 Zhixin Ni1,2†
 Han Zhang3†
 Minxia Zhang4Tuanjie Li1*Shengyong Li1Xin Chen1Ling Zhang5Yuan Gao3Changshu Chen1
 Zhongyuan Wang1Wei Deng1Hai zhou Zhang6
- 1South China Sea Ecological Center of Ministry of Natural Resources (MNR), Nansha Islands Coral Reef Ecosystem National Observation and Research Station, & Key Laboratory of Marine Environmental Survey Technology and Application of MNR, Guangzhou, China
- 2Guangdong Provincial Key Laboratory of Applied Marine Biology, South China Sea Institute of Oceanology, Chinese Academy of Sciences, Guangzhou, China
- 3Polar Research Institute of China, Ministry of Natural Resources (MNR), Shanghai, China
- 4China National Offshore Oil Corporation Research Institute, China National Offshore Oil Corporation, Beijing, China
- 5Key Laboratory of Tropical Marine Bio-resources and Ecology, South China Sea Institute of Oceanology, Chinese Academy of Sciences, Guangzhou, China
- 6North China Sea Forecasting and Disaster Reduction Center, North China Sea Bureau, Ministry of Natural Resources, Qingdao, China
The Arctic is one of the regions under the most dramatic climate change. Global warming has led to elevated freshwater inflow into the western Arctic Ocean and significantly altered nutrient structure and biogeochemical cycling. In this work, inorganic dissolved nutrients in the Chukchi Plateau (CP) and adjacent regions were investigated to further understand their characteristics and influencing factors. Results showed that relatively high nutrient concentrations occurred in the water masses with salinity >32 psu, especially there was a nutrient-rich layer influenced by Winter Pacific Water in the water column (15.10±1.96, 2.23±0.26, and 23.46±6.64 µmol/L for DIN, PO43– and Si(OH)4, respectively). Contrarily, lower nutrient concentrations occurred in the mixing water of the upper layer (1.76±1.04, 1.15±0.16 and 3.76±2.29 µmol/L for DIN, PO43– and Si(OH)4, respectively) with a low DIN/P ratio (1.44±0.59), suggesting DIN has become the potentially biological limiting factor. Furthermore, the freshening and deepening of the upper layer driven by the Beaufort Gyre has hindered the nutrient transport from underlying layer into the upper layer. A maximum chla was observed at 36‒75 m water depth, and the phytoplankton biomass decreased from the western to the eastern CP, accompanied by a decreased contribution of micro-sized chla but an increased contribution of small-sized chla (74.0±0.1%). The phytoplankton resource use efficiency for DIN was estimated as (3.2±4.6)×10-3, which was primarily influenced by the physicochemical parameters of water and also largely regulated by the size structure of phytoplankton.
1 Introduction
The Arctic has experienced some of the most pronounced dramatic climate change, with surface air temperature rising nearly twice as the global average over the last two decades (Screen et al., 2012; Ravindran et al., 2021). Global warming has given rise to many unprecedented changes in the Arctic region since the late 20th century, such as large-scale sea ice melt and retreat (Kumar et al., 2020; Wu et al., 2021), degradation of permafrost (Abolt et al., 2020; Zhang et al., 2021) and increasing evaporation/precipitation due to elevated land-air interaction (Ridley et al., 2023), which caused more freshwater and materials into the Arctic Ocean. For example, an increase in freshwater accumulation of about 5000 km3 was found in the Beaufort Gyre (BG) in the 2000s compared to the 1980–2000 average (Haine et al., 2015). The buoyant freshwater settled on the topmost layer of the ocean has created a strong stratification and thus inhibited the vertical mixing of physical and chemical properties in the water column (Timmermans and Marshall, 2020; Ravindran et al., 2021), due to which nutrients were more difficult to reach surface waters from underlying layer and posed a negative impact on primary producers in the western Arctic Ocean (Coupel et al., 2015). Although it is conducive to enhance productivity that the receding of the ice pack allows more sunlight to penetrate the Arctic Ocean, freshening may counteract the additional light availability to phytoplankton in regions of the Arctic Ocean where strong stratification inhibits wind-driven mixing (Ardyna et al., 2014). Phytoplankton community has responded to this change in stratification by increasing the abundance of small-sized species typically in oligotrophic regimes, but larger cells were detrimentally affected as water stability increased and the nutricline deepened (Fu et al., 2020; Mishra et al., 2022). For example, Zhuang et al. (2016) observed that the spread of the freshened and nutrient-rich Alaska Coastal Water (ACW) reduced the diatom biomass in the Chukchi Sea waters. Therefore, climate change has posed significant influences on the aquatic environment via altering the physical, biological and biogeochemical processes in the Arctic Ocean (Liang et al., 2024; Seok et al., 2024), and subsequently induced the intense variations in the mechanisms of nutrient consumption and replenishment (Carmack et al., 2015; Zhuang et al., 2019), as well as ecosystem responses such as decreasing primary production and changing phytoplankton size structure (Arrigo and van Dijken, 2015; Lee et al., 2019; Zhang et al., 2023). That not only damaged the role of phytoplankton as the fundamental source of energy for an ecosystem (Behrenfeld and Boss, 2014; Leu et al., 2015), but also influenced the associated biological pump as a key process in the Arctic Ocean’s carbon cycle (Castagno et al., 2023).
The Chukchi Plateau (CP), located on the edge of the Canada Basin and adjacent to the Chukchi and Beaufort Sea slopes, consists of two mountain systems and a basin with water depth more than 2100 m hydrologically influenced by several water masses (Brugler et al., 2014). Studies have shown the dramatic changes of sea-ice in the area of Pacific Arctic Ocean including the East Siberian, Chukchi and Beaufort seas (Arrigo and van Dijken, 2011; Lee et al., 2019), and the regularly ice-free during summer and early fall in the CP region (Kawagoshi et al., 2019). In the context of global warming, abundant researches have been performed with regard to the biogeochemical cycling of nutrients in the Arctic Ocean in recent years, such as the availability of the nutrients and the effect of the Beaufort Gyre on the nutrient characteristics (Zhuang et al., 2018), and the nitrate deficit caused by the strong denitrification in the Bering-Chukchi shelves (Zhuang et al., 2021). However, our understanding of nutrients in the western Arctic Ocean, particularly in the Chukchi Plateau area distant from the coastal regions, remains limited. In addition, the phytoplankton resource use efficiency (RUE) that can better reflect the utilization of phytoplankton to nutrients and the possible influencing factors are still scarce in the study area. Therefore, the present work was carried out in the Chukchi Plateau and adjacent waters mainly to investigate the characteristics of inorganic nutrients, phytoplankton and their RUE in the water column, as well as the possible controlling factors. The findings of this study are valuable for further long-term research on nutrient changes in connection with the physical and biogeochemical processes in the Pacific Arctic Ocean.
2 Materials and methods
2.1 Study area
The surveyed area (Figure 1) is dominated by the Pacific water through the Bering Strait and the Atlantic waters entering through the Fram Strait and the Barents Sea (McLaughlin et al., 2004; Woodgate et al., 2005). The Pacific water is primarily driven by a sea level fall between the Bering and Chukchi Seas, and splits into three water masses in the Chukchi Sea as the saline and nutrient-rich Anadyr Water (AdW) at the western branch, the fresher and nutrient-depleted Alaska Coastal Water (ACW) to the east, and the Bering Shelf Water (BSW) of intermediate salinity in between (Reeve et al., 2019) (Figure 1). The upper waters of the Arctic Ocean can be divided into the Arctic Surface Water (ASW) and the halocline (from ~30–50 m to ~200–400 m depth, Colombo et al., 2020; Zhou et al., 2021). ASW contains some freshwater caused by river runoff and some other inputs including sea-ice melting water (Schlosser et al., 1995), which has caused the freshening of surface seawater in the Canada Basin (He et al., 2012; Abe et al., 2020). Then the halocline is composed of ACW, the summer Bering Sea Water (sBSW) and the winter Bering Sea Water (wBSW) (Wang et al., 2021; Fei et al., 2023). Below the upper layer lies the warm and salty Atlantic water (AW), originating from the North Atlantic inflow (Colombo et al., 2020) and is ubiquitous over the Arctic Basins (typically between ~200 and ~800 m depth). The deep water below the Atlantic layer, representing 60% of the total volume, is the colder and saltier Canada Basin Deep Water (CBDW) (Timmermans et al., 2003; Colombo et al., 2020). Long-term observations in the Bering Strait over the past two decades have shown a gradual increase in the volume transport of Pacific water inflow, bringing more heat and nutrients into the Arctic Ocean (Woodgate et al., 2012; Woodgate, 2018).
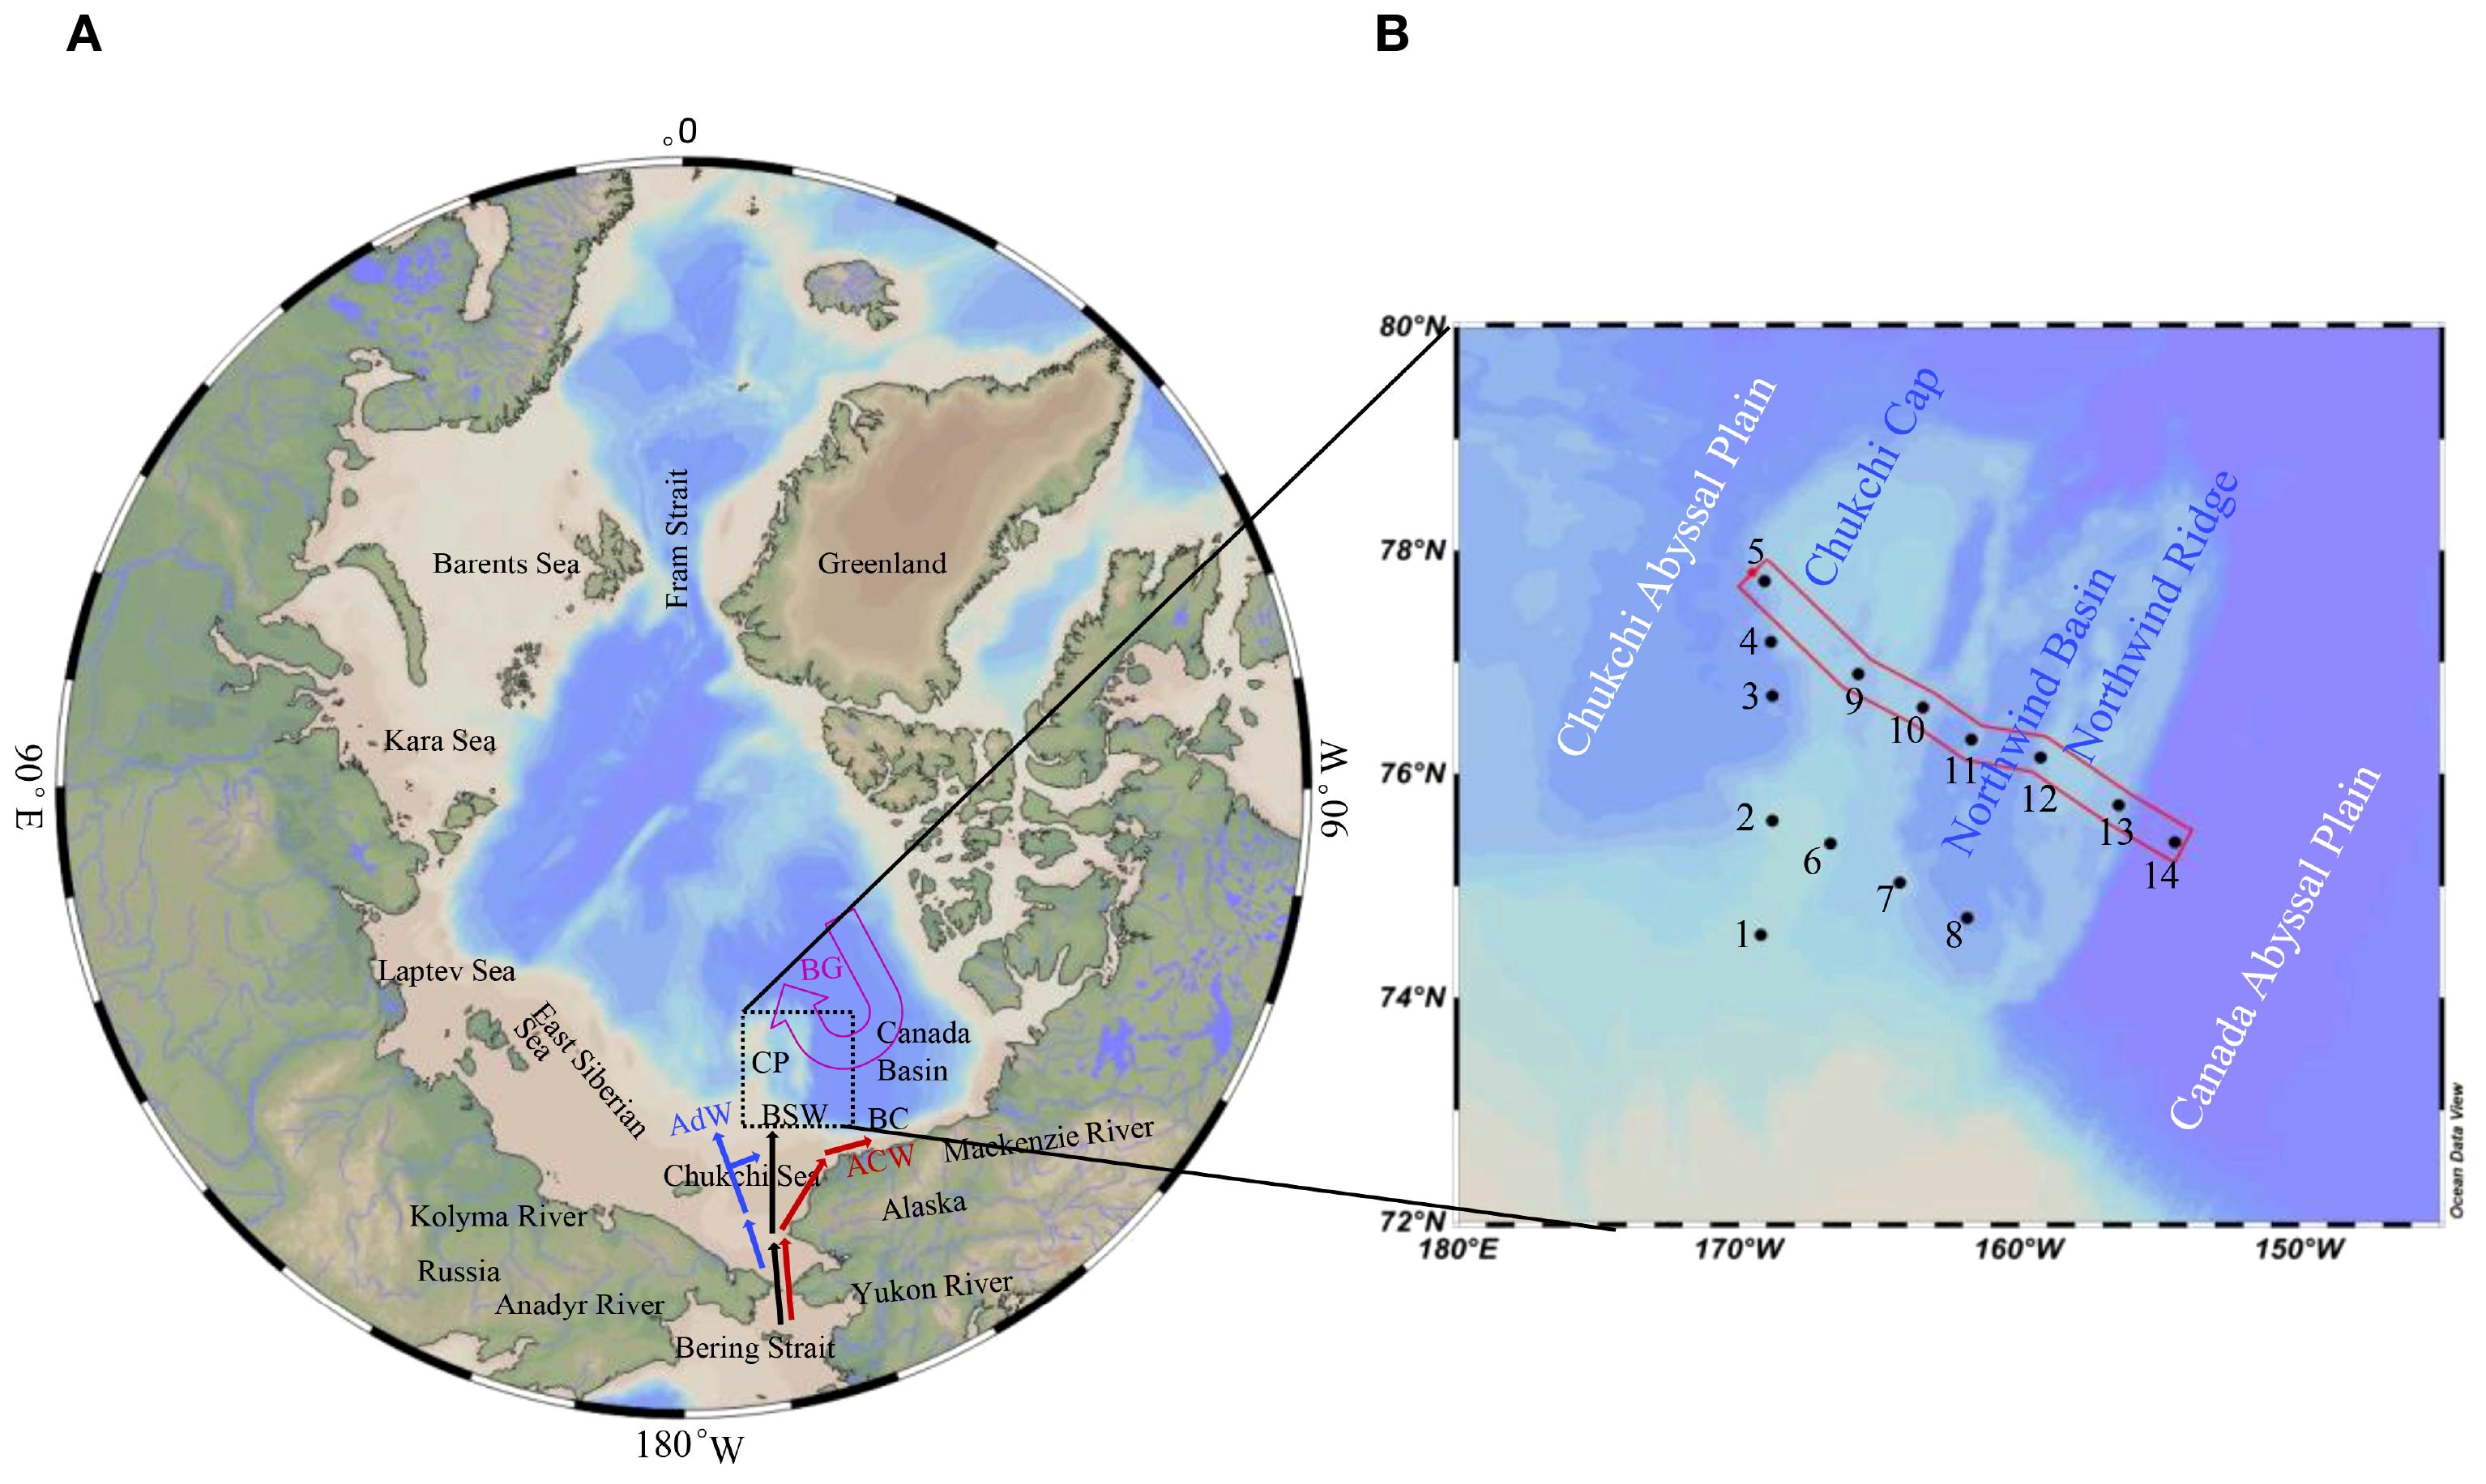
Figure 1. Location of the study area and the sampling stations. Abbreviations in (A) as AdW: Anadyr Water, BSW: Bering Shelf Water, ACW: Alaska Coastal Water, CP: Chukchi Plateau, BG: Beaufort Gyre. Red mark in (B) represented the selected transect discussed.
2.2 Sampling and measurement
Water samples were collected from fourteen stations during the 12th Chinese National Arctic Research Expedition in July 2021. Seawater was collected using the SBE 911 instrument according to the predetermined layers (0, 10, 20, 40, 50, 75, 100, 150, 200, 300, 500, 800, 1000, 1500, 2000 and 3000 m, and the bottom water of 10 m above sea floor) based on the water depth at each station. Salinity, temperature and depth of seawater were achieved via the CTD unit (Conductivity-Temperature-Depth) attached to the instrument. Seawater was filtered immediately through a 0.7 µm pore glass fiber filter (GF/F, Whatman) and the concentrations of dissolved inorganic nutrients (DIN=NO3–+NO2–+NH4+, Si(OH)4 and PO43–) were determined ultraviolet-visible spectro-photometrically. The precisions of duplication for NO3–, NO2–, NH4+, Si(OH)4 and PO43– were 3%, 1%, 1%, 4% and 4%, respectively. Seawater subsamples were firstly filtered through the sieve mesh of 200 µm, then through the filter membranes of 20 µm, 3 µm and 0.22 µm consecutively. The phytoplankton kept in the filters of 20 µm, 3µm and 0.22 µm were defined as micro-, nano- and pico-phytoplankton biomass, respectively. Chla was extracted from the filters at 4°C with 90% acetone (4 hours) with the concentrations determined from the fluorescence data according to the references (Parsons et al., 1984; SOA, 2007).
2.3 Resource use efficiency of phytoplankton
Resource use efficiency (RUE) of phytoplankton typically refers to standing stock production (biovolume, biomass, or Chla concentration) per unit of nutrients (Jin et al., 2023), and it is generally defined as the ratio of the amount of biomass produced by per unit resource (Hodapp et al., 2019, Ye et al., 2019). RUE (N) was obtained following the equation (RUE=Chla : DIN) based on the result that DIN was the limiting nutrient to phytoplankton in study area.
2.4 Statistical analyses
Principal Component Analysis (PCA) is a method to identify significant principal components (PC) in the data as well as possible loadings, which can reduce the dimension of data via linear transformation and is conducive to the understanding of data. PCA (using Origin software) and Pearson Correlation Analysis (using SPSS software) were performed based on the variables, including RUE(N), size-fractionated Chla biomass and their contributions, along with nutrient ratios, DO, salinity, temperature, in order to discuss the potential influencing factors on RUE and phytoplankton.
3 Results
3.1 Horizontal distributions of nutrients, chla and environmental parameters
In this study, the characteristics of nutrients and environmental parameters in the upper waters (less than ~200 m) are horizontally illustrated in terms of three water layers, namely, 0 m layer (beneath the sea ice), subsurface layer with chla maximum (~36–75 m) and 200 m layer. Firstly, the distribution of salinity, temperature and pH values displayed a west-east (from the Chukchi Abyssal Plain toward the Canada Abyssal Plain) gradient in the uppermost layer (Figure 2A, a-c). Salinity decreased from 29.37 to 27.84 psu (average 28.79 ± 0.45 psu), water temperatures increased from –1.51 to –1.26°C (–1.42 ± 0.08°C) and pH increased from 7.99 to 8.11(8.05 ± 0.04) due to a high sea ice coverage in the western and southern plateau compared with the east with warmer and fresher waters (Fei et al., 2023). The uppermost waters had generally very low DIN concentrations (1.45 ± 0.68 µmol/L), especially in the Chukchi slope region, with the lowest value 0.80 µmol/L at Station 1 (Figure 2A, d). The average PO43– concentration was 1.07 ± 0.29 µmol/L (0.47 to 1.27 µmol/L) with the relatively higher levels in the north of the CP decreasing toward the Canada Basin and the slope region (Figure 2A, e). Si(OH)4 concentrations ranged from 2.13 to 9.77 µmol/L with relatively lower values in the Chukchi slope and the Canada Basin region (Figure 2A, f). Relatively higher Si(OH)4 concentrations were observed in a local area, which may be attributed to the sea ice diatoms with higher flux in summer in the Arctic Ocean (Ren et al., 2020). Total chla concentrations were from 0.01 to 0.16 mg/m3 (0.05 ± 0.04 mg/m3) with higher values in the western CP and lower values in the east (Figure 2A, g). On one hand, the relatively abundant nutrients carried by Pacific water through the Chukchi Sea shelf favored the growth of phytoplankton in the western CP (Zhuang et al., 2021). On the other hand, the low chla concentration in the eastern CP adjacent to the Canada Abyssal Plain may be caused by the inability of phytoplankton to survive under low salinity such as the input of freshwater. With the increasing water depth and nutrient concentrations, the maxima of chla biomass were found in the depths of 36−75 m. Chla biomass ranged from 0.04 to 0.69 mg/m3 (0.33 ± 0.18 mg/m3) exhibited relatively higher levels in the western plateau (especially stations 1, 3 and 5) but lower values in the Northwind Basin and the western Canada Basin zone (Figure 2B, g). The salinities in this layer (30.70–31.79, average 31.23 ± 0.36 psu) decreased from the northern plateau toward the Chukchi slope and the Canada Abyssal Plain (Figure 2B, a). Water temperatures fell in the range between –1.53 and 0.62°C(–0.58 ± 0.70°C) with relatively higher values in the Canada Abyssal Plain region (Figure 2B, b). Nutrients displayed similar distributions in this layer, with relatively higher concentrations in the northern and western plateau but lower values near to the Chukchi slope and the western margin of Canada Basin with averages of 4.12 ± 2.11, 1.54 ± 0.21 and 9.16 ± 3.38 µmol/L for DIN, PO43– and Si(OH)4, respectively (Figures 2B, d-f). Salinity and temperature had a similar west-east gradient in the 200 m water layer decreasing from the western CP toward the western Canada Basin with the salinity from 32.99 to 34.52 psu and the temperature from –1.46 to –0.05°C (Figures 2C, a, b). Nutrient distributions showed similar characteristics with relatively higher concentrations near the Chukchi slope and the western Canada Basin, and the values were 13.64 ± 2.44, 1.93 ± 0.44 and 22.35 ± 8.52 µmol/L for DIN, PO43– and Si(OH)4, respectively (Figures 2C, d-f). Stoichiometric relations of nutrients were, N/P ratios of 1.38 ± 0.44, 2.51 ± 0.99 and 7.15 ± 0.55, and N/Si ratios of 0.39 ± 0.23, 0.43 ± 0.10 and 0.73 ± 0.29 in the three layers, respectively (Figure 2).
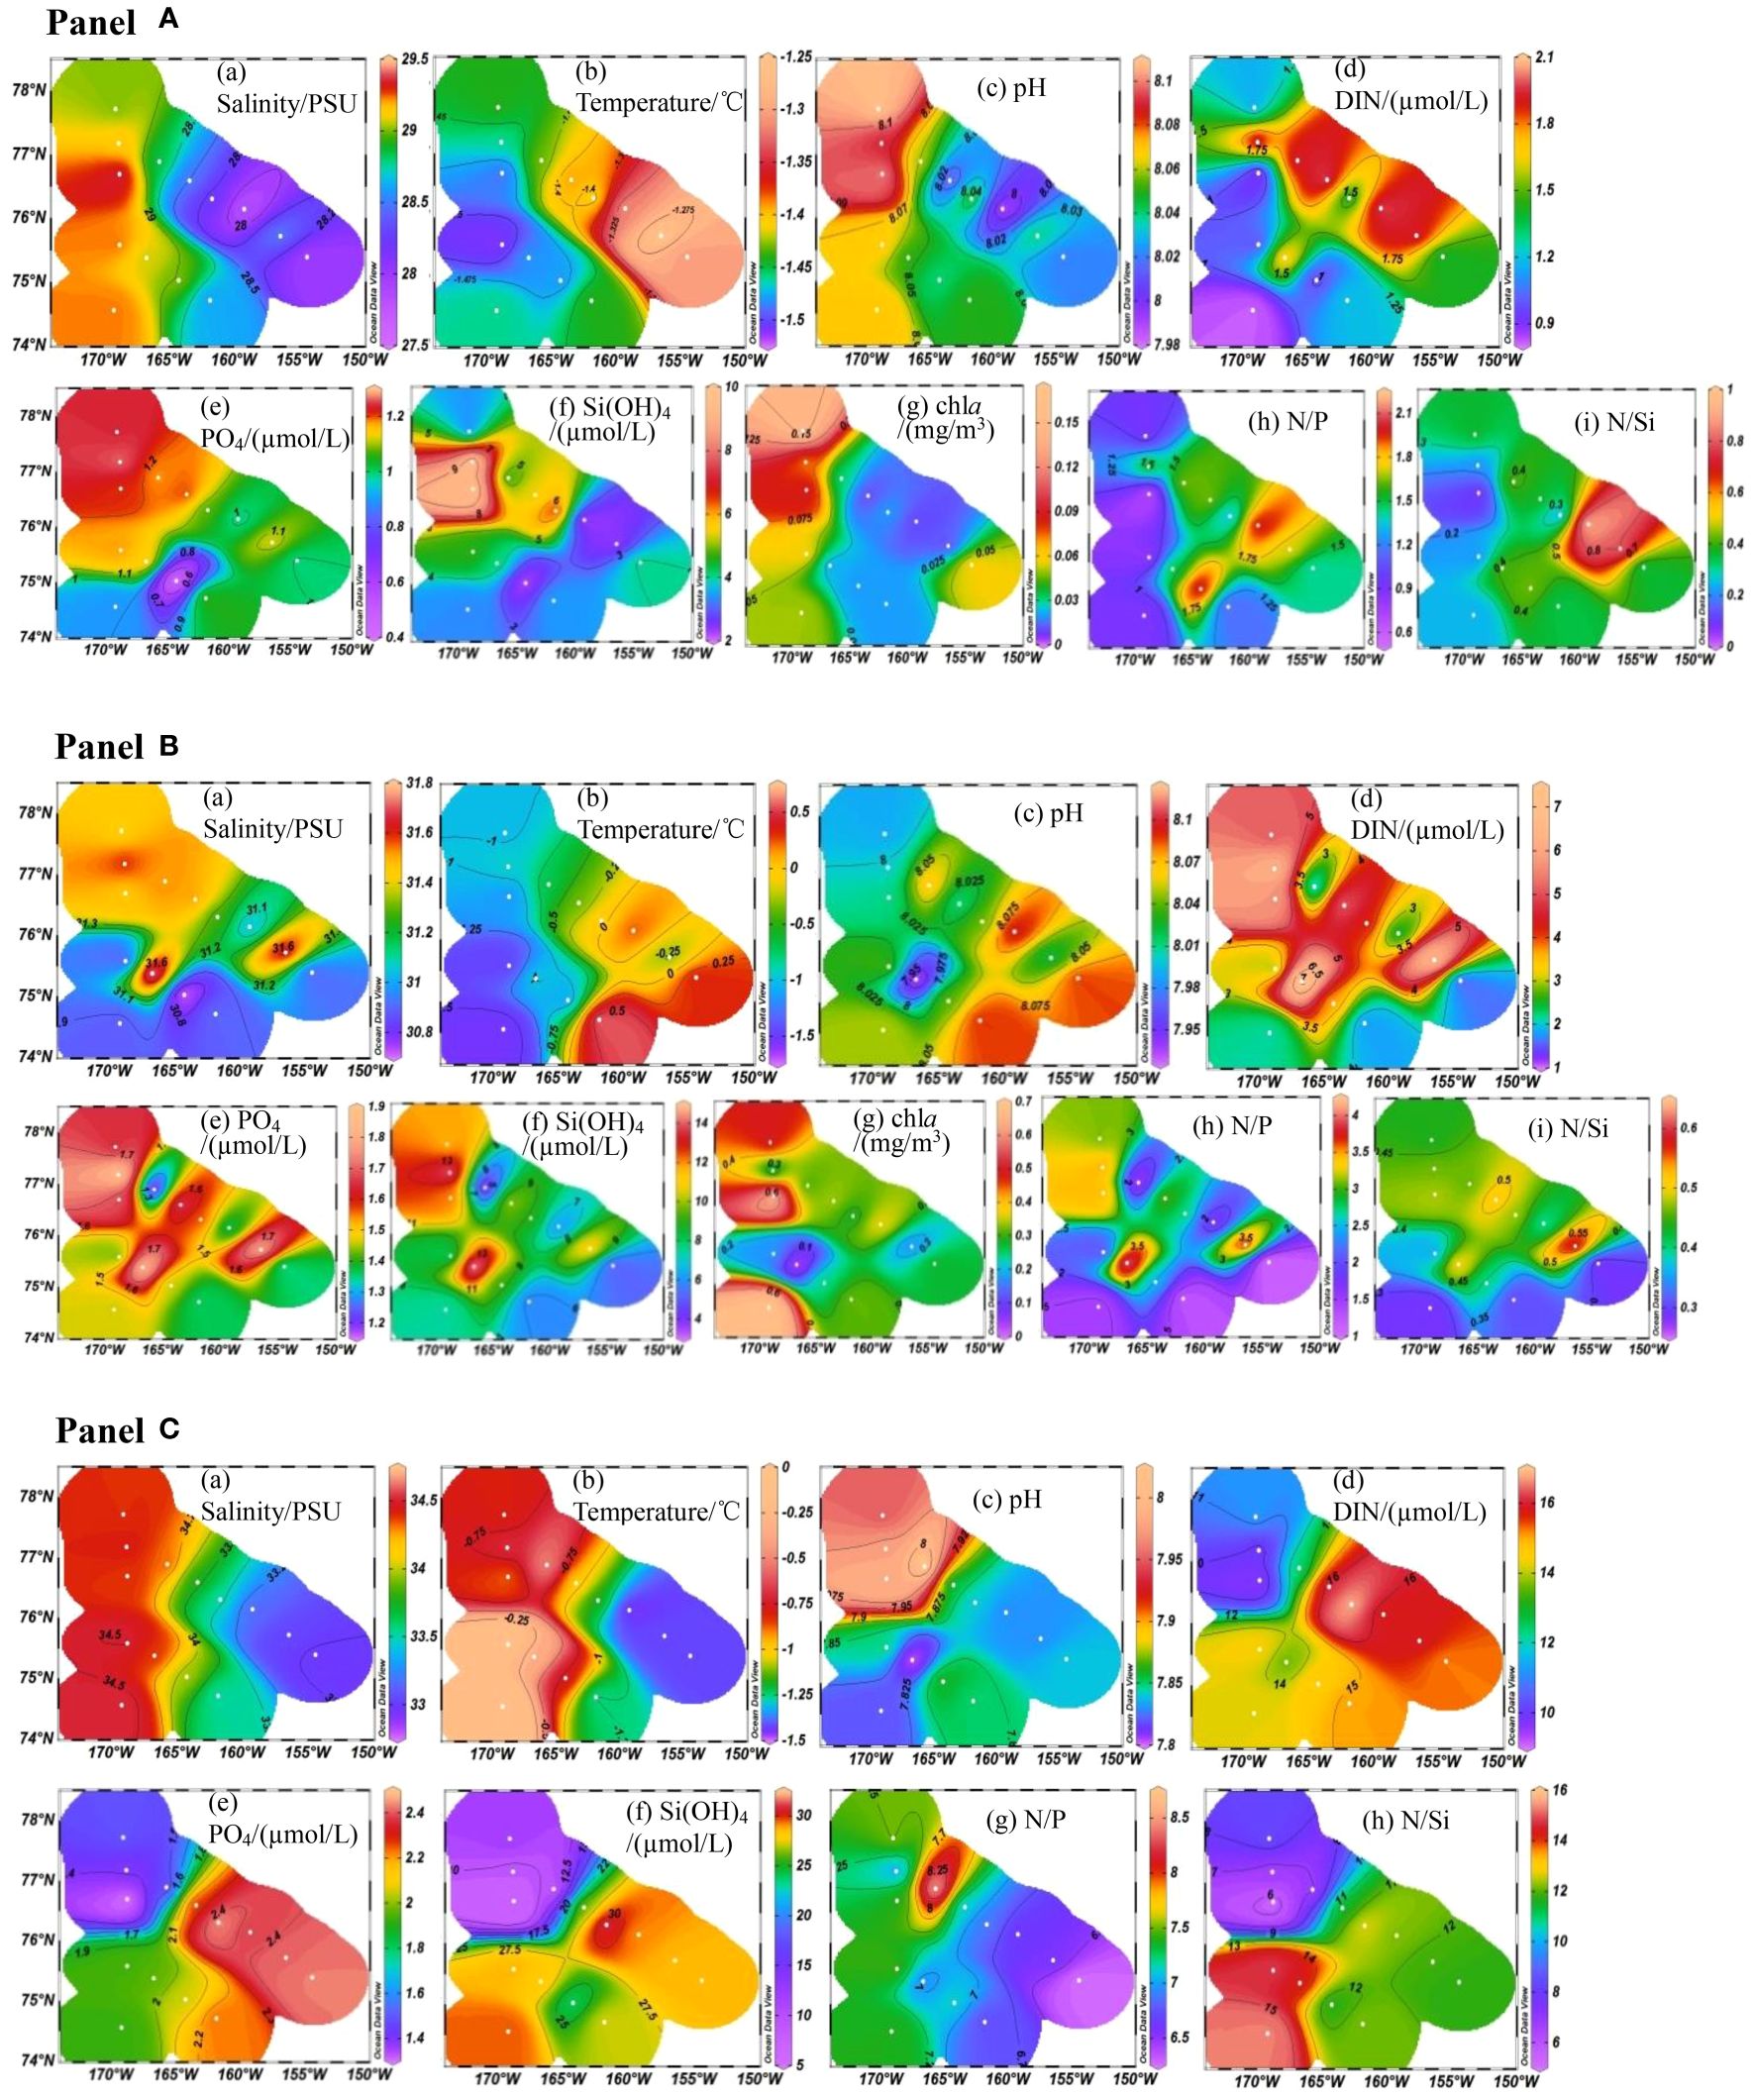
Figure 2. Horizontal distributions of nutrients, chla concentrations and environmental parameters (Panel A for 0 m layer, Panel B for subsurface layer and Panel C for 200 m layer waters. In (A, B), (a) Salinity, (b) Temperature, (c) pH, (d) DIN, (e) PO4, (f) Si(OH)4, (g) a, (h) N/P and (i) N/Si. In (C), (a) Salinity, (b) Temperature, (c) pH, (d) DIN, (e) PO4, (f) Si(OH)4, (g) N/P and (h) N/Si.
3.2 Vertical distributions of nutrients and environmental variables
A longitudinal transect spanning the CP from 169°W to 152°W (Figure 1) was selected to examine the vertical variations in nutrient concentrations, along with the apparently stratified distributions of environmental parameters in the water column. In the surface water (~20 m), low salinity (27.84 to 30.22, 28.66 ± 0.60 psu, Figure 3A) and water temperature (–1.45 to –1.26, –1.35 ± 0.06°C, Figure 3B) indicated the characteristics of the polar mixed water. Elevated salinity (32.55 ± 0.56 psu) and temperature (–1.13 ± 0.30°C) down to about 200 m suggested the main influence of the Pacific inflow through the Chukchi Sea shelf. A clear deepening with a fresher and warmer layer occurred from west to east toward the deep basin displaying an obvious tongue in the water ~20 to 100 m intruding westward from the Chukchi Abyssal Plain to the Canada Abyssal Plain, influenced by downwelling of BG-driven warm freshwater (Zhuang et al., 2021). Relatively higher salinity (34.81 ± 0.14 psu) and temperature (0.24 ± 0.43°C) were exhibited in the waters > 300 m depth. DIN concentrations were generally low (1.76 ± 1.04 µmol/L) in the upper waters, but there was a higher value zone in the water ~150–200 m with the average 15.10 ± 1.96 µmol/L and then the levels lightly decreased from 300 m depth (13.12 ± 0.87 µmol/L, Figure 3C). PO43– and Si(OH)4 concentrations similarly distributed in the water column with the lower values in the upper waters (1.15 ± 0.16 and 3.76 ± 2.29 µmol/L, respectively), then the highest values at the depth of ~50–250 m (2.23 ± 0.26 and 23.46 ± 6.64 µmol/L, respectively), and the lower values occurred in the deeper waters (1.47 ± 0.10 and 8.02 ± 3.54 µmol/L, respectively, Figures 3D, E). Nutrient ratios were low for N/P in the upper 100 m (1.44 ± 0.59) and N/Si in the upper 200 m (0.51 ± 0.20). These ratios increased in the deeper waters, with N/P and N/Si ratios reaching 8.93 ± 0.48 and 1.82 ± 0.47, respectively, Figures 3F, G). pH also displayed stratified distribution with lower values in about 200 m water depth (Figure 3H). In addition to the above waters, closely associated with biochemical processes in the upper ocean, the Atlantic Water (AW) waters (~200–800 m) with salinity above 34.75 psu was primarily from the Fram Strait Branch inflow of the Atlantic Ocean. Finally, the deep water of the Canada Basin extends from the bottom of the AW layer (~1000 m) as relatively old Canadian Basin Deep Water (Carmack et al., 2012). Nutrient concentrations in deep waters were 12.14 ± 1.65 for DIN, 1.42 ± 0.29 for PO43– and 11.23 ± 5.71 µmol/L for Si(OH)4, respectively.
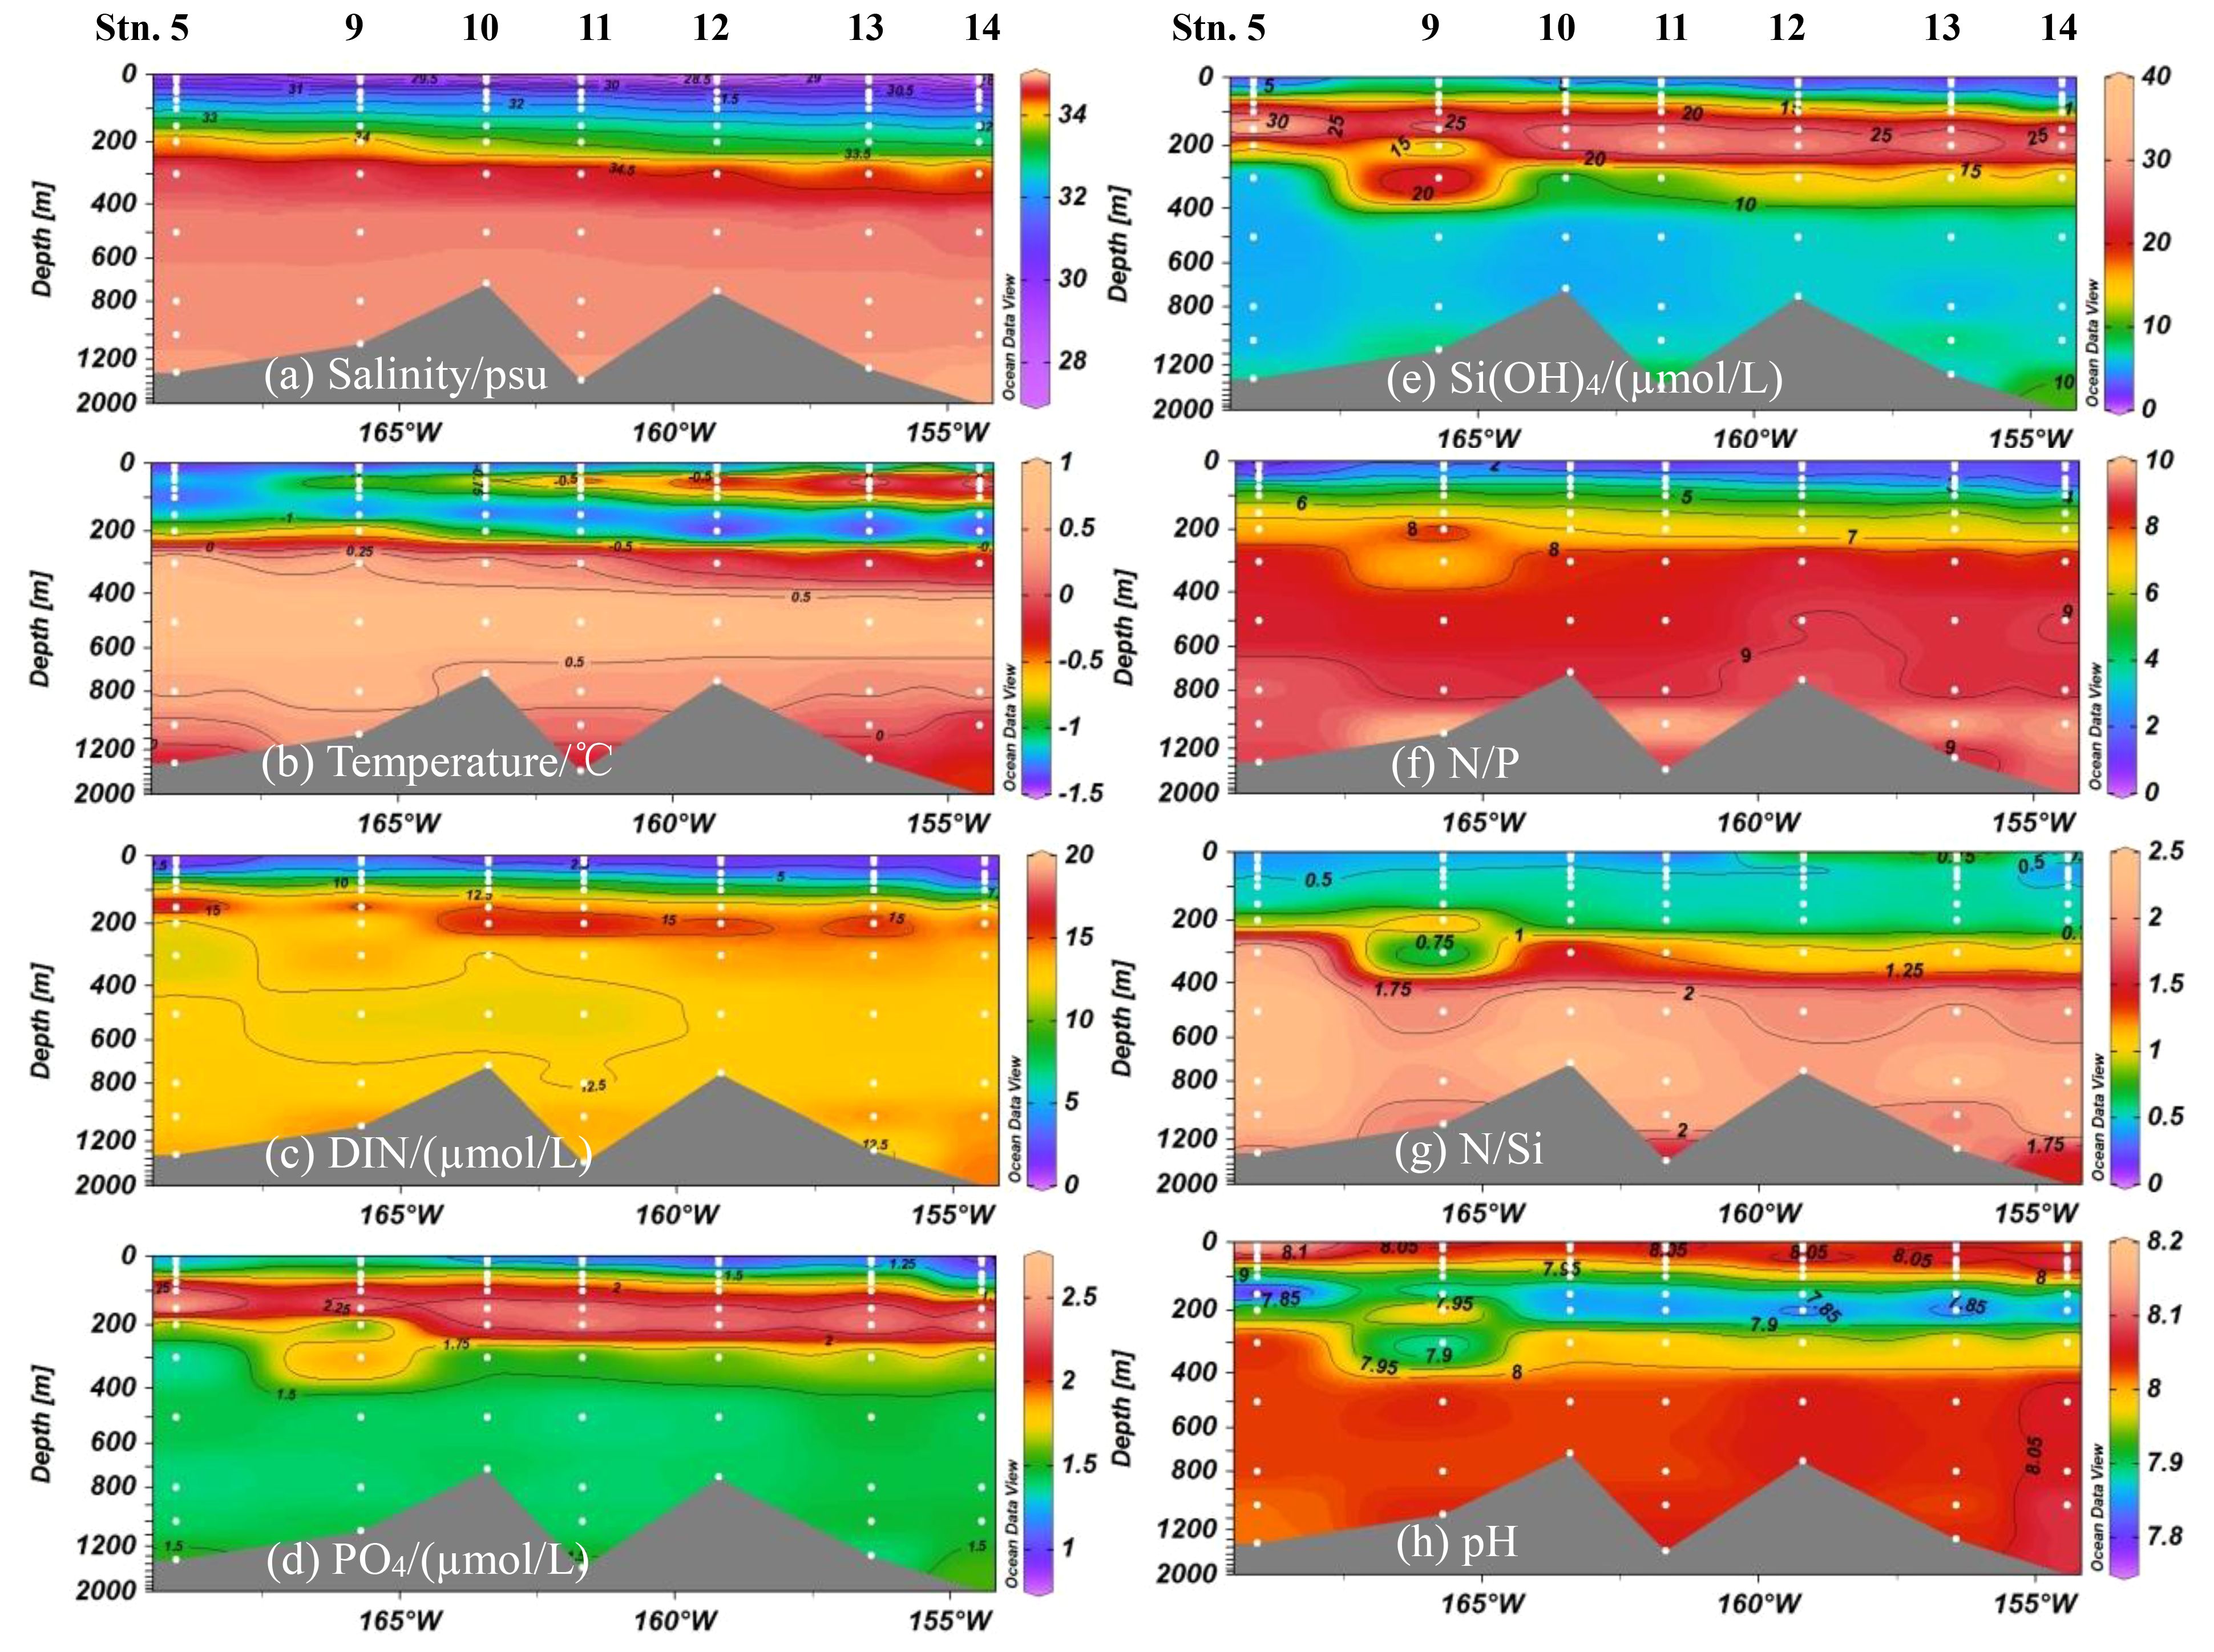
Figure 3. Vertical distributions of nutrients and environmental variables in the water column. (A) Salinity, (B) Temperature, (C) DIN, (D) PO4, (E) Si(OH)4, (F) N/P, (G) N/Si and (H) pH.
3.3 Characteristics of phytoplankton and RUE
The uneven distributions of size-fractionated chla concentrations in the study area were found. Micro- and nano-sized chla concentrations decreased from the western CP to the Canada Abyssal Plain, whereas it was opposite to pico-sized fraction phytoplankton. Micro-chla biomass had the relatively higher levels in the western CP with an average 0.08 ± 0.06 mg/m3 (0.02–0.15 mg/m3) and accounted for 39–64% of the total chla biomass. On the contrary, pico-chla biomass dominated the eastern CP, especially the region near the Chukchi slope and the center of the CP (stations 7–12) with an average pico-chla concentration of 0.08 ± 0.02 mg/m3 accounting for 74 ± 0.05% of the total chla biomass. RUE(N) of phytoplankton was (3.2±4.6)×10-3 in the study area, and Figure 4 showed the variations of natural logarithm of RUE(N) along with salinity values with the higher resource use efficiency for DIN in the salinity range of ~29.0–31.5 psu.
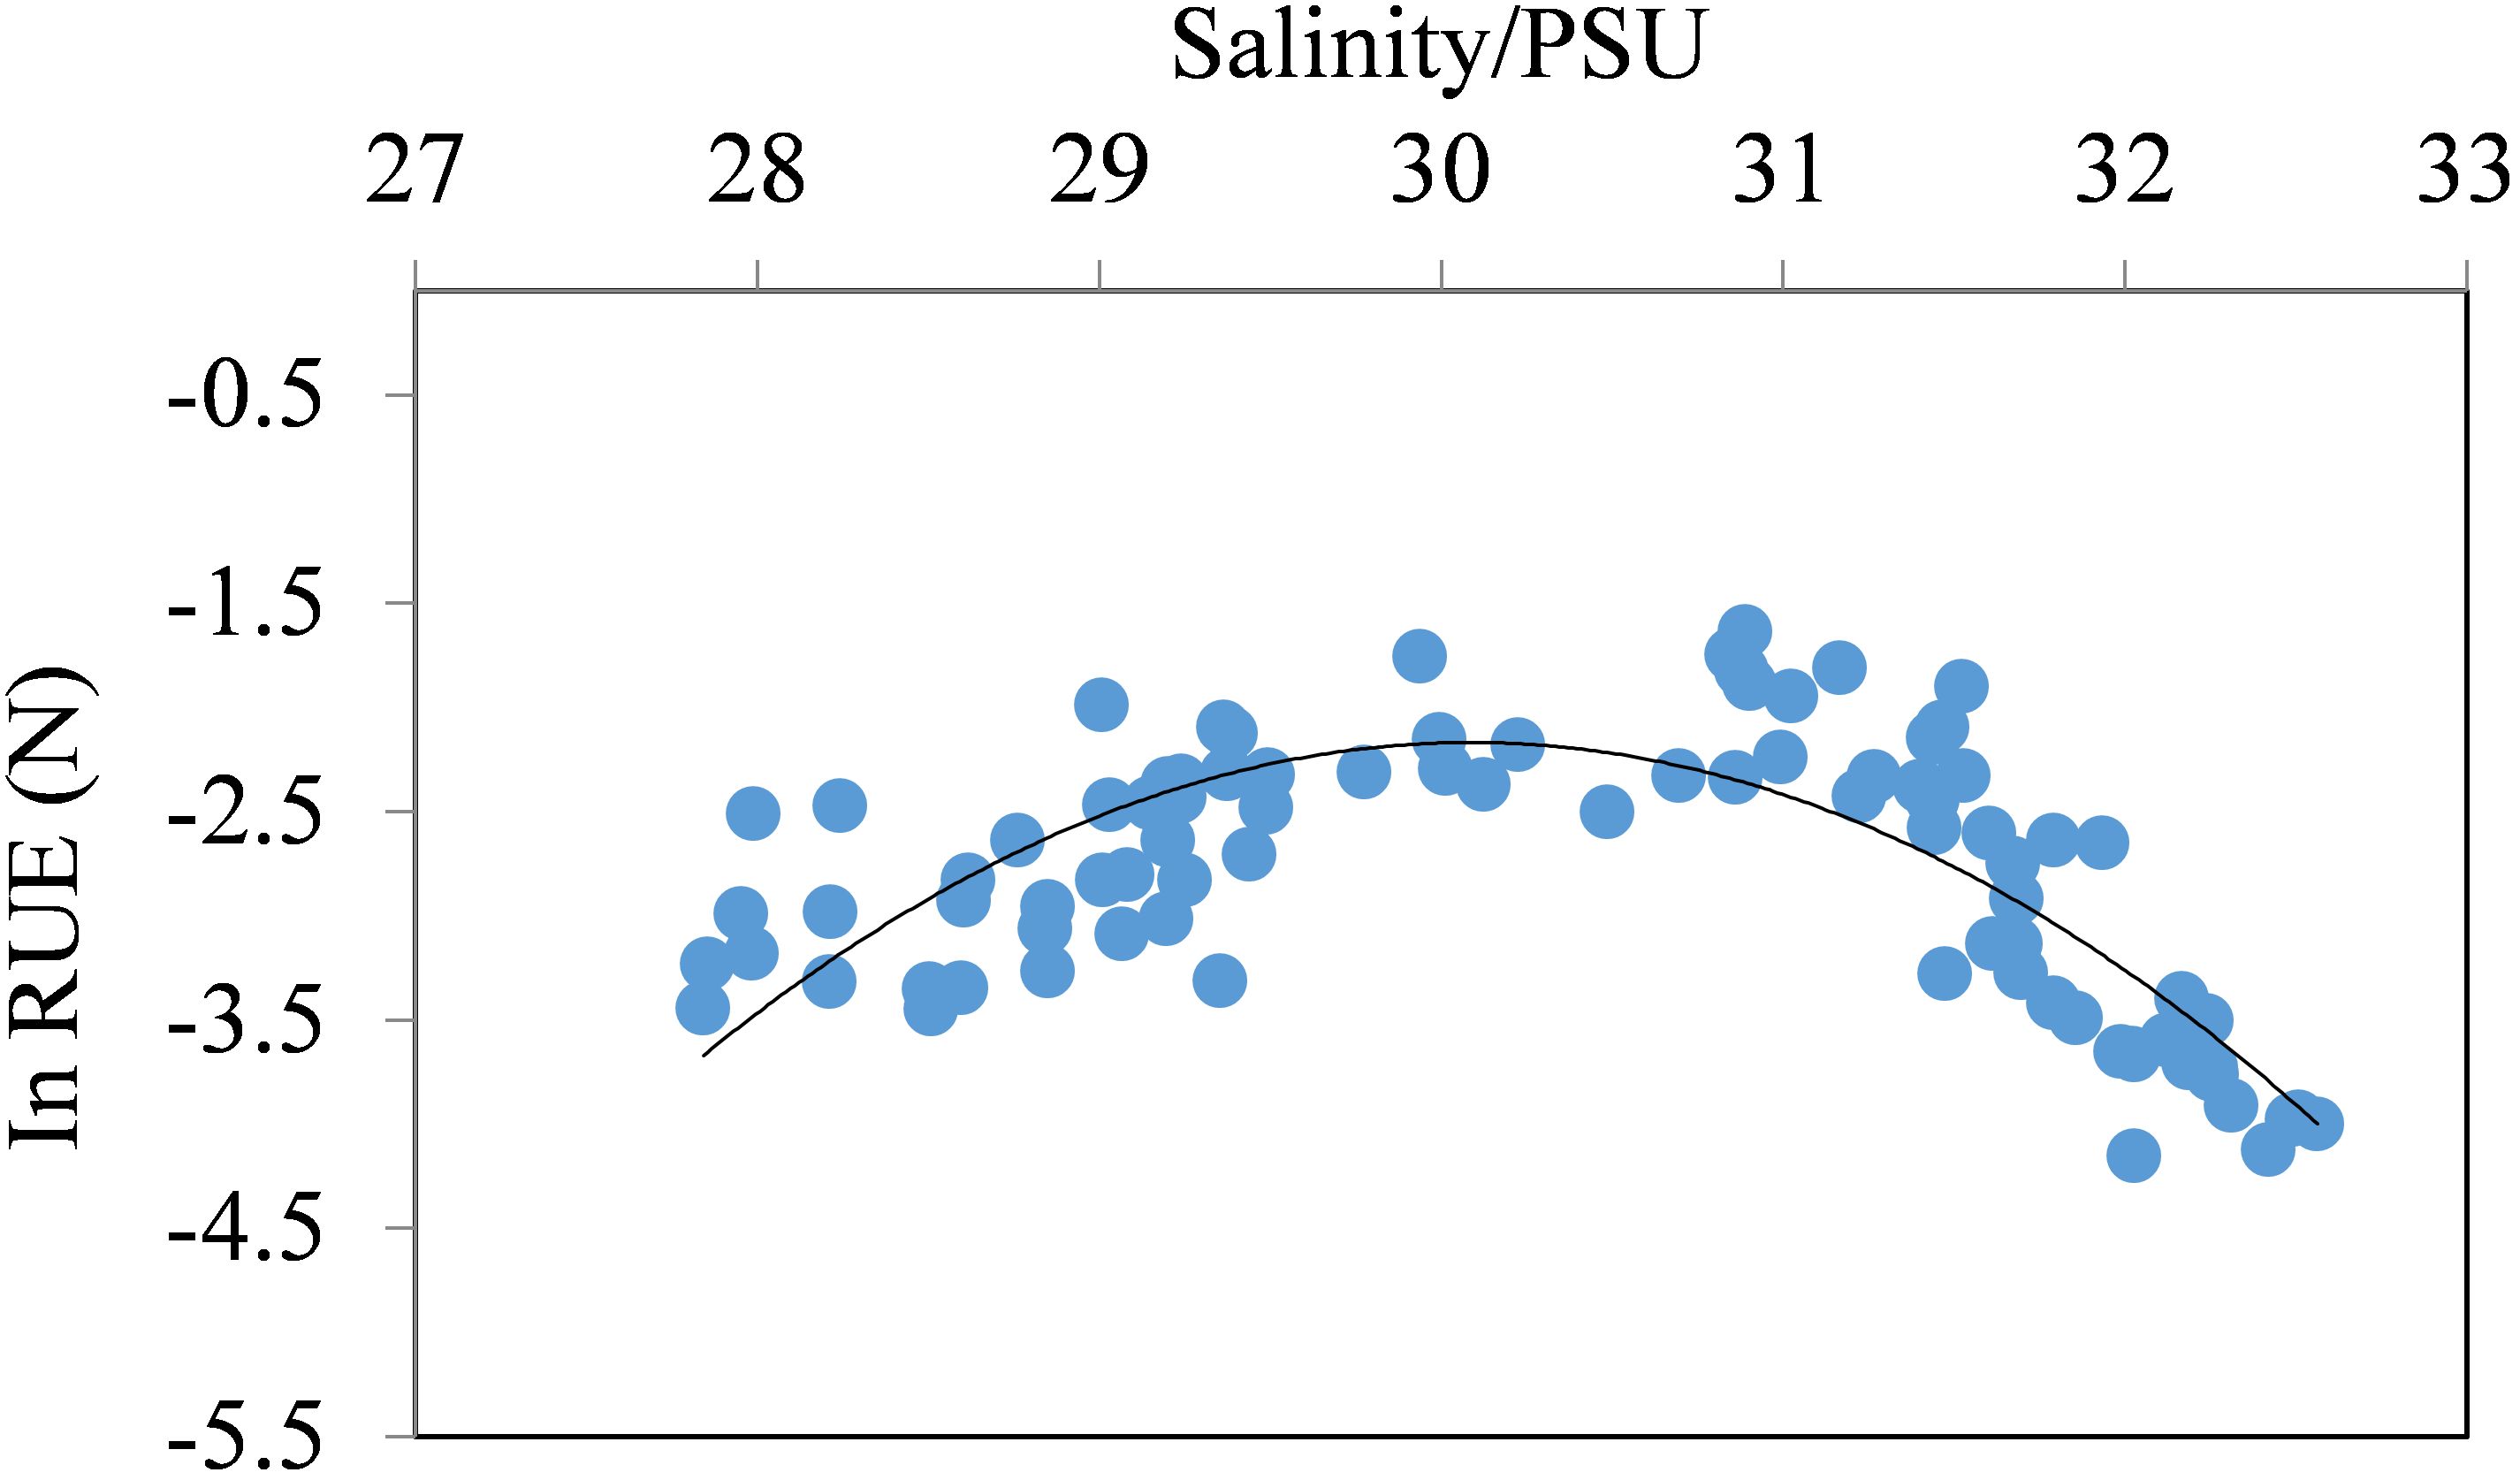
Figure 4. Variations of RUE(N) (natural logarithm) along with salinity values in the study area.
4 Discussion
Climate-driven rapid changes in the Arctic have caused the increasing inputs of northern Pacific water and freshwater into the western Arctic Ocean, significantly influencing the structure and the biogeochemical cycling of nutrients (Zhuang et al., 2016; Woodgate, 2018). The waters in the study area were mainly characterized by a polar mixed layer that is seasonally modified by freeze-thaw cycles of ice/snow and a multi-layered halocline. The upper and middle halocline layers consist of Pacific-origin waters, while the lower halocline layer is composed of Atlantic-origin waters (Timmermans et al., 2017). The underlying layer is the warmer and saltier Atlantic Waters, followed by the colder and even saltier Canada Basin Deep Waters (Colombo et al., 2020). Therefore, six distinct water masses were identified according to their characteristics described in the previous studies (Zhou et al., 2021; Fei et al., 2023), and further defined by the salinity and temperature determined in the present work. Inhomogeneous nutrient concentrations were observed in water masses and are illustrated in Figure 5.
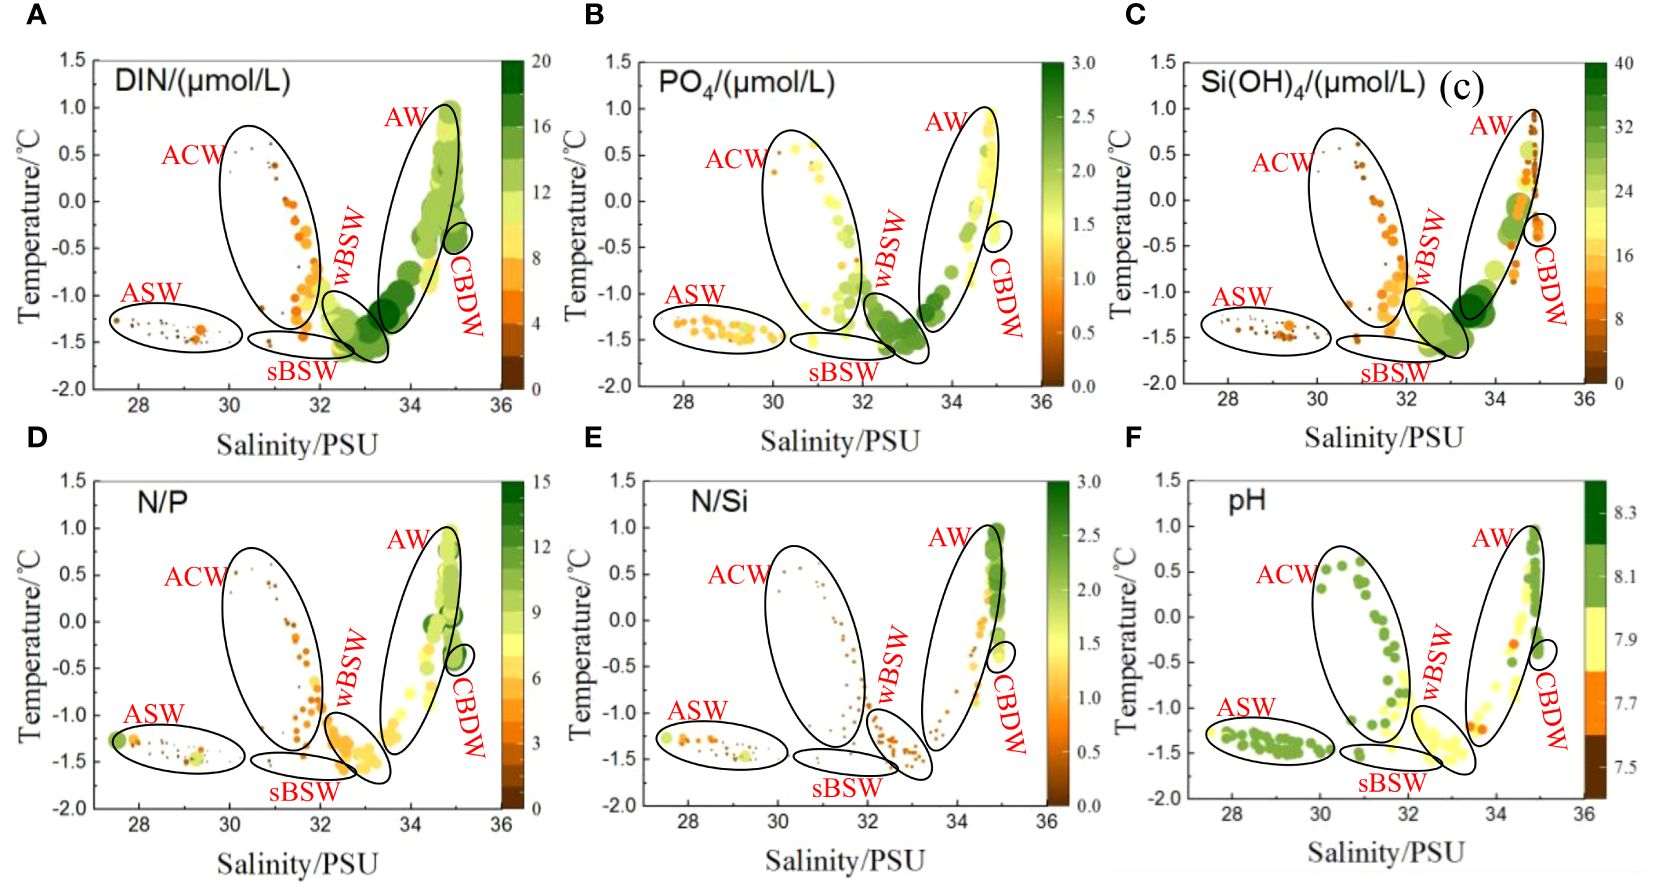
Figure 5. Distributions of nutrient concentrations and ratios in water masses. ASW (Arctic Surface Water), ACW (Alaskan Coastal Water), AW (Atlantic Water), sBSW (Summer Bering Sea Water), wBSW (Winter Bering Sea Water) and CBDW (Canada Basin Deep Water). (A) DIN, (B) PO4, (C) Si(OH)4, (D) N/P, (E) N/Si and (F) pH.
It was observed that nutrients showed relatively higher concentrations in wBSW, AW, CBDW, all of which have salinities higher than 32 psu. In contrast, all nutrient concentrations (particularly DIN) were considerably lower in ASW. This lower nutrient concentration in ASW was accompanied by the lower salinity (< 30 psu) and pH values but higher temperature in the uppermost waters of the eastern CP waters, especially in area adjacent to the Canada Abyssal plain. These conditions were mainly influenced by the freshwater such as ice-melt water, river runoff, freshwater carried by BG (Woodgate, 2018; Zhuang et al., 2021). It was illustrated that ASW (or described as polar mixed layer, less than ~20 m) was the primary factor controlling nutrient stocks in the uppermost waters. Furthermore, the observed variability in nutrient concentrations across different salinity ranges (Figure 6) suggested that the lower nutrients may be associated with the freshening of the water. The freshening reduced the salinity in the surface water and strengthened the stratification of the upper water, which hindered the nutrient replenishment from the lower layer into the upper layer and caused nutrient depletion in the surface water (Zhuang et al., 2016). The acceleration of the Beaufort Gyre due to the strengthening of the Beaufort High and the routing of continental river runoff to the Canada Basin driven by the Arctic Oscillation were complementary for the freshening (Proshutinsky et al., 2019; Falardeau et al., 2023). For example, the influx of Mackenzie River runoff was a significant source of freshwater to the Canada Basin and contributed to the freshening (Fichot et al., 2013), and it was found that the routing of Mackenzie River outflow since 2006 coincided with the observations of a rapid accumulation of freshwater in the Canada Basin (Proshutinsky et al., 2009; Rabe et al., 2011).
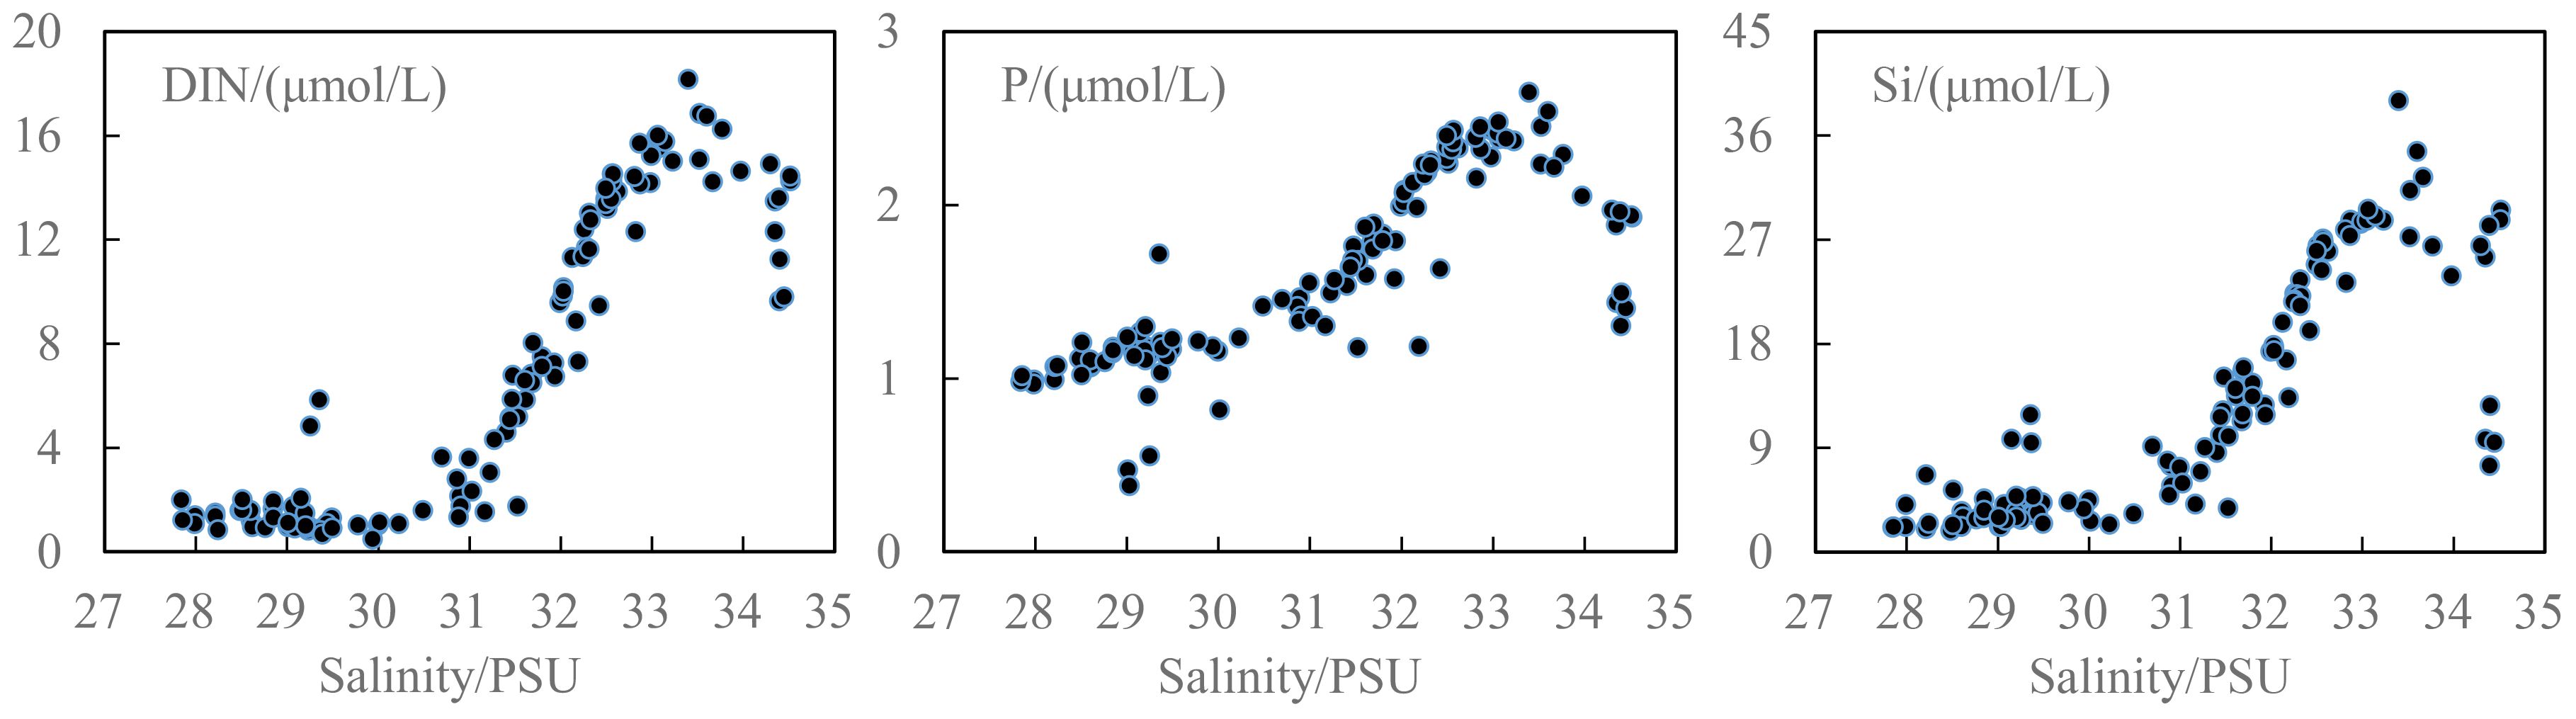
Figure 6. Distributions of nutrients along with salinity in the water column less than 200 m depth.
Therefore, although ASW was almost depleted in nitrate, it was shown that there existed relatively higher DIN concentrations (1.85 ± 0.27 µmol/L) in the uppermost layer in the area of northeastern CP (Figure 2A, d) relative to the western and southern CP (1.09 ± 0.30 µmol/L) influenced by the consumption by relatively abundant phytoplankton biomass (Figure 2A, g). On the contrary, lower concentrations of PO43– and Si(OH)4 in the uppermost water exhibited in the eastern relative to the western region despite the freshwater with abundant Si, which may be partly attributed to the utilization by the spring algae bloom, a key feature of the Arctic ecosystem from late April to early June (Matrai et al., 2013; Behrenfeld et al., 2017).
The wBSW beneath the sBSW layer (salinity 32.5–33.5 psu, less than ~200 m depth with a temperature minimum), transported along with the Pacific inflow via Bering Strait into the Chukchi sea in winter and early springtime and occurred in the north of the Chukchi slope and Canada Basin region year-round (Proshutinsky et al., 2019; Lin et al., 2023). It was also the layer with the nutrient maxima of 15.0 ± 1.96 µmol/L DIN and 2.23 ± 0.26 µmol/L PO43–, which was likely due to the water mass receiving nutrients from remineralization as it advected along the bottom of the Chukchi shelf (Granger et al., 2018). Pacific-origin sBSW and wBSW occupied the upper and middle halocline of the upper ocean, respectively, in the area of the CP and the Canada Basin (McLaughlin et al., 2004). However, the freshening and deepening of the subsurface strengthened the stratification and hindered the vertical transport of the nutrients into subsurface waters from the wBSW layer, which also shaped the cold halocline existing in the Canada Basin and formed the barrier hindering the heat transport from the underlying Atlantic water into the halocline (Pacini et al., 2019).
It has been evident that BG-driven freshwater led to regional differences in the nutrients and phytoplankton (Lee et al., 2019). Zhuang et al. (2018) examined that a gradual decrease in nutrient concentrations toward the center of the BG with a nitrogen deficiency (< 1 μmol/L) occurred, and the contribution of diatoms to the phytoplankton community decreased, accompanied by the increased contribution of small flagellates due to the freshwater accumulation in Canada Basin region impacted by BG circulation. Lower nitrate (1.45 ± 0.68 µmol/L) and DIN/PO43– ratio (1.44 ± 0.59) in ASW (Figures 5A, D) suggested that DIN became the relatively biological limiting factor. Furthermore, the significantly positive correlations between DIN and P, DIN and Si, Si and P (r= 0.8745, 0.9673, 0.9037, respectively, p<0.01) in the upper waters (Figure 7) indicated the close relationships during their consumption and regeneration in the water column. Lower elemental ratios (ΔDIN/ΔP: 8.37 and ΔDIN/ΔSi: 0.53, both less than the Redfield ratios) and the negative intercepts of the regression lines suggested the condition of nitrogen deficiency in the waters. However, the nitrate concentrations were still higher than the limiting level (defined as 1 µmol/L) for phytoplankton growth (Danielson et al., 2017; Mills et al., 2018). Therefore, some species of phytoplankton could still absorb DIN in the top layer water with relatively lower chla concentrations of 0.01–0.16 mg/m3 in the study. Additionally, the trend of freshening in the Arctic Ocean would favor picophytoplankton growth rather than the larger cells (Zhang et al., 2021), which was shown in the study as the decrease in micro-sized chla biomass from the Chukchi Abyssal Plain to the Canada Abyssal Plain.
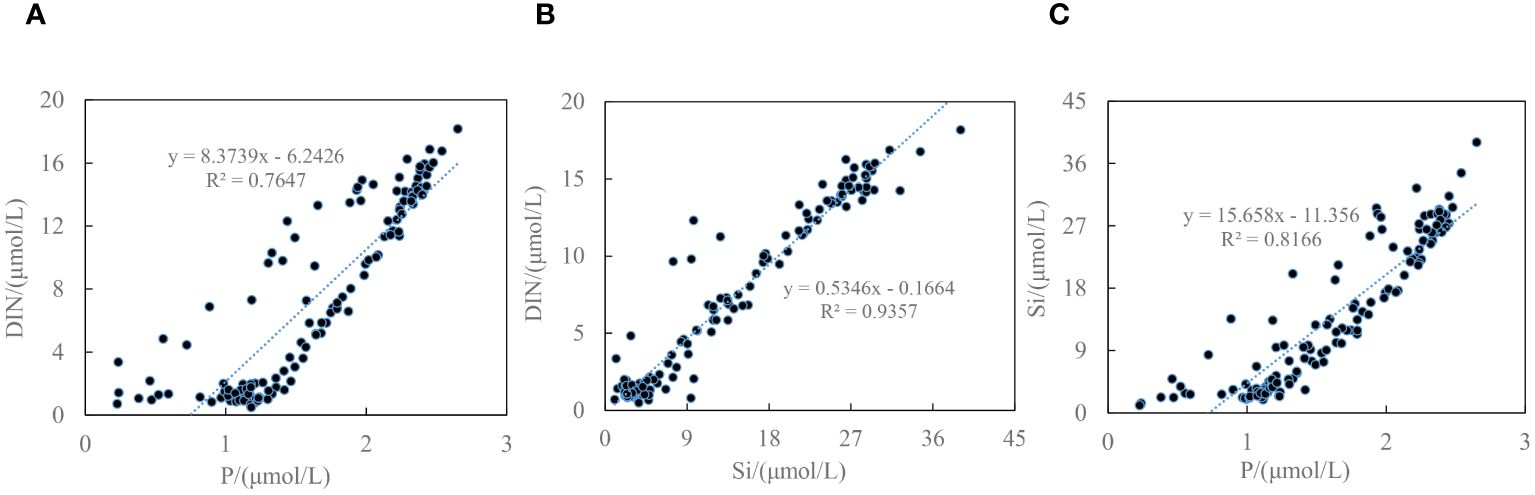
Figure 7. Relations between DIN and PO43– (A), DIN and Si(OH)4 (B), Si(OH)4 and PO43– (C) in the water column less than 200 m depth.
ACW (salinity<32 psu) was derived from the southeastern Bering Sea and mainly characterized by the relatively lower salinity and nutrient concentrations, along with higher temperatures compared to sBSW due to the freshwater infusion when it flowed along the western shelf of northern Alaska (Danielson et al., 2017; Zhuang et al., 2021). Zhuang et al. (2016) observed that ACW flowed in summer with extremely low N:P ratios (0.6 in average) and nutrient concentrations (0.43 ± 0.11 and 0.2 ± 0.1 µmol/L for PO43– and NO3–, respectively). Danielson et al. (2017) reported the concentrations were 0.49 ± 0.08, 0.19 ± 0.04 and 7.77 ± 2.18 µmol/L for PO43–, NO3– and Si(OH)4, respectively, in the water column influenced by the ACW. During summertime, ACW was influenced by the large continental rivers (e.g., Yukon and Mackenzie Rivers), which contributed relatively lower nutrients compared to other rivers globally, for example, the Yukon River contributed an annual freshwater discharge exceeding 2×10¹¹ m3 into the Arctic Ocean, with an average DIN concentration of 2.43 ± 0.63 µmol/L and P of 0.05 ± 0.04 µmol/L (Guo et al., 2004). When the low-salinity nutrient-poor ACW flowed eastward, it partially converged with the BG, which contained increased heat and melt water. This interaction enhanced the BG-driven freshwater accumulation of and facilitated strong downwelling transport to the CP zone. Consequently, this process strengthened the salinity-based stratification in the water column and impeded the vertical transport of nitrate into the surface layer (Zhuang et al., 2018, 2019). sBSW (salinity 30.0–32.5 psu), characterized by high nutrients and low temperature (Ueno et al., 2020), was mainly referred to the mixed waters of Anadyr Water and Bering Shelf Water in summertime (Zhuang et al., 2016). sBSW originated from the Bering Sea Overland Current and gained abundant nutrients during the mixing process in the deep water in winter, and reported to be nutrient-rich relative to the ACW. However, sBSW was lower in nutrients than water flowing over the shelves in winter when advected over the Bering and Chukchi shelves during the high productivity season (McLaughlin et al., 2004). In addition, it was also impacted by other causes including a pre-existing nitrate deficit in the inflowing Pacific water and the nitrate removal induced by denitrification on the Bering-Chukchi shelf (Zhuang et al., 2022).
It has been observed that the subsurface layer in the eastern study area was mainly influenced by the ACW, while sBSW was dominated in the western parts of the CP zone, characterized by relatively colder and nutrient-abundant waters compared to the ACW. The convergence of freshwater and the downwelling of BG led to the deepening of nutricline and chlorophyll maxima in the Canada Basin (Coupel et al., 2015; Wei et al., 2024). In this study, subsurface chlorophyll maxima occurred at 36−75. Lower chla concentrations (average 0.41 mg/m3) were determined in nitrate-poor ACW-influenced area (Zhuang et al., 2016), while the community mainly consisted of nano- and pico-phytoplankton. In the present study, although the total chla biomass was higher in the western part of the CP, pico-sized chla dominated in the center zone of the CP, which was situated in the regime influenced by the BG, especially at stations 7–12, with the pico-sized chla contribution of 66–81%. The high temperature and nitrate-poor conditions of ACW were more suitable for small phytoplankton but significantly reduced the dominance of large phytoplankton (15–29%). Therefore, the northward expansion of the ACW shifted the phytoplankton community structure towards an increased abundance of small phytoplankton (Zhuang et al., 2021).
Figure 8A demonstrates that PC1 and PC2 explain 73.6% of the total variance, with salinity, nutrients and nano-chla% showing higher loadings on PC1. Nano-chla% shows a relatively close relationship with nutrients, confirmed by a significantly positive correlation between nano-chla% and nutrients (Table 1). It suggests that nutrients were crucial to nano-chla contribution, together with the higher Si/P ratios in the water (r=0.259 between Si/P and nano-chla%, p<0.05). On the contrary, micro- and pico-chla contributions have weak relationships with nutrients (p>0.05, except for p<0.05 for PO4 and pico-chla%). Temperature shows close correlations with nano-chla% and pico-chla% but distant correlation with micro-chla% (r=0.298, 0.718 for temperature and nano-chla, pico-chla concentrations, respectively, p<0.01), suggesting that the warm waters favored the smaller-sized phytoplankton growth. These findings indicate that phytoplankton size structure was largely regulated by the water temperature and nutrients.
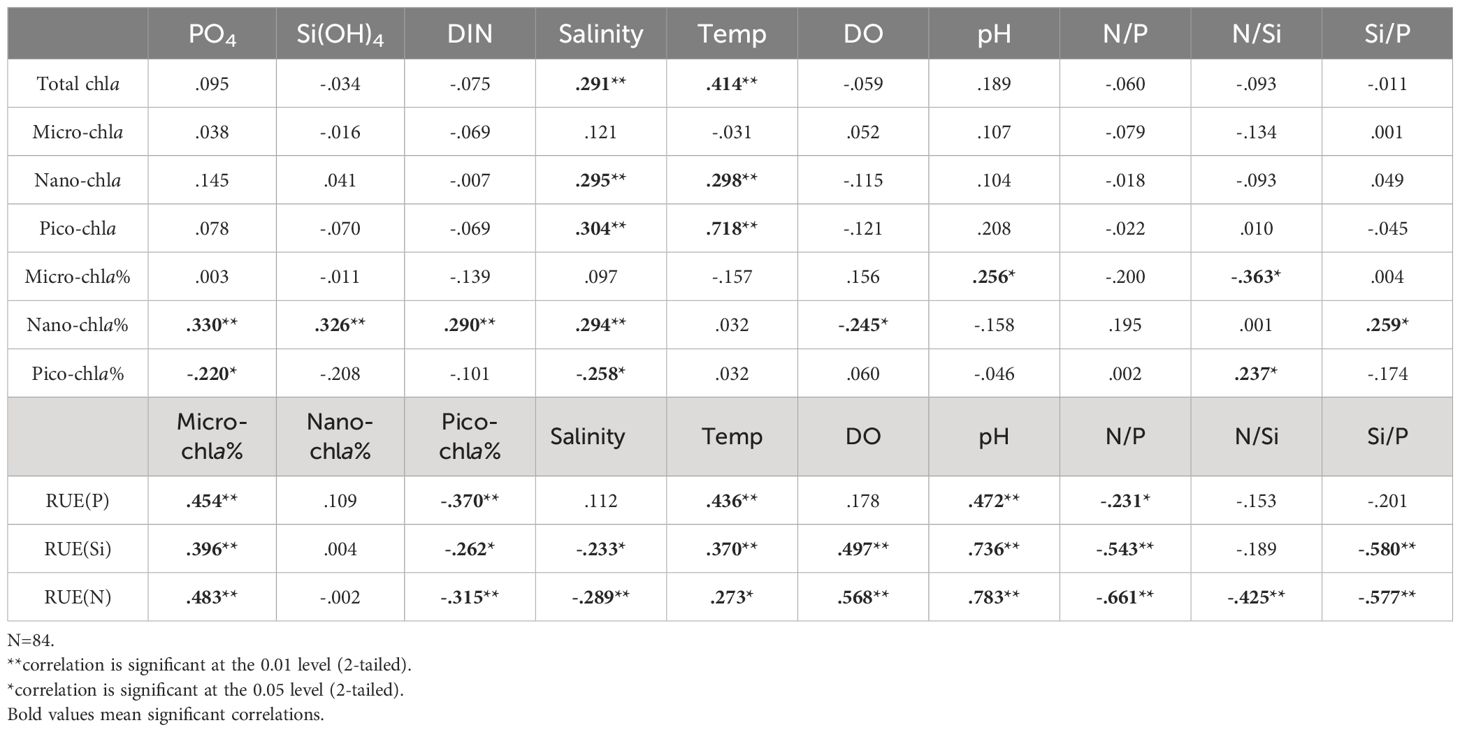
Table 1. The results of Pearson Correlation Analysis for chla, RUE and environmental parameters in the water.
Figure 8B showed that PC1 and PC2 were the main factors influencing the resource use efficiency of phytoplankton, accounting for 67.8% of the total variation. The pH value and temperature had high positive loading on PC1 and PC2, respectively, indicating that warmer waters promote the RUE for DIN by phytoplankton (significantly positive correlations between temperature/pH and RUE). Salinity values had higher positive loading on PC2, however, it also showed higher negative loading on PC1. Micro-chla contributions displayed high positive loading on PC2, but pico-chla concentrations showed high negative loading on PC2, suggesting micro-chla and pico-chla contributed opposite effect on the phytoplankton RUE(N). Therefore, PC1 mainly represented the physicochemical characteristics of water posing the most significant influences on the RUE(N), and PC2 may represent the influence of the phytoplankton size, indicating RUE(N) was largely regulated by the size structure of phytoplankton. Overall, micro-sized phytoplankton (e.g., diatom, ice algae) contribution to total chla and primary production was dominated in the Chukchi shelf region, which was the primary contributor to RUE (Chen et al., 2018). However, miniaturization of phytoplankton was evident due to the stratification and DIN deficiency in the eastern CB waters and resulted in the lower chla concentration (He et al., 2012). There were some researches on phytoplankton community structure influencing the plankton resource use efficiency in aquatic environments (Filstrup et al., 2014; Ye et al., 2019) but the limited data set in the present paper restricted the deep understanding of this issue in this study. Therefore, how the community structure, biodiversity and functional diversity of phytoplankton may influence the resource use efficiency in the western Arctic waters is worth further study in the future, which would be significant to the in-depth understanding on nutrient cycling in the Arctic Ocean.
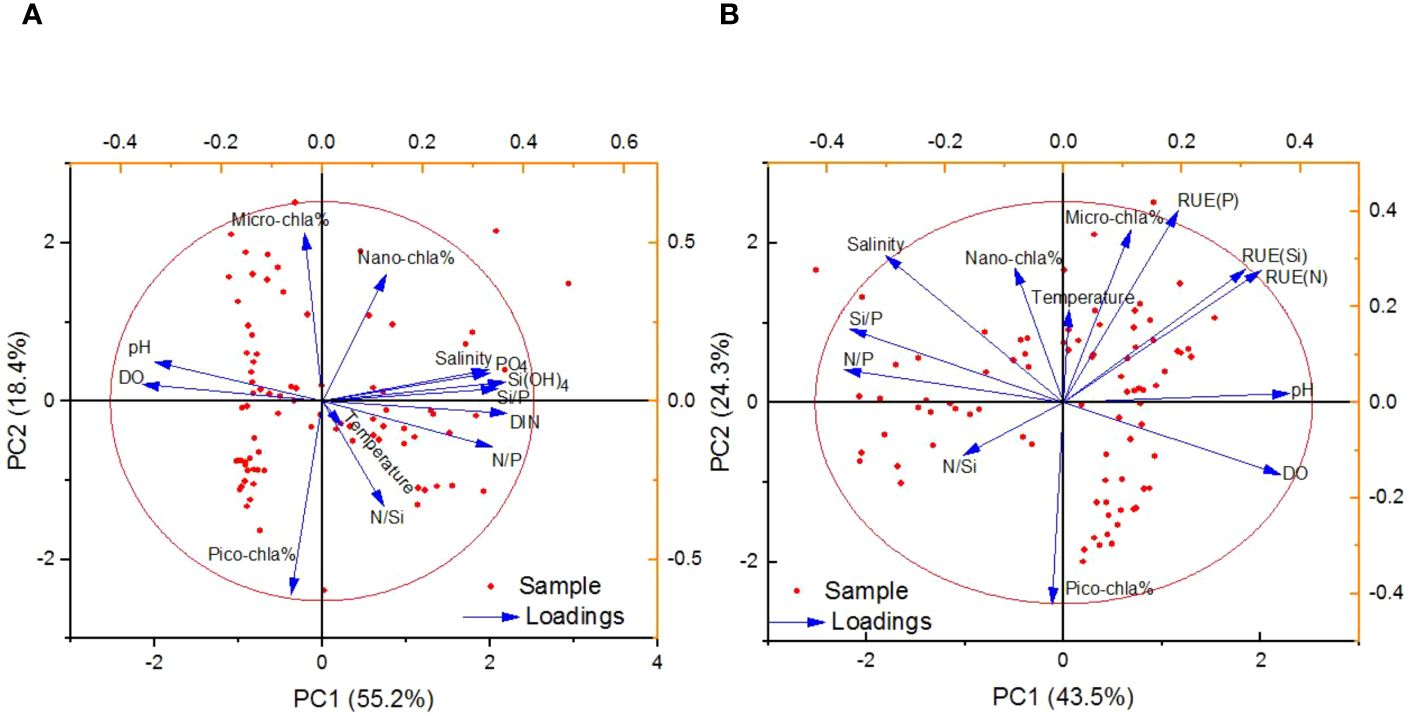
Figure 8. PCA results for size-fractionated phytoplankton contributions (A), and the resource use efficiency of phytoplankton (B) with nutrient concentrations and ratios, as well as environmental parameters.
5 Conclusions
In the context of global warming, increased freshwater input has emerged as a significant factor influencing nutrient and phytoplankton conditions in the upper waters, with the BG-driven freshwater convergence playing a complementary role. Additionally, the freshening of these waters, coupled with the BG-driven downwelling, has deepened the upper water layer and strengthened stratification. This process has impeded the nutrient replenishment from the lower layer into the upper layer, consequently leading to the nutrient depletion in the surface water. Furthermore, freshening has also resulted in the decreased chla concentrations from the western to the eastern CP, accompanied with a decreased contribution of micro-chla biomass but an increased dominance of nano- and pico-chla, particularly evident near the Canada Abyssal Plain in the BG regimes. The freshening and warming water increased the phytoplankton resource use efficiency of DIN, in addition, the fraction of micro-chla positively contributed but pico-chla fraction negatively contributed to the RUE(N).
Data availability statement
The original contributions presented in the study are included in the article/supplementary material. Further inquiries can be directed to the corresponding author.
Author contributions
ZN: Data curation, Software, Writing – original draft, Writing – review & editing. HZ: Formal analysis, Methodology, Validation, Writing – review & editing. MZ: Data curation, Investigation, Methodology, Writing – review & editing. TL: Investigation, Validation, Writing – review & editing. SL: Data curation, Investigation, Writing – review & editing. XC: Data curation, Investigation, Writing – review & editing. LZ: Conceptualization, Data curation, Methodology, Writing – review & editing. YG: Investigation, Software, Writing – review & editing. CC: Investigation, Software, Writing – review & editing. ZW: Investigation, Software, Writing – review & editing. WD: Investigation, Software, Writing – review & editing. HZZ: Data curation, Formal analysis, Funding acquisition, Investigation, Visualization, Writing – review & editing.
Funding
The author(s) declare financial support was received for the research, authorship, and/or publication of this article. This work was supported by the National Key Research and Development Program of China (2022YFC3102001), Director’s Foundation of South China Sea Bureau of Ministry of Natural Resources (230201), the Research Fund Program of Guangdong Provincial Key Laboratory of Applied Marine Biology (LAMB20221007), Hanjiang Estuary–Nanao Island Marine Ecosystem Observation and Research Station (2021B1212050025), Guangdong Basic and Applied Basic Research Foundation (2021A1515011386), and Guangzhou Basic and Applied Basic Research Project (202201011620).
Acknowledgments
The authors would like to thank the 12th Chinese National Arctic Research Expedition by Ministry of Natural Resources and also appreciate the crew on the Xuelong 2 for their help with sampling.
Conflict of interest
The authors declare that the research was conducted in the absence of any commercial or financial relationships that could be construed as a potential conflict of interest.
The handling editor LZ declared a shared affiliation with the author LZ at the time of review.
Publisher’s note
All claims expressed in this article are solely those of the authors and do not necessarily represent those of their affiliated organizations, or those of the publisher, the editors and the reviewers. Any product that may be evaluated in this article, or claim that may be made by its manufacturer, is not guaranteed or endorsed by the publisher.
References
Abe Y., Matsuno K., Fujiwara A., Yamaguchi A. (2020). Review of spatial and inter-annual changes in the zooplankton community structure in the western Arctic Ocean during summers of 2008–2017. Prog. Oceanogr. 186, 102391. doi: 10.1016/j.pocean.2020.102391
Abolt C. J., Young M. H., Atchley A. L., Harp D. R., Coon E. T. (2020). Feedbacks between surface deformation and permafrost degradation in ice wedge polygons, Arctic Coastal Plain, Alaska. J. Geophys. Res.: Earth Surface 125, e2019JF005349. doi: 10.1029/2019JF005349
Ardyna M., Babin M., Gosselin M., Devred E., Rainville L., Tremblay JÉ (2014). Recent Arctic Ocean sea ice loss triggers novel fall phytoplankton blooms. Geophys. Res. Lett. 41, 6207–6212. doi: 10.1002/2014GL061047
Arrigo K. R., van Dijken G. L. (2011). Secular trends in Arctic Ocean net primary production. J. Geophys. Res. 116, C09011. doi: 10.1029/2011JC007151
Arrigo K. R., van Dijken G. L. (2015). Continued increases in Arctic Ocean primary production. Prog. Oceanogr. 136, 60–70. doi: 10.1016/j.pocean.2015.05.002
Behrenfeld M. J., Boss E. S. (2014). Resurrecting the ecological underpinnings of ocean plankton blooms. Annu. Rev. Mar. Sci. 6, 167–194. doi: 10.1146/annurev-marine-052913-021325
Behrenfeld M. J., Hu Y., O’Malley R. T., Boss E. S., Hostetler C. A., Siegel D. A., et al. (2017). Annual boom-bust cycles of polar phytoplankton biomass revealed by space-based lidar. Nat. Geosci. 10, 118–123. doi: 10.1038/ngeo2861
Brugler E. T., Pickart R. S., Moore G. W. K., Roberts S., Weingartner T. J., Statscewich H. (2014). Seasonal to interannual variability of the Pacific water boundary current in the Beaufort Sea. Prog. Oceanogr. 127, 1–20. doi: 10.1016/j.pocean.2014.05.002
Carmack E. C., Williams W. J., Zimmermann S. L., McLaughlin F. A. (2012). The Arctic Ocean warms from below. Geophys. Res. Lett. 39, 1–6. doi: 10.1029/2012GL050890
Carmack E. C., Yamamoto-Kawai M., Haine T. W. N., Bacon S., Bluhm B. A., Lique C., et al. (2015). Freshwater and its role in the Arctic Marine System: Sources, disposition, storage, export, and physical and biogeochemical consequences in the Arctic and global oceans. J. Geophys. Res.: Biogeosciences 121, 675–717. doi: 10.1002/2015JG003140
Castagno A. P., Wagner T. J. W., Cape M. R., Lester C. W., Bailey E., Alves-de-Souza C., et al. (2023). Increased sea ice melt as a driver of enhanced Arctic phytoplankton blooming. Glob. Change Biol. 29, 5087–5098. doi: 10.1111/gcb.16815
Chen J. F., Jin H. Y., Bai Y. C., Zhuang Y. P., Li H. L., Li Y. J., et al. (2018). Marine ecological and environmental response to the Arctic rapid change. Haiyang Xuebao 40, 22–31. doi: 10.3969/j.issn.0253-4193.2018.10.003
Colombo M., Jackson S. L., Cullen J. T., Orians K. J. (2020). Dissolved iron and manganese in the Canadian Arctic Ocean: On the biogeochemical processes controlling their distributions. Geochim. Cosmochim. Ac 277, 150–174. doi: 10.1016/j.gca.2020.03.012
Coupel P., Ruiz-Pino D., Sicre M. A., Chen J. F., Lee S. H., Schiffrine N., et al. (2015). The impact of freshening on phytoplankton production in the Pacific Arctic Ocean. Prog. Oceanogr. 131, 113–125. doi: 10.1016/j.pocean.2014.12.003
Danielson S., Eisner L., Ladd C., Mordy C., Sousa L., Weingartner T. J. (2017). A comparison between late summer 2012 and 2013 water masses, macronutrients, and phytoplankton standing crops in the northern Bering and Chukchi Seas. Deep Sea Res. Part II 135, 7–26. doi: 10.1016/j.dsr2.2016.05.024
Falardeau J., de Vernal A., Fréchette B., Hillaire-Marcel C., Archambault P., Fritz M., et al. (2023). Impacts of stronger winds and less sea ice on Canadian Beaufort Sea shelf ecosystems since the late 1990s. Estuar. Coast. Shelf Sci. 294, 108520. doi: 10.1016/j.ecss.2023.108520
Fei S., Li J., Gao Y., Ge Y., Guo Z., Gao Y. (2023). Regulation of phytoplankton distribution by characteristic water masses in the northern Chukchi Sea, Arctic. Acta Oceanol Sin. 45, 114–124. doi: 10.12284/hyxb2023016
Fichot C. G., Kaiser K., Hooker S. B., Amon R. M. W., Babin M., Bélanger S., et al. (2013). Pan-Arctic distributions of continental runoff in the Arctic Ocean. Sci. Rep. 3, 1053. doi: 10.1038/srep01053
Filstrup C. T., Hillebrand H., Heathcote A. J., Harpole W. S., Downing J. A. (2014). Cyanobacteria dominance influences resource use efficiency and community turnover in phytoplankton and zooplankton communities. Ecol. Lett. 17, 464–474. doi: 10.1111/ele.12246
Fu W., Moore J. K., Primeau F. W., Lindsay K., Randerson J. T. (2020). A growing freshwater lens in the Arctic Ocean with sustained climate warming disrupts marine ecosystem function. J. Geophys. Res.: Biogeosciences 125, e2020JG005693. doi: 10.1029/2020JG005693
Granger J., Sigman D. M., Gagnon J., Tremblay J. E., Mucci A. (2018). On the properties of the arctic halocline and deep water masses of the Canada basin from nitrate isotope ratios. J. Geophys. Res.: Oceans 123, 5443–5458. doi: 10.1029/2018JC014110
Guo L., Zhang J., Guéguen C. (2004). Speciation and fluxes of nutrients (N, P, Si) from the upper Yukon River. Glob. Biogeochem. Cycles 18, GB1038. doi: 10.1029/2003GB002152
Haine T. W. N., Curry B., Gerdes R., Hansen E., Karcher M., Lee C., et al. (2015). Arctic freshwater export: status, mechanisms, and prospects. Glob. Planet Chang. 125, 13–35. doi: 10.1016/j.gloplacha.2014.11.013
He J., Zhang F., Lin L., Ma Y., Chen J. (2012). Bacterioplankton and picophytoplankton abundance, biomass, and distribution in the Western Canada Basin during summer 2008. Deep Sea Res. Part II 81–84, 36–45. doi: 10.1016/j.dsr2.2012.08.018
Hodapp D., Hillebrand H., Striebel M. (2019). Unifying” the concept of resource use efficiency in ecology. Front. Ecol. Evol. 6. doi: 10.3389/fevo.2018.00233
Jin L., Chen H., Matsuzaki S. S., Shinohara R., Wilkinson D. M., Yang J. (2023). Tipping points of nitrogen use efficiency in freshwater phytoplankton along trophic state gradient. Water Res. 245, 120639. doi: 10.1016/j.watres.2023.120639
Kawagoshi Y., Yamashita Y., Duc L. V., Hama T., Ito H. (2019). Changes of nitrogen-removal performance and that of the bacterial community in a mixed culture comprising freshwater and marine anammox bacteria under averaged environmental condition. Chemosphere 217, 609–617. doi: 10.1016/j.chemosphere.2018.11.047
Kumar A., Yadav J., Mohan R. (2020). Global warming leading to alarming recession of the Arctic sea-ice cover: Insights from remote sensing observations and model reanalysis. Heliyon 6, e04355. doi: 10.1016/j.heliyon.2020.e04355
Lee Y., Min J. O., Yang E. J., Cho K. H., Jung J., Park J., et al. (2019). Influence of sea ice concentration on phytoplankton community structure in the Chukchi and East Siberian Seas, Pacific Arctic Ocean. Deep Sea Res. Part I 147, 54–64. doi: 10.1016/j.dsr.2019.04.001
Leu E., Mundy C. J., Assmy P., Campbell K., Gabrielsen T. M., Gosselin M., et al. (2015). Arctic spring awakening-Steering principles behind the phenology of vernal ice algal blooms. Prog. Oceanogr. 139, 151–170. doi: 10.1016/j.pocean.2015.07.012
Liang X., Bi H., Liu C., Li X., Wang D., Zhao F., et al. (2024). The linkage between wintertime sea ice drift and atmospheric circulation in an Arctic ice-ocean coupled simulation. Ocean Model. 189, 102362. doi: 10.1016/j.ocemod.2024.102362
Lin P., Pickart R. S., Weingartner T. J., Simmons H. L., Itoh M., Kikuchi T. (2023). Formation and circulation of newly ventilated winter water in the western Beaufort Sea. Prog. Oceanogr. 216, 103068. doi: 10.1016/j.pocean.2023.103068
Matrai P. A., Olson E., Suttles S., Hill V., Codispoti L. A., Light B., et al. (2013). Synthesis of primary production in the Arctic Ocean: I. Surface waters 1954–2007. Prog. Oceanogr. 110, 93–106. doi: 10.1016/j.pocean.2012.11.004
McLaughlin F. A., Carmack E. C., Macdonald R. W., Melling H., Swift J. H., Wheeler P. A., et al. (2004). The joint roles of Pacific and Atlantic-origin waters in the Canada Basin 1997–1998. Deep Sea Res. Part I 51, 107–128. doi: 10.1016/j.dsr.2003.09.010
Mills M., Brown Z. W., Laney S., Ortega-Retuerta E., Lowry K. E., van Dijken G. V., et al. (2018). Nitrogen limitation of the summer phytoplankton and heterotrophic prokaryote communities in the Chukchi Sea. Front. Mar. Sci. 5. doi: 10.3389/fmars.2018.00362
Mishra R. K., Jena B., Venkataramana V., Sreerag A., Soares M. A., AnilKumar N. (2022). Decadal changes in global phytoplankton compositions influenced by biogeochemical variables. Environ. Res. 206, 112546. doi: 10.1016/j.envres.2021.112546
Pacini A., Moore G. W. K., Pickart R. S., Nobre C., Bahr F., Våge K., et al. (2019). Characteristics and transformation of pacific winter water on the chukchi sea shelf in late spring. J. Geophys. Res.: Oceans 124, 7153–7177. doi: 10.1029/2019JC015261
Parsons T. R., Maita Y., Lalli C. M. (1984). A Manual of Chemical and Biological Methods for Seawater Analysis (Oxford: Pergamon Press).
Proshutinsky A., Krishfield R., Timmermans M. L., Toole J., Carmack E., McLaughlin F., et al. (2009). Beaufort Gyre freshwater reservoir: State and variability from observations. J. Geophys. Res. 114, C00A10. doi: 10.1029/2008JC005104
Proshutinsky A., Krishfield R., Toole J. M., Timmermans M. L., Williams W., Zimmermann S., et al. (2019). Analysis of the Beaufort Gyre freshwater content in 2003–2018. J. Geophys. Res.: Oceans 124, 9658–9689. doi: 10.1029/2019JC015281
Rabe B., Karcher M., Schauer U., Toole J. M., Krishfield R. A., Pisarev S., et al. (2011). An assessment of Arctic Ocean freshwater content changes from the 1990s to the 2006–2008 period. Deep Sea Res. Part I 58, 173–185. doi: 10.1016/j.dsr.2010.12.002
Ravindran S., Pant V., Mitra A. K., Kumar A. (2021). Spatio-temporal variability of sea-ice and ocean parameters over the Arctic Ocean in response to a warming climate. Polar Sci. 30, 100721. doi: 10.1016/j.polar.2021.100721
Reeve J. L., Hamme R. C., Williams W. J. (2019). Tracing denitrification in the Canada Basin: N2 loss to the atmosphere on the Chukchi Shelf and benthic inputs in deep waters. Deep Sea Res. Part I 143, 127–138. doi: 10.1016/j.dsr.2018.11.003
Ren J., Chen J., Bai Y., Sicre M. A., Yao Z., Lin L., et al. (2020). Diatom composition and fluxes over the Northwind Ridge, western Arctic Ocean: Impacts of marine surface circulation and sea ice distribution. Prog. Oceanogr. 186, 102377. doi: 10.1016/j.pocean.2020.102377
Ridley J. K., Blockley E. W., Ringer M. A. (2023). Arctic sea ice causes seasonal differences in the responses of Arctic waters vapor to climate warming in the CMIP6 model, HadGEM3-GC3.1. Geophys. Res. Lett. 50, e2022GL102541. doi: 10.1029/2022GL102541
Schlosser P., Swift J. H., Lewis D., Pfirman S. L. (1995). The role of the large-scale Arctic Ocean circulation in the transport of contaminants. Deep Sea Res. Part II 42, 1341–1367. doi: 10.1016/0967-0645(95)00045-3
Screen J. A., Deser C., Simmonds I. (2012). Local and remote controls on observed Arctic warming. Geophys. Res. Lett. 39, L10709. doi: 10.1029/2012GL051598
Seok M. W., Ko Y. H., Park K. T., Kim T. W. (2024). Possible enhancement in ocean productivity associated with wildfire-derived nutrient and black carbon deposition in the Arctic Ocean in 2019–2021. Mar. Pollut. Bull. 201, 116149. doi: 10.1016/j.marpolbul.2024.116149
SOA (State Oceanic Administration of China) (2007). Specification of Oceanographic Investigation Part 4: Seawater Analysis (GB/T 12763.4–2007) (Beijing: Standards Press of China).
Timmermans M. L., Garrett C., Carmack E. (2003). The thermohaline structure and evolution of the deep waters in the Canada Basin, Arctic Ocean. Deep Sea Res. Part II 50, 1305–1321. doi: 10.1016/S0967-0637(03)00125-0
Timmermans M. L., Marshall J. (2020). Understanding Arctic Ocean circulation: a review of ocean dynamics in a changing climate. J. Geophys. Res.: Oceans 125, e2018JC014378. doi: 10.1029/2018JC014378
Timmermans M. L., Marshall J., Proshutinsky A., Scott J. (2017). Seasonally derived components of the Canada Basin halocline. Res. Lett. 44, 5008–5015. doi: 10.1002/2017GL073042
Ueno H., Komatsu M., Ji Z., Dobashi R., Muramatsu M., Abe H., et al. (2020). Stratification in the northern Bering Sea in early summer of 2017 and 2018. Deep Sea Res. Part II 181–182, 104820. doi: 10.1016/j.dsr2.2020.104820
Wang X., Zhao J., Lobanov V. B., Kaplunenko D., Rudykh Y. N., He Y., et al. (2021). Distribution and transport of water masses in the East Siberian Sea and their impacts on the Arctic halocline. J. Geophys. Res.: Oceans 126, e2020JC016523. doi: 10.1029/2020JC016523
Wei G., Liu H., Cai L. (2024). The oceanic mixed layer changes along with the state transition of the Beaufort Gyre Dynamics of Atmospheres and Oceans. Dynam. Atmos Oceans 106, 101446. doi: 10.1016/j.dynatmoce.2024.101446
Woodgate R. A. (2018). Increases in the Pacific inflow to the Arctic from 1990 to 2015, and insights into seasonal trends and driving mechanisms from year-round Bering Strait mooring data. Prog. Oceanogr. 160, 124–154. doi: 10.1016/j.pocean.2017.12.007
Woodgate R. A., Aagaard K., Swift J. H., Falkner K. K., Smethie W. M. Jr. (2005). Pacific ventilation of the Arctic Ocean’s lower halocline by upwelling and diapycnal mixing over the continental margin. Geophys. Res. Lett. 32, L18609. doi: 10.1029/2005GL023999
Woodgate R. A., Weingartner T. J., Lindsay R. (2012). Observed increases in Bering Strait oceanic fluxes from the Pacific to the Arctic from 2001 to 2011 and their impacts on the Arctic Ocean water column. Geophys. Res. Lett. 39, L24603. doi: 10.1029/2012GL054092
Wu H., Zhang R., Wang Y., Hong M., Yan H., Zhu J. (2021). Analyzing the effects of sea ice melting and atmospheric heat transport on the warming around arctic based on comparable analysis and coupling modes. Atmos Res. 258, 105630. doi: 10.1016/j.atmosres.2021.105630
Ye L., Chang C. W., Matsuzaki S., Takamura N., Widdicombe C. E., Hsieh C. (2019). Functional diversity promotes phytoplankton resource use efficiency. J. Ecol. 107, 2353–2363. doi: 10.1111/1365-2745.13192
Zhang S., Mu C., Li Z., Dong W., Wang X., Streletskaya I., et al. (2021). Export of nutrients and suspended solids from major arctic rivers and their response to permafrost degradation. Adv. Clim. Chang. Res. 12, 466–474. doi: 10.1016/j.accre.2021.06.002
Zhang Y., Zhuang Y., Ji Z., Chen J., Bai Y., Wang B., et al. (2023). Impacts of Atlantic water intrusion on interannual variability of the phytoplankton community structure in the summer season of Kongsfjorden, Svalbard under rapid Arctic change. Mar. Environ. Res. 192, 106195. doi: 10.1016/j.marenvres.2023.106195
Zhou B., Wang R., Xiao W., Wang Y. (2021). Late Quaternary paleoceanographic history based on ostracode records from the Chukchi Plateau, western Arctic Ocean. Mar. Micropaleontol. 165, 101987. doi: 10.1016/j.marmicro.2021.101987
Zhuang Y., Jin H., Cai W., Li H., Qi D., Chen J. (2022). Extreme nitrate deficits in the western Arctic Ocean: origin, decadal changes, and implications for denitrification on a polar marginal shelf. Global Biogeochem. Cy. 36, e2022GB007304. doi: 10.1029/2022GB007304
Zhuang Y., Jin H., Chen J., Li H., Ji Z., Bai Y., et al. (2018). Nutrient and phytoplankton dynamics driven by the Beaufort Gyre in the western Arctic Ocean during the period 2008–2014. Deep Sea Res. Part I 137, 30–37. doi: 10.1016/j.dsr.2018.05.002
Zhuang Y., Jin H., Li H., Chen J., Lin L., Bai Y., et al. (2016). Pacific inflow control on phytoplankton community in the Eastern Chukchi Shelf during summer. Cont. Shelf Res. 129, 23–32. doi: 10.1016/j.csr.2016.09.010
Zhuang Y., Jin H., Zhang Y., Li H., Zhang T., Li Y., et al. (2021). Incursion of Alaska Coastal Water as a mechanism promoting small phytoplankton in the western Arctic Ocean. Prog. Oceanogr. 197, 102639. doi: 10.1016/j.pocean.2021.102639
Keywords: Chukchi Plateau, freshening, nutrient, Western Canada Basin, water masses, RUE
Citation: Ni Z, Zhang H, Zhang M, Li T, Li S, Chen X, Zhang L, Gao Y, Chen C, Wang Z, Deng W and Zhang H (2024) The characteristics of nutrient distribution and influencing factors in the Chukchi Plateau and adjacent waters. Front. Mar. Sci. 11:1429493. doi: 10.3389/fmars.2024.1429493
Received: 08 May 2024; Accepted: 09 July 2024;
Published: 12 August 2024.
Edited by:
Li Zhang, Chinese Academy of Sciences (CAS), ChinaReviewed by:
Jingxi Li, First Institute of Oceanography, Ministry of Natural Resources, ChinaQiang Hao, Ministry of Natural Resources, China
Copyright © 2024 Ni, Zhang, Zhang, Li, Li, Chen, Zhang, Gao, Chen, Wang, Deng and Zhang. This is an open-access article distributed under the terms of the Creative Commons Attribution License (CC BY). The use, distribution or reproduction in other forums is permitted, provided the original author(s) and the copyright owner(s) are credited and that the original publication in this journal is cited, in accordance with accepted academic practice. No use, distribution or reproduction is permitted which does not comply with these terms.
*Correspondence: Tuanjie Li, bHRqMTAwNUAxMjYuY29t
†These authors have contributed equally to this work and share first authorship