 Gualtiero Basilone1,2*
 Gabriella Lo Cicero1,2,3*
 Miryam Fortuna1,2Anita Luviner4
 Rosalia Ferreri1,2
 Salvatore Aronica1,2
 Simona Genovese1,2
 Giovanni Giacalone1,2
 Ignazio Fontana1,2
 Angelo Bonanno1,2
- 1Istituto per lo studio degli impatti Antropici e Sostenibilità in ambiente marino (IAS) S.S. di Capo Granitola, Consiglio Nazionale delle Ricerche (CNR), Campobello di Mazara, TP, Italy
- 2National Biodiversity Future Center (NBFC), Palermo, Italy
- 3Department Earth and Marine Sciences (DiSTeM), University of Palermo, Palermo, Italy
- 4Bruker Italia Unipersonale Srl, Milano, Italy
Fourier-transform near-infrared spectroscopy (FT-NIRS) has recently been used to reduce the processing time for estimates of annual age in several fish species. The present study represents the first application of this technique to marine organisms from the European waters. Atlantic horse mackerel (Trachurus trachurus) from the central Mediterranean Sea was selected for its ecological role, its socioeconomic value, and because its age is regularly estimated by otolith reading under a stereomicroscope for stock assessment purposes. Absorption spectra of the whole otoliths were acquired by FT-NIRS across a multiyear dataset, obtained during acoustic surveys carried out in different regions of the central Mediterranean Sea. The acquired spectra were processed to optimize calibration models to predict age. The best linear models obtained by the optimizing procedure predicted age successfully with a coefficient of determination of 0.95–0.96, mean squared error of 0.5 years, and bias <0.03 years. Although regional calibration models were also obtained separately, the models with all regions combined appeared much more robust and encompassing the whole age range, suggesting its usefulness for the entire spatial distribution range considered in the preset study. The use of FT-NIRS allowed to successfully predict age for horse mackerel between the ages 1 and 14, with similar or better precision (and bias) of the traditional methods, also increasing the standardization by repeatability of age assignments. The preliminary results obtained by this study encourage further effort to fine-tune the calibration model for new species, in order to apply a precise, rapid, cost-effective method for stock assessment purposes of Mediterranean fish resources.
Introduction
The marine fish age estimation is often used in stock assessment models, and it is one of the elements that requires expert operators, updated according to international recommendations, and a significant time commitment (ICES, 2023). In European countries, age estimation of hundreds of managed fish species is continuously carried out on a national basis by international scientific advisory bodies (e.g., STECF and GFCM), often comprising numerous age readers and methodologies. Otoliths preparation (extraction, embedding in resin, thin sectioning, polishing, etc.) and age determination protocol are actually a big issue for time spent by the experienced technicians. Despite being considerably time consuming, the results are biased by subjectivity and experience of readers that are generally two or three for requirement of stock assessment data (ICES, 2018).
Atlantic horse mackerel (HOM), Trachurus trachurus (Linneus, 1758), is one of the highly exploited resources, although the mean landings per year drastically declined since early 2000 (FAO, 2018), and it is routinely assessed within the EU data collection framework (Regulation (EU), 2017). The protocols of data collection require an extensive landing sampling along the years and scientific surveys at sea, which produced hundreds of otoliths to be examined each year.
HOM is a zooplanktivorous fish species (Rumolo et al., 2017), mainly occupying shelf seas, although in Mediterranean Sea, HOM has been reported up to 500 m depth (Milisenda et al., 2018) and forming large shoals during daytime (Abaunza et al., 2003; Iglesias et al., 2003; D’Elia et al., 2014), whereas individuals disperse during the night (Macer, 1977; Bertrand et al., 2006). HOM may grow to approximately 60 cm in length, but the size range of 15–40 cm is more common in Mediterranean waters (Abaunza et al., 2003; Abaunza et al., 2008). They grow rapidly during the first years of life and much more slowly after age 3. Some individuals are reported to reach 40 years of age (Abaunza et al., 2003), although aging methods are somewhat uncertain. Despite the importance of growth studies in stock assessment process, there is still a great deal of uncertainty due to the age assignment variability. Indeed, individual growth of different stocks could be assessed by different sampling procedures and reading protocols and by different readers, which subjectivity and/or experience may affect the observed variability among areas more than the environmental variations (ICES, 2018). Therefore, the use of an automatic calibrated system to estimate the age would ensure more precision and robustness in these data.
Fourier-transform near-infrared spectroscopy (FT-NIRS) has recently been used for rapid, non-destructive estimates of annual age in several fish species from scans of various tissues, including otoliths (Table 1). The literature indicated that this technology may provide a more efficient, timely, cost-effective method for determining fish age (i.e., those cited in Table 1). Efficiency is likely to vary species by species, depending on factors such as longevity and clarity of growth zone patterns, but the variability may be also linked to the otolith preparation method (Table 1). Repeatability (i.e., precision) is also likely to improve, as FT-NIRS measures quantitative information from otoliths (Helser et al., 2019).
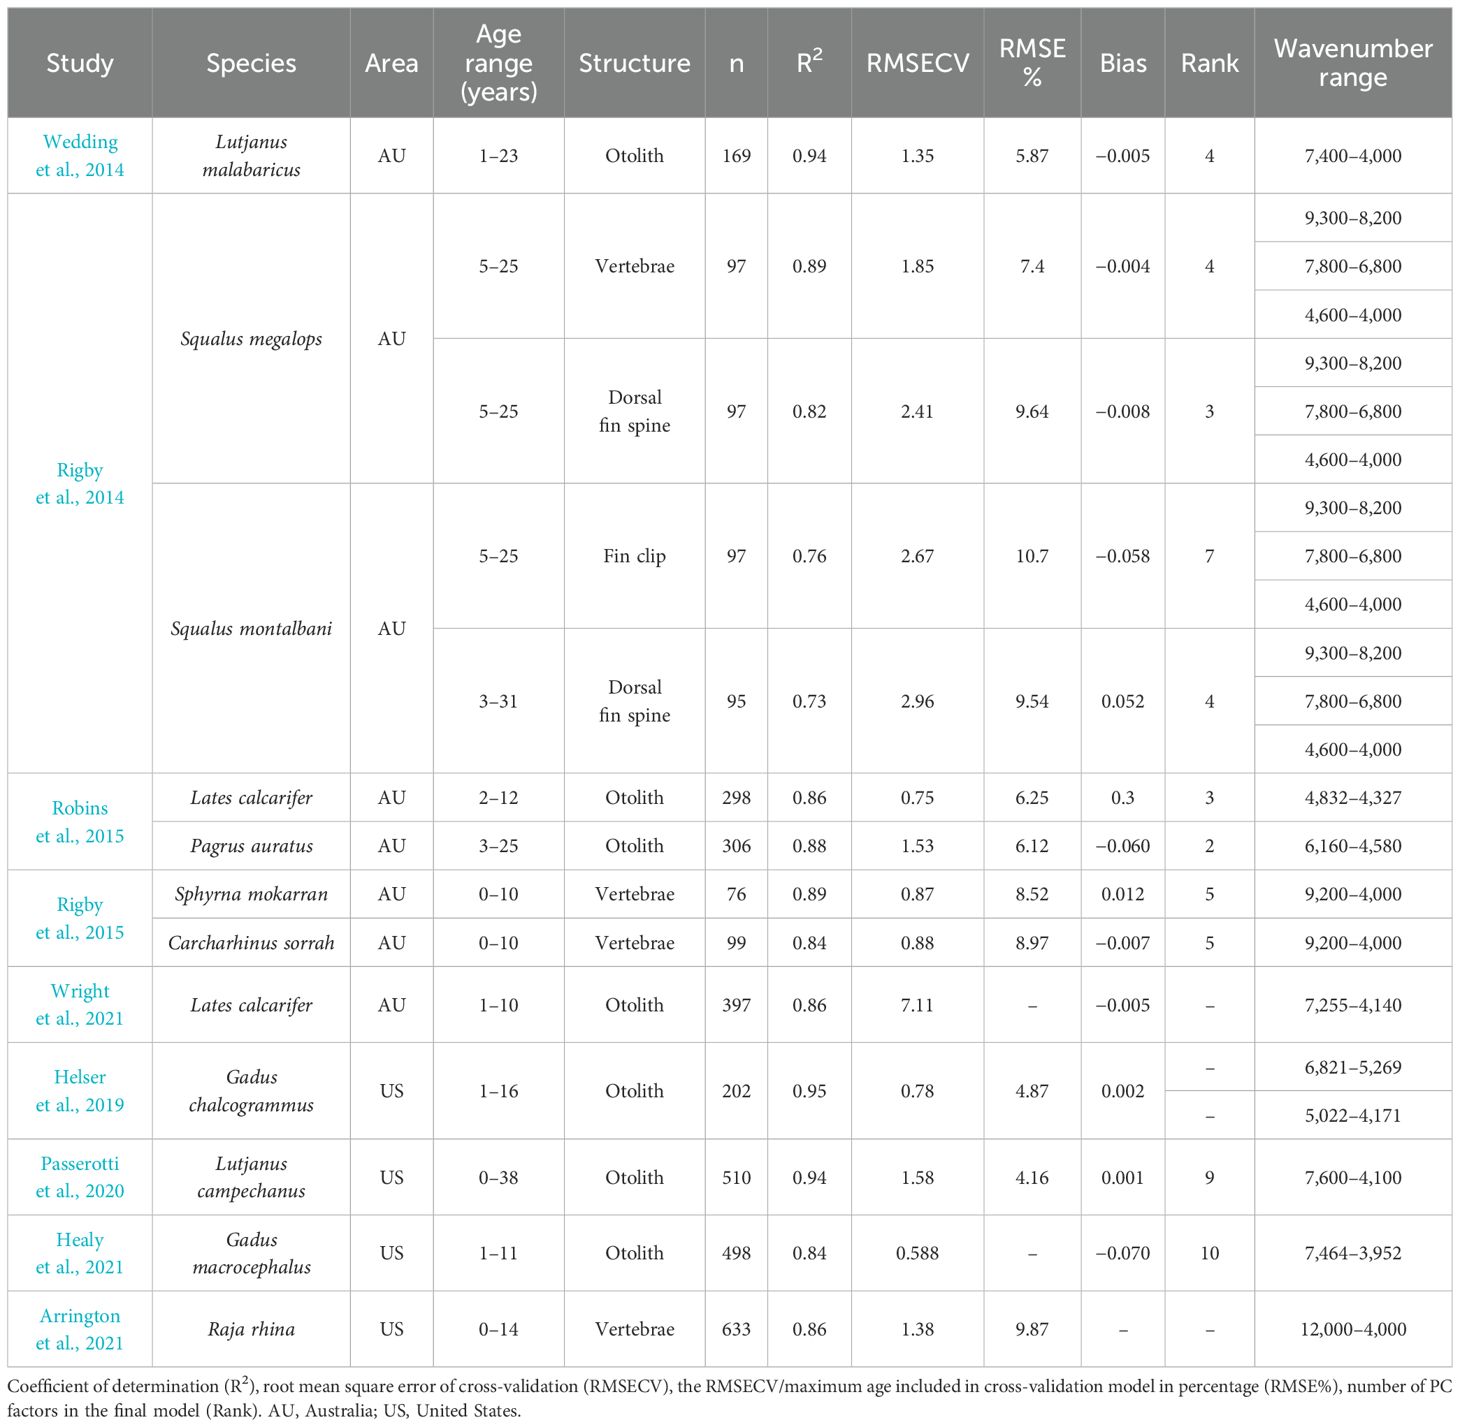
Table 1. Calibration models of FT-NIRS fish age applications available in literature for each fish species.
This technique utilizes light from the near-infrared region to evaluate organic chemical bonds present within a material (Williams, 2008). When irradiated at specific frequencies, these bonds vibrate in characteristic ways and thus absorb light, producing absorbance patterns representative of the composition of the sample (Murray and Williams, 1987; Siesler et al., 2001). Because the absorbance patterns are correlated with other known variables (such as age), they can be used in conjunction with multivariate statistical analysis to provide a rapid and non-destructive method for discriminating variables of interest from spectral data alone (Vance et al., 2016). This methodology has been successfully applied for several fish species mainly along the US and AU coasts, but never in European waters or in Mediterranean species (Table 1). Specifically, the first studies showing the potential for otolith aging were conducted on several fish species, such as the saddleback snapper (Lutjanus malabaricus; Wedding et al., 2014), the barramundi (Lates calcarifer), and the red snapper (Pagrus auratus; Robins et al., 2015), and the eastern Bering Sea pollack (Gadus chalcogrammus; Helser et al., 2019) and red snapper (Lutjanus campechanus; Passerotti et al., 2020). Additionally, the vertebrae of the hammerhead shark (Sphyrna mokarran) and the spotted shark (Carcharhinus sorrah), and the dorsal fin spines, vertebrae, and fin clips of deep-sea sharks (Squalus magalops, Squalus montalbani; Rigby et al., 2014) were analyzed to be effectively aged using FT-NIR spectroscopy. More recently, Arrington et al. (2021) used this methodology on Raja rhina vertebrae for age determination. These preliminary studies demonstrated some degree of environmental or regional specificity for otolith spectra (Benson et al., 2020; Passerotti et al., 2020).
The aim of the present study is to validate the use of FT-NIRS to predict annual age from whole otoliths in horse mackerel; moreover, such utilization represents the first application in European waters (Table 1). To evaluate and calibrate the FT-NIRS model, otoliths of HOM with age data revised in a recent study carried out in the central Mediterranean Sea were used (Basilone et al., 2023). Such data are useful to increase as much as possible the FT-NIRS spectra variability range for the following reasons: the dataset covers a sampling period between 2011 and 2018, thus representing an adequate time period to account for the effect of interannual variability on the FT-NIR spectra; the otoliths were collected from different areas in central Mediterranean Sea; and all the samples came from the same on-board scientific program with updated and internationally adopted sampling and processing protocols.
Materials and methods
Sampling and processing otoliths for age determination
Sagittal otoliths of Atlantic horse mackerel were routinely sampled in the framework of European Data collection acoustic surveys (Mediterranean International Acoustic Surveys-MEDIAS). These surveys were carried out to monitor pelagic fish species by the National Research Council, Institute of Anthropic Impacts and Sustainability in marine environment (CNR IAS—S.S. Capo Granitola). Samples were collected from 2011 up to 2018 over the continental shelf (depth <200 m) in four geographical sub-areas (Figure 1), from the Strait of Sicily to the Tyrrhenian and Ligurian Seas (see Basilone et al., 2023 for more details). These areas are characterized by distinct coastline complexity, riverine input, continental shelf extension, enrichment processes (i.e., upwelling or river runoff driven), and primary productivity levels (Bonanno et al., 2014; Bonanno et al., 2016). No use of live animals has been required for this study, and no specific permissions were needed for the sampling activities in all of the investigated areas because the target species is commercially harvested (neither endangered nor protected) and it was caught in areas where fishing is allowed.
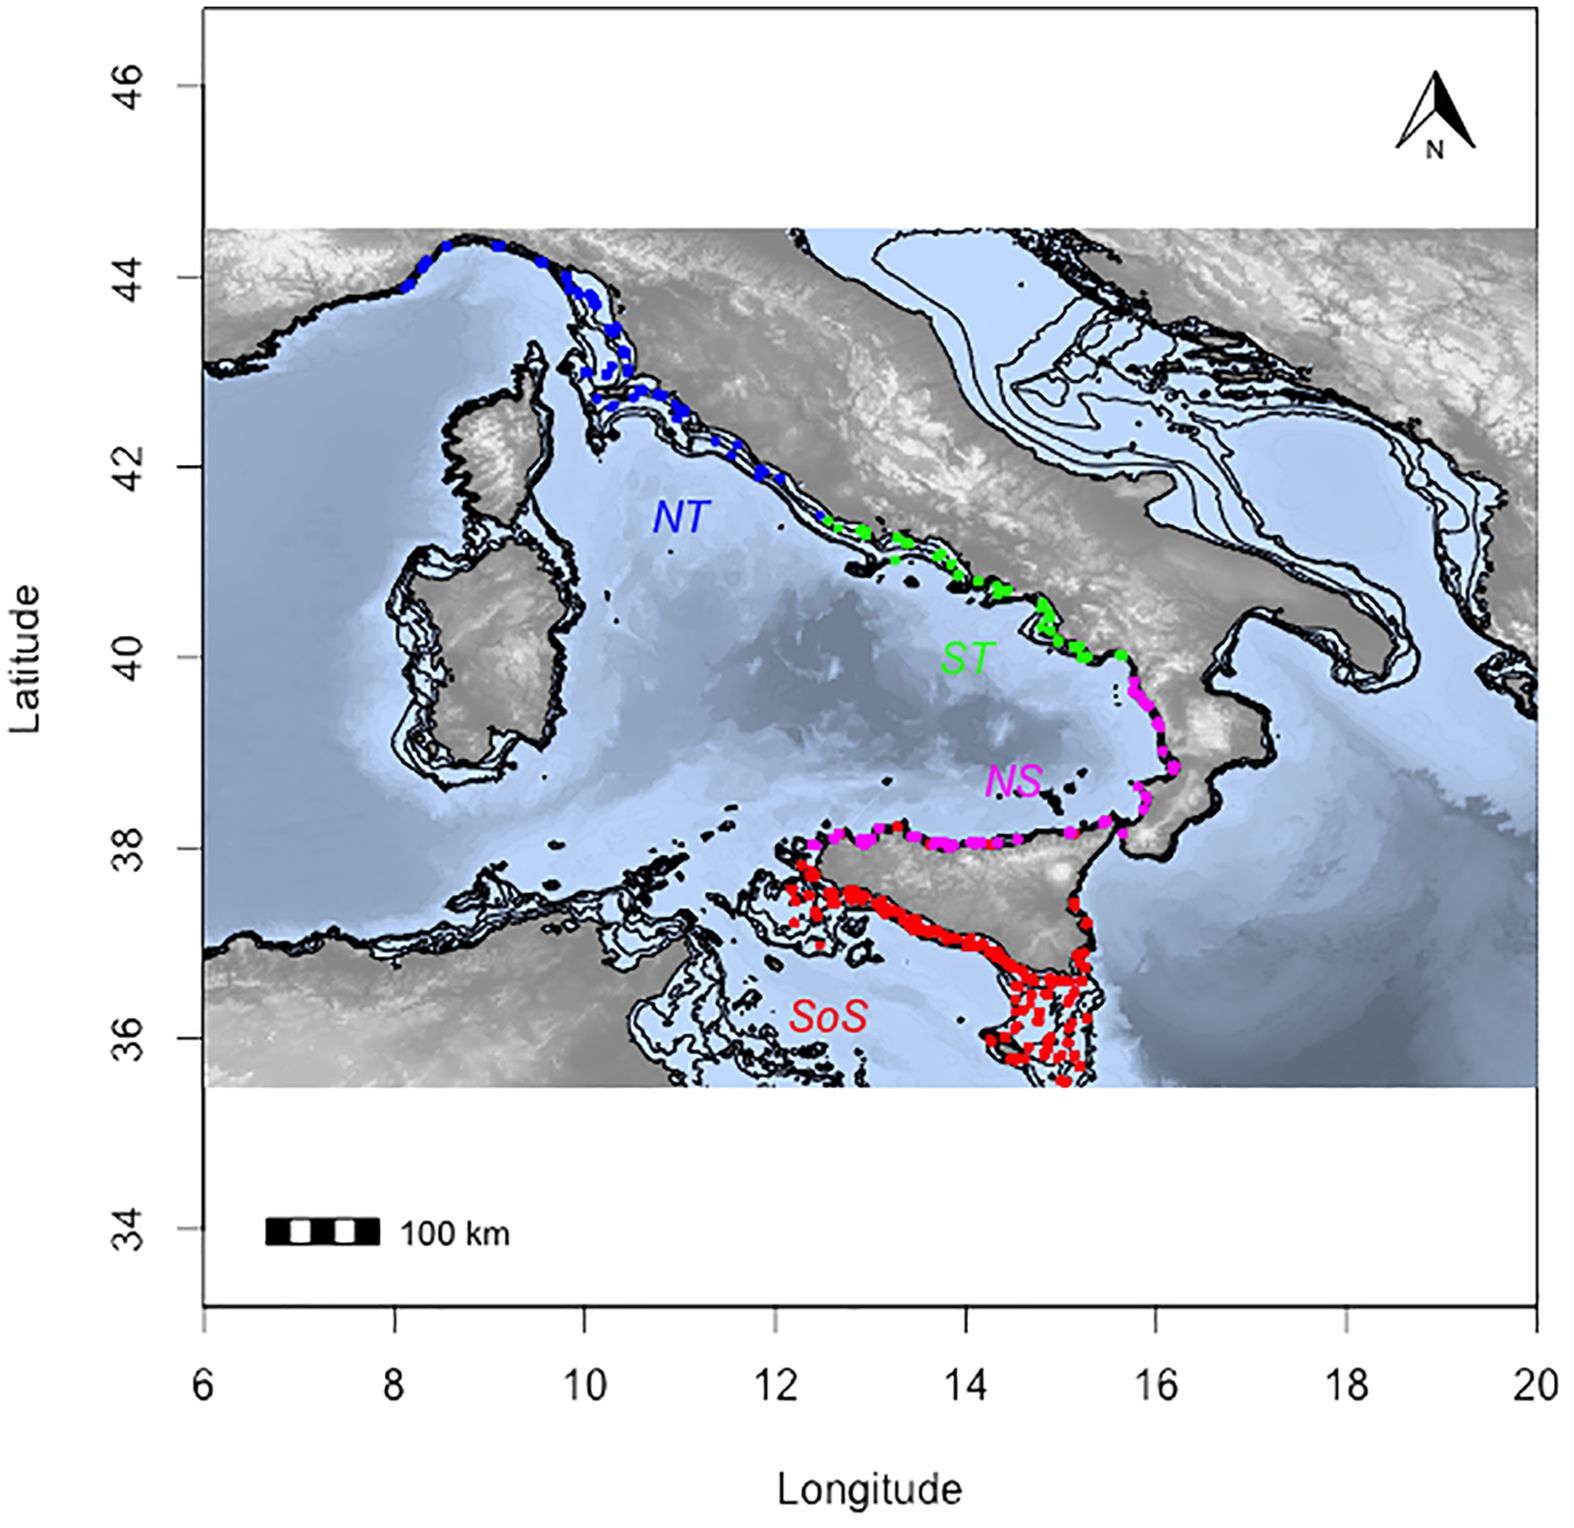
Figure 1. Trawl sampling carried out in the Central Mediterranean Sea along the survey periods: the black line represents the 200-m isobath; the area stratification for comparative purposes are Strait of Sicily (SoS) in red, North of Sicily and Calabria (NS) in magenta, south Tyrrhenian Sea (ST) in green, and north Tyrrhenian Sea (NT) in blue.
For the aim of this study, otoliths were selected to equalize sample sizes across regions while maintaining a similar range of collection years along the time series. Different sets of otoliths for calibration and testing, were selected from each geographic region: North of Sicily (NS), North Tyrrhenian (NT), South Tyrrhenian ST, and Strait of Sicily (SoS). Calibration sets were selected to approximate a uniform distribution within regions, with relatively even numbers of samples, which were randomly selected as 20 individuals per length class (1 cm). Test sets of otoliths for each region were randomly chosen from the same sampling years to mirror a typical age structure for each population (Figure 2). The traditional age estimate was obtained as described in Basilone et al. (2023) and according to the international agreed protocol for HOM (ICES, 2018).
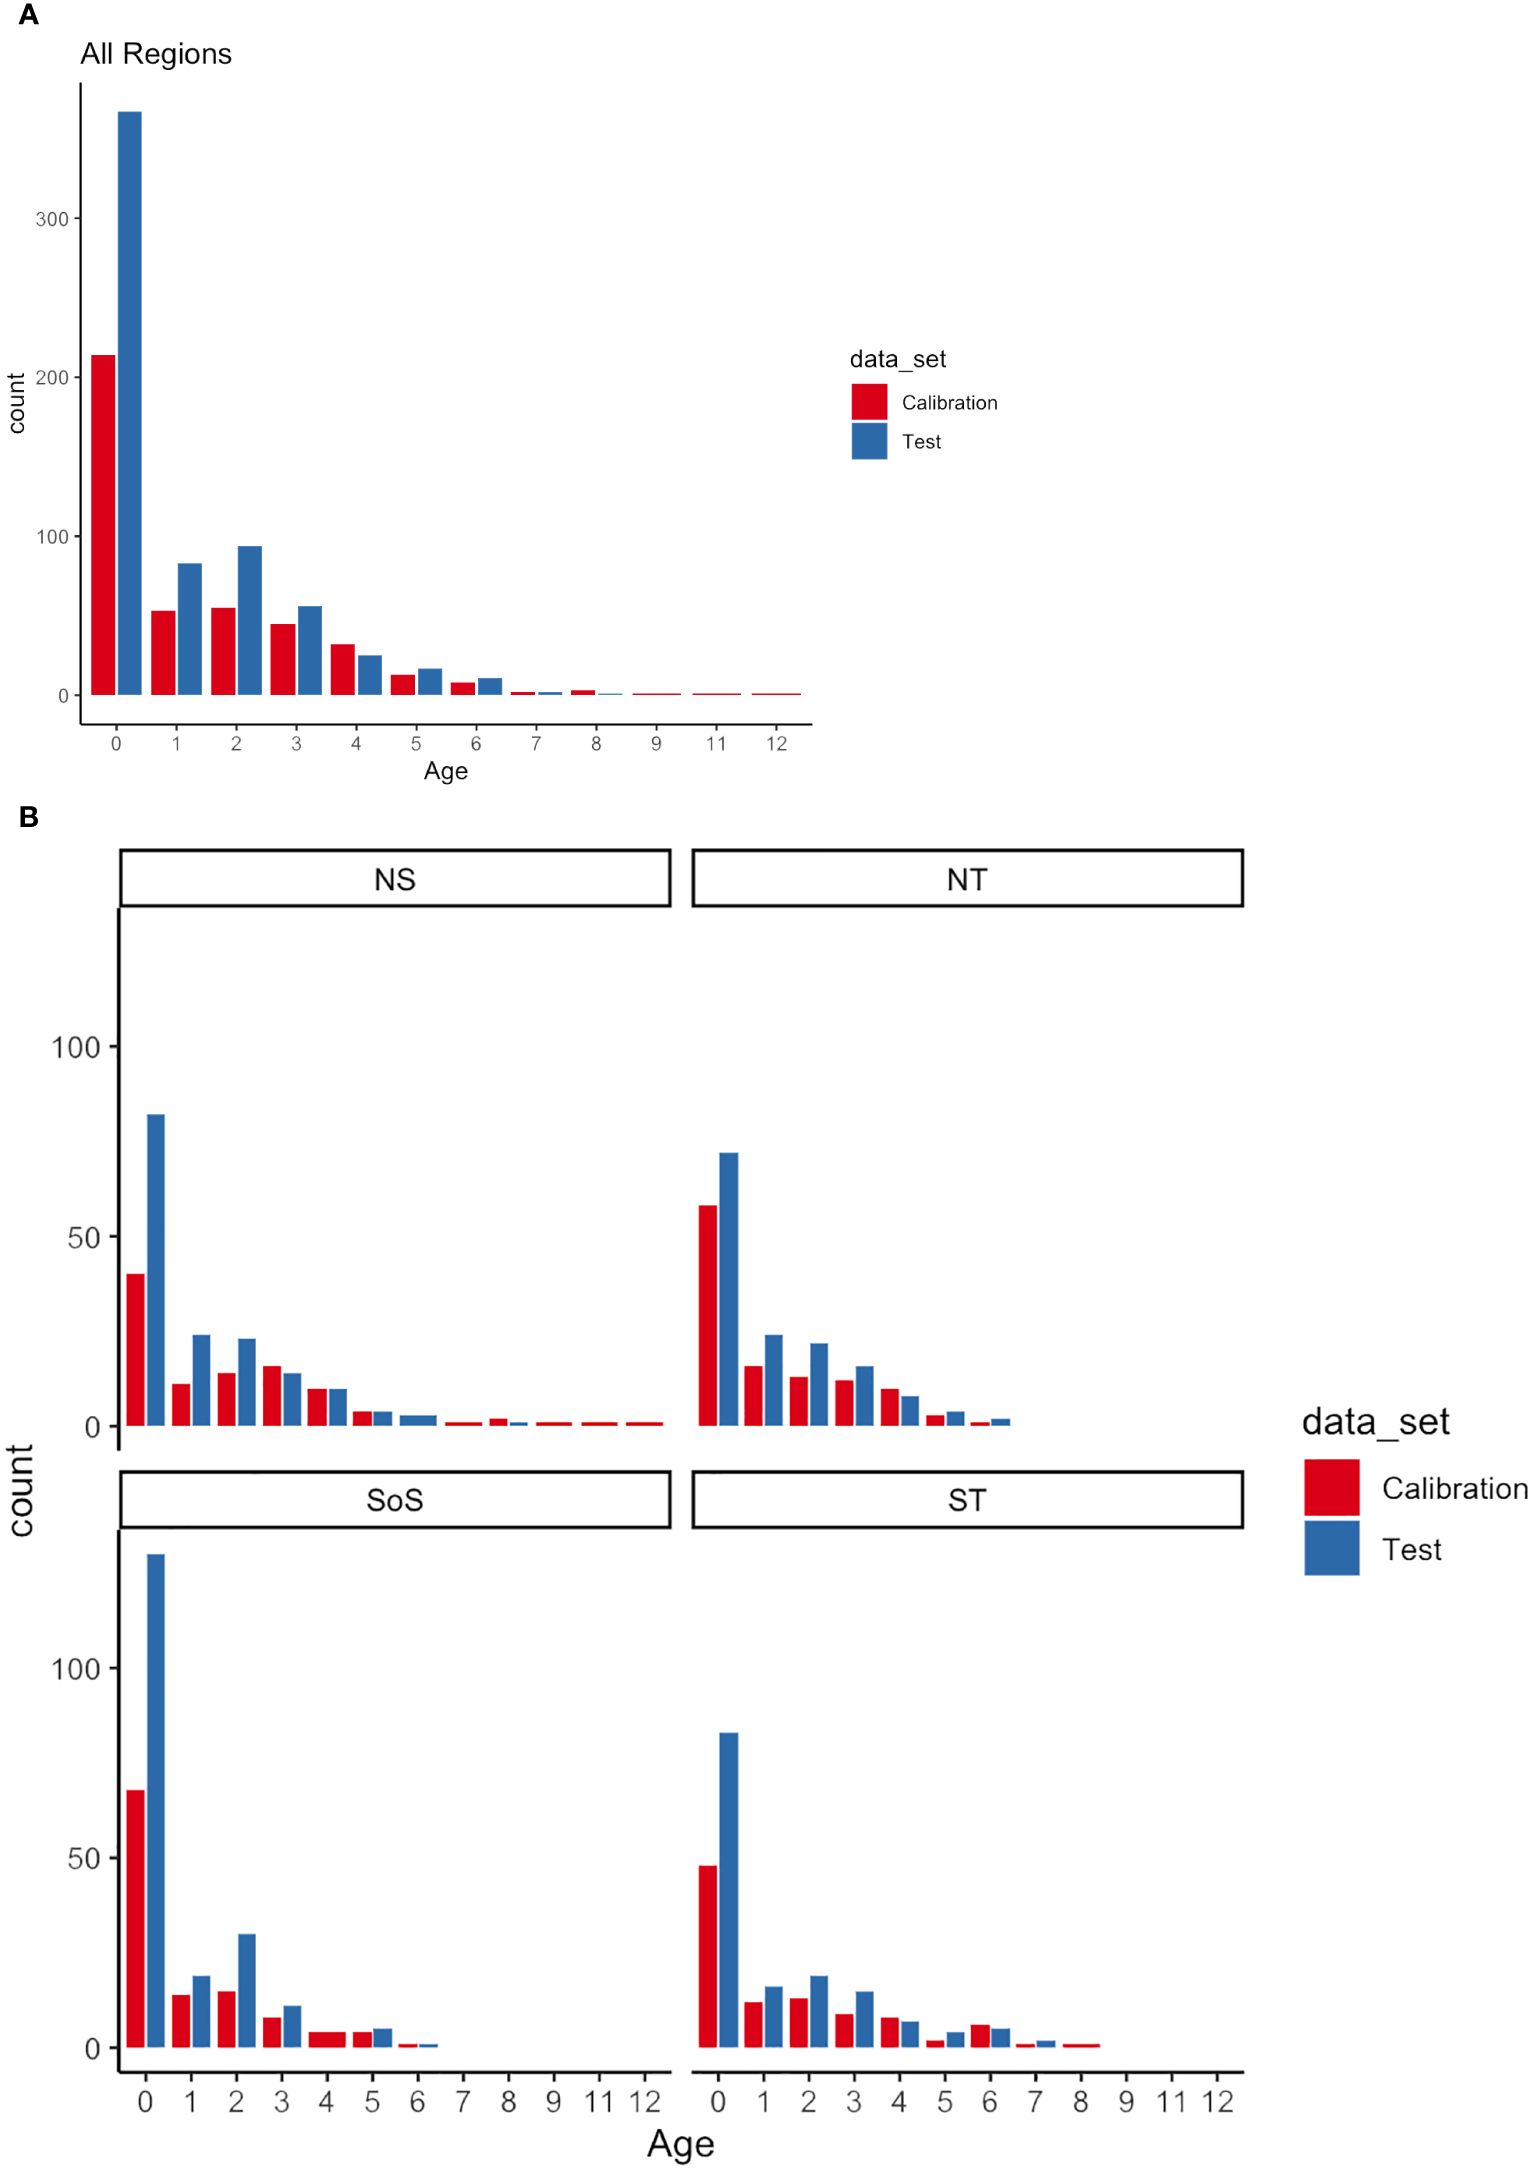
Figure 2. Age distributions of HOM samples selected for Calibration and Test sets, (A) overall (All regions combined) and (B) for each area: North of Sicily and Calabria (NS), North Tyrrhenian (NT), Strait of Sicily (SoS), South Tyrrhenian (ST).
Spectral data acquisition
FT-NIRS spectral absorbance data were acquired using a Bruker TANGO-R Near-Infrared Spectrometer with a 22-mm diameter sample window and OPUS software (version 8.5; Bruker Optics GmbH & Co. KG, Ettlingen, Germany). Dry and cleaned otoliths were first scanned by placing them directly on the center of the sample window, convex side down, and conventionally positioned so that the rostral axis of the otolith was horizontal according to reference points placed around the sample window (Figure 3). A 19-mm gold-coated transflectance cup was placed over the top of each positioned otolith to standardize the path length of NIR incident light. Due to the thickness of some otoliths, it was necessary to add a cover support (metal ring) to provide enough space also for bigger otoliths under the cup (Figure 3). A total of 64 spectral scans were acquired for each otolith at a frequency of 16 cm−1 along the entire NIR spectrum (11,500–4,000 cm−1) and resolution better than 4 cm−1. According to the reading protocol (ICES, 2018), the age data are from the right otoliths, so the same ones were scanned. A principal component analysis (PCA) was used for data visualization and outliers detection of spectrograms for all samples according to the literature (see Table 1). Those that could not be rectified by rescanning were removed from the analysis (n=6).
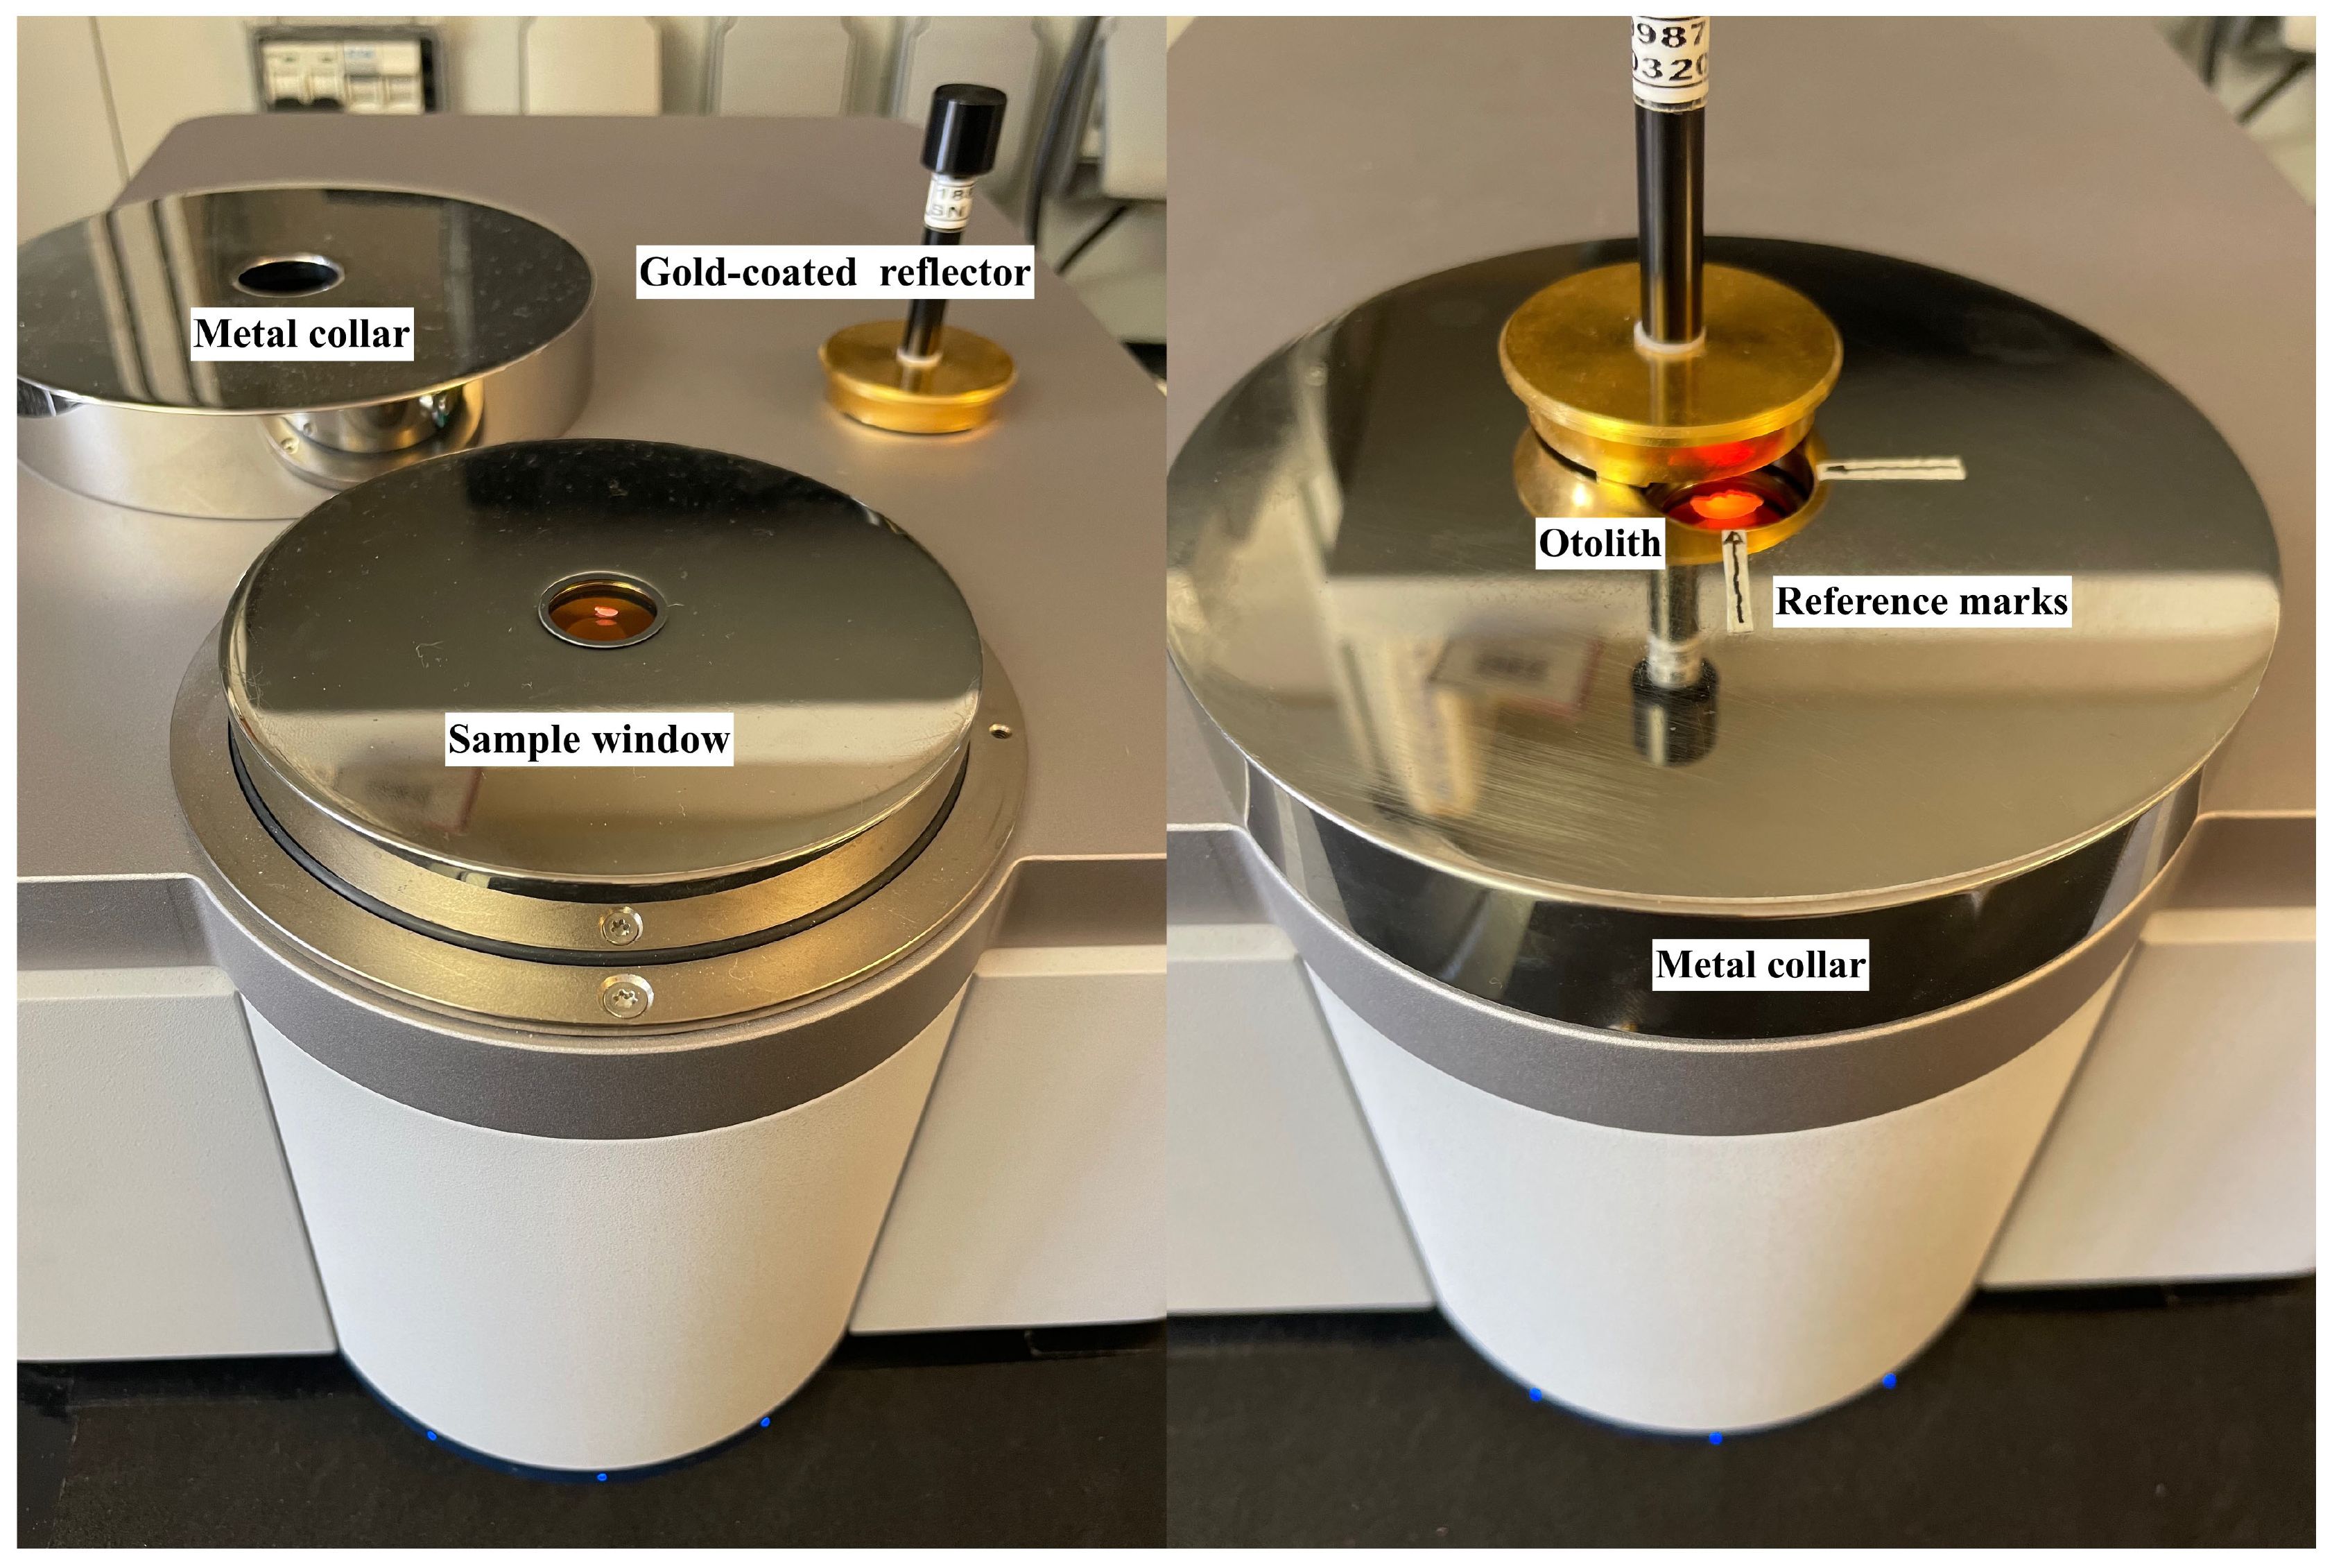
Figure 3. View of an otolith placed on the integrating sphere at a 90°compass orientation with a concave-up position. The gold-coated reflector stamp covers the sample during scanning to reduce stray light infiltration. Furthermore, reference marks were placed on the top of the metal collar for standardization of measurements by placing the otolith to the center of the sample windows.
Multivariate analysis and model selection
In order to set up a predictive model using the FT-NIRS spectral data, a multivariate calibration method, such as the partial least squares (PLS) regression was applied. PLS compares the information in the spectral data (the X data matrix) to reference values for the component of interest (the Y data matrix), and any changes in both matrixes are associated with one another. In the PLS regression, the dataset are first decomposed into their principal components and then fitted the scores vectors from spectral and age data (Conzen, 2014). The set of otoliths of known age have been provided as training set for the calibration model. Then, to correlate spectral signatures with age, the set of spectral data were evaluated using PLS regression, which produce a linear correlation model to predict the age of a fish. In order to increase robustness in its prediction ability, the calibration model should include as much variability as possible with reference to the variable investigated (the age of fishes and the geographical and interannual variability in this case).
The selection of an appropriate frequency range is of crucial importance for the quality of a PLS model. When setting up a model, one should use the frequency range of the spectrum where a good correlation between the changes in the spectral and the concentration data can be found. The extent of correlation can be judged easily by the coefficient of determination R2 (Conzen, 2014).
PLS regression is a so-called full spectrum method, i.e., the more spectral data points are present, the more spectral information is available per component, and the better the respective model will be. However, it has to be taken into account that contributions from spectral noise or absorption bands of interfering components can deteriorate the quality of the model. The PLS algorithm can distinguish between analytically relevant and analytically useless structures in the spectrum. Disturbances are detected during calibration and eliminated in further analysis.
To create the calibration model, an internal cross-validation was applied. Then, to evaluate the predictive capability of the model, an external validation using a separate test set of otoliths was applied (Williams, 2008). Multivariate spectral data fitted by the PLS procedure was than cross-validated (Chen and Wang, 2001). Cross-validation employs the “leave one out” method, which validates by repeatedly excluding and adding back samples. More in detail, every calibration sample is temporarily taken out of the dataset, the remaining samples are used to build a partial least squares model, and the sample that was taken out is predicted as an unknown. The sample is added back to the dataset once the difference between the reference value and the predicted value has been calculated. This procedure is repeated with each sample until all ones had been cross-validated. The model accuracy has been evaluated by the coefficient of determination (R2), root mean square error of cross-validation (RMSECV), and residual prediction deviation (RPD) values. Correlation coefficient gives the percentage of variance present in the component values, which is reproduced in the prediction. This is often called explained variance. The higher the coefficient, the better the correlation between the concentration data and spectral data. Low R-values generally lead to bad analysis results. There are various possible reasons for these bad correlations: selecting inappropriate model parameters leads to a low coefficient of determination (R2 <<90), as does for example an insufficient precision of the reference data, or the existence of outliers in the calibration dataset. RMSECV is a quantitative measure for the accuracy with which the samples are predicted during a validation. The smaller this error, the better the quality of the model. Background and details for statistical analysis of NIR spectral data related to otolith age are well described in Wedding et al. (2014) and Helser et al. (2018). The cross-validated model obtained by 40% of the whole samples acquired (calibration set; n= 428) was used to predict a new separate set of representative unknown samples randomly selecting 60% of the whole dataset (test-set; n= 656).
A comparison of the FT-NIRS results with the traditional age data of the test set has been carried out by the root mean square error of prediction (RMSEP). This value also represents a quantitative measure for the predictive accuracy of the model. Good models are characterized by low RMSEP values. Internal and external validation should lead to comparable values of RMSEP and RMSECV. The RPD is obtained by the ratio between the standard deviation of the reference data and the standard deviation of the predictions of the calibration model (RMSECV or RMSEP). The larger the RPD, the better the calibration (Conzen, 2014); however, an acceptable RPD based on literature and factory specifications would be higher than 3 (Table 1). The RMSEP% was also obtained as the ratio between RMSEP and the maximum age to take into account the age range when comparing the model errors (Couture et al., 2016).
Since variability in FT-NIRS predicted age may be linked to differences in water chemistry, condition, or growth rate (Wedding et al., 2014; Robins et al., 2015; Helser et al., 2018), the calibration models were obtained both separately for each area and overall combined areas.
To support the FT-NIRS predictive capabilities, a two-sided Kolmogorov–Smirnov (K–S) test for each test/calibration set pair was applied to test the differences in length at age distributions derived from FT-NIRS predicted and traditional age reading (Passerotti et al., 2020).
Samples in the oldest age classes were underrepresented, as our pooled samples contained only two samples beyond 9 years. To evaluate possible effects of the few older specimens in some areas, the models were also obtained with and without (truncated) these older specimens (i.e., 11 and 12 years old).
All models were optimized using only wavelength selection with no further data preprocessing, as this optimization process yielded better model results than any preprocessing regime in which spectral data were transformed (i.e., Subtraction of a Constant Offset, Vector Normalization, Min–Max Normalization, Subtraction of a Straight Line, Multiplicative Scatter Correction, First Derivative, and Second Derivative).
In order to further evaluate the bias of traditional aging method and FT-NIRS technique, the predicted ages were rounded to the nearest integer; hence, bias was obtained as the difference of predicted ages minus traditional ages (Passerotti et al., 2020). The percentage of agreement between methods (PA) and average percent of error (APE; Beamish and Fournier, 1981) was calculated using the FSA package in R (Ogle, 2016). The age distributions coming from the two methods were also tested for significant differences by means of the two-sided Kolmogorov–Smirnov (K–S) test for each test/calibration set combination.
Data treatment and spectral data analysis was conducted using the OPUS™ software suite (version 8.5, Bruker Optics GmbH & Co. KG), while PCA and statistical tests and graphical outputs were obtained in R statistical computing software version 4.3.2 (R Core Team, 2023).
Results
A total of 1,084 otoliths were included in FT-NIRS age prediction analyses across all regions (SoS, n= 310; NS, n= 262; ST, n= 251; NT, n= 261) (Figure 3). PCA of no pre-processed spectral data for all otoliths showed that the first principal component (PC first axis) explained 99.8% of the spectral variation among otoliths and suggested an overlapping among areas (Figure 4A), while the ages appeared to segregate, only slightly overlapping specially at older classes (Figure 4B). The one-way ANOVA between the variables and the categorical variables (i.e., area and age) showed a good link with age (R2 = 0.8, p<0.001), but much lower for regional differences (R2 = 0.04, p<0.001), suggesting that the latter variance is negligible in this study.
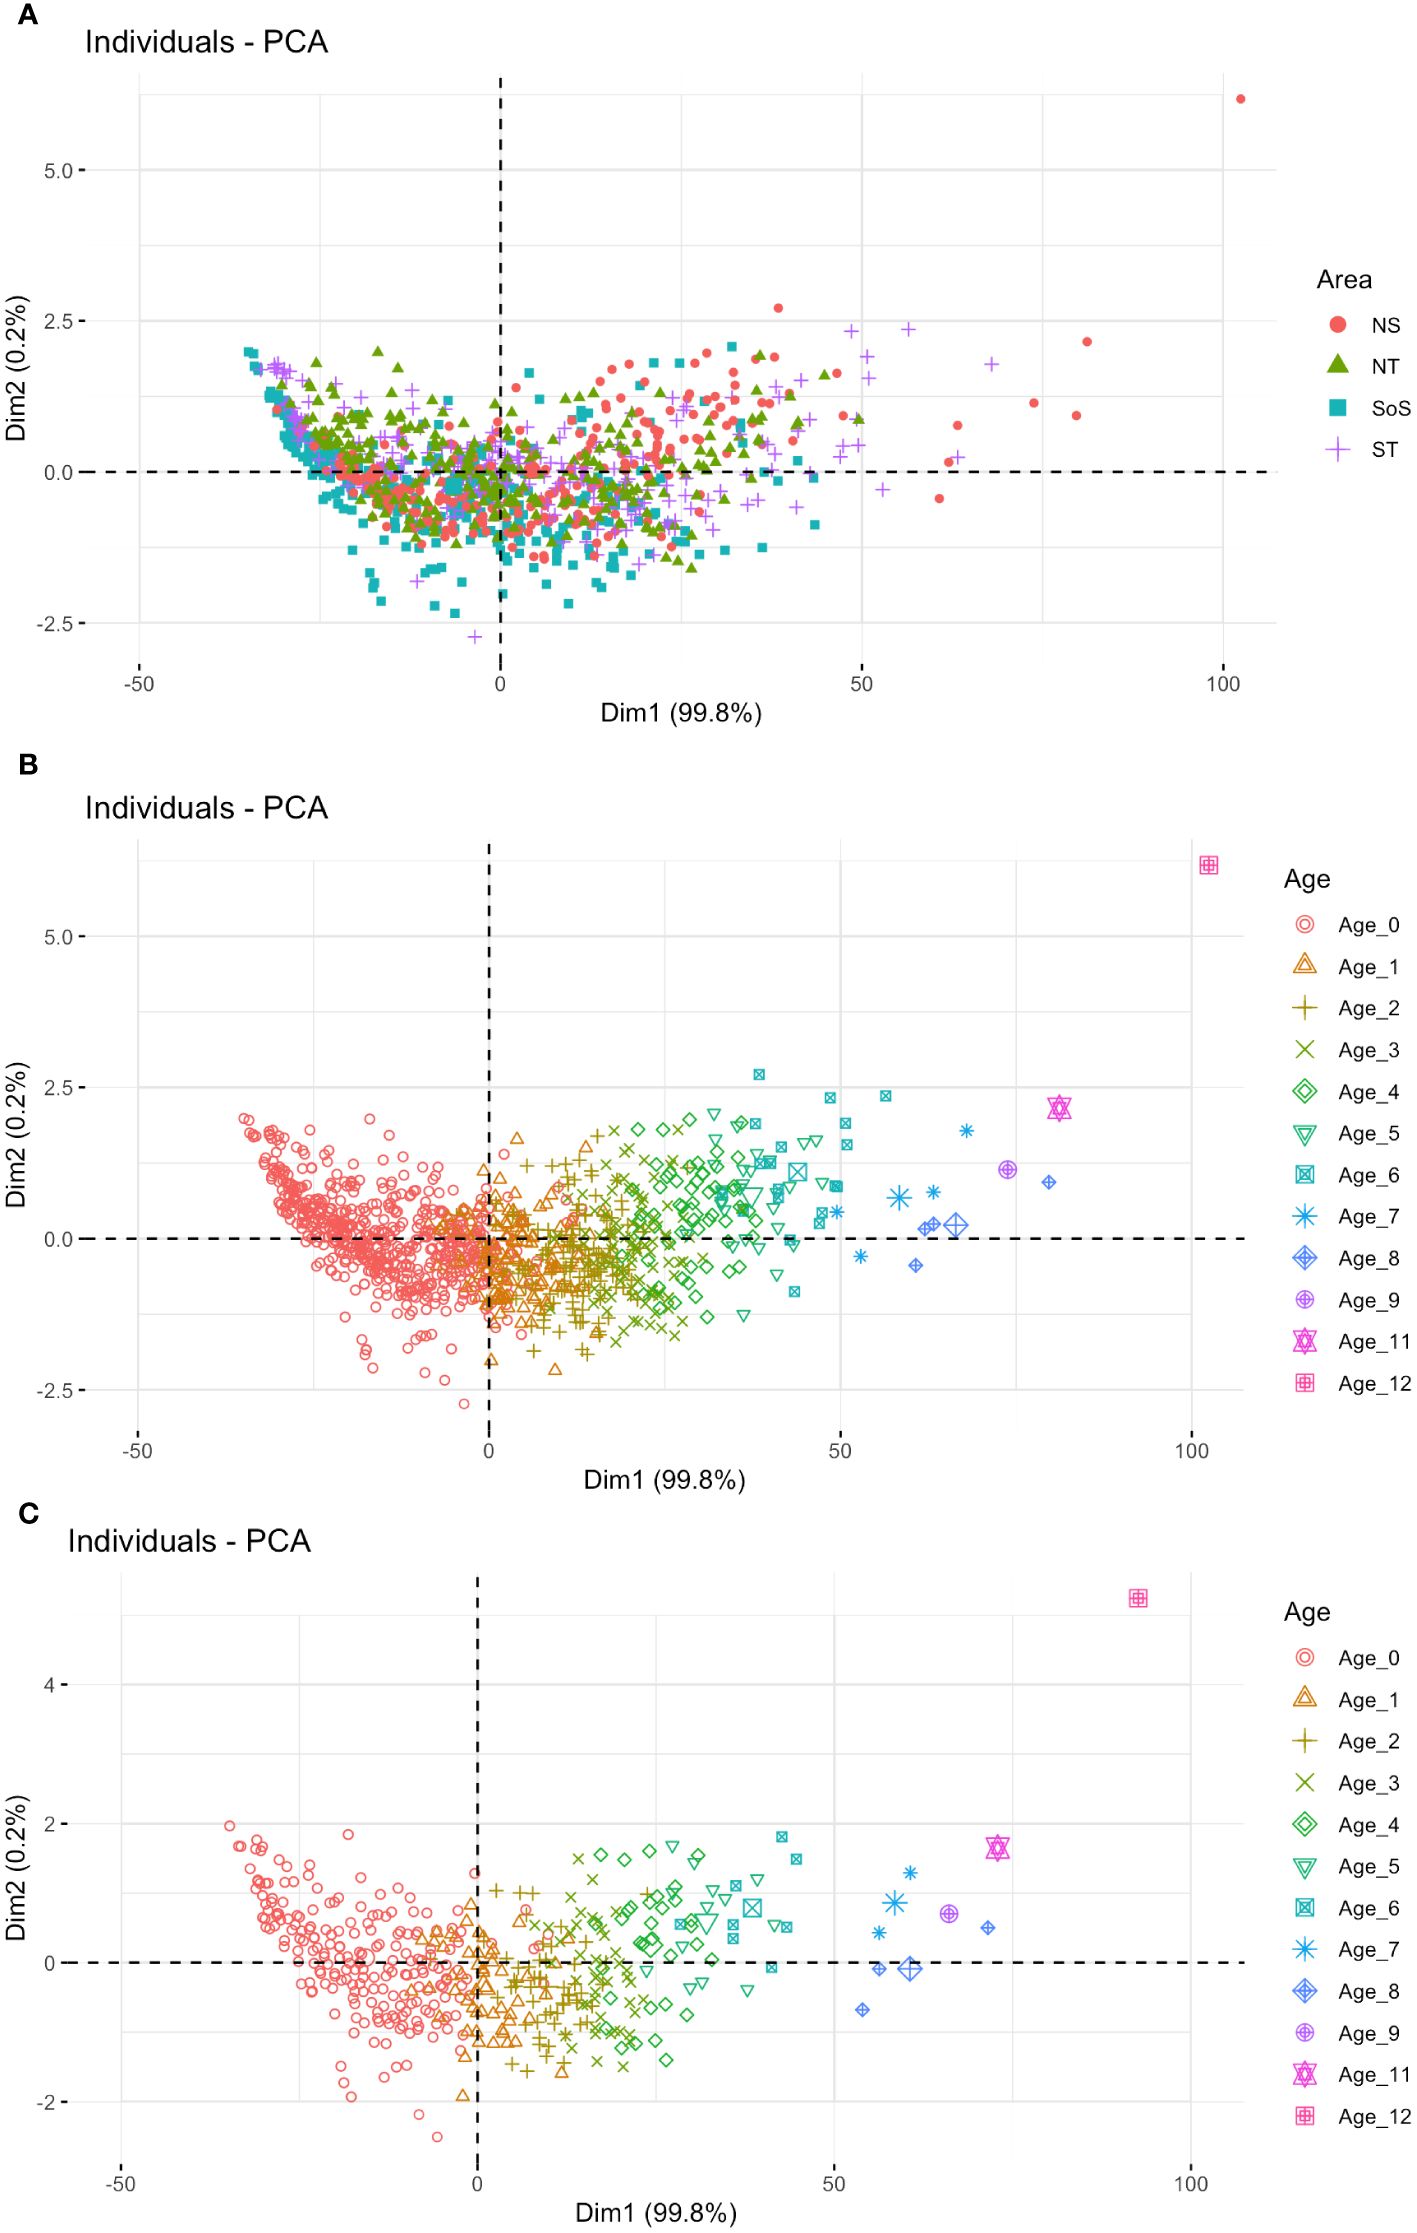
Figure 4. PCA of no preprocessed spectral data for all HOM otoliths coded by (A) region [Strait of Sicily (SoS), North of Sicily and Calabria (NS), south Tyrrhenian Sea (ST), and north Tyrrhenian Sea (NT)] and (B) age group (0–12). PCA carried out on the calibration model complete dataset (C).
The FT-NIRS age calibration models required 6–10 PCs (model rank) to maximize predictive power (Table 2), advising that spectral differences <4% of the total variance played a substantial role in successful age prediction.
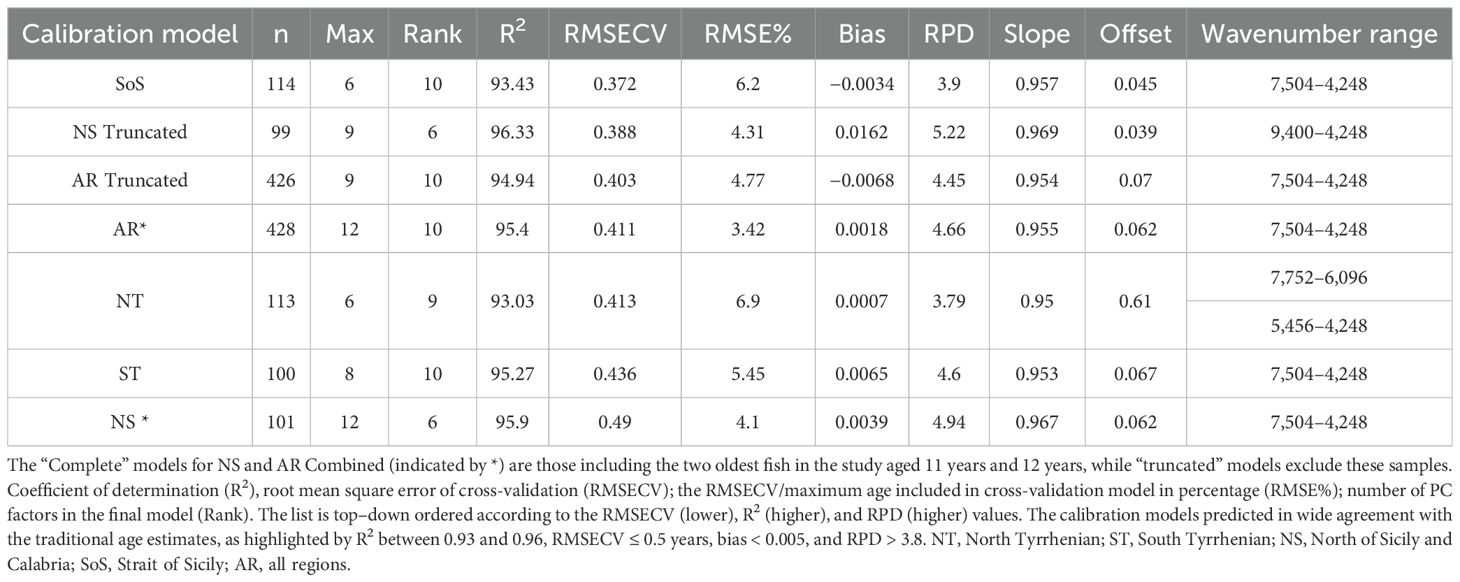
Table 2. Calibration model results for HOM FT-NIRS age prediction by region.
The calibration models predicted in wide agreement with the traditional age estimates, as highlighted by R2 between 0.93 and 0.96, RMSECV ≤ 0.5 years, bias < 0.005, and RPD > 3.8 (Table 2; Figure 5). Although some differences in prediction capability were apparent among regional calibrations, the all-region (AR) combined models generally performed better than the regional models with minimal bias and higher RPD scores. In addition, RMSE % for the AR model was lower than nearly all other calibrations, allowing to include a larger age range in the complete models.
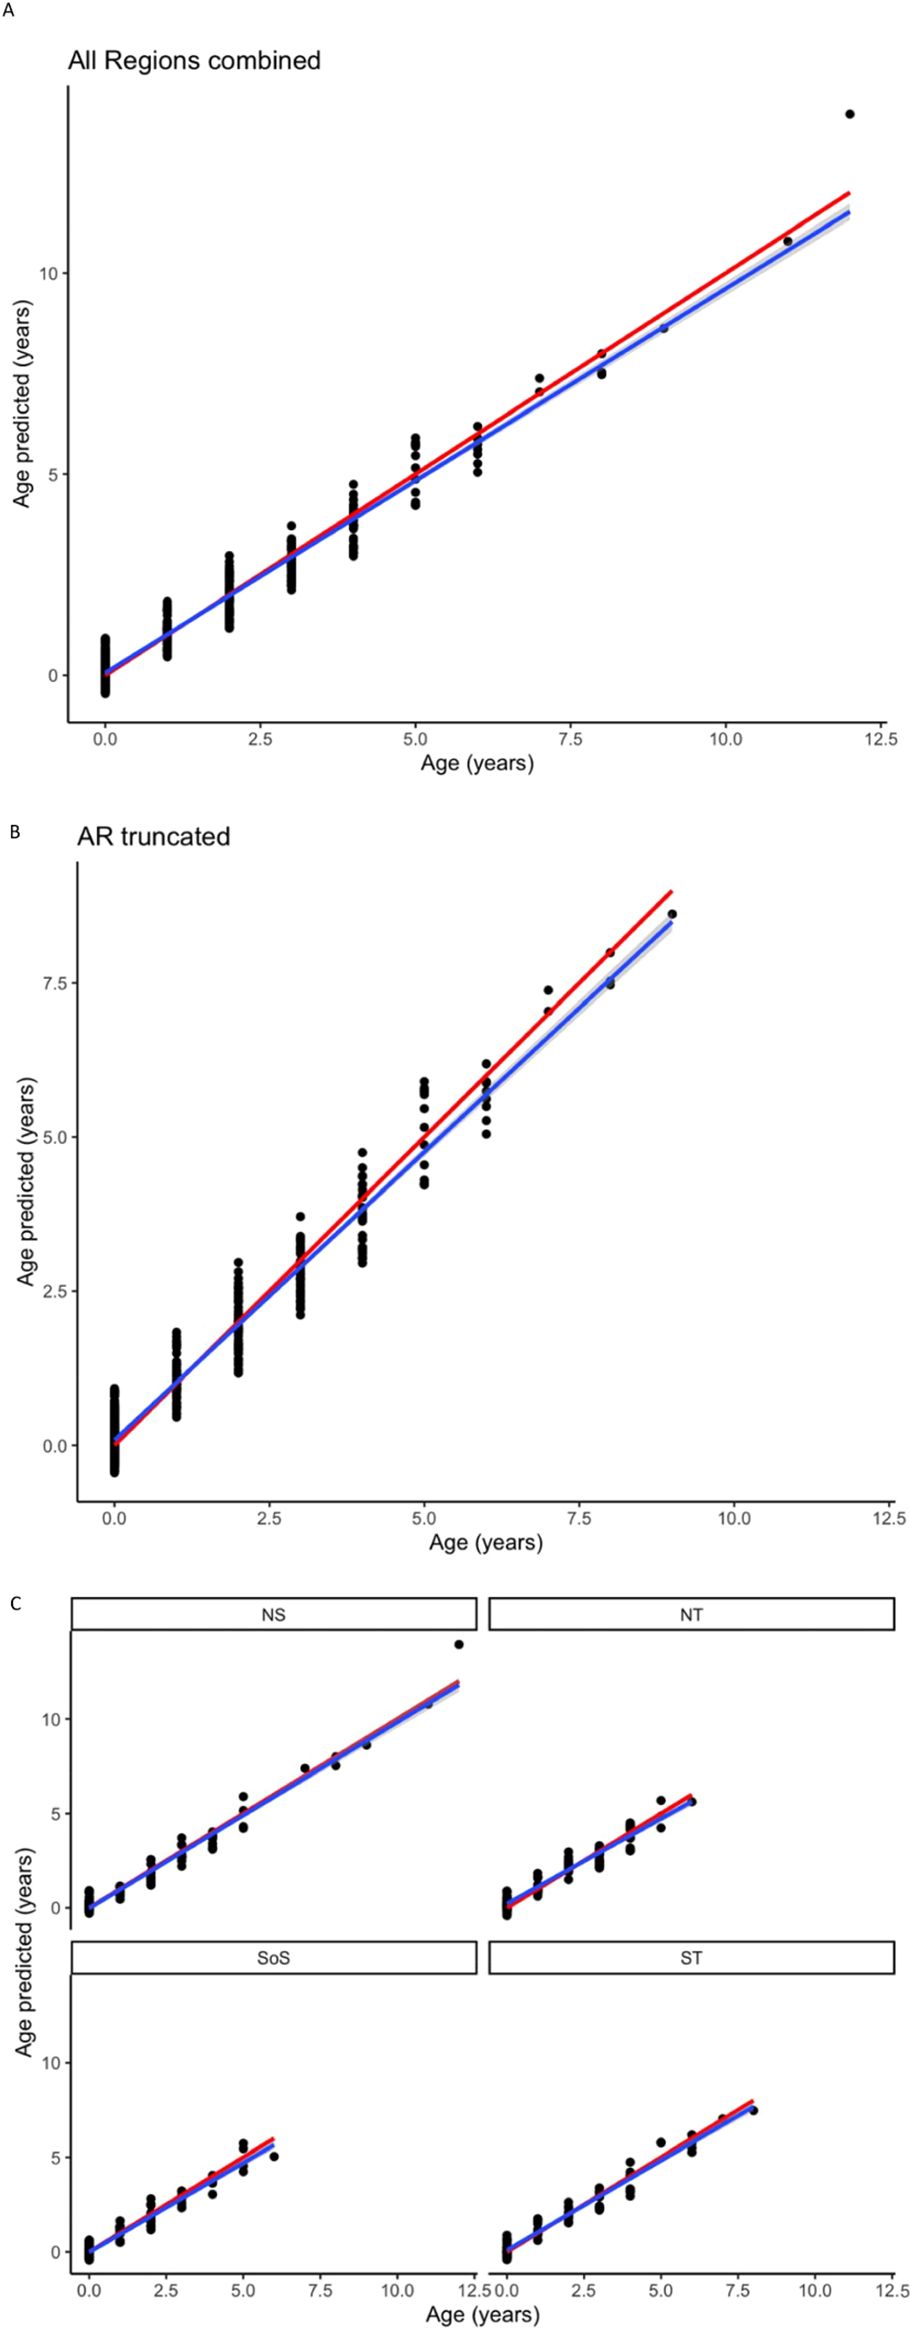
Figure 5. Linear regression plots of HOM FT-NIRS age calibration model predictions, for All regions complete (A), and without the older few specimens of 11 and 12 years old (B), as well as for each regional model (C): North Tyrrhenian (NT), South Tyrrhenian (ST), North of Sicily and Calabria (NS) and without the older few specimens of 11 and 12 years old (NS truncated), Strait of Sicily (SoS). Blue line is the linear regression with confidence limits (grey shadow), and red line represents the 1:1 ideal regression line.
Although there was negligible regional differentiation, full results from pairwise validation of regional test-set/calibration model combinations were obtained (Table 3). The combined test-set ages were well predicted by both AR models with R2 = 0.95, RMSEP ~ 0.5, and mean bias <0.03 years (Table 3). Since differences among regional models in prediction power were negligible, only results of the PLS regression between FT-NIRS and traditional ages for AR models are plotted (Figure 6). Mean FT-NIRS models appeared to underestimate at older ages (age>4 years).
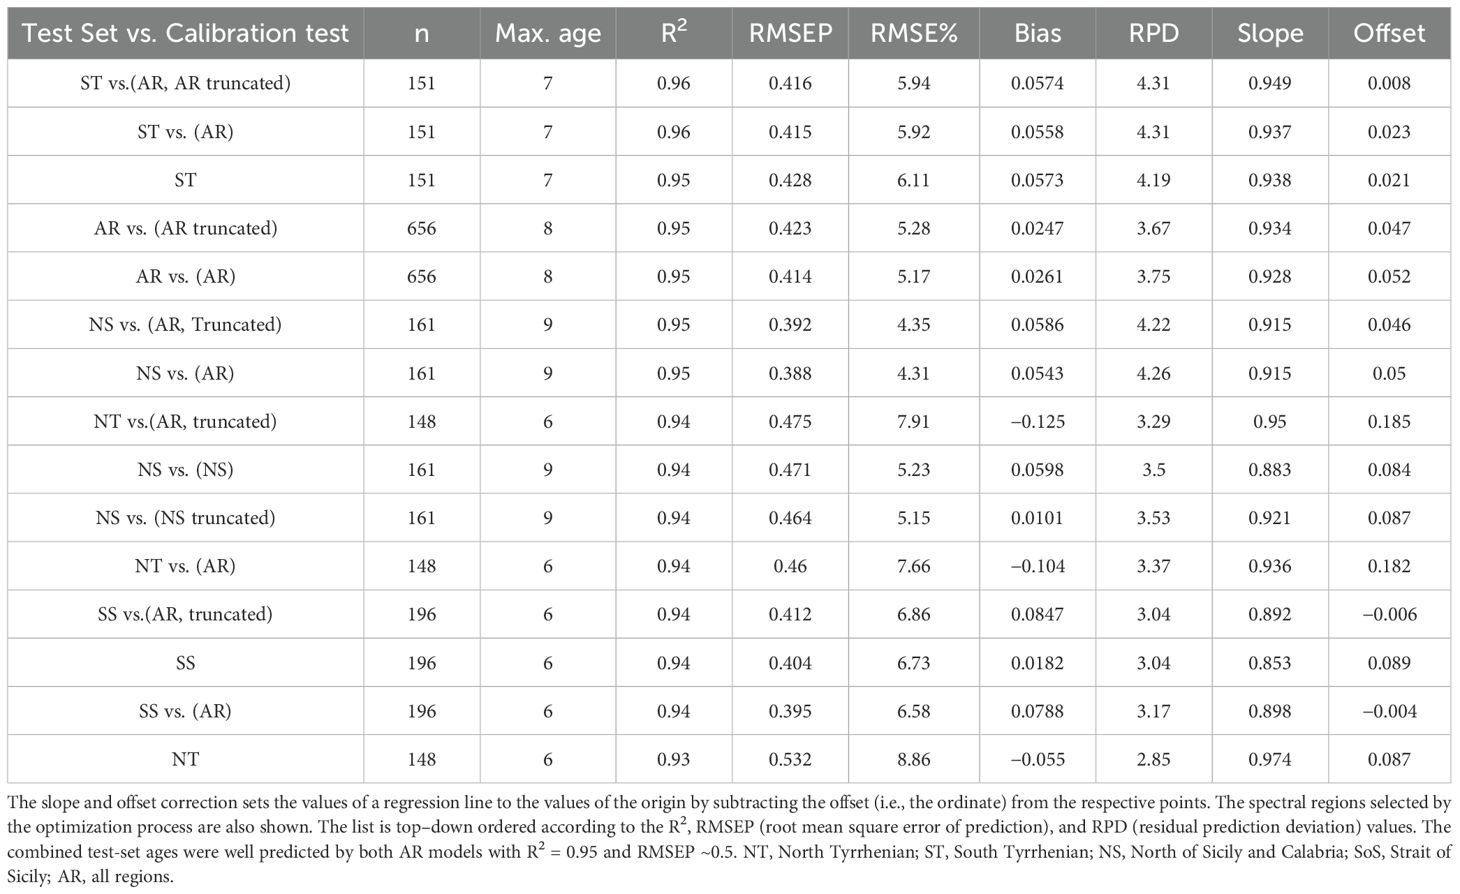
Table 3. Validation results for the age prediction of regional test sets of HOM otoliths relative to the corresponding calibration model used to test (in parentheses).
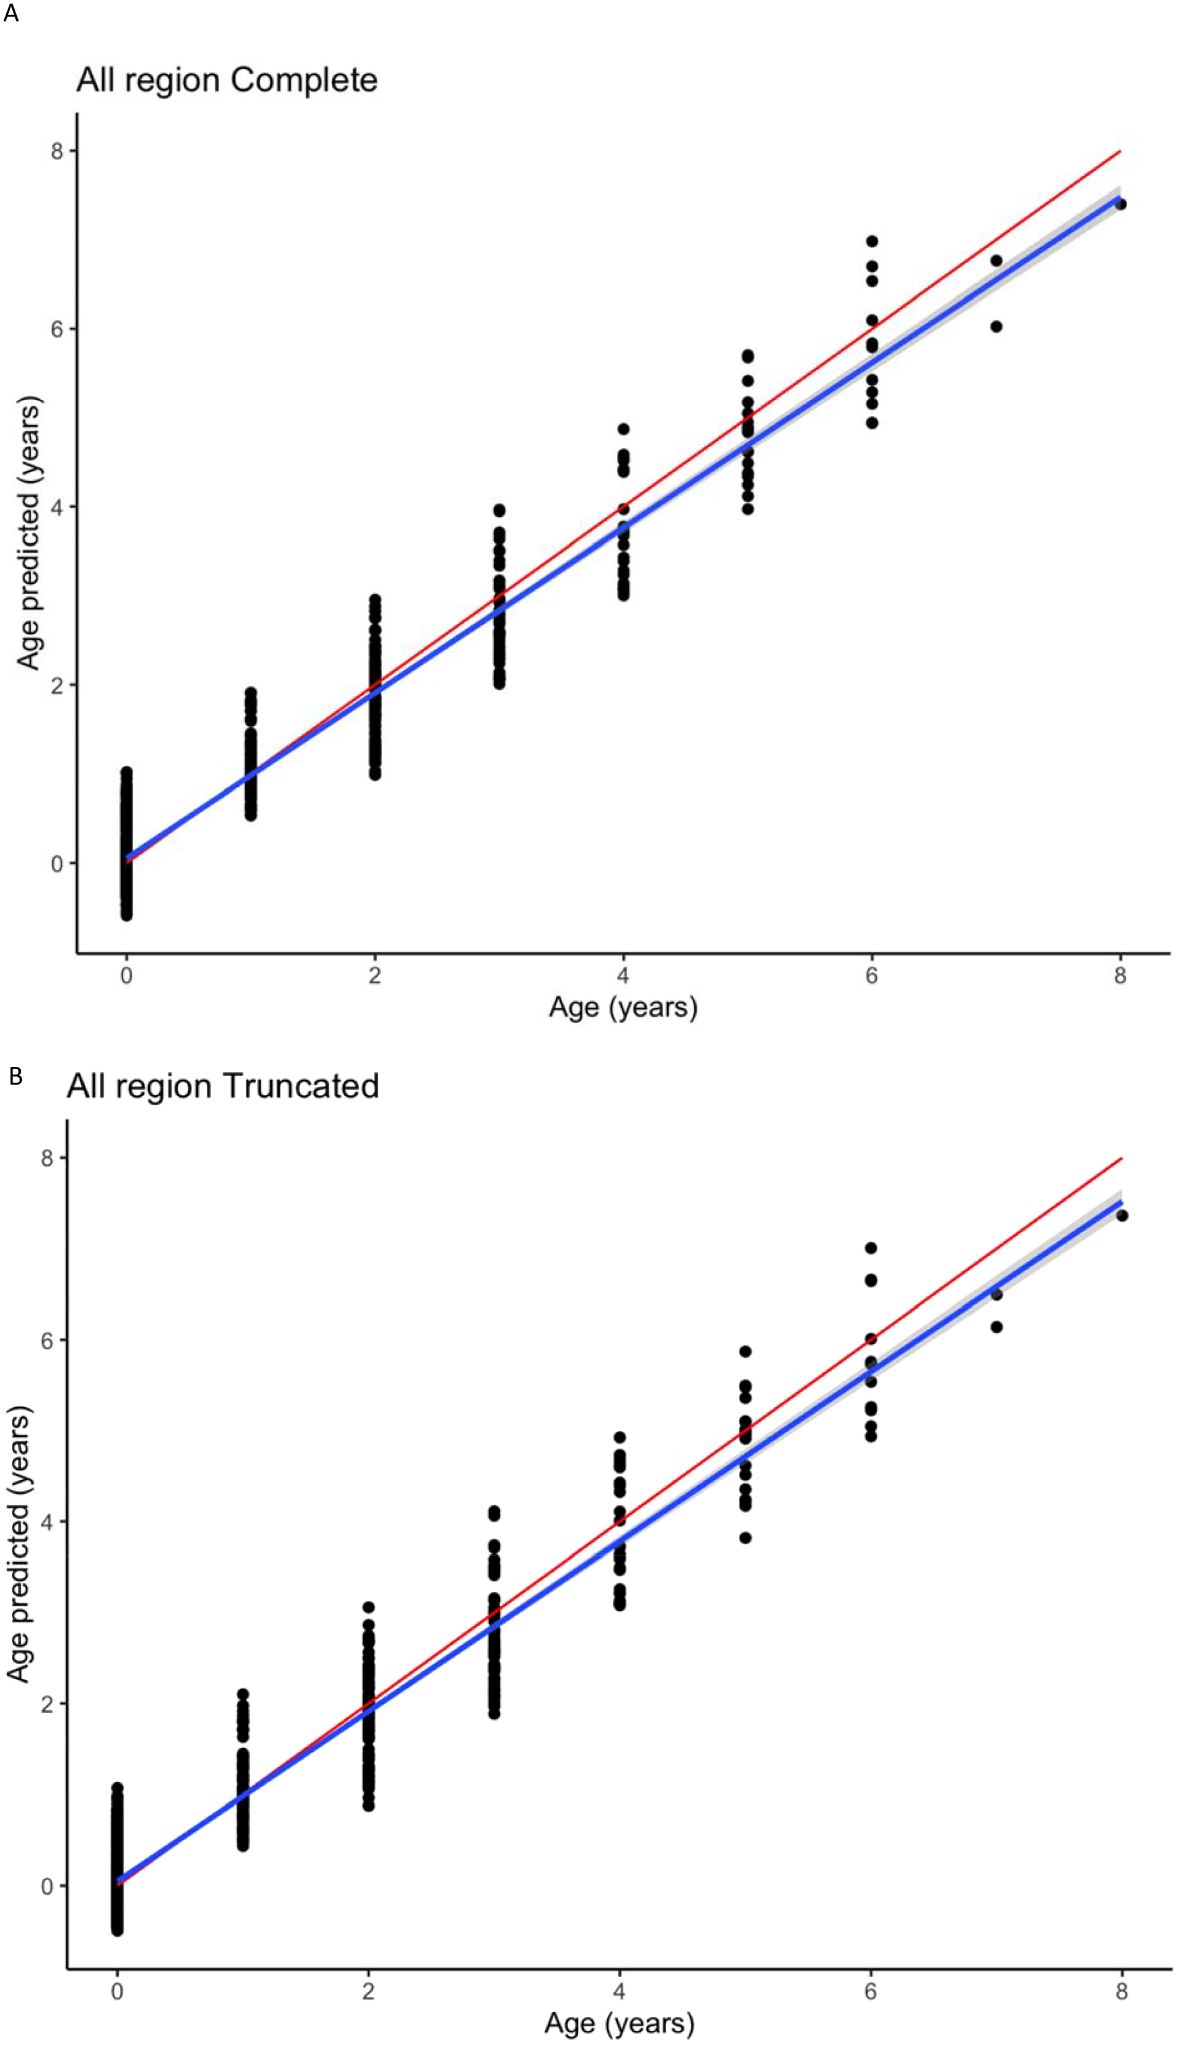
Figure 6. Plot of HOM FT-NIRS test-set results for the (A) AR truncated and (B) AR complete validations models.
The mean bias values (traditional vs. predicted age) were within ± 0.25 years across most age classes (0–6) and reached an underestimation of −0.5 years at age 7 and −1 year at age 8, as expected since there are few samples in these classes (Figure 7). The PA was 76.83% and 23.17% with ± 1 year of difference, while APE was 9.45 and the mean coefficient of variation (CV) was 14.01.
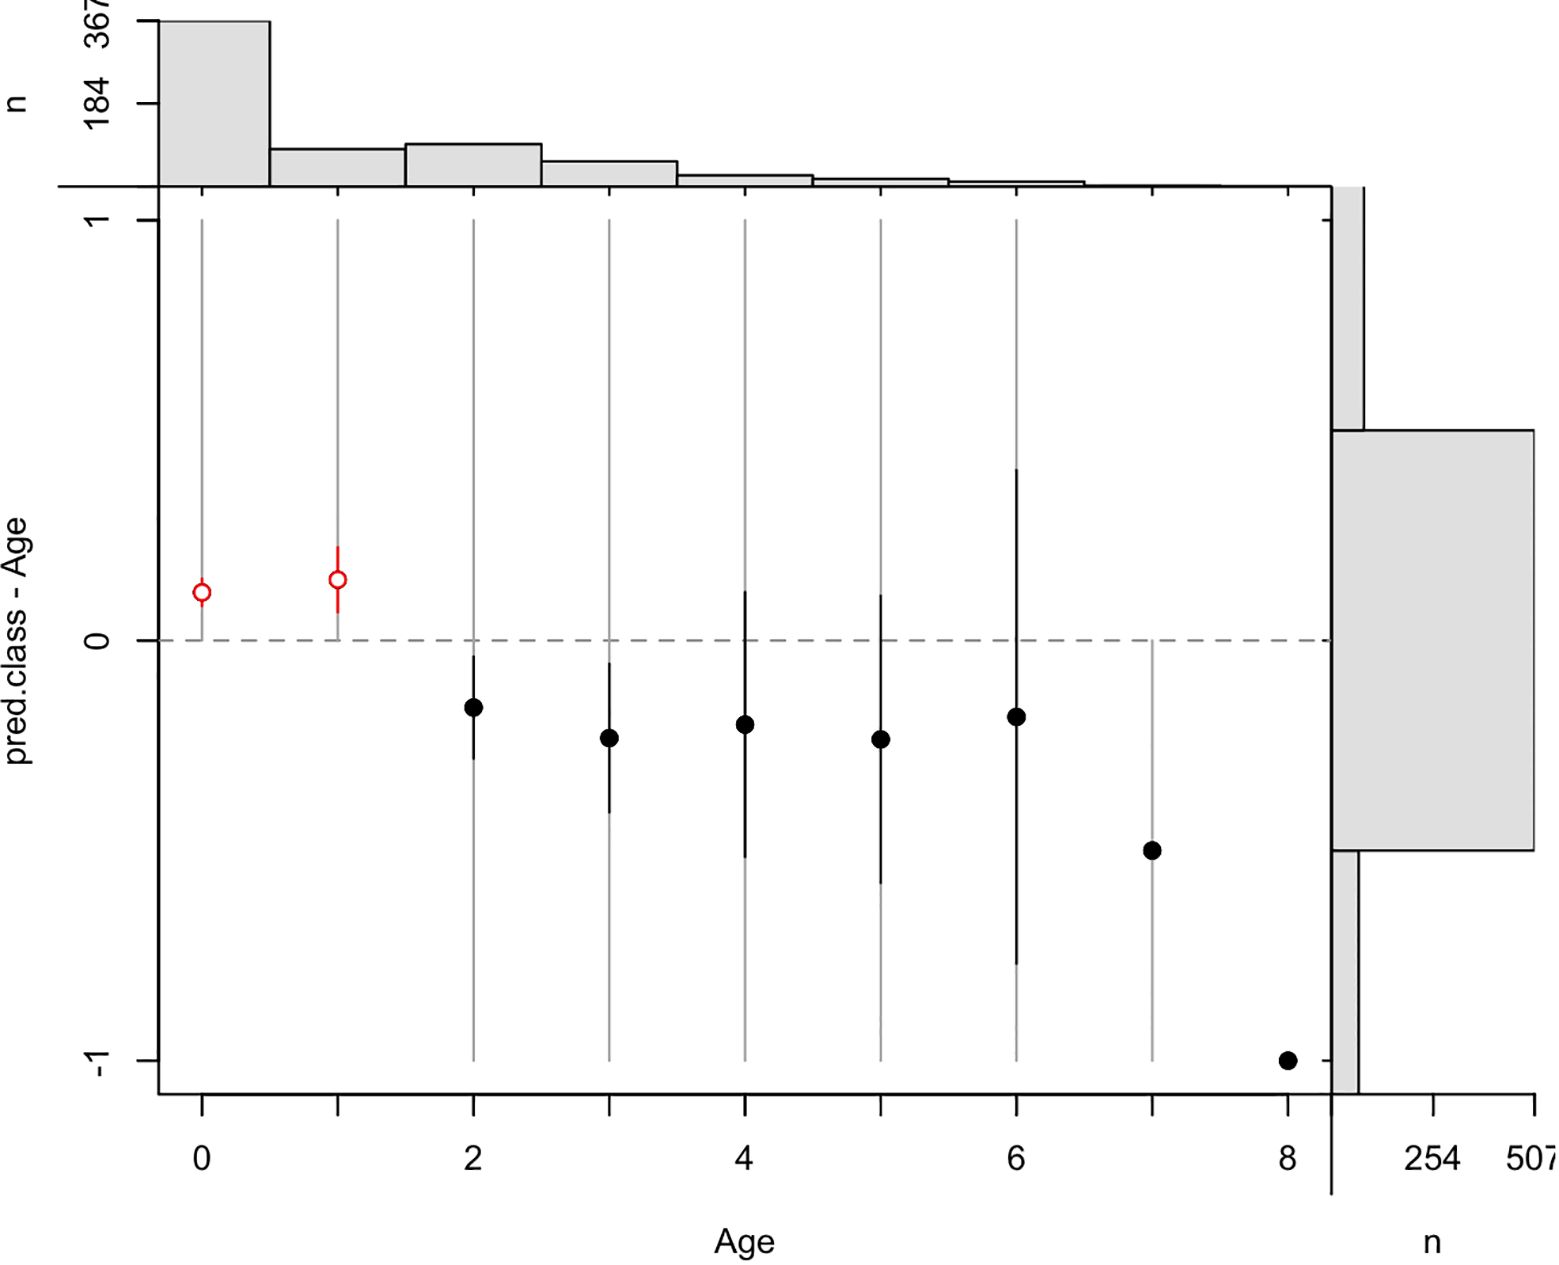
Figure 7. Plot of mean bias (circles) ± confidence intervals (red, positive; black, negative) and variability range (gray) for T. trachurus predicted and traditional ages for all test sets combined, as predicted by the AR combined truncated calibration model. Frequency distribution across age (top) and age class (right side) are also plotted.
Asymptotic two-sample Kolmogorov–Smirnov test, carried out on the combined test sets for each calibration model (AR and AR truncated), showed that the differences between the two age distributions (Traditional and FT-NIRS) were not significant for both models (D = 0.0631, p-value = 0.36 and D = 0.0634, p-value = 0.36, respectively).
The PCA loadings, obtained by the regional calibration models, indicated that the wavenumbers from 7,500 to 4,100 cm−1 had the largest contributions to spectral variance in most regional models, except the NS, which selected a wider region (Figure 8). The loadings plot showed that the overall range of loadings (and thus the areas of the light spectrum with highest importance to the model) are similar among areas, although the NT prediction model selected two distinct spectral regions (Figure 8).
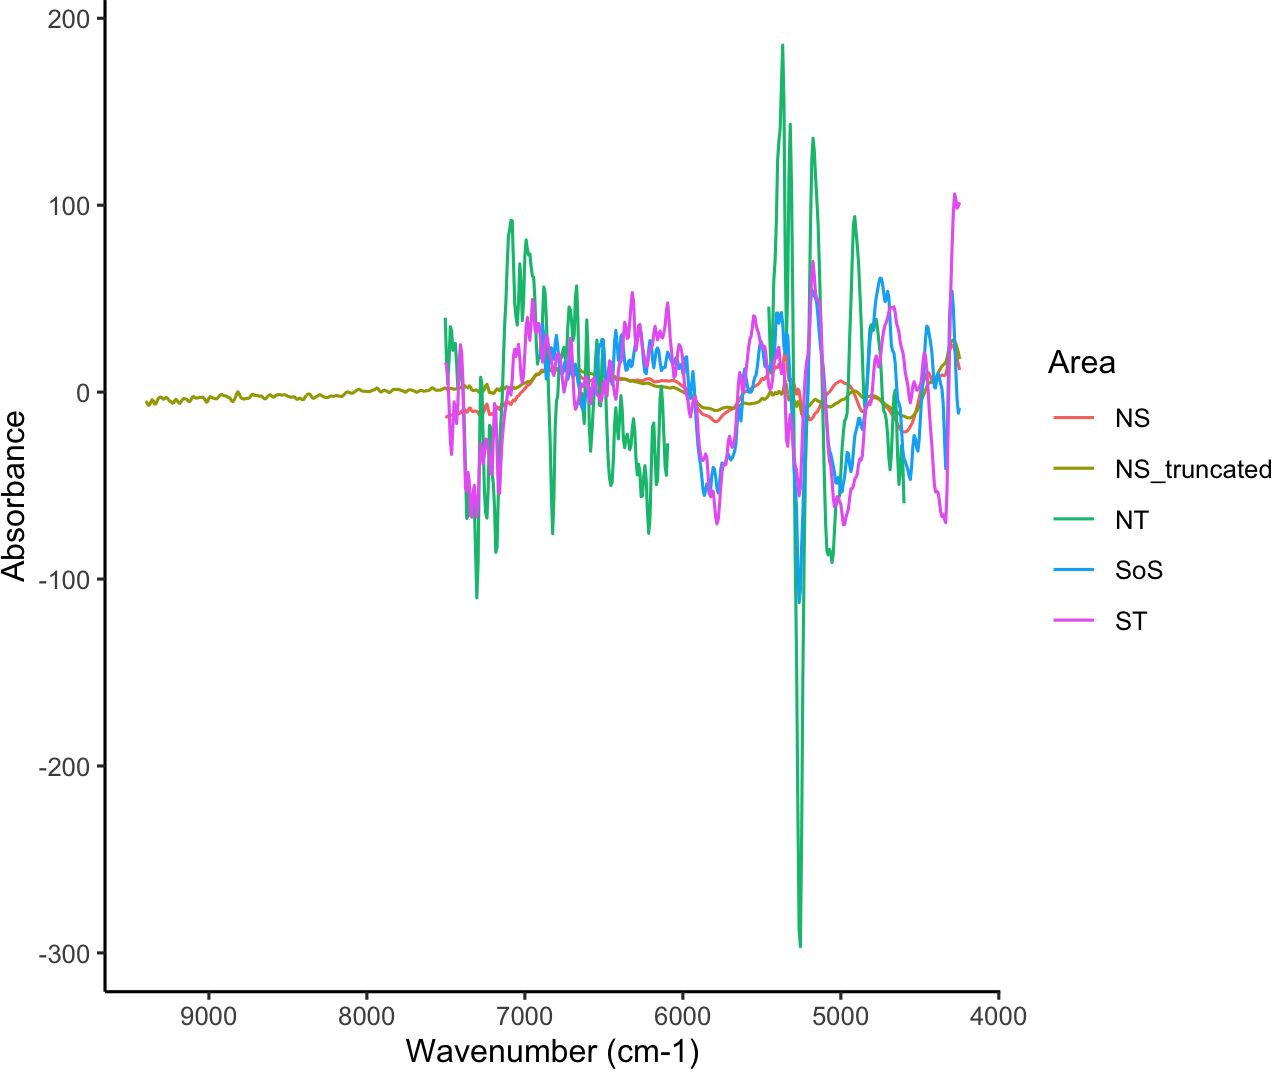
Figure 8. Loadings plot of regression coefficients for each regional age calibration model: North Tyrrhenian (NT), South Tyrrhenian (ST), North of Sicily and Calabria (NS), and Strait of Sicily (SoS).
Discussions
The main cause of age determination error has been identified for HOM in the otolith preparation techniques (whole/slice); several difficulties in age determination were thus raised by the correct identification of the first growth annulus, the presence of many false rings (mainly in the first and second annuli), and the interpretation and identification of the edge characteristics (ICES, 2018). So many problems increase the uncertainty in the age determination, widening the discrepancy among readers and becoming a big problem especially when age structure models are used for stock assessment of these resources. The results here obtained from spectral analysis clearly showed the usefulness of FT-NIRS for the HOM age determination from whole otoliths, valid at least over the age range observed in the present study (0–12 years). Moreover, since especially for older specimens (age > 4 years), an overlapping of rings has been observed (ICES, 2018), the FT-NIRS may increase the accuracy of readings for older fishes.
The obtained calibration models showed high predictive power, although some underestimation was detected in the test sets as the age increases (Figure 7). Most likely, such bias could be due to the very few individuals older than 6 years that were collected (Figure 6). Therefore, an improvement in these models could be achieved by incorporating more older fish. Bias on age assignment was lower if compared to the bias among readers of the traditional age data. The last international exchange results for whole otoliths of HOM in the age range of 0–12 showed values of PA from 52% to 62% (CV between 25 and 27) for experienced readers, and the agreement reached 70.6% (CV = 18.4) when comparing readers from the same laboratory (ICES, 2018). The present study results obtained higher PA (76.83%) and lower CV (14) between the two methods (i.e., FT-NIRS and traditional).
Differences in spectral regions, selected by the optimizing procedure for model selection process, and the differences in the absorbance among areas appeared negligible in the present study, although FT-NIRS demonstrated discriminating power in other species and areas (e.g., Benson et al., 2020). The absence of a relevant differentiation of otoliths among the study areas was expected, based on results of previous studies, which compared the HOM growth in the same regions, suggesting the existence of a unique stock (Basilone et al., 2023). The latter authors proposed that the migration exchanges among metapopulations inhabiting such areas contribute to reduce their differences, although the environments among the investigated regions varied. Such differences were detected only between the SoS age 0 class and the other areas, speculating on the possible existence of a preferred spawning area common to the whole stock with better conditions for juvenile growth (Basilone et al., 2023). However, from the present study results, such differences in otolith spectra were not advisable in the age 0 class and in older ages, since PCA analysis overlapped age 0 individuals coming from different regions (Figure 4).
For some test-set validations, age prediction improved when spatial variability and sample size of the calibration model increased and the AR truncated model optimized R2, RMSEP, and RPD in most test sets (Table 2). The ST regional model showed higher R2 values but lower RMSEP and higher bias than the following AR models, which encompasses a wider age range and spatial variability.
The prediction models obtained here showed similar statistics compared to previous FT-NIRS applications (Tables 1, 2), and the selected wavenumber region of spectrum during the optimizing process are similar to significant age predictive regions from previous studies (Tables 1, 2). These wavenumbers cover first overtones of N–H, O–H, and C–H bonds, stretching vibrations, and combinations (Rigby et al., 2015). Otolith prediction models generally relied on spectral regions between 7,600 and 4,100 cm−1, a reduced region relative to the entire spectrum interrogated (11,500–4,000 cm−1), with some model-specific variation in the importance of different signals occurring throughout that range (Table 1; Figure 8). For the HOM otoliths here analyzed, the raw spectra showed to be more informative than derivative or the other transformations carried out; in other studies, first and second derivatives were used successfully on other species area (see literature from Table 1). Indeed, implementing the FT-NIRS method for new species involves additional time considerations related to model creation and optimal selection of the calibration model based on the reference collections (Passerotti et al., 2020). Several problems as new users of this technique were addressed, mainly in acquiring the minimum chemometric knowledge for model generation and testing. Indeed, the OPUS™ software provided by the spectrometer factory was useful for routine operations and for setting up the calibration model, especially if there is a non-specialist involved in the work. Although other software, open sources are available to easily process the data obtained by the FT-NIRS, the integrated software may speed up the whole procedure. Therefore, once the calibration model is defined and validated by opportune testing and PCA analyses, the OPUS™ software may be used alone to predict ages of new samples or even in case of re-evaluated models on a rolling basis as new years of otolith collections are added, making the full range of spectral variability possible and providing calibration data for model comparisons, as also observed in the literature (Passerotti et al., 2020).
Although some regional models showed reduced bias and good predictive performance (i.e., SoS and NS truncated), the combined models widening the otolith collection and spectra acquisition will enhance the power prediction of the model (Table 2). Indeed, careful consideration has to be devoted to unbalanced populations of young or older and the implication for the use of a single gear for fish sampling (Passerotti et al., 2020). Although the studies reported in Table 1, which relate FT-NIRS spectra to traditionally derived age estimates or counting of otolith or vertebral increments, have shown potential, there are limitations that prevent widespread diffusion of FT-NIRS. The unknown link between FT-NIR spectra and conventionally determined age is one potential obstacle. The otolith’s overall composition, which is affected by several parameters like growth rate, seasonal cycles, environmental stress, salinity, temperature, food availability, and reproductive stress, has been linked to this association (Radtke and Shafer, 1992; Tabouret et al., 2011). The ability of FT-NIRS spectroscopy to reasonably forecast age can be affected by the complex biological history of many fish species. Consequently, not all fish species may be suitable for FT-NIRS spectroscopy for otolith aging analysis. However, for greater applicability of FT-NIRS technology, new sources of variability (spatial and temporal) will need to be integrated into the model and explored to further improve and adapt the model to future variability in the environment and growth of fishes.
Data availability statement
The raw data supporting the conclusions of this article will be made available by the authors, without undue reservation.
Ethics statement
Research is not covered by any regulation and formal ethical approval is not required. The studied species is not protected by regulations or law and sampling area is not protected area or interested by fishery regulations or law.
Author contributions
GB: Conceptualization, Supervision, Writing – original draft, Writing – review & editing. GL: Data curation, Methodology, Software, Validation, Writing – review & editing. MF: Data curation, Methodology, Software, Writing – review & editing. AL: Data curation, Methodology, Software, Writing – review & editing. RF: Conceptualization, Investigation, Writing – review & editing. SA: Conceptualization, Validation, Writing – review & editing. SG: Conceptualization, Visualization, Writing – review & editing. GG: Data curation, Formal analysis, Writing – review & editing. IF: Data curation, Formal analysis, Writing – review & editing. AB: Funding acquisition, Validation, Visualization, Writing – original draft, Writing – review & editing.
Funding
The author(s) declare that no financial support was received for the research, authorship, and/or publication of this article.
Acknowledgments
The authors would like to thank technicians from CNR-IAS and the people involved in the research program “MEDiterranean International Acoustic Survey,” which allowed the sampling at sea GSA 16, 9, and 10.
Conflict of interest
Author AL was employed by the company Bruker Italia Unipersonale Srl.
The remaining authors declare that the research was conducted in the absence of any commercial or financial relationships that could be construed as a potential conflict of interest.
The author(s) declared that they were an editorial board member of Frontiers, at the time of submission. This had no impact on the peer review process and the final decision.
Publisher’s note
All claims expressed in this article are solely those of the authors and do not necessarily represent those of their affiliated organizations, or those of the publisher, the editors and the reviewers. Any product that may be evaluated in this article, or claim that may be made by its manufacturer, is not guaranteed or endorsed by the publisher.
References
Abaunza P., Gordo L., Karlou-Riga C., Murta A., Zimmermann C., Hammer C., et al. (2003). Growth and reproduction of horse mackerel, Trachurus trachurus (carangidae). Rev. Fish Biol. Fish. 13, 27–61. doi: 10.1023/A:1026334532390
Abaunza P., Gordo L. S., García Santamaría M. T., Iversen S. A., Murta A. G., Gallo E. (2008). Life history parameters as basis for the initial recognition of stock management units in horse mackerel (Trachurus trachurus). Fish. Res. 89 (2), 167–180. doi: 10.1016/j.fishres.2007.09.021
Arrington M. B., Helser T. E., Benson I. M., Essington T. E., Matta M. E., Punt A. E. (2021). Rapid age estimation of longnose skate (Raja rhina) vertebrae using near-infrared spectroscopy. Mar. Freshw. Res. 73, 71–80. doi: 10.1071/MF21054
Basilone G., Ferreri R., Aronica S., Bonanno A., Genovese S., Rumolo S., et al. (2023). Growth variability in Atlantic horse mackerel Trachurus trachurus (Linneus 1758) across the central Mediterranean Sea: contrasting latitudinal gradient and different ecosystems. Front. Mar. Sci.,Sec. Mar. Fisheries 10. doi: 10.3389/fmars.2023.1161552
Beamish R. J., Fournier D. A. (1981). A method for comparing the precision of a set of age determinations. Can. J. Fisheries Aquat. Sci. 38, 982–983. doi: 10.1139/f81-132
Benson I., Barnett B., Helser T. E. (2020). Classification of fish species from different ecosystems using the near infrared diffuse reflectance spectra of otoliths. J. Near Infrared Spectrosc. 28, 224–235. doi: 10.1177/0967033520935999
Bertrand A., Barbieri M. A., Gerlotto F., Leiva F., Córdova J. (2006). Determinism and plasticity of fish schooling behaviour as exemplified by the South Pacific jack mackerel Trachurus murphyi. Mar. Ecol. Prog. Ser. 311, 145–156. doi: 10.3354/meps311145
Bonanno A., Barra M., Basilone G., Genovese S., Rumolo P., Goncharov S., et al. (2016). Environmental processes driving anchovy and sardine distribution in a highly variable environment: the role of the coastal structure and riverine input. Fish. Oceanogr. 25, 471–490. doi: 10.1111/fog.12166
Bonanno A., Placenti F., Basilone G., Mifsud R., Genovese S., Patti B., et al. (2014). Variability of water mass properties in the strait of Sicily in summer period of 1998–2013. Ocean Sci. 10, 759–770. doi: 10.5194/os-10-759-2014
Chen J., Wang X. Z. (2001). A new approach to near-infrared spectral data analysis using independent component analysis. J. Chem. Inf. Comput. Sci. 41, 992–1001. doi: 10.1021/ci0004053
Conzen J. P. (2014). Multivariate Calibration. A practical guide for developing methods in the quantitative analytical chemistry. 3rd English edition Ed. (Ettlingen, Germany: Bruker Optik GmbH).
Couture J. J., Singh A., Rubert-Nason K. F., Serbin S. P., Lindroth R. L., Townsend P. A. (2016). Spectroscopic determination of ecologically relevant plant metabolites. Methods Ecol. Evol. 7, 1402–1412. doi: 10.1111/2041-210X.12596
D’Elia M., Patti B., Bonanno A., Fontana I., Giacalone G., Basilone G. (2014). Analysis of backscatter properties and application of classification procedures for the identification of small pelagic fish species in the central Mediterranean. Fish. Res. 149, 33–42. doi: 10.1016/j.fishres.2013.08.006
FAO. (2018). The State of World Fisheries and Aquaculture 2018 - Meeting the sustainable development goals (Rome: FAO), 227 pp.
Healy J., Helser T. E., Benson I. M., Tornabene L. (2021). Aging Pacific cod (Gadus macrocephalus) from otoliths using Fourier-transformed near-infrared spectroscopy. Ecosphere 12, e03697. doi: 10.1002/ecs2.3697
Helser T., Benson I., Erickson J., Healy J., Kastell C., Short J. (2018). A transformative approach to ageing fish otoliths using Fourier transform-near infrared spectroscopy (NIRS): a case study of eastern Bering Sea walleye pollock (Gadus chalcogrammus). Can. J. Fisheries Aquat. Sci. 76. doi: 10.1139/cjfas-2018-0112
Helser T. E., Benson I. M., Barnett B. K. (2019). Proceedings of the research workshop on the rapid estimation of fish age using Fourier Transform Near Infrared Spectroscopy (FT-NIRS) (7600 Sand Point Way NE, Seattle WA 98115: Alaska Fisheries Science Center Publications | NOAA Fisheries).
ICES. (2018). Report of the Workshop on Age reading of Horse Mackerel, Mediterranean Horse Mackerel and Blue Jack Mackerel (Trachurus trachurus, T. mediterraneus and T. picturatus) (WKARHOM3), 5–9 November 2018. Livorno, Italy (Copenhagen (Denmark: ICES Scientific Reports), 186pp. doi: 10.17895/ICES.PUB.8170
ICES (2023). Workshop 3 on age estimation of European anchovy (Engraulis encrasicolus) (WKARA3); outputs from 2021 meeting). ICES Sci. Rep. 5, 59. doi: 10.17895/ices.pub.22725719
Iglesias M., Carrera P., Muiño R. (2003). Spatio-temporal patterns and morphological characterisation of multispecies pelagic fish schools in the north-Western Mediterranean Sea. Aquat. Living Resour. 16, 541–548. doi: 10.1016/j.aquliv.2003.07.003
Macer C. T. (1977). Some aspects of the biology of the horse mackerel [Trachurus trachurus (L.)] in waters around Britain. J. Fish Biol. 10 (1), 51–62. doi: 10.1111/j.1095-8649.1977.tb04041.x
Milisenda G., Garofalo G., Fezzani S., Rjeibi O., Othman J., Chemmam B., et al. (2018). Erratum to: biomass HotSpot distribution model and spatial interaction of two exploited species of horse mackerel in the south-central Mediterranean Sea. Hydrobiologia 821, 135–150. doi: 10.1007/s10750-017-3336-7
Murray I., Williams P. (1987). “Chemical principles of near-infrared technology,” in Near Infrared Technology in the Agricultural and Food Industries. Eds. Williams P., Norris K. (American Association of Cereal Chemists, St. Paul, MN), 29–31.
Ogle D. H. (2016). Introductory Fisheries Analyses with R (Boca Raton, FL: Chapman & Hall/CRC). Available at: https://github.com/fishR-Core-Team/FSA.
Passerotti M. S., Helser T. E., Benson I. M., Barnett B. K., Ballenger J. C., Bubley W. J., et al. (2020). Age estimation of red snapper (Lutjanus campechanus) using FT-NIR spectroscopy: feasibility of application to production ageing for management. ICES J. Marines Sci. 77, 2144–2156. doi: 10.1093/icesjms/fsaa131
R Core Team. (2023). R: A Language and Environment for Statistical Computing. R Foundation for Statistical Computing, Vienna, Austria. Available at: https://www.R-project.org/.
Radtke R. L., Shafer D. J. (1992). Environmental sensitivity of fish otolith microchemistry. Aust. J. Mar. Freshw. Res. 43, 935–951. doi: 10.1071/MF9920935
Regulation (EU) (2017). 1004 of the European Parliament and of the Council of 17 May 2017 on the establishment of a Union framework for the collection, management and use of data in the fisheries sector and support for scientific advice regarding the common fisheries policy and repealing Council Regulation (EC) No 199/2008 (recast). Official Journal of the European Union L 157, 20 June 2017, pp. 1–21.
Rigby C. L., Wedding B. B., Grauf S., Simpfendorfer C. A. (2014). The utility of near infrared spectroscopy for age estimation of deep water sharks. Deep Sea Res. Part I 94, 184–194. doi: 10.1016/j.dsr.2014.09.004
Rigby C. L., Wedding B. B., Grauf S., Simpfendorfer C. A. (2015). Novel method for shark age estimation using near infrared spectroscopy. Mar. Freshw. Res. 67, 537–545. doi: 10.1071/MF15104
Robins J. B., Wedding B. B., Wright C., Grauf S., Fowler A., Saunders T., et al. (2015). Revolutionising Fish Ageing: using Near Infrared Spectroscopy to Age Fish (Brisbane (AUS): State of Queensland through Department of Agriculture and Fisheries).
Rumolo P., Basilone G., Fanelli E., Barra M., Calabrò M., Genovese S., et al. (2017). Linking spatial distribution and feeding behavior of Atlantic horse mackerel (Trachurus trachurus) in the Strait of Sicily (Central Mediterranean Sea). J. Sea Res. 121, 47–58. doi: 10.1016/j.seares.2017.01.002
Siesler H. W., Ozaki Y., Kawata S., Heise H. M. (2001). Near-Infrared Spectroscopy: Principles, Instruments, Applications Eds. WILEY-VCH Verlag GmbHD-69469 Weinheim (Germany). doi: 10.1002/9783527612666
Tabouret H., Lord C., Bareille G., Pecheyran C., Monti D., Keith P. (2011). Otolith microchemistry in Sicydium punctatum: indices of environmental condition changes after recruitment. Aquat. Living Resour. 24, 369–378. doi: 10.1051/alr/2011137
Vance C.K., Tolleson D.R., Kinoshita K., Rodriguez J., Foley W. J. (2016). Near Infrared Spectroscopy in Wildlife and Biodiversity. J. Near Infrared Spectrosc. 24, 1–25.
Wedding B. B., Forrest A. J., Wright C., Grauf S., Exley P., Poole S. E. (2014). A novel method for the age estimation of Saddle tail snapper (Lutjanus malabaricus) using Fourier Transform-near infrared (FT-NIR) spectroscopy. Mar. Freshw. Res. 65, 894–900. doi: 10.1071/MF13244
Williams P. (2008). Near-Infrared Technology-Getting the Best Out of Light. A Short Course in the Practical Implementation of Near-Infrared Spectroscopy for the User. A Short Course Held in Conjunction with the 13th ANISG Conference (Hamilton Centre, Victoria, Canada: Australian Near Infrared Spectroscopy Group. Department of Primary Industries).
Keywords: near-infrared spectroscopy, Trachurus trachurus, age determination, otolith, Mediterranean Sea
Citation: Basilone G, Lo Cicero G, Fortuna M, Luviner A, Ferreri R, Aronica S, Genovese S, Giacalone G, Fontana I and Bonanno A (2024) Fourier-transform near-infrared spectroscopy first application to age determination in European fish species: the case of the Atlantic horse mackerel from the central Mediterranean Sea. Front. Mar. Sci. 11:1429150. doi: 10.3389/fmars.2024.1429150
Received: 07 May 2024; Accepted: 23 July 2024;
Published: 14 August 2024.
Edited by:
John-Lewis Zinia Zaukuu, Kwame Nkrumah University of Science and Technology, GhanaReviewed by:
Eric Mensah, Kwame Nkrumah University of Science and Technology, GhanaVincent Abe-Inge, McGill University, Canada
Copyright © 2024 Basilone, Lo Cicero, Fortuna, Luviner, Ferreri, Aronica, Genovese, Giacalone, Fontana and Bonanno. This is an open-access article distributed under the terms of the Creative Commons Attribution License (CC BY). The use, distribution or reproduction in other forums is permitted, provided the original author(s) and the copyright owner(s) are credited and that the original publication in this journal is cited, in accordance with accepted academic practice. No use, distribution or reproduction is permitted which does not comply with these terms.
*Correspondence: Gualtiero Basilone, Z3VhbHRpZXJvLmJhc2lsb25lQGNuci5pdA==; Gabriella Lo Cicero, Z2FicmllbGxhLmxvY2ljZXJvQHVuaXBhLml0