 Hua Ge
 Lingling Zhu
 Bing Mao1,2
- 1Changjiang River Scientific Research Institute, Wuhan, China
- 2Key Laboratory of River and Lake Regulation and Flood Protection in the Middle and Lower Reaches of Changjiang River, Ministry of Water Resources, Wuhan, China
- 3Bureau of Hydrology, Changjiang Water Resources Commission, Wuhan, China
The non-uniform suspended sediment flowing into the Yangtze River Estuary (YRE) has a substantial impact on riverbed evolution and the ecological environment. Conducting a numerical simulation can provide missing measurement data and act as an important support for river management. In this study, we developed a formula for determining the non-uniform suspended sediment-carrying capacity (SCC) based on the statistical theory of sediment transport. The formula was applied to a river network model domaining the tidal section of the lower reaches of the Yangtze River (LYR) to simulate the non-uniform suspended sediment flowing into the YRE. The verification results showed that the model accurately simulated fine-grained sediments with a high measurement accuracy. The simulation results for coarse-grained sediments were consistent with riverbed evolution that manifests as erosion. Owing to the sediment transport complexity in natural rivers, we propose a method for optimizing calculations of the SCC that provides more accurate modeling results and can be adapted when the observational measurement accuracy is improved in the future. These findings provide support for simulations and measurements of non-uniform suspended sediment transported in the LYR.
1 Introduction
Non-uniform suspended sediment flowing into an estuary is the material basis that shapes the estuarine delta, and it carries various chemical substances (such as heavy metals, nitrogen, and phosphorus) that affect the water environment in estuaries and nearshore areas. Affected by climate change and human activities, the estuarine deltas of many large rivers worldwide have experienced erosion and retreat because of reduced inflow of sediment from rivers (Li et al., 2017a) such as the Yellow River (Chen et al., 2019), Colorado River (Carriquiry et al., 2001), Mississippi River (Coleman et al., 1998), Nile River (Frihy et al., 2003), and Danube River (Panin and Jipa, 2002). When there is a sharp decrease in incoming sediment, shoals in estuaries undergo prominent migration changes (Mei et al., 2018). In addition, Murray et al. (2019) found that 16.02% of tidal flats were lost between 1984 and 2016 owing to reduced sediment delivery from major rivers, and this was accompanied by increased coastal erosion and sea-level rises in East Asia, the Middle East, and North America. Such changes are causing a series of social, economic, and environmental problems in local regions. Therefore, it is important to investigate the non-uniform sediment flowing into estuaries and oceans.
These effects are particularly prominent in the Yangtze River Estuary (YRE), the largest economic zone in China. In the last half-century, sedimentation of the YRE has mainly originated from the upstream tributaries of the Yangtze River (Sun et al., 2016). With the successive use of cascade reservoirs, represented by the Three Gorges Reservoir (TGR), sediment from the upper reaches is intercepted by dams, and this has substantially reduced the amount of sediment flowing into the YRE, which has led to a synchronous decrease in the suspended sediment concentration (SSC) of 67% and 69% during rising and falling tides, respectively (Jiao et al., 2021). However, the decreasing SSC pattern corresponding to reduced sediment input differs in the lower reaches of the Yangtze River (LYR); the impact of sediment reduction has a greater impact on the SSC in the upper YRE (Liu et al., 2012), and it decreases along the river channel, as revealed by local 2D mathematical models (Wang et al., 2023). The decrease in SSC has caused a series of changes in the riverbed, intensifying the erosion of river channels and deltas (Yang et al., 2011) and controlling the evolution of mudflats (Du et al., 2013). For example, accumulative erosion with an annual average riverbed lowering volume of 0.71×10⁸ m3 in the tidal river sections was triggered from 2001 to 2021 (Yang et al., 2024), directly affecting the LYR and delta region (Zhao et al., 2017). The stability of the shoal in the YRE has been reduced, and some sand bodies have disappeared since 2009, with a decreased area of 45 km2 within an elevation range of -2 m and -5 m (Wei et al., 2017), leading to net erosion of the estuarine area (Yang et al., 2023b). It is even closely related to the occurrence and acceleration of coastal erosion (Deng et al., 2017). Furthermore, the decreased SSC and the eroded riverbed lead to changes in the sediment particle size, which conversely impact riverbed evolution by affecting flocculation (Luo et al., 2012) and changing the grading of mudflat sedimentation in the YRE (Yang et al., 2016; Chen et al., 2021). In addition, since the non-uniform grain sizes have a significant impact on flow resistance (Gladkov et al., 2021), bedload transport rates (Houssais and Lajeunesse, 2012; Deal et al., 2023), and sediment settling velocity (Jing et al., 2024), studying the non-uniformity of sediment entering the sea is of great significance for evaluating the evolution of tidal river sections.
In addition to its impact on riverbed evolution, the reduced amount of sediment has a considerable impact on the aquatic environment. For example, incoming sediment amounts lower than 2.63×10⁸ t/y will trigger degradation of the intertidal wetlands at the delta (Yang et al., 2005) and a 70% decline will reduce saline intrusion (Zhu et al., 2023). Furthermore, during the riverbed erosion process caused by a reduction in sediment, the resuspension of sediment can lead to an abnormal increase in nutrients in the bottom layer of water (Wen et al., 2024). Following the sharp decline in the amount of sediment entering the YRE after 2006, a more suitable sedimentary environment for benthic organism development was formed (Cheng et al., 2023). During the transport of inorganic pollutants, the average Hg flux to the China Sea was reduced from 38 Mg/y in 2016 to 10 Mg/y in 2018 and 2021 due to the decreased sediment (Peng et al., 2023). In addition to the reduced volume, the non-uniformity of the sediment also affects the ecological environment. It has also been reported that the reduction in fine sediment particles during the flood season significantly reduces the risk of heavy metals in suspension, particularly for Pb and Cr (Zeng et al., 2023). The flocculation effect generated by finer sediment particles is closely related to the biogeochemical processes of the YRE (Chen et al., 2005), and it plays a crucial role in the biogeochemical cycles of aquatic environments, particularly in estuarine areas (Fan et al., 2023).
Overall, changes in the volume and uniformity of sediment have a significant impact on riverbed evolution and the ecological environment of the LYR. In the coming decades, with the intensification of human activities, the sediment flux flowing into the YRE will be further decreased, and this will strongly impact the coastal environment (Dai et al., 2007) and pose many challenges to the management of river deltas (Liu et al., 2014). As such, this requires urgent research attention (Yang et al., 2014), and investigating the non-uniform sediment flux flowing into the YRE is an important prerequisite for the management and protection of river channels and water environments in the LYR, particularly the YRE areas.
Many studies have investigated changes in the flux of sediments into the YRE, and the influence of the TGR has been evaluated. A comparative analysis of the sediment flowing into the sea before and after impoundment of the TGR has been conducted, the geomorphic evolution at outlets of the YRE has been discussed (Zhang, 2011; Du et al., 2012), and the influence of the TGR on sedimentary landforms of the LYR has been a key focus (Yang et al., 2015). Dai et al. (2016) suggested that water and soil loss along the Yangtze River, dam construction, and bank reinforcement were the main reasons for changes in SSC entering the sea, and Wang and Zhou (2018) analyzed the driving factors of the water-sediment relationship evolution at Datong hydrographic station. To date, research based on observational data analyses has mostly used data from the Datong hydrographic station to represent the sediment flux flowing into the YRE (Zhu et al., 2019; Zuo et al., 2022). However, Datong hydrographic station is located more than 600 km from the YRE. Due to strong sediment erosion (Xu et al., 2023), it is not possible to represent the sediment flux flowing into the YRE after experiencing a large amount of riverbed replenishment.
In addition to conducting data analyses, numerical and physical models, such as 2D models (Wang et al., 2024) and physical models (Zhang et al., 2009), of local estuarine areas have been developed. Some models, such as the 2D & 3D nested models (Kuang et al., 2013), 2D models (Kuang et al., 2014), and 3D models (Gu and Guo, 2020), have focused on deep-water channels in estuaries. Other 2D models have been used to consider viscous and non-viscous sediments (Hu et al., 2021). Furthermore, 2D and 3D models have been applied to reveal the role of impulsive river floods and density-driven flows in the morphological responses of the Yellow River Delta to the water-sediment regulation scheme (Wu et al., 2023). These local multidimensional models have made progress in determining the relationships between the evolution of estuarine areas and water and sediment conditions (Yu and Zhang, 2021). However, owing to computational cost limitations, it is difficult to apply 2D or 3D models to long-distance river sections. Therefore, the sediment flowing into the YRE cannot be effectively analyzed with respect to extensive riverbed erosion and replenishment along the river reach, and this is not monitored by continuous observation downstream of the Datong hydrographic station. Therefore, the 1D model has become a recommended related research method, and it has been widely applied to the Pearl River (Zhang et al., 2005; Li and Li, 2012) and reaches above Datong in the Yangtze River (Shi et al., 2005; Gong and Yang, 2009), with only a few applications in the LYR (Sun et al., 2007). Although in the context of the operation of cascade reservoirs the characteristics of non-uniform sediment transport have become increasingly complex, they have not been the focus of such models, and model improvement in this respect is required. Therefore, we developed a formula for calculating the non-uniform suspended sediment-carrying capacity (SCC) and established and verified a 1D river network model for non-uniform suspended sediment transport in the tidal section of the LYR. We anticipate that this will provide support for the analysis of non-uniform suspended sediment fluxing into the YRE and the management and protection of estuaries and coasts.
2 Model set up
2.1 Study area
Datong is the final hydrographic station to conduct year-round observations of the water level (Zf), flow discharge (Qf), SSC (S) and its grading before the Yangtze River enters the sea, and it is located approximately 624 km from the YRE. Therefore, the water and sediment fluxes of Datong cannot be considered representative of those flowing into the YRE. It was feasible to assume this prior to constructing the numerous cascade reservoirs in the upper reaches of the Yangtze River, as LYR evolution was essentially in an equilibrium state, and the SSC did not change significantly along the LYR. However, owing to the influence of cascade reservoirs and other human activities in recent decades, the amount of incoming sediment has decreased significantly, and the sediment supply in the LYR has increased. Therefore, sediment flux at Datong is no longer equivalent to that fluxing into the sea, not only in quantity but also with respect to grading.
Our model domain begins at Datong station and ends at the YRE, and its length is thus approximately 75% of the length of the LYR, as shown in Figure 1. There are multiple hydrographic stations in this region, and their continuous Zf and discontinuous Qf observation data provided support for verifying the hydrodynamic model. Nanjinge station conducts discontinuous SSC and grading experimental observations within a year, which provides support for verifying sediment dynamics. Xuliujing station monitors the total SSC using Optical Backscatter (OBS), but it does not include grading monitoring. Nevertheless, its monitoring data provided a reference for model validation. Information about each station is given in Table 1.
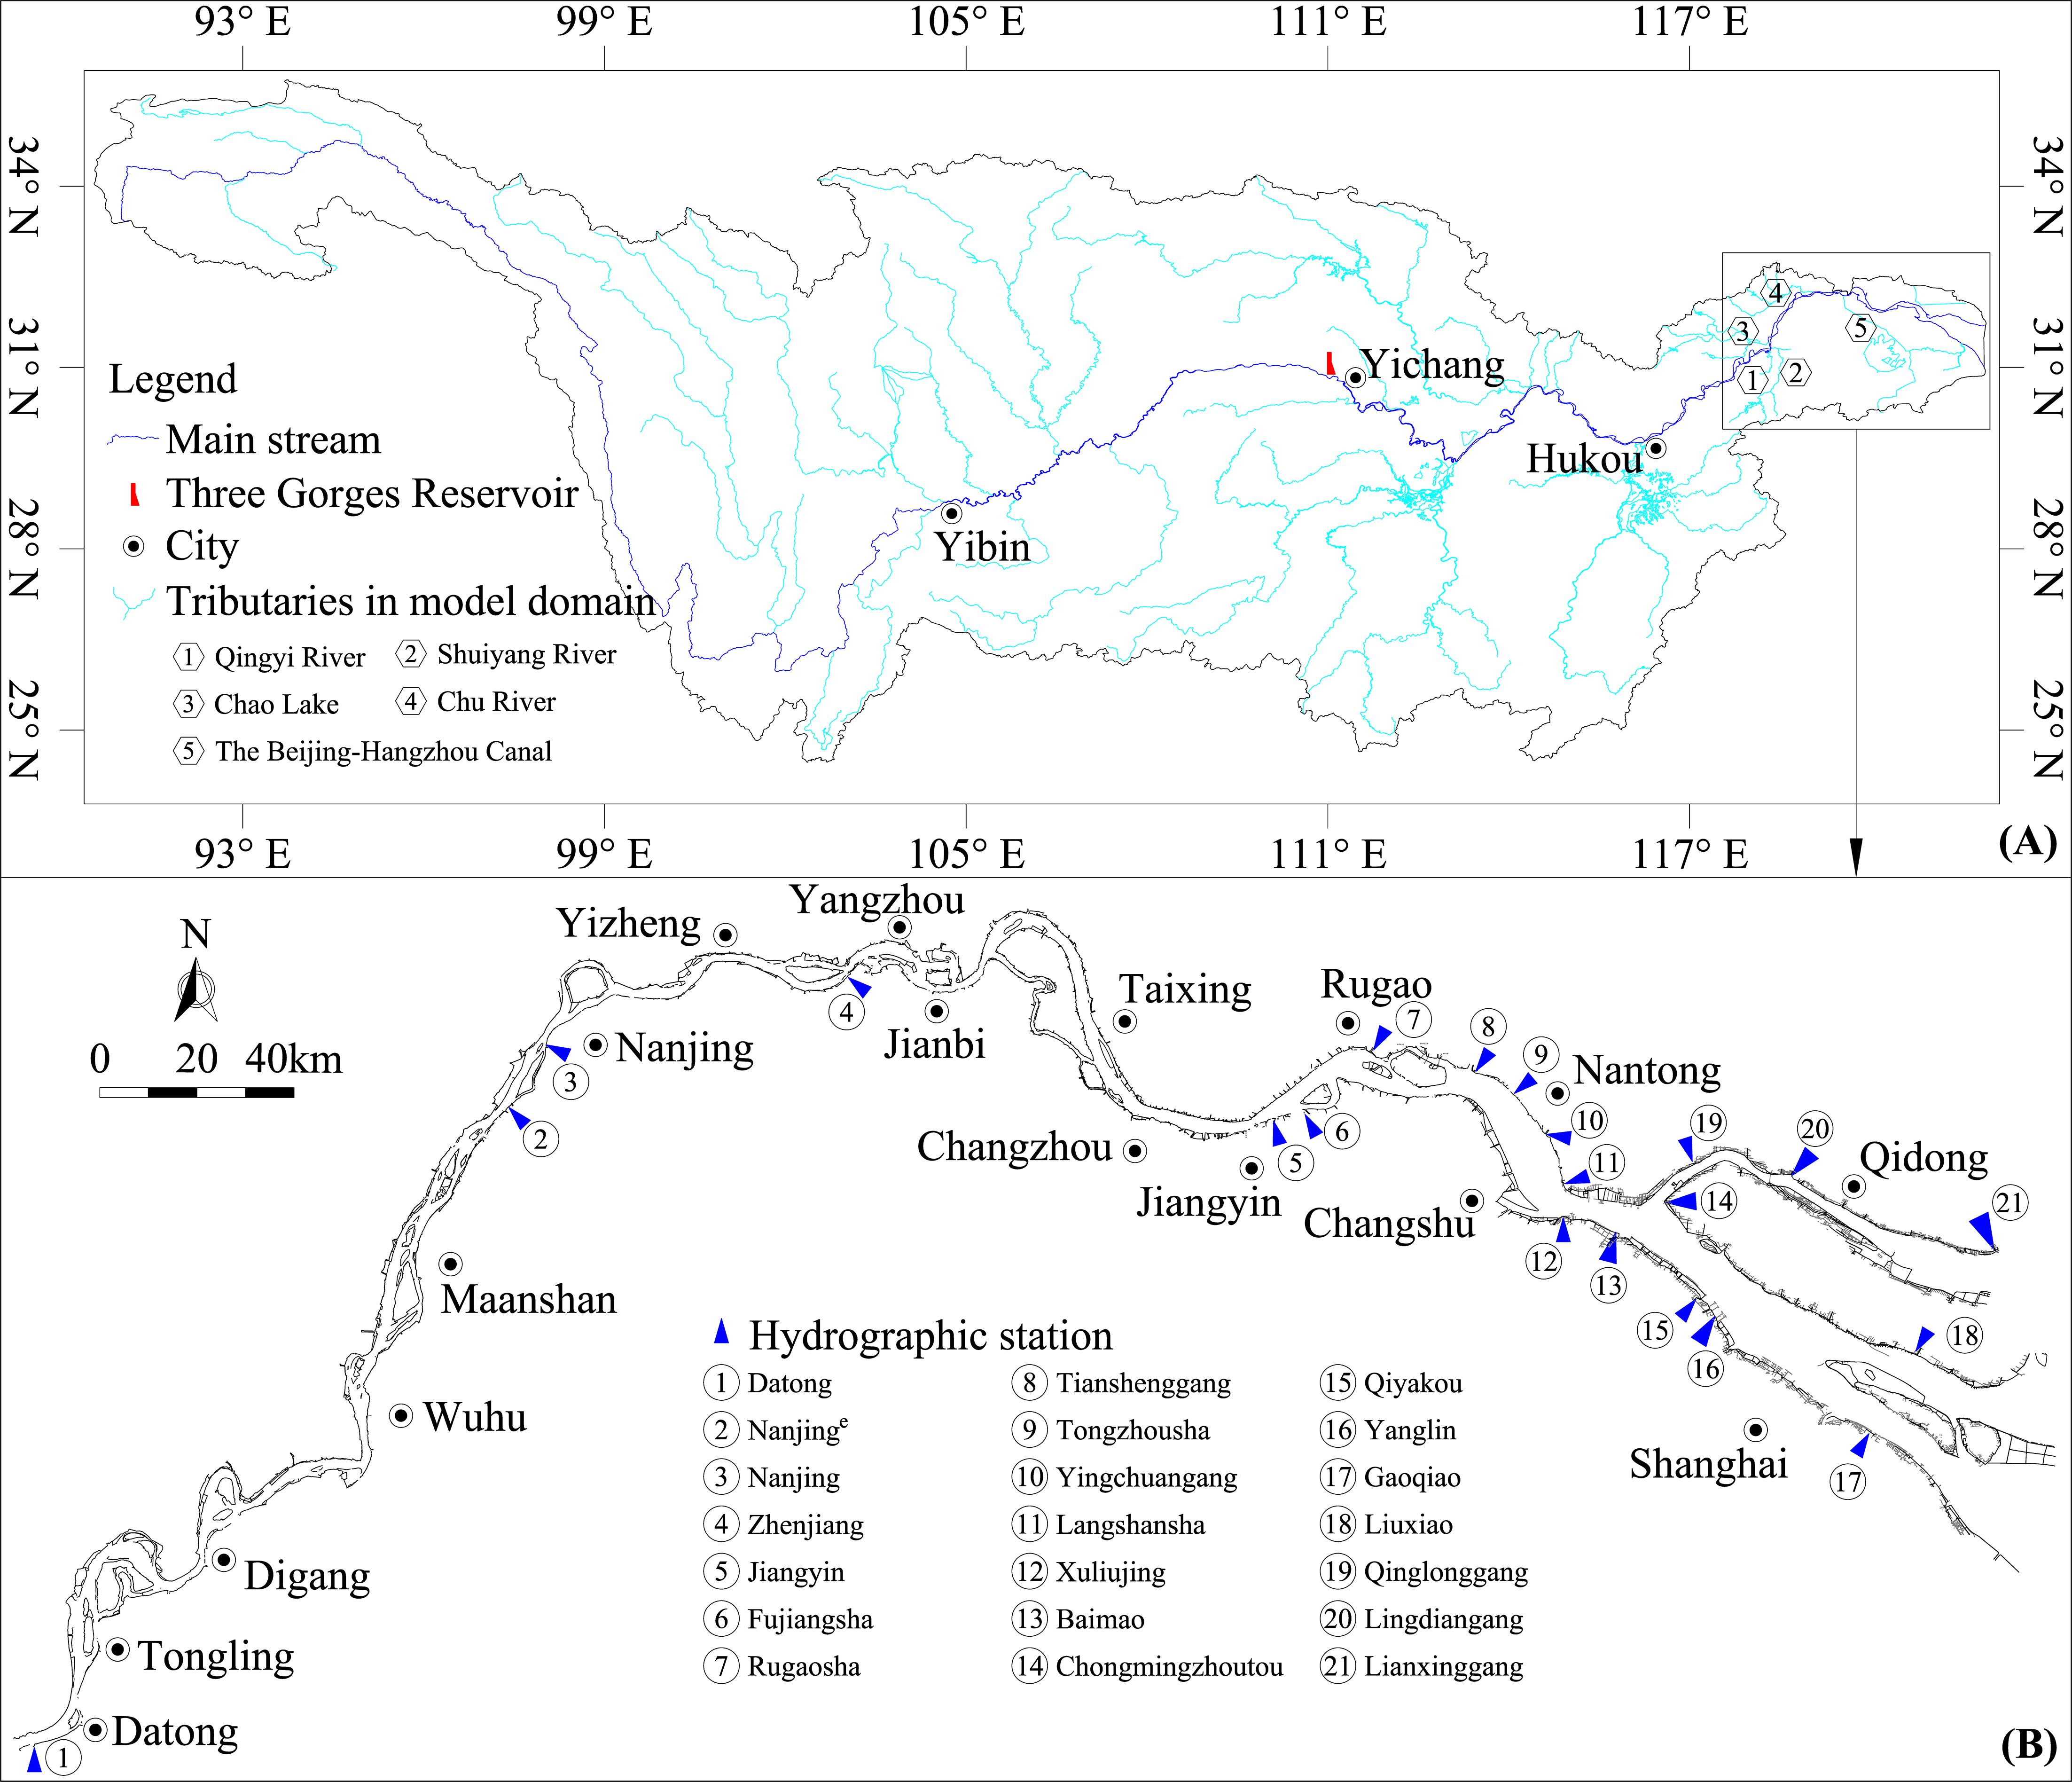
Figure 1. Study area: (A) the Yangtze River Basin, (B) domain of the river network model.

Table 1. Hydrographic station information.
There are numerous branching river reaches within the study area that are divided by sand bars. In this study, a river network structure composed of 46 nodes and 66 river reaches was generalized based on the distribution of branches and sand bars, and a total of 687 cross-sections with an average spacing of approximately 1600 m were used to divide the river reaches. To use the grouping method (Li, 1997) and accelerate model calculation, all nodes were divided into five groups. The 1st to 5th groups contained nodes from 1 to 11, 12 to 20, 21 to 28, 29 to 35, and 36 to 46, respectively. Generalization of the river network is shown in Figure 2.
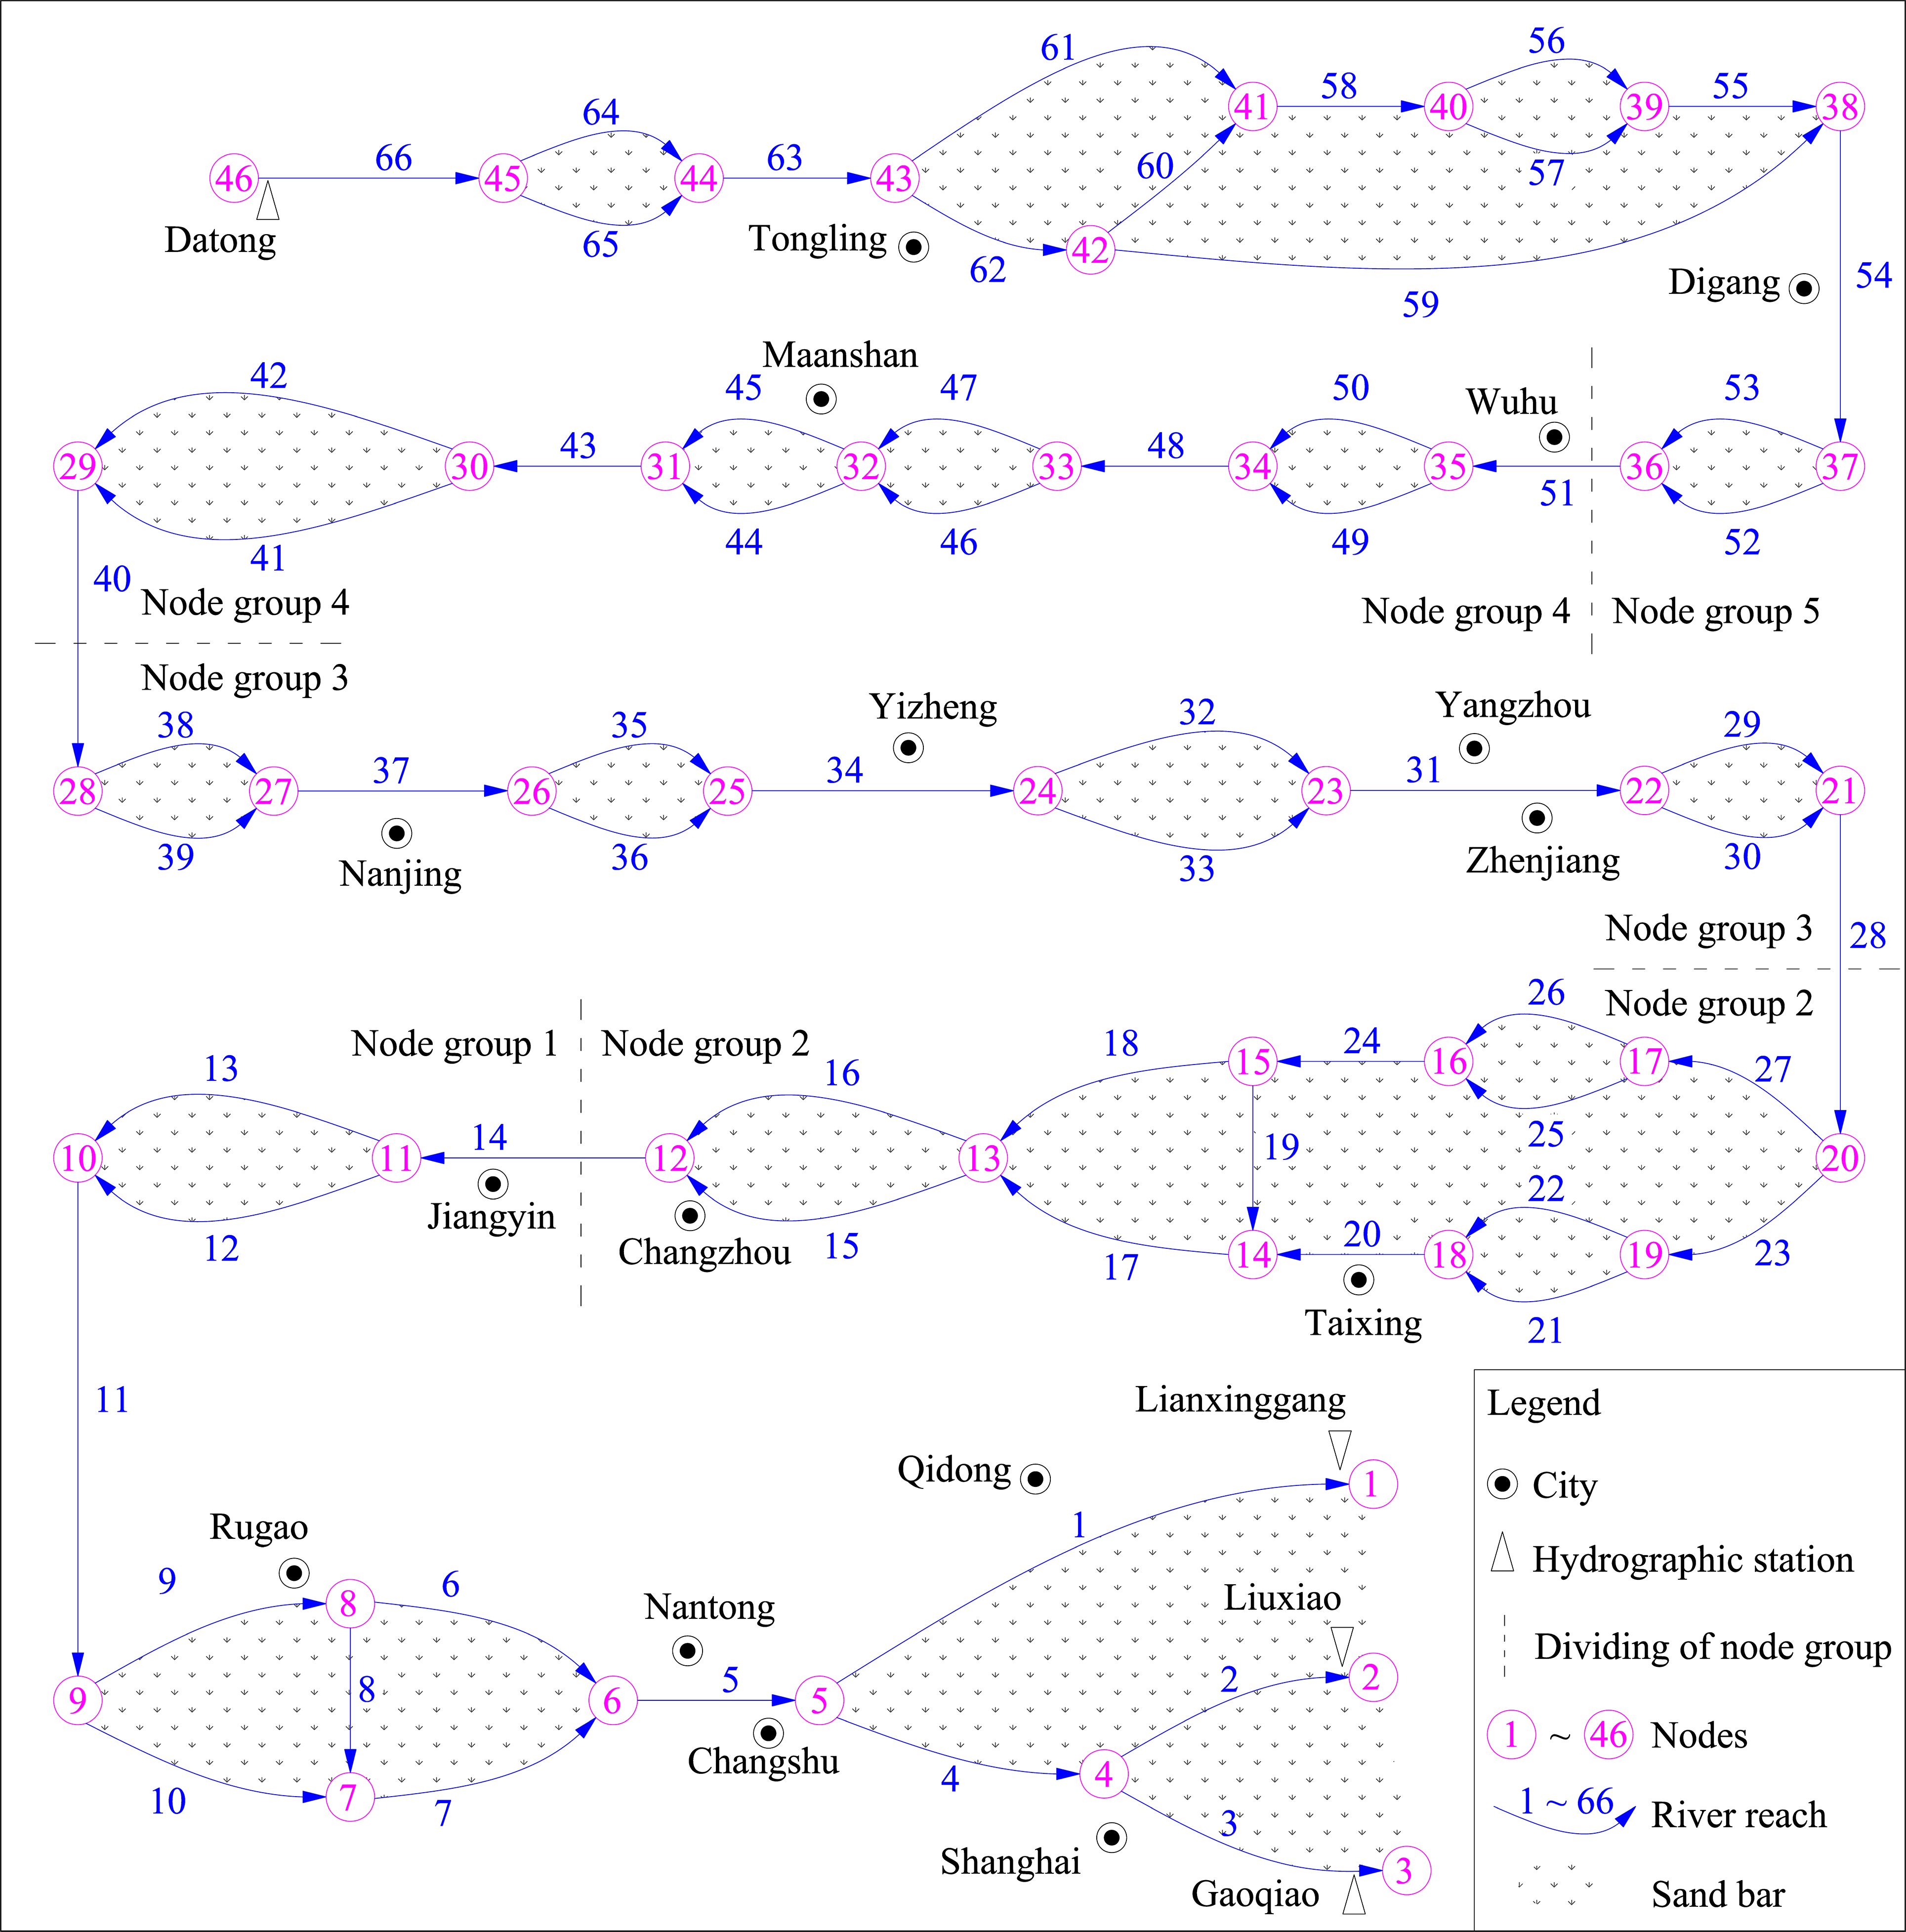
Figure 2. River network generalization for the model domain.
2.2 Methods
2.2.1 Governing equations and solutions
Since there are numerous bifurcations in the LYR, as shown in Figure 1, a river network model was used in this study. The primary governing equations are as follows (Sun et al., 2004):
Flow continuity equation for the river channel.
Flow momentum equation for the river channel.
Sediment continuity equation for the river channel.
Riverbed deformation equation for the river channel.
Flow continuity equation at the node of the river network.
Flow momentum equation at the node of the river network.
Sediment continuity equation at the node of the river network.
where x and t are the spatial and time variables, B is the water surface width, q is the interval inflow discharge, A is the cross-section discharge area, β is the momentum correction coefficient, g is the gravitational acceleration, n is the Manning roughness, R is the hydraulic radius, u and U are velocities of the interval inflow and channel flow, S is the SSC, is the SCC, α is the sediment saturation recovery coefficient, calibrated based on field data with values ranging from 0.001 to 0.1 (Ge et al., 2011). ω is the sediment settling velocity, is the area of riverbed deformation, and is the dry density of sediment particles. is the of the lth reach flowing into or out of the node m when , is the number of reaches connected to the node m; is the at the node m, which is equal to at the endpoints of river reach l connected to node m; M is the number of nodes in the river network, and is the SSC at the endpoints of river reach l connected to node m.
For non-cohesive sediments, ω is calculated using the formula proposed by Zhangruijin (Tan et al., 2018).
where v is the viscosity coefficient of water flow, is the sediment particle diameter, and are the densities of sediment and water, respectively.
For cohesive sediments, ω is affected by flocculation and calculated using the Stokes formula, which is suitable for the YRE (Mikkelsen and Pejrup, 2001; Wang et al., 2017).
where and are the average particle size and effective density of the floc.
The Holly–Preissmann scheme (Holly and Preissmann, 1977) was used to discretize the flow continuity and momentum equations for the river channel.
where and are the change values of and , respectively, within the time step ; and , , , , , , , , , and are the coefficients which are only related to the known and at the current moment . By substituting variables, the unknown and can be concentrated at the node.
where is the number of cross-sections in the river reach l; and , , , , , and are the coefficients. According to the flow continuity equation at a node of the river network, the equation system for the river network can be obtained as follows.
where is the coefficient matrix, and is a vector composed of constant terms. With reference to the matrix partitioning operation method in linear algebra theory, the at the node can be obtained by solving Equation 14 using the node grouping method (Li, 1997). By substituting it back to Equations 12 and 13, the at the head and tail of the river reach l is obtained; and by iterating them back to Equations 10 and 11, the and of any cross-section i in the river reach can be obtained.
According to the results from the hydrodynamic equations, SSC can be obtained using an analytical solution (Cao and Li, 2004) to solve Equation 4.
where is the distance between adjacent sections i and within the river reach, and is the of per unit width for the section. The overline parameter refers to the average value of Δxi.
Before solving Equation 15, a node-by-node scanning method is used to determine the SSC at the inlet of a river reach that leaves the node. For the river reaches connected at the nodes with known SSC boundary conditions, their inlet SSC is directly determined by boundary conditions. For the nodes within the river network, if all the SSC of the river reaches flowing into the node has been calculated after scanning, the SSC flowing out of the node and into the inlet of the river reaches connected to this node will be determined based on the conservation principle. In this process, it is assumed that the sediment-laden water flowing into the node has undergone sufficient mixing, that is, the SSC flowing out of the node into each river reach is the same.
The model algorithm flowchart is shown in Figure 3.
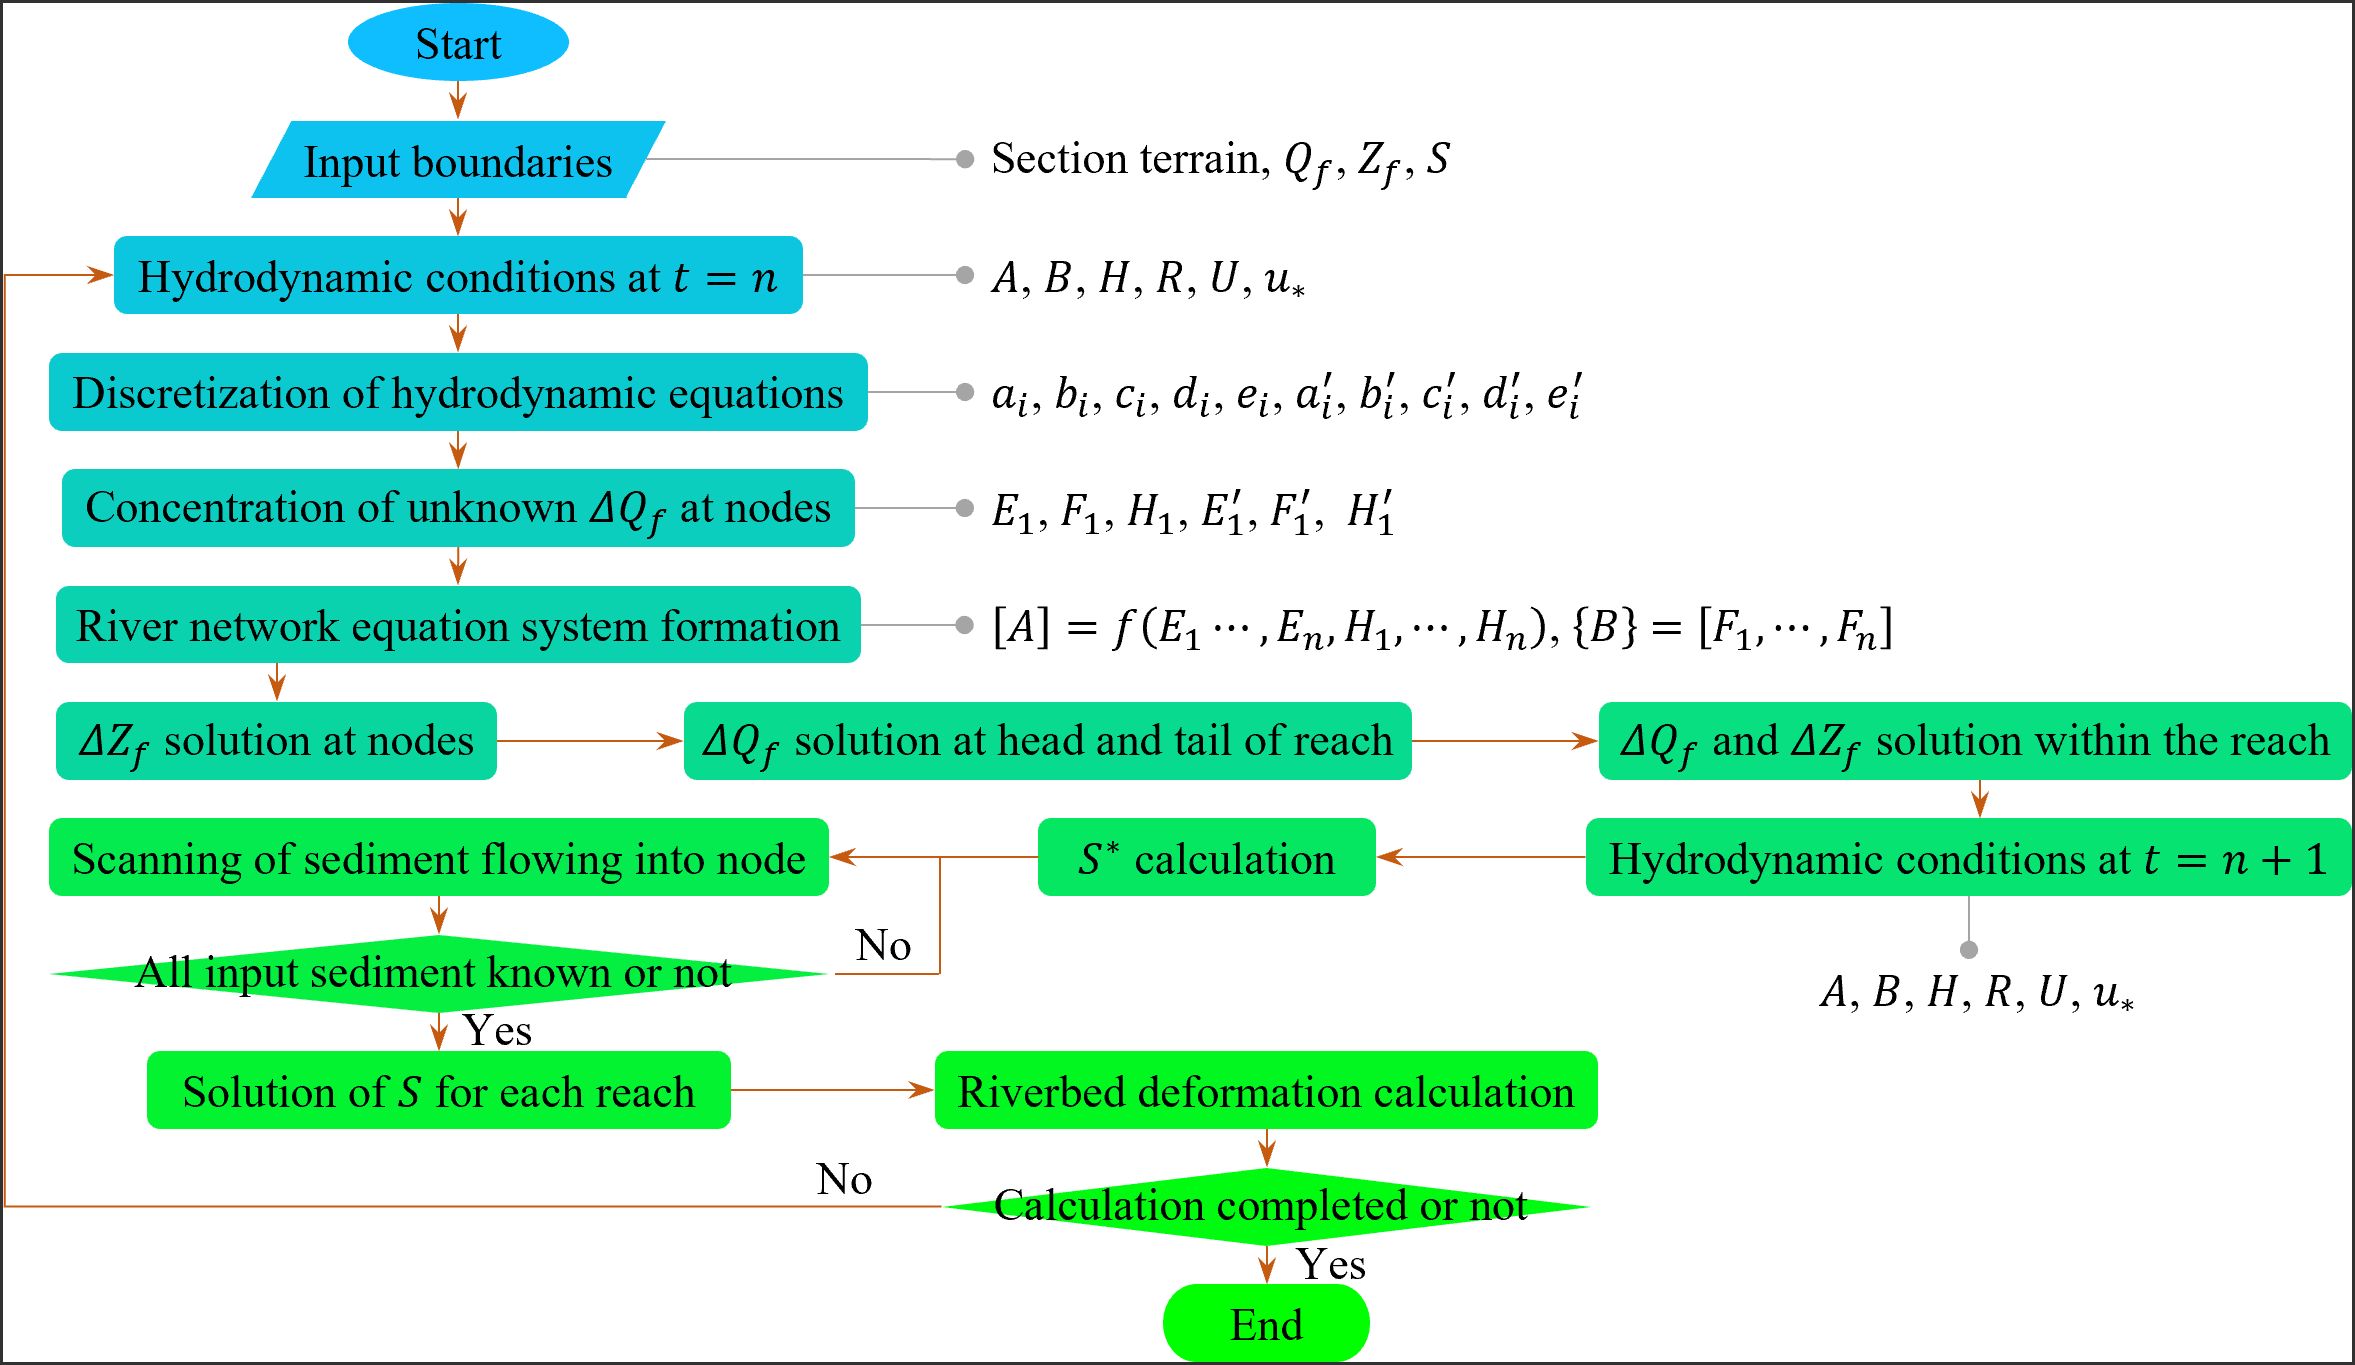
Figure 3. Model algorithm flowchart.
2.2.2 SCC for non-uniform sediment
The SCC for non-uniform sediment is an important parameter that directly determines the accuracy of the calculated SSC. From the perspective of the relationship between SSC and riverbed deformation, when SSC is greater than a certain critical level, the riverbed is deposition, and when it is less than that level, the riverbed is erosion. Therefore, the SCC refers to the critical SSC that can be transported under certain water flow and riverbed conditions. For sediment movement, the erosion and deposition of the riverbed are the results of sediment settlement from the water body and picking up from the riverbed. Observations show that the movement state of the sediment particles is not invariable; it can settle into the riverbed or rush up from the riverbed, and the two movement states exist simultaneously at a certain position on a riverbed (Chien and Wan, 1999). The balanced state of riverbed deformation corresponds to the equal settling flux () and rising flux (). The expression for SCC can be deduced based on the equal relationship between the two in terms of the balance of erosion and deposition.
The is mainly affected by the SSC near the bottom of the riverbed and the ω in flowing water. Compared with still water, it is affected by particle shape, riverbed boundary conditions, SSC, and flow turbulence. Therefore, the gd cannot be simply expressed as the product of the SSC near the bottom of the riverbed and the ω in the still water but as a nonlinear expression of the SSC. This complicates the derivation and calculation of SCC, and a trial calculation is required. is affected by both the flow and riverbed composition conditions. Hidden interactions between the bed material particles make the calculation of more complex. According to the statistical theory of sediment movement, Han and He (1997) provided the sediment flux as follows.
where is the SSC near the bottom of the riverbed, is the probability of not stopping motion, is the probability of levitation, is the friction velocity, π is the ratio of the circumference, and m0 is the static compaction coefficient of bed materials with a value of 0.4. is the sediment content of a certain size particle in bed materials, γ is the probability of suspension, which is equal to ϵ4 when the particles on the bed surface are under loose conditions, and ϵ1 is the probability of starting to move.
Among them, is calculated using an empirical formula.
The sediment movement probabilities are calculated as follows.
Vb,k0 and are the flow velocity near the riverbed when the sediment particles stop and start moving.
where H is the water depth. The values and ranges for these parameters are shown in Figure 4.
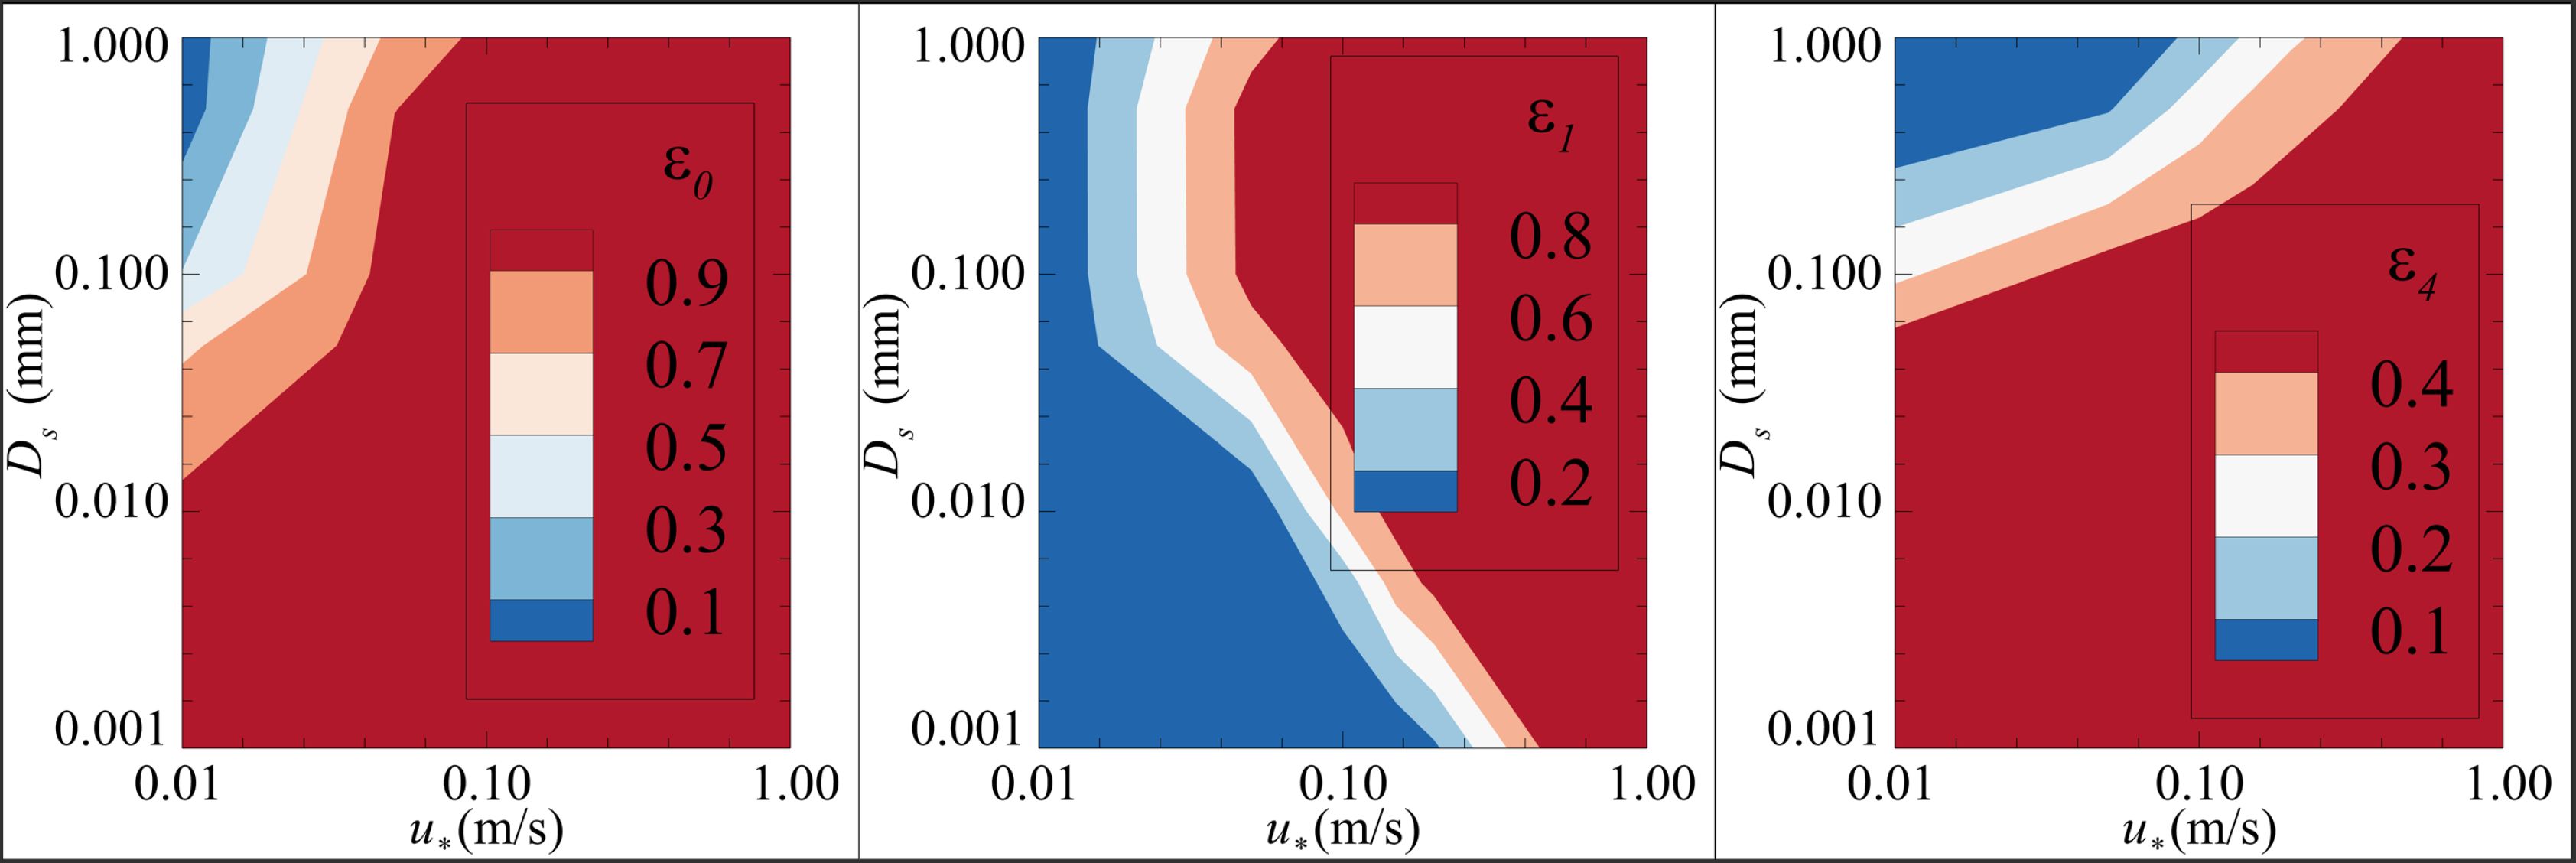
Figure 4. Values and ranges for the parameters in gd and gu formulas.
When , the expression of SCC near the bottom of the riverbed can be deduced according to Equations 16 and 17 as follows.
Under the equilibrium condition of the riverbed, the vertically averaged SCC for non-cohesive sediment can be obtained using the Ryan formula (Rouse, 1937) as follows.
where κ is the Karman constant.
For cohesive sediments, related research shows that the Soulsby formula (Whitehouse et al., 2020) has strong adaptability in the YRE (Li et al., 2017b; Luan et al., 2023). By adopting the Soulsby formula, the vertically averaged SCC for cohesive sediment can be obtained as.
where Rc is the ratio of the near-bottom SSC to surface SSC.
2.3 Boundary conditions
The boundary conditions of the model include Qf, SSC and its grading at the inlet of the study area, and Zf at the outlet. When the tide enters the river reach, it also requires the SSC and its grading of the tide from the sea. The daily averaged Qf and total SSC of all sediment particles at Datong hydrographic station were used as the import flow and sediment conditions (Figure 5A). In the study area, water systems such as Qingyi River, Shuiyang River, Chao Lake, Chu River, and other small rivers flow into the LYR, but there are no available measured data for use in characterizing the amount of Qf and SSC and associated processes; therefore, we did not consider these tributaries in our study. The non-uniformity of the sediment was assessed using monthly averaged grading (Figure 5C). The Zf values measured at the Liuxiao and Lianxinggang hydrographic stations were used as outlet boundaries (Figure 5B). These two hydrographic stations are distributed sequentially in the southern and northern branches of the YRE. When the tide enters the Yangtze River, the SSC of the tide is calculated using the weighted values of SCC and SSC (Sun et al., 2022).
Grading of the riverbed in the study area is necessary to calculate the SCC using Equations 25 and 26. Within the study area, three hydrographic stations (Datong, Nanjinge, and Xuliujing) conduct regular riverbed sediment grading measurements annually. We therefore used the yearly averaged values from the three stations to perform a linear interpolation between the stations (Figure 5D). During the calculation process, riverbed grading was adjusted based on the calculated sediment erosion and deposition depths of different particle sizes within a mixed layer based on sand wave movement (Ge et al., 2012).
In 2020, the Yangtze River Basin, especially the LYR, experienced catastrophic flooding that was second only to that occurring in 1954 and 1998 (Ge and Zhu, 2023). To fully test the adaptability of the model under extreme flow conditions, a model verification was conducted using the water and sediment processes from 2020. All the boundary conditions employed are shown in Figure 5.
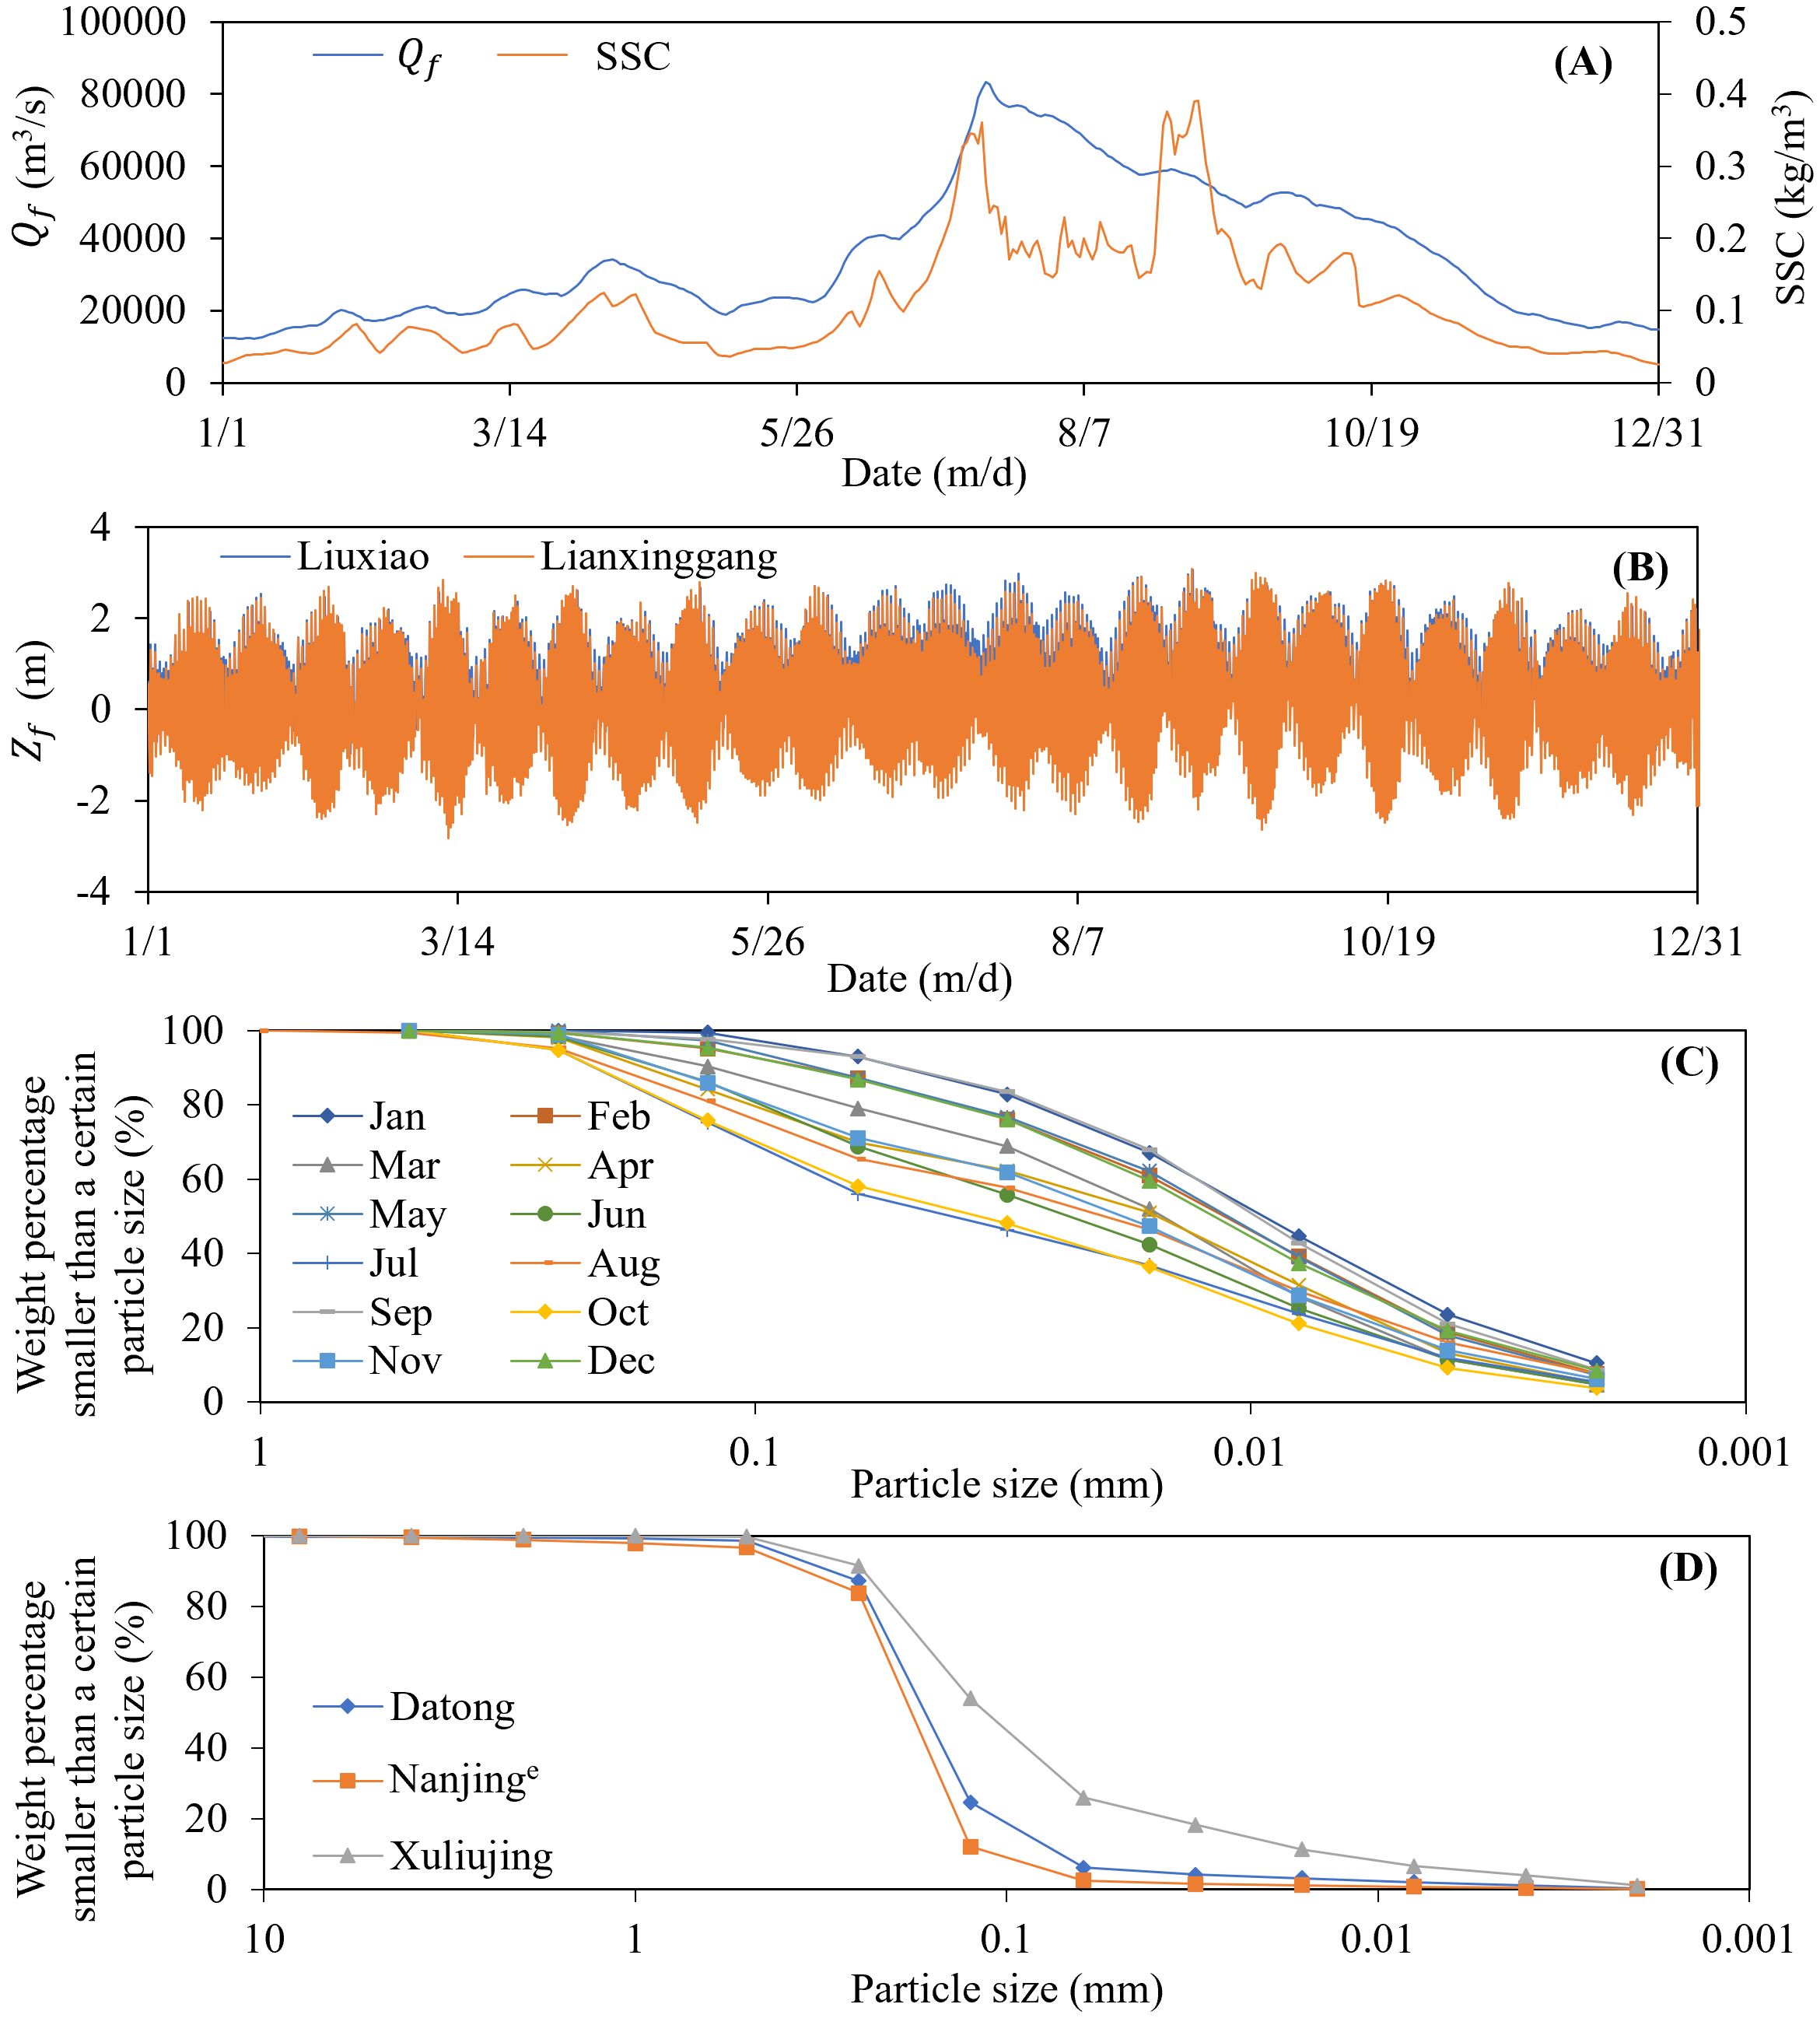
Figure 5. Model verification boundaries: (A) inlet Qf and SSC at Datong, (B) outlet Zf at Liuxiao and Lianxinggang, (C) monthly averaged grading of the inlet SSC at Datong, and (D) yearly averaged grading of the riverbed at hydrographic stations.
3 Model verification
3.1 Qf and Zf
Figures 6 and 7 show a comparison between the measured and calculated Qf and Zf processes at different hydrographic stations, respectively. In Figure 6, the negative Qf value means that the flow direction is opposite to that indicated by the arrow in Figure 2; that is, the water is flowing from the downstream to the upstream of the river reach. During the dry season, both the peak and phase of the calculated Qf were in line with the measured in the entire model domain. However, this situation changed during the flood season. During this period, the LYR experienced a catastrophic flood process with a large amount of flood discharged from Qingyi River, Shuiyang River, Chao Lake, Chu River, and other water systems (Ge and Zhu, 2023). Owing to the lack of measured data for these water systems, the calculation could not consider the input Qf of these river systems. Therefore, the calculated peak of Qf was smaller than the measured, but with little difference in the phase for the river reach above Xuliujing station. Below Xuliujing, where Qf was mainly affected by the tide, the difference between the calculated and measured peaks of Qf, as well as the phase, was relatively small.
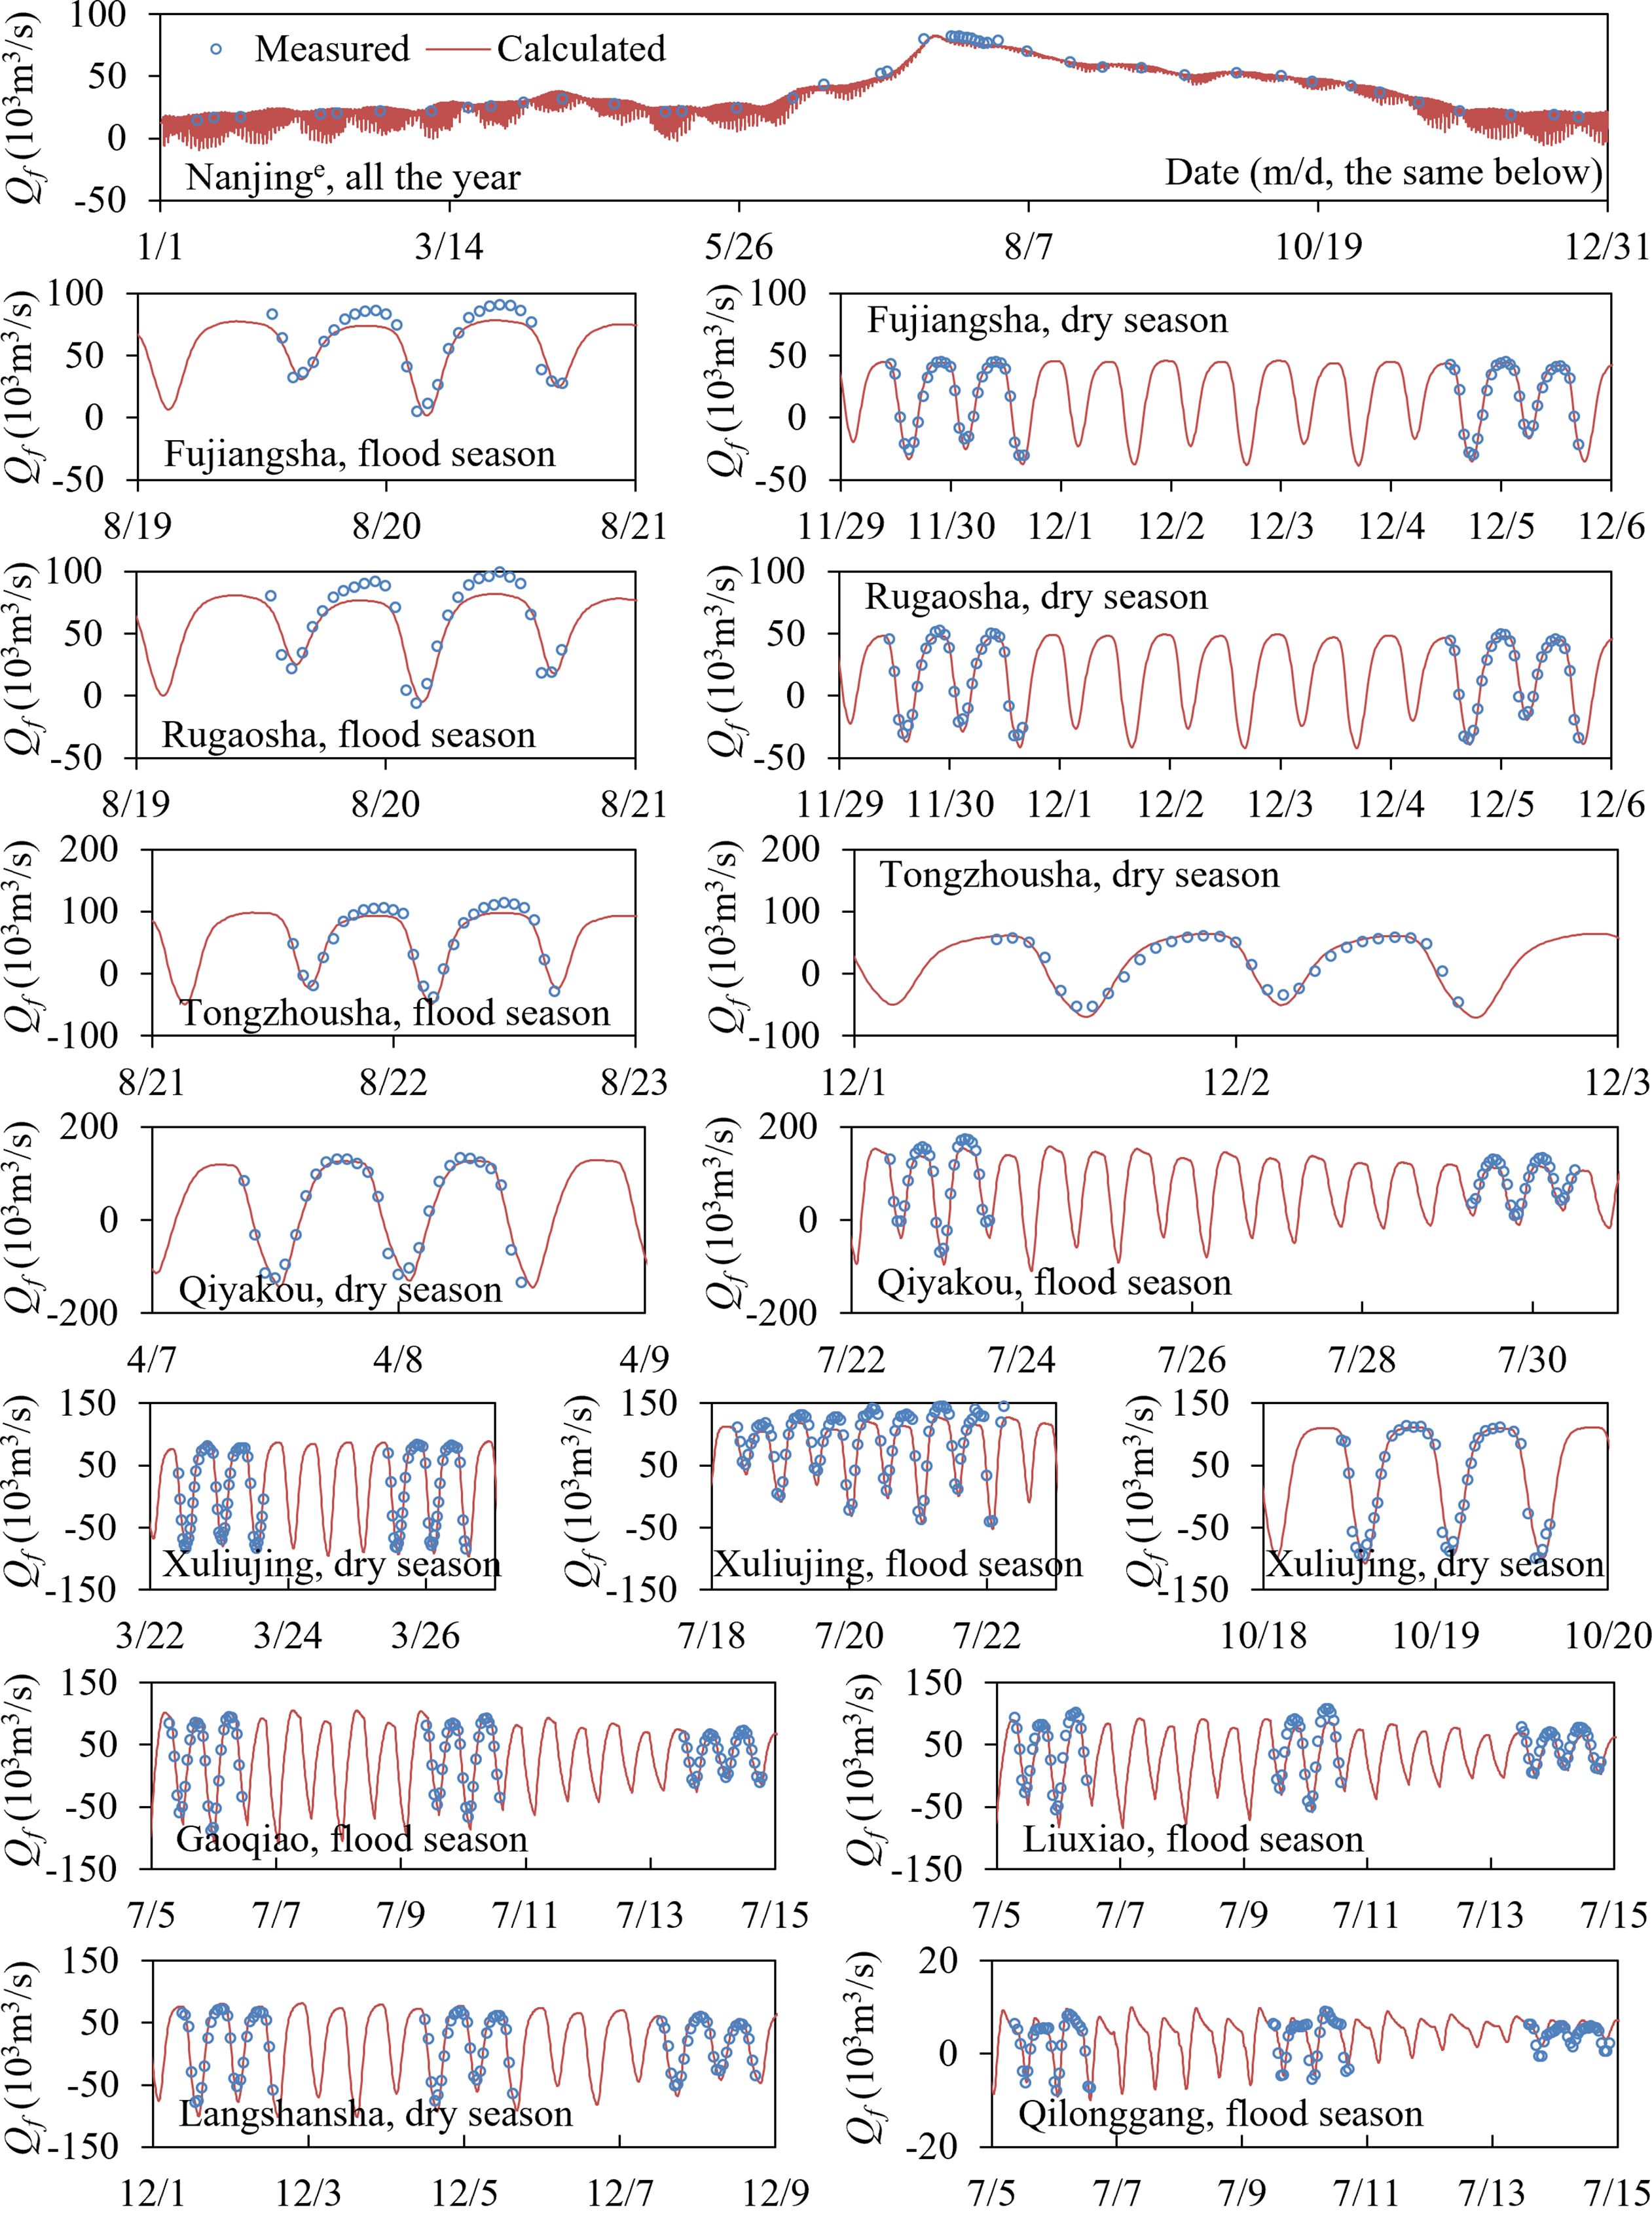
Figure 6. Verification of the Qf process in 2020.
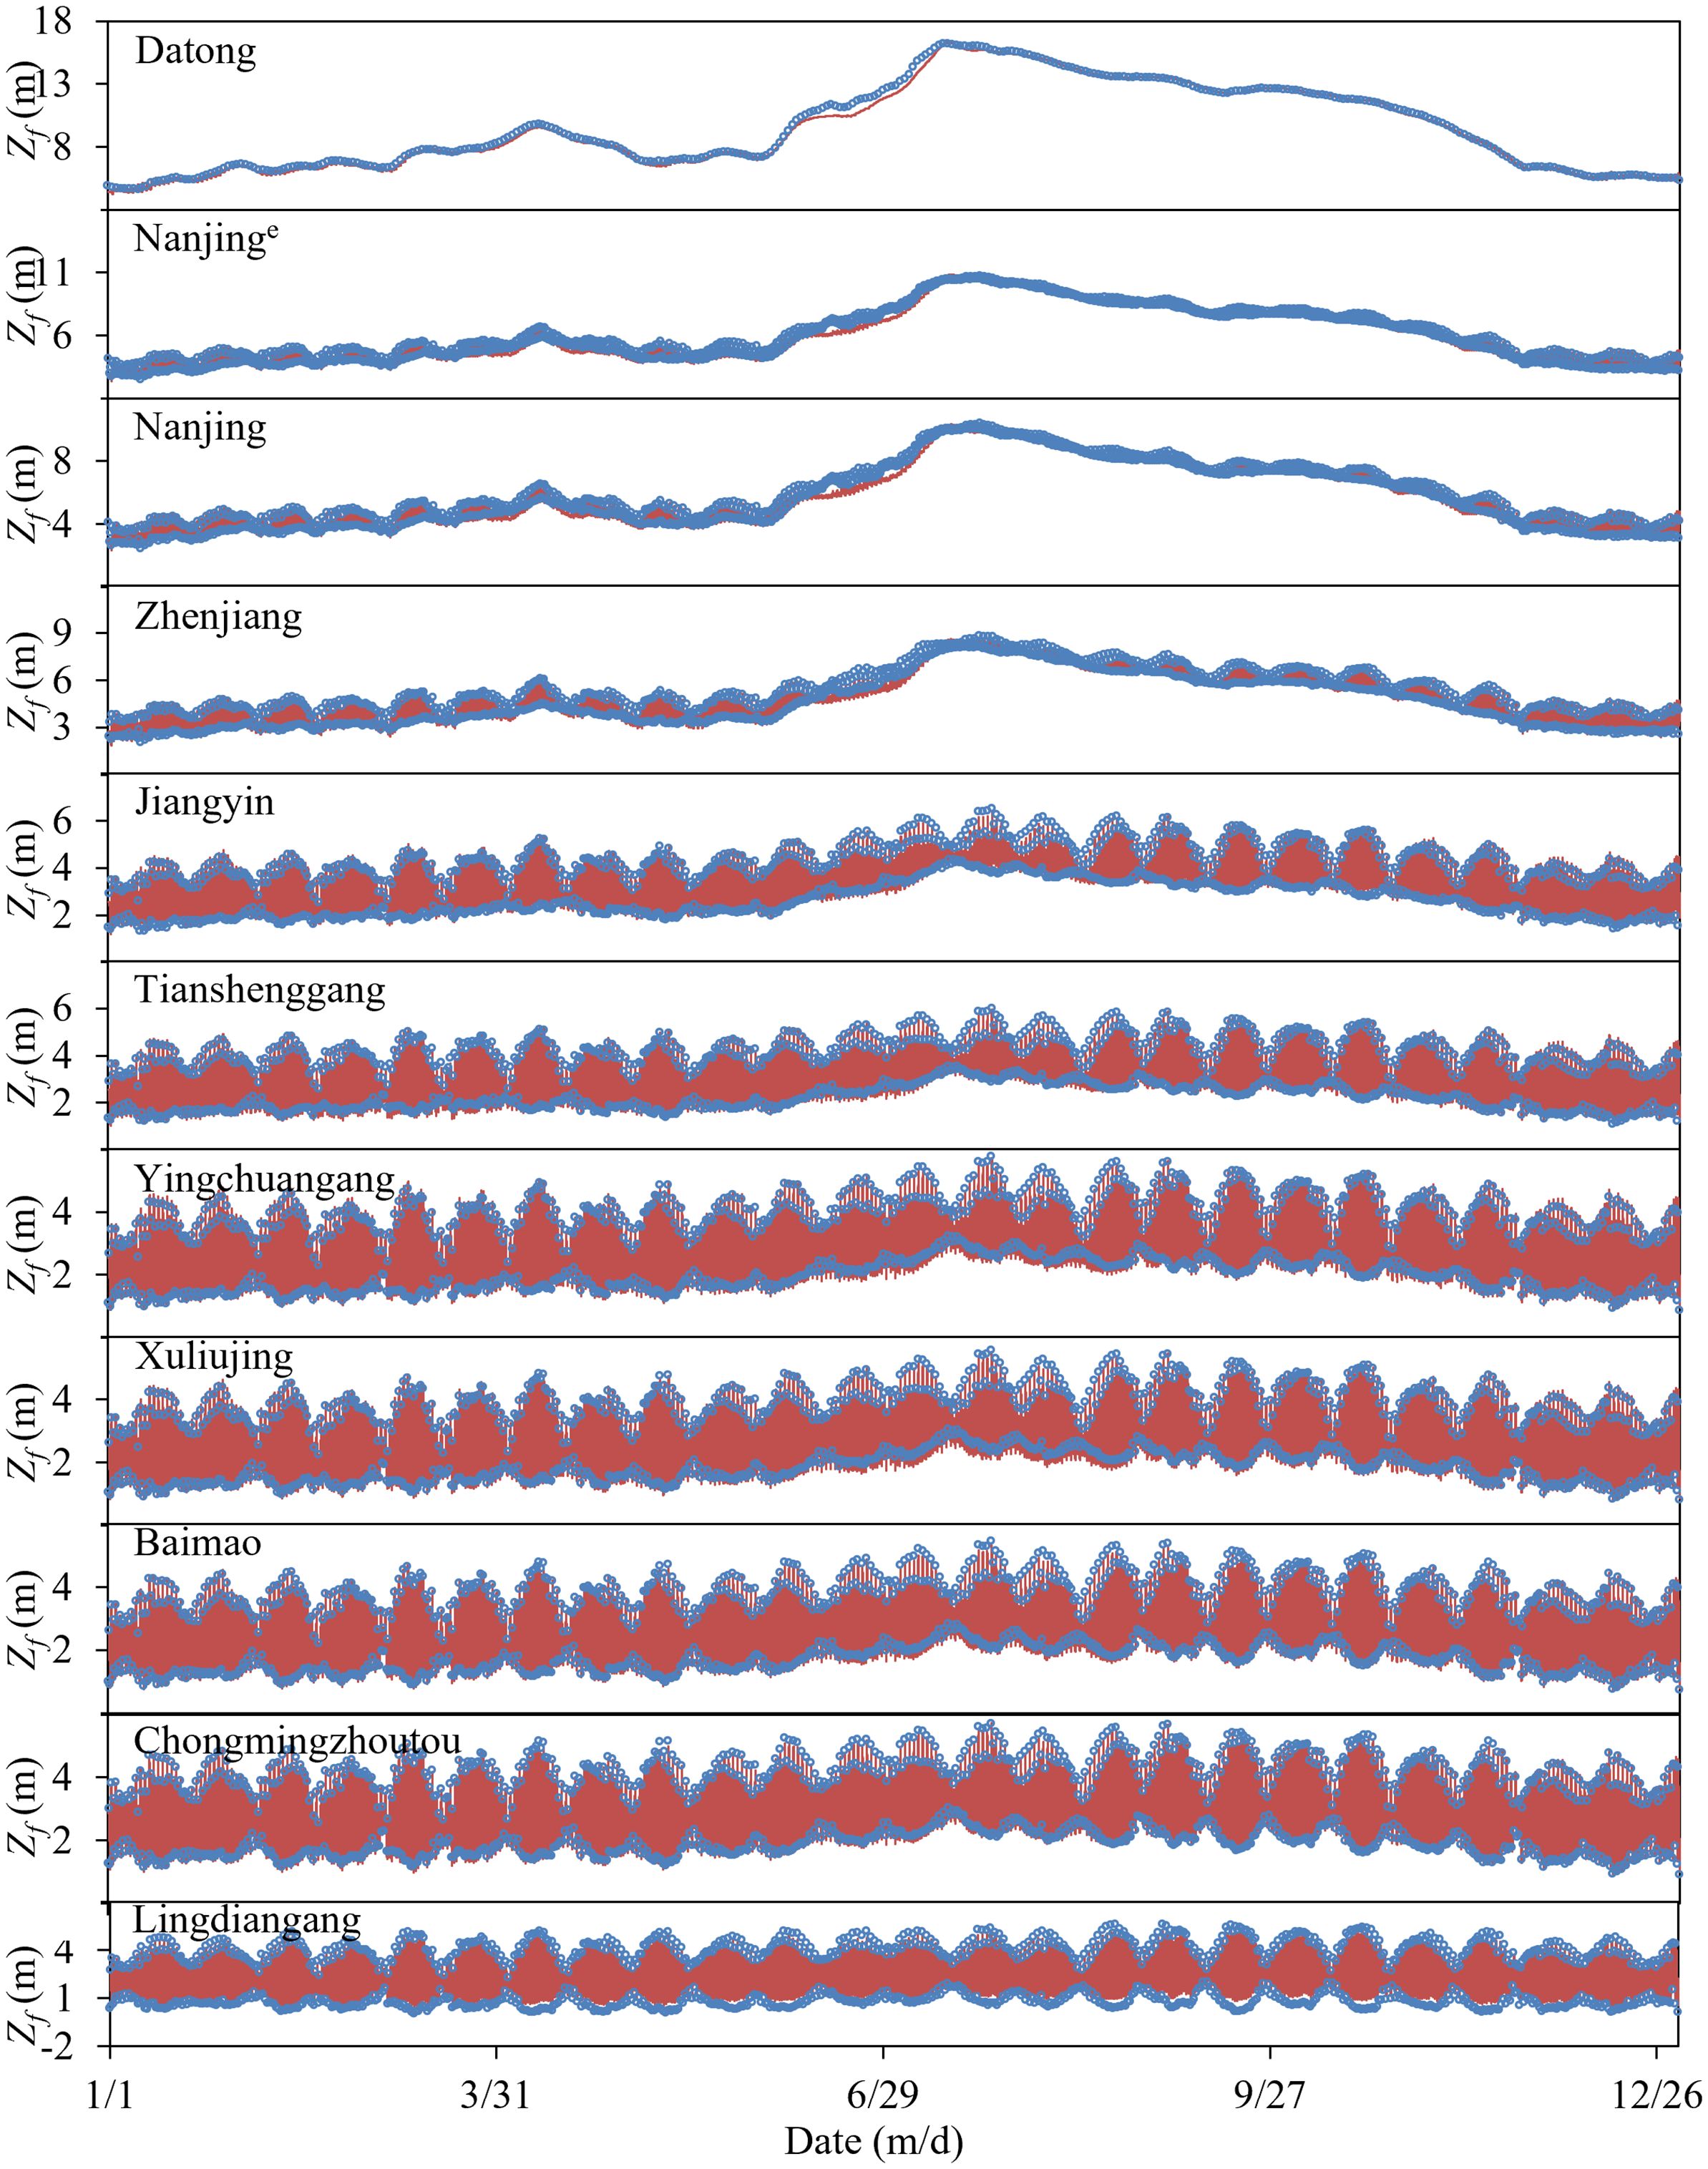
Figure 7. Verification of the Zf process in 2020.
The error distribution pattern in the calculated Zf was similar to that of Qf. In the river reach below Xuliujing, whether during the flood or dry seasons, the peak and phase of the calculated Zf were in strong alignment with the measured values, as well as in the river reach above Xuliujing during the dry season. Above Xuliujing station, owing to the smaller calculated Qf during the flood season, the calculated peak of Zf was smaller than that measured, especially above Zhenjiang station. Similar to Qf, the calculated phase of Zf was consistent with the measured phase. Owing to the lack of input Qf from the tributaries, it was difficult to calculate the jacking effect of the tributaries on the local Zf of the mainstream. This was one of the reasons for the lower calculated Zf.
3.2 SSC
Figure 8 shows a comparison between the measured and calculated SSC at Nanjinge and Xuliujing stations. For sediment with Ds less than 0.031 mm, the calculated SSC at Nanjinge station was consistent with the measured. For Ds greater than 0.031 mm, the calculated SSC at Nanjinge station was larger than the measured. In the river reach above Nanjinge station, the content of the sediment with Ds less than 0.031 mm in the riverbed materials was generally within 4% (see Figure 5D). During erosion, the amount replenished from the riverbed was relatively small. The calculated SSC for these particles was in strong alignment with the measured values. This indicates that the model effectively reflected the movement of these particles. The content of particles with Ds > 0.031 mm was relatively high in the riverbed, resulting in relatively large amounts being replenished from the riverbed during the erosion process. As riverbed erosion is mainly dominated by sediments with Ds larger than 0.031 mm, the SSC in this river reach should increase along the way. This also implies that the SSC at Nanjinge station should be greater than that at Datong station, and Figure 8 shows that the calculated SSC for sediment with Ds > 0.031 mm is greater than that measured at the Nanjinge station. Therefore, the calculated SSC for these particles is reasonable.

Figure 8. Verification of the SSC process in 2020.
SSC measurements at Xuliujing station were conducted using OBS; as they did not include measurements of grading, only a comparison of the total SSC could be made. Figure 8 shows that the calculated total SSC was generally greater than the measured, with a deviation range of 0.01 ~ 0.23 kg/m3 and an average deviation of 0.06 kg/m3. This deviation was slightly smaller than that at the Nanjinge station of about 0.08 kg/m3. However, this result is qualitatively reasonable. Due to the low SSC water flow entering the study area, the SSC continued to recover with the erosion of the riverbed along the way. In addition, impacted by the deeper water depth and the stronger effect of the current, the further downstream, the smaller the increase in SSC. Therefore, calculations of the sediment concentration with a smaller bias than that of the Nanjinge station are reasonable.
4 Discussion
4.1 Rationality of the proposed SCC formula
The SCC of non-uniform sediment is a key parameter used in sediment dynamic numerical models. Based on the statistical theory of sediment exchange near the riverbed, we propose a new formula for calculating the SCC. Applying the numerical simulation of non-uniform suspended sediment flowing into the YRE indicated that the model has satisfactory computational accuracy.
Zhang (1989) and Wu and Li (1993) also proposed SCC formulas for non-uniform sediment based on a similar sediment exchange flux concept but involving other theories. Figure 9A provides a comparison of the total SCC near the riverbed calculated by Equation 24, Zhang (1989), and Wu and Li (1993) under certain flow conditions and riverbed grading conditions. It can be seen that the result of Equation 24 is larger than that of the other two formulas. The SCC calculated by Equation 24 increases with the flow intensity, which is in line with the general law of sediment transport. However, the SCC calculated by Zhang (1989) and that of Wu and Li (1993) first decreases and then increases with the flow intensity, which is inconsistent with the law of sediment transport. Figure 9B shows a comparison of the grading of SCC. The result of Equation 24 is close to that of Wu and Li (1993) but differs slightly from that of Zhang (1989). Overall, compared with the other two formulas based on the same concept, namely that the SCC is equal to the SSC when gu = gd, the formula proposed in this study is more in line with the general law of sediment movement. That is, the SCC increases with an increase in the water flow intensity.
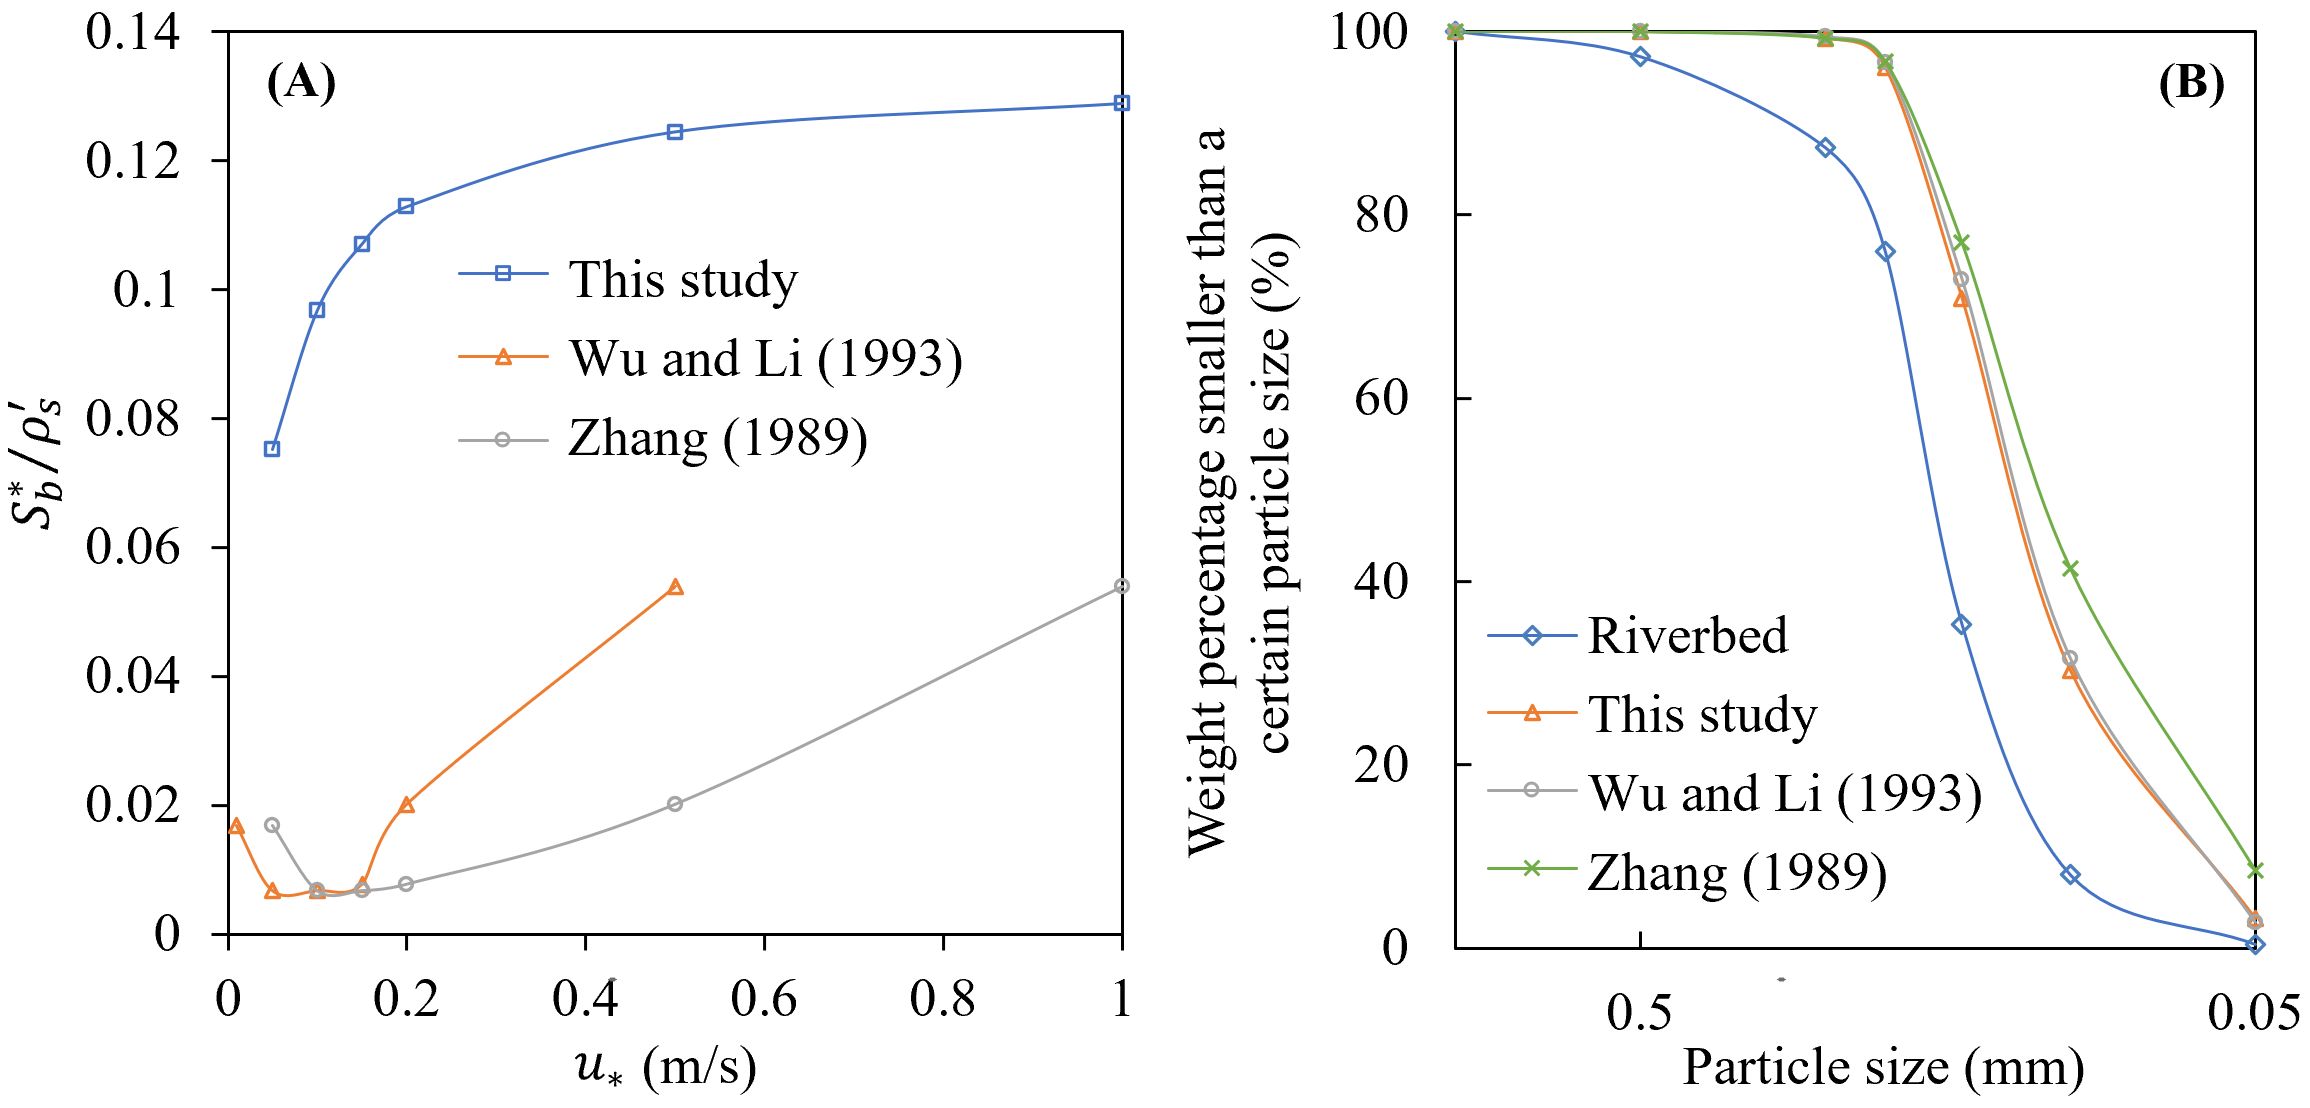
Figure 9. Comparison of total SCC (A) and its grading (B) calculated by different formulas.
4.2 Impact of measurements
4.2.1 Contradiction between measured SSC and riverbed evolution
The model established in this study effectively simulates the processes of Qf, Zf, and SSC for finer sediment particles, but the calculated SSC of coarser sediment is larger than that of the measured values. According to calculations based on cross-sectional terrain data, approximately 1.8223×10⁸ m3 and 0.0607×10⁸ m3 of the riverbeds from Datong to Nanjinge and Nanjinge to Xuliujing station were scoured in 2020, respectively (Xu et al., 2023). According to the principle of sediment conservation, combined with the sediment transport amount at Datong station calculated with a of 1400 kg/m3, the net sediment transport amount flowing to the ocean at Nanjinge and Xuliujing station in 2020 should be 4.1912×10⁸ t and 4.2762×10⁸ t, respectively, which is more than 2.5 times that of Datong station (1.64×10⁸ t). This means that the SCC at Nanjinge and Xuliujing stations should be higher than that at the Datong station. However, a comparison of the relationship between measured Qf and Qs (sediment transport rate calculated by product of Qf and SSC) at the two stations (Figure 10) indicated that the SSC measured at both the Nanjinge and Xuliujing stations was significantly lower than that at the Datong station. The measured net sediment transport amount at Xuliujing was only 1.54×10⁸ t in 2020, which indicated a deposition of 0.1×10⁸ t, that is 0.0714×10⁸ m3. This contradicted the state of the scoured riverbed with an erosion amount of 1.883×10⁸ m3 from Datong to Xuliujing.
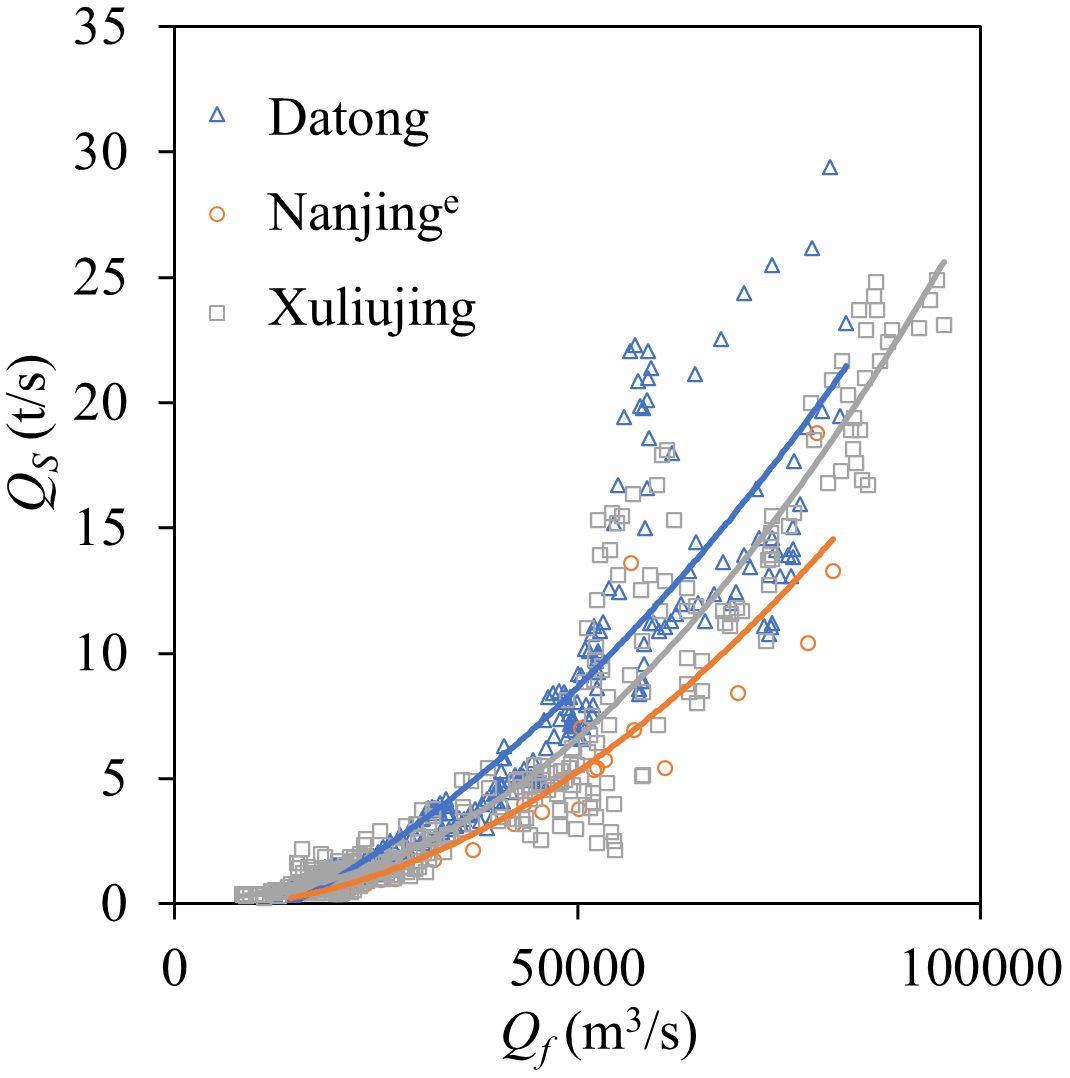
Figure 10. Relationship between Qf and Qs at different stations.
However, this contradiction commonly occurred in the middle and lower reaches of the Yangtze River following the impoundment of the TGR (Xu et al., 2021), and it is difficult to determine which is more accurate, the erosion calculated based on cross-sectional data or the SSC data. First, the calculation based on cross-sectional terrain data may not be entirely accurate. This is mainly because of the large spacing between cross sections, which cannot fully and accurately depict the shape of the river section. In this respect, the amount of erosion calculated using finer grids may be smaller (Xu et al., 2021). Second, the riverbed evolution and the causes for this may differ in the various sections of the LYR. For example, the tidal section of the LYR (Datong to Jiangyin) has shown a cumulative erosion trend due to the reduction of incoming sediment, sand mining, and channel regulation (Du et al., 2016; Yang et al., 2024), and the rapid reduction of incoming sediment in recent years is the main reason for excessive erosion in the LYR (Zheng et al., 2018, 2022). In the Nanjing river section, shore protection engineering is the main cause of nearshore sediment deposition (Wei et al., 2022), while in the Chengtong river section, studies based on Delft3D model show that the net discharge ratio is the main factor involved in river evolution, and it decreases with an increase in the upstream inflow (Chen et al., 2016), but the decreased input sediment has set the river section in a state of erosion (Xu et al., 2019). The evolution of the YRE is even more complex. On the one hand, the TGR exerts its influence by changing the sediment particle size, thereby affecting the flocculation and subsequent sedimentation of suspended sediment (Luo et al., 2012), and on the other hand, the deep-water channel projects implemented in recent years have changed the flow and sediment diversion situation of the YRE, which has had a significant impact on local riverbed evolution (Liu et al., 2008; Wu et al., 2016; Dou et al., 2019; Tang et al., 2022). In addition, the changes in tidal dynamics have had a significant impact on the evolution (Ding et al., 2023). It can be seen that the complexity of the evolution in the LYR makes it very difficult to quantify the erosion caused by water and sediment dynamic conditions, resulting in distorted erosion amounts calculated based on cross-sectional data. As a result, the amount of erosion may not be as large as the previously calculated based on cross-sectional terrain data.
Nonetheless, in terms of the nature of erosion and deposition, there is a consensus that the river section below Datong has been scoured since the impoundment of the TGR, meaning a higher SSC at Nanjinge and Xuliujing than that at Datong station, but it may not as large as the reverse calculated based on the erosion amount. Therefore, it is reasonable that the SSC calculated using the model proposed in this study is higher than that measured at Nanjinge and Xuliujing stations. However, there are still some difficulties in determining quantitative rationality, as it is difficult to quantify the deformation of the riverbed caused by human activities, such as sand mining, reclamation, hydraulic filling, etc.
4.2.2 SSC measurement
Compared with the runoff river section, it is more difficult to obtain measurements of SSC in the tidal river, and achieving this is still in the experimental stage. Taking Nanjinge station as an example, the measurement for SSC adopts the seven-line-three-point method. That is, seven vertical lines are arranged on the cross section as shown in Figure 11A, with distances of 955, 1115, 1435, 1750, 1900, 2030, and 2140 m from the left bank. The SSC at the three relative water depths of 0.2, 0.6, and 0.8 is measured for each vertical line. The vertical average SSC is then obtained as follows.
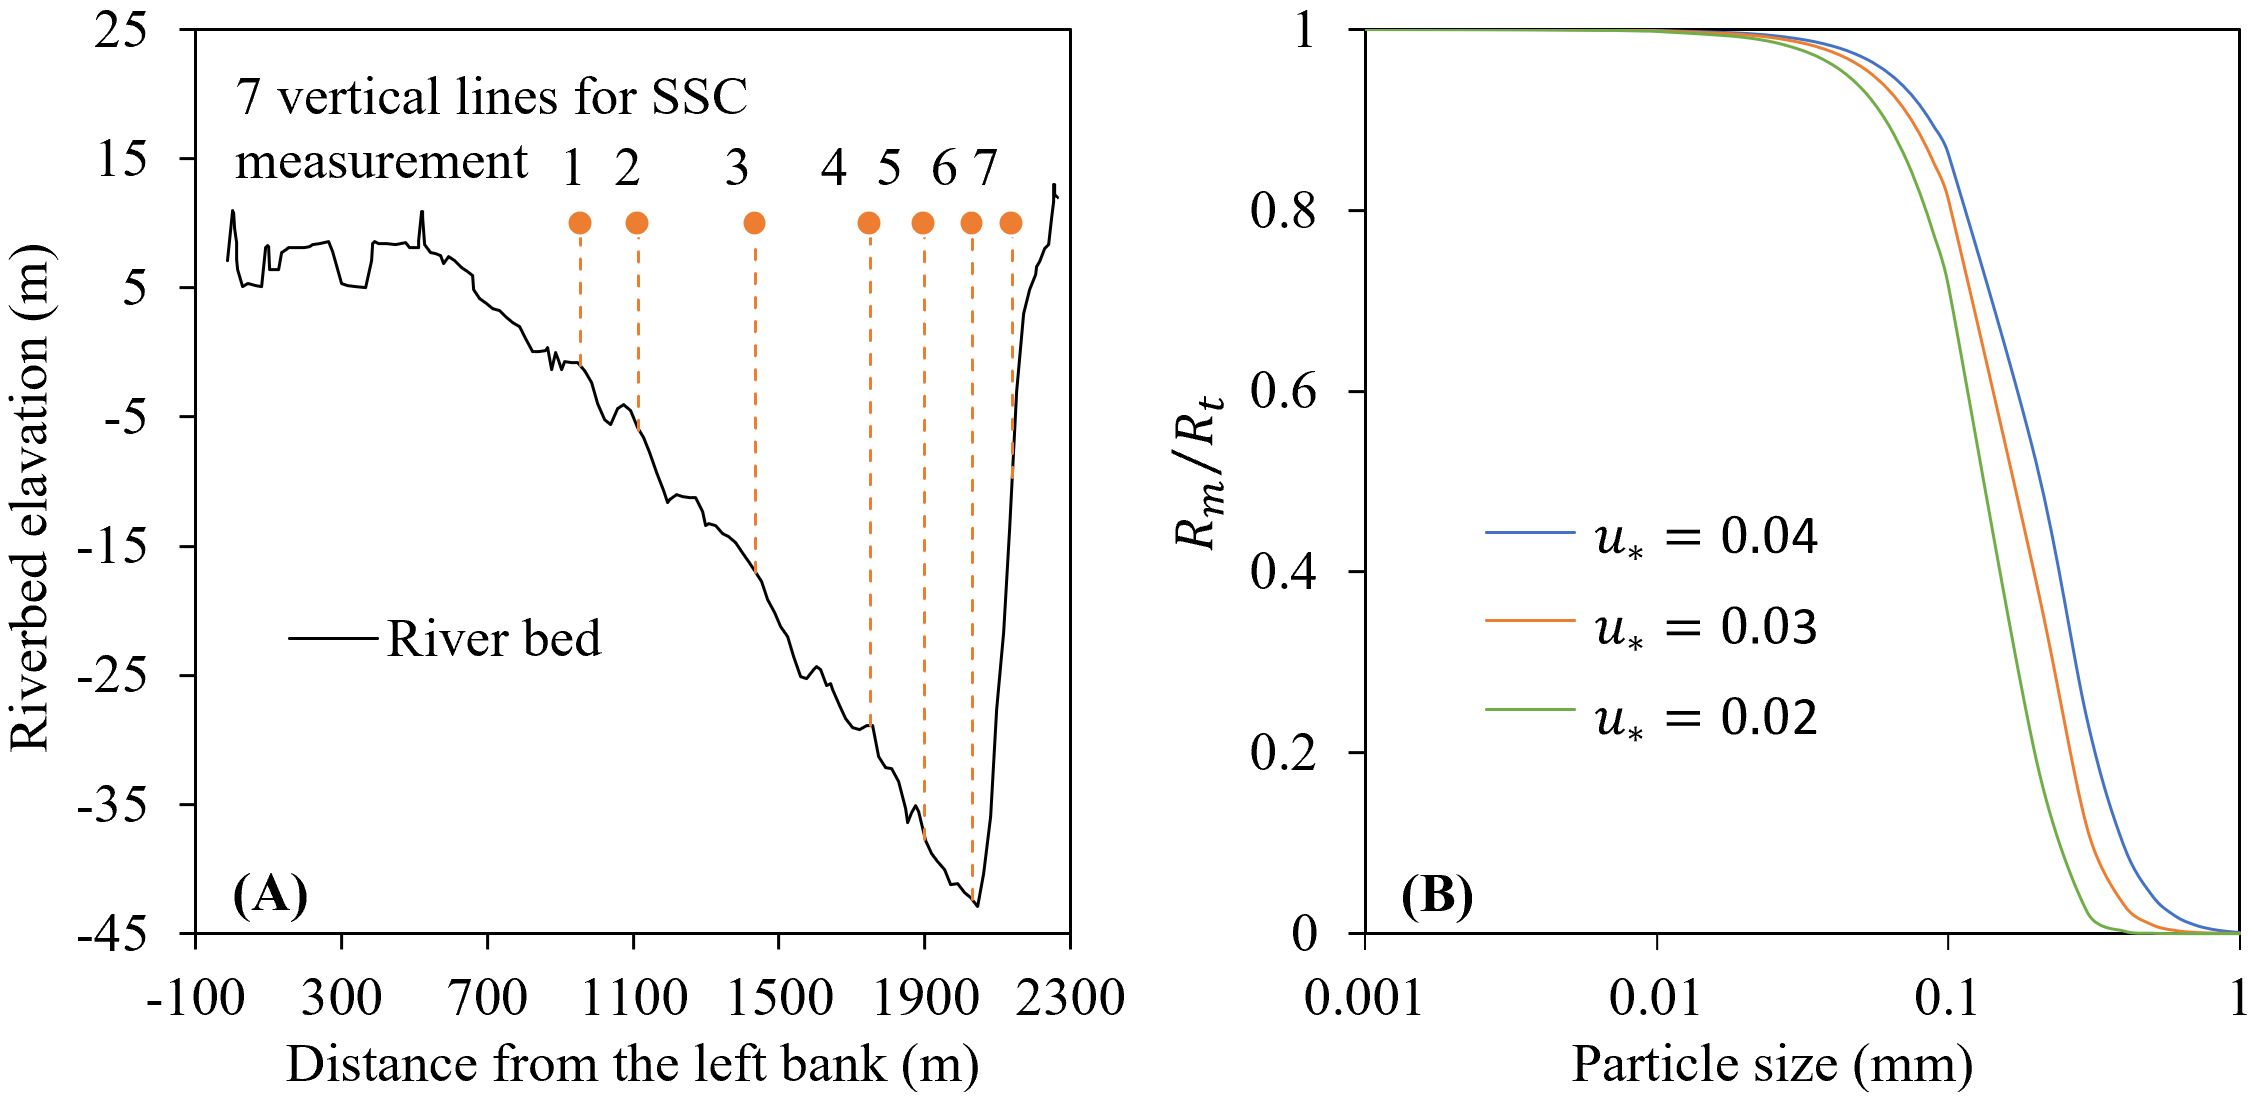
Figure 11. SSC measurement layout at Nanjinge station (A) and comparison of measured SSC results with theoretical value (B).
where is the vertical average SSC; , U0.6, and are the flow velocities at relative water depths of 0.2, 0.6, and 0.8, respectively; and , S0.6, and are the measured SSC. Based on the distribution of cross-sectional Qf, the cross-sectional average SSC can be calculated.
where is the Qf between the left water edge and the first vertical line; Qf i is the Qf between the ith and (i+1)th vertical lines; and Qf n is the Qf between the nth vertical line and the right water edge.
Due to the extremely uneven distribution of SSC along the vertical line, using the weighted average of the measurements from only three points on the vertical line as the average SSC will inevitably result in significant errors in actual measurements. Taking the Ryan formula (Rouse, 1937) used in this study as an example, the relationship between the SSC at any relative water depth and the vertical average SSC along the line is.
where η is the relative water depth. After calculating the SSC at three points using Equation 29, the vertical average SSC can be calculated using Equation 27. A comparison between results of the measured SSC and the theoretical SSC by Equation 29 at the three relative water depths () and the theoretical value (Rt) under different water flow conditions is shown in Figure 11B. It can be seen that when <0.031 mm, the Rm is close to the Rt with a deviation less than 2%. However, as the particle size increases, the gradually deviate from the theoretical values. When the particle size is 0.2 mm, the is only 20% ~ 52% of the theoretical values under different water flow conditions. The measurement error of the seven-line-three-point method for the finer particles was smaller, and the measured SSC therefore reflects the actual conditions more accurately. For coarser sediment, the seven-line-three-point method has a certain measurement error, and the measured value may be smaller than the actual value. Combined with the difficulty in obtaining the value from the water layer near the riverbed, the missed SSC of these particles may be relatively large. Therefore, it is reasonable that the SSC for coarser sediment particles calculated by the proposed model is slightly higher than the measured value.
4.3 Other factors affecting accuracy
Many factors can affect the modeling accuracy. In addition to the proposed SCC formula in this study and the measurements mentioned above, some other parameters, such as ω, α and the SSC vertical distribution formula, will also impact the accuracy of the model.
In this respect, the ω is influenced by factors such as particle characteristics (Dietrich, 1982; Riazi and Türker, 2019), turbulent effects (Kawanisi and Shiozaki, 2008; Ha and Maa, 2010), flocculation (Winterwerp et al., 2002; Manning and Schoellhamer, 2013; Soulsby et al., 2013), SSC (Cheng, 1997; Baldock et al., 2004; You, 2004), tides (Voulgaris and Meyers, 2004), and salinity (Portela et al., 2013). It is difficult to provide a general formula that has wide applicability and is highly accurate. Although this study adopts two formulas, which are distinguished between cohesive and non-cohesive sediment and suitable for the model domain from a practical perspective, the factors considered are not comprehensive enough, and this inevitably affects the model accuracy.
The α is an important parameter in the sediment numerical modeling, and it determines the approaching speed from SSC to SCC. However, depending on different study approaches and models, its value differs significantly. For example, values ranging between 0.016 and 0.095 can be obtained using probability theory (Wang et al., 2003), while values using statistical theory are between 0.01 and 0.1 (Han and Chen, 2008). The calibration results based on the GSTATRS computer model generally have an order of magnitude of 10-3 (Yang, 2010; Ahn and Yang, 2015), while those based on measured data from the Jingjiang reach are between 0.0003 and 0.027 (Li et al., 2021, 2023). The values based on the assumption of sediment suspension height are between 0.01 and 3.00 (Yang et al., 2023a). We used results calibrated based on measured data after the TGR, which may carry a certain degree of empirical impact affecting the model accuracy.
We used two formulas for SSC vertical distribution that distinguished cohesive and non-cohesive sediment to convert the SCC near the riverbed to the vertical average SCC. The SSC vertical distribution is a very complex problem in itself, and plenty of theoretical and empirical formulas have been developed since the Ryan formula. Some studies have attempted to establish a unified formula (Ni and Wang, 1991). In recent years, some formulas based on different theories have emerged, such as the novel power-law theory (Cantero-Chinchilla et al., 2016), Reynolds averaged Navier-Stokes equation and the mass conservation equations (Pal and Ghoshal, 2016), Renyi Entropy and Random Walk Hypothesis (Kumbhakar et al., 2017), gravity theory considering vegetation influence (Li et al., 2020), data mining algorithms (Mehri et al., 2021), diffusion differential equation (Sun et al., 2021), advection-diffusion equation (Quan et al., 2022), the Hausdorff fractal derivative advection-dispersion equation (Liu et al., 2023; Sun et al., 2023), and Shannon entropy (Mohan and Tsai, 2024). Even the vegetation (Liu and Shan, 2022; Shan et al., 2023) and river bends (Konsoer et al., 2023; He et al., 2024), which are widely present in natural rivers can also alter the vertical distribution of flow velocity, thereby affecting ω and the SSC vertical distribution. The use of different formulas will inevitably have different impacts on the model results, and the formulas used in this study differ from the above-mentioned formulas, which will have an impact on the model results.
It can be seen that due to the complexity of sediment transport, many methods are used to calculate its various motion parameters, and it is difficult to find a universal formula that is highly accurate. The selection of different formulas will have an impact on the model accuracy established in this study. The lack of quantification of these impacts is a limitation of this study and in-depth future research is required.
4.4 Improvement of the SCC formula
Equation 24 is based on sediment exchange near the riverbed. To obtain the vertical average SCC, Equations 25 and 26 introduce SSC vertical distribution formulae, which is a difficult problem in sediment movement. In these equations, γ is related to the loose condition of the riverbed surface, which alters along the river reach with its differing composition and particle characteristics. Studies of γ are currently insufficient. Therefore, combined with the uncertainty of the measurements and other parameters mentioned above, it may be difficult for Equations 25 and 26 to accurately describe the actual situation in practical applications of natural rivers. To address this, two empirical parameters, K and M, were introduced to Equations 25 and 26.
The γ can be revised by parameter K to meet different riverbed conditions, and the SSC vertical distribution can be revised by parameter M to compensate for the limitations of previous studies.
Using K and M, the revised total SCC and its grading obtained by Equation 30 are shown in Figure 12. In general, K is used to adjust the total SCC and has little impact on its grading. The M not only affects the total SCC, but it also has a certain impact on its grading. K and M can be calibrated according to measured data for practical applications. Different K and M values can be set for each particle size. In the model validation and application of this study, the values of K and M were 1.0. Based on the measured SSC in the study area and with reference to the research results of Zhang (1998), it is recommended that the K and M values are between 0.1 and 4, and 0.4 and 1.6, respectively.

Figure 12. Influence of K and M on total SCC and its grading: (A) K on total SCC, (B) M on total SCC, (C) K on total grading, and (D) M on total grading.
4.5 Sensitivity of riverbed evolution to sediment reduction and non-uniformity
Following the impoundment of the TGR, the annual sediment discharge at Datong station from 2003 to 2021 decreased by about 69% compared to that before the impoundment (1950-2002) (Xu et al., 2023). At the same time, the particle size of suspended sediment became coarser, with the median particle size increasing from 0.009 mm to 0.012 mm. In the future, with the continuous use of cascade reservoirs in the upper reaches of the Yangtze River, the middle reaches of the Yangtze River will face an erosion situation for hundreds of years due to low-sediment-laden-flow. When the erosion intensity of the middle reaches of the Yangtze River weakens, the supply from the riverbed will decrease, and the SSC at Datong station will be further reduced. At the same time, grading may become coarser. Therefore, to analyze the impact of sediment reduction on riverbed evolution in this study, we assumed that the SSC at Datong station will decrease by 10%, 30%, and 50% respectively compared to 2020.
Figure 13 shows a comparison of the total SSC processes at Nanjinge and Xuliujing stations following the reduced sediment input. It can be seen that as the incoming sediment decreased, the SSC in down streams also decreased. When the input sediment decreased by 10%, 30%, and 50% respectively, the net sediment discharge at the Nanjinge station was reduced by 5%, 14%, and 23% respectively, which is about half of the decreased amplitude of the input sediment. The reduction in Xuliujing was similar to that at Nanjinge station. It is of note that the greater the reduction in the amount of input sediment, the greater the replenishment from the riverbed caused by erosion. After a 10%, 30%, and 50% reduction of input sediment, replenishment of the riverbed from Datong to Xuliujing increased from 0.4964×10⁸ t to 0.5674×10⁸ t, 0.7094×10⁸ t, and 0.8520×10⁸ t, with increase ranges of 14%, 43%, and 72%, respectively, which was greater than the reduced range of input sediment. This indicates that if the SSC in Datong further decreases in the future, erosion of the riverbed below Datong will be even more severe, and the increased amplitude in erosion will be greater than the decrease in SSC.
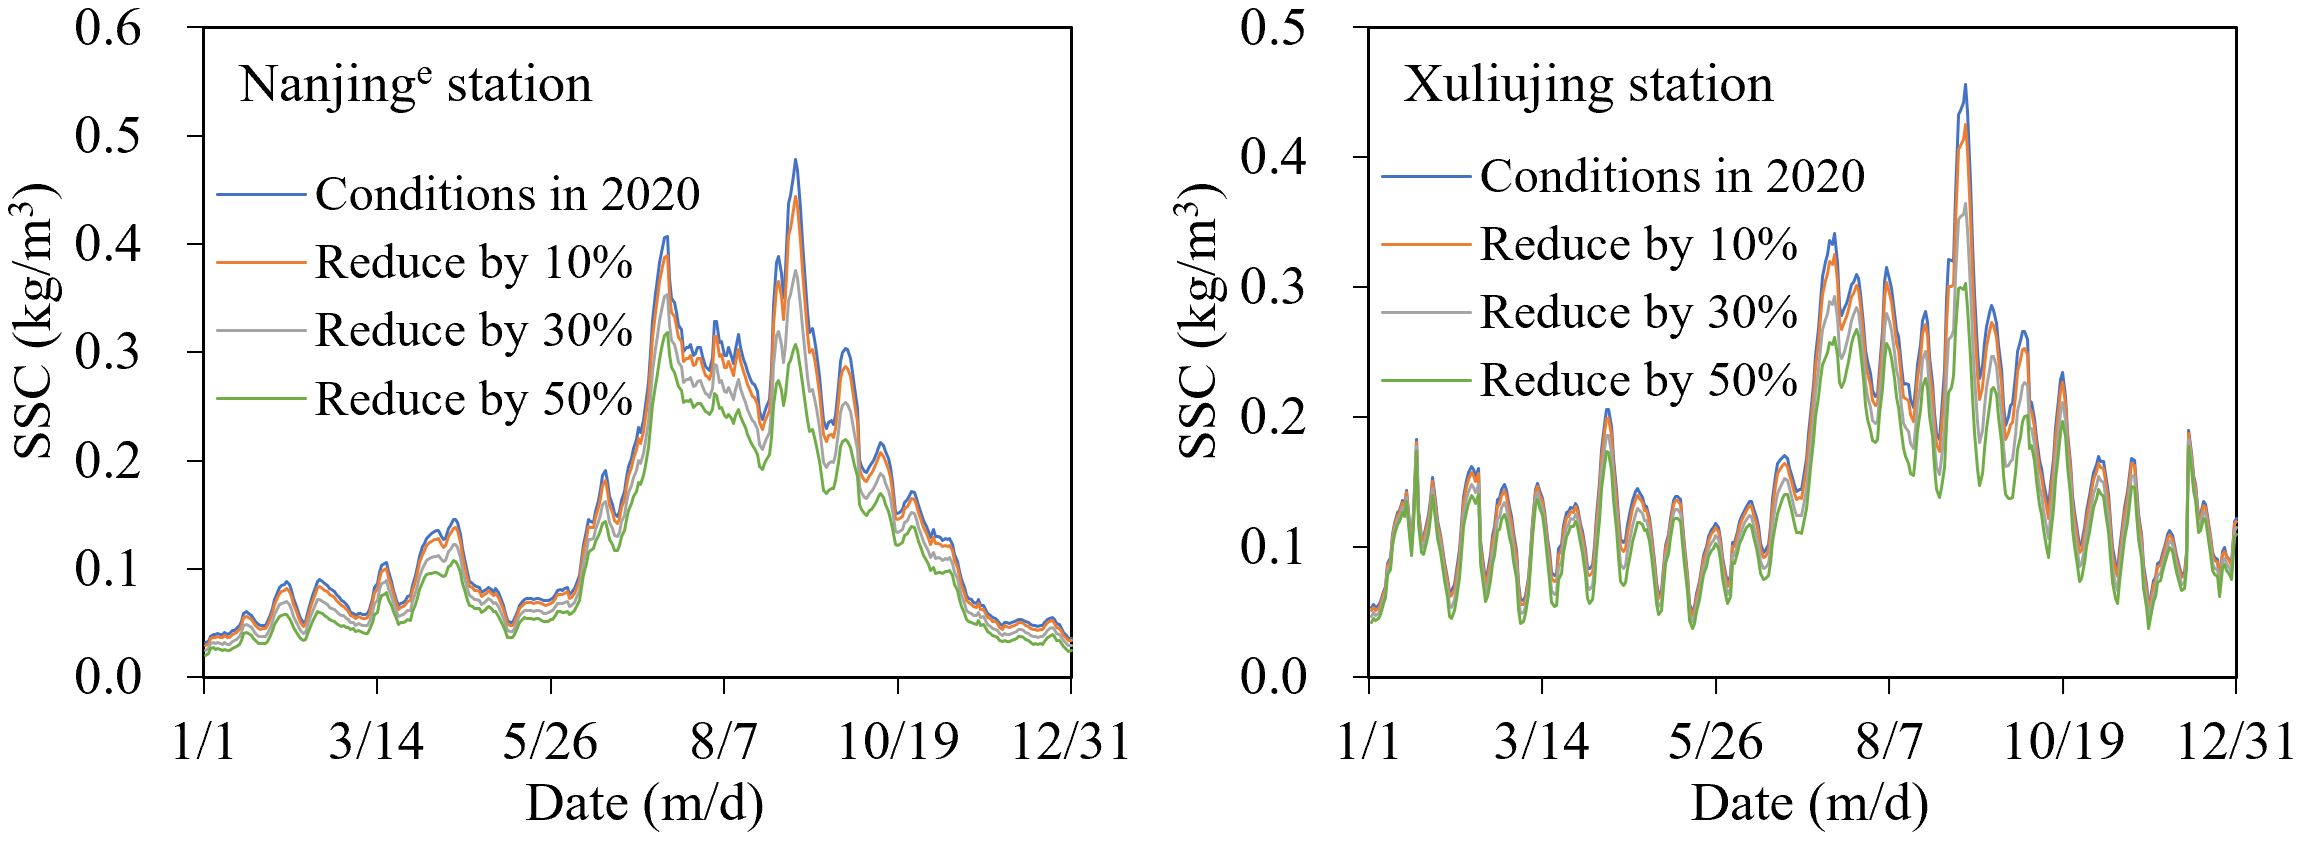
Figure 13. SSC process at Nanjinge and Xuliujing stations after the reduced sediment input.
In addition, assuming that the SSC remained at the level of 2020, the impacts of changes in grading on riverbed evolution were calculated and analyzed. The average grading values from 2003 to 2021 at Datong were taken as the benchmark case. In the other three cases, the SSC for Ds < 0.5 mm decreased by 5%, 10%, and 15% compared to the benchmark case, while that for Ds < 0.25 mm decreased by 10%, 20%, and 30%, respectively, and the median particle size increased from 0.012 mm of the benchmark case to 0.018 mm, 0.030 mm, and 0.061 mm, respectively, as shown in Figure 14A. Figures 14B, C show the total SSC process at Nanjinge and Xuliujing stations under different input sediment grading conditions. It can be seen that when the incoming sediment became coarser, the downstream SSC was reduced. The net sediment discharge at Nanjinge and Xuliujing stations was reduced by about 7%, 14%, and 20% in the three grading cases, respectively. However, unlike the situation of reduced input sediment, the amount replenished from the riverbed was also decreased with the reduction in net sediment transport, by about 24%, 49%, and 73%, respectively, compared to the benchmark grading conditions. The changing law of grading downstream was consistent with that of the input; that is, both developed towards coarsening as shown in Figures 14D, E. The median particle size at the Nanjinge station increased from 0.034 mm in the benchmark case to 0.040 mm, 0.046 mm, and 0.052 mm in the other three grading cases, respectively, while that at Xuliujing increased from 0.019 mm to 0.023 mm, 0.027 mm, and 0.030 mm, respectively. The reason for the above changes relates to the replenishment capacity of the riverbed. In the study area, the riverbed material is mainly composed of sediment particles with a diameter between 0.062 mm and 0.25 mm, as shown in Figure 5D. When the amount of input sediment remains unchanged and the grading becomes coarser, the SSC of coarser sediment particles increases, and their SCC can be achieved by a smaller replenishment amount. However, although the SSC of finer sediment particles decreases due to their limited content in the riverbed, it is difficult to replenish them from the riverbed to achieve the SCC. Therefore, the coarsening of input sediment grading results in a decrease in total riverbed replenishment, which leads to a reduced SSC downstream. As replenishment is still dominated by coarser sediment particles, the grading downstream will become coarser. From this, it is evident that further coarser grading at Datong station in the future will decrease the replenishment of coarser sediment from the riverbed and weaken the erosion intensity of the study area, but still result in coarser sediment entering the sea.
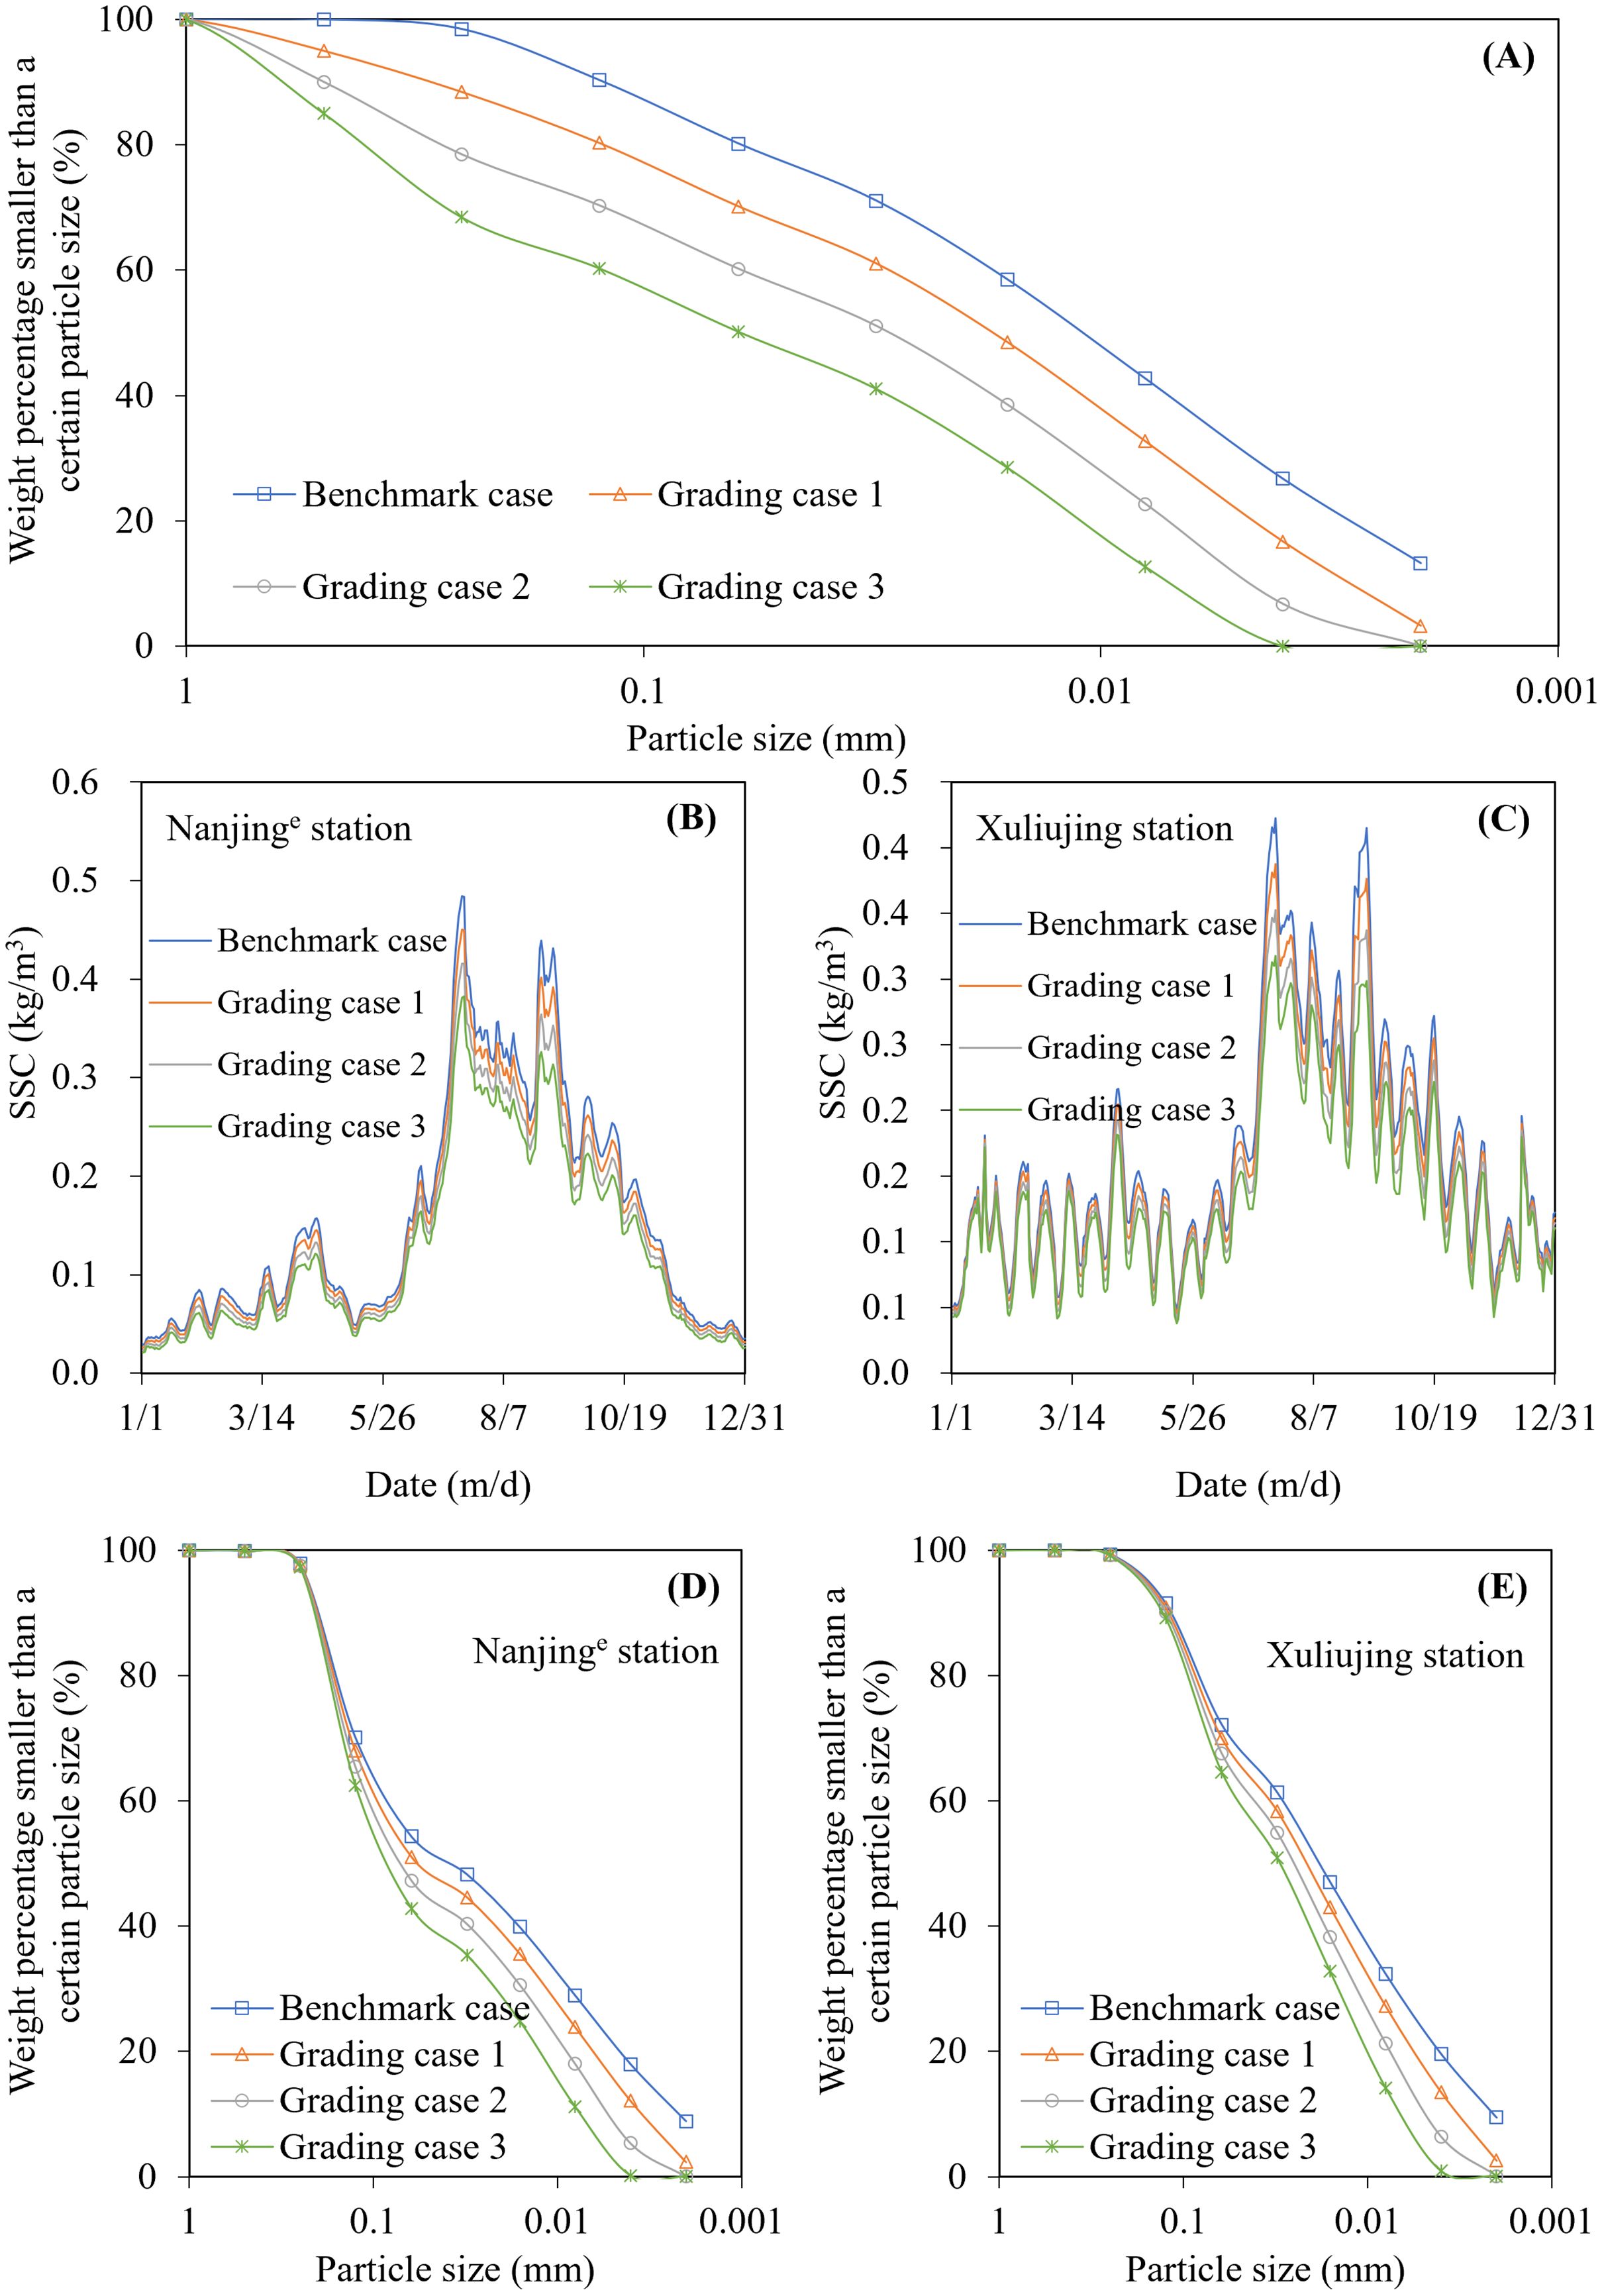
Figure 14. SSC at Nanjinge and Xuliujing stations corresponding to different input SSC grading: (A) generalized of the input SSC grading, (B) SSC process at Nanjinge, (C) SSC process at Xuliujing, (D) SSC grading at Nanjinge and (E) SSC grading at Xuliujing.
5 Conclusions
Based on the statistical theory of sediment transport, we propose a formula for calculating the SCC of non-uniform sediment. The formula was applied to the river network model domain in the tidal section of the LYR to simulate the non-uniform sediment flowing into the YRE. The results indicated that the numerical model established in this study can effectively simulate the motion of tidal currents, and the calculated tidal flow discharge, tidal level, and their phases were consistent with the measured values. The SSC and its process calculated by the model were in strong alignment with the measured values for fine-grained sediments with high measurement accuracy. For coarse-grained sediments with lower measurement accuracy, the calculated values of the model were reasonable and consistent with the riverbed evolution properties obtained in a scoured state. In the future, denser cross-sectional data and more accurate SCC measurements of non-uniform sediments are required to better-validate the model by introduced two empirical parameters. The findings provide support for the simulation of non-uniform sediment entering the YRE in the context of the operation of a large number of cascade reservoirs in the upper Yangtze River and for measuring non-uniform sediment in tidal river sections.
Data availability statement
The original contributions presented in the study are included in the article/supplementary material. Further inquiries can be directed to the corresponding author.
Author contributions
HG: Formal analysis, Funding acquisition, Methodology, Project administration, Software, Writing – original draft. LZ: Conceptualization, Data curation, Investigation, Supervision, Validation, Writing – review & editing. BM: Resources, Visualization, Writing – review & editing.
Funding
The author(s) declare that financial support was received for the research, authorship, and/or publication of this article. This research was funded by the National Key Research and Development Program of China (grant number 2022YFC3202602) and the National Natural Science Foundation of China (grant number U2240224).
Conflict of interest
The authors declare that the research was conducted in the absence of any commercial or financial relationships that could be construed as a potential conflict of interest.
Publisher’s note
All claims expressed in this article are solely those of the authors and do not necessarily represent those of their affiliated organizations, or those of the publisher, the editors and the reviewers. Any product that may be evaluated in this article, or claim that may be made by its manufacturer, is not guaranteed or endorsed by the publisher.
Glossary
A: area of cross-section discharge, m2
Ab: area of riverbed deformation, m2
B: water surface width, m
Dm: average particle diameter of the floc, m
Ds: sediment particle diameter, m
g: gravitational acceleration, m/s2
gd: sediment settling flux, kg/s/m2
gu: sediment rising flux, kg/s/m2
H: water depth, m
K: parameter to adjust the total sediment-carrying capacity
m0: the static compaction coefficient of bed materials with a value of 0.4
M: parameter to adjust the total sediment-carrying capacity and its grading
n: Manning roughness
Pb: sediment content of a certain size particle in bed materials
R: hydraulic radius, m
t: time variables, s
q: interval inflow discharge, m2/s
Qf: flow discharge, m3/s
Qs: sediment discharge, kg/s
S: sediment concentration, kg/m3
S*: sediment-carrying capacity, kg/m3
Sb: sediment concentration near the bottom of riverbed
Rc: ratio of the near-bottom SSC to the surface SSC
u: velocities of the interval inflow, m/s
u*: friction velocity, m/s
U: velocities of the channel flow, m/s
v: viscosity coefficient of water flow, m2/s
Vb,k0: flow velocity near the riverbed when the sediment particles stop moving, m/s
Vb,k1: flow velocity near the riverbed when the sediment particles start moving, m/s
x: spatial variables, m
Zf: water level, m
α: sediment recovery saturation coefficient
β: momentum correction coefficient
γ: probability of suspension
η: relative water depth
ϵ0: probability of not stopping motion
ϵ1: probability of starting
ϵ4: probability of levitation
ρ: density of water, kg/m3
ρs: wet density of sediment particles, kg/m3
π: dry density of sediment particles, kg/m3
π: ratio of the circumference
Ω: sediment settling velocity, m/s
References
Ahn J., Yang C. (2015). Determination of recovery factor for simulation of non-equilibrium sedimentation in reservoir. Int. J. Sediment Res. 30, 68–73. doi: 10.1016/S1001-6279(15)60007-5
Baldock T. E., Tomkins M. R., Nielsen P., Hughes M. G. (2004). Settling velocity of sediments at high concentrations. Coast. Eng. 51, 91–100. doi: 10.1016/j.coastaleng.2003.12.004
Cantero-Chinchilla F. N., Castro-Orgaz O., Dey S. (2016). Distribution of suspended sediment concentration in wide sediment-laden streams: A novel power-law theory. Sedimentology 63, 1620–1633. doi: 10.1111/sed.12276
Cao Z., Li Y. (2004). Numerical simulation of sediment transport in unsteady flow of river networks in flood plains. J. Sediment Res. 03), 14–21. doi: 10.16239/j.cnki.0468-155x.2004.03.002
Carriquiry J. D., Sánchez A., Camacho-Ibar V. F. (2001). Sedimentation in the northern Gulf of California after cessation of the Colorado River discharge. Sedimentary Geology 144, 37–62. doi: 10.1016/S0037-0738(01)00134-8
Chen S., Gu S., Ji H., Xu C. (2019). Processes of the Yellow River Mouth on new water and sediment condition. J. Sediment Res. 44, 7. doi: 10.16239/j.cnki.0468-155x.2019.05.010
Chen Y., Li J., Wu Z., Pan S. (2016). Dynamic analysis of riverbed evolution: Chengtong Reach of Yangtze Estuary. J. Coast. Res. 75, 203–207. doi: 10.2112/si75-041.1
Chen Q., Meng Y., Zhou J., Ding P. (2005). A review on flocculation of fine suspended sediments and its controlling factors in the Yangtze River estuary. Ocean Eng. 23, 74–82. doi: 10.16483/j.issn.1005-9865.2005.01.012
Chen Y., Sheng H., Xu Q., Qu Y., Xing F., Li Z., et al. (2021). Analysis of sediment grain size change and its response to erosion and deposition pattern within the Yangtze River Estuary for the past 40 years. Hydro-Science Eng. 5), 8–18. doi: 10.12170/20210628002
Cheng N. (1997). Effect of concentration on settling velocity of sediment particles. J. Hydraulic Eng. 123, 728–731. doi: 10.1061/(ASCE)0733-9429(1997)123:8(728
Cheng P., Liu J., Zhang X., Fan D. (2023). Changes of sedimentation rates in the yangtze river subaqueous delta and its adjacent inner continental shelf before and after the construction of the three gorges dam. Periodical Ocean Univ. China 53, 77–87. doi: 10.16441/j.cnki.hdxb.20220139
Coleman J. M., Roberts H. H., Stone G. W. (1998). Mississippi River delta: an overview. J. Coast. Res. 14, 698–716. Available at: https://www.jstor.org/stable/4298830.
Dai Z. J., Fagherazzi S., Mei X. F., Gao J. J. (2016). Decline in suspended sediment concentration delivered by the Changjiang (Yangtze) River into the East China Sea between 1956 and 2013. Geomorphology 268, 123–132. doi: 10.1016/j.geomorph.2016.06.009
Dai S., Yang S., Gao A., Liu Z., Li P. (2007). Trend of sediment flux of main rivers in China in the past 50 years. J. Sediment Res. 02), 49–58. doi: 10.16239/j.cnki.0468-155x.2007.02.008
Deal E., Venditti J. G., Benavides S. J., Bradley R., Zhang Q., Kamrin K., et al. (2023). Grain shape effects in bed load sediment transport. Nature 613, 298–302. doi: 10.1038/s41586-022-05564-6
Deng B., Wu H., Yang S., Zhang J. (2017). Longshore suspended sediment transport and its implications for submarine erosion off the Yangtze River Estuary. Estuar. Coast. Shelf Sci. 190, 1–10. doi: 10.1016/j.ecss.2017.03.015
Dietrich W. E. (1982). Settling velocity of natural particles. Water Resour. Res. 18, 1615–1626. doi: 10.1029/WR018i006p01615
Ding L., Jiao J., Tong C., Wang Y., Chen B., Sun J., et al. (2023). Study on volume variation and stability of riverbed in the yangtze estuary. China Ocean Eng. 37, 433–446. doi: 10.1007/s13344-023-0036-0
Dou X. P., Zhang Z. L., Gao X. Y., Zhang X. Z., Ding L., Jiao J. (2019). “Analysis on Changes of Current, Sediment and Riverbed Evolution in Yangtze Estuary for the Past 20 Years,” in APAC 2019. Eds. Trung Viet N., Xiping D., Thanh Tung T. (Berlin, German: Springer Singapore), 641–647.
Du J., Yang S., Chen D. (2012). Preliminary study on the effect of Three Gorges Reservoir on the evolution of landform of the Yangtze Estuary delta. Mar. pollut. Bull. 31, 7. Available at: https://kns.cnki.net/kcms2/article/abstract?v=nouGVBS_tgect42zi075hEsxYYKJagzsWfzfFQ0k6AGQI8grTDuEm9-9WxZLACI1GCc75Pc7lbrCyqReg01If4gUuoROwl73goNNF20KjsPiC4ubrHdLIg==&uniplatform=NZKPT.
Du J., Yang S., Chen G. (2013). Influence of human activities on the evolution of the tidal flat of Yangtze River delta front during the last 30 years. Mar. Sci. Bull. 32, 296–302. Available at: https://kns.cnki.net/kcms2/article/abstract?v=nouGVBS_tgc3BuIBlJItuE9I48W-0vJhuItMKCdXvOvgRdxfe3vXDnPPrDz4IG7j5p8vFdkpHHZFPTKWls6wPQSxVNolxBDEVdecDZeraBPOMV2VjfVMLM_fmsPNFJnxyiCANuCtqSQ=&uniplatform=NZKPT&language=CHS.
Du J., Yang S., Feng H. (2016). Recent human impacts on the morphological evolution of the Yangtze River delta foreland: A review and new perspectives. Estuarine Coast. Shelf Sci. 181, 160–169. doi: 10.1016/j.ecss.2016.08.025
Fan J., Yang J., Cheng F., Zhang S. (2023). The source, distribution, and environmental effects of suspended particulate matter in the yangtze river system. Water 15. doi: 10.3390/w15193429
Frihy O. E., Debes E. A., El Sayed W. R. (2003). Processes reshaping the Nile delta promontories of Egypt: pre- and post-protection. Geomorphology 53, 263–279. doi: 10.1016/S0169-555X(02)00318-5
Ge H., Zhu L. (2023). Extreme flood levels during the operation of cascade reservoirs: A case study of the lower yangtze river in 2020. Water 15, 851. doi: 10.3390/w15050851
Ge H., Zhu L., Zhang X. (2012). “A new method to calculate mixed-layer thickness based on sand wave movement,” in 2012 International Conference on Civil, Architectural and Hydraulic Engineering, ICCAHE 2012, August 10, 2012 - August 12, 2012. 33–39 (Durnten-Zurich, Switzerland: Trans Tech Publications).
Ge H., Zhu L., Zhang X. (2011). Analysis of nonuniform sediment recovery coefficient downstream from reservoir. Eng. J. Wuhan Univ. 44, 711–714+764.
Gladkov G., Habel M., Babiński Z., Belyakov P. (2021). Sediment transport and water flow resistance in alluvial river channels: modified model of transport of non-uniform grain-size sediments. Water 13, 2038. doi: 10.3390/w13152038
Gong P., Yang W. (2009). Preliminary study of river-lake evolution effect due to Three Gorges project. Part 1.Numerical modeling and verification of sediment transport in large-scale river networks. J. Hydroelectric Eng. 28, 112–119,125. Available at: https://kns.cnki.net/kcms2/article/abstract?v=nouGVBS_tgfcYQBwrNOHXLOIzoFKtqsOa1N9mcpyCvinV_9TEk2buNGEL76uTNvEyTGOjToETdATha5C0TQmZ-67-xUIGRkZo2WRaO_tnfHtMnIgLC2xQ8D_mUOXfmrM&uniplatform=NZKPT&flag=copy.
Gu F., Guo H. (2020). A review on the three-dimensional numerical model of flow,sediment and salinity and the movement mechanism in Yangtze estuary. Ocean Eng. 38, 37–45. doi: 10.16483/j.issn.1005-9865.2020.04.005
Ha H. K., Maa J. P. Y. (2010). Effects of suspended sediment concentration and turbulence on settling velocity of cohesive sediment. Geosciences J. 14, 163–171. doi: 10.1007/s12303-010-0016-2
Han Q., Chen X. (2008). Theoretical method for calculating the saturation recovery coefficient. J. Sediment Res. 6), 8–16. doi: 10.3321/j.issn:0468-155X.2008.06.002
Han Q., He M. (1997). 2-D nonequilibrium transportation equation of nonuniform suspended load and its boundary condition. SHUILI XUEBAO 1), 1–10. doi: 10.13243/j.cnki.slxb.1997.01.002
He X., Yu M., Liu Y. (2024). Effect of the transition section on the flow structure of consecutive river bends with point bars. Adv. Water Resour. 185, 104640. doi: 10.1016/j.advwatres.2024.104640
Holly F. M., Preissmann A. (1977). Accurate calculation of transport in two dimensions. J. Hydraulics Division 103, 1259–1277. doi: 10.1061/JYCEAJ.0004870
Houssais M., Lajeunesse E. (2012). Bedload transport of a bimodal sediment bed. J. Geophysical Research: Earth Surface 117. doi: 10.1029/2012JF002490
Hu P., Tao J., Ji A., Li W., He Z. (2021). A computationally efficient shallow water model for mixed cohesive and non-cohesive sediment transport in the yangtze estuary. Water 13. doi: 10.3390/w13101435
Jiao J., Yang X., Ding L., Huang Y., Wang Y. (2021). Study on the response law of the riverbed volume of the South Branch of the Yangtze Estuary to the change of discharge and sediment load. Ocean Eng. 39, 119–125. doi: 10.16483/j.issn.1005-9865.2021.06.013
Jing Y., Zhang J., Zhang Q., Maa J. P. Y. (2024). Experimental study on the effects of sediment size gradation and suspended sediment concentration on the settling velocity, ws. Powder Technol. 437, 119541. doi: 10.1016/j.powtec.2024.119541
Kawanisi K., Shiozaki R. (2008). Turbulent effects on the settling velocity of suspended sediment. J. Hydraulic Eng. 134, 261–266. doi: 10.1061/(ASCE)0733-9429(2008)134:2(261
Konsoer K., Rowley T., Rhoads B. (2023). The role of bed morphology and channel curvature on the redistribution of momentum in a series of meander bends, pearl river, USA. Water Resour. Res. 59, e2023WR034804. doi: 10.1029/2023WR034804
Kuang C., Chen W., Gu J., He L. (2014). Comprehensive analysis on the sediment siltation in the upper reach of the deepwater navigation channel in the Yangtze Estuary. J. Hydrodynamics 26, 299–308. doi: 10.1016/s1001-6058(14)60033-0
Kuang C., Liu X., Gu J., Guo Y., Huang S., Liu S., et al. (2013). Numerical prediction of medium-term tidal flat evolution in the Yangtze Estuary: Impacts of the Three Gorges project. Continental Shelf Res. 52, 12–26. doi: 10.1016/j.csr.2012.10.006
Kumbhakar M., Ghoshal K., Singh V. P. (2017). Renyi entropy and random walk hypothesis to study suspended sediment concentration. J. Hydrologic Eng. 22, 15. doi: 10.1061/(asce)he.1943-5584.0001546
Li Y. (1997). A junctions group method for unsteady flow in multiply connected networks. SHUILI XUEBAO 03), 50–58. doi: 10.13243/j.cnki.slxb.1997.03.008
Li T., Li S. (2012). Numerical simulation of hydrodynamics and sediment transport in tidal pearl river of guangzhou. Acta Scientiarum Naturalium Universitatis Sunyatseni 51, 14–20.
Li Y., Li Z., Zhang Z., Wang Z., Yoa H. (2017b). Vertical distribution patterns of suspended sediment concentration in the North Passage of the Changjiang Estuary. J. East China Normal University(Natural Science) 6), 114–125. doi: 10.3969/j.issn.1000-5641.2017.06.011
Li X., Liu J. P., Saito Y., Nguyen V. L. (2017a). Recent evolution of the Mekong Delta and the impacts of dams. Earth-Science Rev. 175, 1–17. doi: 10.1016/j.earscirev.2017.10.008
Li L., Xia J., Deng S., Zhou M., Li Z. (2021). Saturation recovery coefficient of nonuniform suspended sediment in the Jingjiang reach of the Middle Yangtze River. Adv. Water Sci. 32, 727–737. doi: 10.14042/j.cnki.32.1309.2021.05.008
Li L., Xia J., Zhou M., Deng S., Li Z. (2023). A new formula of recovery factor for non-equilibrium transport of graded suspended sediment in the Middle Yangtze River. J. Mountain Sci. 20, 87–100. doi: 10.1007/s11629-022-7359-9
Li D., Yang Z. H., Zhu Z. T., Guo M., Gao W., Sun Z. H. (2020). Estimating the distribution of suspended sediment concentration in submerged vegetation flow based on gravitational theory. J. Hydrology 587, 12. doi: 10.1016/j.jhydrol.2020.124921
Liu M., Chen D., Sun H. G., Zhang F. (2023). Vertical distribution of suspended sediment concentration in the unsaturated jingjiang reach, Yangtze river, China. Fractal Fractional 7, 13. doi: 10.3390/fractalfract7060456
Liu J., Chen J., Xu Z. (2008). River-bed evolution in the braided reach of the south and north passage after implementing Yangtze estuary deepwater navigational improvements. Adv. Water Sci. 19, 605–612. doi: 10.3321/j.issn:1001-6791.2008.05.001
Liu H., He Q., Wang Y., Chen J. (2012). Processes of suspended sediment mixture in the yangtze river estuary. Acta Geographica Sin. 67, 1269–1281. doi: 10.11821/xb201209011
Liu C., Shan Y. (2022). Impact of an emergent model vegetation patch on flow adjustment and velocity. Proc. Institution Civil Engineers - Water Manage. 175, 55–66. doi: 10.1680/jwama.20.00108
Liu F., Yang Q., Chen S., Luo Z., Yuan F., Wang R. (2014). Temporal and spatial variability of sediment flux into the sea from the three largest rivers in China. J. Asian Earth Sci. 87, 102–115. doi: 10.1016/j.jseaes.2014.02.017
Luan K., Li H., Pan Y., Wang Z., Xu H., Zhu W., et al. (2023). Characterization of suspended sand concentrations in the Yangtze River Estuary and adjacent waters. Front. Mar. Sci. 10. doi: 10.3389/fmars.2023.1178862
Luo X. X., Yang S. L., Zhang J. (2012). The impact of the Three Gorges Dam on the downstream distribution and texture of sediments along the middle and lower Yangtze River (Changjiang) and its estuary, and subsequent sediment dispersal in the East China Sea. Geomorphology 179, 126–140. doi: 10.1016/j.geomorph.2012.05.034
Manning A. J., Schoellhamer D. H. (2013). Factors controlling floc settling velocity along a longitudinal estuarine transect. Mar. Geology 345, 266–280. doi: 10.1016/j.margeo.2013.06.018
Mehri Y., Nasrabadi M., Omid M. H. (2021). Prediction of suspended sediment distributions using data mining algorithms. Ain Shams Eng. J. 12, 3439–3450. doi: 10.1016/j.asej.2021.02.034
Mei X. F., Dai Z. J., Wei W., Li W. H., Wang J., Sheng H. (2018). Secular bathymetric variations of the North Channel in the Changjiang (Yangtze) Estuary, China 1880-2013: Causes and effects. Geomorphology 303, 30–40. doi: 10.1016/j.geomorph.2017.11.014
Mikkelsen O., Pejrup M. (2001). The use of a LISST-100 laser particle sizer for in-situ estimates of floc size, density and settling velocity. Geo-Marine Lett. 20, 187–195. doi: 10.1007/s003670100064
Mohan S., Tsai C. W. (2024). Derivation of vertical concentration profile for nonuniform sediment in suspension using Shannon entropy. Chaos Solitons Fractals 178, 13. doi: 10.1016/j.chaos.2023.114313
Murray N. J., Phinn S. R., DeWitt M., Ferrari R., Johnston R., Lyons M. B., et al. (2019). The global distribution and trajectory of tidal flats. Nature 565, 222–22+. doi: 10.1038/s41586-018-0805-8
Ni J. R., Wang G. Q. (1991). Vertical sediment distribution. J. Hydraulic Engineering-Asce 117, 1184–1194. doi: 10.1061/(asce)0733-9429(1991)117:9(1184
Pal D., Ghoshal K. (2016). Vertical distribution of fluid velocity and suspended sediment in open channel turbulent flow. Fluid Dynamics Res. 48, 27. doi: 10.1088/0169-5983/48/3/035501
Panin N., Jipa D. (2002). Danube river sediment input and its interaction with the north-western black sea. Estuarine Coast. Shelf Sci. 54, 12. doi: 10.1006/ecss.2000.0664
Peng D., Lyu J., Song Z., Huang S., Zhang P., Gao J., et al. (2023). Mercury budgets in the suspended particulate matters of the Yangtze River. Water Res. 243. doi: 10.1016/j.watres.2023.120390
Portela L. I., Ramos S., Teixeira A. T. (2013). Effect of salinity on the settling velocity of fine sediments of a harbour basin. J. Coast. Res. 65, 1188–1193. doi: 10.2112/si65-201.1
Quan X. F., Li R. J., Li Y. T., Luo F., Fu X. Y., Gou H. (2022). The influence of vertical velocity distribution on the calculation of suspended sediment concentration. Discrete Dynamics Nat. Soc. 2022, 15. doi: 10.1155/2022/6455999
Riazi A., Türker U. (2019). The drag coefficient and settling velocity of natural sediment particles. Comput. Particle Mechanics 6, 427–437. doi: 10.1007/s40571-019-00223-6
Rouse H. (1937). Modern conceptions of the mechanics of fluid turbulence. Trans. Am. Soc. Civil Engineers 102, 463–505. doi: 10.1061/TACEAT.0004872
Shan Y., Yan C., Liu J., Liu C. (2023). Predicting velocity and turbulent kinetic energy inside an emergent Phragmites australis canopy with real morphology. Environ. Fluid Mechanics 23, 943–963. doi: 10.1007/s10652-023-09942-0
Shi Y., Luan Z., Hu S. (2005). Numerical modeling of flow-sediment transport in the middle-lower reach of the Yangtze River. Adv. Water Sci. 16, 840–848. doi: 10.3321/j.issn:1001-6791.2005.06.015
Soulsby R. L., Manning A. J., Spearman J., Whitehouse R. J. S. (2013). Settling velocity and mass settling flux of flocculated estuarine sediments. Mar. Geology 339, 1–12. doi: 10.1016/j.margeo.2013.04.006
Sun Z., Chen Z., Gao H., Wang M. (2022). Study on tidal boundary conditions in 1-D numerical modeling of hydrodynamic and sediment transport in Datong to Xuliujing reach of the Yangtze River. J. Sediment Res. 47, 38–45. doi: 10.16239/j.cnki.0468-155x.2022.04.006
Sun Z., Chen F., Guo X. (2007). One-dimension numerical simulation of flow and sediment in estuary reach of the Yangtze River. Hydro-science Eng. 3), 44–50. doi: 10.3969/j.issn.1009-640X.2007.03.008
Sun Z., Li Y., Cao Z. (2004). Numerical simulation of sediment transport in unsteady flow of river network. Adv. Water Sci. 02), 165–172. doi: 10.3321/j.issn:1001-6791.2004.02.007
Sun X., Li C., Kuiper K. F., Zhang Z., Gao J., Wijbrans J. R. (2016). Human impact on erosion patterns and sediment transport in the Yangtze River. Global Planetary Change 143, 88–99. doi: 10.1016/j.gloplacha.2016.06.004
Sun H. G., Nie S. Q., Packman A. I., Zhang Y., Chen D., Lu C. P., et al. (2023). Application of Hausdorff fractal derivative to the determination of the vertical sediment concentration distribution. Int. J. Sediment Res. 38, 12–23. doi: 10.1016/j.ijsrc.2022.07.007
Sun Z. L., Zheng H. L., Xu D., Hu C. H., Zhang C. F. (2021). Vertical concentration profile of nonuniform sediment. Int. J. Sediment Res. 36, 120–126. doi: 10.1016/j.ijsrc.2020.06.008
Tan G., Fang H., Dey S., Wu W. (2018). Rui-jin zhang’s research on sediment transport. J. Hydraulic Eng. 144, 02518002. doi: 10.1061/(ASCE)HY.1943-7900.0001464
Tang M., Cheng H., Xu Y., Hu H., Zheng S., Wang B., et al. (2022). Channel bed adjustment of the lowermost yangtze river estuary from 1983 to 2018: causes and implications. Water 14, 4135. doi: 10.3390/w14244135
Voulgaris G., Meyers S. T. (2004). Temporal variability of hydrodynamics, sediment concentration and sediment settling velocity in a tidal creek. Continental Shelf Res. 24, 1659–1683. doi: 10.1016/j.csr.2004.05.006
Wang X., Cao R., Shen J. (2003). Investigation on coefficient of saturation recovery of non-uniform suspended load. J. Hydraulic Eng. 3), 120–124,128. doi: 10.3321/j.issn:0559-9350.2003.03.022
Wang J., Chu A., Dai Z., Nienhuis J. (2024). Delft3D model-based estuarine suspended sediment budget with morphodynamic changes of the channel-shoal complex in a mega fluvial-tidal delta. Eng. Appl. Comput. Fluid Mechanics 18. doi: 10.1080/19942060.2023.2300763
Wang S., Jiang X., He Q. (2017). Flocculation characteristics of fine sediment in the surface water of the Yangtze Estuary. J. Sediment Res. 42, 47–53. doi: 10.16239/j.cnki.0468-155x.2017.02.008
Wang X., Zhang W., Tong C., Lei Z., Qin J., Ji X., et al. (2023). Exploration of the mechanisms for the low sensitivity of deposition flux to upstream sediment reduction in the north passage, yangtze estuary. China Ocean Eng. 37, 533–546. doi: 10.1007/s13344-023-0045-z
Wang L., Zhou Y. (2018). Driving factors analysis on evolution of water and sediment at datong station. J. Jilin Univ. (Earth Sci. Edition) 48, 8. doi: 10.13278/j.cnki.jjuese.20160365
Wei W., Dai Z. J., Mei X. F., Liu J. P., Gao S., Li S. S. (2017). Shoal morphodynamics of the Changjiang (Yangtze) estuary: Influences from river damming, estuarine hydraulic engineering and reclamation projects. Mar. Geology 386, 32–43. doi: 10.1016/j.margeo.2017.02.013
Wei X., Heqin C., Shuwei Z., Yuehua J., Quanping Z., Guoqiang Y., et al. (2022). Riverbed deformation and its response to human intervention on the lower reaches of the Yangtze River. River Res. Appl. 38, 222–234. doi: 10.1002/rra.3899
Wen L., Song J., Dai J., Li X., Ma J., Yuan H., et al. (2024). Nutrient characteristics driven by multiple factors in large estuaries during summer: A case study of the Yangtze River Estuary. Mar. pollut. Bull. 201, 116241–116241. doi: 10.1016/j.marpolbul.2024.116241
Whitehouse R., Soulsby R., Roberts W., Mitchener H. (2020). “5. Suspension of mud in the water column,” in Dynamics of estuarine muds. Eds. Whitehouse R., Soulsby R., Roberts W., Mitchener H. (London, England: ICE Publishing), 75–101.
Winterwerp J. C., Bale A. J., Christie M. C., Dyer K. R., Jones S., Lintern D. G., et al. (2002). “Flocculation and settling velocity of fine sediment,” in Proceedings in Marine Science. Eds. Winterwerp J. C., Kranenburg C. (Amsterdam, Netherlands: Elsevier), 25–40.
Wu S., Cheng H., Xu Y. J., Li J., Zheng S., Xu W. (2016). Riverbed micromorphology of the yangtze river estuary, China. Water 8, 190. doi: 10.3390/w8050190
Wu W., Li Y. (1993). The study of nonuniform sediment transport capacity. J. Sediment Res. 4), 81–88. doi: 10.16239/j.cnki.0468-155x.1993.04.013
Wu G., Wang K., Liang B., Wu X., Wang H., Li H., et al. (2023). Modeling the morphological responses of the yellow river delta to the water-sediment regulation scheme: the role of impulsive river floods and density-driven flows. Water Resour. Res. 59, e2022WR033003. doi: 10.1029/2022WR033003
Xu Q., Dong B., Yuan J., Zhu L. (2023). Scouring effect of the middle and lower reaches of the Yangtze River and its impact after the impoundment of the Three Gorges Project. J. Lake Sci. 35, 650–661. doi: 10.18307/2023.0221
Xu Q., Li S., Yuan J., Yang C. (2021). Analysis of equilibrium sediment transport in the middle and lower reaches of the Yangtze River after the impoundment of the Three Gorges Reservoir. J. Lake Sci. 33, 806–818. doi: 10.18307/2021.0316
Xu H., Xia Y. F., Wen Y. C. (2019) “Study on Characteristics of River Evolution of Chengtong Reach in the Lower Reach of the Yangtze River Before and After Operation of the Three Gorges Project,” in APAC 2019. Eds. Trung Viet N., Xiping D., Thanh Tung T. (Berlin, German: Springer Singapore), 745–749.
Yang C. T. (2010). Recovery factor for non-equilibrium sedimentation processes. J. Hydraulic Res. 48, 409–413. doi: 10.1080/00221686.2010.481842
Yang Y., Li Y., Fan Y. (2014). Relationship between sediment elements of river basin and front sand islands evolution in Yangtze Estuary. Resour. Environ. Yangtze Basin 23, 652–658. Available at: https://kns.cnki.net/kcms2/article/abstract?v=nouGVBS_tgfj2lsEjsXC9TtMZOFocE52AQdmyFI5rWO5zZkfVz6svQZltwtlylPXgInumm_pStyj2uK9ByRdiy1xyM0v0nLLTOLnM_xZKkymG5Uh6VQpmarD6wD3viflM4HE6RzE22s=&uniplatform=NZKPT&language=CHS.
Yang S. L., Milliman J. D., Li P., Xu K. (2011). 50,000 dams later: Erosion of the Yangtze River and its delta. Global Planetary Change 75, 14–20. doi: 10.1016/j.gloplacha.2010.09.006
Yang S. L., Xu K. H., Milliman J. D., Yang H. F., Wu C. S. (2015). Decline of Yangtze River water and sediment discharge: Impact from natural and anthropogenic changes. Sci. Rep. 5. doi: 10.1038/srep12581
Yang Y., Zhang M., Fan Y., Li Y., Liu W. (2016). Variation trend and causes of suspended sediment characteristic in yangtze estuary. J. Basic Sci. Eng. 24, 1203–1218. doi: 10.16058/j.issn.1005-0930.2016.06.012
Yang Y., Zhang G., Xu X. (2023a). Study on the saturation recovery coefficient of suspended sediment based on the hypothesis of suspension height. J. Water Resour. Architectural Eng. 21, 30–36,104. doi: 10.3969/j.issn.1672-1144.2023.03.005
Yang S. L., Zhang J., Zhu J., Smith J. P., Dai S. B., Gao A., et al. (2005). Impact of dams on Yangtze River sediment supply to the sea and delta intertidal wetland response. J. Geophysical Research-Earth Surface 110. doi: 10.1029/2004jf000271
Yang Y., Zheng J., Zhang M., Wang J., Chai Y. (2024). Impacts of human activities on the riverbed morphological in the tidal reaches of the Yangtze River. J. Hydrology 630. doi: 10.1016/j.jhydrol.2024.130735
Yang Y., Zheng J., Zhang M., Zhu L. (2023b). Sediment sink-source transitions in the middle and lower reaches of the Yangtze River estuary. Front. Mar. Sci. 10. doi: 10.3389/fmars.2023.1201533
You Z.-J. (2004). The effect of suspended sediment concentration on the settling velocity of cohesive sediment in quiescent water. Ocean Eng. 31, 1955–1965. doi: 10.1016/j.oceaneng.2004.05.005
Yu W., Zhang Z. (2021). Evolution trend of basic channel scour and morphological adjustment in yangtze river estuary from 2002 to 2018. J. Yangtze River Sci. Res. Institute 38, 1–8,13. doi: 10.11988/ckyyb.20201057
Zeng Y., Wang H., Liang D., Yuan W., Yan Y., Shen Z. (2023). Three gorges dam shifts estuarine heavy metal risk through suspended sediment gradation. J. Environ. Manage. 338, 117784–117784. doi: 10.1016/j.jenvman.2023.117784
Zhang L. (1989). Research on carrying capacity of non-uniform sediments in alluvial rivers. J. Wuhan Univ. Hydropower Electric Eng. 22, 37–43.
Zhang Z. (2011). Quantifying the Influence of Three Gorges Project on Yangtze Suspended Sediment Flux, Water Discharge and Water Level (East China Normal University: Master).
Zhang J., Chen L., Wu H., Xu W. (2009). Foundation and prospect of complete sediment model for the Yangtze estuary. Hydro-Science Eng. 2), 26–32. doi: 10.3969/j.issn.1009-640X.2009.02.005
Zhang W., Huo G., Zhu Y. (2005). Prediction model for suspended-sediment transport in unsteady flow in Pearl River network. J. Hohai Univ. (Natural Sciences) 33, 542–545. doi: 10.3321/j.issn:1000-1980.2005.05.014
Zhao Y., Zou X., Liu Q., Yao Y., Li Y., Wu X., et al. (2017). Assessing natural and anthropogenic influences on water discharge and sediment load in the Yangtze River, China. Sci. Total Environ. 607, 920–932. doi: 10.1016/j.scitotenv.2017.07.002
Zheng S., Luo H., Zhang J., Cheng H., Li Z., Ma Y., et al. (2022). Sediment budget and riverbed deformation in the uppermost part of the lower Yangtze River, China. Int. J. Sediment Res. 37, 484–492. doi: 10.1016/j.ijsrc.2022.02.004
Zheng S., Xu Y. J., Cheng H., Wang B., Xu W., Wu S. (2018). Riverbed erosion of the final 565 kilometers of the Yangtze River (Changjiang) following construction of the Three Gorges Dam. Sci. Rep. 8, 11917. doi: 10.1038/s41598-018-30441-6
Zhu B., Li Y., Yu W., Sun Z., Deng J., Chai Y., et al. (2019). An analysis of the processes and trends of changes in yangtze river water and sediment fluxes into the ocean. Resour. Environ. Yangtze Basin 28, 2980–2991. doi: 10.11870/cjlyzyyhj201912018
Zhu C., van Maren D. S., Guo L., He Q., Wang Z. B. (2023). Impact of reduced fluvial sediment supply on saltwater intrusion in the yangtze estuary. Earths Future 11. doi: 10.1029/2022ef003274
Keywords: non-uniform sediment, river network model, Yangtze River Estuary, numerical simulation, cascade reservoirs
Citation: Ge H, Zhu L and Mao B (2024) Numerical simulation of non-uniform suspended sediment flowing into the Yangtze River Estuary, China based on a river network model. Front. Mar. Sci. 11:1428345. doi: 10.3389/fmars.2024.1428345
Received: 06 May 2024; Accepted: 19 September 2024;
Published: 08 October 2024.
Edited by:
Giuseppe Barbaro, Mediterranea University of Reggio Calabria, ItalyCopyright © 2024 Ge, Zhu and Mao. This is an open-access article distributed under the terms of the Creative Commons Attribution License (CC BY). The use, distribution or reproduction in other forums is permitted, provided the original author(s) and the copyright owner(s) are credited and that the original publication in this journal is cited, in accordance with accepted academic practice. No use, distribution or reproduction is permitted which does not comply with these terms.
*Correspondence: Lingling Zhu, emh1bGwxMDEyQGZveG1haWwuY29t