 Nadia Marinchel1*
 Silvia Casabianca2
 Alexis Marchesini3,4
 Cristiano Vernesi4,5
 Michele Scardi6
 Antonella Penna2*
- 1Department of Pure Applied Sciences, University of Urbino Carlo Bo, Urbino, Italy
- 2Department of Biomolecular Sciences, University of Urbino Carlo Bo, Urbino, Italy
- 3Research Institute on Terrestrial Ecosystems (IRET), National Research Council (CNR), Porano, Italy
- 4National Biodiversity Future Center, Palermo, Italy
- 5Forest Ecology Unit, Research and Innovation Centre, Fondazione Edmund Mach, S. Michele all’Adige, Italy
- 6Department of Biology, University of Roma Tor Vergata, Roma, Italy
Marine sediments host heterogeneous protist communities consisting of both living benthic microorganisms and planktonic resting stages. Despite their key functions in marine ecosystem processes and biogeochemical cycles, their structure and dynamics are largely unknown. In the present study, with a spatially intensive sampling design we investigated benthic protist diversity and function of surface sediment samples from three subregions of the Mediterranean Sea, through an environmental DNA metabarcoding approach targeting the 18S V4 region of rRNA gene. Protists were characterized at the taxonomic level and trophic function, both in terms of alpha diversity and community composition, testing for potential differences among marine subregions and bathymetric groups. Overall, Alveolata and Stramenopiles were the two divisions that dominated the communities. These dominant groups exhibited significant differences among the three Mediterranean subregions in the alpha diversity estimates based on the detected ASVs, for all computed indices (ASV richness, Shannon and Simpson indices). Protist communities were also found to be significantly different in terms of composition at the order rank in the three subregions p-value < 0.01). These differences were mainly driven by Anoecales, Peridiniales, Borokales, Paraliales and Gonyaulacales, which together contributed almost 80% of the average dissimilarity. Anoecales was the dominant order in the Ionian – Central Mediterranean and Adriatic Sea, but with considerably different relative abundances (52% and 36%, respectively), while Borokales was the dominant order in the Western Mediterranean Sea (33%). Similarly, significant differences among the three marine subregions were also highlighted when protist assemblages were examined in terms of trophic function, both in terms of alpha diversity (calculated on the ASVs for each trophic group) and community composition p-value < 0.01. In particular, the Adriatic Sea stood out for having the highest relative abundance of autotrophic/mixotrophic components in the surface sediments analyzed. Conversely, no significant differences in protist assemblages were found among depth groups. This study provided new insights into the taxonomic and trophic composition of benthic protist communities found in Mediterranean surface sediments, revealing geographical differences among regional seas. The results were discussed in relation to the Mediterranean environmental features that could generate the differences among benthic protist communities.
1 Introduction
Eukaryotic unicellular organisms belonging to the polyphyletic group of marine protists play a variety of crucial roles in marine ecosystems and the whole Earth’s biosphere, from primary production to biogeochemical cycling and climate regulation (Caron et al., 2012). In particular, protist communities of marine benthic habitats exhibit key ecosystem functions, coupling the benthic and pelagic compartments. Protists found in marine sediments are typically nanosized (< 20 um), barotolerant and can assume diverse trophic roles (e.g., predators, decomposers, parasites or symbionts). They are responsible for energy transfer through aquatic food webs, acting as trophic links, contribute to the carbon dioxide exchanges, storage and decomposition of organic matter and nutrients remineralization (Caron et al., 2012; Thurber et al., 2014; Schoenle et al., 2021). Moreover, protist diversity of marine sediments consists not only of truly active benthic species, but also of resting stages of eukaryotic planktonic organisms (e.g., diatoms and dinoflagellates), that ensure them the long-term survival in harsh environmental conditions (Belmonte and Rubino, 2019). Therefore, marine sediments act as “seed banks”, allowing the spatio-temporal persistence of these species, with only a very small proportion of resting stages needed to originate blooms in response to environmental changes (Ellegaard and Ribeiro, 2018).
Due to their pivotal and multifaceted ecosystem functions, shedding light on the diversity and composition of benthic protists, at the taxonomic and functional level, is thus of crucial importance for a better understanding of marine ecosystems and predicting their response to ongoing climate and environmental changes, in terms of food web dynamics, biogeochemistry, carbon sequestration and sediment stability (Fuks et al., 2012). Lastly, gaining information on the potential presence of planktonic resting stages in marine sediments may help in disentangling the spatio-temporal dynamics of overlying plankton communities, as well as tracing present and predicting future blooms of potentially harmful algae (Ellegaard and Ribeiro, 2018). Despite the urgent need of more accurate information, sediments are one of the least studied marine environments due to its vastness and remote access, which implies difficulties in sampling activities, and current knowledge on benthic protists relies on sparse and locally restricted data (Forster et al., 2016; Cordier et al., 2022). Traditionally, taxonomic and functional characterization of benthic marine protists have been challenging due to methodological limitations. Many small eukaryotic species (< 3 μm) living in the sediments are unculturable, poorly described or unknown and/or difficult to identify based on morphological classification (Forster et al., 2016; del Campo et al., 2023). Moreover, resting stages produced by protists (e.g., diatom and dinoflagellate spores and cysts, respectively) are often difficult to identify and their germination requires long incubation periods (Kremp et al., 2018; Ellegaard et al., 2020).
In the last decade, the DNA metabarcoding approach applied to environmental samples (eDNA metabarcoding; Taberlet et al., 2012; Taberlet et al., 2018) has proven to be a useful tool to overcome the above-mentioned difficulties in studying the diversity of protists in marine ecosystems (De Vargas et al., 2015; Burki et al., 2021), including European and Mediterranean coastal sediments (Massana et al., 2015; Reñé et al., 2020). However, this methodology is not free from technical biases that may originate in different steps of the experimental workflow, from sample collection and DNA extraction protocols, to the choice of the barcode gene and primers (e.g., preferential amplification of some taxa, gene copy number variation, etc.), the use of sub-optimal bioinformatic pipelines and incomplete/inaccurate reference sequence databases (Ruppert et al., 2019; Ficetola and Taberlet, 2023). All the above-mentioned shortcomings may result in false negatives (i.e., the failure to detect some taxa), false positives (due to misclassification or contamination), or in biased relative abundances of sequences. Moreover, studying protist communities in marine sediments using eDNA can be challenging, due to the presence and temporal persistence of intra- and extra-cellular DNA in surface sediments, sometimes originated from different sources (Pawlowski et al., 2022). Nevertheless, the rapid maturation of the field, including the development of strategies to mitigate these issues and the deriving uncertainties (Santoferrara, 2019), as well as the growing accumulation of new data has made metabarcoding a powerful and cost-effective tool for the study of marine protist diversity and ecology (Burki et al., 2021).
The Mediterranean Sea is an oligotrophic basin, highly differentiated into subregions based on hydrodynamic and climatological regimes as well as human coastal pressures (Reygondeau et al., 2017; Ayata et al., 2018). Therefore, trophic conditions and productivity differ among subregions, and this may be reflected in the structure and dynamics of marine protist assemblages in the water column. Marine areas of high productivity are mainly located near important freshwater inputs from rivers (D’Ortenzio and Ribera d’Alcalà, 2009). In addition, human activities are important drivers that significantly affect the functioning of coastal and offshore marine ecosystems, both pelagic and benthic (i.e., fishing net trawling, dredging, translocation, eutrophication, ballast water discharge and mariculture) (Cloern et al., 2016; Casabianca et al., 2022). This could suggest that the diversity and community composition of protist assemblages may vary in the different Mediterranean subregions, as well as their trophic structure and dynamics (Burki et al., 2021).
In this study, we investigated benthic protist assemblages (i.e., the living and resting stage components of unicellular eukaryotes) from surface sediments in three subregions of the Mediterranean Sea: Adriatic Sea, Ionian – Central Mediterranean and Western Mediterranean, using an eDNA metabarcoding approach targeting the V4 region of the 18S SSU rDNA and a spatially intensive sampling design. Specifically, we aimed to: (1) characterize benthic protist communities in terms of taxonomic composition and function, and (2) test for potential differences in protist assemblages among marine subregions and depth at both taxa and trophic level.
2 Materials and methods
2.1 Samples collection
In the Mediterranean Sea along the Italian peninsula, a total of 94 sediment samples were collected at the surface (about 1 cm depth) between 2015 and 2017 (Supplementary Table S1, Supplementary Figure S1). Samples were collected using a Van Veen grab, a sampler commonly used for sampling sediments from coastal and shallow marine seafloor. This kind of grab is also suitable for sampling different types of sediments (Klemm et al., 1990). Despite the known limitations of grabs (e.g., premature/incomplete closure, clogging, sediment loss, etc.), these samplers should be preferred over corers for collecting surface sediments (Moncada et al., 2024). Moreover, subsampling activity was applied to grab samples, which contained the first layer of bottom sediment collected in undisturbed areas. Precaution was also taken to maximize the recovery of the surface sediment. The marine subregions of the Mediterranean Sea were defined according to the MSFD (Marine Strategy Framework Directive 2008/56/EC), as described in Article 4 of the MSFD (Jensen et al., 2017; Servello et al., 2019). In this study, we referred to them as the Adriatic Sea (ADRIATIC), the Ionian – Central Mediterranean Sea (CMED), and the Western Mediterranean Sea (WMED). The depths of the samples ranged from 1 to 1,018 m, and they were divided into two depth groups defined by a threshold corresponding to the sharpest discontinuity in the distribution of depth values found between 152 and 171 m. This depth corresponds approximately to the outer margin of the continental shelf, right above the upper part of the continental slope. The distribution of the samples above and below this discontinuity resulted in two groups of 64 and 30 sites, respectively, with depths ranging from 1 to 161 m in the first group and from 162 to 1,018 m in the second group.
2.2 Molecular analysis
Before DNA extraction, samples were treated to separate resting stages from sediments according to the procedures described in Kim et al. (2016); Perini et al. (2019) and Casabianca et al. (2020). For each sample, DNA was extracted using DNeasy PowerSoil Kit (Qiagen, Hilden, Germany) according to the manufacturer’s instructions with the following modifications. Briefly, an incubation step at 70°C for 10 min was performed prior to the bead-beating step which was increased to 20 min. Both steps were added to facilitate the rupture of the resting stages. All centrifugation steps were performed at 12,000 rpm with a final total DNA elution of 50 µl. Amplification of the V4 region of the 18S SSU rDNA was performed using TAReuk454FWD1 and TAReukREV3 (Stoeck et al., 2010). Illumina adapters, PCR reaction mixture and thermal conditions were described in Marinchel et al. (2023). Three independent PCR replicates were performed for each sample and then pooled for sequencing, in order to minimize the effects of PCR stochasticity. Negative controls (blanks) were included during the resting stage purification phase (N = 3), DNA extraction (N = 28) and PCR amplification (N = 6) to control for potential contaminants throughout the whole experimental workflow. Positive controls (N = 6) were included in each PCR amplification batch to check for potential amplification failure or bias and test the efficiency of the bioinformatic parameter set. Positive controls were represented by mock communities assembled using four diatom cultured strains of Chaetoceros socialis, Guinardia flaccida, Pseudo-nitzschia spp., and Skeletonema marinoi and three dinoflagellate cultured strains of Alexandrium minutum, A. pacificum, and Scrippsiella spp. For each taxon included in the mock communities, DNA was extracted from cultured cells using DNeasy Plant Kit (Qiagen, Hilden, Germany) according to the manufacturers’ instructions. DNA was quantified using Qubit fluorometer with a Quant-iT dsDNA HS Assay Kit (Invitrogen, Carlsbad, CA, USA) and mixed using equimolar concentrations (2 ng/µl). Positive controls were then amplified and processed equally to environmental samples. PCR products were purified with the MinElute PCR Gel Extraction Kit (Qiagen, Hilden, Germany), according to the manufacturer’s protocol. Library preparation was performed in two amplification steps: an initial PCR amplification with specific primers and a subsequent amplification integrating relevant flow-cell binding domains and unique indices (using the NexteraXT Index Kit; FC‐131‐1001/FC‐131‐1002). The obtained libraries were sequenced at Fondazione Edmund Mach (S. Michele a./A., Trento, Italy) using an Illumina MiSeq platform (2 x 300 bp paired-end sequencing). A total of 94 marine samples were sequenced (ADRIATIC, N = 46; CMED, N = 30; WMED, N = 18).
2.3 Bioinformatic analysis
Demultiplexed fastq reads were checked for sequence quality using FastQC v0.12 (Andrews, 2010) and trimmed using Cutadapt version 3.5 (Martin, 2011). Primer sequences and their reverse complements were trimmed in both directions, with the default maximum error rate of 0.1. Sequences less than 80 base pairs long were filtered out. Trimmed reads were then imported into QIIME2 (Bolyen et al., 2019) for quality filtering, denoising, merging, and classification. Quality filtering was performed with a minimum quality threshold of 25 per base. Denoising was performed with DADA2 (Callahan et al., 2016) using the q2-dada2 plugin with the following parameters set to: –p-trunc-len-f 244 and –p-trunc-len-r 193. The obtained Amplicon Sequence Variants (ASVs) were classified using the VSEARCH algorithm (Rognes et al., 2016) against the PR2 Protist Ribosomal Reference database, ver. 5.0.0 (Guillou et al., 2013), using a sequence identity threshold of 97%. It should be emphasized that the PR2 database classification treats several diverse groups of protists as actual taxonomic divisions, even though contemporary classification systems do not recognize them as such. This is the case for Alveolata, Stramenopiles, Opisthokonta, and Rhizaria. We utilized this nomenclature throughout the text to ensure agreement with the reference sequence database. The metabarcoding dataset was exported from QIIME2 and then imported in R (ver. 4.3.1; R Core Team, 2022) for the post‐sequencing removal of contaminant reads. Decontamination of all obtained ASVs was performed using microDecon (McKnight et al., 2019), a specific R package developed for the identification and removal of contaminant reads. Through an iterative process, a constant (i.e., ASV or OTU fully emerged as a contaminant) is found and used for samples decontamination. Specifically, the decon function was run with default parameters, except for the thresh parameter, which was set to 1 to prevent the removal of rare taxa. The decontaminated metabarcoding dataset was then imported again in QIIME2 for the removal of non-target taxa (i.e., pluricellular organisms, fungi) through the filter-table plugin of q2-taxa (–p-exclude). Taxonomies were collapsed at the division and order ranks using the QIIME2 taxa collapse plugin with the –p-level flag set to 3 and 6, respectively.
2.4 Statistical analysis
Statistical analyses were performed using R (ver. 4.3.1; R Core Team, 2022) and PAST version 4.08 (Hammer et al., 2001). The decontaminated metabarcoding dataset was used to create rarefaction curves using the rarecurve function of vegan R package ver. 2.6-4 (Oksanen et al., 2017). Read counts were normalized into relative abundances using the decostand function (method = “total”) using vegan R package; all further analyses were performed on the normalized dataset.
To estimate protists alpha diversity of the three different marine subregions, we computed ASV richness for each site using the specnumber function in vegan R package for: (a) all the obtained ASVs (total), (b) for each protist division separately (excluding those with less than two ASVs), and (c) for protist trophic function separately (see below for details on the trophic classification). In addition, we calculated Shannon and Simpson indices for each division represented with more than one ASV, and for each trophic function separately, using the diversity function of the vegan R package, setting “index = shannon” and “index = simpson”, respectively. To compare ASV richness, Shannon and Simpson indices obtained from each sample among subregions, we computed Kruskal-Wallis test which, in case of significant differences, was followed by Dunn’s post hoc test with p-values adjusted according to Bonferroni correction. These tests were conducted in PAST.
The analysis of community composition was performed at both taxonomic level, collapsing ASVs at the order level, and trophic function. ASVs that were not classified at order rank were removed from the dataset.
Protists were classified into four functional groups based on their trophic function: autotrophs/mixotrophs, heterotrophs, parasites, and heterotrophs/parasites. The autotrophic and mixotrophic components were treated together because the taxonomic rank used for ASVs classification (i.e., order) could often include taxa with both autotrophic and mixotrophic behavior (i.e., dinoflagellates). Similarly, the heterotrophic/parasitic trophic group was assigned to the taxonomies that could have heterotrophic or parasitic trophism (in this study Sagenista and Opisthokonta). The trophic function was assigned according to Armeli Minicante et al. (2019) and Encyclopedia of Life (https://eol.org/).
To reduce the impact of outliers, the protist community composition was analyzed by non-metric multidimensional scaling (nMDS) based on Euclidean distances, using the metaMDS function of the vegan R package for both taxonomic classification (order rank) and trophic function. Multivariate differences between sample groups were analyzed through the analysis of similarity (ANOSIM) and adjusted using Bonferroni correction to check for significant differences between subregions and depth groups considering both taxonomic classification (order rank) and trophic function of protists. Two-way and one-way ANOSIM tests were performed in PAST using 999 permutations and Euclidean distance. To assess which taxonomic orders were responsible for the observed differences among groups, the similarity percentage (SIMPER) test was performed on Euclidean distance in PAST.
Figures were created using ggplot2 package ver. 3.4.0 (Wickham, 2016).
3 Results
3.1 Sequencing
After trimming and bioinformatic filtering, a total of 1,633,778 merged reads were obtained from Illumina amplicon sequencing, representing 6,589 amplicon sequence variants (ASVs). In the mock positive controls, we found 130,109 reads, corresponding to 57 ASVs. Of these, 24 ASVs (129,085 reads) were assigned to the genus or species rank of the protist taxa included in the mock communities, 3 ASVs were classified at a higher taxonomic rank (102 reads); 25 ASVs (289 reads) remained unassigned, and five were assigned to Minorisa minuta (633 reads), a common heterotrophic nanoflagellate found in coastal waters (Keeling and del Campo, 2017). Overall, all the target taxa were amplified, but false negatives (i.e., the failure to detect a taxon, which was included in the mock community) occurred for the diatom genera Chaetoceros and Pseudo-nitzschia, resulting in two false negatives each. After completing the screening of the mock positive controls, they were removed from the dataset for further analysis (i.e., statistical analysis).
In the negative controls (blanks), we identified a total of 51,898 reads, corresponding to 209 ASVs. Of these, 116 ASVs (37,465 reads) were assigned to non-target taxa (i.e., Metazoa, Fungi, Streptophyta) or remained unassigned. The ASVs found in blanks, which were identified as eukaryotic protists were assigned to the following divisions: Amoebozoa, Chlorophyta, Choanoflagellata, Alveolata and Stramenopiles (14,433 reads; 93 ASVs).
During the decontamination analysis, a total of 11 ASVs identified as systematic contaminants were removed from the entire dataset, all of which belonged to non-target groups of organisms (i.e., non-protists). Moreover, 52 ASVs identified as occasional contaminants were occasionally removed from some samples (for a total of 103,343 reads), when they did not reach the abundance threshold inferred from the algorithm for filtering out occasional contaminations. Of these, 19 ASVs were assigned to protist taxa, for a total of 66,079 reads removed; specifically, they belonged to Caecitellaceae (47,185 reads), Bicoecea (16,060 reads), Alexandrium spp. (1,086 reads), Acanthoecida (949 reads), Paraphysomonas and Chaetoceros spp. (399 and 400 reads, respectively). The non-protist taxa removed from the dataset for being identified as contaminants belonged to Metazoa, Fungi, Streptophyta, Pseudofungi, Lobosa, Mesomycetozoa, Conosa, Rhodophyta, Breviatea, Amoebozoa, and Ulvophyceae class of Chlorophyta. After the post-sequencing decontamination analysis, the dataset retained a total of 1,348,073 reads, corresponding to 6,578 ASVs. The dataset was then further refined by removing unclassified ASVs (387,624 reads) and those corresponding to non-protist eukaryotes and non-target pluricellular organisms (254,400 reads). The final dataset comprised 706,049 reads, which corresponded to 1,766 ASVs, classified into 389 protist taxa. The rarefaction curves showed an appropriate sequencing depth, with only a few samples failing to reach the plateau (Supplementary Figure S2).
3.2 Diversity of the benthic protist communities
The detected protist taxa belonged to 14 divisions (Figure 1), corresponding to 63 classes and 117 orders (Supplementary Figure S3).
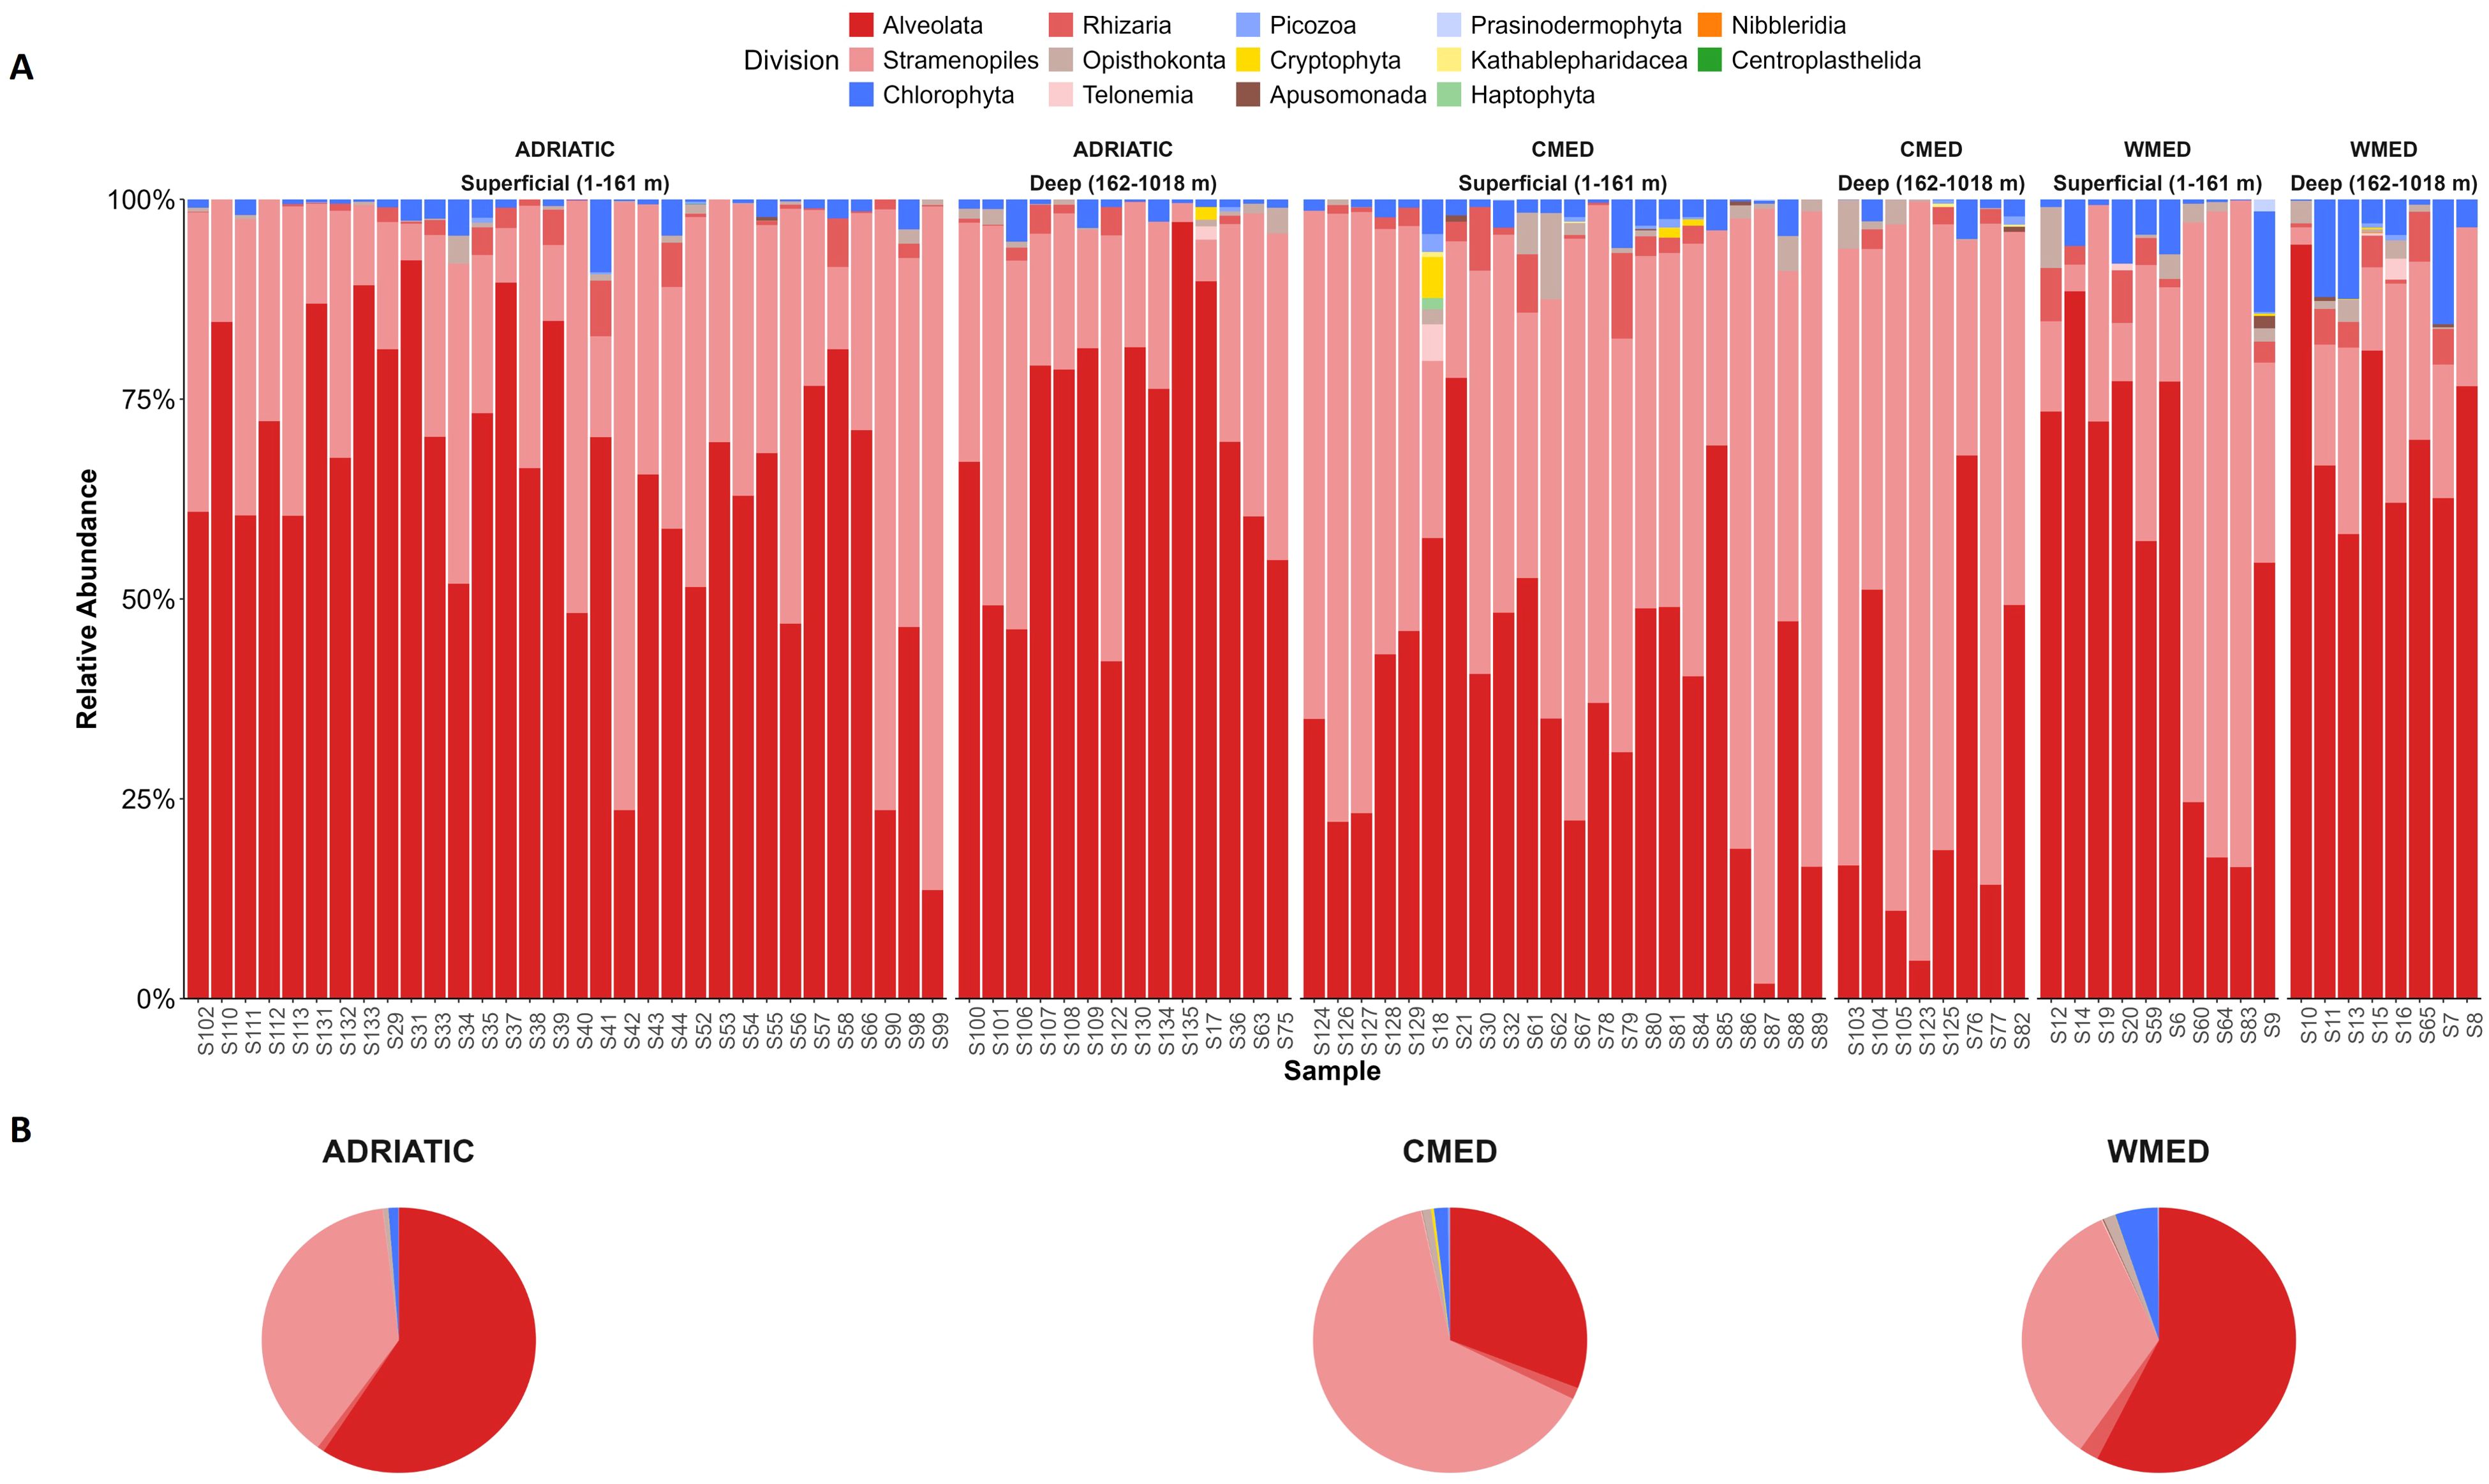
Figure 1. Taxonomic composition of the protist communities at division level of the three Mediterranean subregions studied based on the regional sea classification: Adriatic Sea (ADRIATIC), Ionian – Central Mediterranean Sea (CMED) and Western Mediterranean Sea (WMED). The bar charts (A) show the relative abundance (y-axis) of each protist division in each sampling site (x-axis); sites are ordered by depth groups (superficial; deep). The pie charts (B) show the relative abundance of divisions for each subregion: ADRIATIC, CMED and WMED.
In the three marine subregions, Alveolata and Stramenopiles resulted to be the divisions with the highest relative abundances (Supplementary Table S2). The highest relative abundance recorded for Alveolata was found in ADRIATIC (66.18%), while in CMED, Stramenopiles were the most represented (57.82%). WMED instead, resulted to be the most heterogeneous of the three subregions, with a higher fraction of protists belonging to Chlorophyta (5.14%) and Rhizaria (2.55%), besides Alveolata (62.8%) and Stramenopiles (27.47%). In the two most represented divisions (i.e., Alvolata and Stramenopiles), the orders mainly contributing (> 10%) to the total relative protist abundances in all the three subregions were Peridiniales (division Alveolata), Borokales, Anoecales, and Paraliales (division Stramenopiles) (Table 1). In addition, Gonyaulacales (Alveolata) were found to contribute for about 10% of the total protist abundance in ADRIATIC, but not in the other subregions, while Sagenista_X (Stramenopiles) were found to account for about 22% of the total in WMED, but not in other subregions.
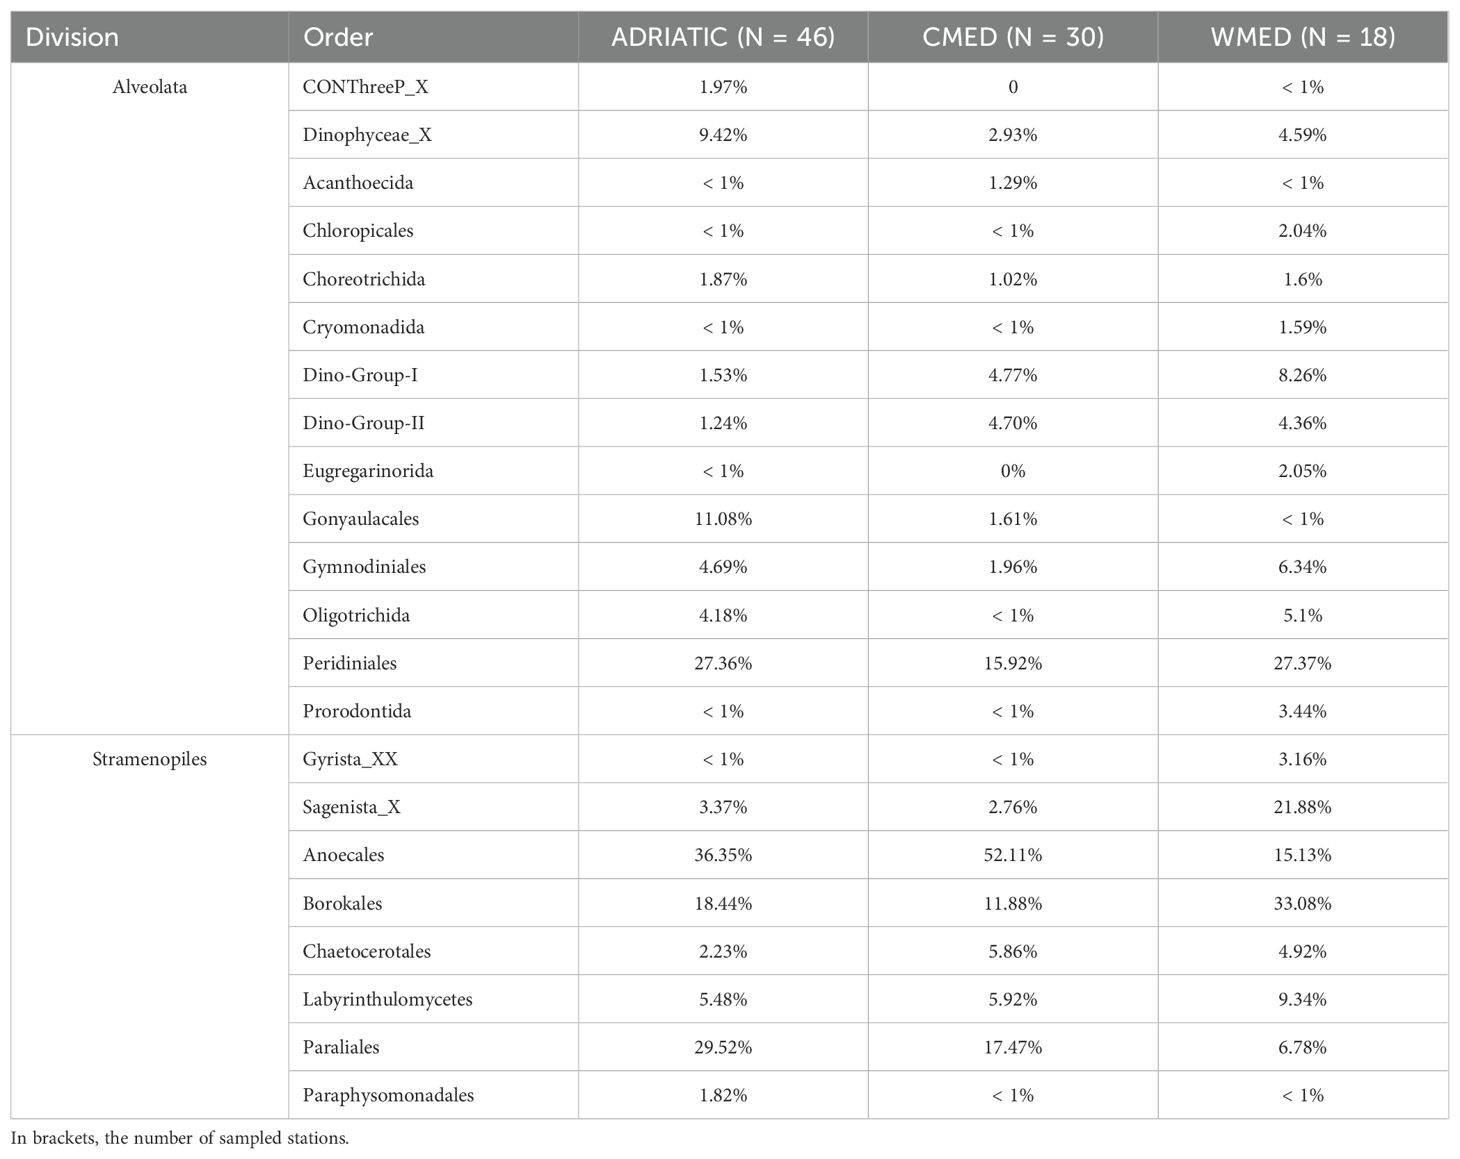
Table 1. Relative abundance of orders belonging to the Alveolata and Stramenopiles divisions in the three Mediterranean subregions.
When alpha diversity was calculated among subregions, the mean per sample of each index was similar (Table 2). Specifically, the highest value recorded for ASV richness was 52.06 in WMED and the lowest was 49.07 in CMED. For the Shannon index, the highest mean per sample was recorded in ADRIATIC (3.33) and the lowest in WMED (3.1), while the mean per sample of the Simpson index was 0.94 in ADRIATIC and CMED, and 0.9 in CMED. When these indices were calculated for each division, some differences among the mean per sample per subregion were highlighted. In ADRIATIC, the highest value for ASV richness and Shannon index was recorded for Alveolata, while the highest Simpson index was recorded for Kathablepharidacea and Prasinodermophyta. In CMED, the highest mean per sample for ASV richness and Shannon index was recorded for Stramenopiles, while the highest Simpson index was recorded for Telonema. In WMED Alveolata showed the highest values for ASV richness and Shannon index, Kathablepharidacea showed the highest mean per sample for Simpson index.
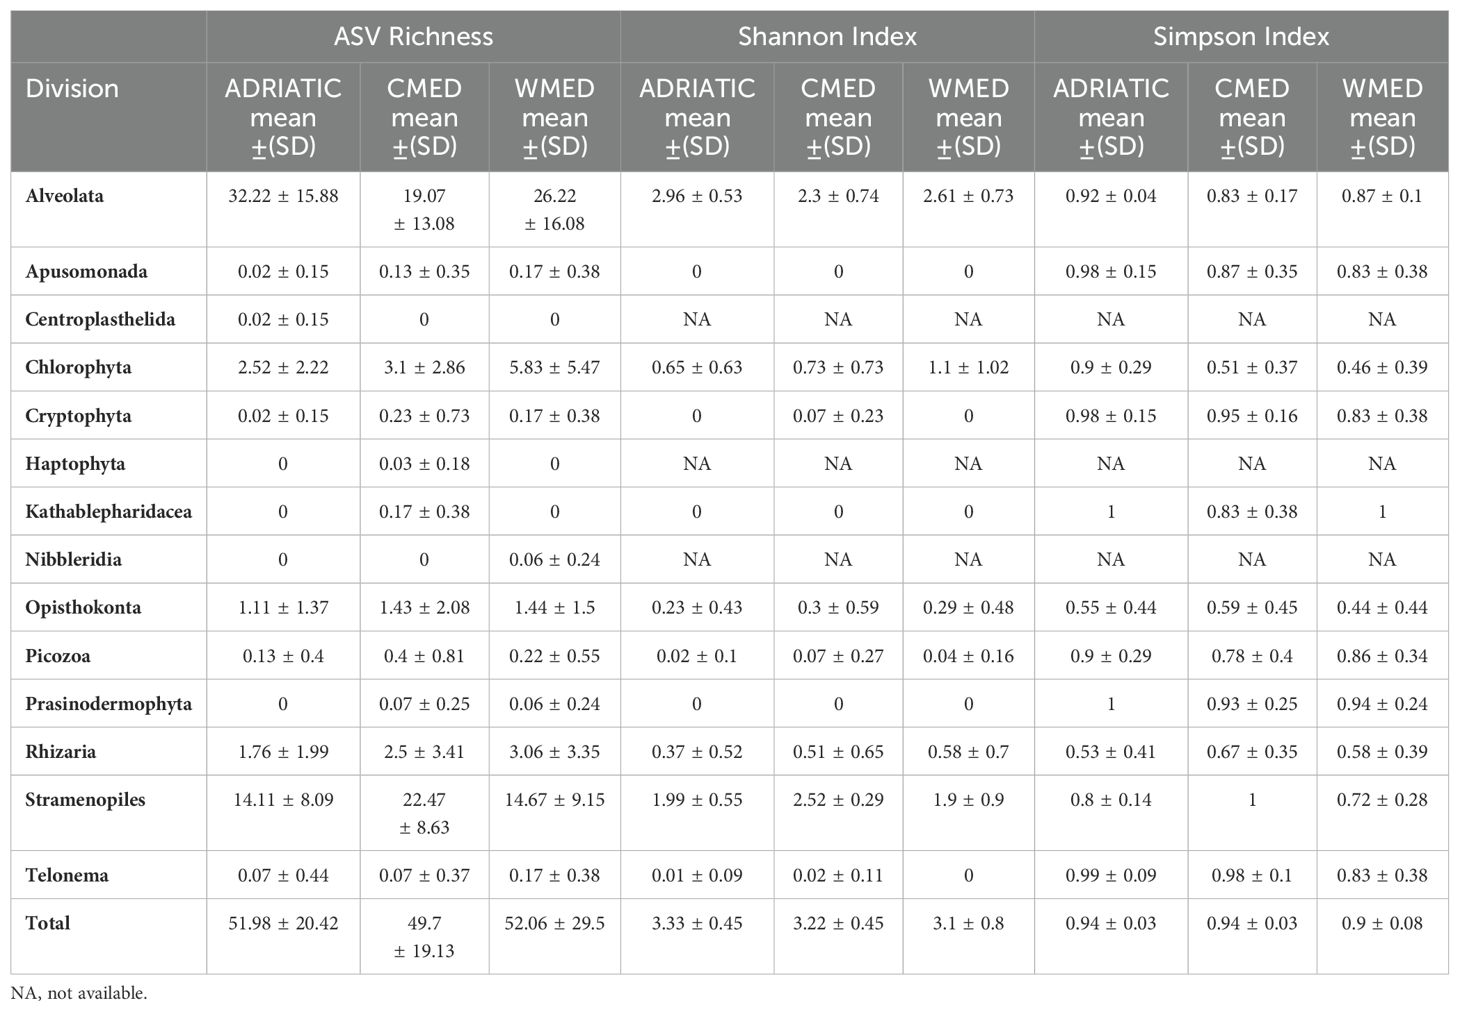
Table 2. Alpha diversity indices expressed as mean ± standard deviation (SD) of each protist division based on ASVs in the three Mediterranean subregions.
Considering all the protist ASVs obtained for each site, no statistically significant differences between marine subregions were highlighted for the alpha diversity indices computed (Kruskal-Wallis, p-value > 0.05; Supplementary Table S3). When alpha diversity was examined for each division separately, statistically significant differences between marine subregions were found in the Alveolata and Stramenopiles divisions for ASVs richness, Shannon and Simpson indices (Kruskal-Wallis, p-value < 0.01; Supplementary Table S3), in the Kathablepharidacea for ASV richness and Simpson index (Kruskal-Wallis, p-value < 0.01; Supplementary Table S3), in the Cryptophyta for Shannon index (Kruskal-Wallis, p-value < 0.05; Supplementary Table S3) and in the Telonema for Simpson index (Kruskal-Wallis, p-value < 0.05; Supplementary Table S3). Specifically, for all alpha diversity indices computed, significantly higher values were highlighted for Alveolata in ADRIATIC compared to CMED (Dunn’s post hoc test, p-value < 0.01; Supplementary Table S4); while for Stramenopiles, significantly higher values were found in CMED compared to ADRIATIC and WMED (Dunn’s post hoc test, p-value < 0.01; Supplementary Table S4). For the Kathablepharidacea division, significantly higher values were found in CMED compared to ADRIATIC and WMED for ASV richness and Simpson index (Dunn’s post hoc test, p-adjusted < 0.05; Supplementary Table S4). For the Cryptophyta division, significantly higher values were found in CMED compared to ADRIATIC for the Shannon index (Dunn’s post hoc test, p-value < 0.05; Supplementary Table S4). Lastly, for the Telonema division, significantly higher values were found in ADRIATIC compared to WMED for the Simpson index (Dunn’s post hoc, p-value = 0.053; Supplementary Table S4).
The taxonomic composition of the protist communities was further investigated at the order rank. For this specific analysis, a total of 2,867 reads, corresponding to 8 protist taxa, were removed from the dataset as they were not unambiguously classified by order rank. The resulting non-metric multidimensional scaling (nMDS) plot showed partial, but not complete, overlap among the three Mediterranean subregions (Figure 2).
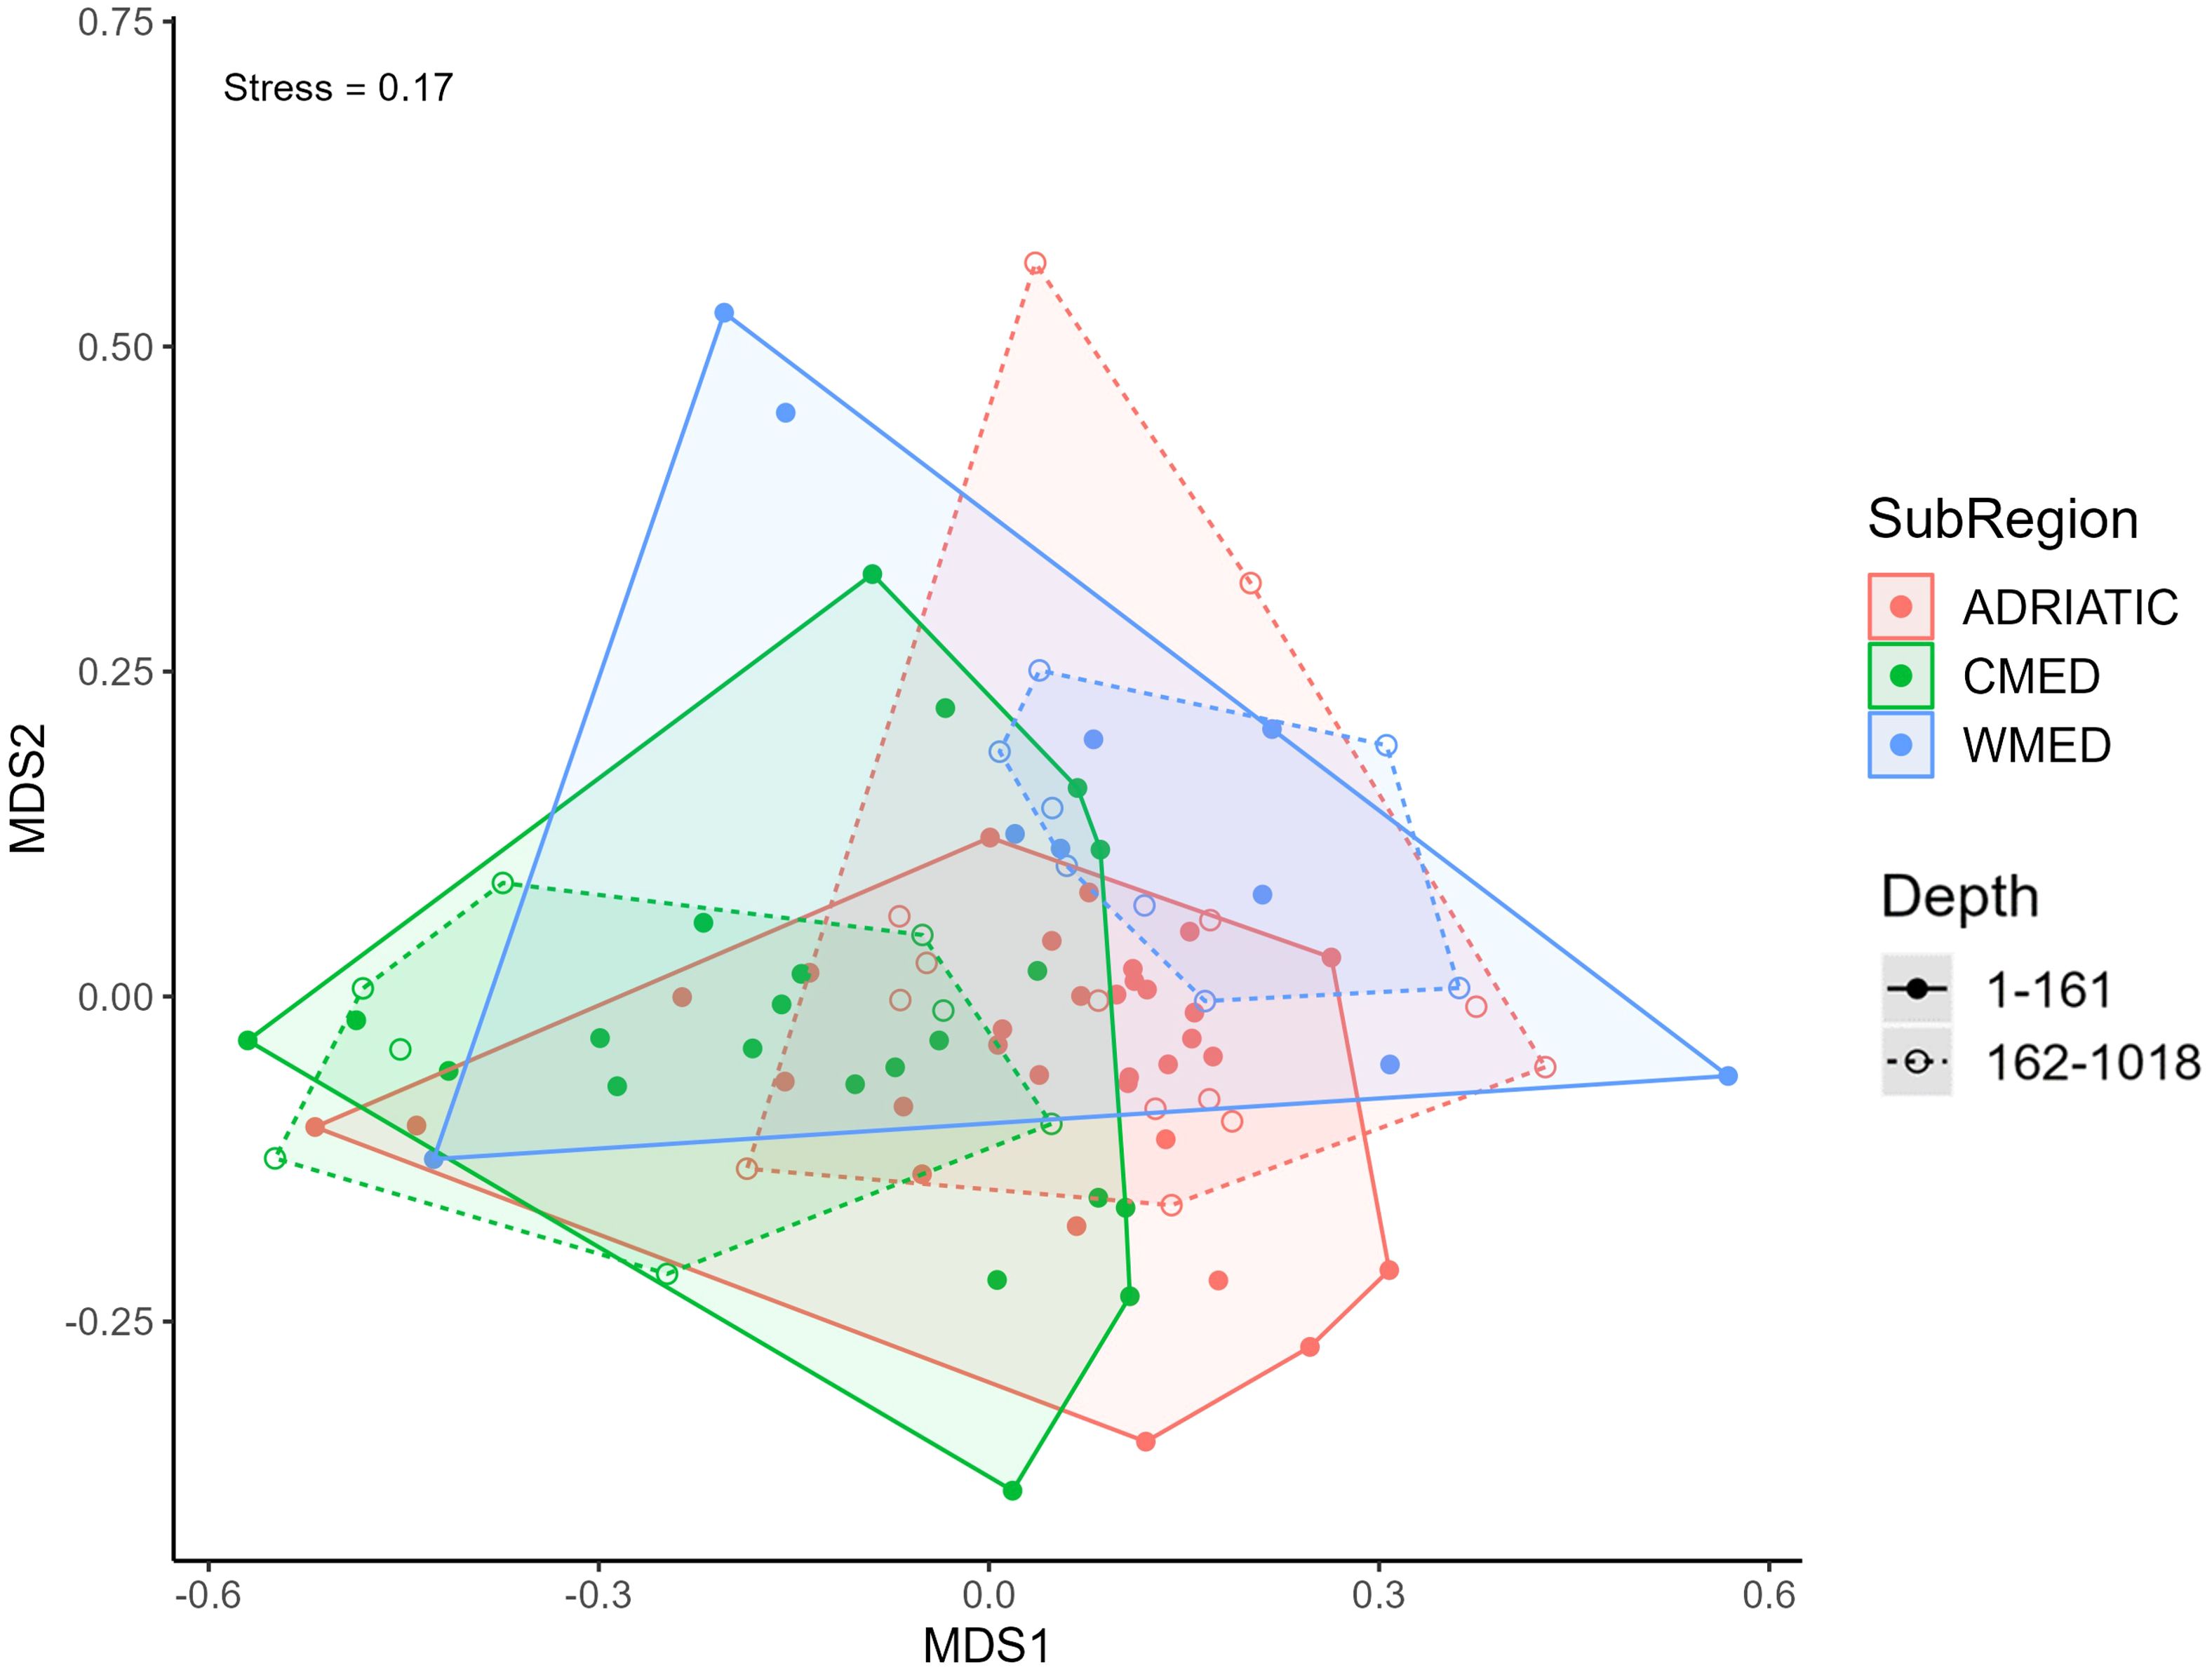
Figure 2. Non-metric multidimensional (nMDS) ordination performed on the protist communities (ranked by order) of the three marine subregions based on Euclidean distance. Convex hulls are shown in different colours according to the subregion. Depth groups per subregion are defined by solid (1-161 depth group) or dashed (162-1,018 depth group) lines.
There was a limited overlap between CMED and WMED, with only six WMED stations having similar assemblages (three belonging to the 1-161 depth group and three to the 162-1,018 depth group). The protist assemblages found in the 162-1,018 depth group of CMED and WMED showed no overlap. When both depth groups were considered, the overlap between ADRIATIC and CMED was greater. The result of the two-way ANOSIM test rejected the null hypothesis of equal assemblages for the three Mediterranean subregions (R = 0.26, p-value < 0.01), while no significant differences were found when considering depth groups. The one-way ANOSIM test performed at the order level to compare the taxonomic composition between subregions, showed that the dissimilarity between CMED and WMED was slightly higher (R = 0.27, p-value < 0.01; Supplementary Table S5); while the most similar assemblages resulted to be those between ADRIATIC and CMED (R = 0.23, p-value < 0.01; Supplementary Table S5).
The SIMPER analysis showed an average Euclidean dissimilarity of 0.31 among the three subregions. Specifically, ADRIATIC had a Euclidean dissimilarity of 0.29 with both CMED and WMED, while CMED and WMED had a Euclidean dissimilarity of 0.37 (Supplementary Table S6). The taxonomic orders with the highest contribution to the mean dissimilarity between the three marine subregions were Anoecales (33.78%), Peridiniales (18.69%), Borokales (10.89%), Paraliales (9.16%) and Gonyaulacales (6.76%), which together accounted for the 79.28% of the mean dissimilarity (Figure 3). Anoecales was the dominant order in CMED and ADRIATIC, but with considerably different relative abundances (52% and 36%, respectively; Table 1). Peridiniales was found with the same relative abundance in ADRIATIC and WMED (27%) but was less abundant in CMED (16%). Borokales was the dominant order in WMED in terms of relative abundance (33%), but the fourth order in ADRIATIC (18%) and CMED (12%). Paraliales was the second most abundant order in ADRIATIC (29.5%) and CMED (17.5%) but ranked only at 7th position in WMED. Lastly, Gonyaulacales was found at relatively high relative abundance (11.1%) only in ADRIATIC, being present at very low abundances (1-2%) in WMED and CMED.
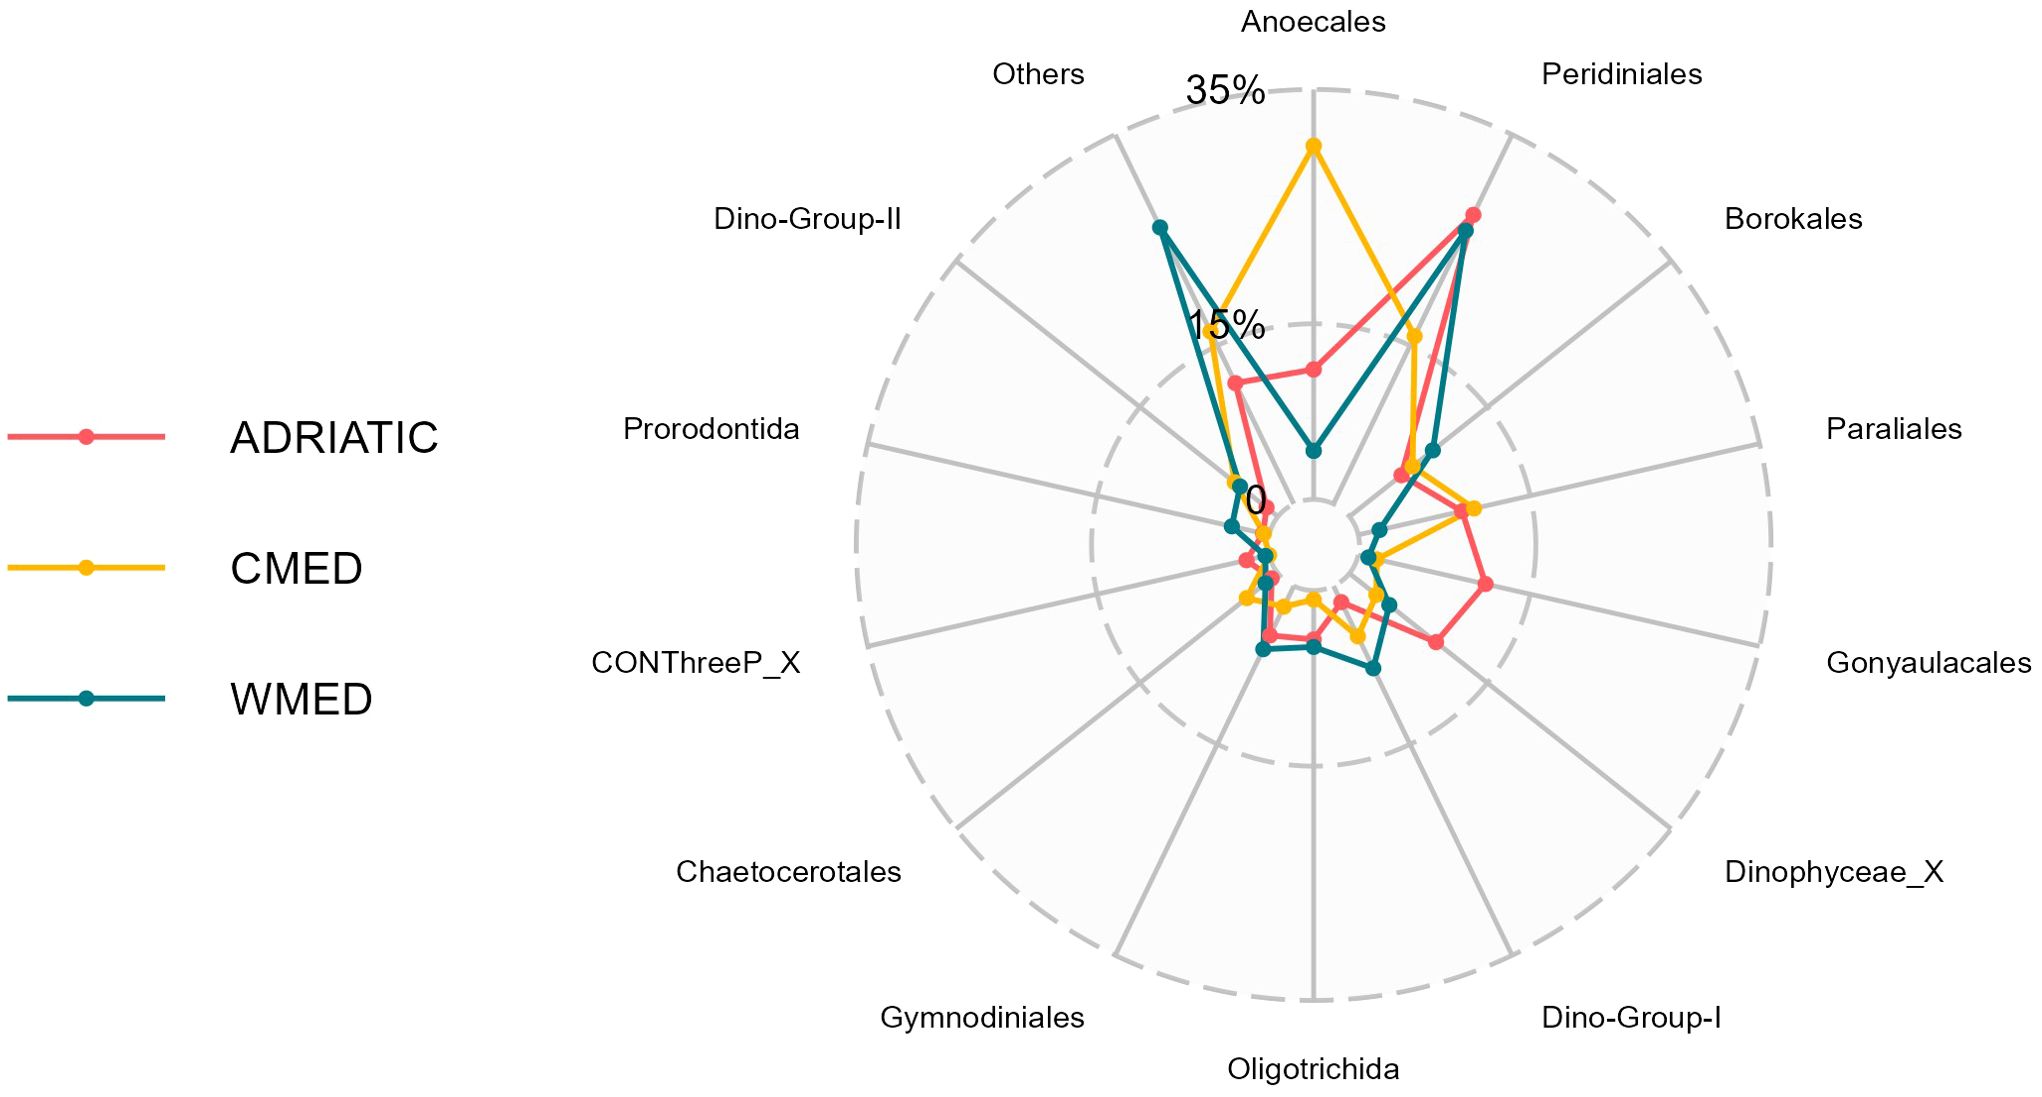
Figure 3. Radar chart representing the contribution of each protist order to the dissimilarity among the three marine subregions (ADRIATIC, CMED, WMED), based on the results of the Similarity of Percentages (SIMPER) analysis performed on Euclidean distances. Protist ASVs were collapsed at the order level; orders contributing more than 1% to the total community dissimilarity are shown, the remaining orders (< 1%) are labelled as Others.
3.3 Functional diversity of the benthic protist communities
The protist ASVs obtained were assigned to four trophic functions: autotrophic/mixotrophic, heterotrophic, parasitic, heterotrophic/parasitic (Figure 4, Supplementary Table S7).
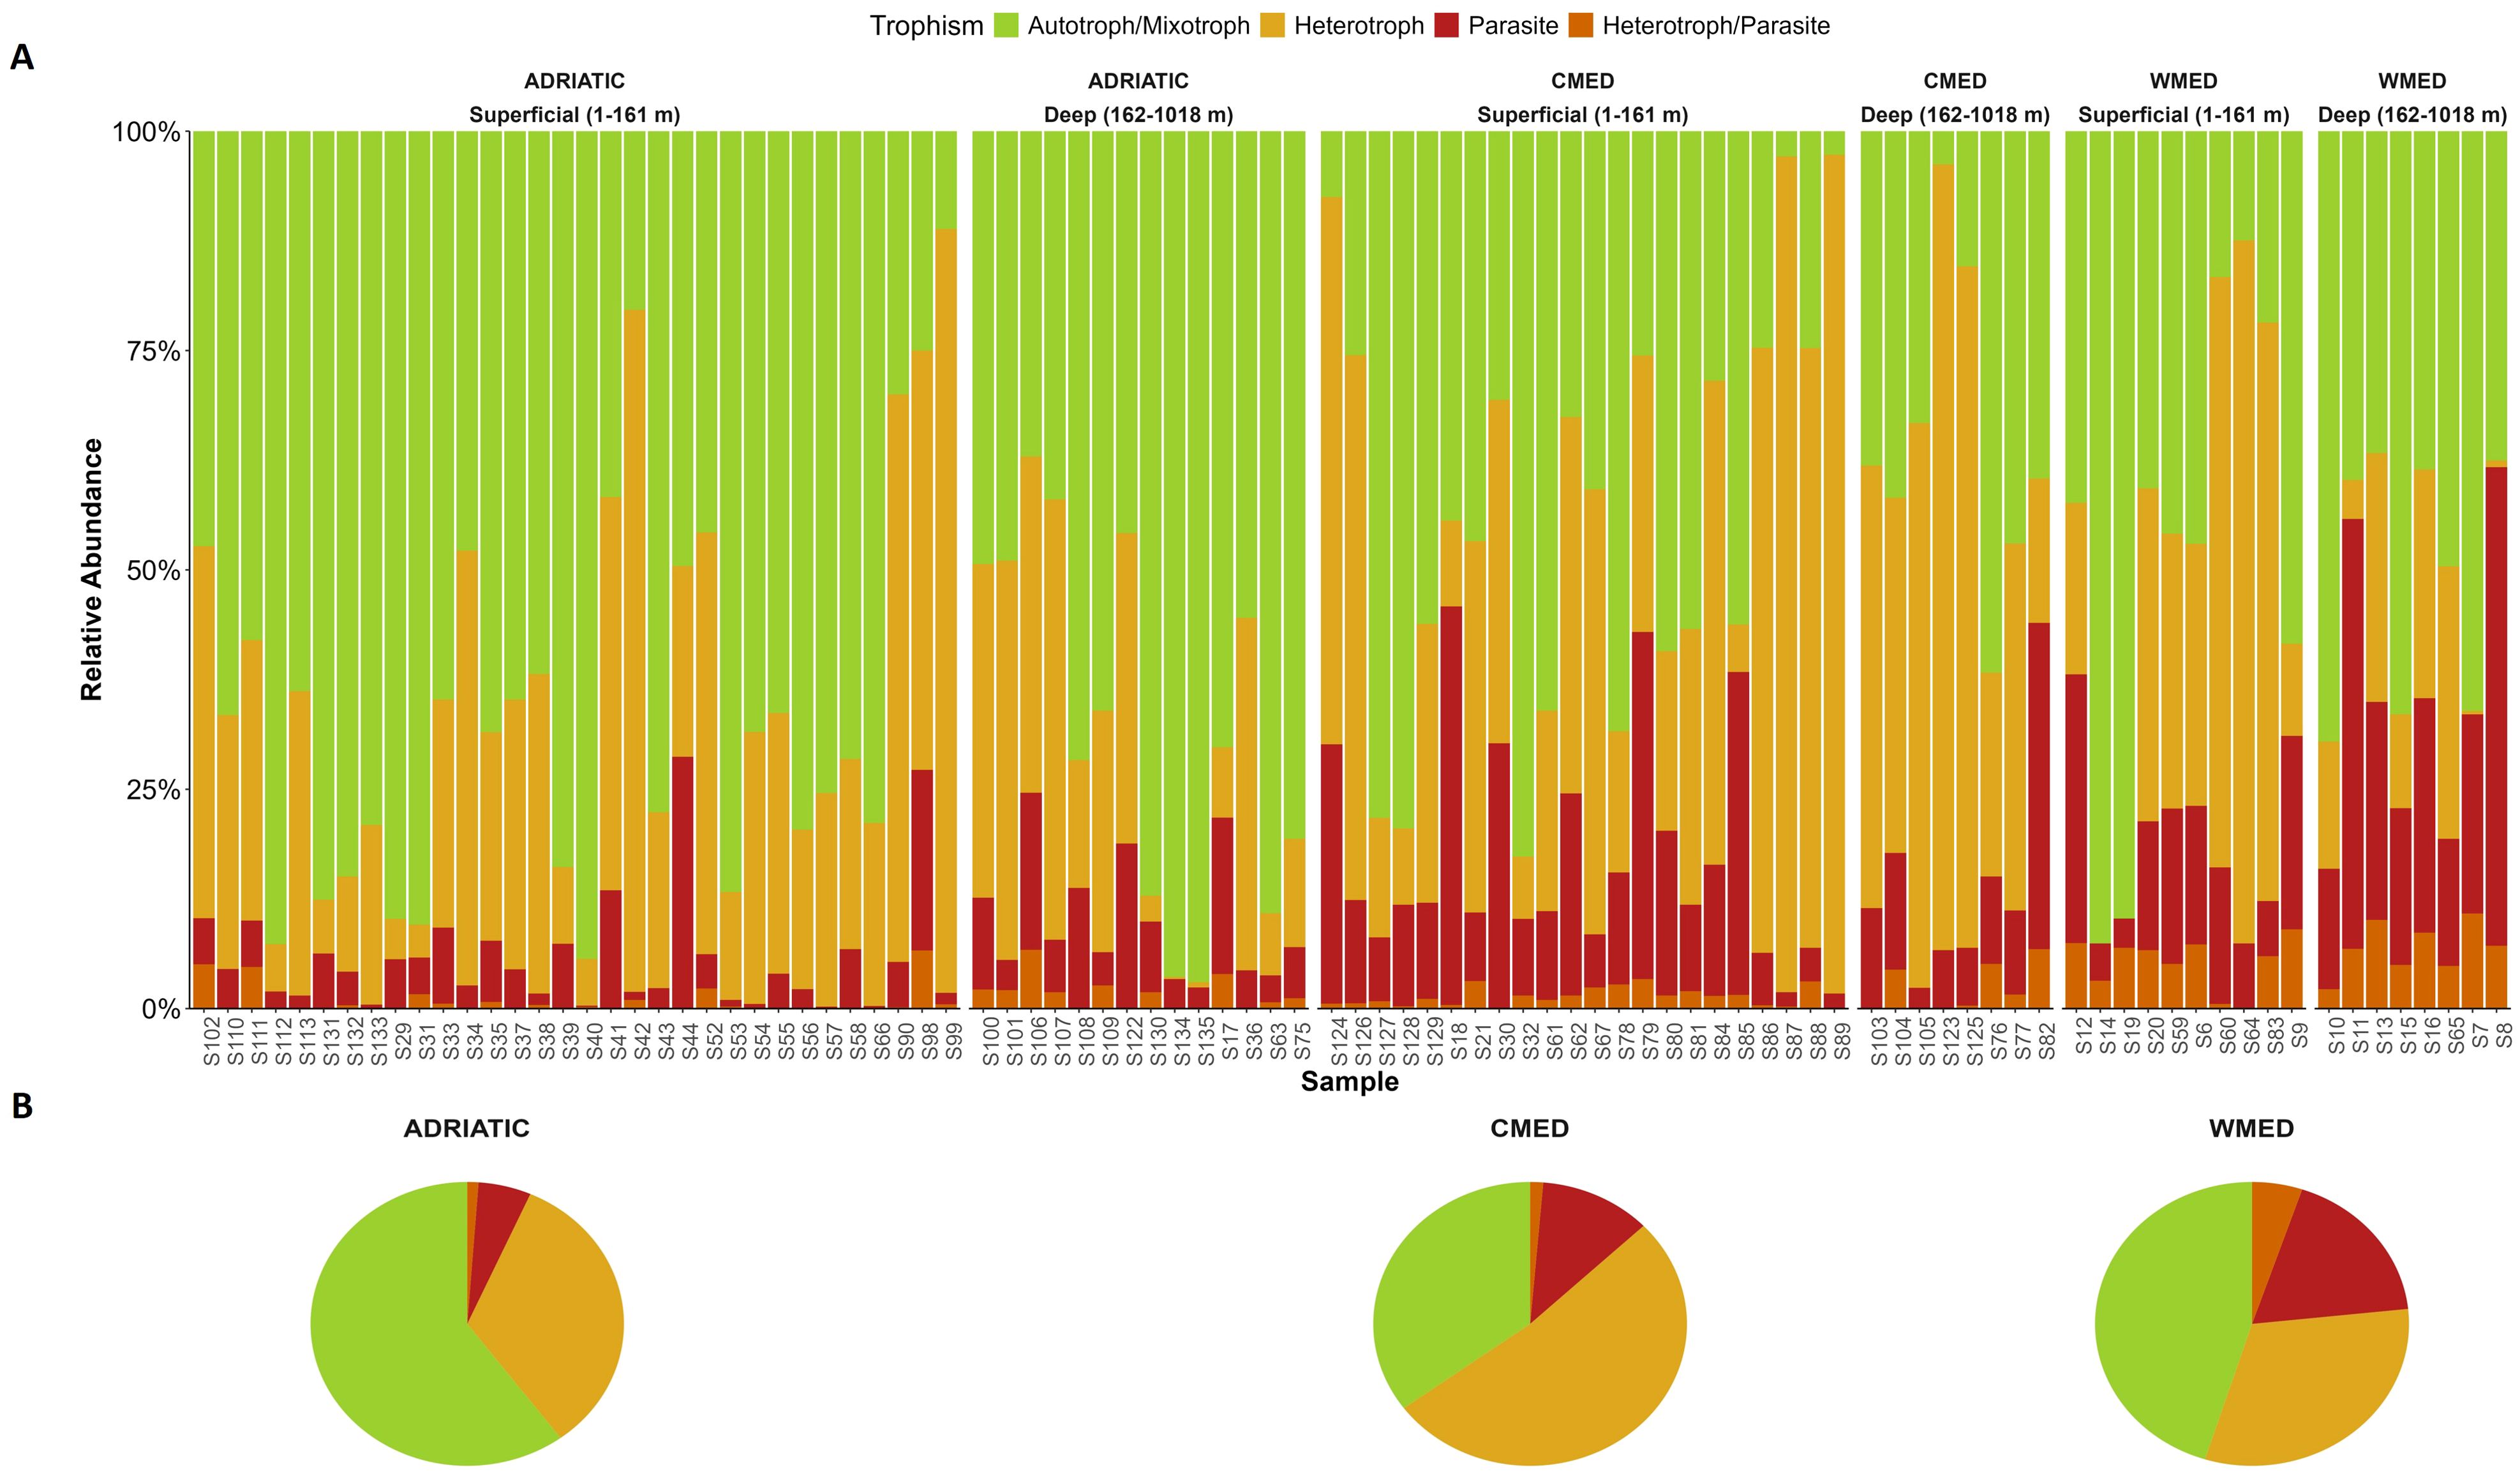
Figure 4. Trophic composition of protist communities in the three Mediterranean subregions studied: Adriatic Sea (ADRIATIC), Ionian – Central Mediterranean Sea (CMED), and Western Mediterranean Sea (WMED). The bar charts (A) show the relative abundance (y-axis) of each protist trophic group for each sampling site (x-axis); sites are ordered by depth groups (superficial; deep). The pie charts (B) show the relative abundance of protist trophic groups in each subregion: ADRIATIC, CMED and WMED.
Considering the trophic function of the Mediterranean protist communities, the surface sediments of ADRIATIC showed the highest relative abundance of autotrophic/mixotrophic organisms (65.45%; Supplementary Table S8), followed by WMED (48.43%). CMED showed a more balanced composition between the autotrophic/mixotrophic (40.7%) and heterotrophic (42.85%) components. The parasitic and heterotrophic/parasitic components were not dominant in any subregion but showed high relative abundances in CMED and WMED.
For each trophic group, the three marine subregions showed no differences in terms of the main protist orders detected, but differences were found in terms of their relative abundances (Supplementary Table S9).
Alpha diversity was calculated for each trophic group among the sites of each subregion (Supplementary Table S10). The autotrophic/mixotrophic component showed the highest mean per sample for the three alpha diversity indices calculated in all the three Mediterranean subregions. The trophic groups showed significant differences among the three marine subregions for ASV richness, Shannon index and Simpson index (Kruskal-Wallis, p-value < 0.05; Supplementary Table S11). Specifically, when considering the autotrophic/mixotrophic component, ADRIATIC and CMED were found to be significantly different for all the alpha diversity indices computed (Dunn’s post hoc test, p-value < 0.01; Supplementary Table S11). Heterotrophic protists showed significant differences for the Shannon index between ADRIATIC and WMED, as well as between WMED and CMED, (Dunn’s post hoc test, p-value < 0.05; please refer to Supplementary Table S12). However, it is worth noting that only WMED and CMED exhibited significant differences in heterotrophic ASV richness and Simpson index. When considering parasitic protists, ADRIATIC was found to be significantly different from both CMED and WMED in terms of ASV richness and Shannon index (Dunn’s post hoc test, p-value < 0.05);, but only from CMED for the Simpson index. With regards to the heterotrophic/parasitic component, it was observed that ADRIATIC had a significantly different ASV richness compared to CMED and WMED (Dunn’s post hoc test, p-value < 0.05). However, only a difference in Shannon index was observed between ADRIATIC and WMED, while a marginally significant difference (Dunn’s post hoc, p-value = 0.054) was found between ADRIATIC and CMED for Simpson index (Supplementary Table S12).
The non-metric multidimensional scaling (nMDS) was implemented to examine protist communities according to trophic groups. The findings indicated that there was partial overlap among the three marine subregions (Supplementary Figure S4). However, the two-way ANOSIM test rejected the null hypothesis of equal assemblages for the three Mediterranean subregions (R = 0.2, p-value < 0.001). Conversely, no significant relationship was found when considering depth groups. The one-way ANOSIM test was then performed to compare the benthic protist assemblages of the three subregions. According to the results, only ADRIATIC was found to differ significantly from CMED and WMED (Supplementary Table S13).
4 Discussion
The aim of this study was to examine microeukaryotic communities in surface sediments of three Mediterranean marine subregions: the Adriatic Sea, Ionian–Central Mediterranean Sea, and the Western Mediterranean Sea. The taxonomic level and trophic function were studied, by means of an eDNA metabarcoding approach targeting the V4 region of the 18S SSU rDNA.
The relative abundance of Alveolata and Stramenopiles were found to be dominant in the three marine subregions. This observation is in line with previous studies that examined surface sediments from different areas including the Yellow Sea (Gong et al., 2015) and various coastal sites in Europe (Forster et al., 2016). These two protist supergroups are known for their contribution to primary productivity and their role in the carbon cycle. They include many planktonic microeukaryotes, such as diatoms and dinoflagellates (Pernice et al., 2013; Brannock et al., 2016; Zamora-Terol et al., 2020; Mordret et al., 2023). With regards to the Alveolata division, the samples included several orders, such as Peridiniales, Gonyaulacales, Gymnodiniales, Oligotrichida and Prorodontida. It was known that these orders include species that can produce resting stages (Montresor et al., 1998; Kim et al., 2002; Ellegaard and Ribeiro, 2018; Belmonte and Rubino, 2019; Dzhembekova et al., 2020). Two additional orders with high relative abundances within this division were the parasitic orders Dino-Group-I and Dino-Group-II. The presence of these orders has been observed in marine sediments (Guillou et al., 2008; Gong et al., 2015). Some species within these orders produce free dinospores that infect hosts, which may contribute to the termination of algal blooms, with recovered ranges of infected cells between 1% and 25% (Siano et al., 2011). It has been observed that these parasites can survive in the resting stage of the parasitized organism (Chambouvet et al., 2011; Jephcott et al., 2016).
The Stramenopiles division comprised Chaetocerotales order, which is known to produce resting stages (Ellegaard and Ribeiro, 2018; Belmonte and Rubino, 2019). Additionally, some heterotrophic nanoflagellate species in Anoecales order are cosmopolitan, inhabiting both sediments and the water column (e.g., Caecitellus parvulus). However, there is currently no available information on the encystment capacity of certain Stramenopiles orders, such as Anoecales, Borokales, Labyrinthulomycetes, and Paraliales. These orders may include organisms able of living in or on sediments for part or all their life cycle and their occurrence have been reported also by other studies (Gong et al., 2015; Obiol et al., 2021; Ríos-Castro et al., 2022; Schoenle et al., 2021; Cordier et al., 2022).
The alpha diversity, computed on the detected protist ASVs, showed significant differences among the three Mediterranean subregions for all indices analyzed in the Alveolata and Stramenopiles divisions. These divisions were the most diverse and displayed the most pronounced signal in terms of alpha diversity differences among subregions. Moreover, regional differences were found in the ASV richness and Simpson index of the division Kathablepharidacea, in the Shannon index for Cryptophyta and in the Simpson index for Telonema. At the order rank, the taxonomic composition of the investigated protist communities showed significant differences among the three Mediterranean subregions. Similarly, differences among the three marine subregions were highlighted also when protist assemblages were examined in terms of their functional diversity, particularly their trophic role. In fact, the analysis of alpha diversity conducted on all the ASVs of the four trophic groups (i.e., autotrophs/mixotrophs, heterotrophs, parasites and heterotrophs/parasites) showed significant differences for all the trophic groups in the three subregions. When the functional diversity was investigated in terms of community composition, significant differences were found, highlighting the ADRIATIC significantly different from the other two Mediterranean subregions and presenting the highest relative abundance of autotrophic/mixotrophic protists which constituted more than half of the community functional composition (Supplementary Table S8). These taxonomic composition and trophic differences of benthic protist communities retrieved among Mediterranean subregions may reflect their varying ecological conditions and dynamics. Benthic protist communities can be diversified depending on various physical and chemical features of the water column near the sediment such as temperature, pH, salinity, and dissolved oxygen, as well as sediment granulometry and organic matter content (Gong et al., 2015; Pedersen et al., 2015; Forster et al., 2016). All these ecological factors can promote habitat heterogeneity shaping different microhabitats, which in turn may favor some taxa over others. Therefore, while some benthic microeukaryotes are generalist and can be found in many different habitats, others are more specialized and may only be found in specific microhabitats (Brandt et al., 2007; Hortal et al., 2009; Menden-Deuer and Fredrickson, 2010; Forster et al., 2016; Obiol et al., 2021). Geological structures of the seafloor can also play a crucial role in shaping benthic protist communities, leading to spatial segregation (Scheckenbach et al., 2010; Gong et al., 2015), and ultimately, creating conditions for allopatric speciation (Forster et al., 2016). In addition, the structure of plankton assemblages in the water column can also be affected by trophic and hydrodynamic processes that can vary among Mediterranean subregions (Glibert et al., 2005; Valbi et al., 2019; Casabianca et al., 2020). Protist taxa have diverse potential for colonization, differing in performance and fitness under certain ecological conditions (or stability/instability), which is another mechanism that could drive regional differences (Barton et al., 2013). However, it is important to note that microplankton populations, including species that produce resting stages, are usually highly interconnected due to their high dispersal abilities (Norris, 2000; Palumbi, 2003).
The Mediterranean Sea is characterized by semi-closed circulation patterns due to the coastal topography. Water masses flow in from the Atlantic Ocean and divide into western and eastern Mediterranean basins at the Strait of Sicily undergoing an initial division (Demirov and Pinardi, 2001) and influencing the dispersal dynamics of pelagic planktonic organisms and the sinking of resting stages (Godhe and Härnström, 2010; Halkett et al., 2005; Penna et al., 2010).
Productive areas are characterized by a higher presence of phototrophic organisms compared to heterotrophs (Gasol et al., 1997). Conversely, the heterotrophic component dominates the benthic and deep-sea food webs, which relies on the amount of sinking organic matter and in turn decreases with depth (Tecchio et al., 2013). In this study, the ADRIATIC was the subregion with the highest relative abundance of autotrophic/mixotrophic protists, having also the lower average depth of the sampled stations compared to WMED and CMED. This can result in shorter sinking times of pelagic organisms, which can represent the dominant fraction of the autotrophic/mixotrophic component. The productivity of the northwestern part of the Adriatic Sea is widely recognized, and this is largely attributed to the nutrient inputs from the main river Po and other minor rivers, as well as its hydrodynamic (Poulain and Cushman-Roisin, 2001; Campanelli et al., 2004; Cozzi and Giani, 2011; Grilli et al., 2020; Ricci et al., 2022). In contrast, CMED and WMED are generally considered to have more oligotrophic waters (Krom et al., 1991; Turley et al., 2000; Ridame and Guieu, 2002; Siano et al., 2011). It has been observed that the nutrient levels in the Mediterranean Sea gradually decrease from west to east (Krom et al., 1991), with a decline in chlorophyll a concentration (Ignatiades et al., 2009) and primary productivity (Turley et al., 2000; Moutin and Raimbault, 2002). The CMED, which represented the eastern and deeper subregion of this study, had the highest relative abundance of heterotrophic taxa, being also the most observed trophic habit of the subregion. The functional diversity of the subregions was likely to be determined by factors such as nutrient input and bathymetry.
Among the subregions, the autotrophic/mixotrophic protists were mainly represented by orders that can produce resting stages and sink to the seafloor. It is noteworthy that ADRIATIC, being the shallower subregion, it may have relatively short sinking times and, being also the most productive, could be characterized by a higher formation of resting stages at the end of algal blooms (Totti et al., 2019; Ellegaard and Ribeiro, 2018; Casabianca et al., 2020; Neri et al., 2023). Heterotrophic protists were mainly represented by Anoecales and Borokales (Supplementary Table S9), which corresponded to two of the five orders that contributed most to the differentiation of the communities between the three subregions. Furthermore, ADRIATIC and WMED showed high relative abundances of a heterotrophic order that can produce resting stages such as the Oligotrichida. Regarding the parasites, the highest relative abundances were shown by dinoflagellate parasites (i.e., Dino-Group-I and Dino-Group-II) and parasites living in the benthic compartment (i.e., Labyrinthulomycetes) (Raghukumar and Damare, 2011; Gong et al., 2015).
In this study, no significant differences in the community composition of benthic protists between the two groups of samples defined based on sediment depths were found at either the taxonomic composition level or trophic function. However, this did not necessarily mean that differences between shallow and deeper protist assemblages do not exist. Rather, it indicated that they were not highlighted by our approach of grouping samples into two distinct, discrete clusters. A study conducted in the Black Sea did not reveal any significant pattern between phytoplankton resting stages and depth distributions clustered by habitat (Dzhembekova et al., 2018). Conversely, a relationship was found between alpha and beta diversities of benthic protists and depth gradient in coastal surface sediments within a limited depth range (14 m – 75 m) of the Yellow Sea (Gong et al., 2015). Further studies may be necessary to investigate this aspect in benthic protist communities of the Mediterranean Sea, considering the highlighted regional differences and implementing a specific sampling design.
In our study, we included negative controls (blanks) during sediment sample processing, DNA extraction and PCR amplification. We found that the process of separating the resting stages from sediments using steel meshes resulted in minor cross-contamination, even when all precautions were taken to avoid it. Indeed, the fractionation of samples, depending on their size, might result in the retention of fragments in the sieves’ steel mesh (Massana et al., 2015). Therefore, a post-sequencing bioinformatic process was used to decontaminate the samples. Alternative procedures for separating protist cells from sediments for DNA metabarcoding of benthic samples, such as melting seawater-ice elution, have demonstrated good performance (Uhlig, 1964; Reñé et al., 2020).
Positive controls (i.e., mock communities of known taxa composition) were also included, to test for potential amplification failure. Two of the seven species included in the mock communities were not detected in a limited number of cases, suggesting that diversity estimates derived from metabarcoding may not be free from bias. This can be due to different technical and biological reasons and, considering the targeted barcode region, to the widely documented variation in 18S rDNA subunit’s gene copy number among protist groups and species, which can lead to the non-detection of some taxa (i.e., false negatives) and discrepancies between true abundances and metabarcoding-derived estimates (Gong and Marchetti, 2019; Marinchel et al., 2023). This bias could potentially be overcome using an eDNA metabarcoding approach that involves the use of multiple primer pairs (Ficetola and Taberlet, 2023).
It should be also noted that the study of benthic protists is made difficult by the processes impacting sediment dynamics. In fact, the seafloor has a role in shaping communities, as it is subject to continuous surface resuspension, which may depend on surface waves, the effect of storms, shipping and trawling, with more or less strong effects depending on depth (Giannakourou et al., 2005; Sanchez-Vidal et al., 2012). Thus, the sedimentation rates, the mechanical resuspension and the interactions between benthic and pelagic habitats, make the assessment of the dynamics in the proximity of sediments challenging (Giannakourou et al., 2005; Cibic et al., 2022). Moreover, currents, horizontal flow speed, upwelling and depth have been shown to influence the dispersal, transport and sinking rates of eDNA particles, living microorganisms and resting stages, with the potential to be recovered in sediments far from their origin (Harrison et al., 2019; Nooteboom et al., 2019; Nguyen et al., 2023).
When applying eDNA metabarcoding to sediments, another important aspect to consider is that they represent a complex matrix. In fact, sediments collect a mixture of extra- and intra-cellular DNA, hampering the differentiation between living and dead organisms (Pawlowski et al., 2022). Moreover, once eDNA reaches the seafloor, it can be adsorbed by sediments and protected from degradation (Romanowski et al., 1991), with extremely variable decay times (ranging from days to thousands of years) depending on sediment structure and on the abiotic and biotic processes involved (Harrison et al., 2019; Ellegaard et al., 2020; Pawlowski et al., 2022). In our study, this was not an issue as we were interested in detecting the benthic organisms and the resting stage component sinking from the pelagic domain. The long-term persistence of eDNA in sediments could be an additional source of uncertainty when reconstructing living benthic communities or using them for monitoring purposes (Harrison et al., 2019).
It is worth highlighting that, while our findings may be influenced by some biases, the associated errors are systematic and do not invalidate the relative comparisons between samples and Mediterranean subregions. As a result, we can state that the major findings of our study are robust, particularly in terms of the discovered changes in benthic protist community composition throughout the three Mediterranean subregions.
5 Conclusions
Our study provided important insights into the benthic protist communities of surface sediments in Mediterranean subregions. Results obtained from the eDNA metabarcoding approach highlighted spatial differences in terms of taxonomic composition and trophic function. Despite the similar relative abundances of two divisions in three subregions, the relative contribution of orders outlined regional differences and rare taxa exclusive to one or two subregions were also detected. The results obtained from the study of trophic function in sediments are consistent with what is already known for the water column and confirm that some Mediterranean subregions can be more productive than others, as evinced by the surface sediments of the Adriatic Sea. On the contrary, no differences were found between protist assemblages when they were clustered in two different bathymetric groups. Despite no clear barriers to the dispersal process of the benthic protists emerged, the communities were found to be heterogenous.
To better understand the drivers underlying the detected pattern of regional differentiation, future studies should consider the sampling of biotic and abiotic factors from both, the water column, and the sediments, with the implementation of a multi-seasonal and multi-annual sampling scheme. Despite some difficulties that can arise in extracting the eDNA from the sediments, we believe that this molecular technique can be a rapid and effective tool in benthic community studies and monitoring.
Data availability statement
The raw sequence data for the DNA metabarcoding experiment are deposited in the NCBI Sequence Read Archive (BioProject accession PRJNA1068337).
Author contributions
NM: Conceptualization, Data curation, Formal analysis, Methodology, Validation, Visualization, Writing – original draft, Writing – review & editing. SC: Writing – review & editing. AM: Formal analysis, Validation, Writing – review & editing. CV: Conceptualization, Supervision, Writing – review & editing. MS: Conceptualization, Data curation, Formal analysis, Validation, Writing – review & editing. AP: Conceptualization, Funding acquisition, Supervision, Validation, Writing – original draft, Writing – review & editing.
Funding
The author(s) declare financial support was received for the research, authorship, and/or publication of this article. This work was supported by a grant of REMEST (REsearch MEthods in Science and Technology) Ph.D School of University of Urbino, Italy. AM acknowledges funding support from the European Union -NextGenerationEU.
Acknowledgments
We thank Samuela Cappellacci and Matteo Girardi for their technical support. We also thank Fondazione E. Mach (FEM) Sequencing and Genotyping Platform for library preparation, amplicon sequencing and demultiplexing. Lastly, we would like to express special thanks to two reviewers for their valuable and constructive comments on an earlier version of the manuscript.
Conflict of interest
The authors declare that the research was conducted in the absence of any commercial or financial relationships that could be construed as a potential conflict of interest.
The author(s) declared that they were an editorial board member of Frontiers, at the time of submission. This had no impact on the peer review process and the final decision.
Publisher’s note
All claims expressed in this article are solely those of the authors and do not necessarily represent those of their affiliated organizations, or those of the publisher, the editors and the reviewers. Any product that may be evaluated in this article, or claim that may be made by its manufacturer, is not guaranteed or endorsed by the publisher.
Supplementary material
The Supplementary Material for this article can be found online at: https://www.frontiersin.org/articles/10.3389/fmars.2024.1427357/full#supplementary-material
Figure S1 | Map of the stations sampled in the Mediterranean Sea along the Italian peninsula. Stations sampled in the Adriatic Sea are shown as circles (ADRIATIC, N = 46), those sampled in the Ionian – Central Mediterranean Sea (CMED, N = 30) as triangles, and those sampled in the Western Mediterranean Sea (WMED, N = 18) as squares. Regional sea borders are reported with dashed lines. Specifically, the boundary between ADRIATIC and CMED is between Capo Santa Maria di Leuca (Italy) (39.8° N, 18.36666° E) and the west coast of Corfu (Greece) (39.75194° N, 19.62777° E). The border between CMED and WMED runs between Capo Bon (37.08333° N, 11.05° E) (Tunisia) and Capo Lilibeo (37.8° N, 12.43333° E) (Sicily, Italy); and also, from Capo Peloro (north-east Sicily, Italy) (38.26666° N, 15.65° E) to Capo Paci (Calabria, Italy) (38.25° N, 15.7° E) on the mainland.
Figure S2 | Rarefaction curves showing the relationship between sequencing depth (number of reads) and number of amplicon sequence variants (number of ASVs) for each site sampled in Adriatic (red), CMED (green) and WMED (blue).
Figure S3 | Relative abundance of the protist community composition per site at order rank for the three Mediterranean subregions studied: Adriatic Sea (ADRIATIC), Ionian – Central Mediterranean Sea (CMED) and Western Mediterranean Sea (WMED). The colours in the legend are ordered by the mean relative abundance of orders among subregions.
Figure S4 | Non-metric multidimensional ordination based on Euclidean distance for trophic level. Convex hulls outline the perimeter of the sites, which are shown in different colours depending on the subregion. Depth groups per subregion are defined by solid (1-161) and dashed (162-1,018) lines.
References
Andrews S. (2010). FastQC: a quality control tool for high throughput sequence data. Available online at: https://www.bioinformatics.babraham.ac.uk/projects/fastqc/ (Accessed August 23, 2024).
Armeli Minicante S., Piredda R., Quero G. M., Finotto S., Bernardi-Aubry F., Bastianini M., et al. (2019). Habitat heterogeneity and connectivity: effects on the planktonic protist community structure at two adjacent coastal sites (the lagoon and the gulf of venice, northern adriatic sea, Italy) revealed by metabarcoding. Front. Microbiol. 10. doi: 10.3389/fmicb.2019.02736
Ayata S. D., Irisson J. O., Aubert A., Berline L., Dutay J. C., Mayot N., et al. (2018). Regionalisation of the Mediterranean basin, a MERMEX synthesis. Prog. Oceanogr. 163, 7–20. doi: 10.1111/ele.12063
Belmonte G., Rubino F. (2019). Resting cysts from coastal marine plankton. Oceanogr. Mar. Biol. Ann. Rev. 57, 73–89. doi: 10.7872/crya/v38.iss1.2017.31
Bolyen E., Rideout J. R., Dillon M. R., Bokulich N. A., Abnet C. C., Al-Ghalith G. A., et al. (2019). Reproducible, interactive, scalable and extensible microbiome data science using QIIME 2. Nat. Biotechnol. 37, 852–857. doi: 10.1038/s41587-019-0209-9
Barton A. D., Pershing A. J., Litchman E., Record N. R., Edwards K. F., Finkel Z. V., et al. (2013). The biogeography of marine plankton traits. Ecol. Lett. 16, 522–534. doi: 10.1111/ele.12063
Brandt A., Gooday A. J., Brandão S. N., Brix S., Brökeland W., Cedhagen T., et al. (2007). First insights into the biodiversity and biogeography of the Southern Ocean deep sea. Nature 447, 307–311. doi: 10.1038/nature05827
Brannock P. M., Ortmann A. C., Moss A. G., Halanych K. M. (2016). Metabarcoding reveals environmental factors influencing spatio-temporal variation in pelagic micro-eukaryotes. Mol. Ecol. 25, 3593–3604. doi: 10.1111/mec.13709
Burki F., Sandin M. M., Jamy M. (2021). Diversity and ecology of protists revealed by metabarcoding. Curr. Biol. 31, R1267–R1280. doi: 10.1016/j.cub.2021.07.066
Callahan B. J., Mcmurdie P. J., Rosen M. J., Han A. W., Jonson A. J. A., Holmes S. P. (2016). DADA2: High-resolution sample inference from Illumina amplicon data. Nat. Methods 13, 581–583. doi: 10.1038/NMETH.3869
Campanelli A., Fornasiero P., Marini M. (2004). Physical and chemical characterization of the water column in the Piceno coastal area (Adriatic Sea). Fresenius Environ. Bull. 13, 430–435.
Caron D. A., Countway P. D., Jones A. C., Kim D. Y., Schnetzer A. (2012). Marine protistan diversity. Ann. Rev. Mar. Sci. 4, 467–493. doi: 10.1146/annurev-marine-120709-142802
Casabianca S., Capellacci S., Ricci F., Andreoni F., Russo T., Scardi M., et al. (2020). Structure and environmental drivers of phytoplanktonic resting stage assemblages in the central Mediterranean Sea. Mar. Ecol. Prog. Ser. 639, 73–89. doi: 10.3354/meps13244
Casabianca S., Capellacci S., Ricci F., Scardi M., Penna A. (2022). A phytoplankton time series in the Northwestern Adriatic Sea: Structure and dynamics of the assemblages in a coastal ecosystem. Estuar. Coast. Shelf Sci. 278, 108109. doi: 10.1016/j.ecss.2022.108109
Chambouvet A., Alves-de-Souze C., Cueff V., Marie D., Karpov S., Guillou L. (2011). Interplay between the parasite Amoebophrya sp (Alveolata) and the cyst formation of the red tide dinoflagellate Scrippsiella Trochoidea. Protist 162, 637–649. doi: 10.1016/j.protis.2010.12.001
Cibic T., Baldassarre L., Cerino F., Comici C., Fornasaro D., Kralj M., et al. (2022). Benthic and pelagic contributions to primary production: experimental insights from the gulf of trieste (Northern adriatic sea). Front. Mar. Sci. 9. doi: 10.3389/fmars.2022.877935
Cloern J. E., Abreu P. C., Carstensen J., Chauvaud L., Elmgren R., Grall J., et al. (2016). Human activities and climate variability drive fast-paced change across the world’s estuarine-coastal system. Glob. Change Biol. 22, 513–529. doi: 10.1111/gcb.13059
Cordier T., Angeles I. B., Henry N., Lejzerowicz F., Berney C., Morard R., et al. (2022). Patterns of eukaryotic diversity from the surface to the deep-ocean sediment. Sci. Adv. 8, 26–28. doi: 10.1126/sciadv.abj9309
Cozzi S., Giani M. (2011). River water and nutrient discharges in the Northern Adriatic Sea: current importance and long term changes. Continent. Shelf Res. 31, 1881–1893. doi: 10.1016/j.csr.2011.08.010
D’Ortenzio F., Ribera d’Alcalà M. (2009). On the trophic regimes of the Mediterranean Sea: a satellite analysis. Biogeosciences 5, 139–148. doi: 10.2307/2963459
del Campo J., Carlos-Oliveira M., Čepička I., Hehenberger E., Horák A., Karnkowska A., et al. (2023). The protist cultural renaissance. Trends Microbiol. 32, 128–131. doi: 10.1016/j.tim.2023.11.010
Demirov E., Pinardi N. (2001). Simulation of the Mediterranean Sea circulation from 1979 to 1993: Part I. The interannual variability. J. Mar. Syst. 33, 23–50. doi: 10.1016/S0924-7963(02)00051-9
De Vargas C., Audic S., Henry N., Decelle J., Mahé F., Logares R., et al. (2015). Eukaryotic plankton diversity in the sunlit ocean. Science 348, 1261605. doi: 10.1126/science.1261605
Dzhembekova N., Moncheva S., Ivanova P., Slabakova N., Nagai S. (2018). Biodiversity of phytoplankton cyst assemblages in surface sediments of the Black Sea based on metabarcoding. Biotechnol. Biotechnol. Equip. 32, 1507–1513. doi: 10.1080/13102818.2018.1532816
Dzhembekova N., Rubino F., Nagai S., Zlateva I., Slabakova N., Ivanova P., et al. (2020). Comparative analysis of morphological and molecular approaches integrated into the study of the dinoflagellate biodiversity within the recently deposited Black Sea sediments-benefits and drawbacks. Biodivers. Data J. 8, E55172. doi: 10.3897/BDJ.8.E55172
Ellegaard M., Clokie M. R. J., Czypionka T., Frisch D., Godhe A., Kremp A., et al. (2020). Dead or alive: sediment DNA archives as tools for tracking aquatic evolution and adaptation. Commun. Biol. 3, 1–11. doi: 10.1038/s42003-020-0899-z
Ellegaard M., Ribeiro S. (2018). The long-term persistence of phytoplankton resting stages in aquatic ‘seed banks.’. Biol. Rev. 93, 166–183. doi: 10.1111/brv.12338
Ficetola G. F., Taberlet P. (2023). Towards exhaustive community ecology via DNA metabarcoding. Mol. Ecol. 32, 6320–6329. doi: 10.1111/mec.16881
Forster D., Dunthorn M., Mahé F., Dolan J. R., Audic S., Bass D., et al. (2016). Benthic protists: The under-charted majority. FEMS Microbiol. Ecol. 92, 1–11. doi: 10.1093/femsec/fiw120
Fuks D., Ivančić I., Najdek M., Lučić D., Njire J., Godrijan J., et al. (2012). Changes in the planktonic community structure related to trophic conditions: The case study of the northern Adriatic Sea. J. Mar. Syst. 96–97. doi: 10.1016/j.jmarsys.2012.02.006
Gasol J. M., del Giorgio P. A., Duarte C. M. (1997). Biomass distribution in marine plank- tonic communities. Limnol. Oceanogr. 42, 1353–1363. doi: 10.4319/lo.1997.42.6.1353
Giannakourou A., Orlova T. Y., Assimakopoulou G., Pagou K. (2005). Dinoflagellate cysts in recent marine sediments from Thermaikos Gulf, Greece: Effects of resuspension events on vertical cyst distribution. Cont. Shelf Res. 25, 2585–2596. doi: 10.1016/j.csr.2005.08.003
Glibert P. M., Seitzinger S., Heil C. A., Burkholder J. M., Parrow M. W., Codispoti L. A., et al. (2005). The role of eutrophication in the global proliferation of harmful algal blooms. Oceanography 18, 198–209. doi: 10.5670/oceanog.2005.54
Godhe A., Härnström K. (2010). Linking the planktonic and benthic habitat: Genetic structure of the marine diatom Skeletonema marinoi. Mol. Ecol. 19, 4478–4490. doi: 10.1111/j.1365-294X.2010.04841.x
Gong W., Marchetti A. (2019). Estimation of 18S gene copy number in marine eukaryotic plankton using a next-generation sequencing approach. Front. Mar. Sci. 6. doi: 10.3389/fmars.2019.00219
Gong J., Shi F., Ma B., Dong J., Pachiadaki M., Zhang X., et al. (2015). Depth shapes α- and β-diversities of microbial eukaryotes in surficial sediments of coastal ecosystems. Environ. Microbiol. 17, 3722–3737. doi: 10.1111/1462-2920.12763
Grilli F., Accoroni S., Acri F., Bernardi Aubry F., Bergami C., Cabrini M., et al. (2020). Seasonal and interannual trends of oceanographic parameters over 40 Years in the northern Adriatic Sea in relation to nutrient loadings using EMODnet chemistry data Portal. Water 12, 2280. doi: 10.3390/w12082280
Guillou L., Bachar D., Audic S., Bass D., Berney C., Bittner L., et al. (2013). The Protist Ribosomal Reference database (PR2): a catalog of unicellular eukaryote Small Sub-Unit rRNA sequences with curated taxonomy. Nucleic Acids Res. 41, 597–604. doi: 10.1093/nar/gks1160
Guillou L., Viprey M., Chambouvet A., Welsh R. M., Kirkham A. R., Massana R., et al. (2008). Widespread occurrence and genetic diversity of marine parasitoids belonging to Syndiniales (Alveolata). Environ. Microbiol. 10, 3349–3365. doi: 10.1111/j.1462-2920.2008.01731.x
Halkett F., Simon J. C., Balloux F. (2005). Tackling the population genetics of clonal and partially clonal organisms. Trends Ecol. Evol. 20, 194–201. doi: 10.1016/j.tree.2005.01.001
Hammer Ø., Harper D. A. T., Ryan P. D. (2001). PAST: paleontological statistics software package for education and data analysis. Palaeontol. Electron. 4, 9.
Harrison J. B., Sunday J. M., Rogers S. M. (2019). Predicting the fate of eDNA in the environment and implications for studying biodiversity. Proc. R. Soc B Biol. Sci. 286, 20191409. doi: 10.1098/rspb.2019.1409
Hortal J., Triantis K. A., Meiri S., Thébault E., Sfenthourakis S. (2009). Island species richness increases with habitat diversity. Am. Nat. 174, E205–E217. doi: 10.1086/645085
Ignatiades L., Gotsis-Skretas O., Pagou K., Krasakopoulou E. (2009). Diversification of phytoplankton community structure and related parameters along a large-scale longitudinal east–west transect of the Mediterranean Sea. J. Plankton Res. 31, 411–428. doi: 10.1093/plankt/fbn124
Jensen H. M., Panagiotidis P., Reker J. (2017). Delineation of the MSFD article 4 marine regions and subregions. Version 1.0. Technical document (ICES & EEA).
Jephcott T. G., Alves-De-Souza C., Gleason F. H., Van Ogtrop F. F., Sime-Ngando T., Karpov S. A., et al. (2016). Ecological impacts of parasitic chytrids, syndiniales and perkinsids on populations of marine photosynthetic dinoflagellates. Fungal Ecol. 19, 47–58. doi: 10.1016/j.funeco.2015.03.007
Keeling P. J., del Campo J. (2017). Marine protists are not just big bacteria. Curr. Biol. 27, R541–R549. doi: 10.1016/j.cub.2017.03.075
Kim J. H., Kim J. H., Wang P., Park B. S., Han M. S. (2016). An improved quantitative real-time PCR assay for the enumeration of heterosigma akashiwo (Raphidophyceae) cysts using a DNA debris removal method and a cyst-based standard curve. PloS One 11, e0145712. doi: 10.1371/journal.pone.0145712
Kim Y. O., Suzuki T., Taniguchi A. (2002). A new species in the genus Cyrtostrombidium (Ciliophora, Oligotrichia, Oligotrichida): its morphology, seasonal cycle and resting stage. J. Eukaryot. Microbiol. 49, 338–343. doi: 10.1111/j.1550-7408.2002.tb00380.x
Klemm D. J., Lewis P. A., Fulk F., Lazorchak J. M. (1990). Macroinvertebrate field and laboratory methods for evaluating the biological integrity of surface waters (Washington, DC: US Environmental Protection Agency). EPA-600-4-90-030.
Kremp A., Hinners J., Klais R., Leppänen A. P., Kallio A. (2018). Patterns of vertical cyst distribution and survival in 100-year-old sediment archives of three spring dinoflagellate species from the Northern Baltic Sea. Eur. J. Phycol. 53, 135–145. doi: 10.1080/09670262.2017.1386330
Krom M. D., Kress N., Brenner S., Gordon L. (1991). Phosphorus limitation of primary productivity in the Eastern Mediterranean Sea. Limnol. Oceanogr. 36, 424–432. doi: 10.4319/lo.1991.36.3.0424
Marinchel N., Marchesini A., Nardi D., Girardi M., Casabianca S., Vernesi C., et al. (2023). Mock community experiments can inform on the reliability of eDNA metabarcoding data: a case study on marine phytoplankton. Sci. Rep. 13, 1–15. doi: 10.1038/s41598-023-47462-5
Martin M. (2011). Cutadapt removes adapter sequences from high-throughput sequencing reads. EMB-net.journal 17, 10–12.
Massana R., Gobet A., Audic S., Bass D., Bittner L., Boutte C., et al. (2015). Marine protist diversity in European coastal waters and sediments as revealed by high-throughput sequencing. Environ. Microbiol. 17, 4035–4049. doi: 10.1111/1462-2920.12955
McKnight D. T., Huerlimann R., Bower D. S., Schwarzkopf L., Alford R. A., Zenger K. R. (2019). microDecon: A highly accurate read-subtraction tool for the post-sequencing removal of contamination in metabarcoding studies. Environ. DNA 1, 14–25. doi: 10.1002/edn3.11
Menden-Deuer S., Fredrickson K. (2010). Structure-dependent, protistan grazing and its implication for the formation, maintenance and decline of plankton patches. Mar. Ecol. Prog. Ser. 420, 57–71. doi: 10.3354/meps08855
Moncada C., Ellrot A., de Beer D., Amann R., Knittel K. (2024). The Ellrot grab: A small, lightweight sediment sampler for collecting undisturbed sandy sediments. Limnol. Oceanogr.: Methods 22, 159–169. doi: 10.1002/lom3.10598
Montresor M., Zingone A., Sarno D. (1998). Dinoflagellate cyst production at a coastal Mediterranean site. J. Plankton Res. 20, 2291–2312. doi: 10.1093/plankt/20.12.2291
Mordret S., Piredda R., Zampicinini G., Kooistra W. H. C. F., Zingone A., Montresor M., et al. (2023). Metabarcoding reveals marked seasonality and a distinctive winter assemblage of dinoflagellates at a coastal LTER site in the Gulf of Naples. Mar. Ecol. 44, 1–12. doi: 10.1111/maec.12758
Moutin T., Raimbault P. (2002). Primary production, carbon export and nutrients availability in western and eastern Mediterranean Sea in early summer 1996 (MINOS cruise). J. Mar. Syst. 33, 273–288. doi: 10.1016/S0924-7963(02)00062-3
Neri F., Romagnoli T., Accoroni S., Ubaldi M., Garzia A., Pizzuti A., et al. (2023). Phytoplankton communities in a coastal and offshore stations of the northern Adriatic Sea approached by network analysis and different statistical descriptors. Estuar. Coast. Shelf Sci. 282, 108224. doi: 10.1016/j.ecss.2023.108224
Nguyen N., Devendra D., Weiner A. K. M., Ray J. L., Cordier T., De Schepper S., et al. (2023). Sedimentary ancient DNA: a new paleogenomic tool for reconstructing the history of marine ecosystems. Front. Mar. Sci. 10. doi: 10.3389/fmars.2023.1185435
Nooteboom P. D., Bijl P. K., van Sebille E., von der Heydt A. S., Dijkstra H. A. (2019). Transport bias by ocean currents in sedimentary microplankton assemblages: implications for paleoceanographic reconstructions. Paleoceanogr. Paleoclimatology 34, 1178–1194. doi: 10.1029/2019PA003606
Norris R. D. (2000). Pelagic species diversity, biogeography, and evolution. Paleobiology 26, 236–258. doi: 10.1666/0094-8373(2000)26[236:PSDBAE]2.0.CO;2
Obiol A., Muhovic I., Massana R. (2021). Oceanic heterotrophic flagellates are dominated by a few widespread taxa. Limnol. Oceanogr. 66, 4240–4253. doi: 10.1002/lno.11956
Oksanen J. F., Blanchet F. G., Friendly M., Kindt R., Legendre P., McGlinn D., et al. (2017). vegan: community ecology package. Available online at: https://CRAN.R-project.org/package=vegan (Accessed August 23, 2024).
Palumbi S. R. (2003). Population genetics, demographic connectivity, and the design of marine reserves. Ecol. Appl. 13, S146–S158. doi: 10.1890/1051-0761(2003)013[0146:PGDCAT]2.0.CO;2
Pawlowski J., Bruce K., Panksep K., Aguirre F. I., Amalfitano S., Apothéloz-Perret-Gentil L., et al. (2022). Environmental DNA metabarcoding for benthic monitoring: A review of sediment sampling and DNA extraction methods. Sci. Total Environ. 818, 151783. doi: 10.1016/j.scitotenv.2021.151783
Pedersen M. W., Overballe-Petersen S., Ermini L., Der Sarkissian C., Haile J., Hellstrom M., et al. (2015). Ancient and modern environmental DNA. Philos. Trans. R. Soc B Biol. Sci. 370, 20130383. doi: 10.1098/rstb.2013.0383
Penna A., Battocchi C., Garcés E., Anglès S., Cucchiari E., Totti C., et al. (2010). Detection of microalgal resting cysts in European coastal sediments using a PCR-based assay. Deep. Res. Part II Top. Stud. Oceanogr. 57, 288–300. doi: 10.1016/j.dsr2.2009.09.010
Perini F., Bastianini M., Capellacci S., Pugliese L., DiPoi E., Cabrini M., et al. (2019). Molecular methods for cost-efficient monitoring of HAB (harmful algal bloom) dinoflagellate resting cysts. Mar. pollut. Bull. 147, 209–218. doi: 10.1016/j.marpolbul.2018.06.013
Pernice M. C., Logares R., Guillou L., Massana R. (2013). General patterns of diversity in major marine microeukaryote lineages. PloS One 8, e57170. doi: 10.1371/journal.pone.0057170
Poulain P. M., Cushman-Roisin B. (2001). “Chapter 3: circulatio,” in Physical oceanography of the Adriatic Sea – Past, present and future. Ed. Cushman-Roisin, et al (Kluwer Academic Publishers, Dordrecht, The Netherlands), 67–109.
Raghukumar S., Damare V. S. (2011). Increasing evidence for the important role of Labyrinthulomycetes in marine ecosystem. Bot. Mar. 54, 3–11. doi: 10.1515/BOT.2011.008
Reñé A., Auladell A., Reboul G., Moreira D., López-García P. (2020). Performance of the melting seawater-ice elution method on the metabarcoding characterization of benthic protist communities. Environ. Microbiol. Rep. 12. doi: 10.1111/1758-2229.12834
Reygondeau G., Guieu C., Benedetti F., Irisson J. O., Ayata S. D., Gasparini S., et al. (2017). Biogeochemical regions of the Mediterranean Sea: An objective multidimensional and multivariate environmental approach. Prog. Oceanogr. 151, 138–148. doi: 10.1016/j.pocean.2016.11.001
Ricci F., Capellacci S., Campanelli A., Grilli F., Marini M., Penna A. (2022). Long-term dynamics of annual and seasonal physical and biogeochemical properties: Role of minor river discharges in the North-western Adriatic coast. Estuar. Coast. Shelf Sci. 272, 107902. doi: 10.1016/j.ecss.2022.107902
Ridame C., Guieu C. (2002). Saharan input of phosphate to the oligotrophic water of the open western Mediterranean Sea. Limnol. Oceanogr. 47, 856–869. doi: 10.4319/lo.2002.47.3.0856
Ríos-Castro R., Costas-Selas C., Pallavicini A., Vezzulli L., Novoa B., Teira E., et al. (2022). Co-occurrence and diversity patterns of benthonic and planktonic communities in a shallow marine ecosystem. Front. Mar. Sci. 9. doi: 10.3389/fmars.2022.934976
Rognes T., Flouri T., Nicholas B., Quince C., Mahé F. (2016). VSEARCH: a versatile open source tool for metagenomics. PeerJ 4, e2584. doi: 10.7717/peerj.2584
Romanowski G., Lorenz M. G., Wackernagel W. (1991). Adsorption of plasmid DNA to mineral surfaces and protection against DNase I. Appl. Environ. Microbiol. 57, 1057–1061. doi: 10.1128/AEM.57.4.1057-1061.1991
Ruppert K. M., Kline R. J., Rahman M. S. (2019). Past, present, and future perspectives of environmental DNA (eDNA) metabarcoding: A systematic review in methods, monitoring, and applications of global eDNA. Glob. Ecol. Conserv. 17, e00547. doi: 10.1016/j.gecco.2019.e0054710.1016/j.gecco.2019.e00547
Sanchez-Vidal A., Canals M., Calafat A., Lastras G., Pedrosa-Pàmies R., Menéndez M., et al. (2012). Impacts on the deep-sea ecosystem by a severe coastal storm. PloS One 7, e30395. doi: 10.1371/journal.pone.0030395
Santoferrara L. F. (2019). Current practice in plankton metabarcoding: optimization and error management. J. Plankton Res. 41, 571–582. doi: 10.1093/plankt/fbz041
Scheckenbach F., Hausmann K., Wylezich C., Weitere M., Arndt H. (2010). Large-scale patterns in biodiversity of microbial eukaryotes from the abyssal sea floor. Proc. Natl. Acad. Sci. U. S. A. 107, 115–120. doi: 10.1073/pnas.0908816106
Schoenle A., Hohlfeld M., Hermanns K., Mahé F., de Vargas C., Nitsche F., et al. (2021). High and specific diversity of protists in the deep-sea basins dominated by diplonemids, kinetoplastids, ciliates and foraminiferans. Commun. Biol. 4, 1–10. doi: 10.1038/s42003-021-02012-5
Servello G., Andaloro F., Azzurro E., Castriota L., Catras M., Chiarone A., et al. (2019). Marine alien species in Italy: A contribution to the implementation of descriptor D2 of the marine strategy framework directive. Mediterr. Mar. Sci. 20, 1–48. doi: 10.12681/mms.18711
Siano R., Alves-De-Souza C., Foulon E., M. Bendif E., Simon N., Guillou L., et al. (2011). Distribution and host diversity of Amoebophryidae parasites across oligotrophic waters of the Mediterranean Sea. Biogeosciences 8, 267–278. doi: 10.5194/bg-8-267-2011
Stoeck T., Bass D., Nebel M., Christen R., Jones M. D. M., Breiner H. W., et al. (2010). Multiple marker parallel tag environmental DNA sequencing reveals a highly complex eukaryotic community in marine anoxic water. Mol. Ecol. 19, 21–31. doi: 10.1111/j.1365-294X.2009.04480.x
Taberlet P., Bonin A., Zinger L., Coissac E. (2018). Environmental DNA: for biodiversity research and monitoring (Oxford: Oxford University Press).
Taberlet P., Coissac E., Pompanon F., Brochmann C., Willerslev E. (2012). Towards next-generation biodiversity assessment using DNA metabarcoding. Mol. Ecol. 21, 2045–2050. doi: 10.1111/j.1365-294X.2012.05470.x
Tecchio S., van Oevelen D., Soetaert K., Navarro J., Ramírez-Llodra E. (2013). Trophic dynamics of deep-sea megabenthos are mediated by surface productivity. PloS One 8, e63796. doi: 10.1371/journal.pone.0063796
Thurber A. R., Sweetman A. K., Narayanaswamy B. E., Jones D. O. B., Ingels J., Hansman R. L. (2014). Ecosystem function and services provided by the deep sea. Biogeosciences 11, 3941–3963. doi: 10.5194/bg-11-3941-2014
Totti C., Romagnoli T., Accoroni S., Coluccelli A., Pellegrini M., Campanelli A., et al. (2019). Phytoplankton communities in the northwestern Adriatic Sea: Interdecadal variability over a 30-years period, (1988–2016) and relationships with meteoclimatic drivers. J. Mar. Syst. 193, 137–153. doi: 10.1016/J.JMARSYS.2019.01.007
Turley C., Bianchi M., Christaki U., Conan P., Harris J. R. W., Psarra S., et al. (2000). Relationship between primary producers and bacteria in an oligotrophic sea the Mediterranean and biogeochemical implications. Mar. Ecol. Prog. Ser. 193, 11–18. doi: 10.3354/meps193011
Uhlig G. (1964). Eine einfache methode zur extraktion der vagilen, mesopsammalen microfauna. Helgol Wiss Meeresunters 11, 178–185. doi: 10.1007/BF01612370
Valbi E., Ricci F., Capellacci S., Casabianca S., Scardi M., Penna A. (2019). A model predicting the PSP toxic dinoflagellate Alexandrium minutum occurrence in the coastal waters of the NW Adriatic Sea. Sci. Rep. 9, 1–9. doi: 10.1038/s41598-019-40664-w
Wickham H. (2016). ggplot2: elegant graphics for data analysis. Available online at: https://ggplot2.tidyverse.org (Accessed August 23, 2024).
Keywords: benthic protists, eDNA metabarcoding, Mediterranean Sea, resting stages, sediments, trophic function
Citation: Marinchel N, Casabianca S, Marchesini A, Vernesi C, Scardi M and Penna A (2024) Structural variability of protist assemblages in surface sediments across Italian Mediterranean marine subregions. Front. Mar. Sci. 11:1427357. doi: 10.3389/fmars.2024.1427357
Received: 03 May 2024; Accepted: 15 August 2024;
Published: 02 September 2024.
Edited by:
Xosé Anxelu G. Morán, Spanish Institute of Oceanography, SpainReviewed by:
Esther Garcés, Spanish National Research Council (CSIC), SpainDíaz-Tapia, P., University of Santiago de Compostela, Spain
Copyright © 2024 Marinchel, Casabianca, Marchesini, Vernesi, Scardi and Penna. This is an open-access article distributed under the terms of the Creative Commons Attribution License (CC BY). The use, distribution or reproduction in other forums is permitted, provided the original author(s) and the copyright owner(s) are credited and that the original publication in this journal is cited, in accordance with accepted academic practice. No use, distribution or reproduction is permitted which does not comply with these terms.
*Correspondence: Antonella Penna, YW50b25lbGxhLnBlbm5hQHVuaXVyYi5pdA==; Nadia Marinchel, bi5tYXJpbmNoZWxAY2FtcHVzLnVuaXVyYi5pdA==