 Jill M. Hendon1*†
 Eric R. Hoffmayer2†
 Adam G. Pollack2†
 John Mareska3
 Fernando Martinez-Andrade4
 Jeff Rester5
 Theodore S. Switzer6
 Zachary C. Zuckerman7
- 1Center for Fisheries Research and Development, The University of Southern Mississippi, Ocean Springs, MS, United States
- 2Mississippi Laboratories, National Marine Fisheries Service, Southeast Fisheries Science Center, Pascagoula, MS, United States
- 3Marine Resources Division, Alabama Department of Conservation and Natural Resources, Dauphin Island, AL, United States
- 4Coastal Fisheries Division, Texas Parks and Wildlife Department, Corpus Christi, TX, United States
- 5Gulf States Marine Fisheries Commission, Ocean Springs, MS, United States
- 6Florida Fish and Wildlife Conservation Commission, Fish and Wildlife Research Institute, St. Petersburg, FL, United States
- 7Louisiana Department of Wildlife and Fisheries, Grand Isle, LA, United States
The Southeast Area Monitoring and Assessment Program (SEAMAP) Bottom Longline (BLL) survey was established to provide a nearshore complement to the offshore National Marine Fisheries Service (NMFS) BLL survey. SEAMAP state partners (i.e., Texas, Louisiana, Mississippi, and Alabama) used identical gear and sampling protocol to NMFS; however, temporal window, sampling universe, sampling frequency, and station selection were determined independently by each state based on available resources and capabilities. Although each state collected high quality data, the lack of a unified design complicated the efforts to combine state partner data to develop an index of abundance for stock assessment purposes. To improve the value of the survey and prioritize the quality and utility of the resultant data, the SEAMAP BLL survey was modified to implement a unified design that included consistency in spatial coverage and sampling frequency, and proportional allocation of sampling effort. Data from the early (2008-2014) and modified (2015-2021) SEAMAP BLL surveys, and from the modified SEAMAP and NMFS surveys were compared to determine the effects of this unified design on data precision. Overall catch composition slightly differed between the early and modified SEAMAP BLL surveys; however, taxa with declined abundance under the modified SEAMAP BLL survey were adequately sampled by the complementary NMFS BLL survey. Size composition was compared for three managed species. The size composition of Atlantic Sharpnose Sharks and Blacktip Sharks differed significantly between the modified SEAMAP BLL survey and the NMFS BLL survey, indicating that the modified survey is indeed providing complementary data. Further, implementing the modified design reduced the coefficient of variation for the indices of abundance for both Blacktip Sharks and Red Drum. The evolution of this survey highlights the benefit of unifying survey designs that build upon existing efforts to enhance the utility of survey data for multiple applications.
Introduction
All survey methodologies attempt to understand a population by assessing a representative sample (Cadima et al., 2005), and all methodologies have inherent biases that can impact the data collected. These biases should be identified and controlled for, to the greatest extent practicable, when designing the survey so that their impact can be accounted for in multi-model assessments. Best survey designs encompass the full spatial scope of the target species and conduct sampling during the full temporal period of the target species’ presence. Any time these frameworks are limited or are sampled with unequal effort, the full population may be misrepresented in the sample (Hansen et al., 2007). For this reason, standardized survey methodologies with a spatially balanced sampling design are essential for producing improved accuracy and precision of key population dynamic metrics (Cheng et al., 2024).
Fish populations are not evenly distributed within a system and their range may change based on environmental parameters, habitat availability, food availability, reproductive and ontogenetic phases, and/or pressures and stressors, thereby violating the statistical assumption of independence (Pennington and Strømme, 1998; Perry et al., 2005; Blanchard et al., 2008; Nye et al., 2009). Fishers are also dynamic, altering fishing methods, gear types, fishing time/location/effort, or target species to maximize harvest (Simpfendorfer et al., 2002) under a constantly evolving management framework. Due to the complexities of these dynamics, fishery dependent data may not accurately track the status of managed fish populations (de Mutsert et al., 2008; Pennington and Godø, 1995; Pennington and Strømme, 1998). Therefore, fishery independent surveys are invaluable data for assessing stocks (Pennington and Strømme, 1998; Wilberg et al., 2010).
Fishery independent surveys monitor diversity and abundance within an area (Xu et al., 2015) as limited by the selectivity and catchability of the gear being used and the design of the underlying sampling frame (Gunderson, 1993; Rago, 2005; Miller et al., 2007; Liu et al., 2009). These data complement other data inputs (e.g., fishery dependent data, life history data) in stock assessment models to discern population biomass and trends. Fishery independent data are often the most statistically robust assessment inputs, as their standardization, continuity, and random stratified designs result in relative abundance estimates with comparably high precision and low uncertainty (Pennington and Strømme, 1998; Miller et al., 2007). These surveys are of greatest utility when they cover the full spatial distribution of the stock being assessed (Walters, 2003; Wilberg et al., 2010; Gunderson, 1993) and are designed with sufficient statistical power so that as fish populations/distributions shift, changes in relative abundance can be detected (Pennington, 1985; Kimura and Somerton, 2006; Wang et al., 2018; Wilberg et al., 2010; Grace et al., 2012). As depth is a known driver of fish distribution, multispecies surveys typically implement a depth stratified random sampling effort to survey designs (Hansen et al., 2007). This ensures that effort is partitioned among heterogeneous strata based on standardized allocation criteria (Raj, 1968; Cochran, 1977; Gunderson, 1993; Smith et al., 2011; Richards et al., 2016; Ault et al., 2018).
Although valuable, fishery independent surveys are expensive and funding can often restrict the temporal or spatial coverage of the surveys (Dennis and Plagányi, 2015; Howard et al., 2023). To address these limitations, multiple sources of data are often integrated to attempt to capture the full range of species being assessed, especially for highly migratory species such as sharks (Simpfendorfer et al., 2002). The multi-sourced data must be standardized to ensure that the time series data are compatible (e.g., Maunder and Punt, 2004; Francis, 2011; Grüss et al., 2019). With this concept in mind, fishery independent surveys are often modeled after established well designed surveys to allow for effective comparisons and/or combinations and result in a more comprehensive and representative assessment. These standardized datasets can further allow for a more accurate assessment of population dynamic changes as related to broad issues such as climate change, management actions, and migratory pathway dynamics (Bonar et al., 2009). Survey compilations, such as the one published by Grüss et al. (2018) for the northern Gulf of Mexico (GOM), can help in determining what surveys are active and how to best leverage existing resources without duplicating efforts.
The Southeast Area Monitoring and Assessment Program (SEAMAP) is a federal/state/university collaboration that focuses on collecting and disseminating fisheries independent data. Gulf of Mexico SEAMAP partners recognized that the existing National Marine Fisheries Service Bottom Longline (NMFS BLL) survey, which targets Atlantic shark species, only sampled depths greater than 9 m in the northern GOM due to vessel limitations. As there are concerns that many shark stocks in the region are in decline (Stone et al., 1998), and many shark species are common to the coastal region, the nearshore waters (waters <9 m) were a notable gap in the survey. Further, as the NMFS BLL survey data have proven to be informative to the assessment of ten stocks in the GOM (e.g., SEDAR 29, 2012; SEDAR 34, 2013; SEDAR 54, 2017; SEDAR 77, 2024), the SEAMAP program hoped to fill this data gap in the coastal waters. Therefore, a complementary fishery independent BLL survey was initiated in waters off Texas, Louisiana, Mississippi, and Alabama (hereafter SEAMAP BLL survey). The intended goal of the SEAMAP BLL survey was to conduct a fisheries independent, gear standardized, survey in GOM coastal waters that generated data useful for fisheries assessment and management.
While exploring the utility of SEAMAP BLL data for use stock assessments, the Southeast Data Assessment and Review (SEDAR) identified several limitations. Although the sampling protocol was standardized, the variation in other survey design parameters made the datasets challenging to combine. The Texas data was spatially disjunct from the other state sampling universes, resulting in concern that the combined data would not reflect the same population trends as the other states (SEDAR 34, 2013) (Figure 1B). Louisiana sampled depths deeper than other states, resulting in spatial overlap with the NMFS BLL Survey (Figure 1C). Finally, the higher sampling intensity within Mississippi and Alabama waters (Figure 1D) could disproportionately drive population-level trends by artificially lowering coefficients of variation (CV) for target species. Ultimately, various post hoc weighting mechanisms and complex analyses were needed to generate an index of abundance (Hoffmayer et al., 2013a). Weighting, however, can be subjective and could lead to unintended consequences, especially when the parameter estimates are conflicting (Francis, 2011; Thorson et al., 2017). Further post hoc weighting is not always able to account for survey design shortfalls (Gunderson, 1993).
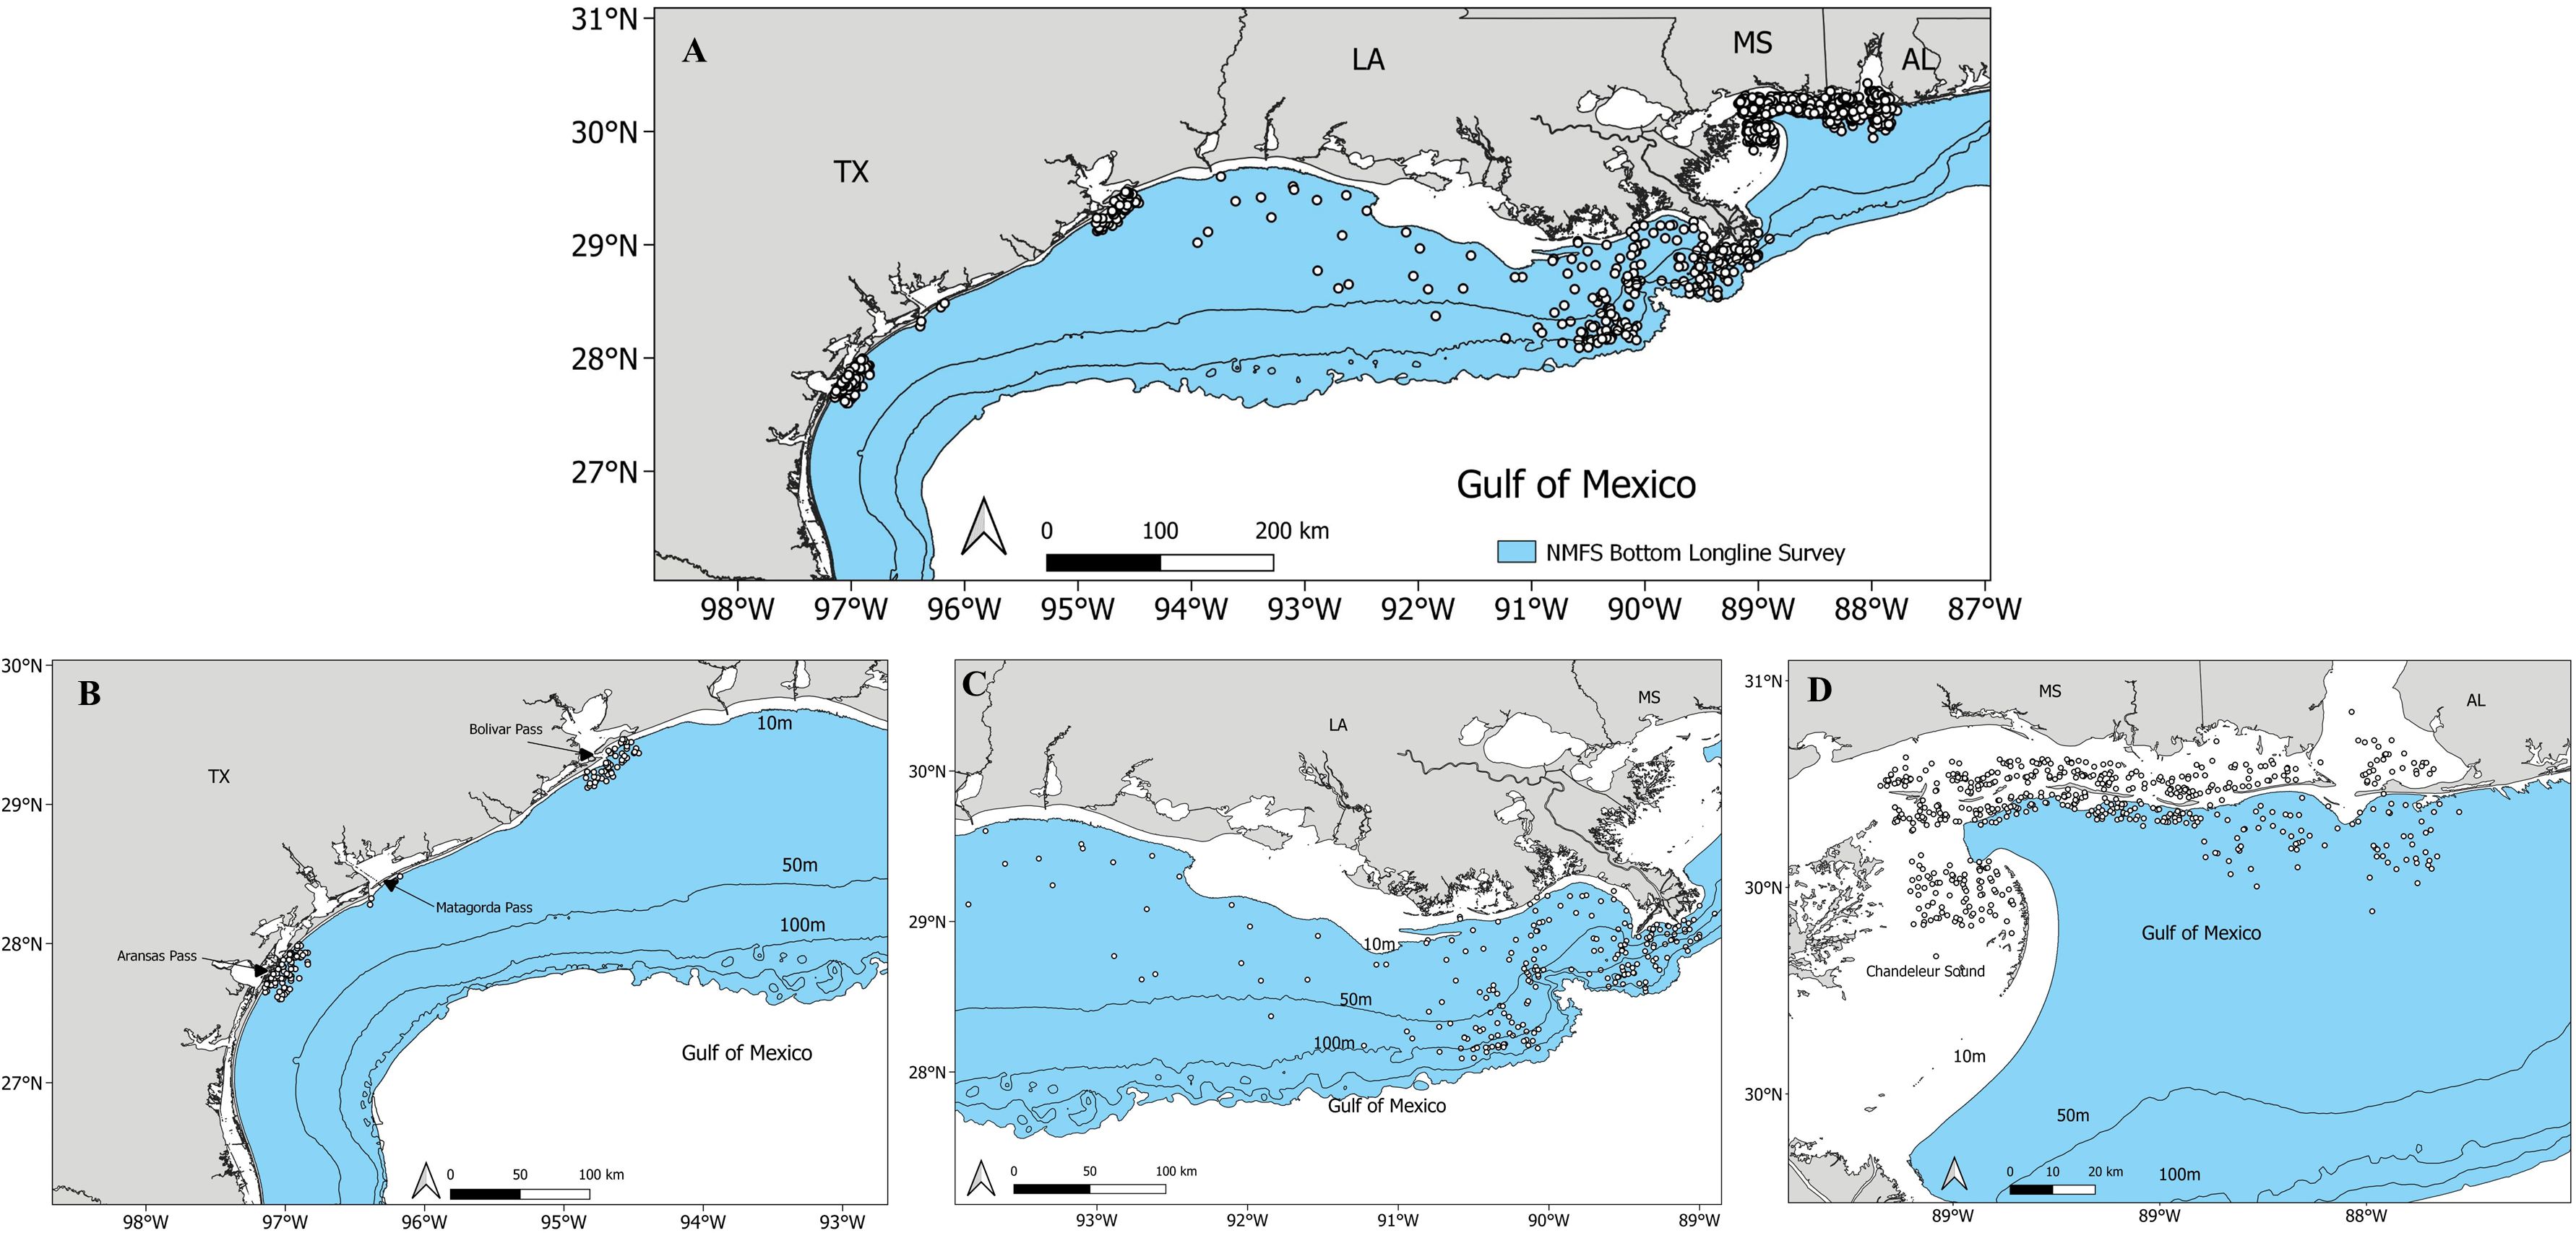
Figure 1. Maps of the sampling effort for the early Southeast Area Monitoring and Assessment Program Bottom Longline Survey in the northern Gulf of Mexico for stations conducted by (A) all SEAMAP state partners, (B) Texas (TX), (C) Louisiana (LA), and (D) Mississippi (MS) and Alabama (AL), during the early sampling period (2008-2014). White dots represent a sampling location. The blue region represents the universe covered by the National Marine Fisheries Service Bottom Longline Survey.
The SEAMAP partners made plans to solve these complications with a modified survey design (Christman, personal communication) and hopefully improve index of abundance precision and lower variance. Accordingly, the state partners integrated survey efforts under a unified, spatially balanced survey design. This sampling design has the advantages that 1) stratification improves the precision of parameter estimates by subdividing a heterogeneous population into relatively homogeneous strata and effectively partitioning population variance (Smith et al., 2011; Richards et al., 2016; Ault et al., 2018), and 2) assures that sampling effort is appropriately assigned to all strata.
This paper follows the management and evolution of the regional, multi-partner, fishery independent SEAMAP BLL survey. Data from the original survey design, hereafter referred to as “early” (2008-2014), was compared to data generated from the GOM-wide unified design, hereafter referred to as “modified” (2015-2021), as well as to the NMFS BLL survey. Herein, we explore the impacts of an independent (early) versus unified (modified) survey design (i.e., spatial scope, effort allocation, frequency) on survey statistics and estimates in a Gulf of Mexico bottom longline survey.
Methods
Independent state designs: early BLL design (2008-2014)
The SEAMAP BLL Survey began in 2008 when Mississippi and Texas started sampling their respective coastal waters and the waters off eastern Louisiana (Chandeleur Sound). Alabama joined the survey efforts in 2010 and Louisiana began in 2011. All partners used sampling methodology identical to that of the NMFS BLL Survey, which involved the deployment of a 1.85 km main longline, weighted to the bottom at the beginning, middle, and endpoints, outfitted with one hundred 15/0 circle hooks baited with Atlantic Mackerel, Scomber scombrus, on 3.66 m gangions, fished for 60 minutes (Grace and Henwood, 1997; Driggers et al., 2008). Catch data (e.g., species, length, weight, sex, etc.) and environmental data (e.g., surface, middle, and bottom temperature, salinity, dissolved oxygen) were collected at each site. Although fishing protocol and sampling window (March through October) were standardized, each state partner independently determined the size of the sampling universe, the number of random stations conducted, the frequency of sampling, and the depth range sampled based on logistical and funding limitations (Table 1; Figure 1).
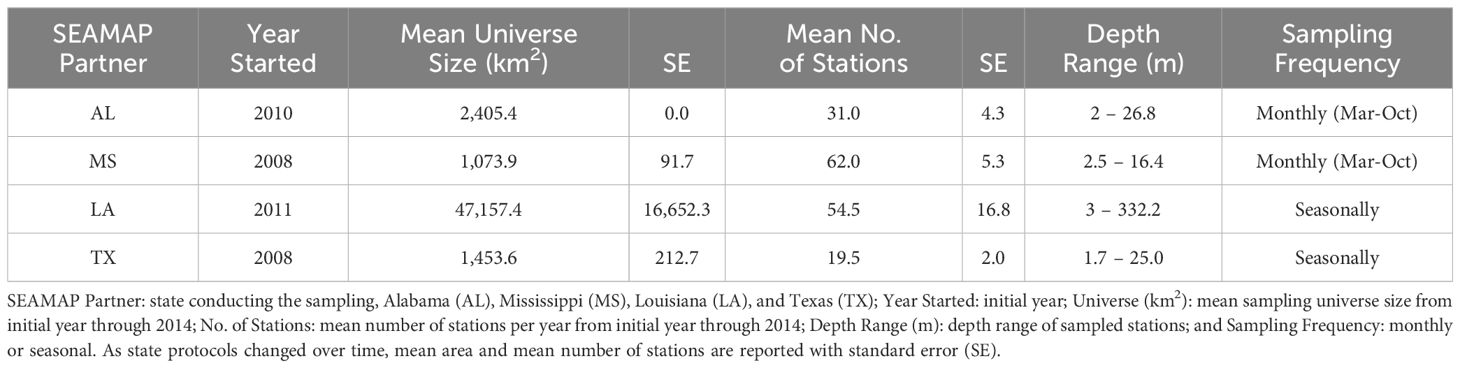
Table 1. Comparison of the early Southeast Area Monitoring and Assessment Program Bottom Longline Survey (2008-2014) by Gulf of Mexico SEAMAP partner.
Transition to a unified design: modified BLL design (2015-2021)
The first change implemented was a revision of the depth boundaries for the SEAMAP BLL Survey. It was known that the NMFS BLL survey implements a 9 m minimum depth limit due to the draft limitations of their vessels, and the BLL gear requires a minimum of 3 m for effective fishing. Therefore, SEAMAP set the modified design depth range as 3 – 10 m to ensure inclusion of unsampled waters while minimizing overlap with the NMFS BLL survey (9 - 366 m).
The second modification to the SEAMAP BLL survey was a spatial expansion of the survey universe and redistribution of sampling effort. In the modified design, the entire 3 - 10 m coastal contour from the Mexico-Texas border to just east of the Alabama-Florida border was eligible in the universe. This was a much larger sampling area and, therefore, required a station allocation protocol that would result in sufficient statistical power in the resultant data. Accordingly, the sampling effort was allocated among NMFS statistical reporting zones (zones 10 – 21) based on the proportion of the total universe 3 – 10 m depth contour present in each zone (Figure 2). Since the 3 – 10 m depth stratum is smaller in some zones relative to others, each statistical zone was allocated a minimum of two sampling stations to ensure that a measure of variability could be estimated. The random stratified design with proportional allocation ensured that the heterogeneity of the universe would be captured a priori through the station selection process.
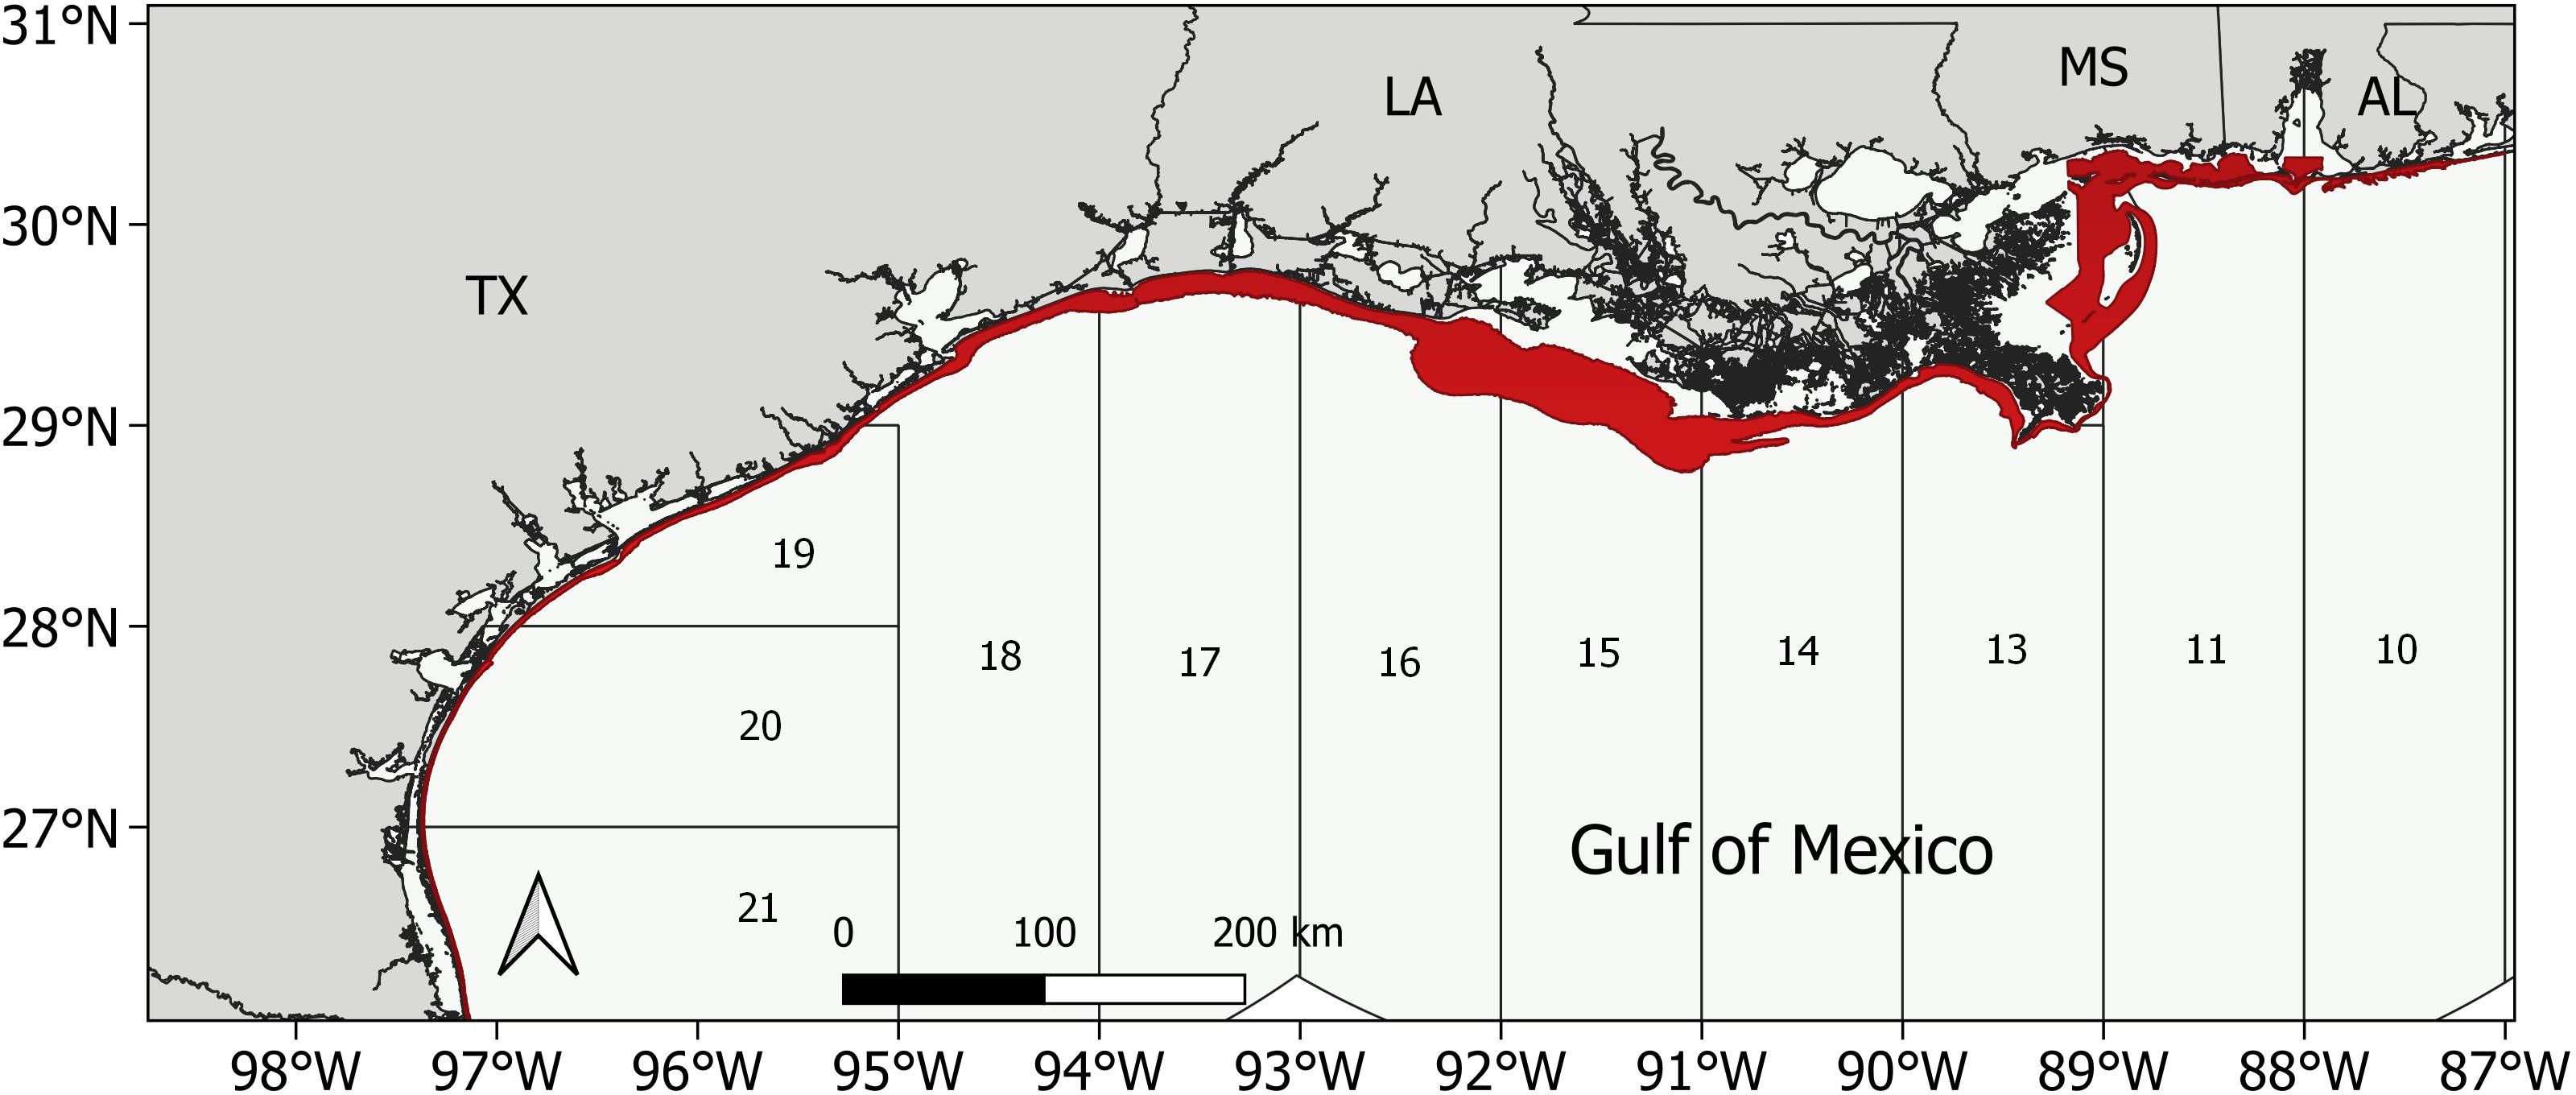
Figure 2. Map of the National Marine Fisheries Service Statistical Reporting Zones (labeled 10-21) in the northern Gulf of Mexico used to proportionally allocate sampling effort for the Southeast Area Monitoring and Assessment Botom Longline Survey. Effort was allocated based on the proportion of the total 3 - 10 m depth contour (red) present in each zone.
The final change to the SEAMAP BLL survey defined the temporal sampling window. In the early SEAMAP design, the partners conducted the work from March to October with either seasonal or monthly sampling efforts when sharks and Red Drum were prevalent in coastal waters. The NMFS BLL survey, however, is only conducted from August through September due to ship availability. It was therefore decided that the nearshore effort would involve a seasonal sampling strategy where sampling effort was allocated among three sampling seasons: Spring (April-May), Summer (June-July), and Fall (August-September). This ensured that, 1) there was consistency in the sampling frequency by maintaining the majority of the original sampling period in the new design, and 2) the Fall survey period would directly correspond to the NMFS offshore survey (and the SEAMAP data could be truncated to that, if necessary).
Under the modified SEAMAP design, fifty-five stations were randomly selected per season throughout the statistical zones (10 – 21) in the 3 – 10 m depth stratum. The largest sampling area occurred off the Louisiana coast, accounting for 74.7% of the sampling universe (10,300 km2), followed by Texas 12.7% (1,742 km2), Mississippi 7.5% (1,040 km2), and Alabama 5.1% (700 km2). The proportional allocation resulted in 37 stations sampled off Louisiana, 10 off Texas, 5 off Mississippi, and 3 off Alabama during each season, totaling 165 stations completed each year. Each SEAMAP state partner was primarily responsible for conducting efforts off their respective coastlines, although sampling often extended into neighboring states when logistically efficient.
Comparison between early and modified SEAMAP BLL survey designs
During the early (2008 – 2014) SEAMAP period, states joined the survey in different years and expanded and/or shifted their universe annually as their survey capability matured. To allow for comparison of these spatial scopes, the sampled area for each state partner was calculated by year and a mean and standard error were determined.
Statistical analyses were conducted to compare depth data between the early (2008 – 2014) and modified (2015 – 2021) SEAMAP designs to quantify how the design change impacted the fish assemblages sampled. The mean depth sampled was compared between states and by survey design using a two-way analysis of variance (ANOVA; Zar, 2010).
A multivariate analysis compared the catch composition of the early and modified survey design periods. Catch per unit effort (CPUE) for all sets with positive catch were 4th-root-transformed to down-weight the contribution of highly abundant taxa. Next, an analysis of similarity (ANOSIM) was conducted on the Bray-Curtis similarity matrix (Clarke and Warwick, 2001) to compare catch composition between the early and modified SEAMAP designs. ANOSIM produces an R statistic where values of 0 indicate that groups are not distinct from the entire dataset, while values of 1 indicate that groups of samples are completely distinct; the p-value indicates the significance of this statistic. Further, a similarity percentage analysis (SIMPER) was conducted to identify the species that discriminate between the compared surveys (Warwick et al., 1988). The SIMPER procedure compares the average abundances per design and examines the contribution of each species to the average Bray–Curtis dissimilarity. Both ANOSIM and SIMPER non-parametric statistical tests were carried out using PRIMER v.7 (Clarke and Gorley, 2015). Since there was a significant depth effect when comparing the early to the modified SEAMAP designs, the deeper stations (>15 m) within the early design were removed when comparing catch composition and length data. In addition, since Louisiana did not fully participate in the SEAMAP BLL survey until 2012, the years 2012 - 2014 were used to represent the early design period, and the years 2015 - 2017 were used to represent the modified design period. Catch composition was also compared between the modified SEAMAP design and the NMFS BLL survey for the years 2015 - 2021 using ANOSIM and SIMPER analyses. Since the NMFS survey only occurred during the months of August and September, the modified SEAMAP data was further truncated to this time period.
Three important species under federal management plans (FMP), Atlantic Sharpnose Shark, Rhizoprionodon terraenovae, Blacktip Shark, Carcharhinus limbatus, and Red Drum, Sciaenops ocellatus, were investigated for potential changes in abundance and length frequency. Catch per unit effort was compared between the early and modified SEAMAP designs and between the modified SEAMAP and NMFS BLL surveys (2015-2021) using a t-test (Zar, 2010). Mean length (shark by sex: Fork Length, FL; teleost: Total Length, TL) and length distributions were compared for both early and modified SEAMAP designs using t-tests and Kolmogorov-Smirnov (K-S) tests, respectively (Zar, 2010). Mean length and length distributions were compared for the modified SEAMAP design and the NMFS BLL survey for the August-September 2015 - 2021 temporal scope, using t-tests and K-S tests, respectively.
Further, to determine if the changes to the SEAMAP modified design improved the relative abundance estimates for the three species, a delta-lognormal model was used to generate relative abundance indices for each assessed FMP species. An index of relative abundance was built using a combined dataset consisting of the early (2008 – 2014) and the modified (2015 – 2021) SEAMAP data following the method outlined in Ingram et al. (2017), as this is a common method used in stock assessments in the southeast region. The early data were truncated to only include stations with depths from 3 - 15 m as this range matched the modified SEAMAP design dataset. Factors that were included in the initial model run included depth (m), bottom dissolved oxygen (mg/l), bottom salinity (psu), bottom temperature (˚C), SEAMAP partner (Texas, Louisiana, Mississippi, and Alabama), month (March-October), and year. The submodels of the delta-lognormal model were built using a backward selection procedure based on type III analyses with an inclusion level of significance of α = 0.05 (Lo et al., 1992). Coefficients of variance around the annual abundance estimates were compared (Lo et al., 1992) as a performance metric to assess the effect of the modified survey design.
Results
A total of 1,866 BLL sets were completed by the SEAMAP BLL survey from 2008 to 2021, with 920 completed under the early SEAMAP design (2008 – 2014) and 946 completed under the modified SEAMAP design (2015 – 2021; Figures 1 and 3). With the early SEAMAP design, 53% of the stations spatially overlapped the NMFS BLL sampling universe, while 19.2% overlapped both spatially and temporally (August-September) (Figure 1). However, with the modified SEAMAP design, only 20% of the stations overlapped spatially with the NMFS sampling universe (Figure 3), of which only 6.9% overlapped both spatially and temporally (August-September).
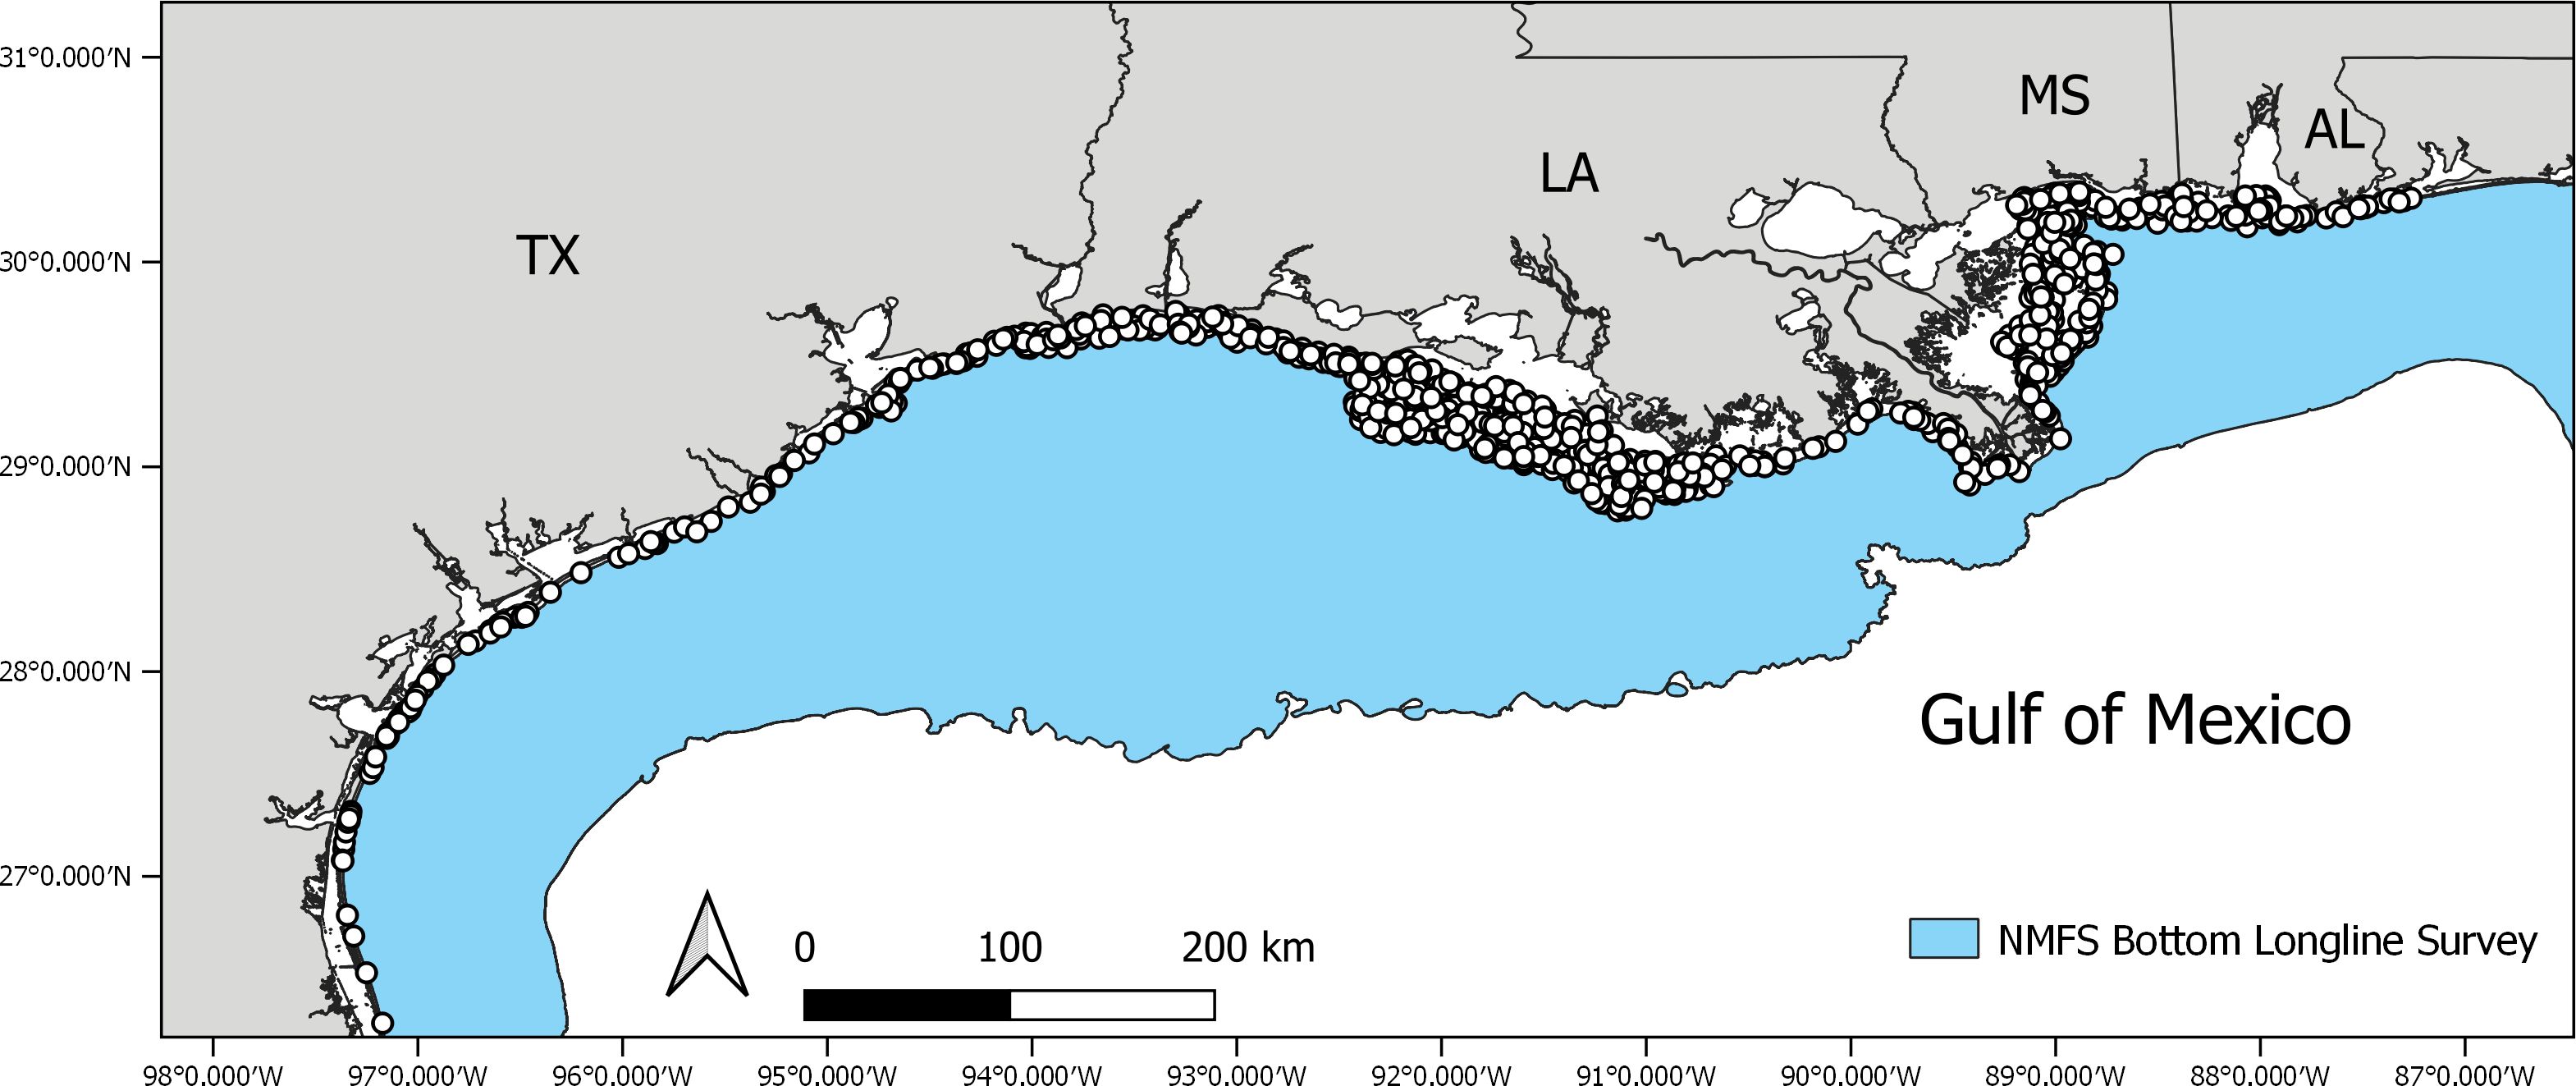
Figure 3. Map of the modified Southeast Area Monitoring and Assessment Program Botom Longline Survey in the northern Gulf of Mexico for the sampling period 2015-2021. White circles represent sampling locations conducted by SEAMAP partners. The blue region represents the universe covered by the National Marine Fisheries Service Botom Longline Survey.
When comparing the two SEAMAP BLL survey designs, the biggest difference observed was in the depths sampled. There was a significant difference in station depth across state partners (F3,1847 = 343.7, p < 0.001) and between the early and modified sampling designs (F1,1849 = 272.5, p < 0.001). Stations sampled under the early SEAMAP design were significantly deeper (mean: 26.4 ± 0.7 m, range: 1.7 - 332.2 m) compared to those sampled under the modified SEAMAP design (mean: 7.0 ± 0.9 m, range: 1.4 – 15.1 m). These differences were most pronounced off Louisiana where station depths between the early (mean: 74.0 ± 1.4 m) and modified (mean: 6.5 ± 0.9 m) designs were significantly different from each other (p < 0.05).
From 2008 to 2021, 34,589 organisms were caught on the SEAMAP BLL survey with 15,944 caught during the early design and 18,645 caught during the modified design. During the early design, 73.0% of the total catch consisted of: Atlantic Sharpnose Sharks (46.9%), Blacktip Sharks (12.2%), Gafftopsail Catfish, Bagre marinus (8.6%), and Red Drum (5.4%). With the modified survey design, the top species present were similar, but their frequency of occurrence was substantially different, with 82.6% of the catch made up of Gafftopsail Catfish (34.1%), Blacktip Sharks (24.6%), Atlantic Sharpnose Sharks (15.2%), Red Drum (8.7%), and Bull Sharks, C. leucas (5.5%). Six species were caught in relatively high numbers with the early survey design that were caught in lower numbers (n < 30) or were absent in the modified design, including: Smoothhounds, Mustelus spp. (early: n = 680; modified n = 0), Red Snapper, Lutjanus campechanus (early: n = 584; modified: n = 0), King Snake Eels, Ophichthus rex (early: n = 369; modified n = 1), Tiger Sharks, Galeocerdo cuvier (early: n = 103; modified: n = 20), Scalloped Hammerheads, Sphyrna lewini (early: n = 94; modified: n = 9), and Sandbar Sharks, C. plumbeus (early: n = 81; modified: n = 30).
Catch composition was slightly different between the early (station n = 269) and modified (station n = 433) SEAMAP BLL survey designs (R = 0.044, p = 0.001). The SIMPER analysis revealed that Atlantic Sharpnose Shark (17.3%), Blacktip Shark (14.6%), Gafftopsail Catfish (13.2%), Red Drum (10.1%), Bull Shark (9.6%), and Southern Stingray (7.0%) accounted for the majority of the dissimilarity (71.7%) in species composition between the survey designs (Table 2). Catch composition was also found to be significantly different between the modified SEAMAP (station n = 303) and the NMFS BLL (station n = 444) surveys (R = 0.263, p = 0.001). The SIMPER analysis revealed that Blacktip Sharks (12.6%), Atlantic Sharpnose Sharks (11.9%), Gafftopsail Catfish (10.2%), Red Snapper (9.0%), Bull Sharks (7.2%), Blacknose Sharks (5.1%), Southern Stingrays (4.3%), Spinner Sharks (4.2%), Red Drum (3.9%), and Hardhead Catfish (3.6%) accounted for the majority of the difference (72.0%) in composition (Table 3).
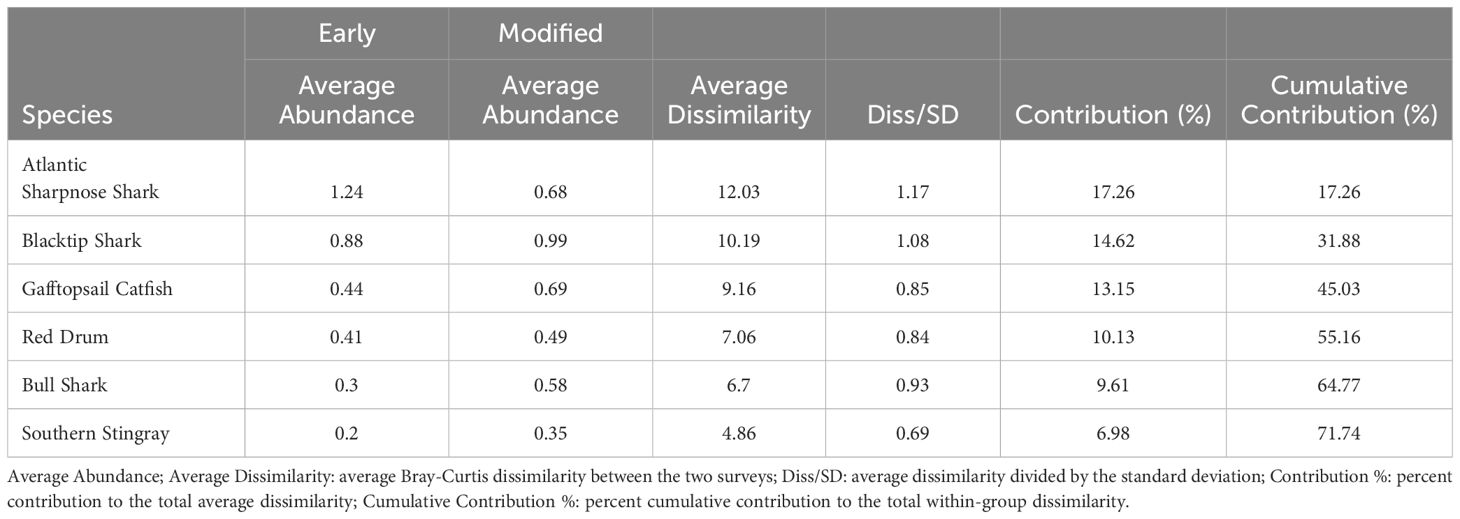
Table 2. Catch composition similarity percentage analysis (SIMPER) results for early and modified Southeast Area Monitoring and Assessment Program (SEAMAP) botom longline survey designs.
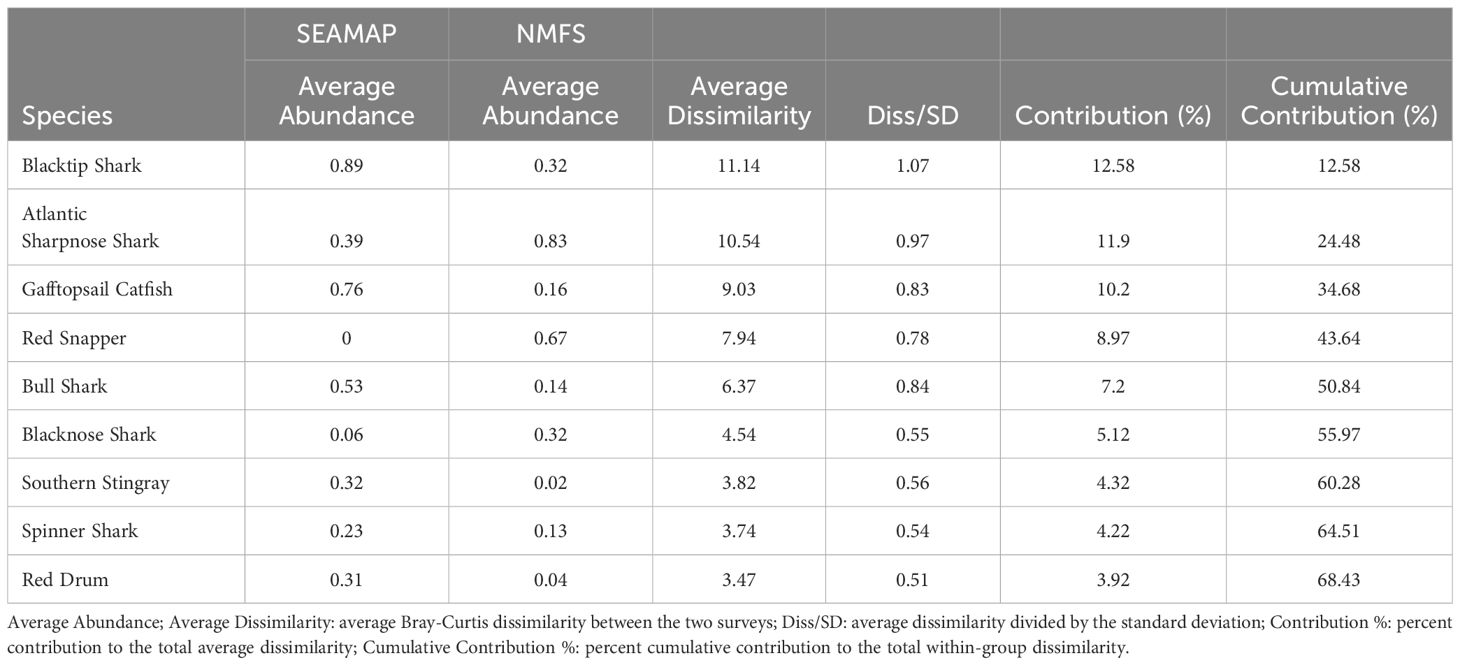
Table 3. Catch composition similarity percentage analysis (SIMPER) results for modified Southeast Area Monitoring and Assessment Program (SEAMAP) and National Marine Fisheries Service (NMFS) botom longline survey designs.
There were differences in CPUE and length frequencies for the three FMP species examined when comparing the early and modified SEAMAP designs (Figure 4). Atlantic Sharpnose Shark catch rates were significantly higher with the early (CPUE: 6.6 ± 0.4 sharks/100 hook hrs, n = 275) compared to the modified (CPUE: 3.0 ± 0.2 sharks/100 hook hrs, n = 444) design (t = 9.3, p < 0.001). Female Atlantic Sharpnose Shark mean size was significantly larger during the early (mean: 587.5 ± 5.9 mm FL, range: 265 – 965 mm FL, n = 466) compared to the modified (mean: 534.9 ± 11.3 mm FL, range: 265 – 975 mm FL, n = 152; t = 4.2, p < 0.001; Figure 4A) SEAMAP design, and the length distributions were significantly different between the two designs (D = 0.209, p < 0.001). Male Atlantic Sharpnose Shark mean size was significantly smaller in the early (mean: 671.9 ± 1.7 mm FL, range: 255 – 931 mm FL, n = 3,081) compared to the modified (mean: 724.7 ± 2.2 mm FL, range: 273 – 890 mm FL, n = 2,086) SEAMAP design (t = 19.5, p < 0.001; Figure 4A), and the length distributions were significantly different between the early and modified designs (D = 0.365, p < 0.001).
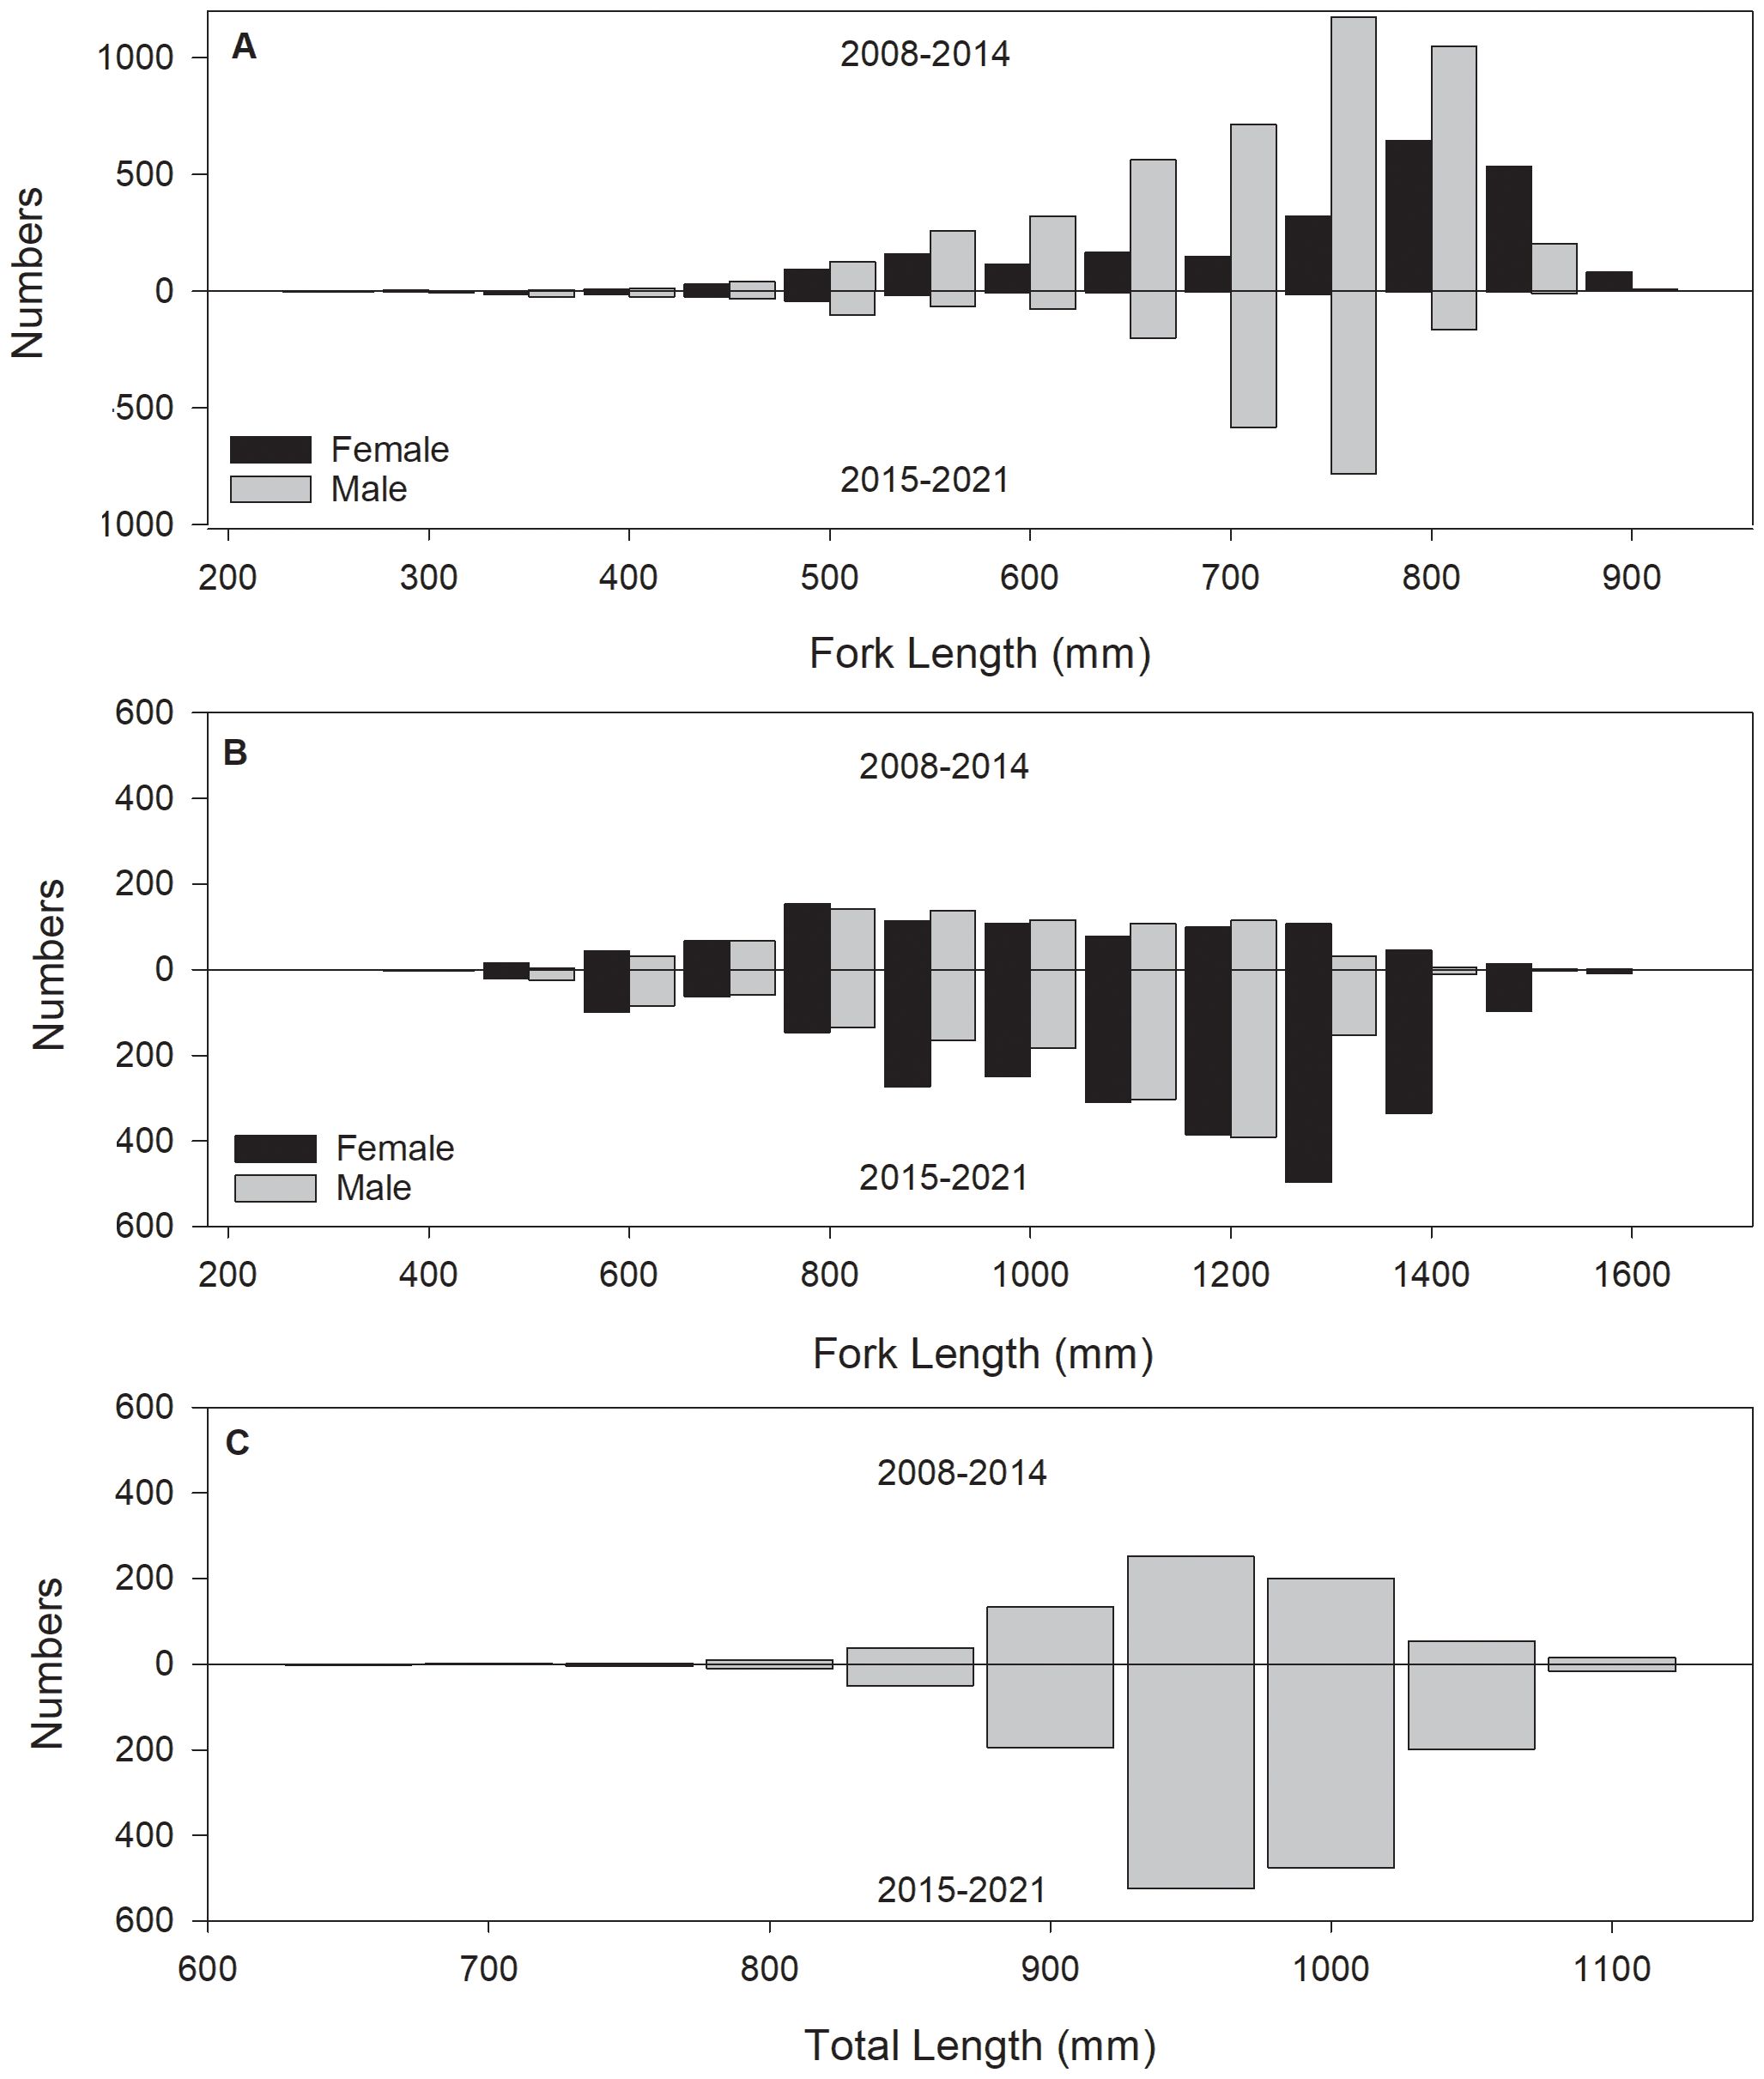
Figure 4. Length frequency distribution for (A) female (black) and male (gray) Atlantic Sharpnose Shark, Rhizoprionodon terraenovae, (B) female (black) and male (gray) Blacktip Shark, Carcharhinus limbatus, and (C) Red Drum, Sciaenops ocellatus, from the early (2008-2014; top) and modified (2015-2021; bottom) Southeast Area Monitoring and Assessment Program Bottom Longline Survey design conducted in the northern Gulf of Mexico.
Blacktip Shark catch rates were significantly higher with the modified (CPUE: 4.8 ± 0.2 sharks/100 hook hrs, n = 444) compared to the early SEAMAP design (CPUE: 2.4 ± 0.2 shark/100 hook hrs, n = 275; t = 8.0, p < 0.001). Female Blacktip Shark mean size was significantly larger with the modified (mean: 1,079.4 ± 4.7 mm FL, range: 331 – 1,574 mm FL, n = 2,484) compared to the early (mean: 927.4 ± 9.6 mm FL, range: 446 – 1,590 mm FL, n = 623) SEAMAP design (t = 14.3, p < 0.001; Figure 4B), and the length distributions were significantly different (D = 0.367, p < 0.001). Similarly, male Blacktip Shark mean size was significantly larger for the modified (mean: 985.8 ± 5.3 mm FL, range: 355 – 1,524 mm FL, n = 1,512) compared to the early (mean: 873.6 ± 8.0 mm FL, range: 433 – 1,441 mm FL, n = 536, Figure 4B) SEAMAP design (t = 11.1, p < 0.001), and the length distributions were significantly different (D = 0.345, p < 0.001).
Red Drum catch rates were significantly higher with the modified (CPUE: 1.7 ± 0.1 fish/100 hook hrs, n = 444) compared to the early (CPUE: 1.2 ± 0.1 fish/100 hook hrs, n = 275; t = 2.5, p < 0.0134) SEAMAP design, and significantly larger fish were caught with the modified (n = 1,478, mean: 945.3 ± 1.5 mm TL, range: 492 – 1,180 mm TL) compared to the early design (n = 618, mean: 934.4 ± 2.3 mm TL, range: 669 – 1,090 mm TL; t = 4.0, p < 0.001; Figure 4C). In addition, the distribution of lengths was significantly different (D = 0.0846, p = 0.004).
When the length frequency data from the modified SEAMAP and NMFS survey datasets were compared for the FMP species, some interesting differences were observed (Figure 5). Fewer Atlantic Sharpnose Sharks were caught on the modified SEAMAP survey (n = 485) than the NMFS survey (n = 2,247). This was especially true for female Atlantic Sharpnose Sharks, where sharks with significantly smaller mean size were caught with the modified SEAMAP design (mean: 469.7 ± 14.3 mm FL, range: 340 - 672 mm FL, n = 42) as compared to the NMFS BLL (mean: 781.9 ± 2.4 mm FL, range: 389 – 990 mm FL, n = 1,177) survey (t = 23.643, p < 0.001; Figure 5A). Length distributions were also significantly different (D = 0.904, p < 0.001). Similarly, male Atlantic Sharpnose Shark mean size was significantly smaller for the modified SEAMAP BLL survey (mean: 681.6 ± 5.6 mm FL, range: 356 – 850 mm FL, n = 373) compared to the NMFS BLL survey (mean: 764.6 ± 2.4 mm FL, range: 310 – 958 mm FL, n = 1,069, Figure 5A) survey (t = 16.007, p < 0.001), and the length distributions were also significantly different (D = 0.503, p < 0.001).
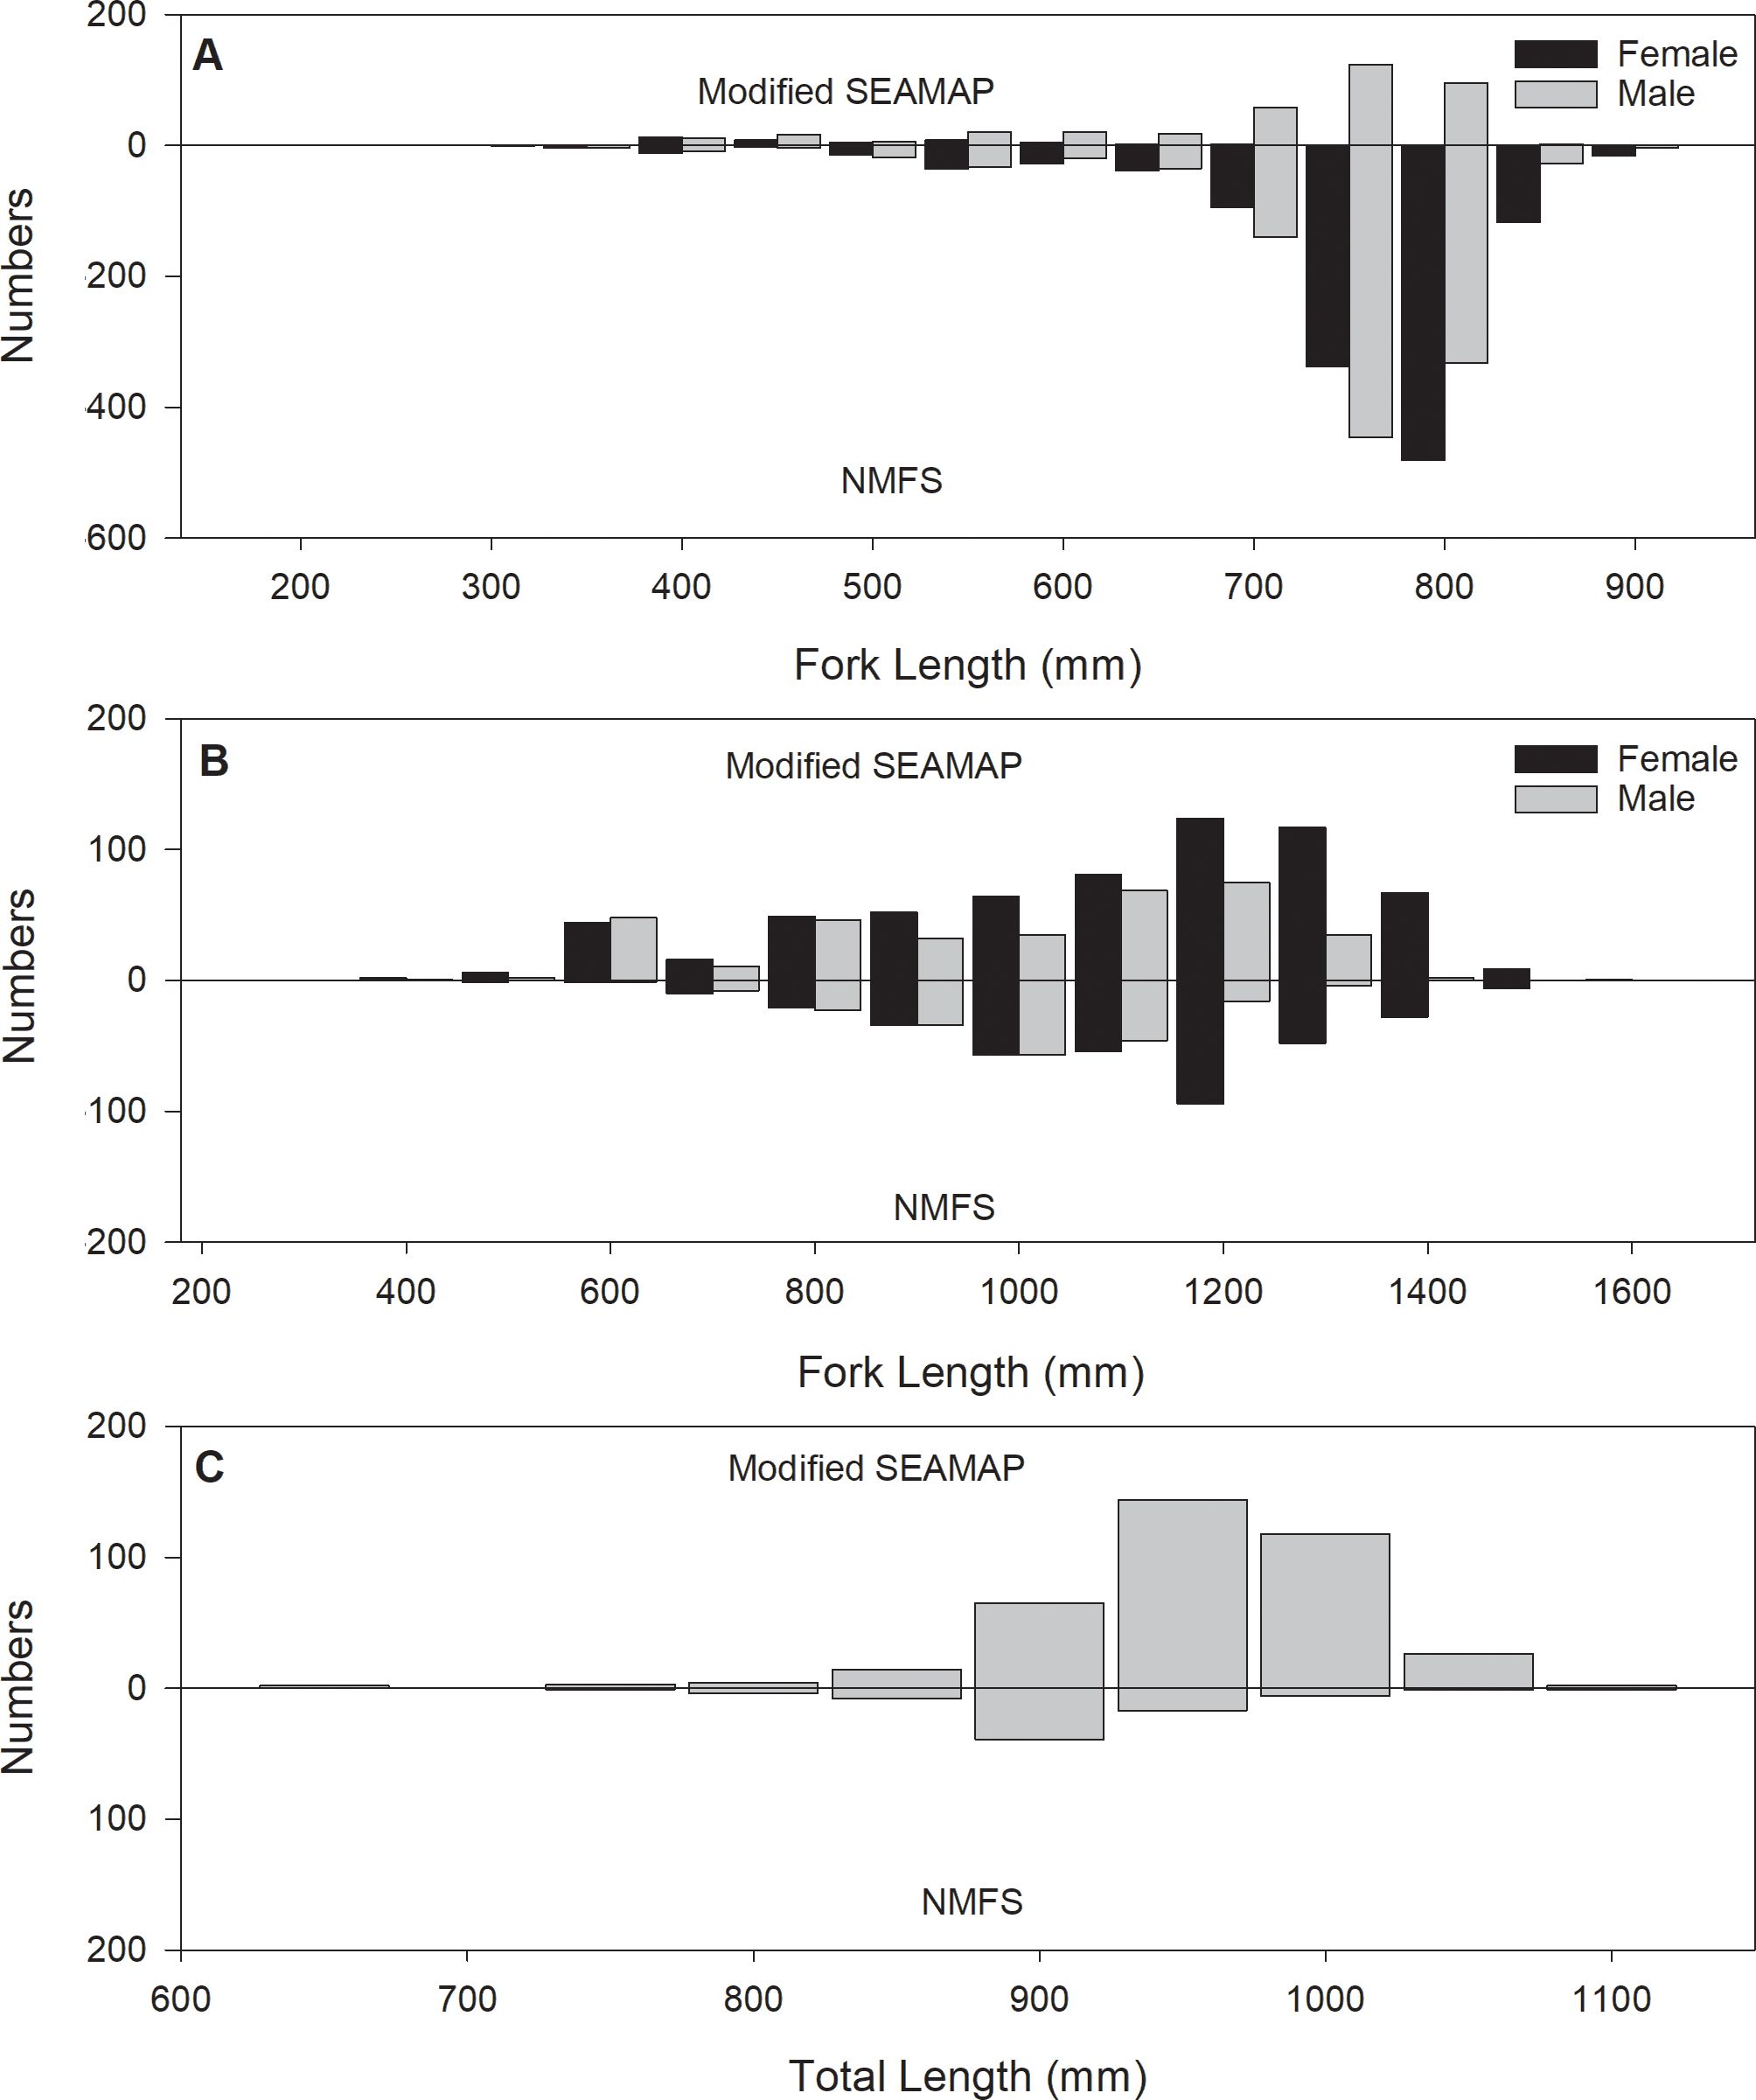
Figure 5. Length frequency comparison for (A) Atlantic Sharpnose Shark, Rhizoprionodon terraenovae, (B) Blacktip Shark, Carcharhinus limbatus, and (C) Red Drum, Sciaenops ocellatus, caught in the modified Southeast Area Monitoring and Assessment Program Bottom Longline Survey during August and September and the National Marine Fisheries Service Bottom Longline Survey from 2015-2021.
More Blacktip Sharks were caught during the modified SEAMAP BLL survey (n = 1,073) compared to the NMFS BLL survey (n = 590). Female Blacktip Shark mean size was significantly larger with the NMFS BLL survey (mean: 1,166.9 ± 9.8 mm FL, range: 593-1,530 mm FL, n = 349) compared to the modified SEAMAP BLL survey (mean: 1,043.8 ± 9.6 mm FL, range: 389 – 1,341 mm FL, n = 848) survey (t = 8.263, p < 0.001; Figure 5B), and the length distributions were significantly different (D = 0.214, p < 0.001). Similarly, male Blacktip Shark mean size was significantly larger for the NMFS BLL survey (mean: 1036.6 ± 9.7 mm FL, range: 645 – 1,346 mm FL, n = 189) compared to the modified SEAMAP BLL survey (mean: 944.5 ± 12.5 mm FL, range: 355 – 1,298 mm FL, n = 356, Figure 5B) survey (t = 5.101, p < 0.001), and the length distributions were significantly different (D = 0.263, p < 0.001).
Red Drum catch was relatively low within the NMFS BLL survey (n = 77) compared to the modified SEAMAP BLL survey (n = 400). There was no significant difference in the mean size of Red Drum for fish caught in the modified SEAMAP (mean: 932.5 ± 3.0 mm TL, range: 492 – 1,120 mm TL, n = 400) as compared to the NMFS (mean: 933 ± 2.2 mm TL, range: 669 – 1,090 mm TL, n = 705) survey (t = 0.203, p = 0.839). In addition, the distribution of lengths was not significantly different (D = 0.111, p = 0.409; Figure 5C).
Standardized relative abundance indices were generated for Atlantic Sharpnose Sharks, Blacktip Sharks, and Red Drum (Figure 6). For Atlantic Sharpnose Sharks, the final model retained year, SEAMAP partner, month, and bottom temperature, salinity and dissolved oxygen in the binomial submodel, whereas the lognormal submodel retained year, SEAMAP partner, month, depth, and bottom temperature and salinity as significant factors (Supplementary Table 1). For Blacktip Sharks, the final model retained the same factors in the binomial and lognormal submodels, which included year, SEAMAP partner, month, and bottom temperature and salinity as significant factors (Supplementary Table 2). For Red Drum, the final model retained year, SEAMAP partner, month, and bottom salinity and dissolved oxygen in the binomial submodel, and the lognormal submodel retained year, SEAMAP partner, depth, and bottom temperature as significant factors (Supplementary Table 3). The CVs generated from the modified SEAMAP BLL survey dataset were slightly higher for Atlantic Sharpnose Sharks than those generated from the early design (Figure 6). There was an increasing trend in CV from 2013 -2021, corresponding with a decrease in total numbers and frequency of occurrence for this species. The CVs generated from the modified SEAMAP BLL design for Blacktip Sharks slightly improved and consistently remained low (Figure 6). Red Drum showed the most substantial CV reduction with the modified SEAMAP design (Figure 6).
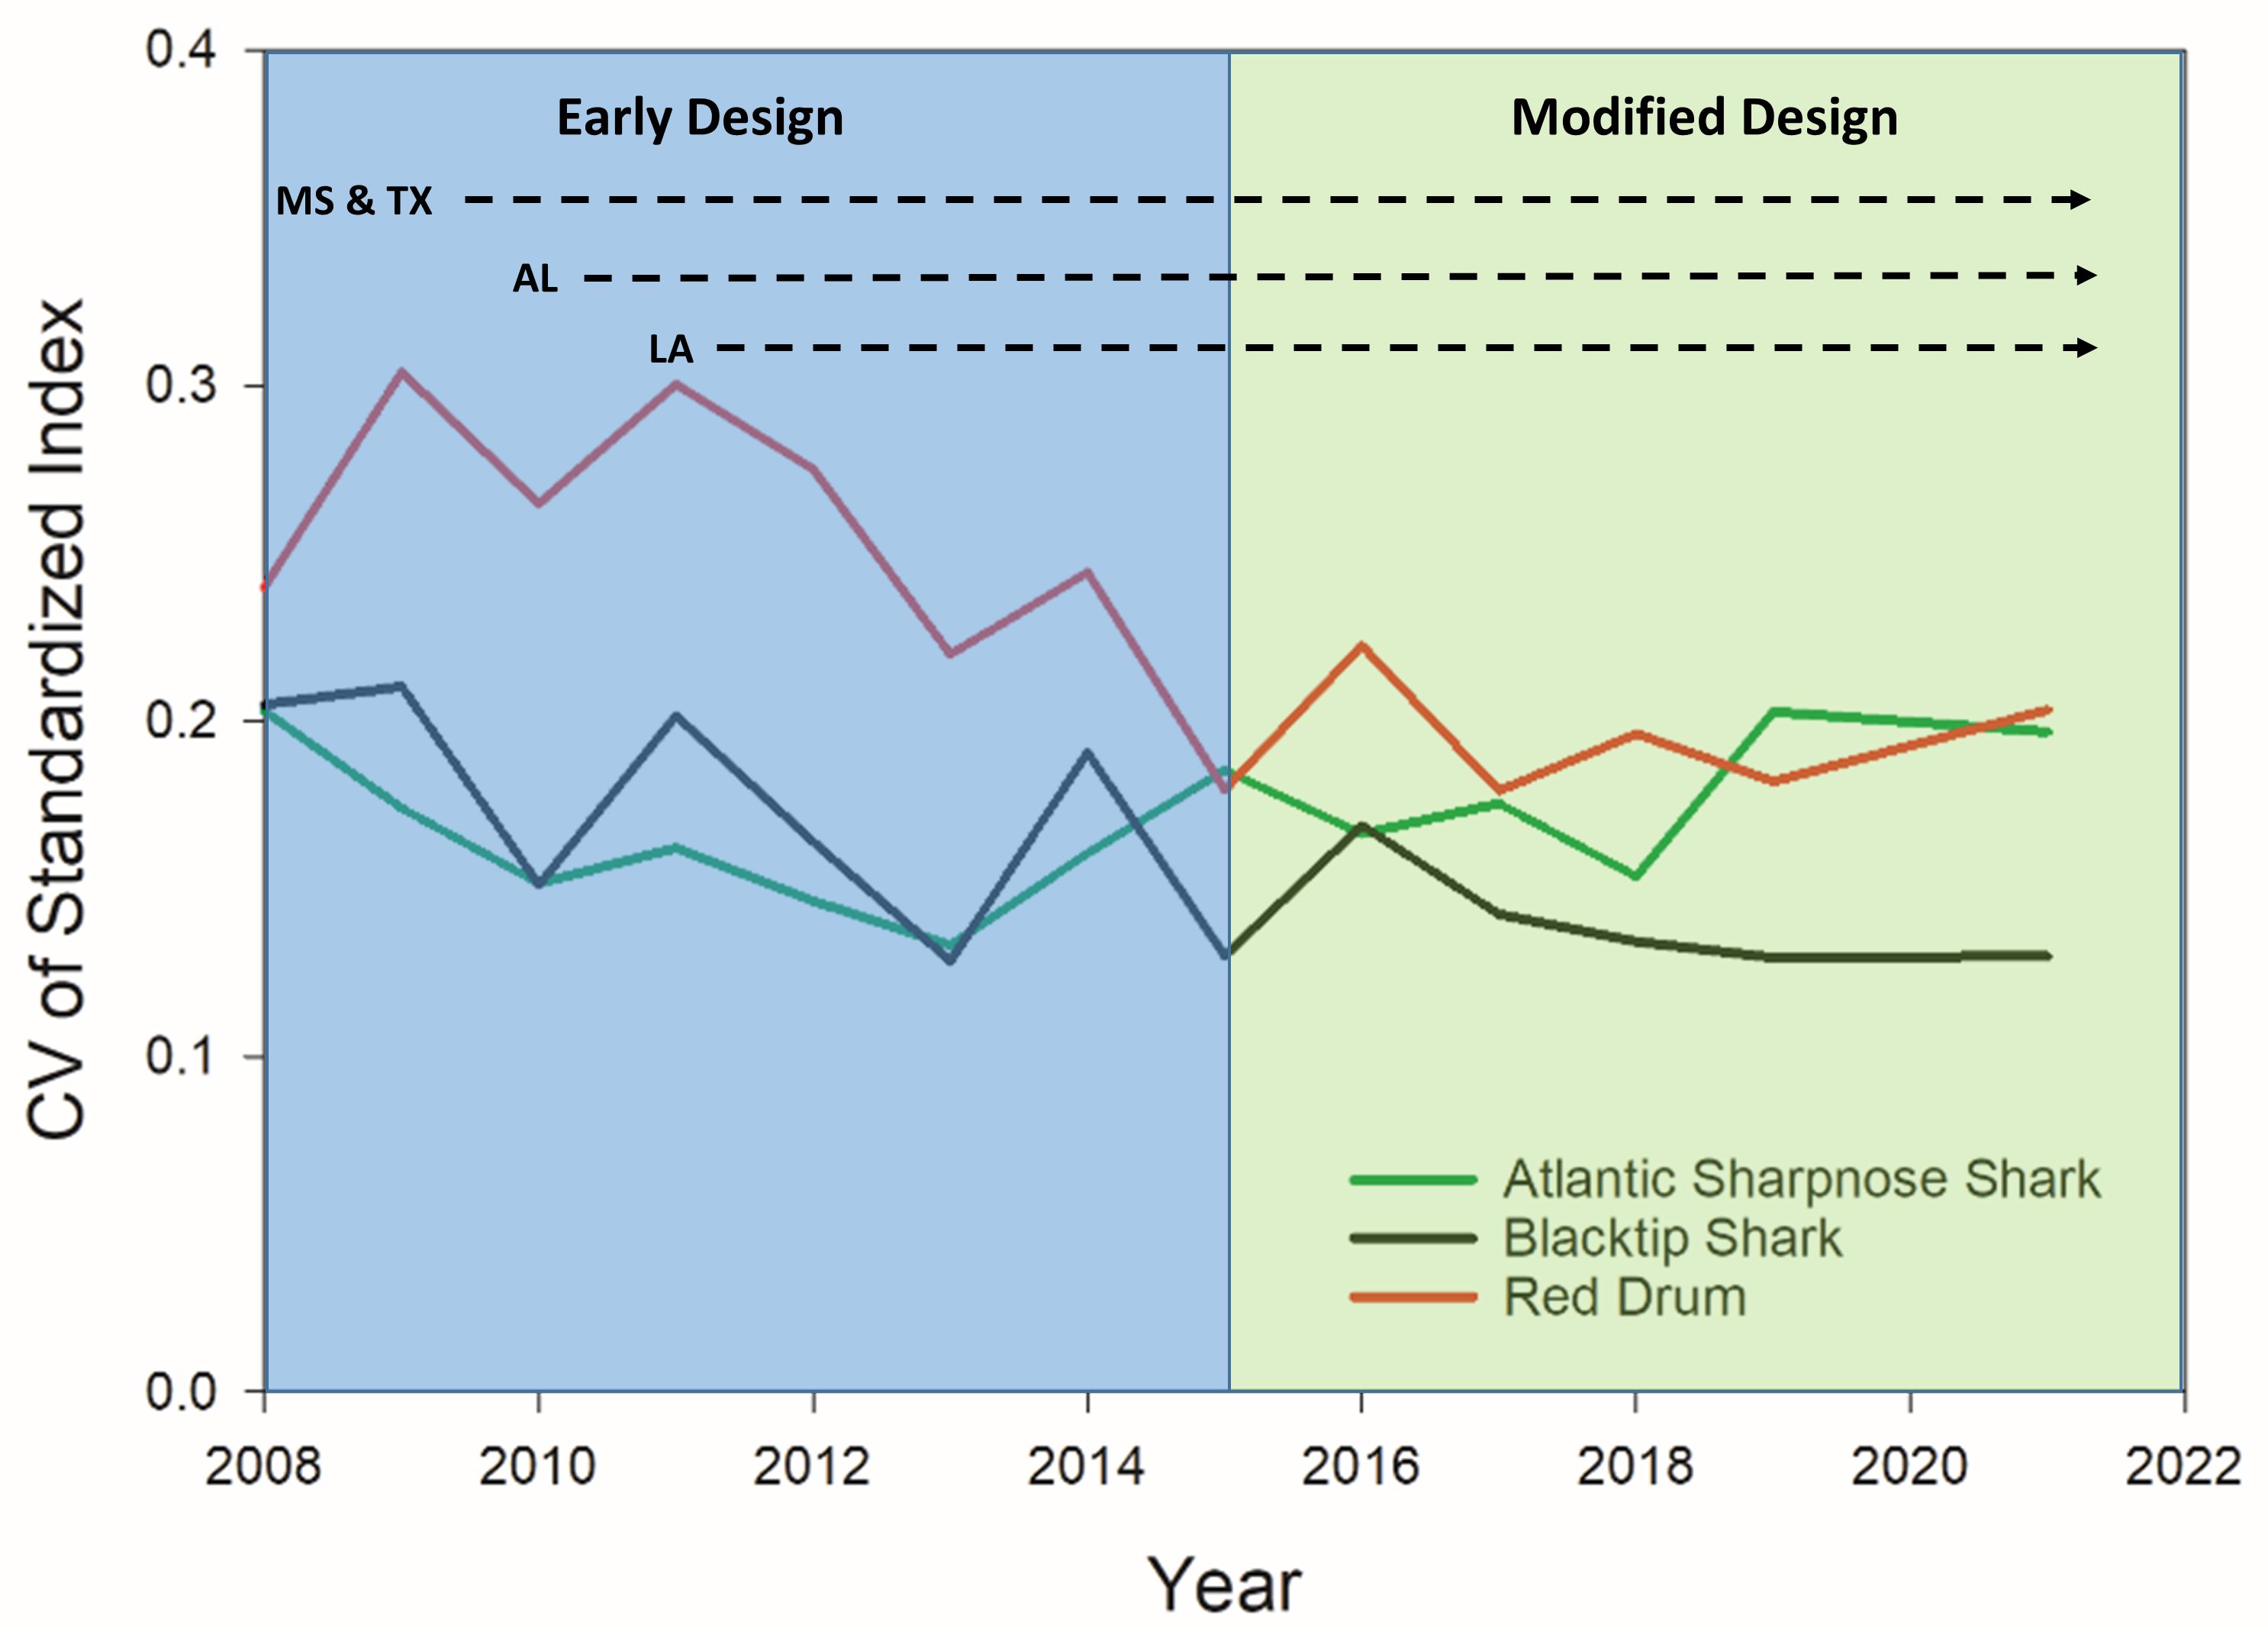
Figure 6. Coefficients of variation (CV) by year from standardized catch rates of Atlantic Sharpnose Shark, Rhizoprionodon terraenovae (green), Blacktip Shark, Carcharhinus limbatus (black), and Red Drum, Sciaenops ocellatus (red) using the delta-lognormal modeling method for the Southeast Area Monitoring and Assessment Program Bottom Longline survey early (blue region) and modified designs (light green region). Time of state partner participation in the survey is shown by the labeled dashed lines (MS, Mississippi; TX, Texas; AL, Alabama; LA, Louisiana).
Discussion
Under the modified design, the restriction of the depth stratum allowed survey resources to be redistributed to prioritize the goal of evenly distributing station effort throughout the 3-10 m depth stratum. The survey was then able to fully complement half of the spatial scope (Mexico-Texas border to the east of the Alabama-Florida border) of the NMFS BLL survey with minimal overlap and fill a data gap for the target species. The proportional allocation of stations by depth and the distribution based on NMFS statistical reporting zones ensured a spatially balanced sampling design. Finally, the seasonal timing of the survey ensured that seasonal movement patterns of target species could be captured (Grace et al., 2012). This exclusion of the winter season further maximized survey resources as it is known that sharks move out of the coastal region during this time (Springer, 1940; Parsons and Hoffmayer, 2005; Peterson and Grubbs, 2024).
Most state partners were conducting the early SEAMAP BLL efforts within the boundary of the modified stratum simply due to logistics and resource limitations. Sampling conducted off Louisiana was the only state that showed a significant change in mean depth sampled between the early and modified design. This state had the capability of sampling deeper offshore waters, however, these data were one of the primary sources of complication during the SEDAR data combination. As 53% of early design stations conducted by Louisiana overlapped spatially with the NMFS BLL sampling universe, the most parsimonious solution was to restrict depth and increase coverage in the unified stratum. This depth restriction was a major factor in many of the effects seen in the survey comparisons.
The most common species encountered in both the early and modified SEAMAP surveys were relatively similar, with Atlantic Sharpnose Sharks, Blacktip Sharks, Gafftopsail Catfish, and Red Drum being predominant. There were six species, however, that were caught in noticeably lower numbers in the modified survey. This shift was likely a result of the depth restriction in the modified design. Smoothhounds, Red Snapper, and King Snake Eel are known deeper water species (McEachran and Fechhelm, 2005; Castro, 2011), while Tiger Sharks, Scalloped Hammerheads, and Sandbar Sharks are large coastal shark species that often partition to deeper habitats than the small coastal shark species (Castro, 2011). Several of these species are federally managed, including Red Snapper, Smoothhounds, Scalloped Hammerheads, and Sandbar Sharks, and their loss in the composition was concerning; however, as all are caught in relatively high numbers on the NMFS BLL survey, their population signature is still being captured. The ANOSIM also detected a significant difference in the composition between the early and modified designs; however, the Global R statistic confirmed that the effect is negligible due to the composition overlap. The dissimilarity was driven by Atlantic Sharpnose Sharks, Blacktip Sharks, Gafftopsail Catfish, and Red Drum, which were the common species in both designs. This small effect was likely due to the exclusion of the deeper Louisiana stations in the early design from the analysis, where the mature female Atlantic Sharpnose Sharks were caught in higher numbers.
When comparing the modified SEAMAP and NMFS survey, the ANOSIM detected a significant difference in the composition; although the Global R statistic inferred the effect was moderate due to some species overlap. The dissimilarity was driven by Blacktip Sharks, Atlantic Sharpnose Sharks, Gafftopsail Catfish, and Red Snapper. In this case, Red Snapper was the only species not present in the modified design and likely had the greatest effect on the R value.
Atlantic Sharpnose Shark showed the greatest shift between the early and modified designs. With the modified design, there was a substantial decrease in the overall catch rate, as well as a shift from a mixed catch of males and females to mainly males. Female Atlantic Sharpnose Sharks are known to remain in deeper offshore waters once mature (size at maturity: 620 mm FL; Hoffmayer et al., 2013b), and mature males return to coastal areas of the GOM each spring (Parsons and Hoffmayer, 2005; Hoffmayer et al., 2006), therefore this shift in the size composition is not surprising as the depth strata for the modified design was restricted to 3 -10 m. Comparison of the Atlantic Sharpnose Shark catch between the modified SEAMAP design and NMFS BLL survey corroborates this as the NMFS survey captures the offshore female Atlantic Sharpnose Shark signature while the modified SEAMAP survey captures the portion of adult males that are moving inshore.
This species was the only assessed species that showed an increase in CV with the modified design indicating a reduction in the frequency of occurrence for this species. This may be due to a gear bias selecting against the smallest Atlantic Sharpnose Shark size classes. Hoffmayer et al. (2013b) showed that Atlantic Sharpnose Sharks pup at approximately 350 mm resulting in a neonate shark with a mouth gape that could not consume a 15/0 hook with a large piece of bait. The length frequency histograms show that Atlantic Sharpnose Sharks are not caught in larger numbers until the 500 mm size class. There may also be a concerning trend occurring for this species that our analysis is capturing. The modified SEAMAP design showed a reduction in catch, which was surprising considering that the Atlantic Sharpnose Shark typically had the highest catch rates. However, looking at trends in catch across multiple GOM surveys since 2013, there has been a consistent decline in Atlantic Sharpnose shark catch (NMFS, unpub. data). Therefore, the increase in CV and the decrease in catch may highlight a true population-level shift in abundance.
Blacktip Sharks exhibited an increase in frequency of occurrence and relative abundance with the modified SEAMAP BLL design compared to the early design. The number of Blacktip Sharks caught was more than double, and included a similar mix of males and females, and length frequencies. This is not surprising since the survey’s new depth boundary encompassed the species’ known depth range (Compagno, 1984; Castro, 2011). The low catch numbers in the early design were likely driven by the imbalance of sampling effort across the different state partners. It was found that the modified SEAMAP BLL survey catches a larger number as well as a broader size range of Blacktip Sharks than the NMFS BLL survey and will ultimately become a better indicator for population abundance. Although the CVs for the Blacktip Shark’s relative abundance index only slightly improved with the modified design, the increased catch that this survey will have as compared to the NMFS BLL survey will improve the precision for this species.
Red Drum exhibited an increased frequency of occurrence between the early and modified SEAMAP BLL survey designs. There were more than twice as many Red Drum caught across the adult size range with the modified design resulting in greatly improved CVs. As Red Drum is a coastal, shallow water species that prefers sand and mud bottoms in the GOM (McEachran and Fechhelm, 2005), these changes were likely driven by the restricted sampling depth with the modified design. Red Drum is a highly sought after recreational and commercial species that was recently assessed in the GOM in a data limited stock assessment (SEDAR 49, 2016) with only a single fishery independent dataset from a limited spatial area eligible for evaluation (SEDAR 49, 2016). It was recommended to either expand current inshore surveys that catch Red Drum or develop a new survey to characterize the relative abundance and size composition of Red Drum across the GOM (SEDAR 49, 2016). The modified SEAMAP BLL survey, especially with the recent expansion into Florida waters (2024), shows promise for generating a future index of abundance for Red Drum.
Multi-species surveys that target highly migratory species such as sharks will continually be faced with concern over the spatial and temporal universe covered by the survey, as catchability can be continually changing and influenced by many factors such as environmental, management, or biological processes (Simpfendorfer et al., 2002; Wilberg et al., 2010). Surveys are always designed with the best intentions for gathering data on the target species; however, the decision to change the design of a long-term survey should never be taken lightly. Instead, routine evaluation of the survey data to ensure that it continues to meet management needs is suggested (Bonar et al., 2009; Wang et al., 2018; Vecchio et al., 2023; Cheng et al., 2024).
The survey modification steps discussed herein are typical of the maturation process for a multi-agency survey. The transition to a spatially balanced, unified sampling design and the reduction of spatial overlap with concurrent surveys improved target species’ relative abundance index CVs and reduced the potential redundancy in information provided by the respective BLL surveys. Although catch of some species were lost in the design change (i.e., Red Snapper, Smoothhound, Sandbar Shark; all still present in the NMFS survey), the change has resulted in higher catches of several FMP teleost and elasmobranch species that are highly important to commercial and recreational fisheries, including Blacktip Sharks, Bull Sharks, and Red Drum. Further, length frequencies for Atlantic Sharpnose Sharks and Blacktip Sharks showed that the modified SEAMAP BLL survey data was reflecting a different portion of the population than the NMFS BLL Survey.
With the addition of Florida to the modified SEAMAP BLL Survey in 2024, the SEAMAP BLL Survey will cover the entire spatial scope of the 3 – 10 m depth zone in the northern GOM. This consistent effort across the entire GOM basin will further improve the precision and utility of the data collected. Ultimately, these two surveys (SEAMAP and NMFS BLL) will represent the most comprehensive, standardized BLL dataset in the Gulf of Mexico.
Data availability statement
The datasets presented in this study can be found in online repositories. The names of the repository/repositories and accession number(s) can be found below: https://www.gsmfc.org/seamap-sis.
Ethics statement
This study was conducted in accordance with the local legislation and institutional requirements. The study was approved by The University of Southern Mississippi Institutional Animal Care and Use Commitee: 9031202, 11092217, 18010502, 18010502.1.
Author contributions
JH: Writing – original draft, Writing – review & editing. EH: Writing – original draft, Writing – review & editing. AP: Writing – original draft, Writing – review & editing. JM: Writing – review & editing. FM-A: Writing – review & editing. JR: Writing – review & editing. TS: Writing – review & editing. ZZ: Writing – review & editing.
Funding
The author(s) declare financial support was received for the research, authorship, and/or publication of this article. Funding for this survey was allocated by Congress through NOAA to the GOM SEAMAP partners. Funds are obligated annually via multi-year cooperative agreements. This paper focuses on the SEAMAP allocation that was designated to the Gulf states for the years 2008-2021 and only reports on the bottom longline survey efforts.
Acknowledgments
The authors would like to thank R. Waller of The University of Southern Mississippi, as he was instrumental in directing the initial funding for the SEAMAP BLL Survey, the Southeast Area Monitoring and Assessment Program for funding, Gulf States Marine Fisheries Commission for coordination, and Southeast Data Assessment and Review for data consideration, M. C. Christman for survey analysis, and the staff of the Center for Fisheries Research and Development at The University of Southern Mississippi.
Conflict of interest
The authors declare that the research was conducted in the absence of any commercial or financial relationships that could be construed as a potential conflict of interest.
Publisher’s note
All claims expressed in this article are solely those of the authors and do not necessarily represent those of their affiliated organizations, or those of the publisher, the editors and the reviewers. Any product that may be evaluated in this article, or claim that may be made by its manufacturer, is not guaranteed or endorsed by the publisher.
Supplementary material
The Supplementary Material for this article can be found online at: https://www.frontiersin.org/articles/10.3389/fmars.2024.1426756/full#supplementary-material
Abbreviations
BLL, bottom longline; CPUE, catch per unit effort; CV, coefficient of variation; FMP, federal management plan; GOM, Gulf of Mexico; NMFS, National Marine Fisheries Service; SEAMAP, Southeast Area Monitoring and Assessment Program; SEDAR, Southeast Data and Assessment Review.
References
Ault J. S., Smith S. G., Richards B. L., Yau A. J., Langseth B. J., O’Malley J. M., et al. (2018). Towards fishery-independent biomass estimation for Hawaiian Islands deepwater snappers. Fisheries Res. 208, 321–328. doi: 10.1016/j.fishres.2018.08.012
Blanchard J. L., Maxwell D. L., Jennings S. (2008). Power of monitoring surveys to detect abundance trends in depleted populations: the effects of density-dependent habitat use, patchiness, and climate change. ICES J. Mar. Sci. 65, 111–120. doi: 10.1093/icesjms/fsm182
Bonar S. A., Contreras-Balderas S., Iles A. C. (2009). “An introduction to standardized sampling,” in Standard Methods for Sampling North American Freshwater Fishes. Eds. Bonar S. A., Hubert W. A., Willis D. W. (American Fisheries Society, Bethesda, MD).
Cadima E. L., Caramelo A. M., Afonso-Dias M., Conte de Barros P., Tandstad M. O., de Leiva-Moreno J. I. (2005). Sampling Methods Applied to Fisheries Science: A Manual. FAO Fisheries Technical Paper No. 434 (Rome: FAO), 99.
Cheng W., Zhang C., Ji Y., Xue Y., Ren Y., Xu B. (2024). Performance evaluation of spatially balanced sampling designs in fishery independent surveys. Fisheries Res. 270, 106879. doi: 10.1016/j.fishres.2023.106879
Clarke K. R., Warwick R. M. (2001). Change in Marine Communities: An Approach to Statistical Analysis and Interpretation. 2nd ed (Plymouth, UK: PRIMER-E Ltd), 203.
Compagno L. J. V. (1984). Sharks of the World: An Annotated and Illustrated Catalogue of Shark Species Known to Date. Vol. 4: Hexanchiformes to Lamniformes (Rome, Italy: Food and Agriculture Organization of the United Nations).
de Mutsert K., Cowan J. H., Essington T. E., Hilborn R. (2008). Reanalysis of Gulf of Mexico fisheries data: Landings can be misleading in assessments of fisheries and fisheries ecosystems. Proc. Natl. Acad. Sci. 105, 2740–2744. doi: 10.1073/pnas.0704354105
Dennis D., Plagányi É. (2015). Cost benefit of fishery-independent surveys: are they worth the money? Mar. Policy 58, 108–115. doi: 10.1016/j.marpol.2015.04.016
Driggers W.B.III., Ingram G. W. Jr., Grace M. A., Gledhill C. T., Henwood T. A., Horton C. N., et al. (2008). Pupping areas and mortality rates of young tiger sharks Galeocerdo cuvier in the western North Atlantic Ocean. Aquat. Biol. 2, 161–170. doi: 10.3354/ab00045
Francis R. I. C. C. (2011). Data weighting in statistical fisheries stock assessment models. Can. J. Fisheries Aquat. Sci. 68, 1124–1138. doi: 10.1139/f2011-165F
Grace M., Henwood T. (1997). Assessment of the distribution and abundance of coastal sharks in the U.S. Gulf of Mexico and Eastern Seaboard 1995 and 1996. Mar. Fisheries Review 59, 23–32.
Grace M. A., Ingram W., Driggers W.B.III., Henwood T. (2012). Assessing adequate sampling levels with time-series resampling of fishery-independent bottom longline surveys of the U.S. Gulf of Mexico. Gulf Mexico Sci. 30. doi: 10.18785/goms.3001.06
Grüss A., Perryman H. A., Babcock E. A., Sagarese S. R., Thorson J. T., Ainsworth C. H., et al. (2018). Monitoring programs of the U.S. Gulf of Mexico: inventory, development and use of a large monitoring database to map fish and invertebrate spatial distributions. Rev. Fish Biol. Fisheries 28, 667–691. doi: 10.1007/s11160-018-9525-2
Grüss A., Walter J. F. III, Babcock E. A., Forrestal F. C., Thorson J. T., Lauretta M. V., et al. (2019). Evaluation of the impacts of different treatments of spatio-temporal variation in catch-per-unit-effort standardization models. Fisheries Res. 213, 75–93. doi: 10.1016/j.fishres.2019.01.008
Hansen M. J., Beard T. D. Jr., Hayes D. B. (2007). “Sampling and Experimental Design,” in Analysis and Interpretation of Freshwater Fisheries Data. Eds. Guy C. S., Brown M. L. (American Fisheries Society, Bethesda, MD), 51–120.
Hoffmayer E. R., Driggers W.B.III., Jones L. M., Hendon J. M., Sulikowski J. A. (2013b). Variability in the reproductive biology of the Atlantic Sharpnose Shark in the Gulf of Mexico. Mar. Coast. Fisheries: Dynamics Management Ecosystem Sci. 5, 139–151. doi: 10.1080/19425120.2013.783518
Hoffmayer E. R., Parsons G. R., Horton J. (2006). Seasonal and interannual variation in the energetic condition of adult male Atlantic Sharpnose Shark Rhizoprionodon terraenovae in the northern Gulf of Mexico. J. Fish Biol. 68, 645–653. doi: 10.1111/j.0022-1112.2006.00942.x
Hoffmayer E., Pollack A., Hendon J., Drymon M., Grace M. (2013a). Standardized catch rates of Atlantic sharpnose sharks (Rhizoprionodon terraenovae) collected during bottom longline surveys in Mississippi, Louisiana, Alabama, and Texas coastal waters 2004-2011. SEDAR34-WP- 11 (North Charleston: SEDAR).
Howard R. A., Ciannelli L., Wakefield W. W., Haltuch M. A. (2023). Comparing fishery-independent and fishery-dependent data for analysis of the distributions of Oregon shelf groundfishes. Fisheries Res. 258, 106553. doi: 10.1016/j.fishres.2022.106553
Ingram G. W., Alvarez-Berastegui D., Reglero P., Balbín R., García A., Alemany F. (2017). Incorporation of habitat information in the development of indices of larval Bluefin Tuna (Thunnus thynnus) in the Western Mediterranean Sea, (2001–2005 and 2012–2013). Deep Sea Res. Part II: Topical Stud. Oceanogr. 140, 203–211. doi: 10.1016/j.dsr2.2017.03.012
Kimura D. K., Somerton D. A. (2006). Review of statistical aspects of survey sampling for marine fishes. Rev. Fisheries Sci. Aquaculture 14, 245–283. doi: 10.1080/10641260600621761
Liu Y., Chen Y., Cheng J. (2009). A comparative study of optimization methods and conventional methods for sampling design in fishery-independent surveys. ICES J. Mar. Sci. 66, 1873–1882. doi: 10.1093/icesjms/fsp157
Lo N. C. H., Jacobson L. D., Squire J. L. (1992). Indices of relative abundance from fish spotter data based on delta-lognormal models. Can. J. Fisheries Aquat. Sci. 49, 2515–2526. doi: 10.1139/f92-278
Maunder M. N., Punt A. E. (2004). Standardizing catch and effort data: a review of recent approaches. Fisheries Res. 70, 141–159. doi: 10.1016/j.fishres.2004.08.002
McEachran J. D., Fechhelm J. D. (2005). Fishes of the Gulf of Mexico: Volume 2 Scorpaeniformes to Tetraodontiformes (Austin: University of Texas Press).
Miller T. J., Skalski J. R., Ianelli J. N. (2007). Optimizing a stratified sampling design when faced with multiple objectives. ICES J. Mar. Sci. 64, 97–109. doi: 10.1093/icesjms/fsl013
Nye J. A., Link J. S., Hare J. A., Overholtz W. J. (2009). Changing spatial distribution of fish stocks in relation to climate and population size on the Northeast United States continental shelf. Mar. Ecol. Prog. Series 393, 111–129. doi: 10.3354/meps08220
Parsons G. R., Hoffmayer E. R. (2005). Seasonal changes in the distribution and relative abundance of the Atlantic Sharpnose Shark Rhizoprionodon terraenovae in the north central Gulf of Mexico. Copeia 2005 (4), 913–919. doi: 10.1643/0045-8511(2005)005[0914:SCITDA]2
Pennington M. (1985). Estimating the relative abundance of fish from a series of trawl surveys. Biometrics 41, 197–202. doi: 10.2307/2530654
Pennington M., Godø O. R. (1995). Measuring the effect of changes in catchability on the variance of marine survey abundance indices. Fisheries Res. 23, 301–310. doi: 10.1016/0165-7836(94)00345-W
Pennington M., Strømme T. (1998). Surveys as a research tool for managing dynamic stocks. Fisheries Res. 37, 97–106. doi: 10.1016/S0165-7836(98)00129-5
Perry A. L., Low P. J., Ellis J. E., Reynolds J. D. (2005). Climate change and distribution shifts in marine fishes. Science 308, 1912–1915. doi: 10.1126/science.1111322
Peterson C. T., Grubbs R. D. (2024). Temporal community structure and seasonal climatic migration of coastal sharks and large teleost fishes in the northeast Gulf of Mexico. Can. J. Fisheries Aquat. Sci. 80, 1335–1350. doi: 10.1139/cjfas-2022-0124
Rago P. J. (2005). “Fishery independent sampling: survey techniques and data analyses,” in Management Techniques for Elasmobranch Fisheries. Eds. Musick J. A., Bonfil R. (Food and Agriculture Organization of the United Nations, Rome, Italy), 201–215.
Richards B. L., Smith J. R., Smith S. G., Ault J. S., DiNardo G. T., Kobayashi D., et al. (2016). Design and implementation of a bottomfish fishery-independent survey in the main Hawaiian Islands. U.S. Department of Commerce, National Oceanic and Atmospheric Administration, NOAA Technical Memorandum NOAA-TM-NMFS-PIFSC-53. 54 p. Available at: htps://repository.library.noaa.gov/view/noaa/10761.
SEDAR 29. (2012). SEDAR 29 stock assessment report HMS gulf of Mexico blacktip shark (North Charleston, SC: SEDAR). Available at: https://sedarweb.org/documents/sedar-29-final-stock-assessment-report-gulf-of-Mexico-blacktip-shark/ (Accessed April 10, 2024).
SEDAR 34. (2013). SEDAR 34 stock assessment report HMS atlantic sharpnose shark (North Charleston, SC: SEDAR). Available at: https://sedarweb.org/documents/sedar-34-final-stock-assessment-report-atlantic-sharpnose-shark/ (Accessed April 10, 2024).
SEDAR 49. (2016). SEDAR 49 stock assessment report gulf of Mexico data-limited species (North Charleston, SC: SEDAR), 618. Available at: https://sedarweb.org/documents/sedar-49-final-stock-assessment-report-gulf-of-Mexico-data-limited-species/ (Accessed April 10, 2024).
SEDAR 54. (2017). SEDAR 54 stock assessment report HMS sandbar shark (North Charleston, SC: SEDAR). Available at: https://sedarweb.org/documents/sedar-54-final-assessment-report-hms-sandbar-shark/.
SEDAR 77. (2024). SEDAR 77 stock assessment report HMS hammerhead sharks (North Charleston, SC: SEDAR). Available at: https://sedarweb.org/documents/sedar-77-hms-hammerhead-sharks-final-stock-assessment-report/ (Accessed April 10, 2024).
Simpfendorfer C. A., Hueter R. E., Bergman U., Connett S. M. H. (2002). Results of a fishery-independent survey for pelagic sharks in the western North Atlantic 1977-1994. Fisheries Res. 55, 175–192. doi: 10.1016/S0165-7836(01)00288-0
Smith S. G., Ault J. S., Bohnsack J. A., Harper D. E., Luo J., McClellank D. B. (2011). Multispecies survey design for assessing reef-fish stocks, spatially explicit management performance, and ecosystem condition. Fisheries Res. 109, 25–41. doi: 10.1016/j.fishres.2011.01.012
Springer S. (1940). The sex ratio and seasonal distribution of some Florida sharks. Copeia 1940, 188–194. doi: 10.2307/1437982
Stone R. B., Bailey C. M., McLaughlin S. A., Mace P. A., Schulze M. B. (1998). Federal management of US Atlantic shark fisheries. Fisheries Res. 39, 215–221. doi: 10.1016/S0165-7836(98)00185-4
Thorson J. T., Johnson K. F., Methot R. D., Taylor I. G. (2017). Model-based estimates of effective sample size in stock assessment models using the Dirichlet-multinominal distribution. Fisheries Res. 192, 84–93. doi: 10.1016/j.fishres.2016.06.005
Vecchio J. L., Bubley W. J., Smart T. I. (2023). Increased fishery-independent sampling effort results in improved population estimates for multiple target species. Front. Mar. Sci. 10. doi: 10.3389/fmars.2023.1192739
Walters C. J. (2003). Folly and fantasy in the analysis of spatial catch data. Can. J. Fisheries Aquat. Sci. 60, 1433–1436. doi: 10.1139/f03-152
Wang J., Xu B., Zhang C., Xue Y., Chen Y., Ren Y. (2018). Evaluation of alternative stratifications for a stratified random fishery independent survey. Fisheries Res. 207, 150–159. doi: 10.1016/j.fishres.2018.06.019
Warwick R. M., Carr M. R., Clarke K. R., Gee J. M., Green R. H. (1988). A mesocosm experiment on the effects of hydrocarbon and copper pollution on a sublittoral soft-sediment meiobenthic community. Mar. Ecol. Prog. Series 46, 181–191. doi: 10.3354/meps046181
Wilberg M. J., Thorson J. T., Linton B. C., Berkson J. (2010). Incorporating time-varying catchability into population dynamic stock assessment models. Rev. Fisheries Sci. 18, 7–24. doi: 10.1080/10641260903294647
Xu B., Zhang C., Xue Y., Ren Y., Chen Y. (2015). Optimization of sampling effort for a fishery-independent survey with multiple goals. Environ. Monit. Assess. 187, 252. doi: 10.1007/s10661-015-4483-9
Keywords: fishery-independent survey, coefficient of variation, multispecies, standardization, stock assessment, Atlantic Sharpnose Shark, Blacktip Shark, Red Drum
Citation: Hendon JM, Hoffmayer ER, Pollack AG, Mareska J, Martinez-Andrade F, Rester J, Switzer TS and Zuckerman ZC (2025) Impacts of survey design on a Gulf of Mexico bottom longline survey and the transition to a unified, stratified - random design. Front. Mar. Sci. 11:1426756. doi: 10.3389/fmars.2024.1426756
Received: 02 May 2024; Accepted: 06 December 2024;
Published: 03 January 2025.
Edited by:
Fabio Campanella, National Research Council (CNR), ItalyReviewed by:
Bradley P. Harris, Alaska Pacific University, United StatesWalter Bubley, South Carolina Department of Natural Resources, United States
Copyright © 2025 Hendon, Hoffmayer, Pollack, Mareska, Martinez-Andrade, Rester, Switzer and Zuckerman. This is an open-access article distributed under the terms of the Creative Commons Attribution License (CC BY). The use, distribution or reproduction in other forums is permitted, provided the original author(s) and the copyright owner(s) are credited and that the original publication in this journal is cited, in accordance with accepted academic practice. No use, distribution or reproduction is permitted which does not comply with these terms.
*Correspondence: Jill M. Hendon, SmlsbC5oZW5kb25AdXNtLmVkdQ==
†These authors contributed equally to this work and share first authorship