 Judha Benhur
 Mullai Vendhan
 Ramkumar Janagiraman
- National Institute of Ocean Technology, Ministry of Earth Sciences, Chennai, Tamil Nadu, India
Puducherry, a Union Territory of India, has been strongly affected by severe erosion after the construction of the Puducherry port in 1989. To mitigate this cause, the National Institute of Ocean Technology, Chennai, and the Puducherry government implemented a beach restoration strategy involving a hybrid solution in 2017 for coastal protection/stabilization and the restoration of the lost beach. The strategy involved deploying a steel reef into the nearshore sea and implementing beach nourishment processes. To monitor the coastal morphological changes after implementing the coastal protection strategy, the Digital Shoreline Analysis System, was adopted to calculate the rate of shoreline change statistics for the years 2016 to 2022. It uses spatio-temporal shoreline positions from multi-temporal satellite imagery. The shorelines are extracted from the Sentinel-2A satellite images by a Normalized Differential Water Index based semi-automated model. Statistical parameters in DSAS analyze the shorelines to determine the shoreline changes in this area. The results reveal the remarkable resilience of a newly restored beach, where the linear regression rate statistics in Zone A show an average accretional rate of 2.92m/yr. Alternatively, Zone B exhibits an average erosion rate of -0.23m/yr, with intermittent sandy beaches experiencing maximum erosion rates of -1.63m/yr. The influence of longshore current direction and sediment transport on shoreline movement is evident in seasonal analysis, with shoreline development and recession primarily observed near shore protection structures. The study’s outcome provides valuable insights for coastal management, offering a reliable approach for shoreline monitoring post-implementation of mitigation projects.
1 Introduction
Coastal communities are highly interconnected with the seafood, transportation, and tourism industries (Abriani, 2023; Islam, 2024). Being a crucial element in economic development, these communities face livelihood and local economic constraints arising from the spatio-temporal variation of the coastlines, particularly concerning erosion and accretion events (Quang et al., 2021). In response to such challenges, shoreline analysis using Remote sensing and GIS techniques have become as one of the vital strategies adopted for planning coastal management strategies (Twumasi et al., 2016; Quang et al., 2021; Hossen and Sultana, 2023). Shoreline is the dynamic line of interface that distinguishes land and water, which has been recognized as a significant instrument for determining the spatial and temporal fluctuation of the coastline (Hayden et al., 1978; Pajak and Leatherman, 2002; Boak and Turner, 2005; Maiti and Bhattacharya, 2009; Cui and Li, 2011). Both natural (e.g., tides, waves, rivers, storms, geology, geomorphology, sea level rise) and anthropogenic activity interfering with natural coastal processes are accountable for the dynamic shoreline migration pattern (Palanques and Guillén, 1998; Morton et al., 2005; Aedla et al., 2015; Chenthamil Selvan et al., 2016; Zambrano-Medina et al., 2023).
Artificial shore protection structures were constructed to protect and develop the coastal community from the natural erosive processes on the shoreline. Construction of seawalls, groins, tetrapods, ripraps, and breakwaters are some of the coastal protection measures to reduce the erosion prone areas along the coast (Esmail et al., 2019; Ramana Murthy et al., 2020; Sundar et al., 2022). Coastal protection structures effectively shield and stabilize vulnerable coastlines from erosion within their vicinity (Lim et al., 2021). These coastal structures alter the natural hydrodynamic process and possibly migrate the erosive forces to nearby regions due to altered longshore current flow and sediment transport (Hall and Pilkey, 1991). The shoreline’s position gets reorientated after constructing coastal protection and development structures (Lim et al., 2021; El-Masry, 2022; Johnston et al., 2023) (Dean, 1986; Kraus and McDougal, 1996). reported that seawall structures can also induce erosion in adjacent beach areas. Therefore, it is necessary to understand shoreline dynamics to implement, monitor, and assess any impact post-implementation of any coastal management projects that interfere with shoreline morphology. After the development of Earth Observation satellites, shoreline modifications have been continuously studied using satellite imageries. Satellite imagery analysis for shoreline change is a fast and efficient technique to monitor and study coastal changes based on cost, coverage efficiency, and ease of use (Smith et al., 2021; Angelini et al., 2023). Several algorithms were developed for the extraction of shorelines from satellite data. In most studies, shorelines were extracted by either automated or manual digitization techniques (Ryu and Sun Won, 2002; Loos and Olaf Niemann, 2002; Yamano et al., 2006; Boak and Turner, 2005). Manual digitization is time-consuming and requires intensive user effort and visual perception that varies from person to person (Matin and Jahid Hasan, 2021). Meanwhile, thresholding-based automated shoreline extraction techniques are a faster approach to detecting and extracting shorelines (Toure et al., 2019; Hui et al., 2022). This study uses a semi-automated model to extract shorelines that use an image segmentation technique based on land and water reflectance properties. The Digital Shoreline Analysis System (DSAS) tool is used to analyze the spatio-temporal variation. It is a widely used statistical plugin in ArcGIS software that calculates the rate of shoreline changes using multi-temporal shoreline data (Thieler et al., 2009; Mishra et al., 2020; Bagaria et al., 2021).
Due to the construction of the breakwaters for the Port in 1989 in the Southern part of Puducherry City, severe beach erosion was induced on its Northern side, losing the majority of the sandy beach area (Chenthamil Selvan et al., 2016; Misra and Ramakrishnan, 2020). The Puducherry government constructed seawalls to protect the coastal area and mitigate erosional activity, but the erosion has intensified lately. As a sustainable shoreline management plan, the Puducherry government, along with the National Institute of Ocean Technology (NIOT, Chennai) in 2017, initiated a beach restoration project consisting of a hybrid solution with two components: (1) construction of artificial submerged reefs and (2) beach nourishment strategy, to restore the lost beach, protect and stabilize the beach at Puducherry coast (Balaji et al., 2019; Misra and Ramakrishnan, 2020; Ramana Murthy et al., 2020; Raju Alluri et al., 2022). The main objective of this study is to assess and evaluate the impact of the beach restoration project on Puducherry’s shoreline using open-source Sentinel-2A satellite images and GIS techniques. Furthermore, addressing the influence of coastal structures like the groins and breakwaters, this study has attempted to determine the position of shorelines on seasonal aspects.
2 Materials and methods
2.1 Study area
The study area (Figure 1A), encompassing a 3km stretch from the Chief Secretariat in the North to the North breakwater of the Puducherry port in the South, lies within the Union Territory of Puducherry, often referred to as the French city of India and renowned as a premier tourist destination. It is characterized by an artificial coastline dominated by seawalls and structures such as groins, breakwaters, and an abandoned old pier (Figures 1C, D). Geographically, the area is prone to cyclones and storm surges (Ramasamy et al., 2005; Shanmugam et al., 2014; Dhanya et al., 2020). The Northeast Monsoon season (October to January) holds greater dominance compared to the Southwest Monsoon (June to September) in this region (Misra and Ramakrishnan, 2020). Wave-induced currents consistently flow from south to north along the coastline, independent of tidal variations, significantly influencing the movement of longshore currents and sediment particles (Balaji et al., 2019). During the northeast monsoon season, waves approach the coast from the northeast, while during the southwest monsoon season, they predominantly come from the southeast and south directions. Approximately 75% of the year sediment transport is from south to north along the coastline, resulting in a net annual sediment transport towards the north (Dhanya et al., 2020; Sabah et al., 2022). The Gingee River, situated nearby, plays a vital role in sediment transport during the Northeast monsoon season by carrying substantial suspended sediment loads into the region, thereby influencing sediment deposition and dynamics (Sunder et al., 2017). A study by (Bharathi et al., 2017) indicates variations in nearshore transparency, with decreased suspended sediments during non-monsoon periods (February to May) and further reductions during monsoon seasons, reflecting reduced turbidity due to decreased wave and current forces. Beach morphology and shoreline changes in this region are unpredictable and attributed mainly to developmental activities hindering natural longshore sediment transport and beach reclamation (Anandabaskaran and Vijayakumar, 2022). A steel wedge reef of weight about 900 tons and measuring 60m x 50 m x 2.5m (Figure 2E), was fabricated at site and launched using airbags on August, 2018, at 2.5m water depth by NIOT. The steel reef is a triangular wedge of length 170 m projecting into sea pointing eastwards, in which 120 m will be below water level to naturally bypass sand to the northern areas. The width of reef is 110 m at base, which tappers to 15 m in the sea with a working platform of 50 m length into sea. The study is divided into Zones A and B (Figures 1B–D), each exhibiting unique characteristics and responses to coastal protection activities.
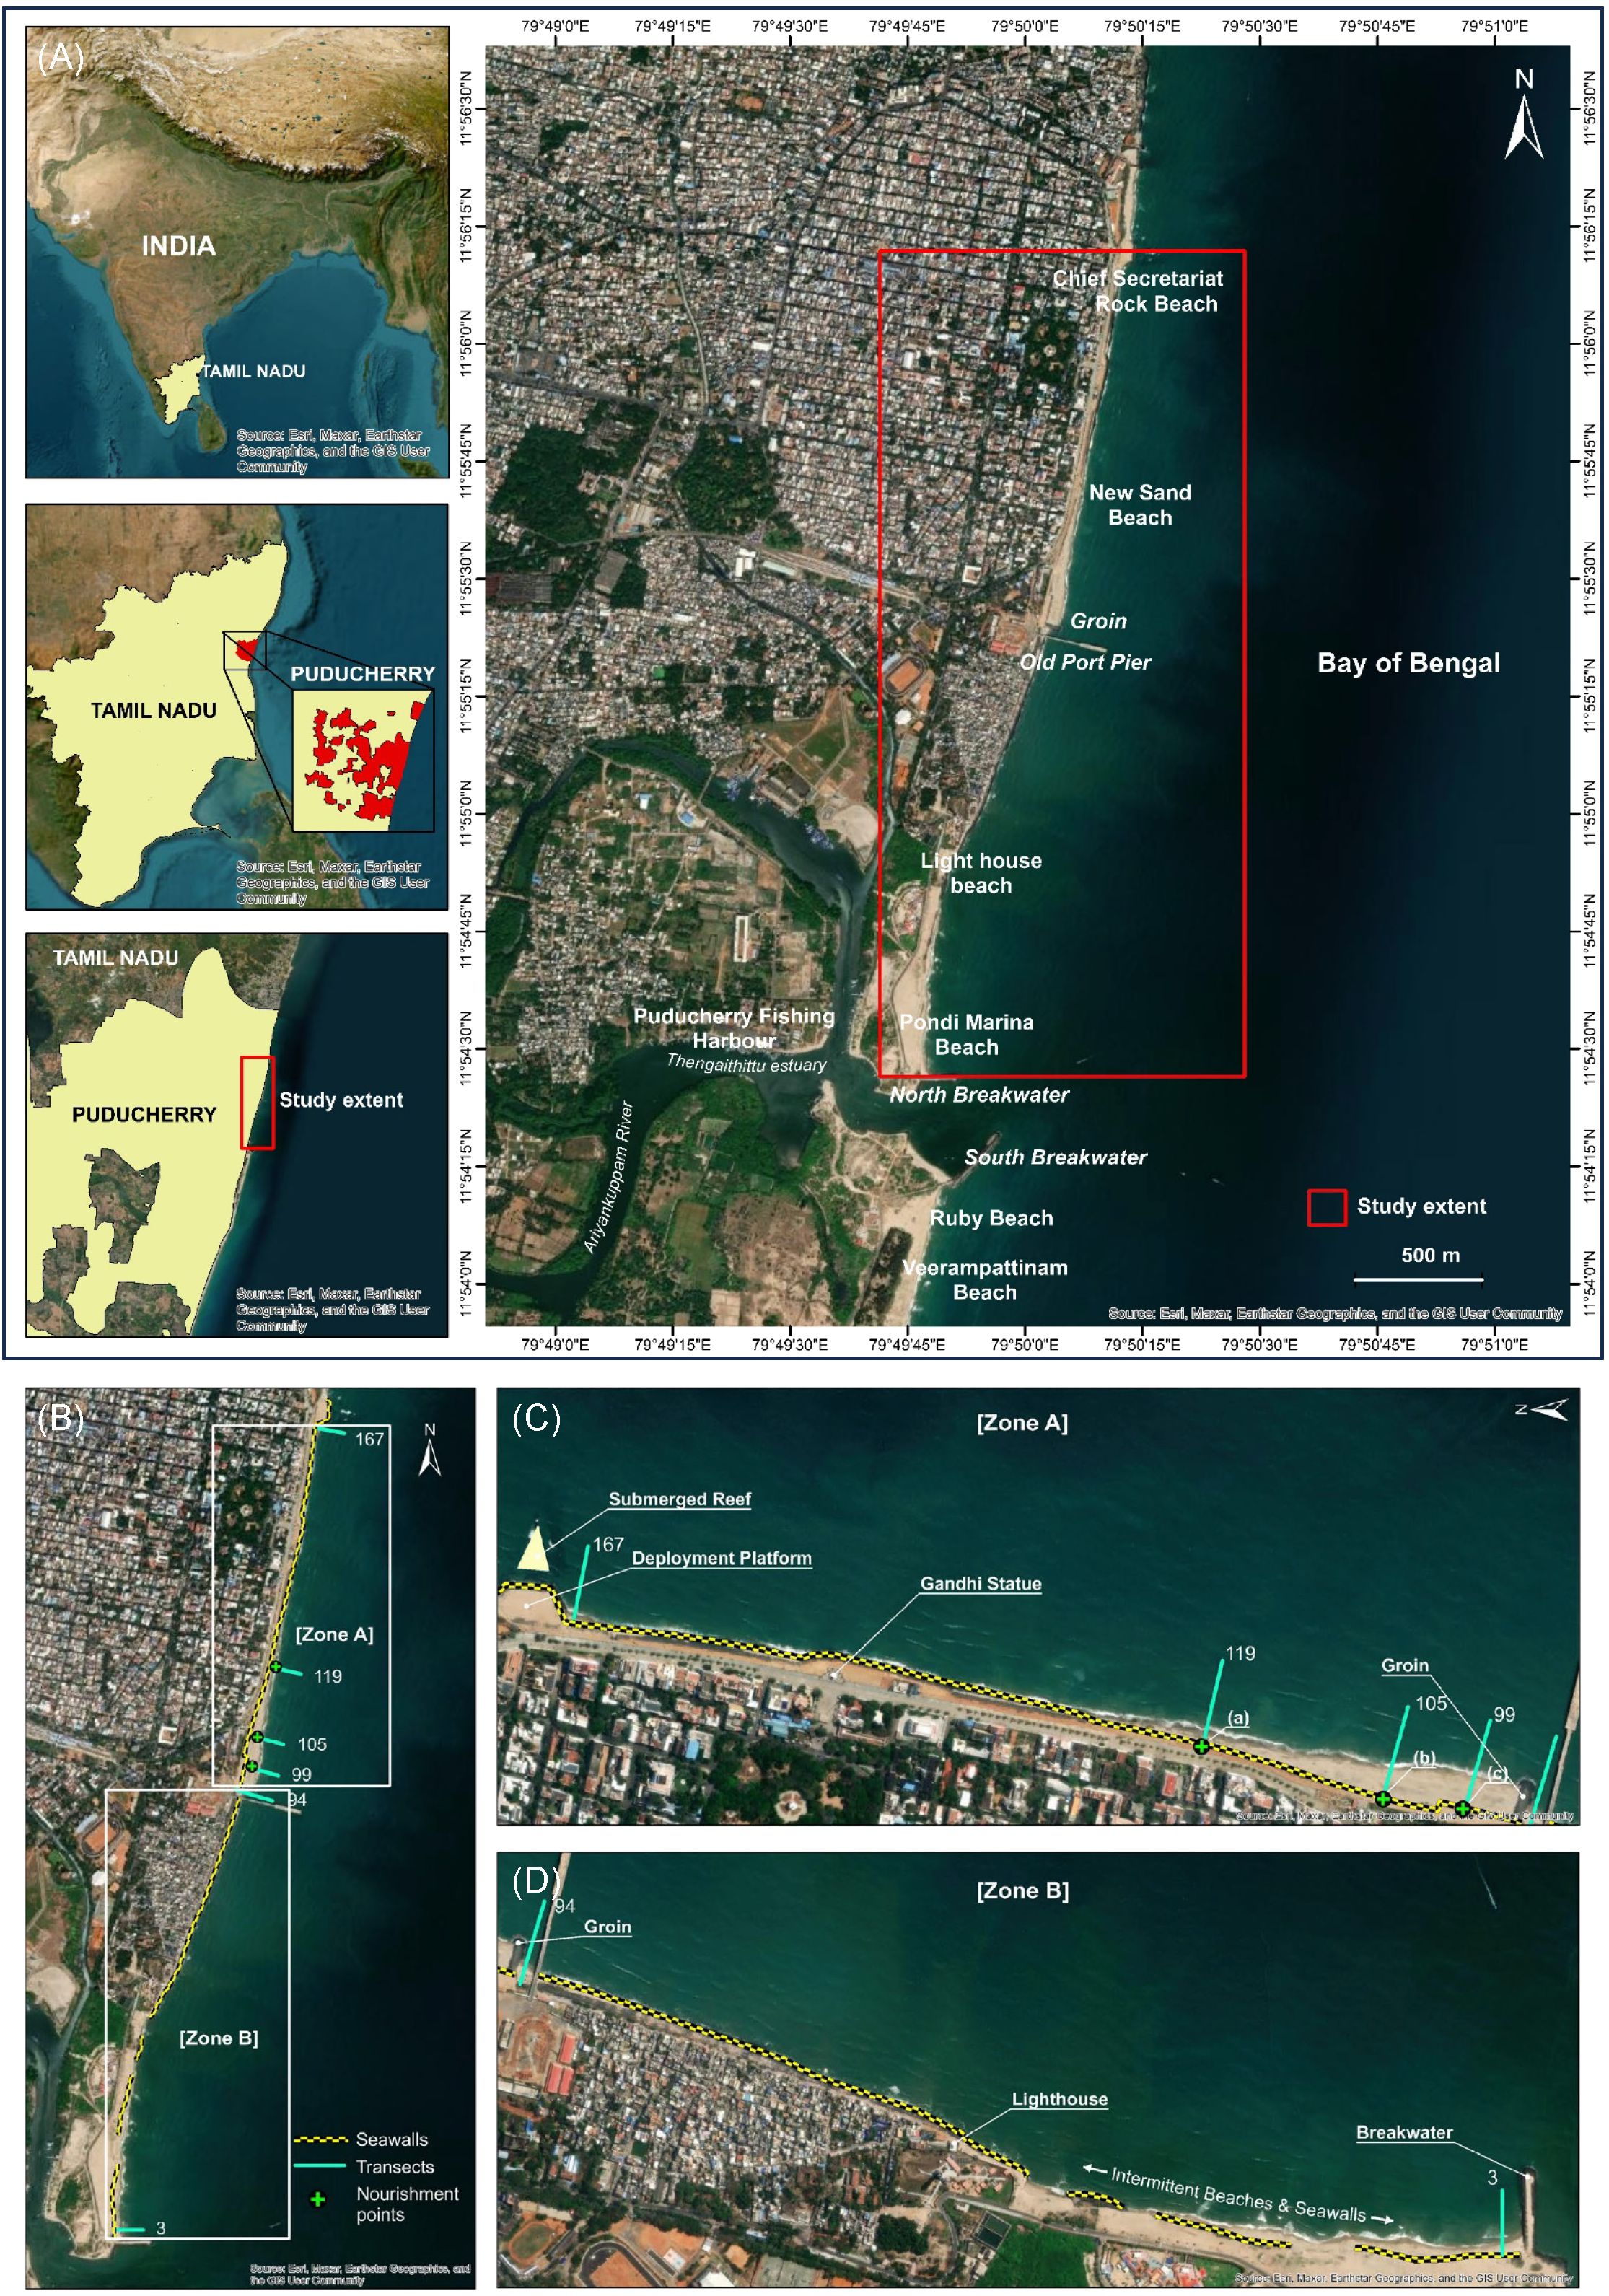
Figure 1 (A) Location of the Study Area. (B) Zonal division. (C) Zone A. (D) Zone B.
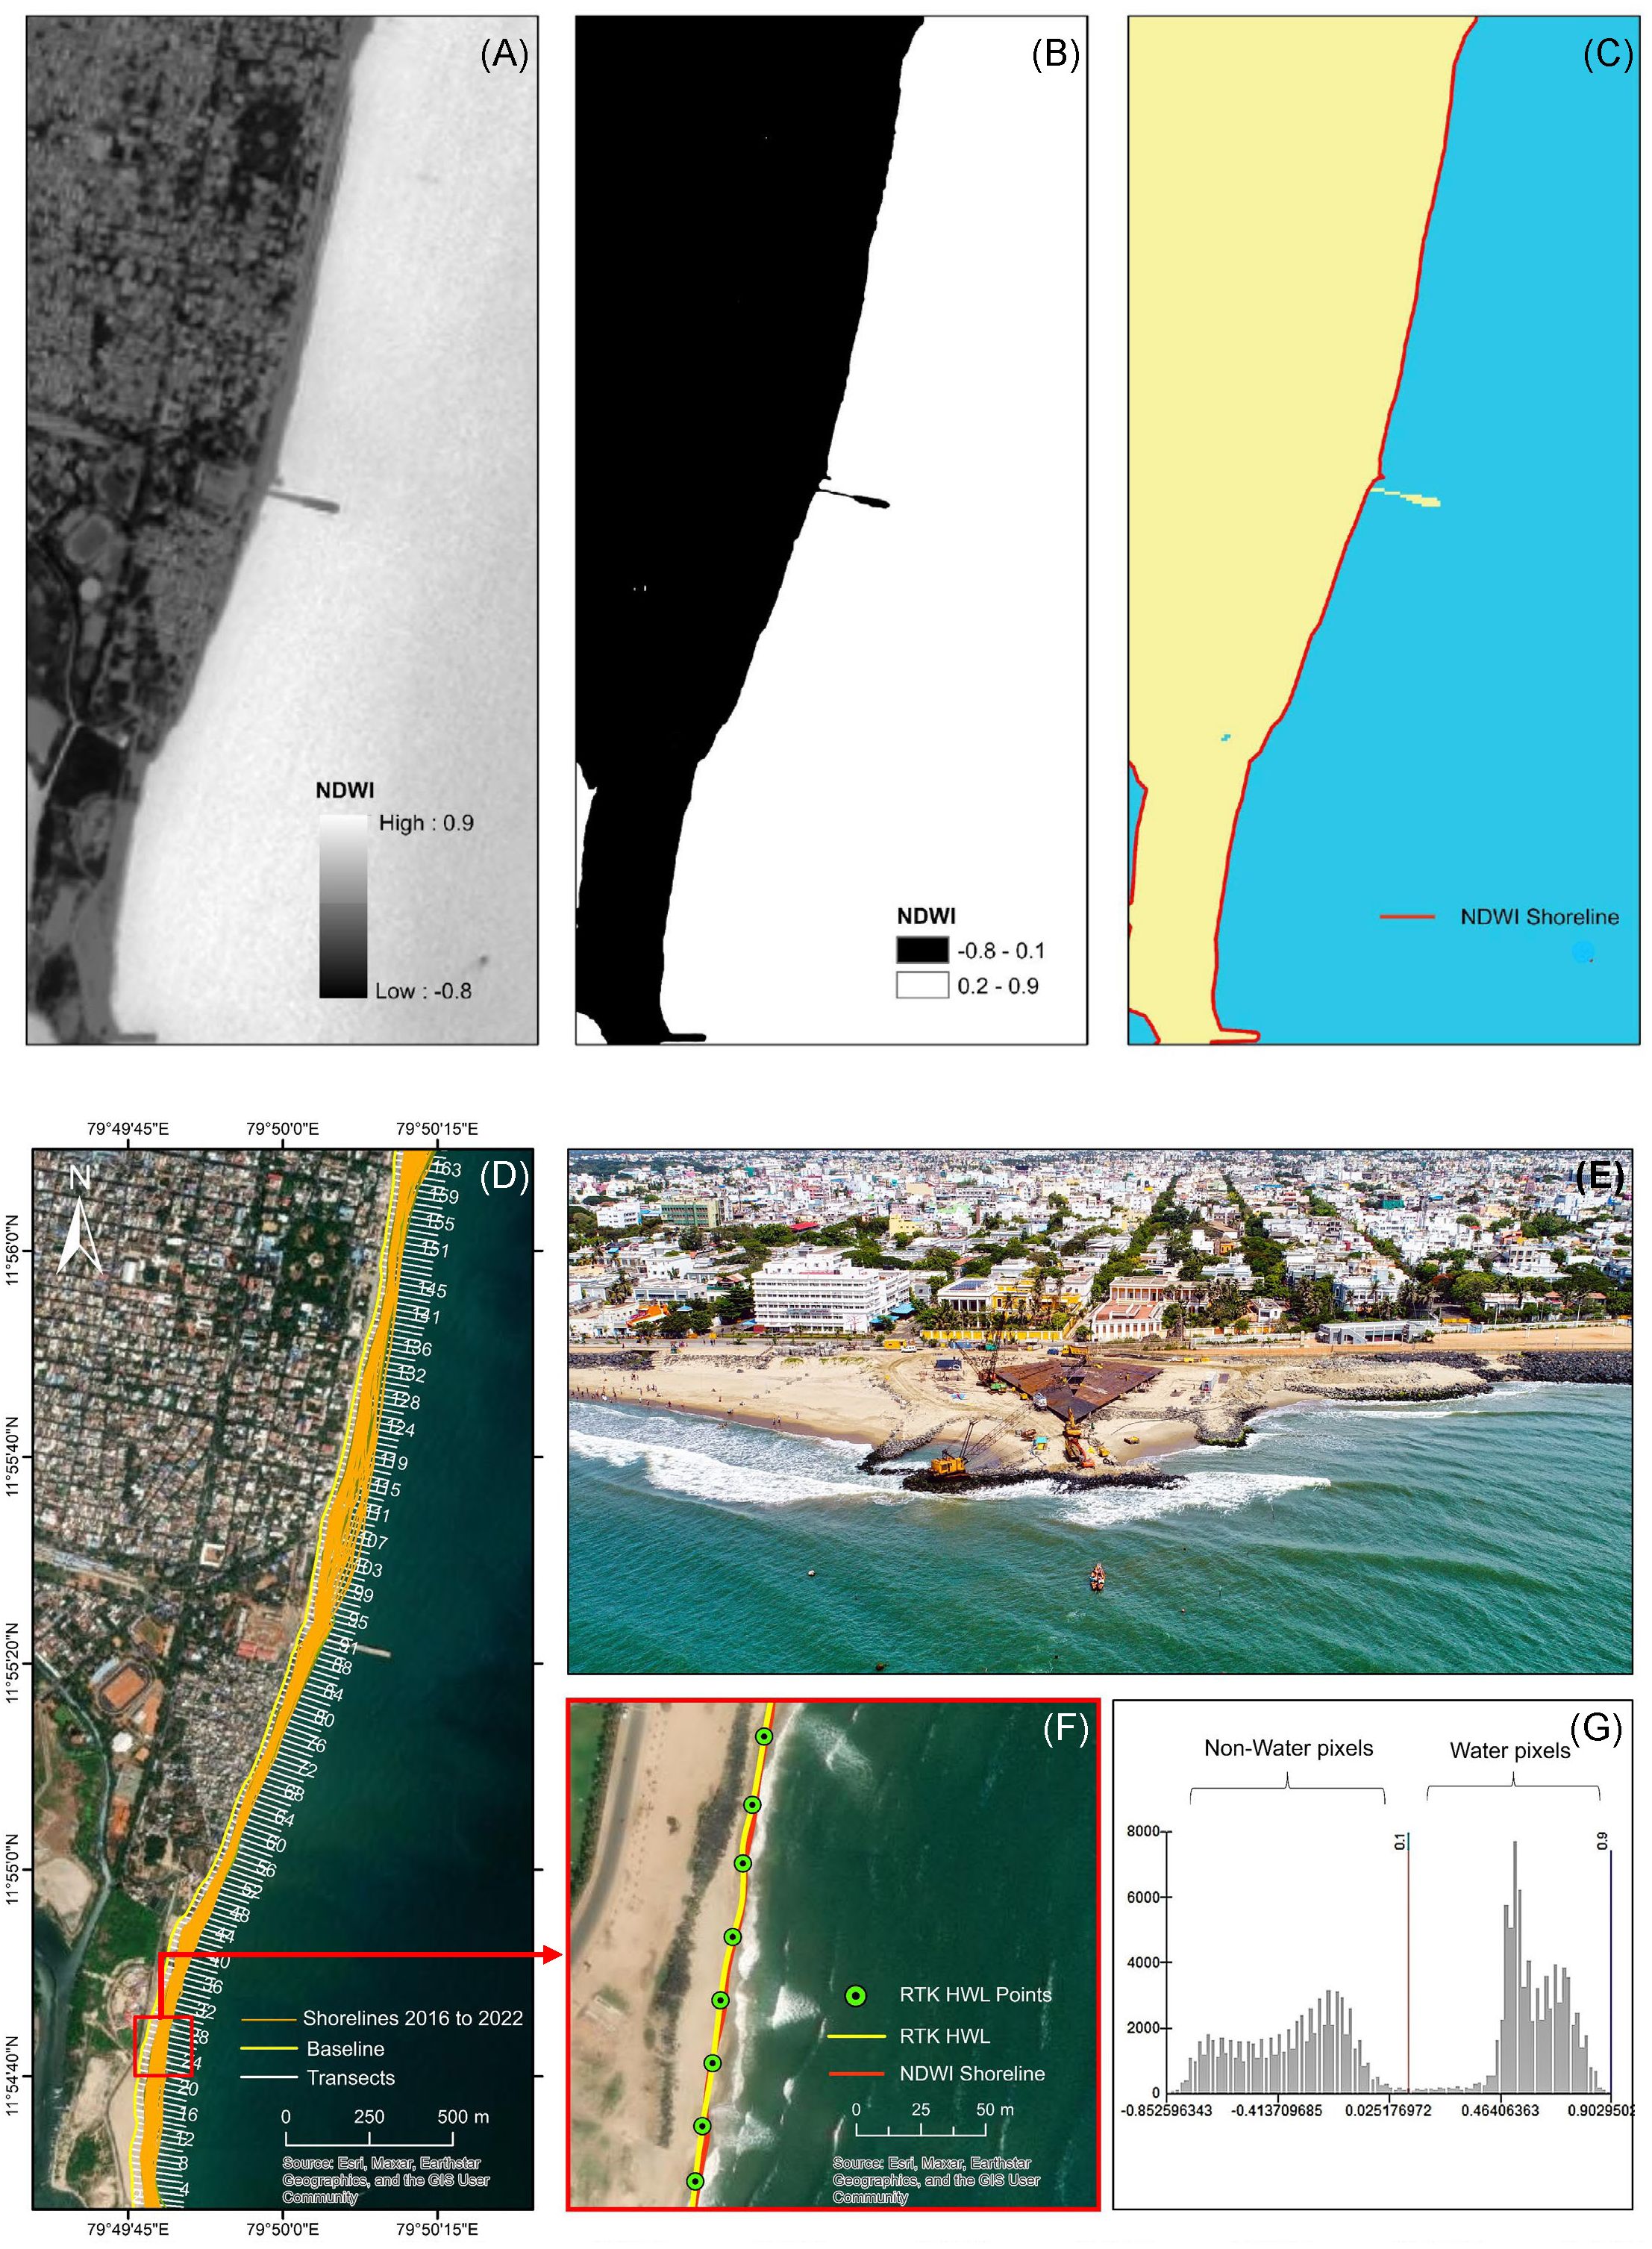
Figure 2 (A) NDWI image generated from Green and NIR band (B) Segmented image after thresholding (C) Extracted shoreline by vectorization. (D) Transects generation (E) Construction of the steel reef. (F) GNSS and NDWI derived shoreline. (G) Thresholding value at NDWI histogram.
2.2 Data
2.2.1 Sentinel-2 data
Sentinel-2 products are used for the study area of interest. Sentinel-2 data is a versatile resource for studies that require monthly or yearly analysis, especially when the study does not span several decades. Sentinel-2 offers a fast combined constellation revisit cycle of five days and has a medium to high spatial resolution of 10 meters (Drusch et al., 2012; Spoto et al., 2012; Mandanici and Bitelli, 2016; Bergsma and Almar, 2020; Yiğit et al., 2022) This study is concentrated on using single-resolution satellite data as the spatial resolution changes from using datasets with varying resolutions have a noticeable impact on shoreline positioning (Pardo-Pascual et al., 2018). In using multi-resolution datasets, all data needed to be reprojected and resampled to a standard spatial resolution and coordinate system (Maiti and Bhattacharya, 2009; Wu et al., 2015; Ge et al., 2022; Martinis et al., 2022; Ozturk and Ahmet Sesli, 2015). This decision eliminated the need for complex geometric resampling and error correction procedures typically required when combining satellite data with different spatial resolutions (Mandanici and Bitelli, 2016). About 134 satellite datasets were downloaded for all available months from January 2016 to December 2022, starting before the reef installation (35 datasets) and continuing until the project completion (99 datasets). This collection includes 43 datasets from the non-monsoon season, 45 from the southwest monsoon, and 46 from the northeast monsoon seasons. This study used Level-2A products of Sentinel-2, which are open-source and pre-processed products, corrected for orthorectification, atmospheric effects, and cloud cover.
2.2.2 GNSS data
GPS surveying techniques can be used to monitor the beaches, develop a procedure to collect and analyze the data for coastal application, and evaluate the accuracy of GPS beach surveys (Anandabaskaran and Vijayakumar, 2022). The wet/dry shoreline, the High-Water Line (HWL, the farthest point reached by the last high tide on land), was mapped using the Leica GS16 RTK GNSS system. The HWL is the commonly used shoreline indicator for shoreline change studies (Boak and Turner, 2005; Leatherman et al., 2002; Ozturk and Ahmet Sesli, 2015; Vicens-Miquel et al., 2022). The survey was planned to acquire shoreline ground truth data in the field around the time of satellite image capture. The GNSS points measured approximately 30 minutes before and after the satellite’s sensing time were used to validate the data. The satellite data acquisition occurred at 2:19:02Z (equivalent to 7:49 am IST), while the RTK GNSS survey spanned from 7:15 am to 8:30 am IST.The collected GNSS points (longitude and latitude) were converted to polyline features (Figure 2F) (the insitu shoreline), subsequently the shoreline data created from satellite images were validated.
2.3 Methods
Sentinel 2A datasets were acquired for all available months within this timeframe, and shoreline changes were comprehensively analyzed. The process involved the utilization of ArcGIS 10.7.1 software for model development and shoreline extraction. Furthermore, shoreline change analysis was facilitated through the DSAS tool on the extracted shorelines. Seasonal analysis was performed using the transect data generated by DSAS.
2.3.1 Semi-automated shoreline extraction
Shoreline data extraction of all possible months requires processing a considerable volume of satellite data. In this case, shoreline digitization is time-consuming, requires effort, and is also subject to misinterpretation. To reduce such limitations, a semi-automated shoreline extraction model was created using the model builder tool in ArcGIS software. The only limitations that classify this model as “semi-automated” are the manual input of the satellite data-containing folders and the visual inspection. This model is based on NDWI (McFeeters, 1996), which excels at detecting water bodies within the surrounding non-built land cover (Rokni et al., 2014). Thresholding is a rapid image segmentation technique that enables the instant extraction of shorelines from NDWI images (Qu and Wang, 2002; Liu and Jezek, 2004; Kuleli et al., 2011; Aedla et al., 2015; Toure et al., 2019). The Otsu method thresholding technique was used in this study to detect and extract shorelines (Otsu, 1979; Toure et al., 2019; Pucino et al., 2022) (Liu et al., 2017). us ed the segmentation method of the Otsu algorithm to separate the NDWI image into water and non-water features to extract shorelines. A threshold of ‘0.1’ is used on the NDWI data (Figure 2A) for land/water mapping (Hmelnov and Gachenko, 2021; Mora et al., 2021), and they are assumed to be interpreted as follows: values greater than 0.1 indicated surfaces of water, while values lower than 0.1 indicated non-water surfaces (Figure 2B). The NDWI images can be reclassified with ArcGIS software into binary format with values “>0.1” as water pixels and values “<0.1” (Figure 2G) as non-water pixels (Zoysa et al., 2023).
The model starts from thresholding till smoothening and extracting shorelines from 134 satellite images by iteration. The initial step involves batch processing to derive NDWI (Figure 2A) using 10m resolution band 3 (green band) and band 8 (NIR band) of all Sentinel-2A data. Subsequently, the NDWI data volume is fed into a self-iterating tool. The image segmentation technique proceeds with a thresholding value of 0.1. The segmented image was reclassified into binary raster (Figure 2B) and underwent a raster-to-polyline conversion using a vectorization process (Figure 2C) to delineate the continuous shoreline edges. Subsequently, a buffer operation was used to selectively eliminate small polygons and lines near the shoreline, which were random errors generated during the vectorization process. Finally, the extracted shoreline features were smoothened with a tolerance of 0.001 to remove any sharp irregularities, thereby providing an accurate shoreline vector.
2.3.2 Shoreline validation
A geometric comparison was conducted between the model-generated shoreline and ground truth data obtained through RTK GNSS measurements taken on the exact date and near acquisition time to validate the extracted shoreline. Transects were systematically generated at 5-meter intervals, intersecting the shorelines at a near-perpendicular angle. The Euclidean distance between the model-derived shorelines and the RTK GNSS shoreline was then measured at these intersection points. The Root Mean Square Error (RMSE) of 1.26 meters was calculated, indicating the level of deviation between the model-generated and ground truth shorelines.
2.3.3 DSAS-based analysis
The DSAS-based shoreline analysis examined the shoreline change along the Puducherry coast using statistical methods integrated within the DSAS tool. The Statistical parameters used for this study are the linear regression rate (LRR), net shoreline movement (NSM), and shoreline change envelope (NSM). The LRR is the rate-of-change statistic determined by fitting a least-squares regression line to all shoreline points for a transect. The NSM is the distance between each transect’s oldest and youngest shorelines. The SCE reports a distance (in meters), not a rate. The SCE value represents the largest distance among all the shorelines intersecting a given transect. As the total distance between two shorelines has no sign, the value for SCE is always positive (Himmelstoss et al., 2018). These statistical parameters provide a robust framework for analyzing shoreline dynamics on various temporal scales, ranging from monthly to long-term trends (Shanmugam et al., 2014; Chenthamil Selvan et al., 2016; Misra and Ramakrishnan, 2020). have utilized DSAS to identify both developed and vulnerable beach areas along the Puducherry coast. In this study, about 134 shoreline data were analyzed using LRR, which offers more accurate and objective results by considering all available coastlines to estimate the average rate of change over time. SCE values, consistently positive, indicate the maximum seaward or landward movement of the shoreline at a given transect. Negative values of LRR and NSM signify shoreline recession, while positive values denote advancement. Before statistical calculations, a baseline and shoreline layers were constructed. The shoreline vector data were imported into the shoreline layer. At the same time, the baseline was established on the “onshore” side of the study area, delineating a 50-meter landward buffer using compiled shoreline data. About 167 transects were cast towards the seaward side at every 20 m interval along the baseline (Figure 2D). After running DSAS, the shoreline rate change statistics of the Puducherry coast were obtained with a 90% confidence interval.
3 Results
3.1 DSAS analysis
3.1.1 Zone A
Zone A has a length of 1.47km and covers the transects from 96 to 167. It incorporates the adopted beach restoration strategy, such as the submerged reef and nourishment points. In 2018, the steel reef was successfully deployed, followed by periodic beach nourishment. The deployed submerged reef produces a wave-breaking activity that breaks the waves, rotates, and reduces its velocity such that suspended sediments in waves and longshore currents lose their momentum and subsequently deposit on the shore and bypass sediments to the upstream side of the reef (Ramana Murthy et al., 2020). After the project’s initiation, Zone A accretes at an average LRR rate of 2.92m/yr (Figure 3C), and no erosion is observed during this period. The maximum accretion rate is estimated to be 6.38m/yr in the nourishment area (Figure 4E). A low accretion rate is observed along the seawall area in Zone A (Figure 4E). According to shoreline classification by (Kankara et al., 1990), Zone A experiences stable to high accretion. Elevated SCE observed during 2016–2022 records a distance of 105.24m near the nourishment points (Figure 3A). In Zone A, the average SCE is observed to be 65.37m. Groins create beaches, and the high SCE value of 85.96m observed north of the groin represents the formation of a noticeable beach near the structure. The lowest SCE value of 34.06m occurs in the seawall region in Zone A (Figure 3A). Based on NSM, the shoreline reaches a maximum seaward distance of 47.30m, and there is no landward migration from the oldest shoreline (Figure 3B).
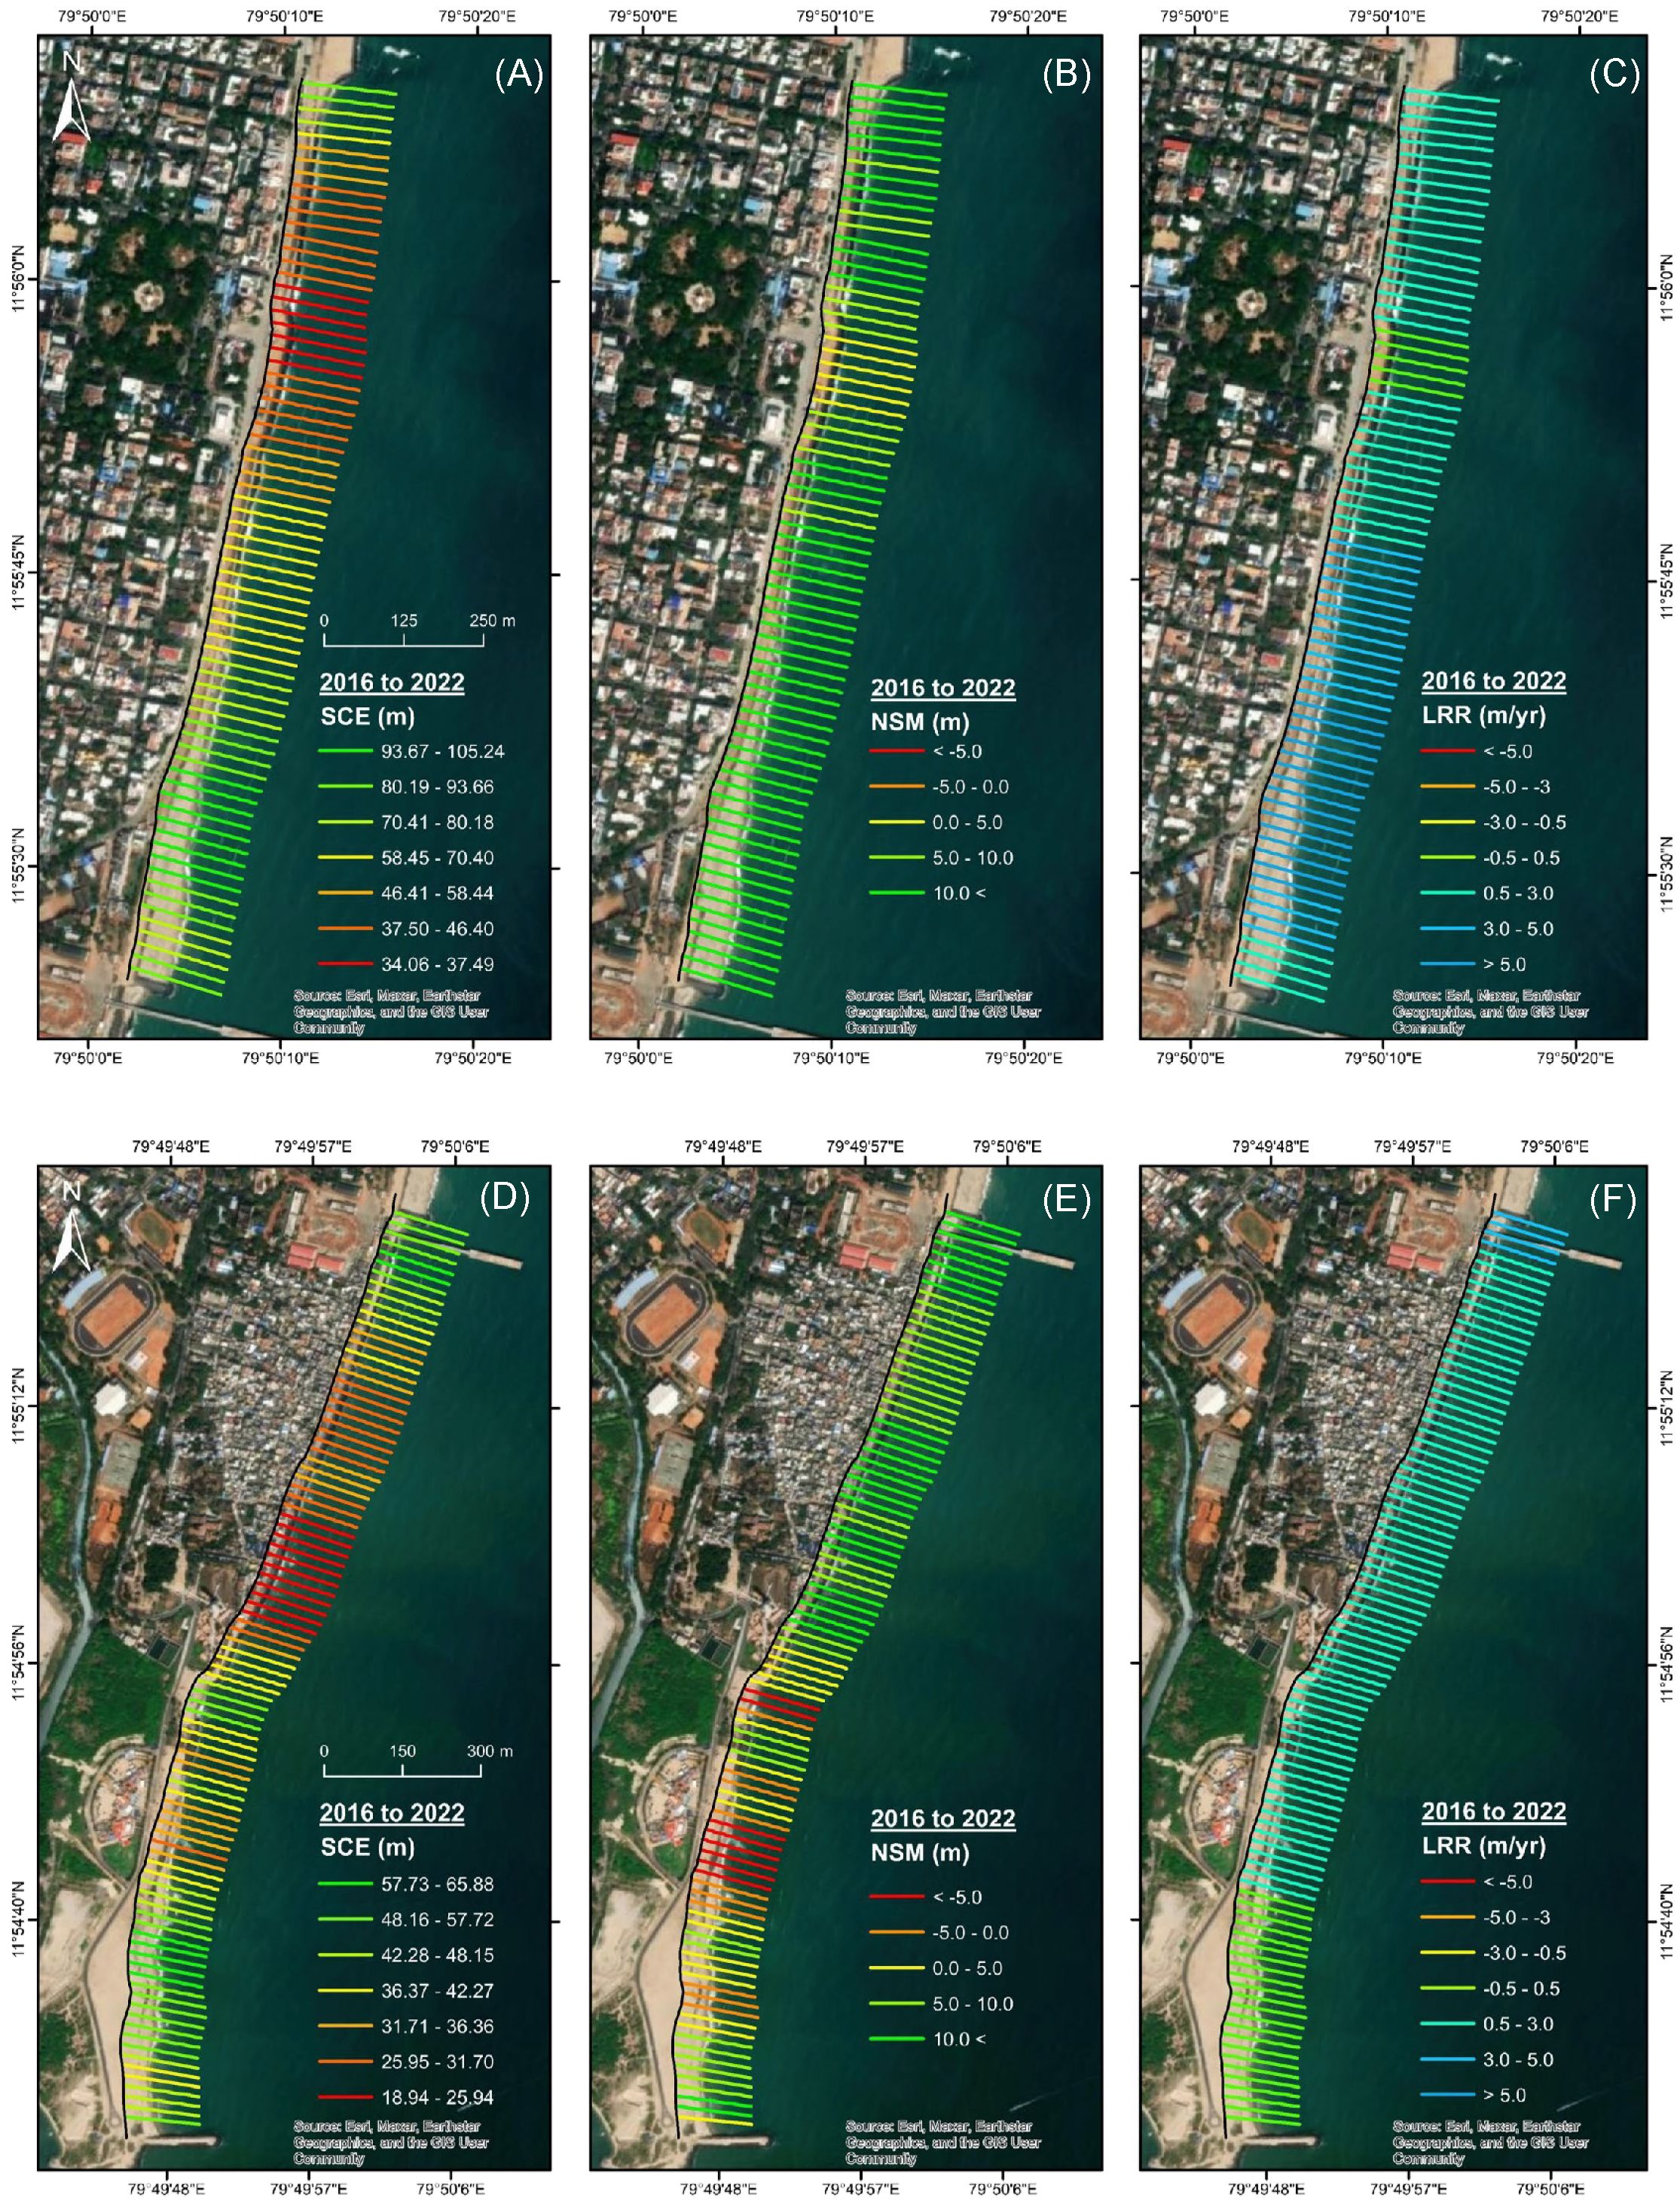
Figure 3 SCE (A), NSM (B), LRR (C) statistics for 2016 to 2022 in Zone A and SCE (D), NSM (E), LRR (F) statistics for 2016 to 2022 in Zone B.
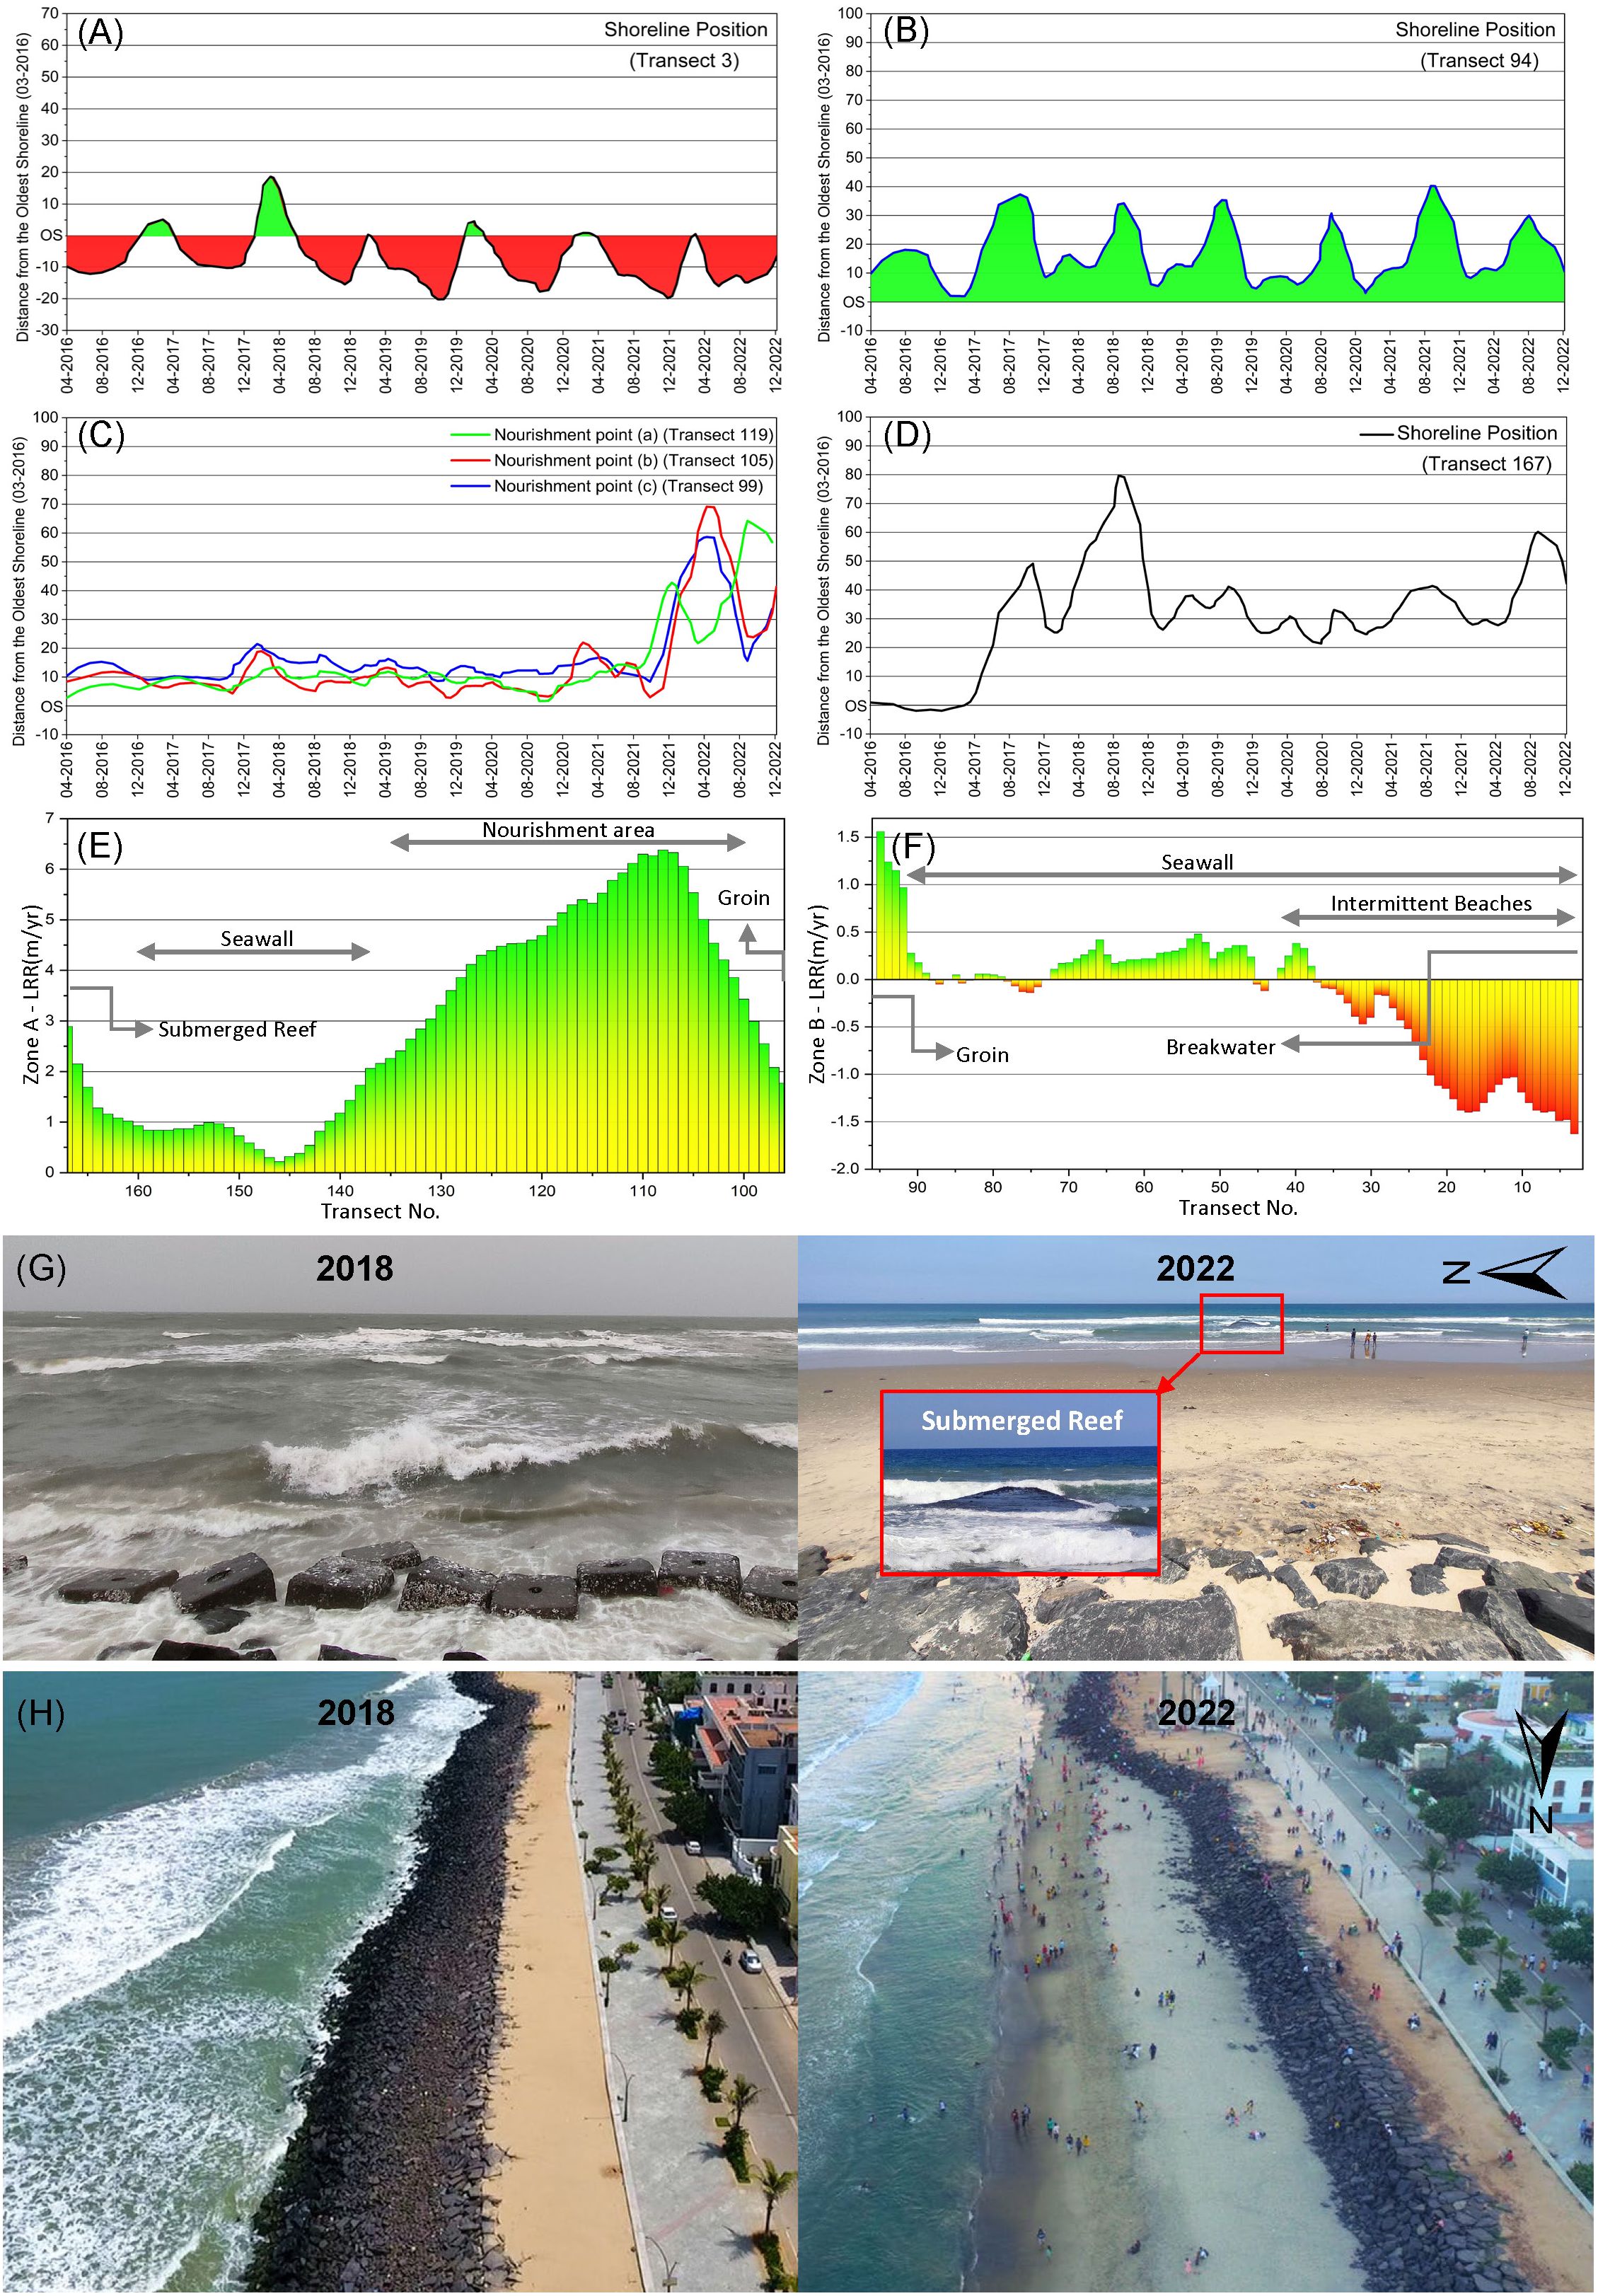
Figure 4 (A) Shoreline movement at Transect 3. (B) Shoreline movement at Transect 94. (C) Shoreline movement at the nourishment points. (D) Shoreline movement near the submerged reef. (E) Zone A LRR rates for transects 96 to 167. (F) Zone B LRR rates for transects 2 to 94. (G) Images before and after the submergence of the reef. (H) Images before and after the nourishment.
3.1.2 Zone B
Zone B covers the transects from 2 to 94, a distance of 1.53 km. From LRR, the average erosion rate of -0.23m/yr is observed in Zone B. The transects 14 to 21, 24 to 32, and 41 to 45 cover the intermittent beaches, and the remaining transects cover from the seawall to the groin. These beaches are exposed to erosion induced by the Port South Breakwater. These exposed intermittent sandy beaches exhibited a maximum LRR erosion rate of -1.63m/yr (Figures 3F, 4F). Erosion noticed along the seawall region in Zone B at an average erosion rate ranging between -0.04m/yr to -0.17m/yr might represent seawall deterioration over time (Figure 4F). Accretion rates ranging between 1.56m/yr to 1.15m/yr are noticeable at the southern side of the groin. The negative net shoreline movement values are prevalent on the intermittent beaches between seawalls in Zone B (Figure 3E). A maximum SCE of 65.88m is observed south of the groin, and a minimum SCE of 18.94m is observed along the seawall region (Figure 3D). However, most of the coast in Zone B is protected by seawalls and falls under the stable to moderate accretion category (Figure 3F).
3.2 Seasonal shoreline change
The seasonal variability of longshore currents significantly influences shoreline orientation and movement. Zone B, resembling a littoral cell bounded by a groin and a breakwater, was examined to understand these dynamics. The transects 3 and 94 adjacent to these structures were chosen for the seasonal analysis. The position of every shoreline intersecting these specific transects was determined, and the spatio-temporal distance of every shoreline was calculated from the oldest shoreline (OS) dated 27/03/2016 to the points of shoreline-transect intersections. The trend of the shoreline movement at Transect 3 (Figure 4A), near the north breakwater, experiences seasonal accretion during the northeast monsoon and erosion during the southwest monsoon. Over 2016–2022, maximum accretion of 18.9m and maximum erosion of -20.2m occurred near the north breakwater. The accretional trend on Transect 94 (Figure 4B) appears cyclic, with sand accumulation during the southwest monsoon. Loss of sand occurs during the northeast monsoon. Again, minor Sand accumulation and loss are observed from the start until the end of the non-monsoon period (Figure 4B). Therefore, based on erosion and accretion patterns, the direction of current flow in this area is southerly during the northeast monsoon and northerly during the southwest monsoon. The accretional activity is recorded near the groin during the southwest monsoon, and the erosional activity north of the breakwater occurs during the southwest monsoon and vice versa. On comparing Transect 3 and Transect 94 data, Erosion tends to be the dominant process in Transect 3, whereas accretion tends to be the dominant process in Transect 94. Transect 94 exhibits no erosion, and the shoreline accretion variability ranges between 3m and 40m.
3.3 Impact of the hybrid solution
The transects located near the reef and the points of beach nourishment were chosen for analysis. The transects 119,105, and 99 are located near the points of nourishment (a), (b), and (c), respectively (Figure 1D). The Transect 167 is located adjacent to the reef and records the shoreline changes near the reef area (Figure 1C). Prominent peaks indicate nourishment periods, with 2022 showing the most substantial changes (Figure 4C). Due to natural waves and current actions, the drastic shoreline regression is noticed after each nourishment activity.
Shoreline movement at Transect 167 (Figure 4D), near the reef, exhibited stability until 2016. Subsequent drastic accretion of 79.5m in 2018 resulted from reef deployment. However, after immediate erosion, a gradual development of the shoreline is observed in the following years. The deployed submerged reef produces a wave-breaking activity that breaks the waves, rotates, and reduces its velocity such that suspended sediments in waves and longshore currents lose their momentum and subsequently deposit on the shore (Ramana Murthy et al., 2020). A maximum accretion of 59.57m is observed after the installation of the reef.
4 Discussion
Implementing this hybrid solution has resulted in significant beach formation in Zone A. The engineering of the submerged reef has played a vital role in retaining the suspended sediments from the northerly drift and the wave-breaking actions. It is reported that the volume of sediment in the nearshore area improved after the implementation of the project, resulting in the formation of the beach (Misra and Ramakrishnan, 2020; Ramana Murthy et al., 2020). However, the results from the seasonal analysis show that the transformation of beach width near the submerged reef, groins, and breakwaters is entirely seasonal. This study’s findings show that the semi-automated shoreline extraction model has proven effective for quick and reliable shoreline analysis. Automated shoreline extraction using NDWI and Otsu thresholding proved effective for rapid and reliable shoreline analysis. Validation with ground truth data demonstrated the model’s accuracy, emphasizing its utility for monitoring coastal changes. Based on DSAS results, the overall condition of the coast appears to range from stable to moderate accretion. The maximum shoreline movement recorded near the groin indicates the sand accumulation by its interruption with the longshore current. The shoreline has become more stable near the Puducherry secretariat, showing significant beach development after implementing the submerged reef (Figure 4G). The analysis showed the resilience of the beach along the northern part of this coastal stretch and the subsequent stabilization of the coastline by nourishment (Figure 4H). However, nourishment represents a short-term remedy for shoreline development, characterized by a finite lifespan (Staudt et al., 2021). The pattern of accretion and erosion observed in the seasonal shoreline change analysis successfully captures the monthly trends of sediment movement. The maximum beach width occurs during the southwest monsoon season, and the minimum beach width occurs during the northeast monsoon at the location of the submerged reef. This shows the increased sediment availability during the southwest monsoon season and the reversal of current directions.
5 Conclusion
The present study investigated the short-term spatio-temporal evolution of Puducherry’s shoreline from the period of beach absent state to the resilience of the beach. The study assesses the coastal impact of a beach restoration project by NIOT and the Puducherry government to curb shoreline erosion along the coast of Puducherry, India. The statistics obtained by comparing the maps obtained from in-situ measurements and those from satellite datasets demonstrate the capabilities of this approach for faster shoreline monitoring studies. The High RMSE values for the extracted shoreline highlight the importance of automated shoreline extraction for multi-temporal coastal monitoring studies, where carrying out repeated field measurements is a limitation. This is also advantageous for post-monitoring inspection studies of implemented coastal mitigation projects where updated shoreline information is required at varying spatial and temporal scales. The analysis shows the development of a beach along the northern part of this coastal stretch and the subsequent stabilization of the coastline. Monthly shoreline data extracted from satellite images highlights the usage of water indices for multi-temporal beach monitoring studies. The results have also revealed the predictability of beach formation on a seasonal basis. Some of the limitations of this approach could be the resolution of the satellite image and the percentage of cloud cover in satellite images, which can affect data accuracy and availability. The outcome of this study provides essential information on the formation of Puducherry City’s new beach and its cyclic transformation in different seasons. Overall, this research enhances understanding of shoreline dynamics and the effectiveness of coastal restoration strategies, providing valuable information for informing coastal resilience planning efforts in Puducherry and similar coastal regions.
Data availability statement
The raw data supporting the conclusions of this article will be made available by the authors, without undue reservation.
Author contributions
JB: Conceptualization, Data curation, Formal analysis, Investigation, Methodology, Software, Validation, Visualization, Writing – original draft, Writing – review & editing. MV: Conceptualization, Formal analysis, Investigation, Project administration, Supervision, Validation, Visualization, Writing – review & editing. PK: Investigation, Project administration, Resources, Supervision, Validation, Visualization, Writing – review & editing. RJ: Formal analysis, Investigation, Methodology, Supervision, Validation, Visualization, Writing – review & editing.
Funding
The author(s) declare that no financial support was received for the research, authorship, and/or publication of this article.
Conflict of interest
The authors declare that the research was conducted in the absence of any commercial or financial relationships that could be construed as a potential conflict of interest.
Publisher’s note
All claims expressed in this article are solely those of the authors and do not necessarily represent those of their affiliated organizations, or those of the publisher, the editors and the reviewers. Any product that may be evaluated in this article, or claim that may be made by its manufacturer, is not guaranteed or endorsed by the publisher.
References
Abriani A. (2023). The role of coastal communities in increasing income through tourism businesses in takalar regency. J. La Bisecoman 4, 127–131. doi: 10.37899/JOURNALLABISECOMAN.V4I3.899
Aedla R., Dwarakish G. S., Venkat Reddy D. (2015). Automatic shoreline detection and change detection analysis of netravati-gurpurRivermouth using histogram equalization and adaptive thresholding techniques. Aquat. Proc. 4, 563–570. doi: 10.1016/j.aqpro.2015.02.073
Anandabaskaran V., Vijayakumar G. (2022). Short term and seasonal observation on shoreline changes from kanagachettikulam to veerampattinam of the puducherry coastal region using GPS technique. 117, 115–122. doi: 10.1007/978–3-031–05057-2_10
Angelini R., Angelats E., Luzi G., Ribas F., Masiero A., Mugnai F. (2023). “A REVIEW AND TEST OF SHORELINE EXTRACTION TECHNIQUES,” in The International Archives of the Photogrammetry, Remote Sensing and Spatial Information Sciences (ISPRS, c/o Leibniz University, Hannover Institute of Photogrammetry and GeoInformation, Nienburger, Str. 1 D-30167 Hannover, GERMANY: The International Archives of the Photogrammetry, Remote Sensing and Spatial Information Sciences), vol. XLVIII-1-W1–2023, 17–24. doi: 10.5194/ISPRS-ARCHIVES-XLVIII-1-W1–2023-17–2023
Bagaria P., Mitra D., Subrata N., Sivakumar K. (2021). Shifting shoreline of the estuarine landscape in the east godavari district of andhra pradesh, India. Environ. Earth Sci. 80, 1–20. doi: 10.1007/s12665–021-09790–5
Balaji R., Ramana Murthy M. V., Satheeshkumar J. (2019). Measurement of surf zone hydrodynamics along the coastline of pondicherry, India. Lecture Notes Civil Eng. 23, 25–34. doi: 10.1007/978–981-13–3134-3_3
Bergsma E. W. J., Almar R. (2020). Coastal coverage of ESA’ Sentinel 2 mission. Adv. Space Res. 65, 2636–2445. doi: 10.1016/J.ASR.2020.03.001
Bharathi M. D., Sivaji Patra, Sundaramoorthy S., Madeswaran P., Sundaramanickam A. (2017). Elucidation of seasonal variations of physicochemical and biological parameters with statistical analysis methods in puducherry coastal waters. Mar. pollut. Bull. 122, 432–440. doi: 10.1016/j.marpolbul.2017.05.048
Boak E. H., Turner I. L. (2005). Shoreline definition and detection: A review. J. Coast. Res. 21(4, 688–703. doi: 10.2112/03–0071.1
Chenthamil Selvan S., Kankara R. S., Markose V. J., Rajan B., Prabhu K. (2016). Shoreline change and impacts of coastal protection structures on puducherry, SE coast of India. Natural Hazards 83, 293–3085. doi: 10.1007/s11069–016-2332-y
Cui BL, Li X. Y. (2011). Coastline change of the yellow river estuary and its response to the sediment and runoff, (1976–2005). Geomorphology 127, 32–40. doi: 10.1016/J.GEOMORPH.2010.12.001
Dean R. G. (1986). COASTAL ARMORING: EFFECTS, PRINCIPLES AND MITIGATION. Coast. Eng. Proc. 1, 135. doi: 10.9753/icce.v20.135
Dhanya S., Mohan R., Mullai Vendhan K., Ramana Murthy M. V., Sajeev R. (2020). Assessment of performance of a groin constructed on puducherry coast - A case study. J. Coast. Res. 89, 84–91. doi: 10.2112/SI89–015.1
Drusch M., Del Bello U., Carlier S., Colin O., Fernandez V., Gascon F., et al. (2012). Sentinel-2: ESA’s optical high-resolution mission for GMES operational services. Remote Sens. Environ. 120, 25–36. doi: 10.1016/J.RSE.2011.11.026
El-Masry E. A. (2022). Hard engineering coastal structures; detrimental or beneficial: A case study of agami–sidi kerair coast, mediterranean sea, Egypt. Egyptian J. Aquat. Biol. Fisheries 26, 505–531. doi: 10.21608/EJABF.2022.221761
Esmail M., Mahmod W. E., Hassan F. (2019). Assessment and prediction of shoreline change using multi-temporal satellite images and statistics: case study of damietta coast, Egypt. Appl. Ocean Res. 82, 274–282. doi: 10.1016/J.APOR.2018.11.009
Ge X., Ding J., Teng D., Wang J., Huo T., Jin X., et al. (2022). Updated soil salinity with fine spatial resolution and high accuracy: the synergy of sentinel-2 MSI, environmental covariates and hybrid machine learning approaches. CATENA 212, 106054. doi: 10.1016/J.CATENA.2022.106054
Hall M. J., Pilkey O. H. (1991). Effects of hard stabilization on dry beach width for new Jersey. J. Coast. Res. 7, (3). doi: 10.2307/4297892
Hayden B., Dolan R., Felder W. (1978). Spatial and temporal analyses of shoreline variations. Coast. Eng. 2, 351–361. doi: 10.1016/0378–3839(78)90031–5
Himmelstoss E. A., Henderson R. E., Kratzmann M. G., Farris. A. S. (2018). Digital shoreline analysis system (DSAS) version 5.0 user guide. U.S. Geological Survey Open-File Rep. 2021–1091, 1–104. doi: 10.3133/ofr20211091
Hmelnov A. E., Gachenko A. S. (2021) Construction of Nearshore Elevation Model Using Open Satellite Data. Available online at: http://ceur-ws.org.
Hossen MdF., Sultana N. (2023). Shoreline Change detection using DSAS technique: case of Saint Martin island, Bangladesh. Remote Sens. Applications: Soc. Environ. 30, 100943. doi: 10.1016/J.RSASE.2023.100943
Hui S., Mengliang G., Gan Y., Xu M., Liu S., Yasir M., et al. (2022). Coastline extraction based on multi-scale segmentation and multi-level inheritance classification. Front. Mar. Sci. 9. doi: 10.3389/FMARS.2022.1031417/BIBTEX
Islam M. Z. (2024). Ocean wildlife and megafauna protection. Blue Book, 15–33. doi: 10.1007/978–3-031–48831-3_2
Jishuang Q., Chao W., Zhengzhi W. (2002). A multi-threshold based morphological approach for extracting coastal line feature in remote sensed images. FIEOS 2002 Conf. Proc. 1, 184–188.
Johnston W. G., Cooper J. A. G., Olynik J. (2023). Shoreline change on a tropical island beach, seven mile beach, grand cayman: the influence of beachrock and shore protection structures. Mar. Geology 457, 107006. doi: 10.1016/j.margeo.2023.107006
Kankara R. S., Ramana Murthy M. V., Rajeevan M. (1990) National Assessment of Shoreline Changes along Indian Coast Status Report For. Available online at: http://www.nccr.gov.in.
Kraus N. C., McDougal W. G. (1996). The effects of seawalls on the beach: part I, an updated literature review. J. Coast. Res 12, 691–701. doi: 10.2307/4298517
Kuleli T., Guneroglu A., Karsli F., Dihkan M. (2011). Automatic detection of shoreline change on coastal ramsar wetlands of Turkey. Ocean Eng. 38, 1141–1149. doi: 10.1016/j.oceaneng.2011.05.006
Lim C., Lee J., Lee J. L. (2021). Simulation of bay-shaped shorelines after the construction of large-scale structures by using a parabolic bay shape equation. J. Mar. Sci. Eng. 9, 43. doi: 10.3390/jmse9010043
Liu H., Jezek K. C. (2004). Automated extraction of coastline from satellite imagery by integrating canny edge detection and locally adaptive thresholding methods. Int. J. Remote Sens. 25, 937–958. doi: 10.1080/0143116031000139890
Liu Y., Wang X., Ling F., Xu S., Wang C. (2017). Analysis of coastline extraction from landsat-8 OLI imagery. Water (Switzerland) 9, 816. doi: 10.3390/w9110816
Loos E. A., Olaf Niemann K. (2002). Shoreline feature extraction from remotely-sensed imagery. Int. Geosci. Remote Sens. Symposium (IGARSS) 6, 3417–3419. doi: 10.1109/IGARSS.2002.1027201
Maiti S., Bhattacharya A. K. (2009). Shoreline change analysis and its application to prediction: A remote sensing and statistics based approach. Mar. Geology 257, 11–23. doi: 10.1016/J.MARGEO.2008.10.006
Mandanici E., Bitelli G. (2016). Preliminary comparison of sentinel-2 and landsat 8 imagery for a combined use. Remote Sens. 8, 10145. doi: 10.3390/RS8121014
Martinis S., Groth S., Wieland M., Knopp L., Rättich M. (2022). Towards a global seasonal and permanent reference water product from sentinel-1/2 data for improved flood mapping. Remote Sens. Environ. 278, 113077. doi: 10.1016/j.rse.2022.113077
Matin N., Jahid Hasan G. M. (2021). A quantitative analysis of shoreline changes along the coast of Bangladesh using remote sensing and GIS techniques. CATENA 201, 105185. doi: 10.1016/J.CATENA.2021.105185
McFeeters S. K. (1996). The use of the normalized difference water index (NDWI) in the delineation of open water features. Int. J. Remote Sens. 17, 1425–1432. doi: 10.1080/01431169608948714
Mishra M., Sudarsan D., Kar D., Naik A. K., Das P. P., Santos C. A. G., et al. (2020). The development and research trend of using dsas tool for shoreline change analysis: A scientometric analysis. J. Urban Environ. Eng. 14. doi: 10.4090/juee.2020.v14n1.069077
Misra A., Ramakrishnan B. (2020). Assessment of coastal geomorphological changes using multi-temporal satellite-derived bathymetry. Continental Shelf Res. 207, 104213. doi: 10.1016/j.csr.2020.104213
Mora M. R., Almendros G. N., García Sanabria J., de Frutos I. C. (2021). Use of sentinel-2A/B satellites and google earth engine for monitoring estuarine systems: A study case in the western mediterranean. In EGU General Assembly Conference Abstracts, EGU21–15400. doi: 10.5194/EGUSPHERE-EGU21–15400
Morton R. A., Miller T., Moore L. (2005). Historical shoreline changes along the US gulf of Mexico: A summary of recent shoreline comparisons and analyses. J. Coast. Res. 21, 704–709. doi: 10.2112/04–0230.1
Otsu N. (1979). THRESHOLD SELECTION METHOD FROM GRAY-LEVEL HISTOGRAMS. IEEE Trans. Syst. Man Cybern SMC-9, 62–66. doi: 10.1109/TSMC.1979.4310076
Ozturk D., Ahmet Sesli F. (2015). Shoreline change analysis of the kizilirmak lagoon series. Ocean Coast. Manage. 118, 290–308. doi: 10.1016/j.ocecoaman.2015.03.009
Palanques A., Guillén J. (1998). Coastal changes in the ebro delta: natural and human factors. J. Coast. Conserv. 4, 17–265. doi: 10.1007/BF02806485/METRICS
Pajak M. J., Leatherman S. (2002). The high water line as shoreline indicator. Article J. Coast. Res 18, 329–337. doi: 10.2307/4299078
Pardo-Pascual J. E., Sánchez-García E., Almonacid-Caballer J., Palomar-Vázquez J. M., de los Santos E. P., et al. (2018). Assessing the Accuracy of Automatically Extracted Shorelines on Microtidal Beaches from Landsat 7, Landsat 8 and Sentinel-2 Imagery. Remote Sens. 10 (2), 326. doi: 10.3390/RS10020326
Pucino N., Kennedy D. M., Young M., Ierodiaconou D. (2022). Assessing the accuracy of sentinel-2 instantaneous subpixel shorelines using synchronous UAV ground truth surveys. Remote Sens. Environ. 282, 113293. doi: 10.1016/j.rse.2022.113293
Quang D. N., Ngan V. H., Tam HS, Viet N. T., Tinh N. X., Tanaka. H. (2021). Long-term shoreline evolution using DSAS technique: A case study of quang nam province, Vietnam. J. Mar. Sci. Eng. 9, 11245. doi: 10.3390/JMSE9101124
Raju Alluri S. K., Ramana V.M., Sannasi Raj S. A. (2022). Numerical investigation of wave interaction and breaking near a wedge shape submerged reef. Oceans Conf. Rec. (IEEE). 1–3. doi: 10.1109/OCEANSCHENNAI45887.2022.9775406
Ramana Murthy M. V., Ravichandran V., Vendhan M., Kiran A. S., Kiran Raju S., Kumar Avula A., et al. (2020). Shore protection measures along Indian coast-design to implementation based on two case studies. 118, 118. doi: 10.18520/cs/v118/i11/1768-1773
Ramasamy S. M., Joyce E. B., Bishop I. D. (2005) Tectonically Induced Environmental Problems on and off Pondicherry Coast, Tamil Nadu, India-a Vision through Remote Sensing Project ‘TSUNATA’ Tsunami Disaster Assessment and Mitigation Strategies for Nagapattinam District, Tamil Nadu View Project Volcanoes of Western Victoria View Project. Available online at: https://www.researchgate.net/publication/228978552.
Rokni K., Ahmad A., Selamat A., Hazini S. (2014). Water feature extraction and change detection using multitemporal landsat imagery. Remote Sens. 6, 4173–4189. doi: 10.3390/rs6054173
Ryu J. H., Sun Won J. (2002). Application of neural networks to waterline extraction in tidal flat from optic satellite images. Int. Geosci. Remote Sens. Symposium (IGARSS) 4, 2026–2028. doi: 10.1109/IGARSS.2002.1026434
Sabah N., Sil A., Vijayakumar G. (2022). A season-wise geotechnical and morphological study of alteration in coastal profile along the shores of puducherry, India. Lecture Notes Civil Eng. 195, 445–454. doi: 10.1007/978–981-16–6456-4_46/COVER
Shanmugam D., Krishnamurthy R. R., Sivakumar K., Nethaji S. (2014). An integrated study on the impact of anthropogenic influenced coastal erosion in puducherry and villupuram coasts, bay of bengal, south India. EnviroGeoChemica Acta. 1, 437–445.
Smith K. E. L., Terrano J. F., Pitchford J. L., Archer M. J. (2021). Coastal wetland shoreline change monitoring: A comparison of shorelines from high-resolution worldView satellite imagery, aerial imagery, and field surveys. Remote Sens. 13, 30305. doi: 10.3390/RS13153030
Spoto F., Sy O., Laberinti P., Martimort P., Fernandez V., Colin O., et al. (2012). Overview of sentinel-2. Int. Geosci. Remote Sens. Symposium (IGARSS), 1707–1710. doi: 10.1109/IGARSS.2012.6351195
Staudt F., Gijsman R., Ganal C., Mielck F., Wolbring J., Hass H.C., et al. (2021). The sustainability of beach nourishments: A review of nourishment and environmental monitoring practice. J. Coast. Conserv. 25, 1–24. doi: 10.1007/S11852–021-00801-Y/TABLES/3
Sundar V., Sannasiraj S. A., Murali K., Singaravelu V. (2022). Impact of coastal structure on shorelines along the southeast and southwest coasts of India. ISH J. Hydraulic Eng 29, 592–610. doi: 10.1080/09715010.2022.2115319
Sunder S., Ramsankaran R., Ramakrishnan B. (2017). Inter-comparison of remote sensing sensing-based shoreline mapping techniques at different coastal stretches of India. Environ. Monit. Assess. 189, 1–13. doi: 10.1007/S10661–017-5996–1/FIGURES/7
Thieler E.R., Himmelstoss E. A., Zichichi J. L., Ergul A. (2009). The digital shoreline analysis system (DSAS) version 4.0 - an arcGIS extension for calculating shoreline change. Open-File Rep. doi: 10.3133/OFR20081278
Toure S., Diop O., Kpalma K., Maiga A. S. (2019). Shoreline detection using optical remote sensing: A review. ISPRS Int. J. Geo-Information 8 (2), 75. doi: 10.3390/IJGI8020075
Twumasi Y. A., Merem E. C., Ayala-Silva T. (2016). Coupling GIS and remote sensing techniques for coastal zone disaster management: the case of southern mississippi. Geoenvironmental Disasters 3, 1–9. doi: 10.1186/S40677–016-0056–7/FIGURES/6
Vicens-Miquel M., Medrano F.A., Tissot P. E., Kamangir H., Starek M. J., Colburn K. (2022). A deep learning based method to delineate the wet/dry shoreline and compute its elevation using high-resolution UAS imagery. Remote Sens. 14, 5990. doi: 10.3390/RS14235990
Wu P., Shen H., Zhang L., Göttsche F. M. (2015). Integrated fusion of multi-scale polar-orbiting and geostationary satellite observations for the mapping of high spatial and temporal resolution land surface temperature. Remote Sens. Environ. 156, 169–181. doi: 10.1016/j.rse.2014.09.013
Yamano H., Shimazaki H., Matsunaga T., Ishoda A., McClennen C., Yokoki H., et al. (2006). Evaluation of various satellite sensors for waterline extraction in a coral reef environment: majuro atoll, Marshall Islands. Geomorphology 82, 398–411. doi: 10.1016/J.GEOMORPH.2006.06.003
Yiğit A. Y., Kaya Y., Şenol. H. İ. (2022). Monitoring the change of Turkey’s tourism city antalya’s konyaaltı Shoreline with multi-source satellite and meteorological data. Appl. Geomatics 14, 223–236. doi: 10.1007/s12518–022-00431–5
Zambrano-Medina Y. G., Plata-Rocha W., Monjardin-Armenta S. A., Franco-Ochoa C (2023). Assessment and forecast of shoreline change using geo-spatial techniques in the gulf of california. Land 12, 782. doi: 10.3390/LAND12040782
Keywords: shoreline change, DSAS, beach restoration, seasonal analysis, coastal zone management
Citation: Benhur J, Vendhan M, Kumar P and Janagiraman R (2024) Coastal resilience and shoreline dynamics: assessing the impact of a hybrid beach restoration strategy in Puducherry, India. Front. Mar. Sci. 11:1426627. doi: 10.3389/fmars.2024.1426627
Received: 01 May 2024; Accepted: 30 May 2024;
Published: 12 June 2024.
Edited by:
Meilin Wu, Chinese Academy of Sciences (CAS), ChinaReviewed by:
Saravanavel J, Bharathidasan University, IndiaMuthamilselvan A, Bharathidasan University, India
Copyright © 2024 Benhur, Vendhan, Kumar and Janagiraman. This is an open-access article distributed under the terms of the Creative Commons Attribution License (CC BY). The use, distribution or reproduction in other forums is permitted, provided the original author(s) and the copyright owner(s) are credited and that the original publication in this journal is cited, in accordance with accepted academic practice. No use, distribution or reproduction is permitted which does not comply with these terms.
*Correspondence: Judha Benhur, YmVuaHVyNzcuOTdAZ21haWwuY29t