 Jieying Na1,2
 Yadong Zhou2,3
 Hong Cheng2
 Ruiyan Zhang2
 Chengcheng Shen2Bo Lu2
 Chunsheng Wang1,2,3*
 Dongsheng Zhang1,2,3*
- 1School of Oceanography, Shanghai Jiao Tong University, Shanghai, China
- 2Key Laboratory of Marine Ecosystem Dynamics, Second Institute of Oceanography, Ministry of Natural Resources (MNR), Hangzhou, China
- 3Southern Marine Science and Engineering Guangdong Laboratory (Zhuhai), Zhuhai, China
Ophiuroids, the most diverse group of echinoderms, inhabit a vast array of ecological niches and play vital roles in benthic ecosystems as suspension feeders, scavengers and opportunists. Despite the important ecological roles played by Ophiuroidea, their evolutionary history and phylogenetic relationship is not yet fully understood. In this study, 47 mitochondrial genomes of ophiuroids, including 21 newly sequenced ones, were analyzed. tRNA duplication was firstly discovered in four species and a new start codon was identified for Ophiuroidea. Eighteen phylogenetic trees based on mitochondrial genomes consistently supported two major lineages, Ophintegrida and Euryophiurida. It further confirmed the monophyly of Euryalida and Ophiurida, respectively, as well as families represented by multiple species. Among 18 trees, only the two ML trees based on amino acid sequences using IQtree method supported monophyly of Amphilepidida and Ophiacanthida, consistent with current phylogenetic system of Ophiuroidea. This result highlighted the effect of phylogenetic analysis methods and datasets on tree topology, indicating that amino acid sequence data maybe more suitable for higher taxonomic level phylogenetic analysis of ophiuroids than nucleotide sequences. Four new gene orders of 13 protein-coding genes + two rRNAs and 12 new gene orders of all 37 genes were identified. Mitochondrial gene orders were highly variable in Ophiacanthida, but were extremely conserved in Eurylida. Additionally, both branch lengths and estimated positive selection varied among the four orders, and a positive relationship between branch lengths and mitochondrial gene rearrangement rates was revealed, suggesting distinctly different evolutionary history among the four major clades of Ophiuroidea. Overall, we (1) reconstructed the phylogenetic relationship based on mitochondrial genome, supporting the current phylogenetic system in Ophiuroidea, (2) revealed a high variability in mitochondrial gene rearrangement among the four orders, (3) provided the first evidence to link gene rearrangement and nucleotide substitution in Echinodermata.
1 Introduction
Ophiuroids, comprising the most diverse group within the phylum Echinodermata, inhabit a vast array of ecological niches, ranging from the equatorial to the polar regions, from coastal waters to hadal trenches (O’Hara et al., 2011; Stöhr et al., 2012; Okanishi, 2016; Zhang et al., 2021), playing pivotal roles in marine ecosystems, as suspension feeders (Emson et al., 1991), scavengers, and opportunists (Fratt and Dearborn, 1984). Despite their evolutionary and ecological importance, phylogeny and internal taxonomy have received relatively limited attention and are contentious. Matsumoto (1917) initially classified Ophiuroidea into two subclasses: Oegophiurida and Phrynophiurida, which was sequentially complemented with a series of comprehensive key by Fell (1960). The initial cladistics analysis was performed by Smith et al. (1995) using both morphological and molecular data, leading to the identification of two major groups: Ophiurida and Euryalida. However, O’Hara et al. (2014) challenged this classification by reconstructing a class-wide phylogeny using a transcriptome-based dataset and morphological characteristics, suggesting that Ophiurida as then conceived is paraphyletic, with Ophiuridae closely related to euryalids. This finding was supported by other morphology-based phylogenetic studies (Thuy and Stöhr, 2016). More recently, a comprehensive phylogenetic revision at the family level divided Ophiuroidea into two major clades, Ophintegrida (comprising four orders: Amphilepidida, Ophioleucida, Ophiacanthida, and Ophioscolecida) and Euryophiurida (comprising two orders: Ophiurida and Euryalida) (O’Hara et al., 2017, 2018). Nevertheless, uncertainties persist concerning the phylogenetic relationships within orders or lower taxonomic levels, such as three families within Euryalida (Okanishi and Fujita, 2013), Ophiodermatidae, Ophiolepididae (O’Hara et al., 2014), Ophiactidae (Bribiesca-Contreras et al., 2017), and Ophiuridae (Sun et al., 2023).
The mitochondrial genome has proven to be a powerful tool for resolving phylogenetic relationships across a wide range of metazoans due to its small genome size, maternal inheritance, rare recombination, and rapid evolutionary rate (Miya et al., 2001; Osigus et al., 2013; Li et al., 2015; Mikkelsen et al., 2018). However, until recently, less than 30 ophiuroids had been sequenced for complete mitochondrial genomes among over 2,000 extant species, and only a few studies used mitochondrial genome information for phylogenetic analysis of Ophiuroidea (Perseke et al., 2010; Galaska et al., 2019; Lee et al., 2019; O’Hara et al., 2019; Sun et al., 2023). Phylogenetic relationships within Ophiuroidea inferred from these studies were variable (Figure 1), which may be attributed to the datasets and methods used for phylogenetic analysis. For example, Ophiacanthida and Amphilepidida were monophyletic in a tree based on amino acid sequences (Lee et al., 2019), but were paraphyletic from a tree using necleotide sequences (Lee et al., 2019; Sun et al., 2023). Lee et al. (2019) suggested that translated amino acid sequences of mitochondrial protein-coding genes (PCGs) maybe more informative than nucleotide sequences for phylogenetic analysis. Additionally, within Gorgonocephalidae, Gorgonocephalus chilensis was clustered with Astrospartus by Galaska et al. (2019), but was suggested as a sister clade to Astrotoma + Astrohamma (Sun et al., 2023). The phylogenetic position of Ophionotus victoriae was also uncertain, clustered within Ophiuridae or Ophiopyrgidae in different studies (Galaska et al., 2019; Sun et al., 2023). These uncertains may also be attributed to the insufficient sampling.
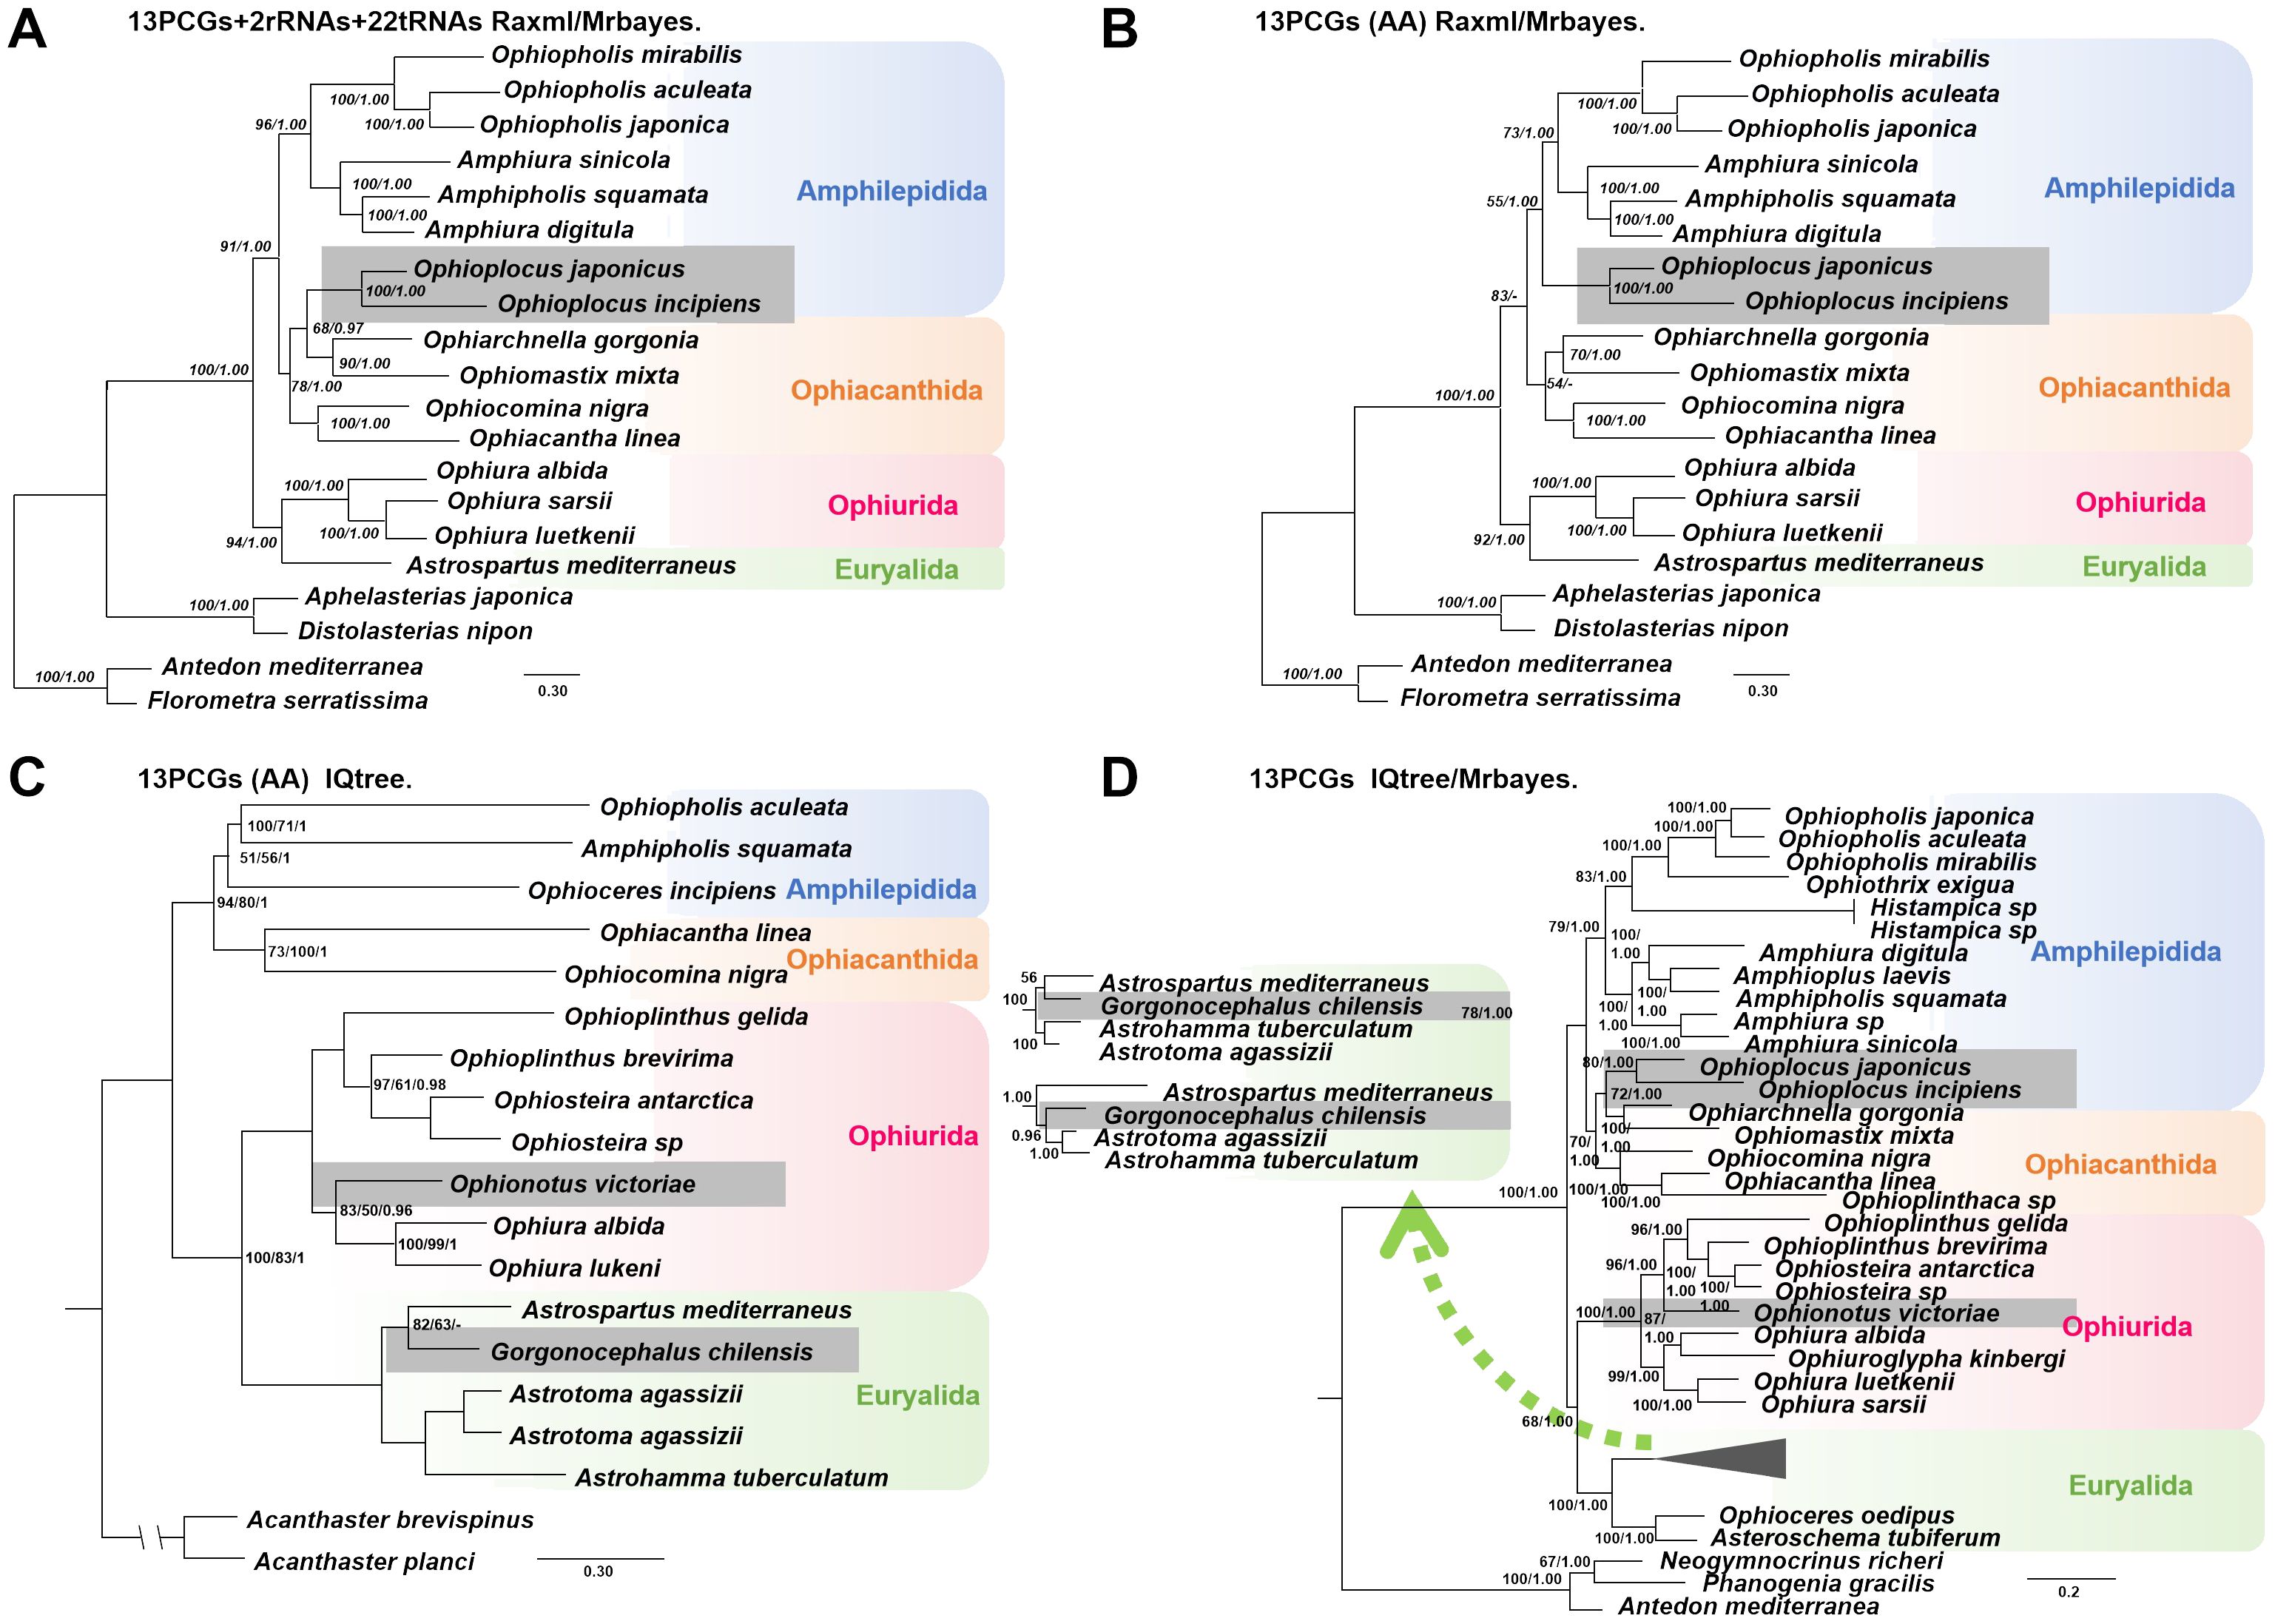
Figure 1. Summary of mitochondrial genome-based phylogenetic trees for Ophiuroidea across different studies. (A, B) Cladogram from Lee et al. (2019). (C) Cladogram from Galaska et al. (2018). (D) Cladogram from Sun et al. (2023). Species highlighted with grey rectangular shadows represent areas of topological conflict among the studies.
Mitochondrial gene rearrangements caused by inversions, transpositions, reverse transpositions, and tandem-duplication/random-loss (TDRL) are a common occurrence in metazoans (Bernt et al., 2013a). A significant correlation between gene rearrangement rates and nucleotide substitution rates has been indicated in previous studies (Shao et al., 2003; Xu et al., 2006; Fourdrilis et al., 2018). A high degree of gene rearrangement, often considered a sign of accelerated molecular evolution in mitochondrial DNA (Zhuang and Cheng, 2010; Tan et al., 2018), is frequently associated with adaptations to extreme ecological niches and lifestyles (Cameron, 2014; Nakajima et al., 2016). The gene orders of 13 PCGs and two rRNAs of Ophiuroidea were highly conserved, while the presence of tRNA led to more frequent mitochondrial gene rearrangement events (Galaska et al., 2019). Within the major clades, mitochondrial gene order exhibits a high degree of conservation in Euryalida, with only slight variation in the other three orders (Lee et al., 2019). Nonetheless, novel mitochondrial gene orders have come to light with additional species being sequenced (Li et al., 2021a; Sun et al., 2023). Among the five echinoderm classes, Ophiuroidea appears to have undergone more extensive mitochondrial genome rearrangements (Scouras et al., 2004), suggesting a higher evolutionary rate in Ophiuroidea than other echinoderm lineages (Perseke et al., 2010). Extensive mitochondrial gene order rearrangements have also been unveiled in some other metazoans, even at the family or genus level (Sun et al., 2020; Malkócs et al., 2022), offering substantial evolutionary insights. Enhanced sampling efforts may furnish further evidence regarding the variability of mitochondrial gene rearrangements across phylogenetic lineages.
In this study, 21 new complete mitochondrial genomes were obtained. Together with other mitochondrial genomes available in GenBank, a total of 47 mitochondrial genomes of Ophiuroidea representing 17 families were compiled for phylogenetic analyses. Our objectives were (1) to explore the characteristics of mitochondrial genomes and to assess the variability of mitochondrial gene orders across phylogenetic lineages, and (2) to infer the phylogenetic relationships within Ophiuroidea using mitochondrial genomes and to evaluate the effects of different types of data or methods on the construction of phylogenetic trees.
2 Materials and methods
2.1 Mitochondrial genome sequencing, assembly, and annotation
A total of 21 ophiuroid species were used for mitochondrial genome sequencing, these specimens were preserved in 90% ethanol (Table 1 lists sampling details). The DNeasy Blood & Tissue Kit (QIAG EN) was used to extract genomic DNA following the manufacturer’s protocol. For Ophiomusium sp., L-PCR methods were employed. COX1 and 16S rRNA were amplified and sequenced with specific primers (Palumbi et al., 1991; O’Hara et al., 2014). Subsequently, L-PCR primers (Supplementary Table S1) based on COX1 and 16S rRNA templates were designed, and the complete mitochondrial genome was amplified in two overlapping fragments. The long segments from COX1 to 16S (COX1–16S or 16S–COX1) was sequenced through the Illumina HiSeq X-Ten platform (Illumina Inc., San Diego, CA, USA) using the next-generation sequencing method. Approximately 1 G of clean data of each partial sequence were de novo assembled with SPAdes 3.12 (Nurk et al., 2013). Any remaining gaps were filled using species-specific primers designed based on the obtained sequences.The other 20 species were directly sequenced through NGS, following Illumina’s standard genomic DNA library preparation procedure. Paired-end libraries with insert sizes of approximately 400 bp were prepared. The qualified Illumina paired-end library (2×150 bp) was used for Illumina NovaSeq 6000 sequencing (Shanghai BIOZERON Co., Ltd.). Raw paired-end reads underwent trimming and quality control with Trimmomatic v0.39 using the parameters (SLIDINGWINDOW:4:15 MINLEN:75) (Supplementary Table S2). Clean data obtained from these quality control processes were used for mitochondrial genome assembly using ABySS v 2.0. Any remaining gaps were filled using GapCloser (http://soap.genomics.org.cn/soapdenovo.html). The MITOS2 Web Server (http://mitos2.bioinf.uni-leipzig.de/index.py) was used to annotate mitochondrial genomes. The boundaries of PCGs and rRNAs were further manually determined through alignment with the published sequence data. The newly sequenced mitochondrial genomes have been submitted to GenBank, the accession number was shown in Supplementary Table S3. MEGA 7 was used to calculate nucleotide composition (Kumar et al., 2016) using four datasets: the full genome, 13 concatenated PCGs, two concatenated rRNAs, and 22 concatenated tRNAs. The formulae of Perna and Kocher (1995) were used to calculate GC-skew and AT-skew.
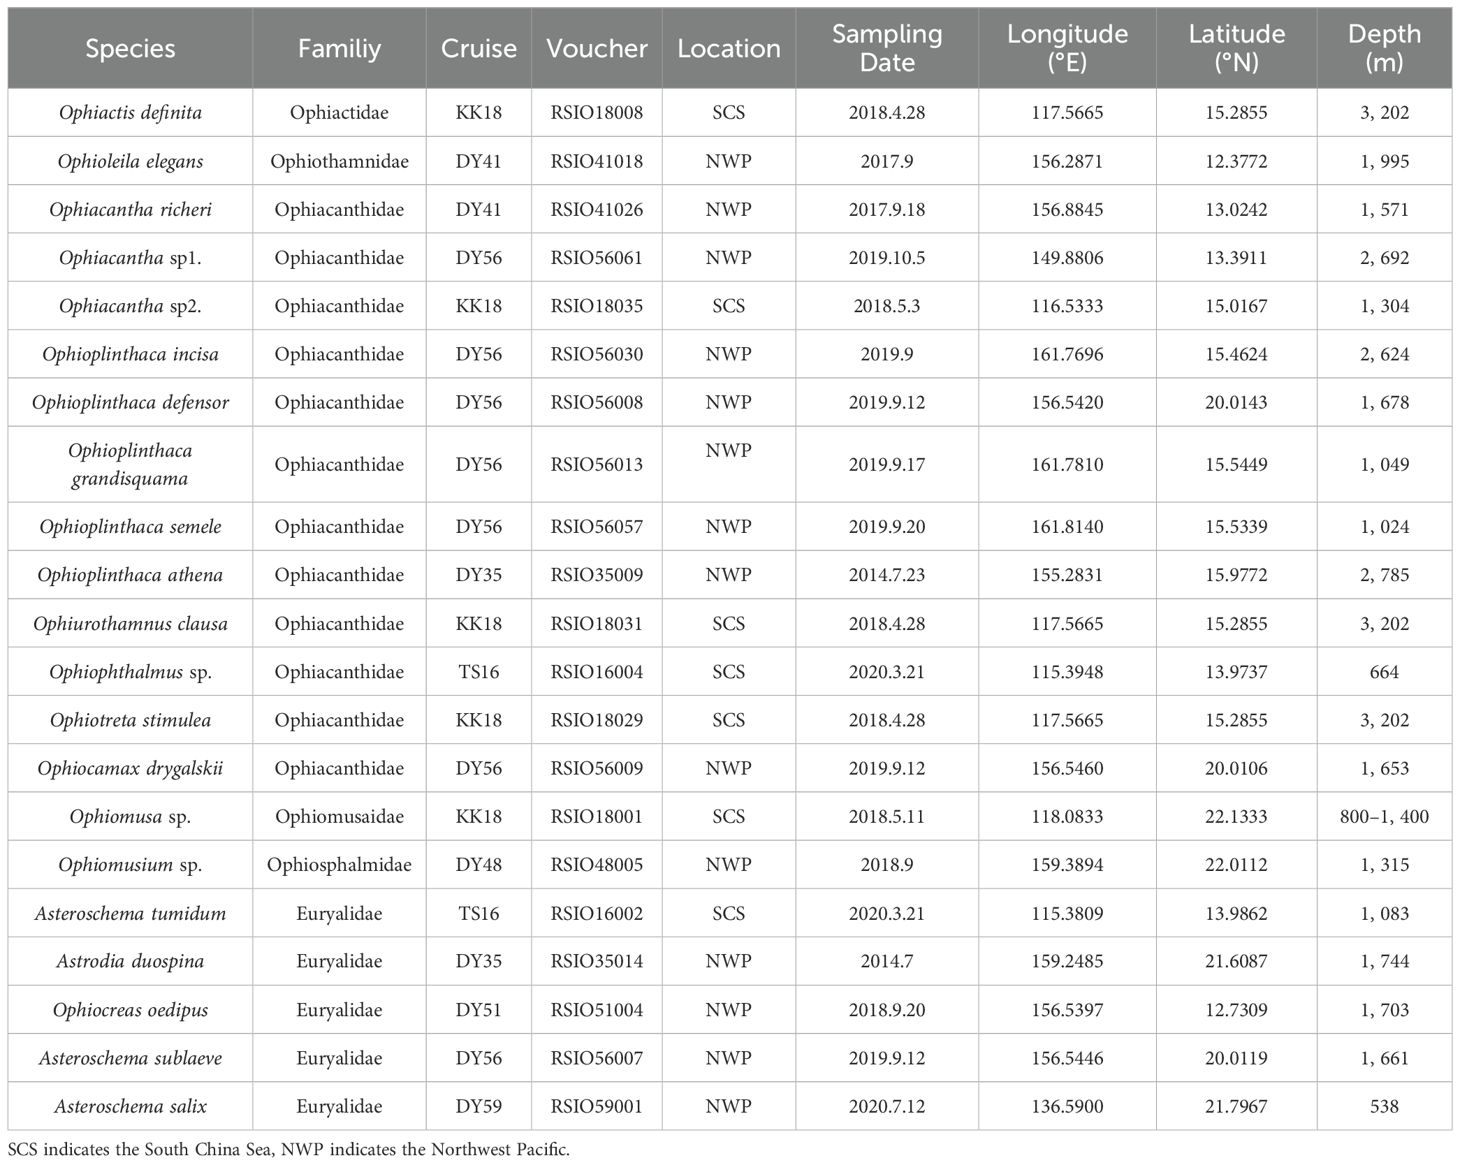
Table 1. Sampling information of the newly sequenced species in this study.
2.2 Phylogenetic analysis
A total of 47 mitochondrial genomes (21 newly sequenced and 26 downloaded from Genbank) were used for phylogenetic analysis, with two mitochondrial genomes of asteroids as outgroups. The MUSCLE algorithm was used to separately align nucleotide sequences of 13 PCGs (Edgar, 2004), while the MAFFT algorithm was used to separately align two rRNAs and 22 tRNAs (Katoh and Standley, 2013). Amino acid sequences of 13 PCGs were also aligned following the same method as for nucleotides. To remove ambiguously aligned regions, the Gblocks Server (http://molevol.cmima.csic.es/castresana/Gblocks_server.html) was used to trim nucleotide and amino acid sequence alignments, with settings allowing smaller final blocks, gap positions within the final blocks, and less strict flanking positions but not permitting many contiguous non-conserved positions.
The following six separate data matrices were generated to assess the effect of datasets on the phylogenetic analysis: 1) a concatenated nucleotide sequence alignment of 13 PCGs, two rRNAs, and 22 tRNAs with the Gblocks (n_Prt G); 2) a concatenated nucleotide sequence alignment of 13 PCGs, two rRNAs, and 22 tRNAs without the Gblocks (n_Prt); 3) a concatenated nucleotide sequence alignment of 13 PCGs and two rRNAs with the Gblocks (n_Pr G); 4) a concatenated nucleotide sequence alignment of 13 PCGs and two rRNAs without the Gblocks (n_Pr); 5) a concatenated amino acid sequence alignment of 13 PCGs with the Gblocks (aa_P G); and 6) concatenated amino acid sequence alignment of 13 PCGs without the Gblocks (aa_P). Maximum likelihood (ML) analysis was conducted in RAxMLGUI 1.5b2 (Silvestro and Michalak, 2012) with ML + thorough bootstrap (1,000 replicates) and the GTR + Γ + I model. The IQ-TREE web server (http://iqtree.cibiv.univie.ac.at/) was also used for ML analysis using the default settings, employing Bayesian information criterion to select the best models for each gene (Supplementary Table S4). MrBayes 3.2.7 was used to conduct Bayesian inference (BI) analysis (Ronquist and Huelsenbeck, 2003) under the GTR + Γ + I models, with 1,000,000 generations of Markov chain Monte Carlo and sampling every 1,000 generations, with the initial 25% generations being discarded as a burn-in. FigTree v1.4.3 was used to visualize tree files.
2.3 Gene rearrangement
The rearrangement of mitochondrial genes was analyzed through pairwise comparison using CREx (Bernt et al., 2007). To identify gene rearrangement events within the ophiuroid phylogenetic context established by ML trees based on amino acid sequences using IQ-TREE, recovered mitochondrial gene orders were compared with Tree REx 1.85 (Bernt et al., 2008). To assess the degree of gene rearrangement across lineages, the breakpoint distance values (BP values) were calculated following the method of Blanchette et al. (1999) to measure the number of gene rearrangements for each species concerning the ancestral gene order of Ophiuroidea inferred based on the TreeREx analysis.
2.4 Nucleotide substitution rate and positive selection
Branch lengths for alignments of 13 concatenated PCGs were calculated using the free-ratio model implemented in the PAML4.8 package to evaluate potential differences in evolutionary rates across the phylogenetic lineages (Yang, 2007).
To evaluate positive selection, maximum likelihood analysis on the concatenated nucleotide sequences dataset of 13 PCGs was performed using the branch model and the branch-site model of the CodeML program implemented in the PAML4.8 package. The branch model assessed whether the value of ω was homogenous among the four orders. The one-ratio model (model = 0) was used to estimate the distribution of ω values as a benchmark. The free-ratio model (model = 1) computed separate ω values for terminal branches to evaluate selective pressure. The two-ratio model (model = 2) assumed that the branches of interest had different ratios from the background ratio (Yang, 1998). The improved branch-site model (model = 2, NSsite = 2), allowing ω to vary both among sites in the protein and across branches on the tree (Zhang et al., 2005), was used to detect the positively selected sites on specific lineages compared with background lineages. To determine whether the positive-selection model (MA) or the corresponding null model (M1a) fit the data, likelihood ratio tests (LRTs) were conducted. The Bayes empirical Bayes method (Yang et al., 2005) was used to calculate posterior probabilities (>0.95) to identify these positively selected sites if the LRTs were significant.
3 Results
3.1 Characteristics of the new mitochondrial genomes
Characteristics of the 21 newly sequenced mitochondrial genomes were summarized in Supplemetary Table S5. The mitochondrial genome size ranged from 15,869 to 20,644 bp, encompassing 13 PCGs and two rRNA genes. Of the 21 new mitochondrial genomes, seventeen genomes possessed 22 tRNAs, while the remaining four exhibited a duplicated tRNA gene—specifically in Ophioplinthaca grandisquama (tRNA S1), Ophiomusa sp. (tRNA S1), Ophioplinthaca athena (tRNA M), and Astrodia duospina (tRNA Y). The start codons were dominated by ATG, with several alternatives such as GTG, ATT, and ATA. Among these, GTG was common in COX1, ND2, ND5, ND6, and CYTB, while ATT was frequent in CYTB and ND1, especially in the genus Ophioplinthaca. ATA, which was previously found in Holothuroidea and Echinoidea (Cantatore et al., 1989; Scouras et al., 2004), was firstly observed in Ophiuroidea. The genes primarily terminated with complete stop codons (TAG or TAA), but truncated stop codons (T and TA) were present in COX2, CYTB, ND4, ND4L, and ND6.
The A+T content, AT-skew, and GC-skew were highly variable within the 47 ophiuroid mitochondrial genomes. The A+T content of the whole genome, PCGs, rRNAs and tRNAs varied from 58.62% to 74.62%, from 58.30% to 74.66%, from 60.80% to 74.51% and from 59.57% to 74.44%, respectively (Supplementary Table S6). Among the four orders, Euryalida had the highest A+T content, followed by Ophiacanthida and Ophiurida, but the lowest observed in Amphilepidida. The GC-skew and AT-skew values also varied significantly, most species exhibited negative GC-skew and positive AT-skew values, however, a reverse skew pattern was obtained from eight Ophiacanthidae species (Figure 2 and Supplementary Table S6).
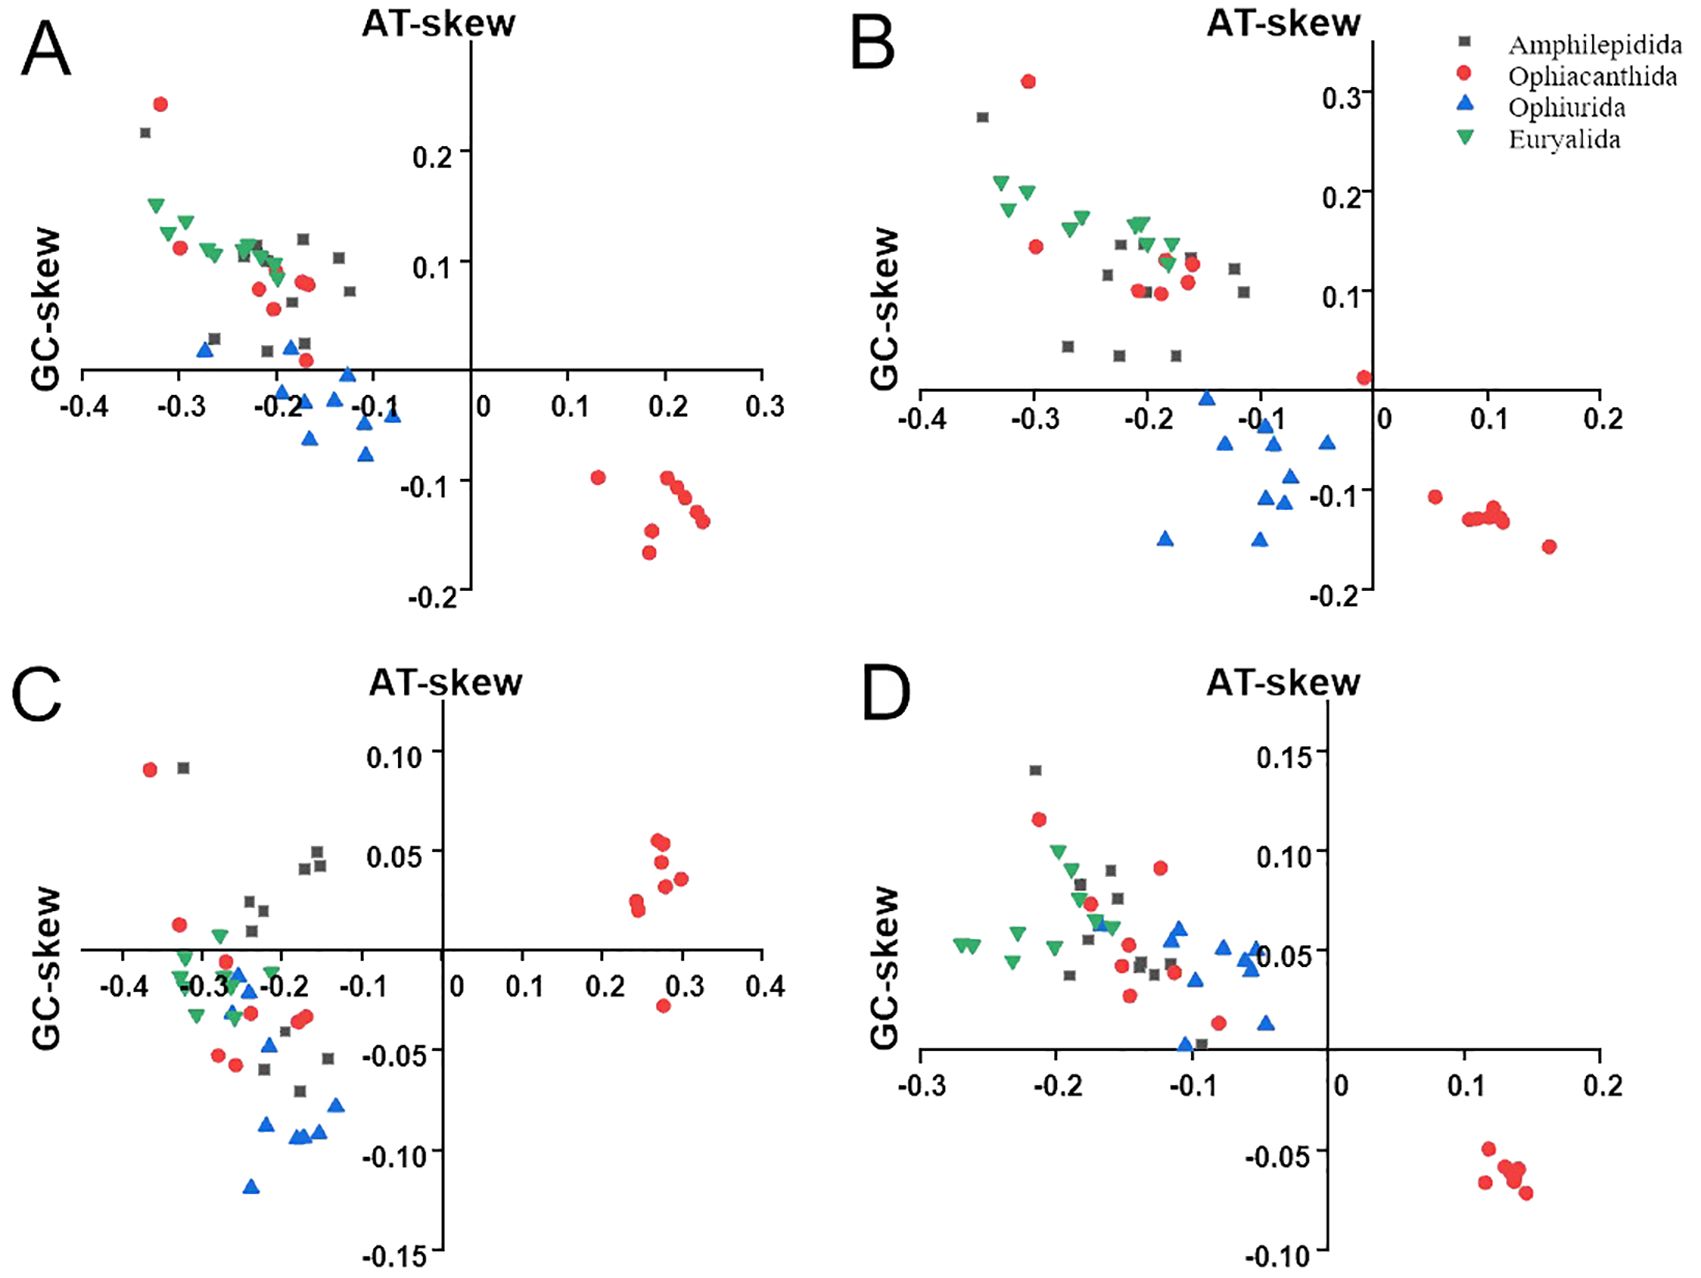
Figure 2. AT-skew and GC-skew values of Ophiuroidea. (A) The whole mitochondrial genomes, (B) 13 PCGs, (C) Two rRNAs, and (D) 22 tRNAs.
3.2 Phylogeny of Ophiuroidea based on mitochondrial genomes
In this study, we generated a total of 18 phylogenetic trees, which can be divided into nine different topologies. The highest congruence with the current Ophiuroidea phylogenetic system (O’Hara et al., 2017) was found in the two ML trees (topology 1) using IQ-TREE based on the aa_P G and aa_P datasets, supporting the monophyly of the four orders (Figure 3). Four topologies (topologies 2–5) were inferred from amino acid sequences using RAxML and MrBayes, in which Amphilepidida, Euryalida and Ophiurida were supported as monophyletic, but Ophiacanthida was a polyphyletic group with three species (Ophiomastix mixta, Ophiarachnella gorgonia, and Ophiocamax drygalskii) positioned at the base of Amphilepidida (Supplementary Figures S1-S4). Among the four topologies, Asteronychidae was positioned at the base of Euryalida in the ML tree based on aa_P (topology 3, Supplementary Figure S2), while in the other topologies it was inferred to be the sister clade of Gorgonocephalidae. The BI tree based on aa_P G (topology 5) didn’t support the two superorders of Ophintegrida and Euryophiurida, suggested that Euryalida was the sister clade of (Amphelipidida + Ophiacanthida) and positioned Ophiurida as the basal clade of the Ophiuroidea (Supplementary Figure S4).
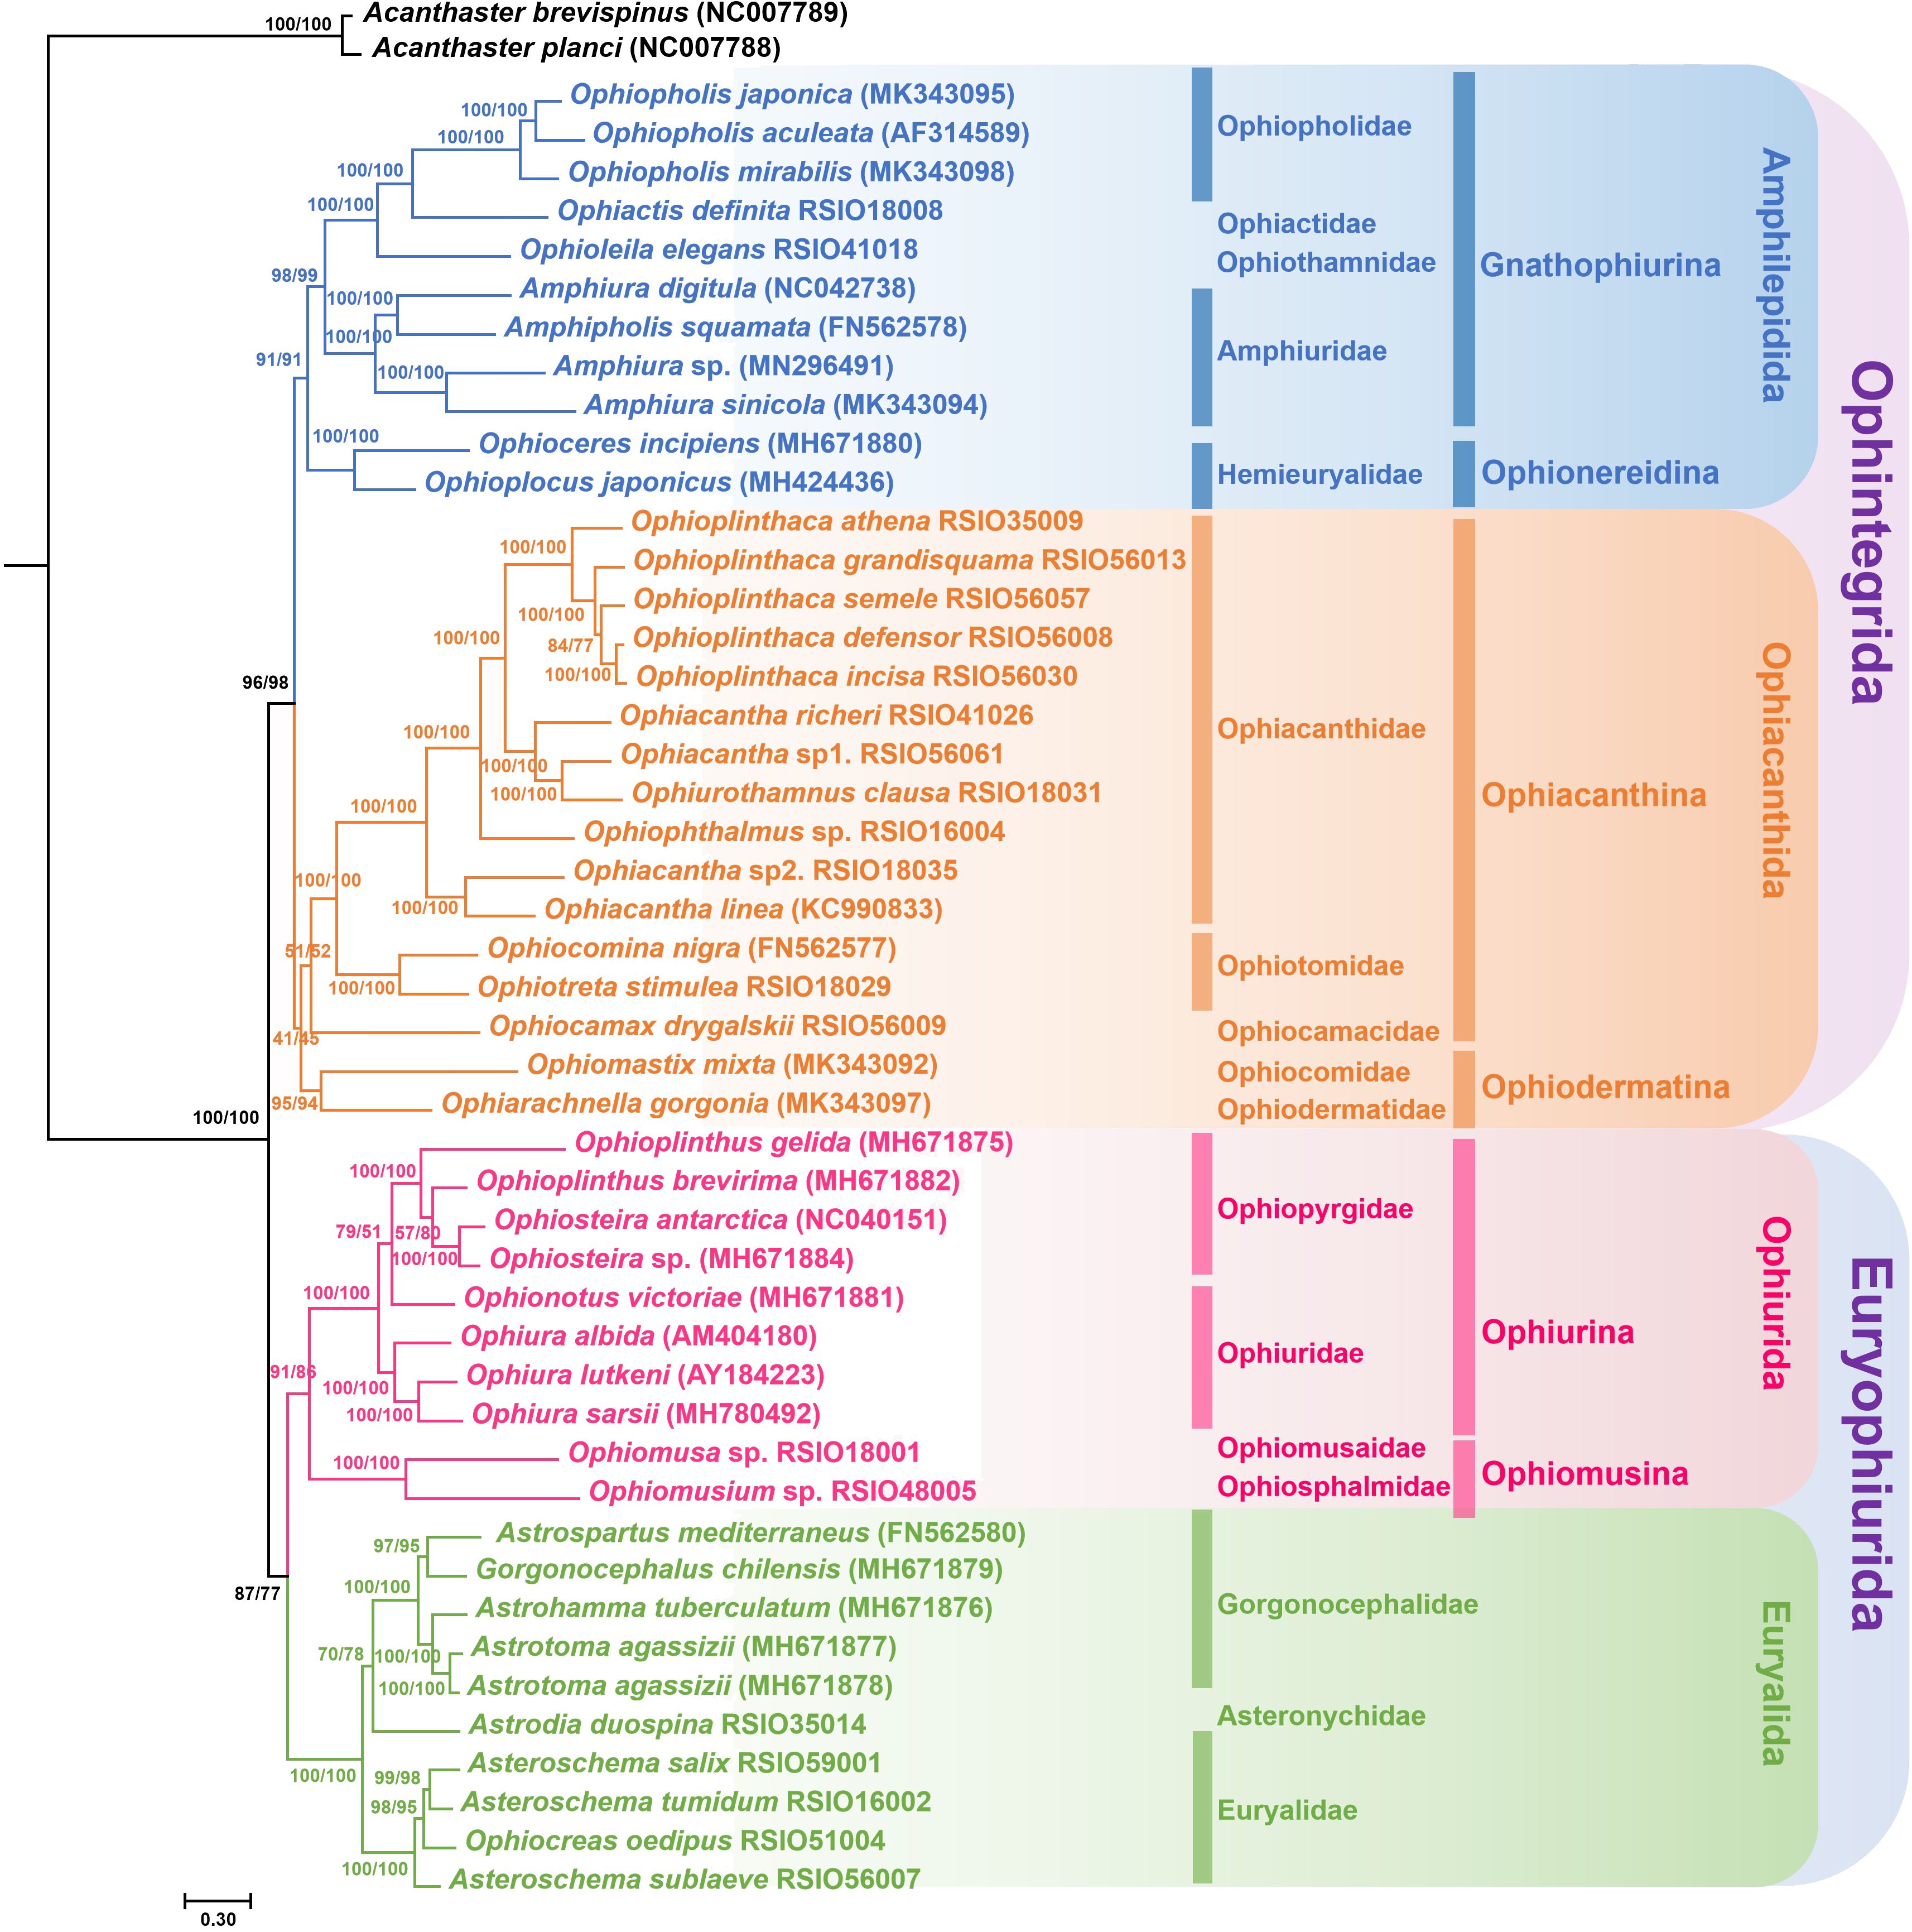
Figure 3. Maximum likelihood (ML) trees of Ophiuroidea inferred from the amino acid databases using IQ-TREE. Numbers on nodes are bootstrap values (left from database aa_P; right from database aa_P G).
There were two topologies (topologies 6 and 7) including seven ML trees generated from n_Prt, n_Prt G and n_Pr using RAxML and from n_Prt, n_Prt G, n_Pr and n_Pr G using IQ-TREE (Supplementary Figures S5, S6). These two topologies suggested Ophiacanthida as paraphyletic and two species of Amphilepidida were clustered with Ophiarachnella gorgonia and Ophiomastix mixta. The two topologies can be differed from each other by the position of Ophionotus victoriae. The remaining two topologies included a ML tree (topology 8) generated from n_Pr G using RAxML (Supplementary Figure S7) and 4 BI trees (topology 9) generated from n_Prt, n_Prt G, n_Pr and n_Pr G using MrBayes (Supplementary Figure S8). These trees suggested Ophiacanthida as monophyletic and clustered Hemieuryalidae with Ophiacanthida rather than Amphilepidida.
3.3 Mitochondrial gene rearrangement
Seven mitochondrial gene orders including 13 PCGs and 2 rRNAs (PCGs-rRNA gene roders, PR1–PR7) were identified, four of which were newly discovered in this study (Figure 4). Only one PR-gene order (PR1) was recovered from Euryalida, two were recovered from Amphilepidida (PR1 and PR2) and Ophiurida (PR2 and PR3). Six PR-gene orders (except PR3) including four new arrangements (PR4–PR7), were recovered from Ophiacanthida. The PR-gene order was conserved for most families or genera represented by multiple species. However, five PR-gene orders (PR1, PR4–PR7) were recovered from Ophiacanthidae, and three PR-gene orders (PR5–PR7) were recovered from Ophioplinthaca (Figure 4). Inversions and transpositions occurred multiple times within Ophiacanthidae, also occurring at the basal nodes of Ophiurina, Euryalida, and Hemieuryalidae (Figure 4).
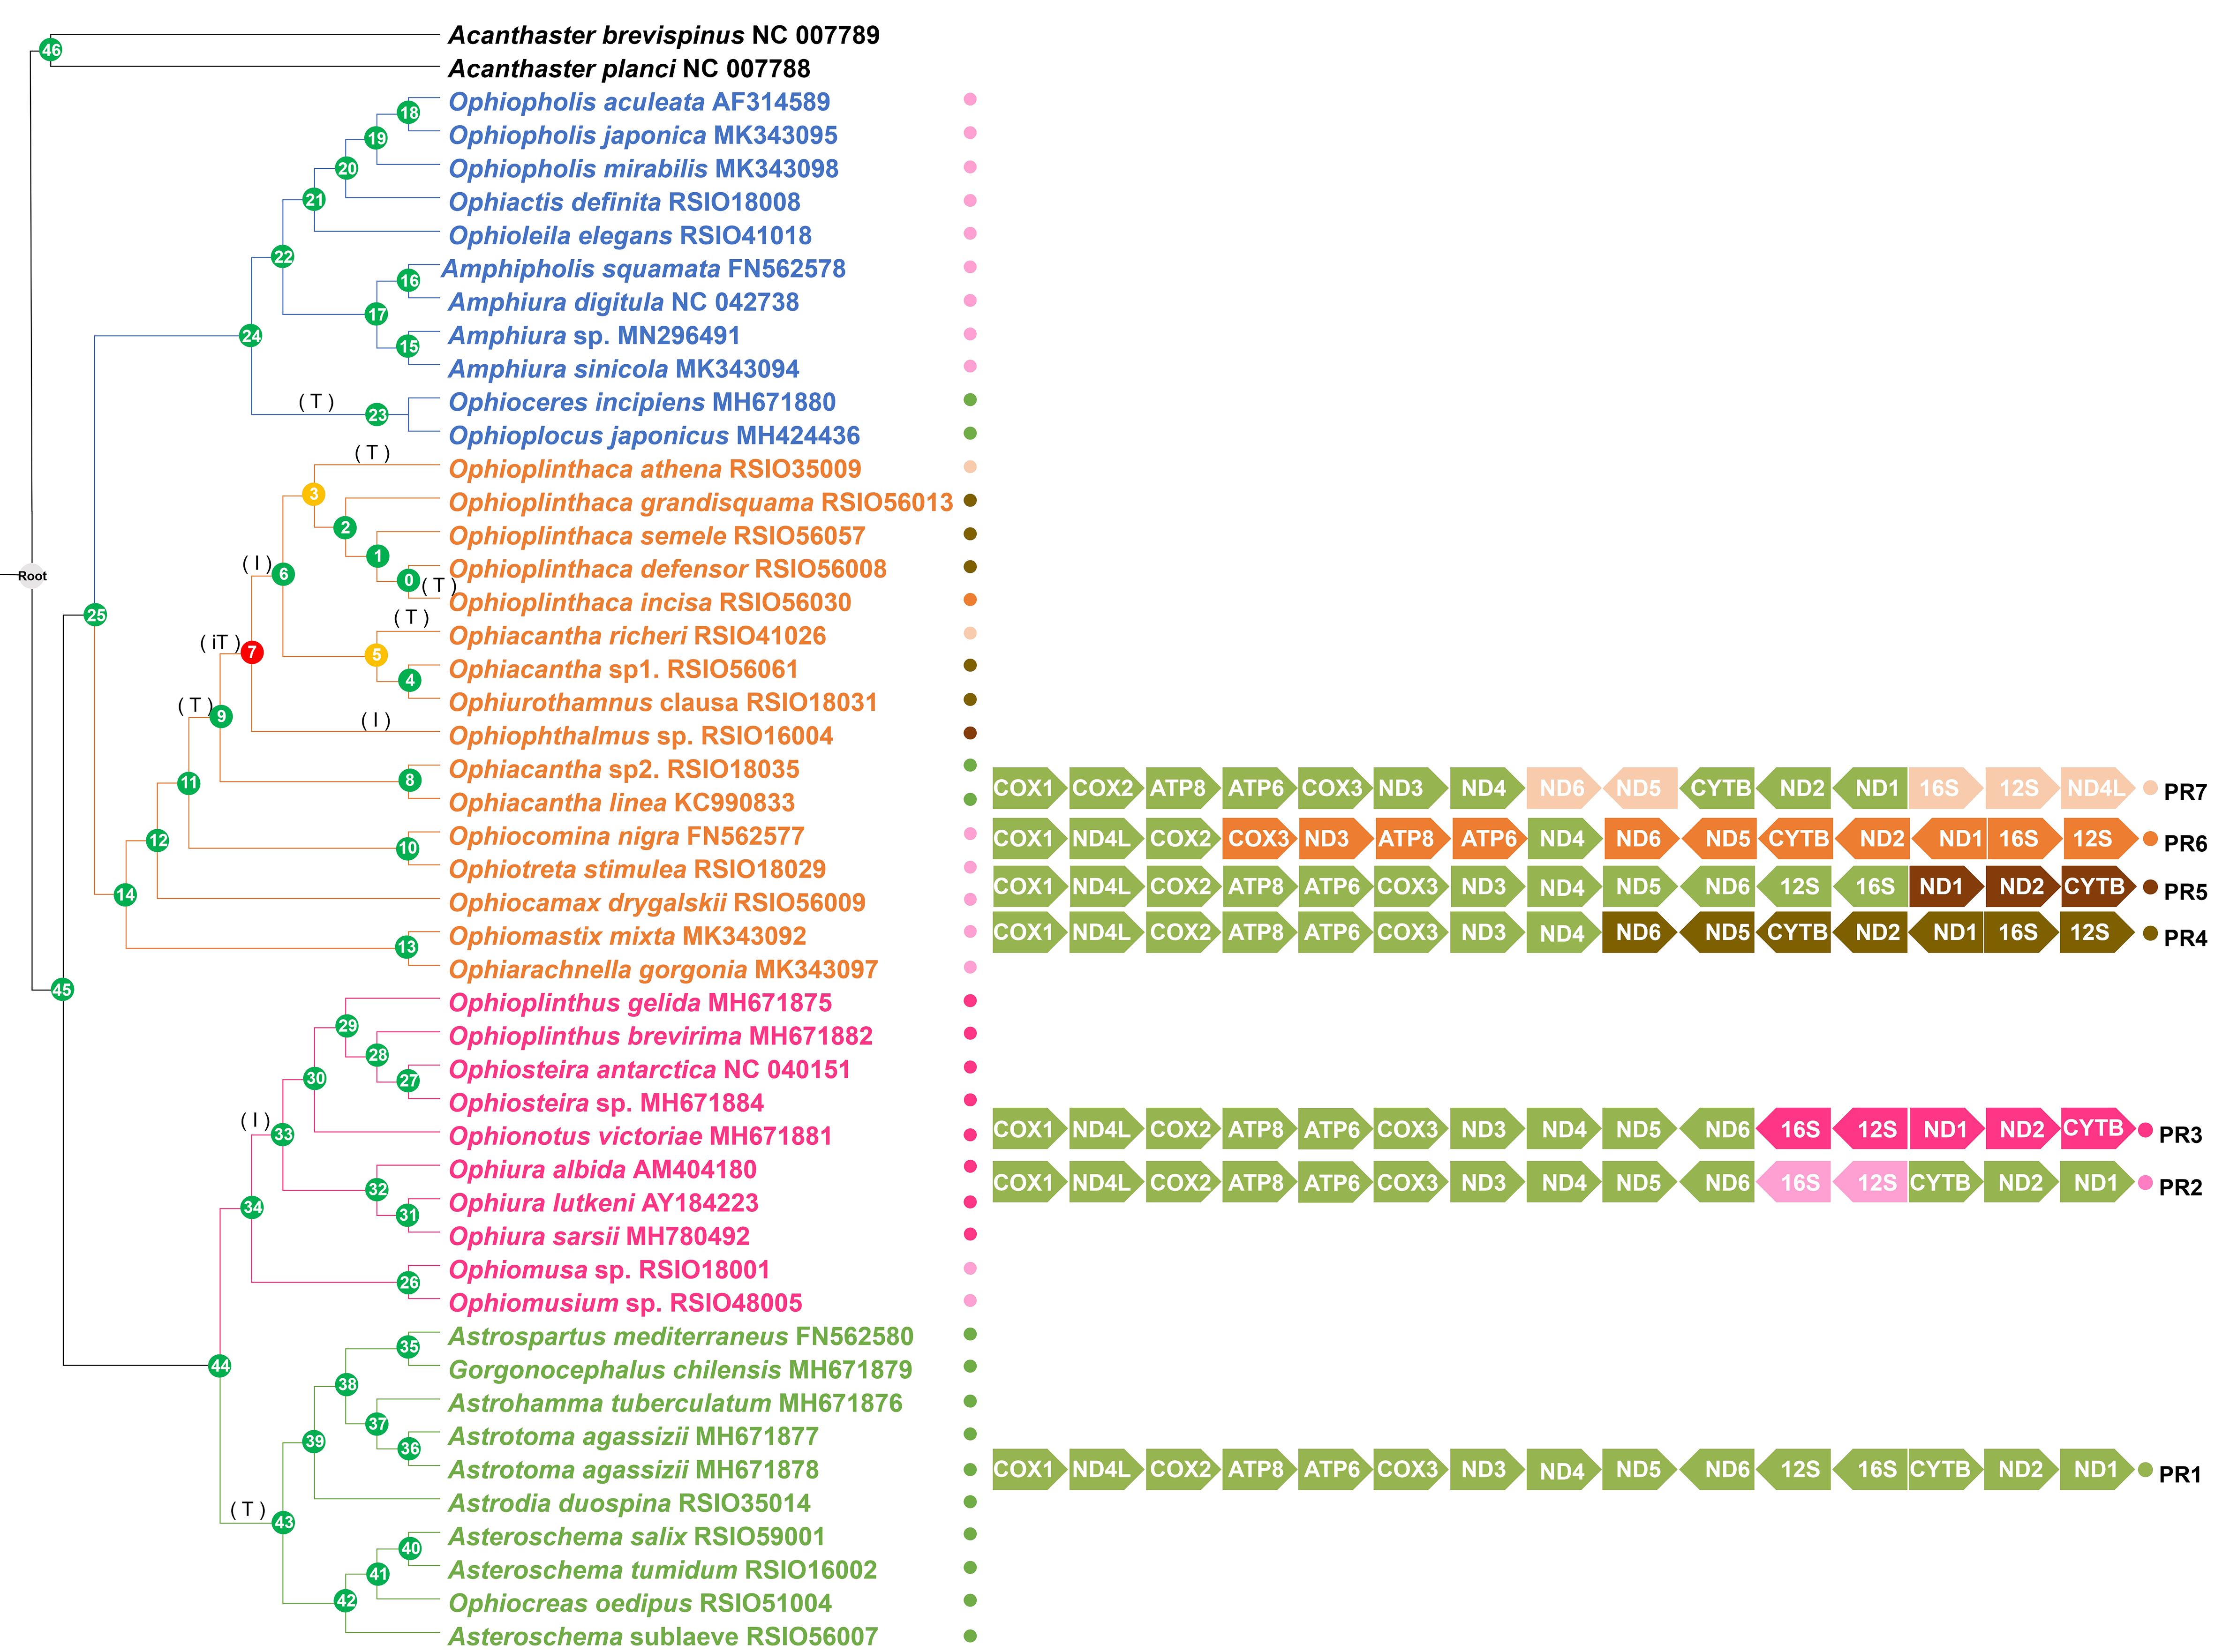
Figure 4. Possible scenario of mitochondrial gene rearrangement of 13 PCGs and two rRNA genes in Ophiuroidea. Gene orders on the nodes were estimated using TreeREx based on the phylogenetic relationships shown in Figure 3. Different gene arrangement patterns are represented by colored circles (PR1–PR7). The rearrangement events on the branches are denoted as “T” for transposition, “I” for inversion event, and “iT” for inversion and transposition (remote inversion) events. Node numbers 1–46 in circles are assigned to each node. Consistently reconstructed nodes are indicated by green circles; 1-consistent reconstructed nodes are indicated by yellow circles; and nodes reconstructed using the fallback method are indicated by red circles.
When tRNAs were included, 23 gene orders (PCGs-rRNA-tRNA gene orders, PRT1–PRT23) were recovered, 12 of which (PRT2, PRT3, PRT4, PRT10–PRT17, and PRT22) were newly discovered (Figure 5). Mitochondrial gene orders in Euryalida were highly conserved, gene orders of 10 species from Gorgonocephalidae and Euryalidae were identical, except for Astrodia duospina with a duplicated tRNA Y gene (Figure 5). Within Amphilepidida, mitochondrial gene order was relatively conserved, with two identical gene blocks COX1–ND5 and ND1–tRNA W. The rearrangements were caused by single transpositions of tRNA T, tRNA M, tRNA L1, tRNA F, and tRNA E (Figure 5). Similarly, transpositions of single tRNA genes, such as tRNA C, tRNA L1, and tRNA G, were also recovered from Ophiurina. In the most recent common ancestor of Ophiomusina, multiple TDRLs may have occurred (Figure 5), suggesting a more complicated evolution of mitochondrial genomes between the two suborders within Ophiurida. The mitochondrial gene orders in Ophiacanthidae were extremely variable, with nine PRT-gene orders recovered from 11 species (Figure 5). The four mitochondrial gene rearrangement events (inversion, transposition, reverse transposition, and TDRL) occurred frequently during its evolution history. However, five species from the other four families in Ophiacanthida shared the same PRT-gene order (PRT8), which was suggested as the ancestral gene order of Ophintegrida.
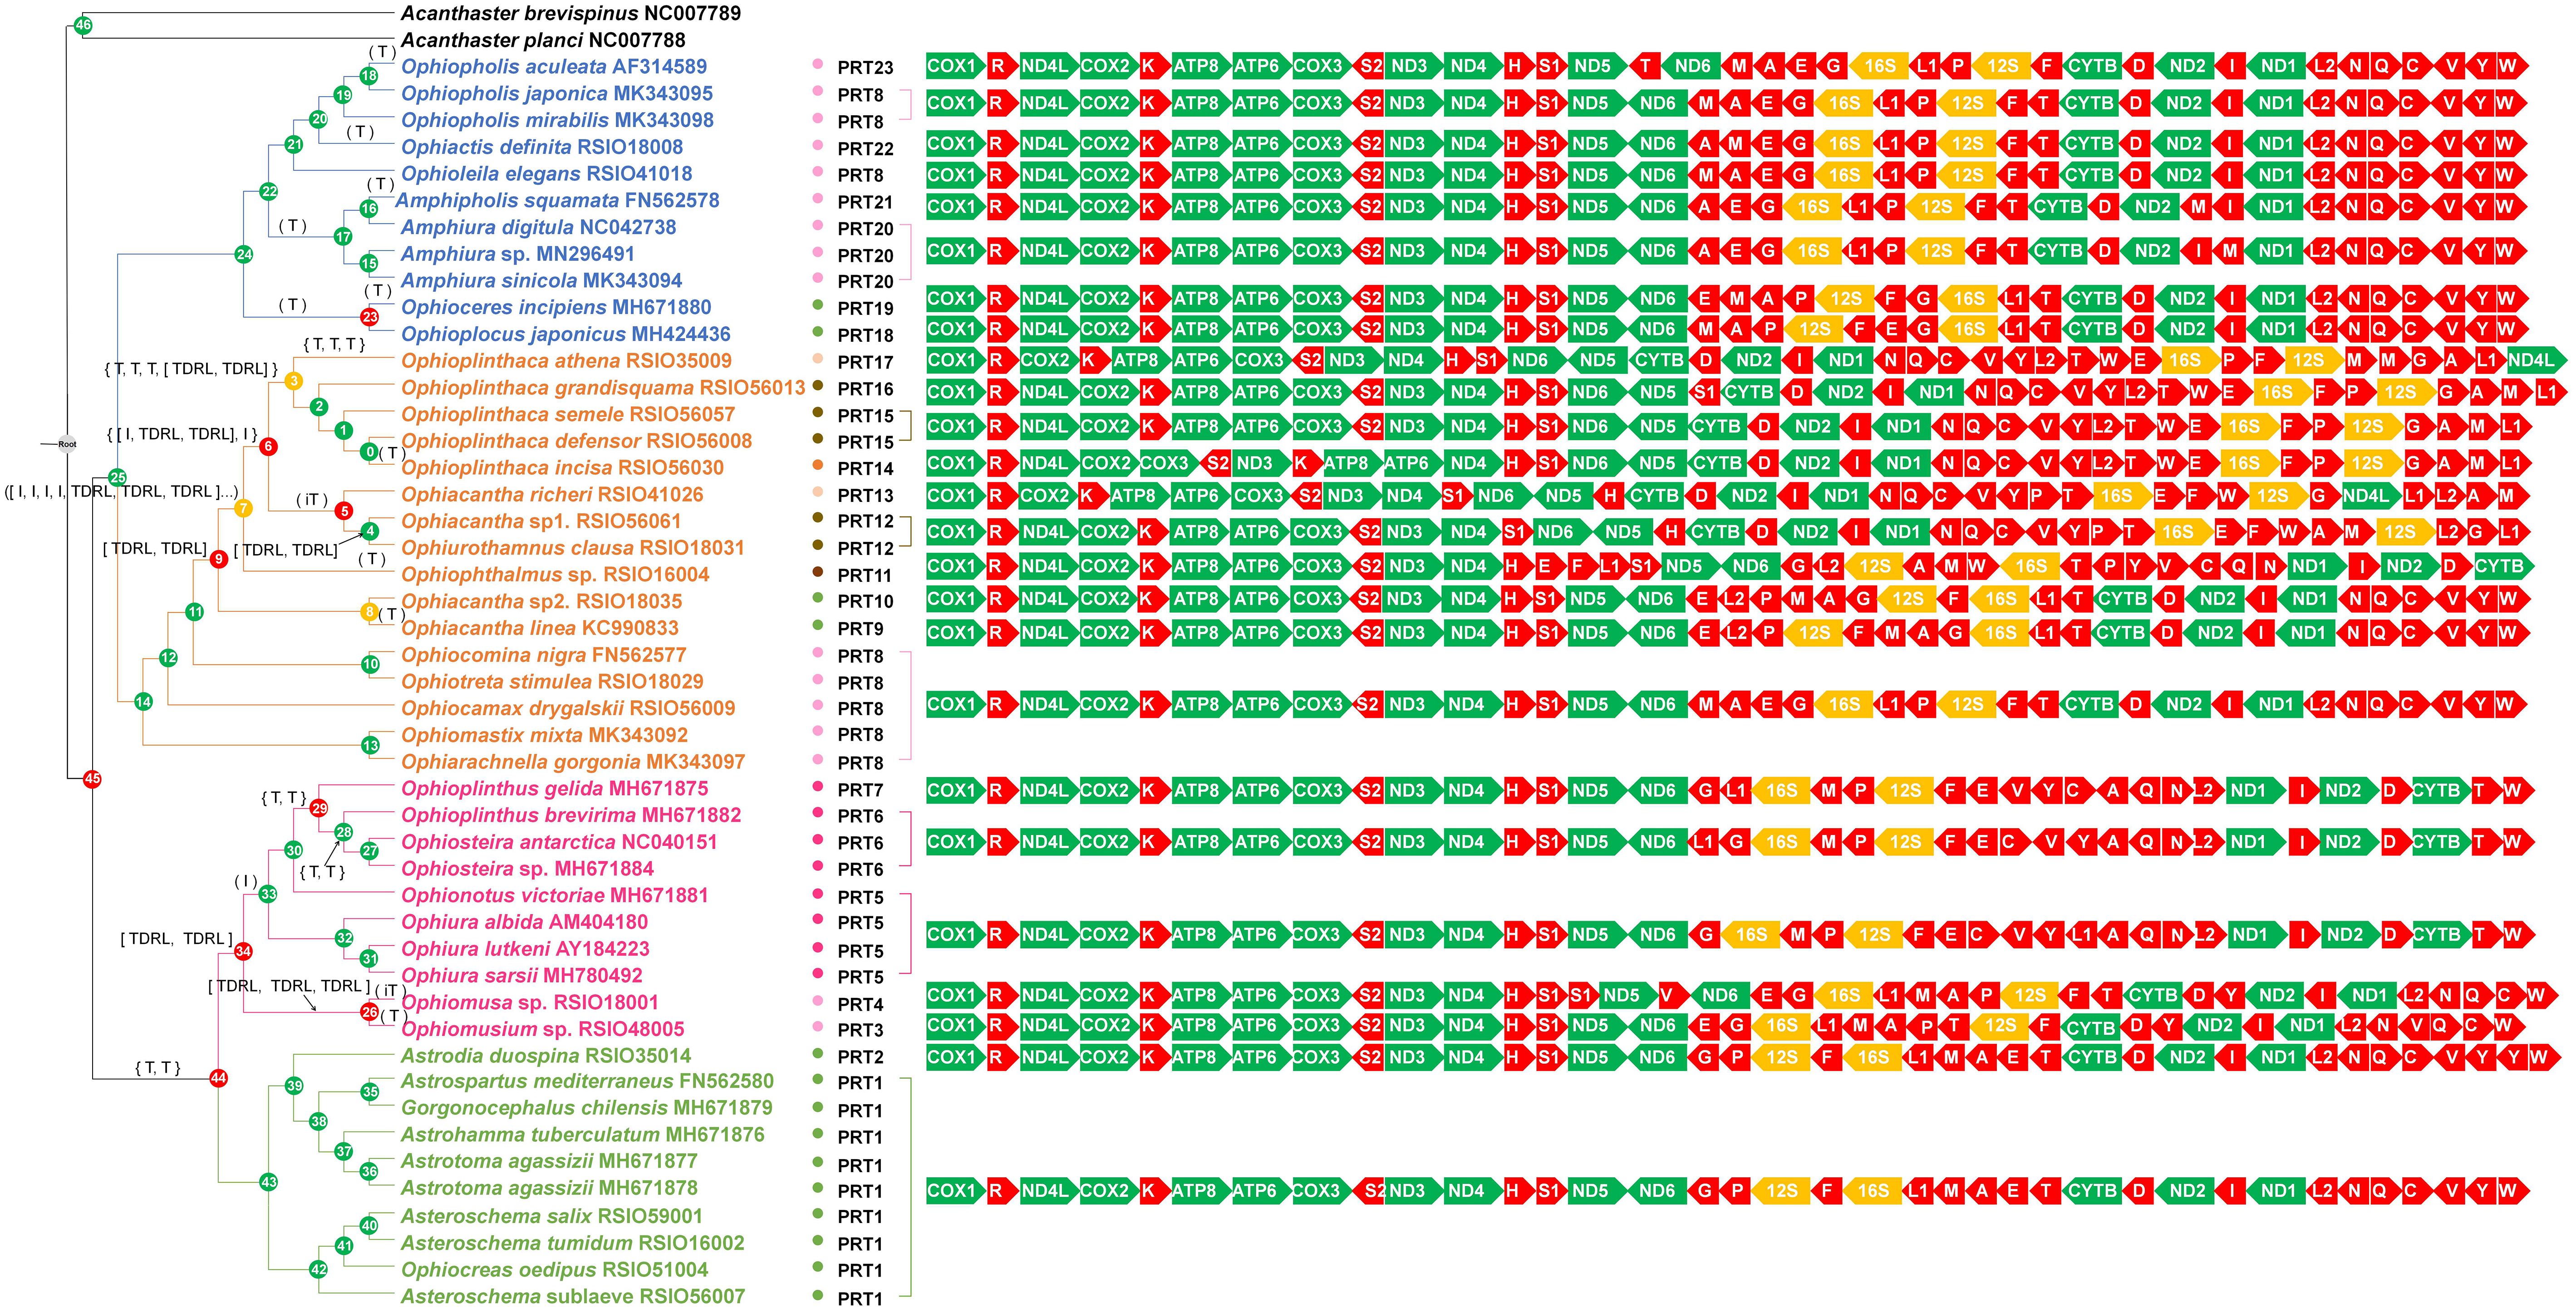
Figure 5. Possible scenario of mitochondrial gene rearrangement of 37 genes in Ophiuroidea. Gene orders at the node were estimated using TreeREx based on the phylogenetic relationships shown in Figure 3. The rearrangements on the branches are denoted as “T” for transposition, “TDRL” for tandem-duplication-random-loss events, “I” for inversion, and “iT” for inversion and transposition (remote inversion) events. Node numbers 1–46 are assigned to each node. Consistently reconstructed nodes are indicated by green circles; 1-consistent reconstructed nodes are indicated by yellow circles; and nodes reconstructed using the fallback method are indicated by red circles. PRT1–PRT23 indicate different gene orders of all 37 mitochondrial genes for the 47 ophiuroids. The small colored circles before “PRT” indicate the gene order of 13 PCGs and two rRNAs as shown in Figure 3.
Additionally, we observed distinct variation in breakpoint distance values (BP values) across the four orders. The highest BP values were recovered in Ophiacanthida, followed by Ophiurida, Euryalida, and Amphilepidida (Supplementary Table S7).
3.4 Branch length and positive selection
The branch lengths exhibited distinct variation across lineages, with higher values recovered in Ophiacanthida and Ophiurida, while lower values recovered in Amphilepidida and Euryalida (Supplementary Table S7). The ω values exhibited variation across the lineages, ranging from 0.02056 to 0.11145 for Amphilepidida, 0.03959 to 0.10883 for Ophiacanthida, 0.01335 to 0.16168 for Ophiurida, and 0.01756 to 0.0874 for Euryalida (Supplementary Table S8). Among the 13 PCGs, COX1, COX2, and CYTB displayed low ω values, while ATP8 and five genes of NADH dehydrogenase subunits (ND2, ND3, ND4, ND5, and ND6) exhibited high ω values (Figure 6A). Specifically, Ophiacanthida exhibited the highest ω values in eight PCGs (ATP6, COX1, COX2, COX3, CYTB, ND1, ND4, and ND4L); Amphilepidida had the highest ω values in three PCGs (ND3, ND5 and ND6), and Ophiurida had the highest ω values in two PCGs (ATP8 and ND2) (Figure 6A). These results suggest that Amphilepidia and Ophiacanthida might have experienced more relaxed purifying selection than Ophiurida and Euryalida.
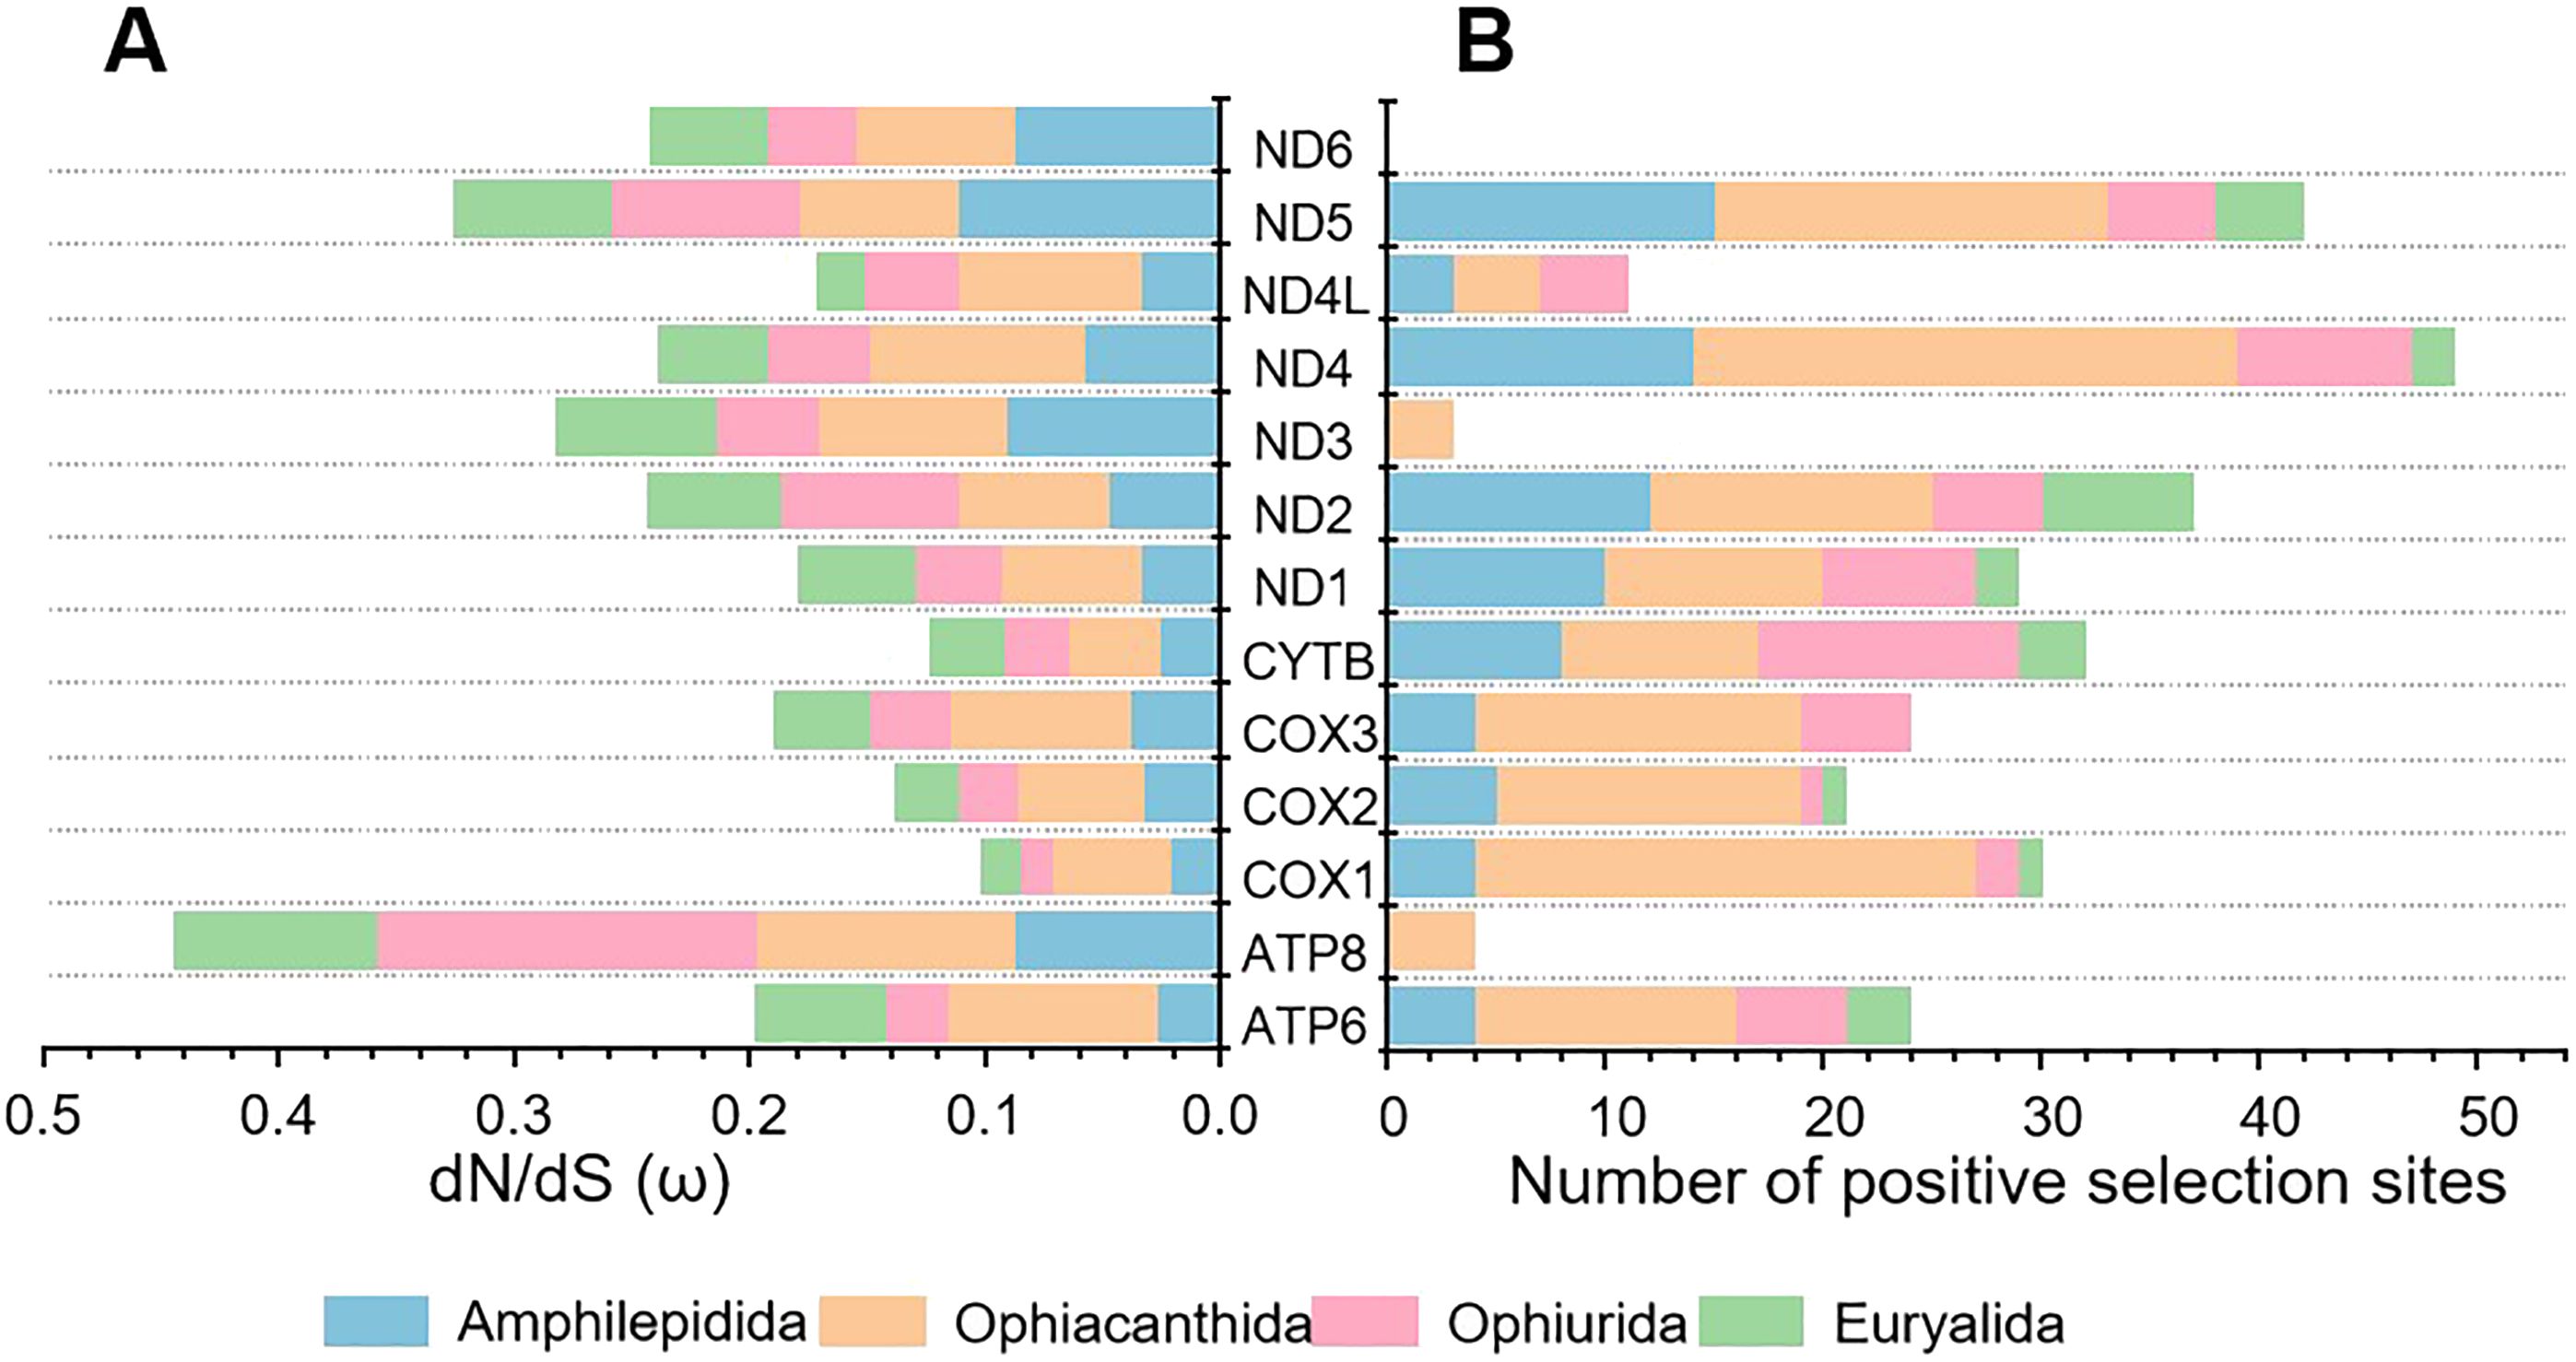
Figure 6. Results of substitution analysis for mitochondrial PCGs in Ophiuroidea. (A) Gross comparison of dN/dS (ω) values of the 13 PCGs among the four orders. (B) Number of positive selection sites of the 13 PCGs among the four orders.
The analysis showed that the free-ratio model fitted the data significantly better than the one-ratio model (Supplementary Table S9), suggesting differential selection pressures on mitochondrial genes across lineages in Ophiuroidea. The two-ratio model was better supported than the one-ratio model, with the ω values consistently exceeding one in the two-ratio model, indicating the presence of positive selection in foreground species (Supplementary Table S9). The branch-site model results revealed that Ophiacanthida exhibited the highest number of positive selection sites (150 sites) among the four orders, followed by Amphilepidida (79 sites) and Ophiurida (54 sites), with the lowest number of positive selection sites detected in Euryalida (23 sites) (Figure 6B, Supplementary Table S9). These positive selection sites were detected from most of the PCGs, except for the ND6 gene. Of the 12 PCGs, nine exhibited more positive selection sites in Ophiacanthida than in the other three orders.
4 Discussion
4.1 Effects of different datasets and methods on phylogenetic analysis
A total of 18 trees were constructed and divided into nine different topologies. The phylogenetic relationships in Ophiuroidea were highly variable at different taxonomic levels, such as families including Ophiocamacidae, Ophiocomidae, Ophiodermatidae, Hemieuryalidae and Asteronychidae and species of Ophionotus victoriae, Gorgonocephalus chilensis. These variations maybe attributed to different dataset choice and analytic methods, which had been widely reported in many other taxa (Burger et al., 2012; Du et al., 2020; Sun et al., 2022).
It has been debated whether amino acid sequences or nucleotide sequences are more informative for phylogenetic analysis (Scouras and Smith, 2001; Townsend et al., 2008). Saturation and compositional biases tend to manifest most strongly in rapidly evolving sequences, thus nucleotide sequences tend to be more biased than amino acid sequences (Rota-Stabelli et al., 2013; Cox et al., 2014). Previous study has suggested that the amino acid sequences of PCGs are more useful than nucleotide sequences for higher taxonomic analyses of ophiuroids (Lee et al., 2019). In this study, only two ML trees generated from amino acid sequences showed consistent topology with the current phylogenetic system of Ophiuroidea (O’Hara et al., 2017), supporting the four major orders as monophyletic. In contrast, trees based on nucleotide sequences failed to recover Ophiacanthida and Amphilephidida as monophyletic. Our results indicated that amino acid sequences may outperform nucleotide sequences in ophiuroids phylogenetic analysis (Lee et al., 2019).
Transfer RNAs are usually excluded in phylogenetic analyses due to their short length. However, tRNAs exhibit typical cloverleaf secondary structures that could facilitate more accurate alignment. Some analyses suggested that the inclusion of tRNAs can improve the tree resolution and nodal support (Yang et al., 2015), and may contribute positively to a more symmetrical tree (He et al., 2018). In this study, we compared the topologies and support values of trees with or without tRNAs included. No distinct differences for both the topologies and support values were observed, suggesting that inclusion of tRNAs had no significant contribution to the phylogenetic analyses for either ML trees or BI trees. Additionally, Gblocks, which can eliminate poorly aligned positions and divergent regions, making the alignments more suitable for phylogenetic analysis (Castresana, 2000), was used to eliminate ambiguously aligned and variable regions of mitochondrial genes (Li et al., 2021b; Sun et al., 2022). In this study, our results did not reveal any significant differences between datasets with or without Gblocks.
The performance of two most popular programs (IQ-TREE and RAxML) for maximum likelihood (ML) phylogenetic inference had been compared. It was suggested that in concatenated-based data analyses, IQ-TREE achieved better likelihood values than RAxML (Zhou et al., 2018). Accordantly, in this study, IQ-TREE produced slightly higher support values in consistent nodes of the ML trees at higher taxonomic levels than RAxML (Supplementary Figures S5-S7). On the other hand, only two ML trees using IQ-TREE based on amino acid sequences supported the four major orders in Ophiuroidea as monophyletic (Figure 3), while the two ML trees using RAxML based on amino acid sequences suggested Ophiacanthida as a polyphyletic clade (Supplementary Figures S1, S2). However, it was worth noting that the support values at the root nodes of Ophiacanthida and Ophiacanthina were very low, therefore, whether the IQ-TREE outperforms RAxML or not for phylogenetic analysis in Ophiuroidea needs further confirmation.
4.2 Phylogenetic relationship of Ophiuroidea based on mitochondrial genome
Among the 18 trees constructed, the monophyly of two major lineages in Ophiuroidea (superorders Ophintegrida and Euryophiurida) were consistently supported, except for the BI tree based on aa_P G (Supplementary Figure S4). Among the four major orders, the monophyly of Euryalida and Ophiurida were well supported, but the phylogenetic relationships of Amphilepidida and Ophiacanthida were complicated.
For Amphlepidida, suborders Gnathophiurina and Ophionereidina were included. Gnathophiurina was consistently supported as monophyletic, within which Ophiopholidae, Ophiactidae and Ophiothamnidae were clustered together, forming a sister clade to Amphiuridae, identical to previous studies (O’Hara et al., 2017; Li et al., 2021a; Sun et al., 2023). But in some trees, Hemieuryalidae was suggested to be a sister clade to Ophiomastix mixta and Ophiarachnella gorgonia (Supplementary Figures S5, S6), or to the Ophiacanthida (Supplementary Figures S7, S8). Similar phylogenetic results were obtained in previous studies (Lee et al., 2019; Sun et al., 2023), suggesting the taxonomic status of Hemieuryalidae needs further evaluation.
For Ophiacanthida, Ophiacanthidae and Ophiotomidae were consistently supported as monophyletic. Within Ophiacanthidae, Ophioplinthaca was well-supported as monophyletic (Nethupul et al., 2022), while Ophiacantha were widely distributed across lineages of Ophiacanthidae, nested with other genera (Ophiurothamnus and Ophiophthalmus) with respect to its current definition (O’Hara et al., 2017). Ophiacantha is one of the most speciose (Stöhr et al., 2012), but also one of the most heterogeneous genera among the extant ophiuroids (O’Hara and Stöhr, 2006). Many species of other ophiacanthid genera share great similarities with Ophiacantha (Thuy, 2013). Therefore, a comprehensive review of this genus is urgently needed.
The phylogenetic relationship of Ophiurida was consistent to that in previous study (O’Hara et al., 2017), supporting the two monophyletic suborders. For Euryalida, Gorgonocephalidae and Euryalidae represented by multispecies were both supported as monophyletic. Asteronychidae was clustered with Gorgonocephalidae, while Euryalidae located at the basal position of Euryalida. This is consistent to the results of Okanishi and Fujita (2013), who suggested that Asteronychidae and Gorgonocephalidae share many morphological similarities (Okanishi and Fujita, 2013). However, O’Hara et al. (2017) suggested that Asteronychidae was the basal clade of Euryalida, while Gorgonocephalidae and Euryalidae were sister groups. Since only one asteronychid was included in this study and support values on node of Asteronychidae + Gorgonocephalidae were relatively low in some trees, more data are needed to examine the phylogenetic relationships of the three families in Euryalida.
Although, mitochondrial genomes are more suitable for phylogenetic analysis for those groups at lower taxonomic level (Qi et al., 2024), they provide limited information for resolving deeper phylogenies at the family or higher taxonomic level. Therefore, incorporating sequences from other loci (e.g. nuclear genes) in phylogenetic analysis should enhance our understanding of the phylogeny of the class Ophiuroidea (Hugall et al., 2016)
4.3 Mitochondrial gene rearrangements in Ophiuroidea
Ancestral gene order inference has provided significant insights into protein functional shifts and positive selection (Muller et al., 2004). Nevertheless, in previous studies, the ancestral gene order within Ophiuroidea has been a subject of persistent debate. Perseke et al. (2010) proposed that the ancestral gene order of Ophiuroidea is likely represented by the gene order in Ophiocomina nigra. More recently, Sun et al. (2023) inferred that the ancestral gene order of Ophiuroidea was the same as the gene order found in Ophiuridae. Galaska et al. (2019) conducted an analysis based on 13 PCGs and two rRNA genes and suggested that the gene order in Euryalida might be the ancestral gene order of Ophiuroidea. In contrast, we suggest that the gene order of 13 PCGs and 2 rRNAs observed in Gnathophiurina, Ophiotomidae, Ophiocamacidae, Ophiocomidae, Ophiodermatidae and Ophiomusina (PR2) was the most likely the ancestral gene order in Ophiuroidea (Figure 4), and at least one transposition may have occurred. Furthermore, our results align with the conclusions of Perseke et al. (2010), supporting the hypothesis that the gene order of O. nigra (PRT8) when including tRNAs, also observed from four other species of Ophiacanthida and three species of Amphilepidida (Figure 5), was the most likely ancestral gene order of Ophiuroidea.
Despite Ophiuroidea being identified as the group with the most gene arrangements in Echinodermata (Perseke et al., 2010), other studies have noted relative conservation in gene orders, in either 13 PCGs + two rRNAs or 13 PCGs + two rRNAs + 22 tRNAs, across different taxonomic levels (Galaska et al., 2019; Lee et al., 2019). In this study, we reported 23 new mitochondrial gene orders, significantly expanding the understanding of mitochondrial gene rearrangements in this group. Multiple gene orders were identified in several genera, such as Ophioplinthaca, Ophiopholis and Ophioplinthus, suggesting a high potentiality for mitochondrial gene rearrangement in Ophiuroidea. Notably, the diversity in mitochondrial gene orders varied considerably among the four orders examined. The gene rearrangement rate (BP values) was positively related to nucleotide substitution rate (branch length) among the investigated species (Figure 7). A similar trend of a high degree of mitochondrial gene rearrangement coupled with an elevated nucleotide substitution rate has been observed in various taxa, e.g., Tunicata, Nematoda, some Mollusca, and Arthropoda (Iannelli et al., 2007; Rawlings et al., 2010; Stach et al., 2010; Bernt et al., 2013b; Luo et al., 2015). Increasing nucleotide substitution can lead to mutations at the initiation and termination sites of the mitogenome replication, causing errors and consequently gene rearrangements through duplication and deletion mechanisms (Boore, 2000; Lavrov et al., 2002). In addition, endogenous DNA damage can be caused by high rates of nucleotide substitution, resulting in double-stranded breaks that may trigger illegitimate recombination (Boore, 2000) or intramitochondrial recombination (Dowton and Campbell, 2001). On the other hand, it was also noted that gene reversals may facilitate the nucleotide evolution (Bernt et al., 2013c). Two mitochondrial genomes of ophiocomids exibited different nucleotide composition compared to their congeners (O’Hara et al., 2019), which might be a result of a substantial mitogenomic reorganisation. By now, we cannot confirm which mechanism play a more important role. Our results provided the first evidence of a significant positive relation (p<0.01) between gene rearrangement and nucleotide substitution in Echinodermata, further highlighting the importance of mitochondrial gene rearrangement in the study of evolutionary history of Ophiuroidea.
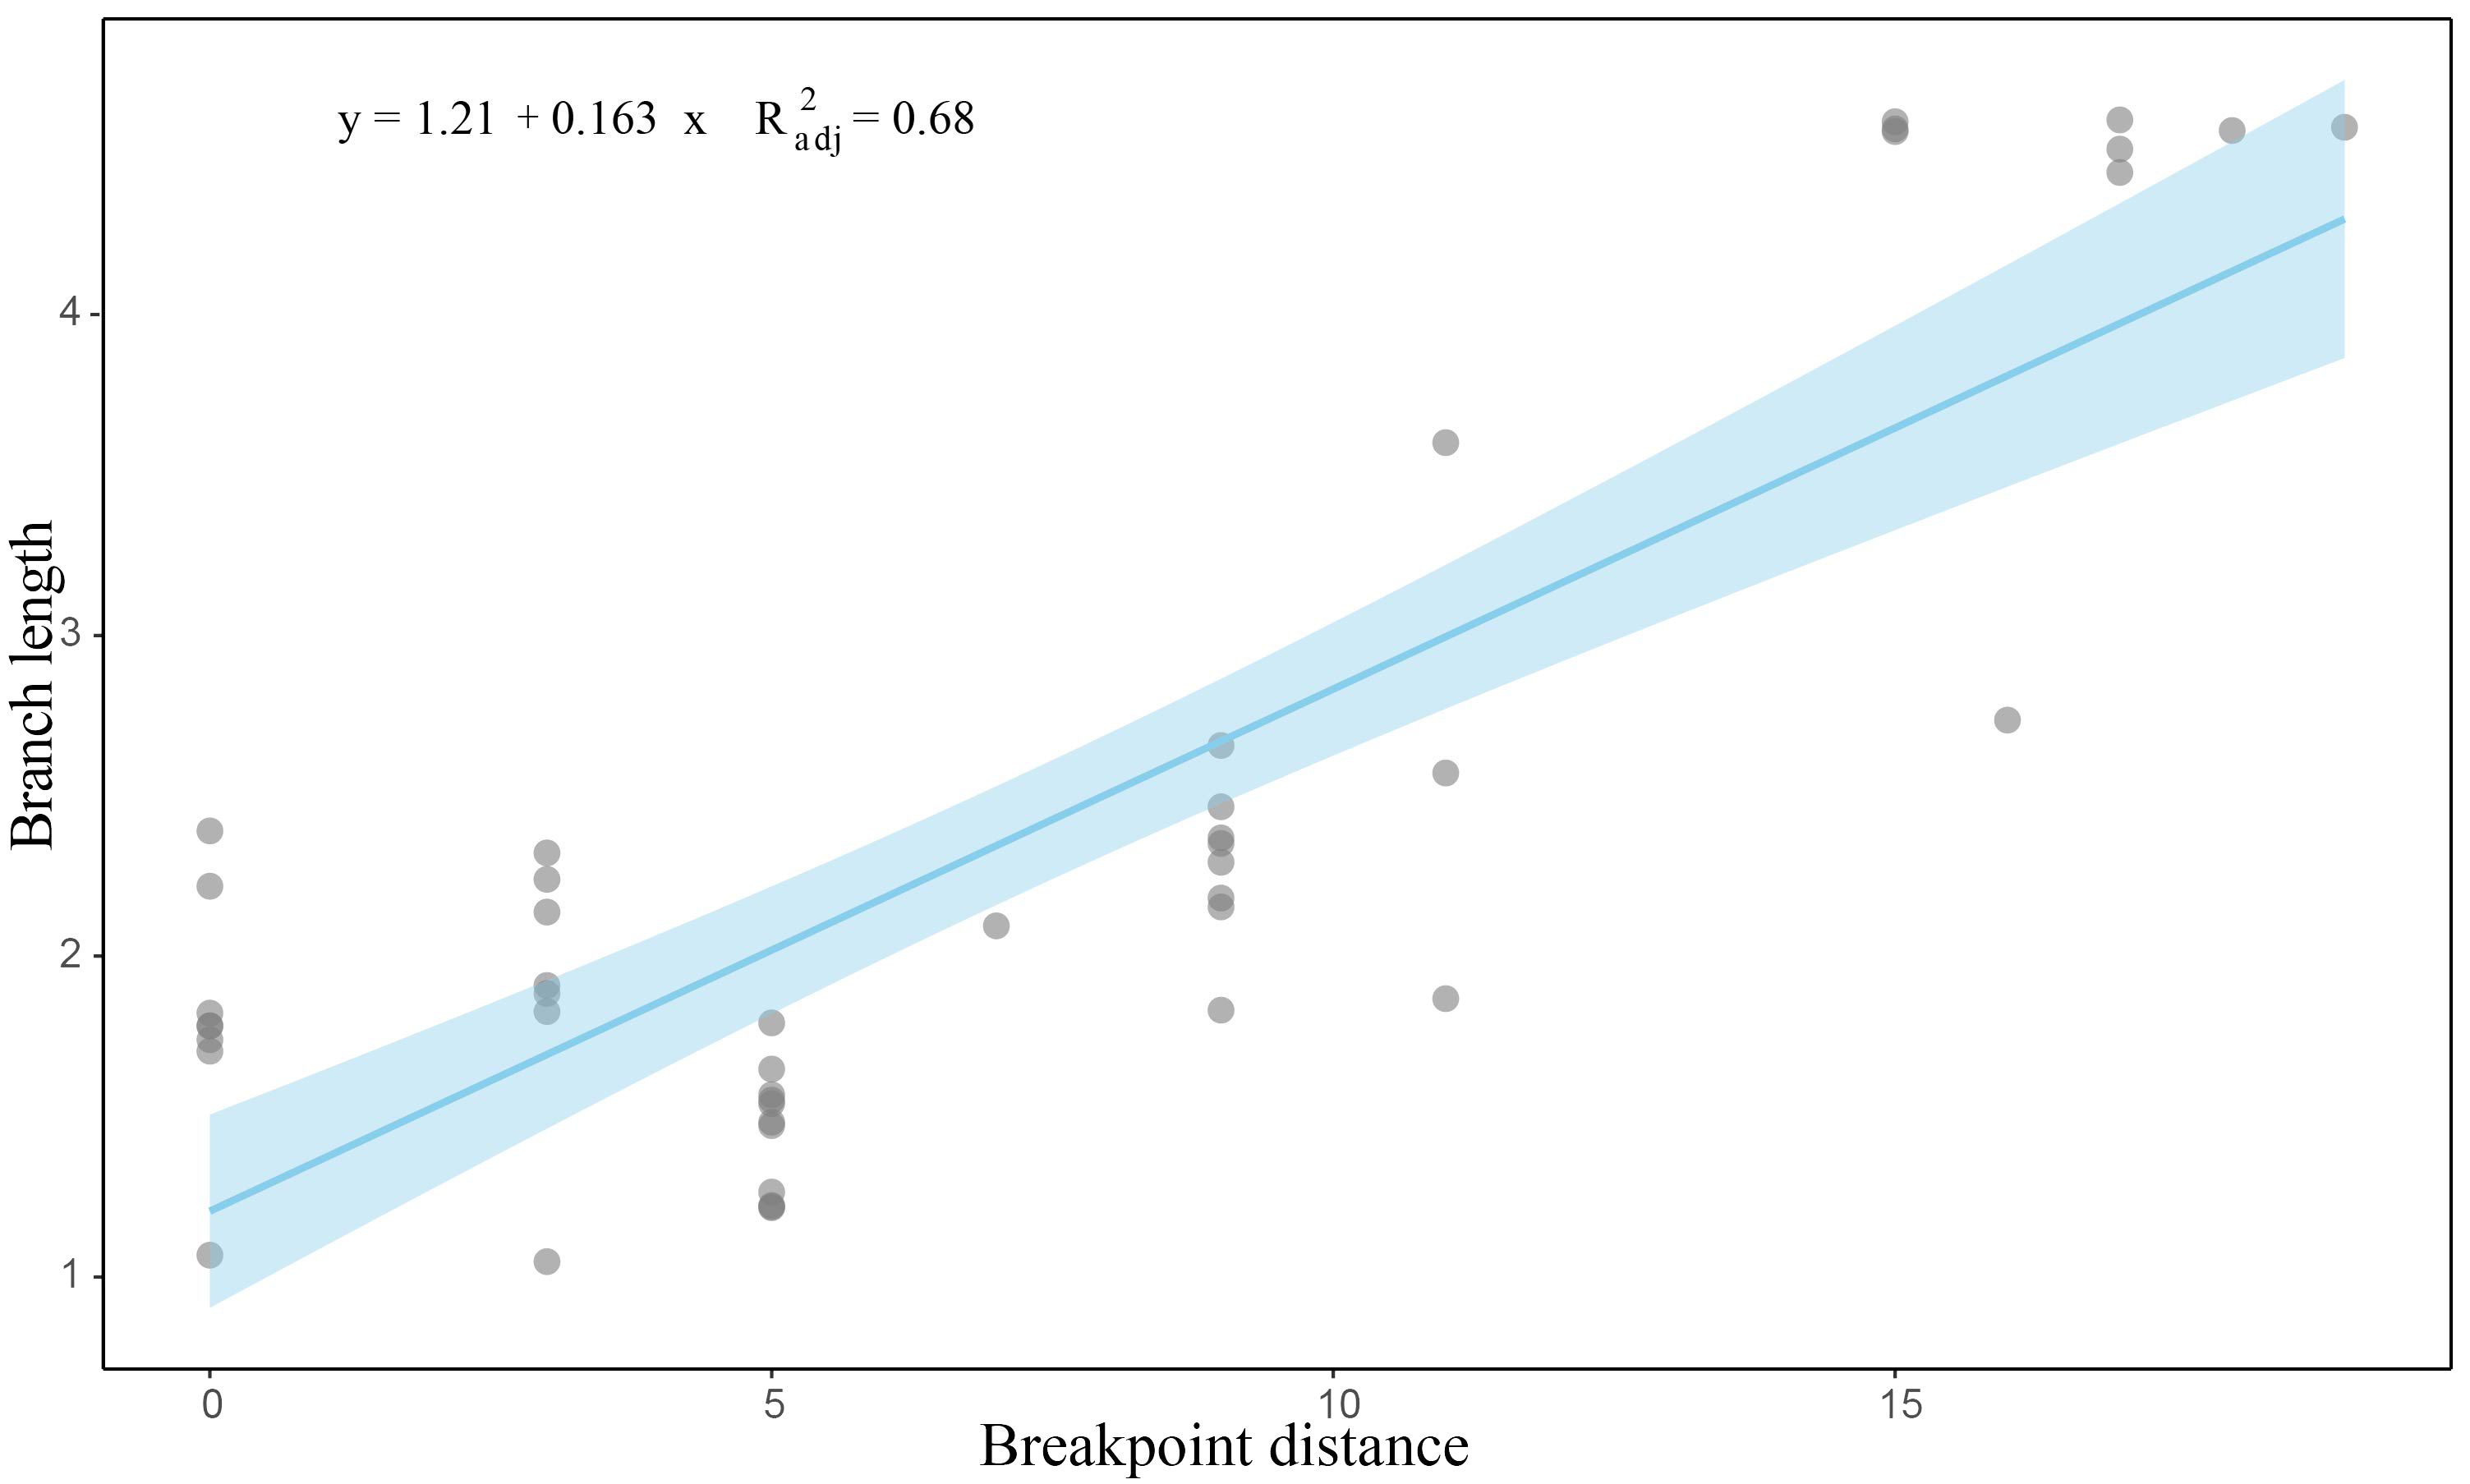
Figure 7. Correlation between the rate of mitochondrial gene rearrangement and the rate of nucleotide substitution among ophiuroids sampled, p < 0.05. The horizontal and vertical axes are the breakpoint distance and the branch length, respectively.
5 Conclusions
In this study, a mitochondrial genome dataset of 47 ophiuroid species spanning 4 orders, 17 families and 30 genera were generated and analyzed, including 21 mitogenomes newly obtained by this study. Mitogenomes of deep-sea families/genera Ophiactidae, Ophiocamacidae, Ophiomusaidae, Ophiosphalmidae, Asteronychidae and genera Ophioleila, Ophioplinthaca, Ophiurothamnus, Ophiophthalmus, Asteroschema and Ophiocreas were first reported, revealing 4 new PR-gene orders and 23 new PRT-gene orders. This mitogenome dataset allows for a comparative analysis of phylogenetic results using different datasets and methods. In general, the phylogenetic trees using mitogenomes support most monophyletic clades of previous phylogenetic trees based on exons, transcriptomes, and DNA barcodes. The choice of datasets (nucleotide or amino acid) and methods (ML or BI) impacts the tree topology, especially for orders Amphilepidida and Ophiacanthida. The inclusion of tRNAs, removal of highly variable sites using Gblocks, on the other hand, have limited influence on tree topology and nodal supports. PR2 and PRT8 were recovered as the most likely mitochondrial ancestral gene orders for Ophiuroidea. The diversity of mitochondrial gene order varied among the four orders. The mitochondrial gene rearrangement rates and nucleotide substitution rates were positively related, suggesting different evolutionary history of the four orders in Ophiuroidea. This study has significantly improved our understanding of mitochondrial gene rearrangement, shedding light on evolutionary patterns in the Ophiuroidea.
Data availability statement
The datasets presented in this study can be found in online repositories. The names of the repository/repositories and accession number(s) can be found in the article/Supplementary Material.
Ethics statement
The manuscript presents research on animals that do not require ethical approval for their study.
Author contributions
JN: Conceptualization, Data curation, Formal analysis, Methodology, Validation, Writing – original draft, Writing – review & editing. YZ: Formal analysis, Methodology, Resources, Writing – review & editing. HC: Data curation, Formal analysis, Methodology, Writing – review & editing. RZ: Data curation, Writing – review & editing. CS: Data curation, Formal analysis, Writing – review & editing. BL: Investigation, Writing – review & editing. CW: Conceptualization, Data curation, Funding acquisition, Project administration, Resources, Validation, Writing – review & editing. DZ: Conceptualization, Funding acquisition, Project administration, Resources, Validation, Writing – original draft, Writing – review & editing.
Funding
The author(s) declare financial support was received for the research, authorship, and/or publication of this article. This study was supported by the National Natural Science Foundation of China (42076135), the Foundation of China Ocean Mineral Resources R & D Association (No. DY135-E2-6) and Digital Deep-sea Typical Habitats Programme of China Deep Ocean Affairs Administration.
Acknowledgments
We appreciate the captains and crews of RVs DAYANGYIHAO, HAIYANGLIUHAO and XIANGYANGHONGJIUHAO, as well as the operation teams of HOV JIAOLONG and ROVs HAILONG III and HAIMA for their invaluable help in collecting the samples used in this study. We sincerely thank Dr. Jin Sun for his valuable comments and suggestions during the preparation of this article.
Conflict of interest
The authors declare that the research was conducted in the absence of any commercial or financial relationships that could be construed as a potential conflict of interest.
Publisher’s note
All claims expressed in this article are solely those of the authors and do not necessarily represent those of their affiliated organizations, or those of the publisher, the editors and the reviewers. Any product that may be evaluated in this article, or claim that may be made by its manufacturer, is not guaranteed or endorsed by the publisher.
Supplementary material
The Supplementary Material for this article can be found online at: https://www.frontiersin.org/articles/10.3389/fmars.2024.1425922/full#supplementary-material
References
Bernt M., Bleidorn C., Braband A., Dambach J., Donath A., Fritzsch G., et al. (2013b). A comprehensive analysis of bilaterian mitochondrial genomes and phylogeny. Mol. Phylogenet. Evol. 69, 352–364. doi: 10.1016/j.ympev.2013.05.002
Bernt M., Braband A., Schierwater B., Stadler P. F. (2013c). Genetic aspects of mitochondrial genome evolution. Mol. Phylogenet. evolution. 69, 328–338. doi: 10.1016/j.ympev.2012.10.020
Bernt M., Donath A., Jühling F., Externbrink F., Florentz C., Fritzsch G., et al. (2013a). MITOS: Improved de novo metazoan mitochondrial genome annotation. Mol. Phylogenet. Evol. 69, 313–319. doi: 10.1016/j.ympev.2012.08.023
Bernt M., Merkle D., Middendorf M. (2008). “An algorithm for inferring mitogenome rearrangements in a phylogenetic tree,” in In RECOMB international workshop on comparative genomics (Springer, Berlin, Heidelberg), 143–157.
Bernt M., Merkle D., Ramsch K., Fritzsch G., Perseke M., Bernhard D., et al. (2007). CREx: inferring genomic rearrangements based on common intervals. Bioinformatics. 23, 2957–2958. doi: 10.1093/bioinformatics/btm468
Blanchette M., Kunisawa T., Sankoff D. (1999). Gene order breakpoint evidence in animal mitochondrial phylogeny. J. Mol. Evolution. 49, 193–203. doi: 10.1007/PL00006542
Boore J. L. (2000). “The duplication/random loss model for gene rearrangement exemplified by mitochondrial genomes of deuterostome animals,” in Comparative genomics (Springer, Dordrecht), 133–147.
Bribiesca-Contreras G., Verbruggen H., Hugall A. F., O’ Hara T. D. (2017). The importance of offshore origination revealed through ophiuroid phylogenomics. Proc. R. Soc. Biol. Sci. 284, 20170160. doi: 10.1098/rspb.2017.0160
Burger T. D., Shao R., Beati L., Miller H., Barker S. C. (2012). Phylogenetic analysis of ticks (Acari: Ixodida) using mitochondrial genomes and nuclear rRNA genes indicates that the genus Amblyomma is polyphyletic. Mol. Phylogenet. Evol. 64, 45–55. doi: 10.1016/j.ympev.2012.03.004
Cameron S. L. (2014). Insect mitochondrial genomics: implications for evolution and phylogeny. Ann. Rev. Entomol. 59, 95–117. doi: 10.1146/annurev-ento-011613-162007
Cantatore P., Roberti M., Rainaldi G., Gadaleta M. N., Saccone C. (1989). The complete nucleotide sequence, gene organization, and genetic code of the mitochondrial genome of Paracentrotus lividus. J. Biol. Chem. 264, 10965–10975. doi: 10.1016/S0021-9258(18)60413-2
Castresana J. (2000). Selection of conserved blocks from multiple alignments for their use in phylogenetic analysis. Mol. Biol. Evol. 17, 540–552. doi: 10.1093/oxfordjournals.molbev.a026334
Cox C. J., Li B., Foster P. G., Embley T. M., Civáň P. (2014). Conflicting phylogenies for early land plants are caused by composition biases among synonymous substitutions. Systematic Biol. 63, 272–279. doi: 10.1093/sysbio/syt109
Dowton M., Campbell N. J. (2001). Intramitochondrial recombination—is it why some mitochondrial genes sleep around? Trends Ecol. Evol. 16, 269–271. doi: 10.1016/S0169-5347(01)02182-6
Du X., Zeng T., Feng Q., Hu L., Luo X., Weng Q., et al. (2020). The complete chloroplast genome sequence of yellow mustard (Sinapis alba L.) and its phylogenetic relationship to other Brassicaceae species. Gene. 731, 144340. doi: 10.1016/j.gene.2020.144340
Edgar R. C. (2004). MUSCLE: multiple sequence alignment with high accuracy and high throughput. Nucleic Acids Res. 32, 1792–1797. doi: 10.1093/nar/gkh340
Emson R., Mladenov P., Barrow K. (1991). The feeding mechanism of the basket star Gorgonocephalus arcticus. Can. J. Zool. 69, 449–455. doi: 10.1139/z91-070
Fell H. B. (1960). Synoptic keys to the genera of Ophiuroidea. Zoological Publications Victoria Univ. Wellington 26, 1–44.
Fourdrilis S., de Frias Martins A. M., Backeljau T. (2018). Relation between mitochondrial DNA hyperdiversity, mutation rate and mitochondrial genome evolution in Melarhaphe neritoides (Gastropoda: Littorinidae) and other Caenogastropoda. Sci. Rep. 8, 1–12. doi: 10.1038/s41598-018-36428-7
Fratt D., Dearborn J. (1984). Feeding biology of the Antarctic brittle star Ophionotus victoriae (Echinodermata: Ophiuroidea). Polar Biol. 3, 127–139. doi: 10.1007/BF00442644
Galaska M. P., Li Y., Kocot K. M., Mahon A. R., Halanych K. M. (2019). Conservation of mitochondrial genome arrangements in brittle stars (Echinodermata, Ophiuroidea). Mol. Phylogenet. Evol. 130, 115–120. doi: 10.1016/j.ympev.2018.10.002
He B., Su T., Wu Y., Xu J., Huang D. (2018). Phylogenetic analysis of the mitochondrial genomes in bees (Hymenoptera: Apoidea: Anthophila). PloS One 13, e0202187. doi: 10.1371/journal.pone.0202187
Hugall A. F., O’Hara T. D., Hunjan S., Nilsen R., Moussalli A. (2016). An exon-capture system for the entire class Ophiuroidea. Mol. Biol. Evol. 33, 281–294. doi: 10.1093/molbev/msv216
Iannelli F., Griggio F., Pesole G., Gissi C. (2007). The mitochondrial genome of Phallusia mammillata and Phallusia fumigata (Tunicata, Ascidiacea): high genome plasticity at intra-genus level. BMC Evol. Biol. 7, 155. doi: 10.1186/1471-2148-7-155
Katoh K., Standley D. M. (2013). MAFFT multiple sequence alignment software version 7: improvements in performance and usability. Mol. Biol. Evol. 30, 772–780. doi: 10.1093/molbev/mst010
Kumar S., Stecher G., Tamura K. (2016). Mega7: molecular evolutionary genetics analysis version 7.0 for bigger datasets. Mol. Biol. Evol. 33, 1870–1874. doi: 10.1093/molbev/msw054
Lavrov D. V., Boore J. L., Brown W. M. (2002). Complete mtDNA sequences of two millipedes suggest a new model for mitochondrial gene rearrangements: duplication and nonrandom loss. Mol. Biol. Evol. 19, 163–169. doi: 10.1093/oxfordjournals.molbev.a004068
Lee T., Bae Y. J., Shin S. (2019). Mitochondrial gene rearrangement and phylogenetic relationships in the Amphilepidida and Ophiacanthida (Echinodermata, Ophiuroidea). Mar. Biol. Res. 15, 26–35. doi: 10.1080/17451000.2019.1601226
Li F., Lv Y., Wen Z., Bian C., Zhang X., Guo S., et al. (2021b). The complete mitochondrial genome of the intertidal spider (Desis jiaxiangi) provides novel insights into the adaptive evolution of the mitogenome and the evolution of spiders. BMC Ecol. Evol. 21, 72. doi: 10.1186/s12862-021-01803-y
Li Q., Li Y., Na J., Han X., Paterson G. L., Liu K., et al. (2021a). Description of a new species of Histampica (Ophiuroidea: Ophiothamnidae) from cold seeps in the South China Sea and analysis of its mitochondrial genome. Deep-Sea Res. Part I: Oceanographic Res. Papers. 178, 103658. doi: 10.1016/j.dsr.2021.103658
Li Y., Kocot K. M., Schander C., Santos S. R., Thornhill D. J., Halanych K. M. (2015). Mitogenomics reveals phylogeny and repeated motifs in control regions of the deep-sea family Siboglinidae (Annelida). Mol. Phylogenet. Evol. 85, 221–229. doi: 10.1016/j.ympev.2015.02.008
Luo Y. J., Satoh N., Endo K. (2015). Mitochondrial gene order variation in the brachiopod Lingula anatina and its implications for mitochondrial evolution in lophotrochozoans. Mar. Genomic. 24, 31–40. doi: 10.1016/j.margen.2015.08.005
Malkócs T., Viricel A., Becquet V., Evin L., Dubillot E., Pante E. (2022). Complex mitogenomic rearrangements within the Pectinidae (Mollusca: Bivalvia). BMC Ecol. Evolution. 22, 29. doi: 10.1186/s12862-022-01976-0
Matsumoto H. (1917). A monograph of Japanese Ophiuroidea, arranged according to a new classification. J. Coll. Sci. Imp Univ Tokyo. 38, 1.
Mikkelsen N. T., Kocot K. M., Halanych K. M. (2018). Mitogenomics reveals phylogenetic relationships of caudofoveate aplacophoran molluscs. Mol. Phylogenet. Evol. 127, 429–436. doi: 10.1016/j.ympev.2018.04.031
Miya M., Kawaguchi A., Nishida M. (2001). Mitogenomic exploration of higher teleostean phylogenies: a case study for moderate-scale evolutionary genomics with 38 newly determined complete mitochondrial DNA sequences. Mol. Biol. Evol. 18, 1993–2009. doi: 10.1093/oxfordjournals.molbev.a003741
Muller K., Borsch T., Legendre L., Porembski S., Theisen I., Barthlott W. (2004). Evolution of carnivory in lentibulariaceae and the lamiales. Plant Biol. 6, 477–490. doi: 10.1055/s-2004-817909
Nakajima Y., Shinzato C., Khalturina M., Nakamura M., Watanabe H., Satoh N., et al. (2016). The mitochondrial genome sequence of a deep-sea, hydrothermal vent limpet, Lepetodrilus nux, presents a novel vetigastropod gene arrangement. Mar. Genomics 28, 121–126. doi: 10.1016/j.margen.2016.04.005
Nethupul H., Stöhr S., Zhang H. (2022). New species, redescriptions and new records of deep-sea brittle stars (Echinodermata: Ophiuroidea) from the South China Sea, an integrated morphological and molecular approach. Eur. J. Taxonomy. 810, 1–95. doi: 10.5852/ejt.2022.810.1723
Nurk S., Bankevich A., Antipov D., Gurevich A., Korobeynikov A., Lapidus A., et al. (2013). “Assembling genomes and mini-metagenomes from highly chimeric reads(C),” in Research in Computational Molecular Biology: 17th Annual International Conference. Annual International Conference on Research in Computational Molecular Biology. 158–170 (Berlin Heidelberg: Springer).
O’Hara T. D., Hugall A. F., Cisternas P. A., Boissin E., Bribiesca-Contreras G., Sellanes J., et al. (2019). Phylogenomics, life history and morphological evolution of ophiocomid brittlestars. Mol. Phylogenet. Evol. 130, 67–80. doi: 10.1016/j.ympev.2018.10.003
O’Hara T. D., Hugall A. F., Stöhr S., Thuy B., Martynov A. (2018). Morphological diagnoses of higher taxa in Ophiuroidea (Echinodermata) in support of a new classification. Eur. J. Taxonomy 416, 1–46. doi: 10.5852/ejt.2018.416
O’Hara T. D., Hugall A., Thuy B., Moussalli A. (2014). Phylogenomic resolution of the class ophiuroidea unlocks a global microfossil record. Curr. Biol. 24, 1874–1879. doi: 10.1016/j.cub.2014.06.060
O’Hara T. D., Hugall A. F., Thuy B., Stöhr S., Martynov A. V. (2017). Restructuring higher taxonomy using broad-scale phylogenomics : The living Ophiuroidea. Mol. Phylogenet. Evol. 107, 415–430. doi: 10.1016/j.ympev.2016.12.006
O’Hara T. D., Rowden A. A., Bax N. J. (2011). A southern hemisphere bathyal fauna is distributed in latitudinal bands. Curr. Biol. 21, 226–230. doi: 10.1016/j.cub.2011.01.002
O’Hara T. D., Stöhr S. (2006). “Deep water ophiuroidea (Echinodermata) of New Caledonia: ophiacanthidae and hemieuryalidae,” in Tropical Deep-Sea Benthos, volume 24. Mémoires du Muséum national d’Histoire naturelle, vol. 193 . Eds. Richer De Forges B., Justine J.-L.(Paris: Muséum national d'Histoire naturelle), 33–141.
Okanishi M. (2016). “Ophiuroidea (Echinodermata): systematics and Japanese fauna,” in Species diversity of animals in Japan. Eds. Motokawa M., Kajihara H. (Springer, Japan, Tokyo), 651–678.
Okanishi M., Fujita T. (2013). Molecular phylogeny based on increased number of species and genes revealed more robust family-level systematics of the order euryalida (echinodermata: ophiuroidea). Mol. Phylogenet. Evol. 69, 566–580. doi: 10.1016/j.ympev.2013.07.021
Osigus H. J., Eitel M., Bernt M., Donath A., Schierwater B. (2013). Mitogenomics at the base of Metazoa. Mol. Phylogenet. Evol. 69, 339–351. doi: 10.1016/j.ympev.2013.07.016
Palumbi S. R., Martin A., Romano S., Mcmillan W. O., Stice L., Grabowsky G. (1991). A simple fool’s guide to PCR (Honolulu, HI, USA: University of Hawaii Press).
Perna N. T., Kocher T. D. (1995). Patterns of nucleotide composition at fourfold degenerate sites of animal mitochondrial genomes. J. Mol. evolution. 41, 353–358. doi: 10.1007/BF01215182
Perseke M., Bernhard D., Fritzsch G., Brümmer F., Stadler P. F., Schlegel M. (2010). Mitochondrial genome evolution in Ophiuroidea, Echinoidea, and Holothuroidea: insights in phylogenetic relationships of Echinodermata. Mol. Phylogenet. Evol. 56, 201–211. doi: 10.1016/j.ympev.2010.01.035
Qi Y., Zhong Z., Liu X., He X., Zhou Y., Zhang L., et al. (2024). Phylogenomic analyses reveal a single deep-water colonisation in Patellogastropoda. Mol. Phylogenet. Evolution. 190, 107968. doi: 10.1016/j.ympev.2023.107968
Rawlings T. A., MacInnis M. J., Bieler R., Boore J. L., Collins T. M. (2010). Sessile snails, dynamic genomes: gene rearrangements within the mitochondrial genome of a family of caenogastropod molluscs. BMC Genom. 11, 440. doi: 10.1186/1471-2164-11-440
Ronquist F., Huelsenbeck J. P. (2003). MrBayes 3: Byesian phylogenetic inference under mixed models. Bioinformatics. 19, 1572–1574. doi: 10.1093/bioinformatics/btg180
Rota-Stabelli O., Lartillot N., Philippe H., Pisani D. (2013). Serine codon-usage bias in deep phylogenomics: pancrustacean relationships as a case study. Systematic Biol. 62, 121–133. doi: 10.1093/sysbio/sys077
Scouras A., Beckenbach K., Arndt A., Smith M. J. (2004). Complete mitochondrial genome DNA sequence for two ophiuroids and a holothuroid: the utility of protein gene sequence and gene maps in the analyses of deep deuterostome phylogeny. Mol. Phylogenet. Evol. 31, 50–65. doi: 10.1016/j.ympev.2003.07.005
Scouras A., Smith M. J. (2001). A novel mitochondrial gene order in the crinoid echinoderm Florometra serratissima. Mol. Biol. Evol. 18, 61–73. doi: 10.1093/oxfordjournals.molbev.a003720
Shao R., Dowton M., Murrell A., Barker S. C. (2003). Rates of gene rearrangement and nucleotide substitution are correlated in the mitochondrial genomes of insects. Mol. Biol. Evol. 20, 1612–1619. doi: 10.1093/molbev/msg176
Silvestro D., Michalak I. (2012). raxmlGUI: a graphical front-end for RAxML. Organisms Diversity Evolution. 12, 335–337. doi: 10.1007/s13127-011-0056-0
Smith A. B., Paterson G. L. J., Lafay B. (1995). Ophiuroid phylogeny and higher taxonomy: morphological, molecular and palaeontological perspectives. Zool. J. Linn. Soc 114, 213–243. doi: 10.1006/zjls.1995.0024
Stach T., Braband A., Podsiadlowski L. (2010). Erosion of phylogenetic signal in tunicate mitochondrial genomes on different levels of analysis. Mol. Phylogenet. Evol. 55, 860–870. doi: 10.1016/j.ympev.2010.03.011
Stöhr S., O’ Hara T. D., Thuy B. (2012). Global diversity of brittle stars (Echinodermata: Ophiuroidea). PloS One 7, e31940. doi: 10.1371/journal.pone.0031940
Sun S. E., Xiao N., Sha Z. (2022). Mitogenomics provides new insights into the phylogenetic relationships and evolutionary history of deep-sea sea stars (Asteroidea). Sci. Rep. 12, 4656. doi: 10.1038/s41598-022-08644-9
Sun S. E., Xiao N., Sha Z. (2023). Mitogenomes provide insights into the phylogeny and evolution of brittle stars (Echinodermata, Ophiuroidea). Zoologica Scripta. 52, 17–30. doi: 10.1111/zsc.12576
Sun X., Yu D., Xie Z., Dong J., Ding Y., Yao H., et al. (2020). Phylomitogenomic analyses on collembolan higher taxa with enhanced taxon sampling and discussion on method selection. PloS One 15, e0230827. doi: 10.1371/journal.pone.0230827
Tan M. H., Gan H. M., Lee Y. P., Linton S., Grandjean F., Bartholomei-Santos M. L., et al. (2018). ORDER within the chaos: Insights into phylogenetic relationships within the Anomura (Crustacea: Decapoda) from mitochondrial sequences and gene order rearrangements. Mol. Phylogenet. Evolution. 127, 320–331. doi: 10.1016/j.ympev.2018.05.015
Thuy B. (2013). Temporary expansion to shelf depths rather than an onshore-offshore trend: the shallow-water rise and demise of the modern deep-sea brittle star family Ophiacanthidae (Echinodermata: Ophiuroidea). Eur. J. Taxonomy. 48, 1–242. doi: 10.5852/ejt.2013.48
Thuy B., Stöhr S. (2016). A new morphological phylogeny of the Ophiuroidea (Echinodermata) accords with molecular evidence and renders microfossils accessible for cladistics. PloS One 11, e0156140. doi: 10.1371/journal.pone.0156140
Townsend J. P., López-Giráldez F., Friedman R. (2008). The phylogenetic informativeness of nucleotide and amino acid sequences for reconstructing the vertebrate tree. J. Mol. Evolution. 67, 437–447. doi: 10.1007/s00239-008-9142-0
Xu W., Jameson D., Tang B., Higgs P. G. (2006). The relationship between the rate of molecular evolution and the rate of genome rearrangement in animal mitochondrial genomes. J. Mol. evolution. 63, 375–392. doi: 10.1007/s00239-005-0246-5
Yang Z. (1998). Likelihood ratio tests for detecting positive selection and application to primate lysozyme evolution. Mol. Biol. Evol. 15, 568–573. doi: 10.1093/oxfordjournals.molbev.a025957
Yang Z. (2007). PAML 4: a program package for phylogenetic analysis by maximum likelihood. Mol. Biol. Evol. 24, 1586–1591. doi: 10.1093/molbev/msm088
Yang X., Cameron S. L., Lees D. C., Xue D., Han H. (2015). A mitochondrial genome phylogeny of owlet moths (Lepidoptera: Noctuoidea), and examination of the utility of mitochondrial genomes for lepidopteran phylogenetics. Mol. Phylogenet. evolution. 85, 230–237. doi: 10.1016/j.ympev.2015.02.005
Yang Z., Wong W. S., Nielsen R. (2005). Bayes empirical Bayes inference of amino acid sites under positive selection. Mol. Biol. Evol. 22, 1107–1118. doi: 10.1093/molbev/msi097
Zhang J., Nielsen R., Yang Z. (2005). Evaluation of an improved branch-site likelihood method for detecting positive selection at the molecular level. Mol. Biol. Evol. 22, 2472–2479. doi: 10.1093/molbev/msi237
Zhang D., Zhou Y., Yang J., Linley T. D., Zhang R., Lu B., et al. (2021). Megafaunal community structure from the abyssal to hadal zone in the Yap Trench. Front. Mar. Sci. 8, 617820. doi: 10.3389/fmars.2021.617820
Zhou X., Shen X. X., Hittinger C. T., Rokas A. (2018). Evaluating fast maximum likelihood-based phylogenetic programs using empirical phylogenomic data sets. Mol. Biol. Evol. 35, 486–503. doi: 10.1093/molbev/msx302
Keywords: Ophiuroidea, mitochondrial genome, phylogeny, gene rearrangement, positive selection
Citation: Na J, Zhou Y, Cheng H, Zhang R, Shen C, Lu B, Wang C and Zhang D (2024) Phylogenetic relationships and lineage-specific mitochondrial gene rearrangement in Ophiuroidea: insights from mitochondrial genomes. Front. Mar. Sci. 11:1425922. doi: 10.3389/fmars.2024.1425922
Received: 30 April 2024; Accepted: 25 July 2024;
Published: 14 August 2024.
Edited by:
Yanjie Zhang, Hainan University, ChinaCopyright © 2024 Na, Zhou, Cheng, Zhang, Shen, Lu, Wang and Zhang. This is an open-access article distributed under the terms of the Creative Commons Attribution License (CC BY). The use, distribution or reproduction in other forums is permitted, provided the original author(s) and the copyright owner(s) are credited and that the original publication in this journal is cited, in accordance with accepted academic practice. No use, distribution or reproduction is permitted which does not comply with these terms.
*Correspondence: Chunsheng Wang, d2FuZ3Npb0BzaW8ub3JnLmNu; Dongsheng Zhang, ZHN6aGFuZ0BzaW8ub3JnLmNu