 Bryanna A. H. Sherbo
 Amanda M. Belanger
 Bertrand Charry
 Cortney A. Watt
94% of researchers rate our articles as excellent or good
Learn more about the work of our research integrity team to safeguard the quality of each article we publish.
Find out more
ORIGINAL RESEARCH article
Front. Mar. Sci., 13 September 2024
Sec. Marine Megafauna
Volume 11 - 2024 | https://doi.org/10.3389/fmars.2024.1422907
The Cumberland Sound beluga whale (Delphinapterus leucas) population inhabits Cumberland Sound on the southeast side of Baffin Island, Nunavut. The population is listed as threatened under the Species at Risk Act. The last abundance estimate from an aerial survey was estimated at 1,381 (95% CI: 1,270-1,502) beluga whales in 2017 for an area covering 12,485 km2. Since then, satellite imagery has been used as a remotely based non-invasive method to monitor these whales. Very High Resolution (VHR) satellite imagery covering 9,690 km² of water was collected from Cumberland Sound from August 30 to September 7, 2021, during the ice free season. Readers with previous imagery analysis experience analyzed the images and identified 704 certain detections. Abundance estimates were corrected for availability bias for whales that were too deep to be detected in the imagery (>2m). We present a total estimate of 1,690 (CV = 0.16; 95% CI: 1,241-2,301) beluga whales in Cumberland Sound (22,663 km2). This estimate covers a larger area and estimates a higher abundance than the 2017 aerial survey. Regular population abundance assessments are essential for understanding population dynamics and trends and we have shown here that satellite imagery is a comparable method to aerial surveys for estimating abundance.
Population abundance and distribution assessments are essential for sustainable management (Fryxell et al., 2014). Traditionally, abundance estimates for marine mammals have been conducted by boat-based or fixed-wing aircraft aerial surveys (Richard and Stewart, 2009; Williams et al., 2017). These surveys are logistically challenging in remote areas in the Canadian Arctic, as they require a large team of people and have the potential to disturb marine mammals (Patenaude et al., 2002). Aerial surveys can pose risks to field personnel associated with flying in the Arctic including landings in remote locations, changes in elevation, and potential rapid changes in weather (e.g., fog). Improvements in spatial resolution of satellite imagery have promoted its use as a completely non-invasive and completely safe method for assessing animal abundance and distribution (Belanger et al., 2024; Fretwell et al., 2012; Sherbo et al., 2023). Very High Resolution (VHR) satellite imagery with submeter spatial resolution has allowed for expanded applications to studies of marine mammals (Fretwell et al., 2019; LaRue and Stapleton, 2018), including large whales such as fin (Balaenoptera physalus), gray (Eschrichtius robustus), humpback (Megaptera novaeangliae), southern right (Eubalaena australis) (Cubaynes et al., 2019), and mid-sized whales such as beluga (Delphinapterus leucas) (Belanger et al., 2024; Charry et al., 2021; Watt et al., 2023). Satellite imagery offers a unique alternative to boat-based or aerial surveys that does not alter whale behavior (Charry et al., 2021; Martin et al., 2023; Miller and D’Sa, 2005; Patenaude et al., 2002).
Using satellite imagery to monitor abundance is advantageous as images covering a large area can be collected simultaneously (<30 seconds). This is beneficial as traditional systematic aerial surveys are conducted following transects (zig zag or parallel) within divided strata, and whales can potentially move from one transect to the next. This can result in whales being surveyed multiple times, or alternatively, whales can move out of the transect line-of-sight (Doniol-Valcroze et al., 2015). Distance sampling methods assume random movement of whales and strive to survey strata in a short time frame; however, with fluctuations in weather (wind, sun glare, cloud) this is not always possible. Additionally, whale movement may be directional or synchronized and not random (Senigaglia et al., 2012; Storrie et al., 2023). Directional movement is especially common in areas with tidal fluctuations, as beluga whales may move in and out of areas in response to tidal currents (Ezer et al., 2008; Smith et al., 2017; Smith and Martin, 1994).
The Cumberland Sound beluga whale population inhabits Cumberland Sound located on the southeast side of Baffin Island, Nunavut (Richard and Stewart, 2009) (Figure 1). This beluga whale population is considered a separate management stock listed as endangered by the Committee on the Status of Endangered Wildlife in Canada and threatened by Species at Risk (COSEWIC, 2021; SARA, 2023). The historical pre-commercial whaling population was estimated at 5,147 (95% CI: 1,667-8,779) beluga whales, based on available catch information (Biddlecombe and Watt, 2022; DFO, 2005). Since the 1920s, the number of Cumberland Sound beluga whales was depleted to less than 1,000 individuals as a result of commercial whaling by the Hudson Bay Company until 1939 (Brodie et al., 1981; Richard, 2013). In 2017 the population was estimated at 1,381 (95% CI: 1,270-1,502) individuals from an aerial survey (Watt et al., 2021b). Using a Bayesian stock production model, which accounted for environmental covariates, the estimated abundance in 2018 was 1,245 (95% CI: 564-2,715) whales (Biddlecombe and Watt, 2022). The Cumberland Sound beluga whale population is hunted for subsistence by Inuit in Canada (Watt et al., 2021a). The subsistence hunt by the community of Pangnirtung, Nunavut has been regulated since the 1980s with the current quota being 41 beluga whales per year (DFO, 2005; Watt, 2021). Watt et al. (2021a) modelled the beluga whale population to assess stock decline, and the model estimated a 96% probability of decline in 10 years with the current annual quota; the population has continued to decline since the quota was established (Watt et al., 2021a). Regular population abundance assessments are essential for monitoring population dynamics and trends especially for this endangered population (COSEWIC, 2021).
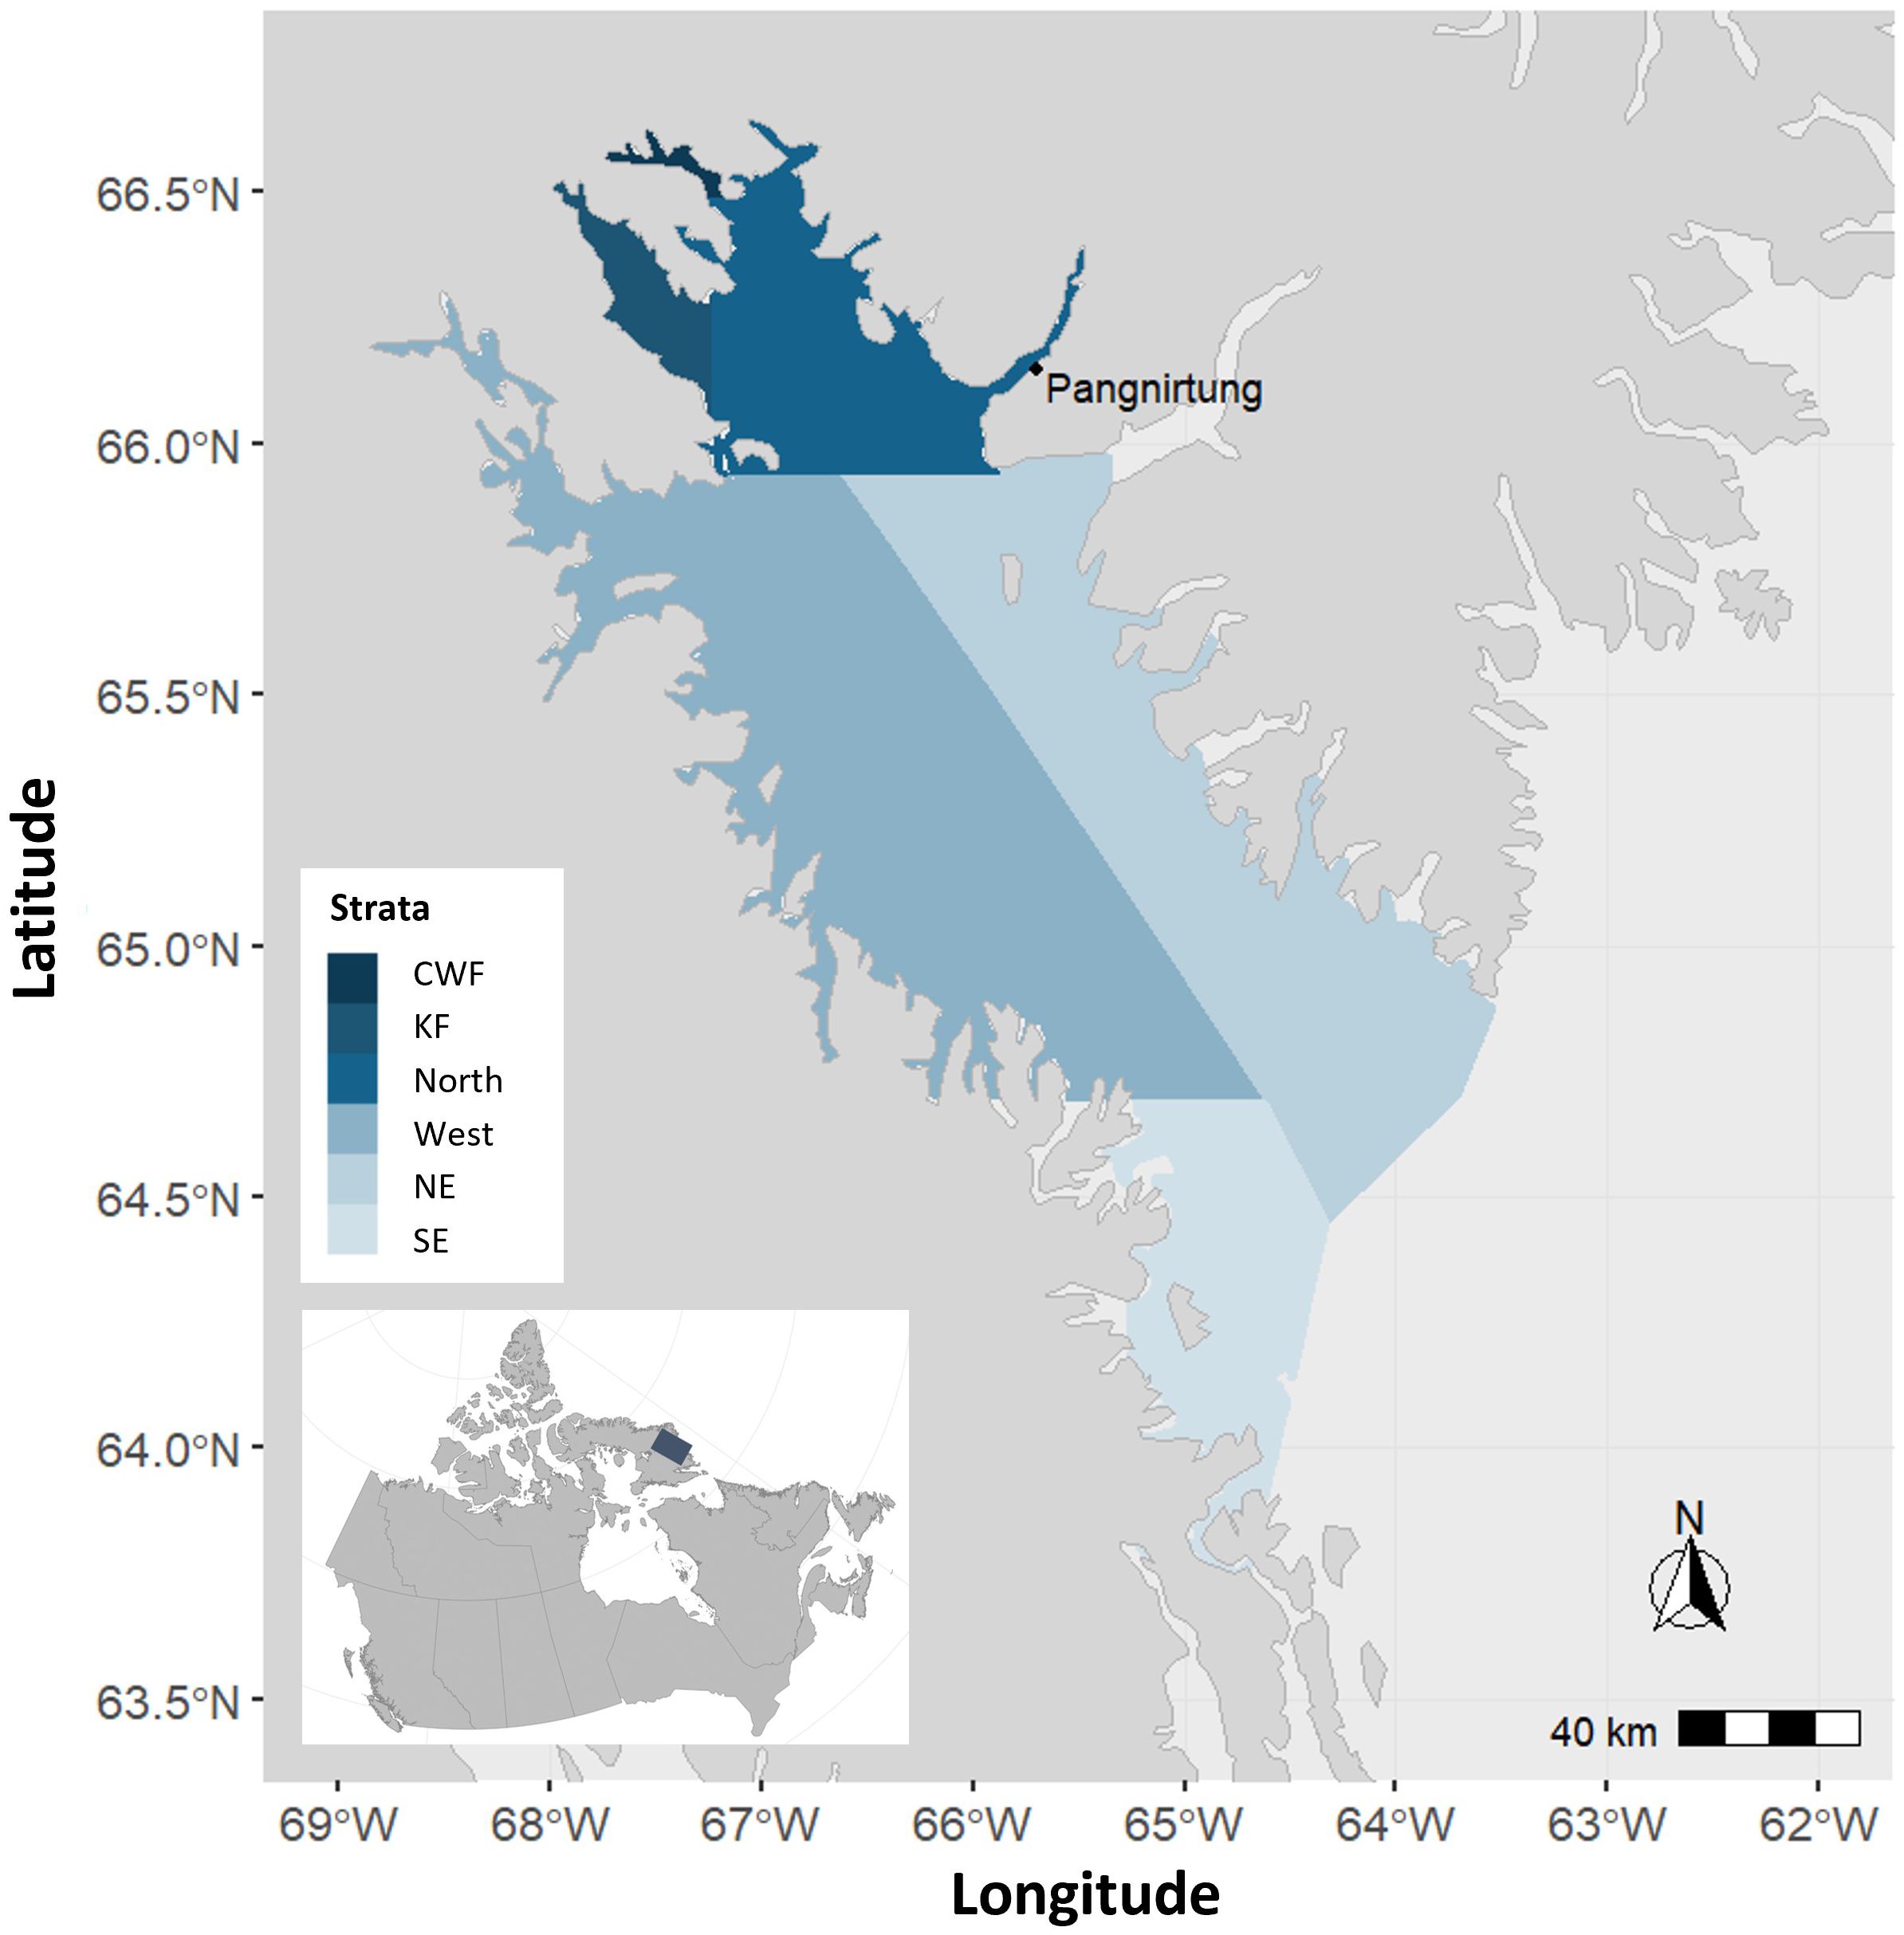
Figure 1. Map of Cumberland Sound located on south Baffin Island in Canada with six strata identified [Clearwater Fiord (CWF), Kangilo Fiord (KF), North, West, Northeast (NE), and Southeast (SE)]. Strata correspond to areas with similar expected whale density based on previous aerial surveys.
The objectives of this study were to estimate abundance of the Cumberland Sound beluga whale population in 2021 using VHR satellite imagery data and to compare the satellite and aerial survey estimates. This is the first study to determine an abundance estimate for the Cumberland Sound beluga whale population (although see Belanger et al. (2024) for an estuary specific estimate) only using VHR satellite imagery data.
Satellite imagery for this study was acquired by the WorldView constellation satellite series (WV1, WV2, and WV3), VHR commercial Earth observing system owned and operated by Maxar Technologies Inc. The WorldView satellites take images of the Earth at an altitude of 496-770 km in a sun-synchronous orbit passing over the Canadian Arctic between 10:30-14:00 UTC-6. The satellite images had 31-50 cm resolution at an average 15° off-nadir viewing angle, an orientation angle of 0°, maximum sun elevation angle of 33°, and maximum sun azimuth angle of 184°. Images were collected from August 29 to September 7, 2021. For each date, satellite images were taken in strips within 30 seconds, to cover the area of interest. For analysis, we selected either the right or left side consistently across all strips per date, whichever had the most overall whales detected (either all left or all right). Overlap in images was systematically removed to avoid duplication in counts.
Satellites were tasked to collect images of Cumberland Sound in 2021 during the relatively ice free season (July-September), when whales are known to aggregate in the Sound and previous aerial surveys have been conducted. Panchromatic (black and white) images covering a total ocean area of 9,690 km² were acquired from areas where beluga whales were previously observed in Cumberland Sound. Prior knowledge of summer distribution was used to determine areas of interest and dominant species in the area, which aided in the delineation of strata. Cumberland Sound was separated into six strata Clearwater Fiord (CWF), Kangilo Fiord (KF), North, West, Northeast (NE), and Southeast (SE) (Figures 1, 2). Each strata corresponded to areas with similar expected whale density and based on previous aerial surveys [Clearwater Fiord (CWF), Kangilo Fiord (KF), North, and West strata (Watt et al., 2021a)]. In areas with unknown whale density, strata were defined based on Inuit Qaujimajatuqangit (a form of Inuit Knowledge) from the Pangnirtung Hunters and Trappers Association. They advised that more whales can be found along the southern rather than northern portion of Cumberland Sound; therefore Southeast and Northeast were identified as two separate strata.
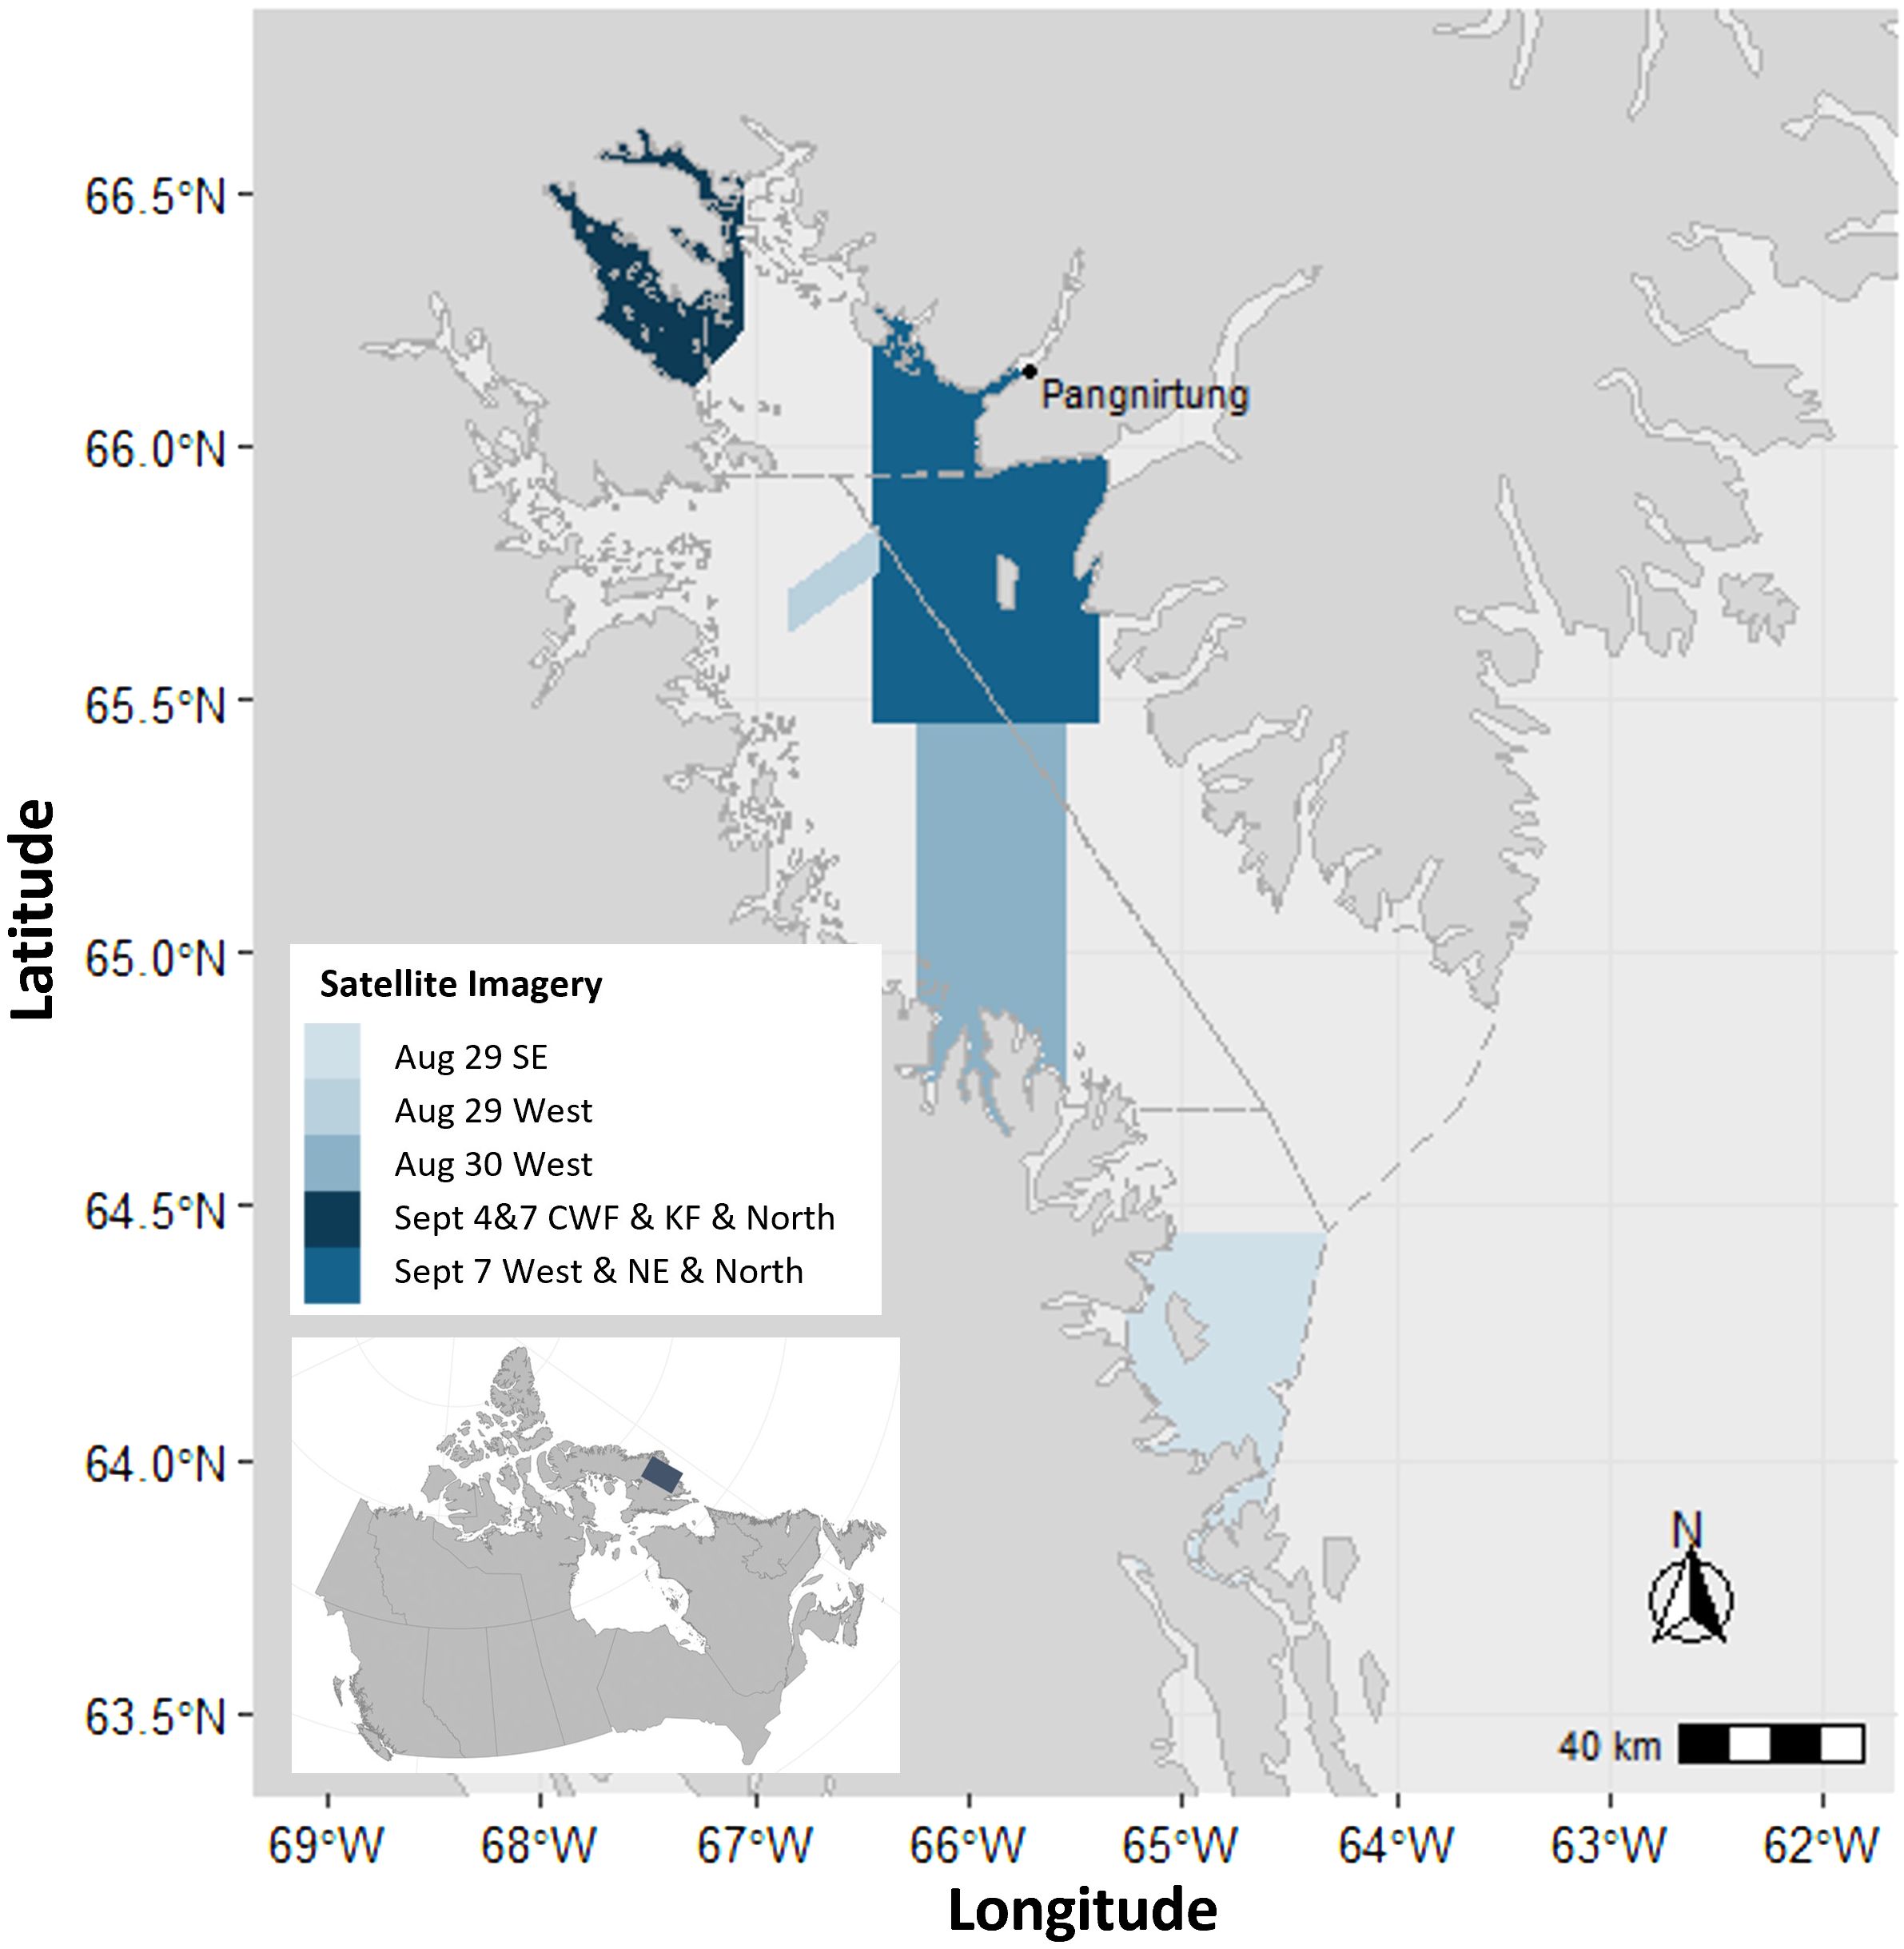
Figure 2. Map of areas where satellite imagery was collected from August 29 to September 7, 2021 in Cumberland Sound with strata outlines overlayed in grey. Population estimates were scaled up from satellite images to the entire strata.
The VHR satellite images were read independently by six experienced readers from WhaleSeeker and Fisheries and Oceans Canada (DFO) using ArcMap 10.8.1 (ESRI Inc., Redlands, CA, USA) and QGIS 3.28.6 software with the ESPG: 3573 WGS 84 projection for analysis. The workload was spread out across all six readers, with two as primary readers (BAHS and BC). Each panchromatic image was read and tagged with features of interest (i.e., beluga whales). To facilitate systematic annotation, a grid was overlaid, ensuring methodical scanning of the entire image. The images were scanned from left to right at a scale less than 1:800. Potential detections were identified and precisely located using a point geometry layer shapefile, each assigned a confidence level in identifying the object of interest. Features were identified by their beluga-like color, torpedo shape, and size between 1.5 to 4.5 m in length and sometimes with an evident fluke (Figure 3). Each feature was scored using a confidence rating of “uncertain” or “certain” (Belanger et al., 2024; Charry et al., 2021). Confident, termed “certain” whales from here on, were made based on known formations and group patterns and had the right shape and size. Not confident, termed “uncertain” whales from here on, were not observed in formations or group patterns but still had the approximate shape and size of a beluga whale and usually consisted of features under the surface where the whole body was not visible. Readers also used contextual cues while determining confidence, including the close proximity of an uncertain detection to a group of certain detections, which increased confidence. Most whales were swimming in groups and some whales such as those under the surface or smaller potentially younger individuals, were identified due to their close proximity to other whales. To further enhance confidence levels, readers used the measuring tool within ArcMap and QGIS to confirm if an observation matched the approximate size of a beluga whale, thus eliminating potential confusion with seals and ice.
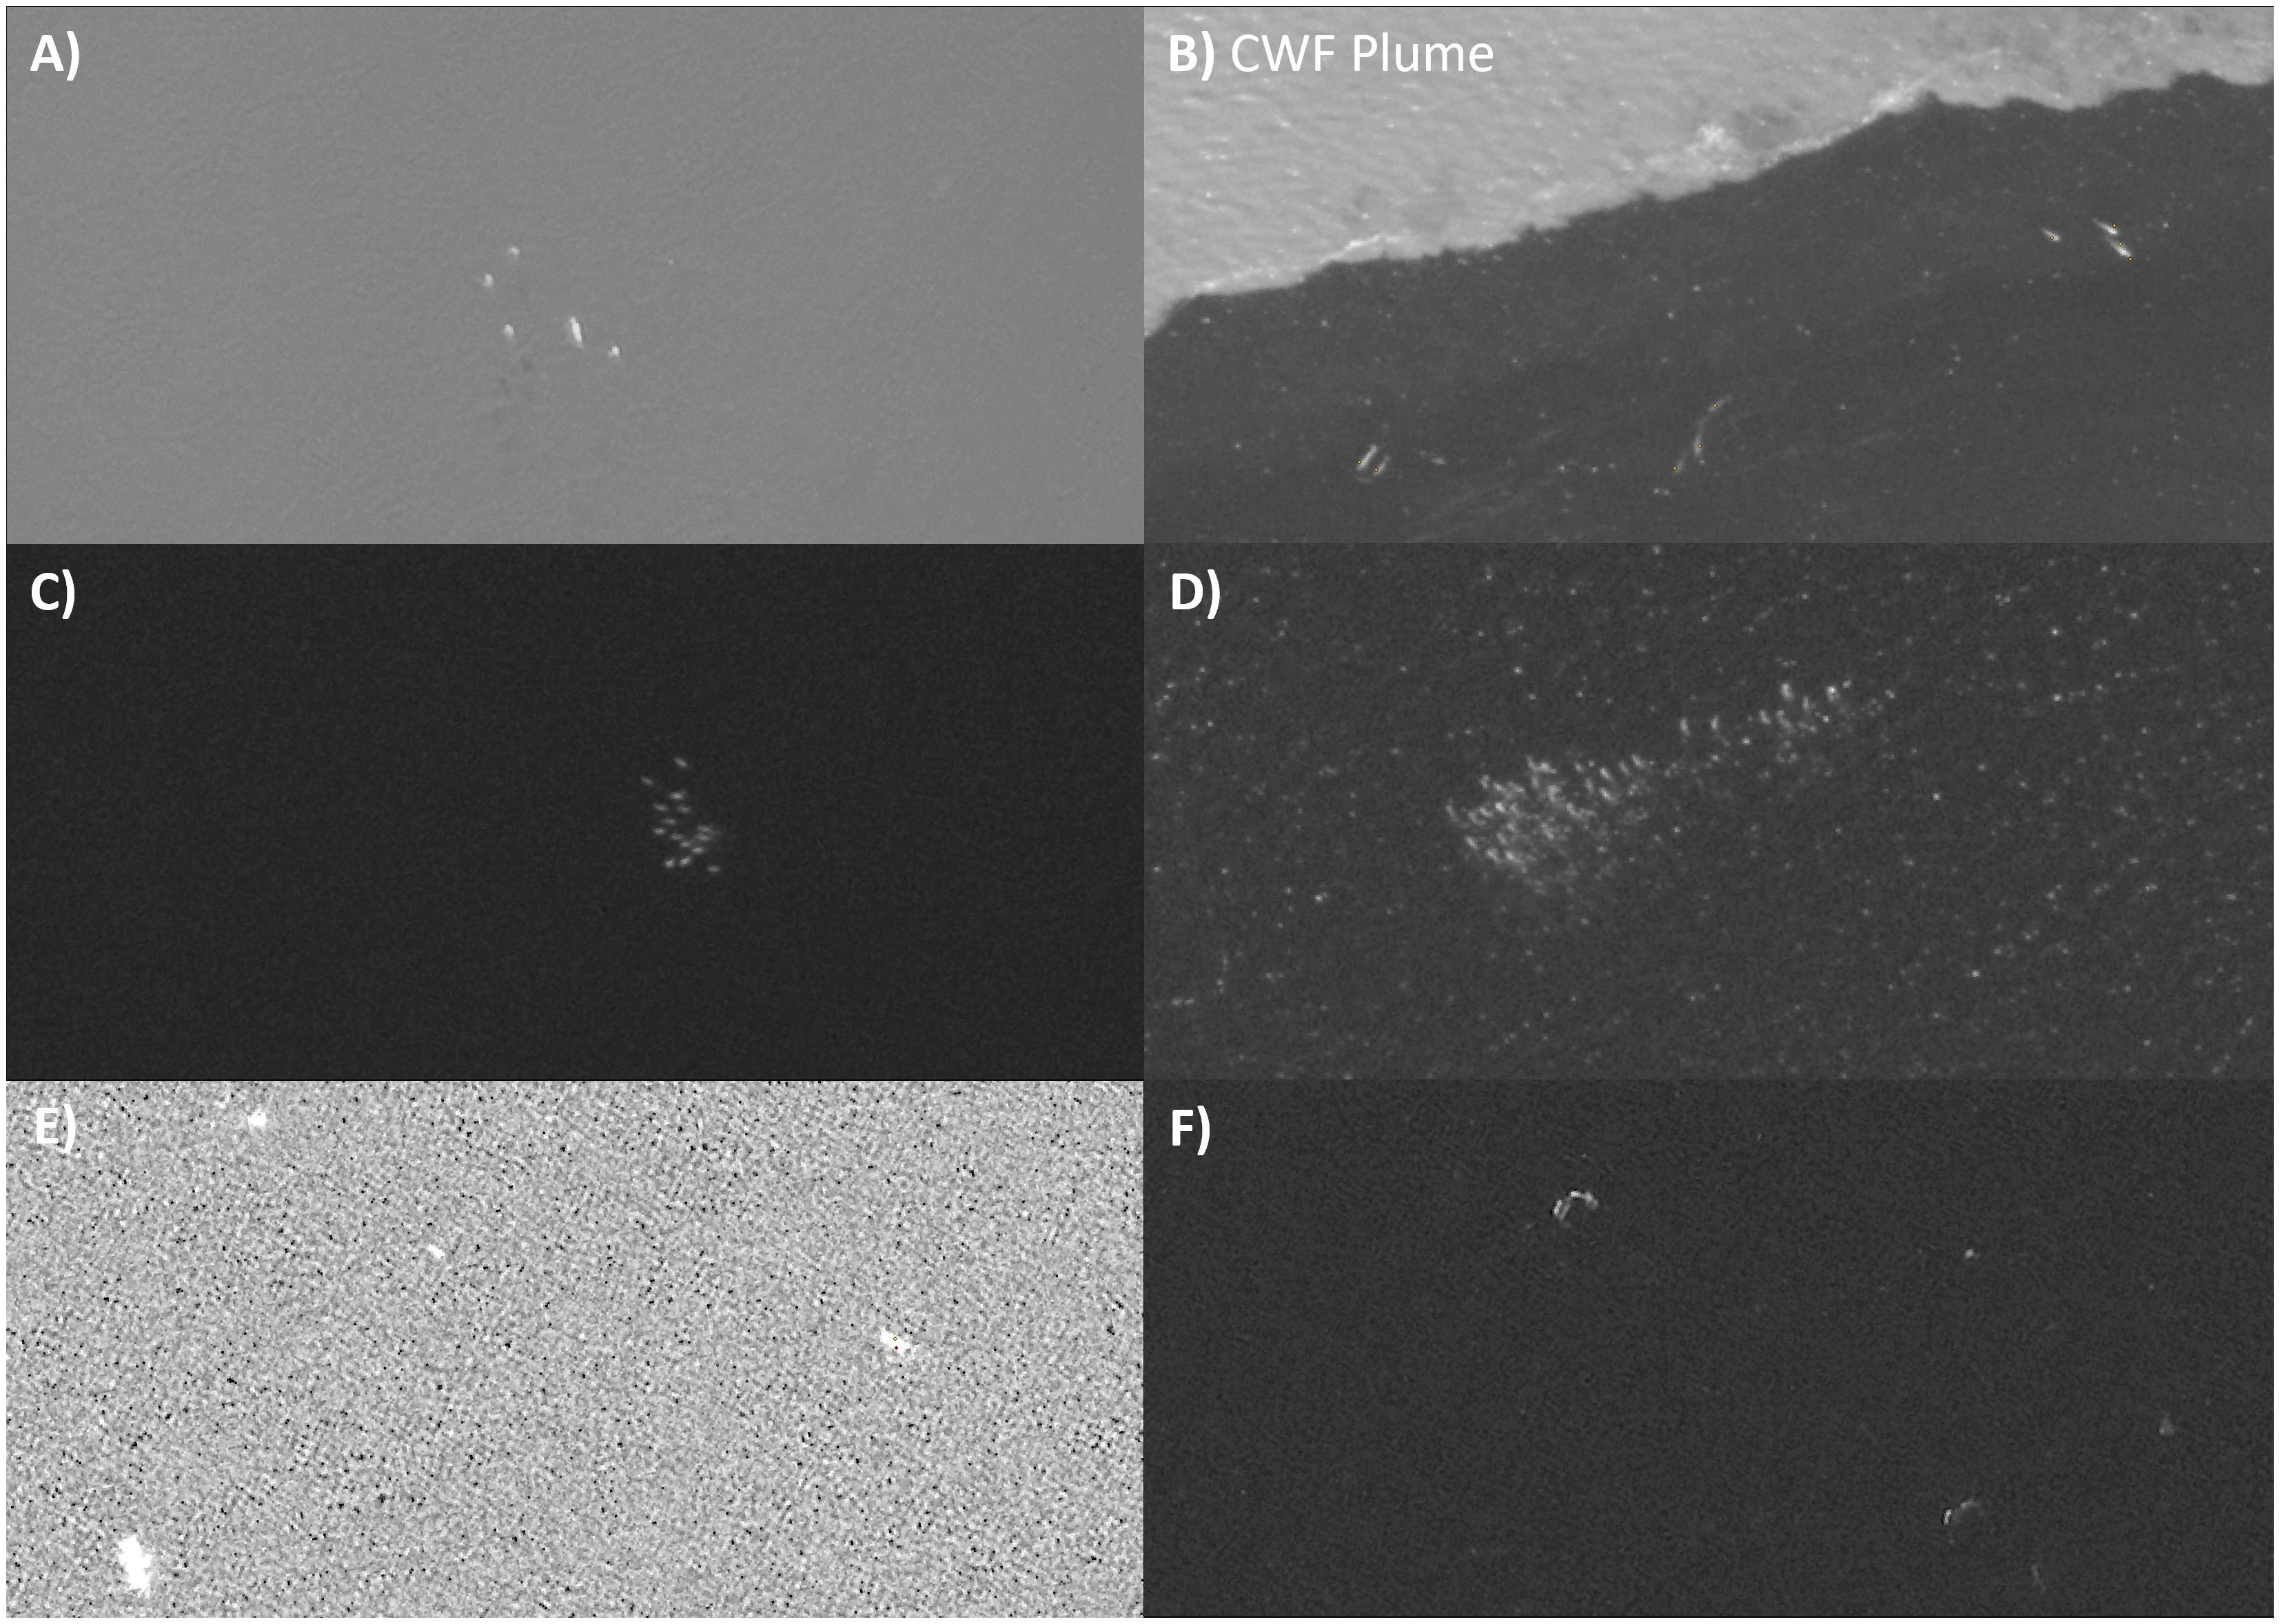
Figure 3. Panchromatic VHR satellite images from (A) September 4, Clearwater Fiord plume, 5 certain detections; (B) September 7, Clearwater Fiord plume and estuary, 8 certain detections; (C) August 29, Southeast, 15 certain detections; (D) September 7, Kangilo Fiord, 0 whale detections, 34 harp seals; (E) August 29, West, 2 certain detections; (F) August 30, Northeast, 2 uncertain detections (republished under an end user license agreement with Maxar Technologies, original copyright 2021).
Following the initial assessment, a quality control process was implemented where each reader re-reviewed >10% of the images they analyzed to ensure features were not missed. We did not find any variation on the number of targets of interest between the initial reading and after the re-reading of 10% of the images. Subsequently, the two primary readers who have years of experience reading imagery went through all detections, indicating agreement or disagreement. Disagreed detections were discussed by the two primary readers until a consensus on the classification (“certain”, “uncertain”, or not a feature of interest) was reached. The final counts were based on the consensus of the primary readers, ensuring a conservative, rigorous, and reliable assessment. In addition to feature detection, cloud cover and Beaufort Sea State (BSS) was documented (sun glare was assessed but not observed in any images). BSS was assessed for each image on the Beaufort Scale (standard scale 1-12) based on direct observation (Abbe, 1914). Beaufort 0 indicated no observed ripples, 1 referred to some observed ripples, 2 indicated stronger ripples/wavelengths, 3 was determined by occasional whitecaps, and 4 had frequent whitecaps. Swell was excluded from the decision-making process as it could not be assessed from the images.
Other satellite imagery studies detecting large whales have documented whale detections in three classes “definite”, “probable”, or “possible” (Bamford et al., 2020; Cubaynes et al., 2019), using a combination of body morphology and surface disturbance to aid with cetacean species identification. However, in this study where beluga whales were the dominant species, methods specific to beluga whales using two classes of “certain” and “uncertain” were implemented (Charry et al., 2021).
Abundance estimates were calculated from confident features for each date that imagery was acquired. Whale density was determined for each date and strata by dividing counts by the area surveyed. Imagery for all stratum covered >43%, with 100% of CWF and KF imaged. Whale densities were then multiplied by the total area of the strata with <100% coverage to achieve a surface count for all of Cumberland Sound (Equation 1).
Surface counts (Ns) were adjusted for whales too deep to be detected in imagery, known as availability bias (Ca). Stewart et al. (2024) determined that beluga whales are visible in clear water up to 2 m deep in VHR satellite imagery, and only at the surface in turbid water. Surface counts were adjusted for availability bias calculated using dive data collected in 2006 from satellite tags in CWF using Equation 2 (Orr et al., 2001; Richard and Stewart, 2008; Watt et al., 2021a). Availability bias adjustment factors were used for clear water representing time above 2 m of depth (Ca= 2.06, CV= 0.056) and turbid waters representing time at the surface (Ca= 4.46, CV= 0.117) (Belanger et al., 2024; Watt et al., 2021b). All areas were considered clear water (as in previous aerial surveys), except the small estuary plume in CWF on September 4 and 7. No specific data was collected to quantify water clarity (i.e., secchi depth) corresponding to imagery, and the September 4 plume does not exhibit the same turbidity as September 7. However, the area of the plume was determined in satellite imagery for both dates and the time at surface adjustment was only used for detections within the plume (Figure 4). Previous secchi depth measurements estimated visibility within the plume to 0.12 m and outside the plume >1.13 m (DFO, unpublished data); therefore, it is reasonable to assume only beluga whales at the surface (<1 m) would be detected within the plume.
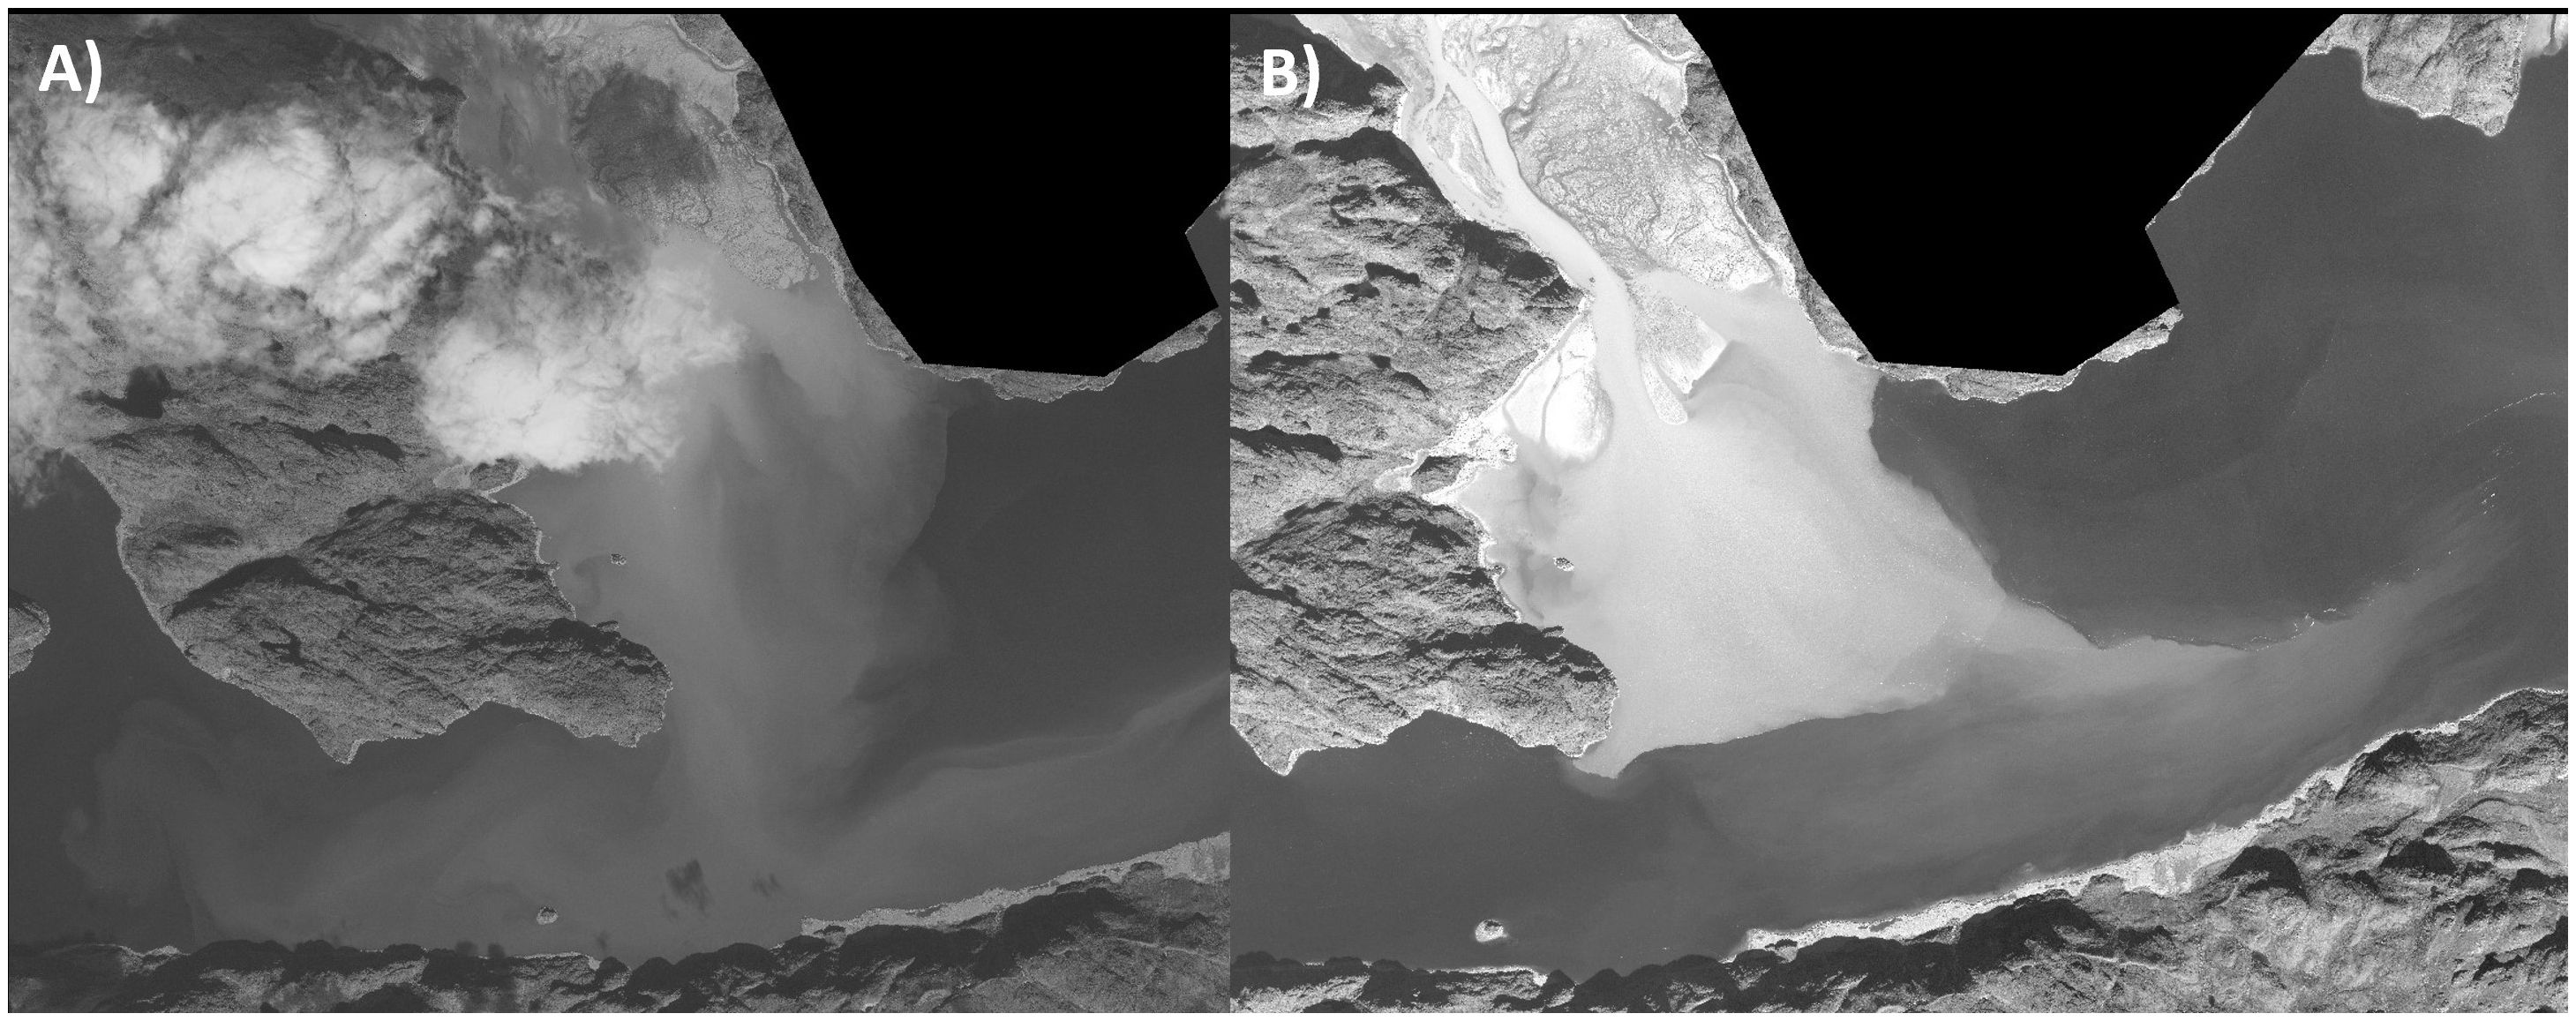
Figure 4. Estuary plume in Clearwater Fiord on (A) September 4 and (B) September 7 (republished under an end user license agreement with Maxar Technologies, original copyright 2021). These tiles were extracted from WV2 and WV3 satellite images with 46 cm (A) and 31 cm (B) resolution.
The adjusted estimates were calculated using methods specific to Cumberland Sound beluga whales in satellite imagery described in Belanger et al. (2024). Equations 2, 3, 5 below were used in Belanger et al. (2024) and in the present study. Surface counts were calculated for strata with less than 100% coverage using the density (certain detections divided by imaged area) of whales within the imaged area, multiplied by the strata area (Equation 1).
Corrected estimates for each individual date were obtained using Equation 2, where surface counts were multiplied by correction factors to adjust for availability bias.
CWF and KF strata had 100% coverage and therefore the availability bias is the only possible variance. Strata without total coverage had counts extrapolated to the entire strata (Equation 1). However, there is no additional variance within the analyzed images and therefore no variance to extrapolate. To account for the missing variance for extrapolation, we obtained variance estimates from aerial surveys conducted in 2014 and 2017 across the North and West strata (presented in Marcoux et al., 2016, and Watt et al., 2021b). We applied those variance estimates ( to our North and West strata (see Supplementary Material A). For strata NE and SE, we applied an average variance from the North and West strata. While this is an assumed variance based on previous surveys, including it is more representative of the uncertainty of our abundance estimates than ignoring this component of variance that we are not able to calculate within our own survey. The final abundance estimate (NC) had an associated variance from the availability bias () and extrapolated variance from previous aerial surveys (.
The final abundance variance () was calculated using the delta method (Buckland et al., 2001) in Equation 3.
For strata with multiple image dates, corrected estimates were calculated using a weighted average based on variance using Equation 4.
Confidence intervals (CI) were calculated using Equation 5, following Buckland et al. (2001).
Where
We identified 704 certain and 1,438 uncertain beluga whales in 9,690 km² of VHR satellite imagery from August 29 to September 7, 2021 (Table 1). Most whales were observed on September 4 (n=264) followed by September 7 (n=198); both of these days include imagery in CWF which is known to provide important habitat for beluga whales (Belanger et al., 2024).
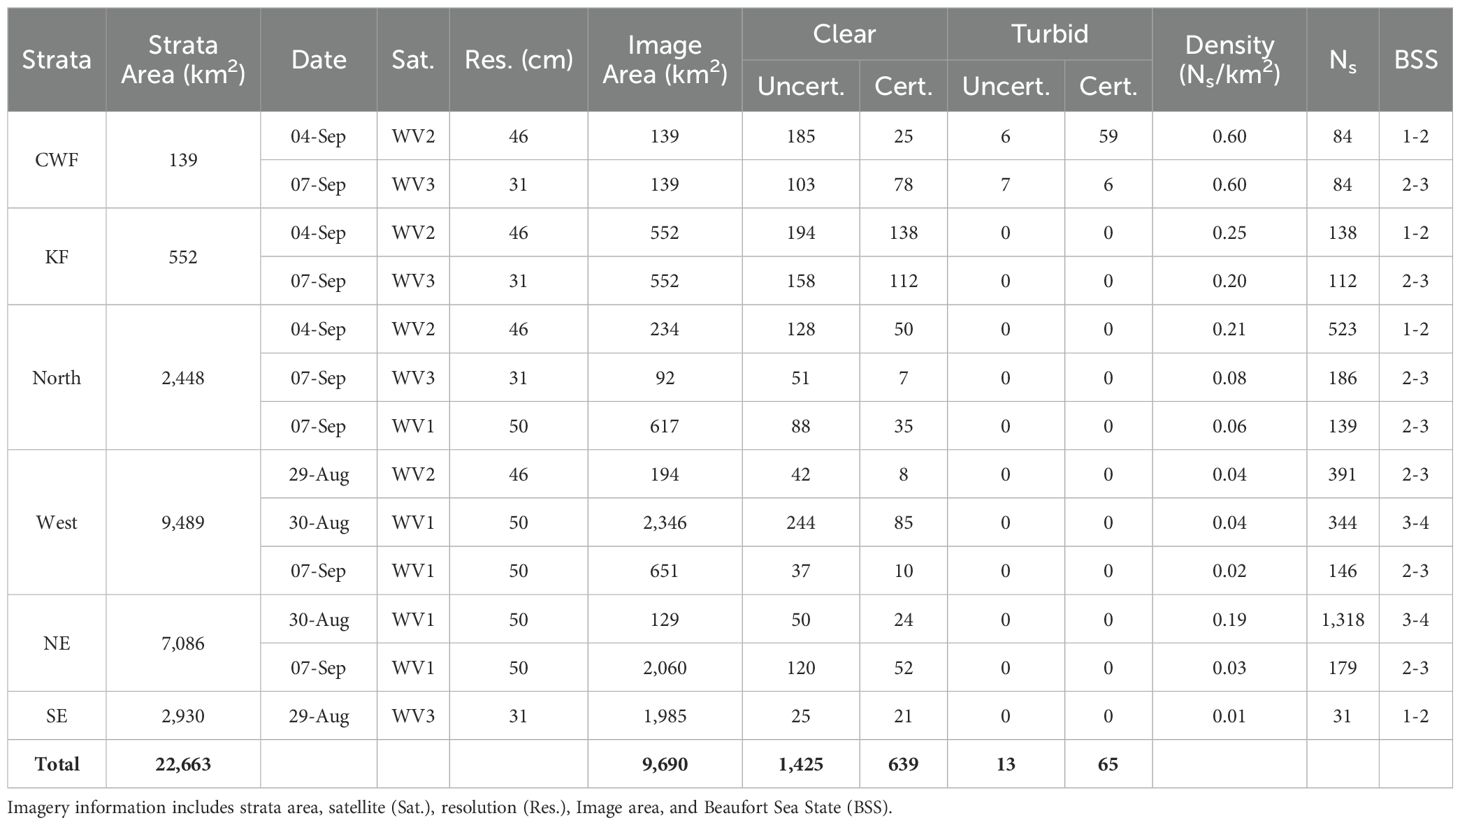
Table 1. Certain (cert.) and uncertain (uncert.) beluga whale detections, whale density, and surface counts (Ns) in VHR satellite imagery from Cumberland Sound collected in 2021 of Clearwater Fiord (CWF), Kangilo Fiord (KF), North, West, Northeast (NE), and Southeast (SE) strata.
Prior to count agreement, out of the original 2,488 feature uncertain and certain detections, 410 were disagreed on by the two primary readers (BC and BAHS). Disagreements between readers occurred when it was impossible to observe the whole body shape; these detections were perceived to be submerged, with only part of the whale at the surface. Disagreements led to a change in classification or the removal of the detection. Of the 410 features, 346 had a final agreement as not a feature and were excluded from analyses, the remaining 64 were reclassified as uncertain (n=46) and certain (n=18).
Cumberland Sound is known to be dominated by beluga whales; however, harp seals (Pagophilus groenlandicus), bowhead (Balaena mysticetus), and narwhals (Monodon monoceros) can occasionally be found in Cumberland Sound. Harp seals have been known to congregate in large groups in Cumberland Sound (Diemer et al., 2011). We detected harp seals but were able to distinguish them by their shorter length (~1.5 m); these detections were removed from counts. On September 4 and 7 three (n=171 individuals) and eleven (n=526 individuals) groups of harp seals were detected in KF, respectively (Figure 3D). Bowhead are found in Cumberland Sound (Fortune et al., 2020) but are larger than beluga and distinguishable in satellite imagery, none were detected in this study. When narwhal enter Cumberland Sound they are usually reported by the Pangnirtung Hunters and Trappers Association, and although they were reported in Cumberland Sound in 2019 and 2020 there are no reports of them being present in 2021; thus, we are confident we are not counting narwhal in this estimate.
August 30 imagery of West and Northeast strata had the lowest resolution of 50 cm (Table 1; Figure 3F) and the highest disturbance of waves (BSS 3-4). August 29 West strata (Figure 3E) had the second lowest resolution of 46 cm. All images had <1% cloud cover and no sun glare.
Abundance estimates were calculated for all imagery from agreed upon certain detections between both primary readers. The abundance estimate for the entire sound (22,663 km2) was 1,690 (CV 0.16) whales (Table 2). The final abundance estimate CV incorporates the variance from the availability bias and previous aerial surveys, resulting in a 95% confidence interval of 1,241-2,301 beluga whales (Table 2). There was no variance from reader counts as only agreed certain points were used for the abundance estimate. The Clearwater plume was more turbid on September 7 than 4, but it is unlikely that whales deeper than 1 m were detected within the plume on either day (Figure 4).
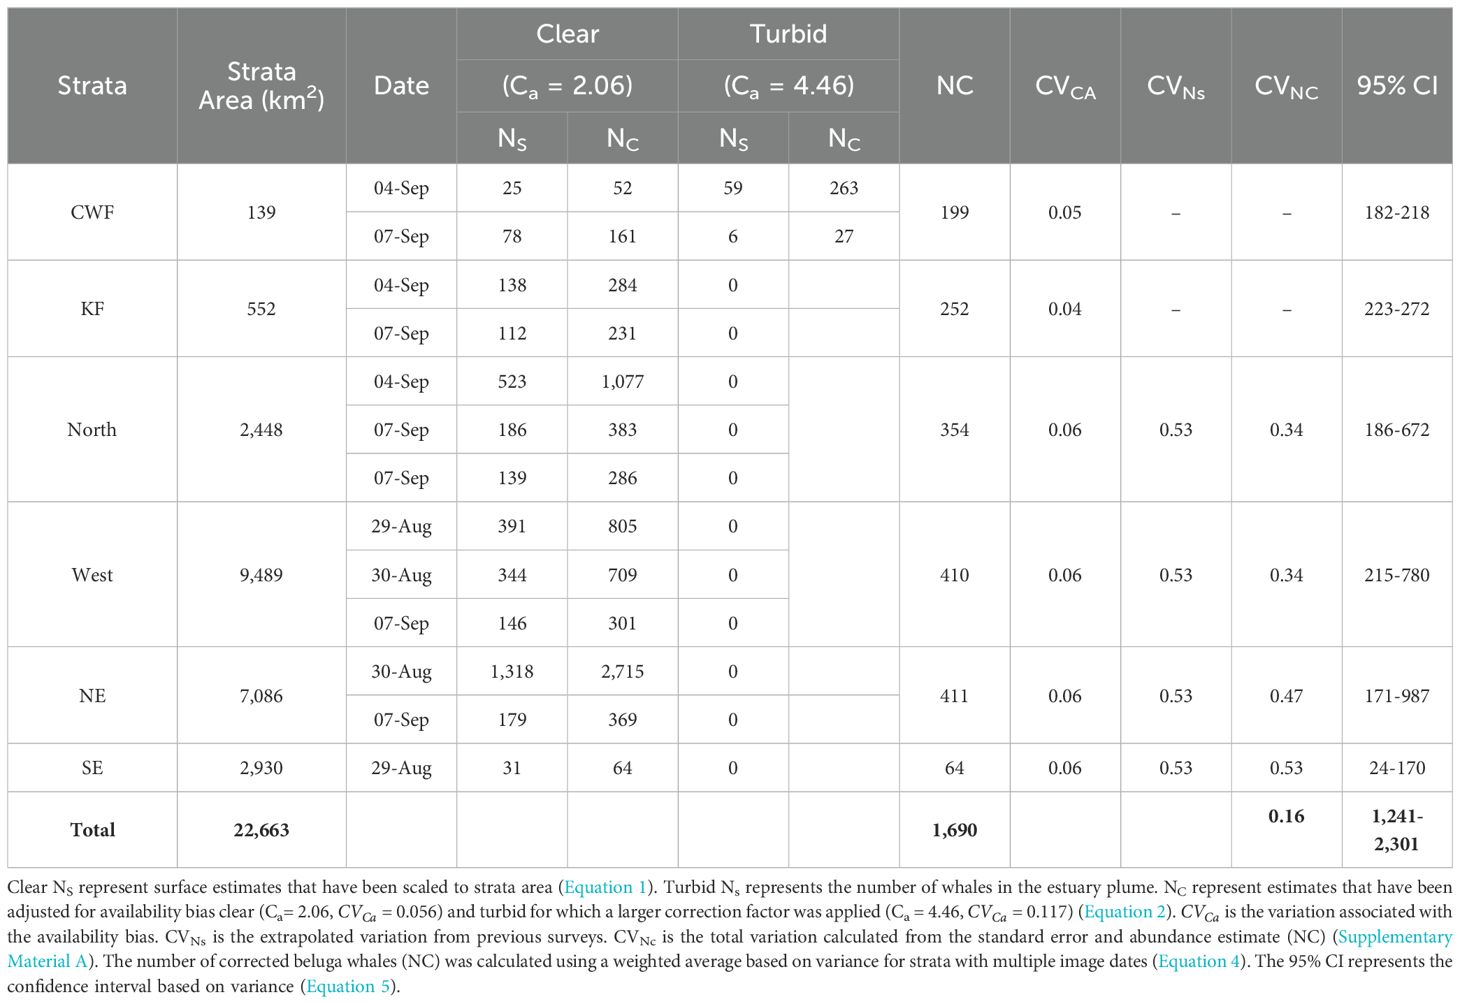
Table 2. Abundance estimates of beluga whales from satellite imagery per strata.
This is the first study to determine an abundance estimate for the Cumberland Sound beluga whale population using VHR satellite imagery. We have provided an updated abundance estimate for Cumberland Sound beluga whales of 1,690 (CV = 0.16; 95% CI: 1,241-2,301). This estimate is for the entire Cumberland Sound covering 22,663 km2, unlike Belanger et al.’s (2024) study that only estimated abundance in the Northern fiords, with a focus on the estuary. The previous aerial survey abundance estimate in August 2017 was 1,381 (CV = 0.04; 95% CI: 1,270-1,502) beluga whales in four strata (CWF, KF, North, and West) covering an area of 12,485 km2 (Watt et al., 2021b). Our estimate of these four strata is about one month later and is 1,215 (CV = 0.15; 95% CI: 906-1,628). This is similar to the previous estimate for these strata, the slight difference may reflect beluga whale movement.
The calculated abundance estimate from satellite imagery presented here is representative of beluga whale abundance in Cumberland Sound. Our total estimate is close to the upper 95% confidence interval from the most recent aerial survey conducted in 2017 (Watt et al., 2021b), which is understandable as a larger area was surveyed in our study. Differences in abundance estimates in strata across Cumberland Sound were expected. Beluga whales have been shown to congregate in CWF during summer months presumably for calving, moulting, and safety from predators (i.e., humans and killer whales) (Richard and Stewart, 2008). The highest density of beluga whales was in the CWF estuary plume (0.60 NS/km2), which corresponds to Belanger et al. (2024) results indicating this glacial river estuary is an important habitat for Cumberland Sound beluga whales. Across strata, the highest density of beluga whales was in CWF, KF had the next highest density of 0.25 NS/km2, and other strata had densities <0.21 NS/km2. The greatest imagery coverage (km2) was also in CWF and KF (100%). We recognize that having strata with <50% coverage (North, West, and Northeast) is not ideal, but much like aerial surveys, large-scale coverage is often impeded by factors out of our control such as cloud cover and weather constraints. In addition, previous aerial surveys have found low abundance in these strata (Watt et al., 2021a). This estimate provides valuable updated information regarding general whale distribution across Cumberland Sound in 2021, which can inform future surveys.
The correction factors used in this study to adjust the abundance estimate are derived from tagged whale data from 2006-2008 and it is possible that dive behavior has changed over time. It would be preferable to have tag data overlapping with satellite imagery collection. Additionally, an average availability bias is used for all whales, but beluga whales have communal behaviors in response to environmental conditions, for example, a group of whales may dive in response to a perceived threat at the same time, which could make an average correction inappropriate (Senigaglia et al., 2012; Storrie et al., 2023). Despite these caveats these are the best correction factors we have for time at the surface for Cumberland Sound beluga (Watt et al., 2021a).
In the silty estuary plume in CWF, the correction factor is larger (Ca = 4.46). This correction factor was used only where the plume is evident for each image (September 4 and 7) despite the plume being more transparent and less turbid on September 4 (Figure 4). It is possible, although unlikely, that whales >1 m deep were detected in the satellite imagery on September 4. On this date, 59 whales were detected in the plume, which was corrected to 263 whales (CV = 0.12), using the turbid water correction factor. If the clear water correction factor was used instead, 142 fewer whales would be included in our estimate. However, variance on our abundance estimate accounts for this potential source of error (95% CI: 1,241-2,301).
Satellite images with very high spatial resolution are becoming more widely used for the detection of animals. Resolutions up to 31 cm have allowed for increased applications in studies of marine mammals (Clarke et al., 2021; Cubaynes et al., 2019; Fretwell et al., 2014). Satellite imagery has the benefit of being able to survey large areas within a short timeframe (<30 seconds between images) and thus capture any small-scale whale movements and eliminate bias that may be caused by whale synchronicity or non-random movement (Ezer et al., 2008; Smith et al., 2017; Smith and Martin, 1994).
Satellite imagery has been previously used for the detection and abundance estimation of beluga whales (Belanger et al., 2024; Charry et al., 2021; Fretwell et al., 2023; Watt et al., 2023). Charry et al. (2021) read 31 cm resolution satellite images of CWF from 2019, and detected 6 beluga whales on August 9 and 262 on August 4 in 138.8 km2. In the same 138.8 km2 area of CWF we detected 80 and 82 beluga whale targets on September 4 and 7, respectively. Belanger et al. (2024) detected 163 and 202 certain whales in CWF, in 31 cm resolution satellite imagery on August 21 and August 30, 2020, respectively. Watt et al. (2021b) observed 84 to 741 beluga whales not corrected for availability bias in CWF during an aerial survey from July 29 to August 12, 2017 within an area of 117.64 to 124.14 km2, respectively. Our observed numbers are on the lower end but fall within the range of uncorrected surface counts previously documented.
An additional non-intentional finding was the detection of harp seals in the VHR imagery (Figure 3D). Satellite imagery has been used to detect Weddell seals (Leptonychotes weddellii) on ice (Ainley et al., 2015; LaRue et al., 2011), elephant seals (Mirounga leonina) on beaches (McMahon et al., 2014), and walrus (Odobenus rosmarus) haul-outs on beaches (Fischbach and Douglas, 2021; Matthews et al., 2022; Sherbo et al., 2023). To our knowledge harp seal detections in VHR satellite imagery have not been previously documented.
Satellite imagery has limitations and it may be logistically challenging to capture clear images of whole strata. Environmental variables such as Beaufort Sea State, cloud, and sun glare can impact detection. In this study an image in the West and Northeast strata had a higher Beaufort Sea State (3-4) which resulted in more uncertain detections. However, this is also a limitation with traditional aerial surveys which can take weeks due to inclement weather (i.e., high winds or low cloud cover). Nevertheless, VHR satellite imagery emerges here as a highly valuable method for monitoring and estimating beluga whale population abundance, comparable to what is achieved with aerial survey data. In the future, as newer technologies become available VHR satellite imagery resolution will improve, thus increasing its applications. While satellite imagery can require substantial time for processing and interpretation, we anticipate faster and more accurate alternatives to manually reading images by using artificial intelligence such as pixel-based algorithms or semi-automated object-based image analysis (Iacozza et al., in prep). Satellite imagery significantly reduces the bureaucratic hurdles associated with obtaining multiple authorizations, permits, and coordinating efforts among stakeholders. Furthermore, it alleviates logistical complexities and lessens the reliance on field personnel.
Cumberland Sound is an ecologically important region and beluga whales are an important part of this ecosystem that are currently listed as endangered under COSEWIC (COSEWIC, 2021). Regular population abundance assessments are essential and here we show that VHR satellite imagery can be used to estimate population abundance. Our estimate was 1,690 beluga whales in Cumberland Sound in 2021 which is comparable to the most recent aerial survey. Thus, future population assessments could rely on collection of VHR satellite imagery to obtain an estimate of abundance for this endangered population. This study broadens our comprehension of utilizing VHR satellite imagery for studying and monitoring marine mammal populations. Our study demonstrate the use of VHR satellite imagery to obtain abundance estimates, comparable to those acquired through aerial surveys.
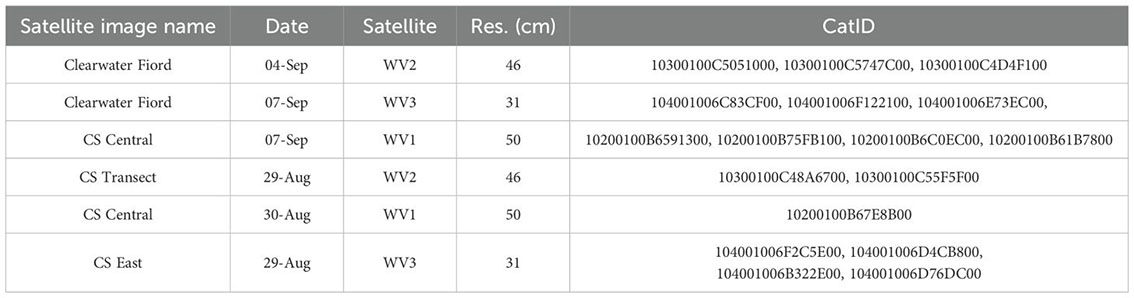
The datasets presented in this article are not readily available because the satellite images are not available for distribution due to the copyright agreement with Maxar. Satellite image identifiers (catalogue IDs) are presented under the resource identification initiative. Beluga whale image annotations could be available upon request. Requests to access the datasets in the form of shape files should be directed toYnJ5YW5uYS5zaGVyYm9AZGZvLW1wby5nYy5jYQ==orY29ydG5leS53YXR0QGRmby1tcG8uZ2MuY2E=.
Ethical approval was not required for the study involving animals in accordance with the local legislation and institutional requirements because there was no handling or interaction with animals during the study, method was 100% non-invasive.
BS: Writing – review & editing, Writing – original draft, Visualization, Validation, Software, Resources, Methodology, Investigation, Formal analysis, Data curation, Conceptualization. AB: Writing – review & editing, Methodology, Formal analysis, Data curation. BC: Writing – review & editing, Methodology, Formal analysis, Data curation. CW: Writing – review & editing, Supervision, Resources, Project administration, Methodology, Funding acquisition, Conceptualization.
The author(s) declare financial support was received for the research, authorship, and/or publication of this article. We thank Species at Risk and Crown-Indigenous Relations and Northern Affairs Canada (CIRNAC) for funding which supported this research.
Thanks to R. Fan and D. Gaspard for reading satellite imagery from West, Northeast, Southeast, and North strata. Thanks to C. Carlyle for partially reading satellite imagery from Clearwater and Kangilo Fiords. Thanks to B. Young for taking secchi depth measurements. Thanks to Maxar technologies for the imagery, with special thanks V. Wu, and M. She, for ongoing technical support.
Author BC was employed by company Whale Seeker.
The remaining authors declare that the research was conducted in the absence of any commercial or financial relationships that could be construed as a potential conflict of interest.
All claims expressed in this article are solely those of the authors and do not necessarily represent those of their affiliated organizations, or those of the publisher, the editors and the reviewers. Any product that may be evaluated in this article, or claim that may be made by its manufacturer, is not guaranteed or endorsed by the publisher.
The Supplementary Material for this article can be found online at: https://www.frontiersin.org/articles/10.3389/fmars.2024.1422907/full#supplementary-material
Abbe C. (1914). THE BEAUFORT WIND SCALE. Monthly Weather Rev. 42, 231–232. doi: 10.1175/1520-0493(1914)42<231:tbws>2.0.co;2
Ainley D. G., Larue M. A., Stirling I., Stammerjohn S., Siniff D. B. (2015). An apparent population decrease, or change in distribution, of Weddell seals along the Victoria Land coast. Mar. Mammal Sci. 31, 1338–1361. doi: 10.1111/mms.12220
Belanger A. M., Sherbo B. A. H., Roth J. D., Watt C. A. (2024). Use of satellite imagery to estimate distribution and abundance of Cumberland Sound beluga whales reveals frequent use of a glacial river estuary. Front. Mar. Sci. 10, 1305536. doi: 10.3389/fmars.2023.1305536
Biddlecombe B., Watt C. (2022). Incorporating environmental covariates into a Bayesian stock production model for the endangered Cumberland Sound beluga population. Endangered Species Res. 48, 51–65. doi: 10.3354/esr01186
Brodie P. F., Parsons J. L., Sergeant D. E. (1981). Present status of the white whale (Delphinapterus leucas) in Cumberland Sound, Baffin Island. Rep. Int. Whal. Commun. 31, 579–582. doi: 10.1139/f71-198
Buckland S. T., Anderson D. R., Burnham K. P., Laake J. L., Borchers D. L., Thomas L. (2001). Introduction to distance sampling: estimating abundance of biological populations (New York, N.Y. USA: Oxford University Press).
Charry B., Tissier E., Iacozza J., Marcoux M., Watt C. A. (2021). Mapping Arctic cetaceans from space: A case study for beluga and narwhal. PloS One 16, 1–14. doi: 10.1371/journal.pone.0254380
Clarke P. J., Cubaynes H. C., Stockin K. A., Olavarría C., de Vos A., Fretwell P. T., et al. (2021). Cetacean strandings from space: challenges and opportunities of very high resolution satellites for the remote monitoring of cetacean mass strandings. Front. Mar. Sci. 8. doi: 10.3389/fmars.2021.650735
COSEWIC (2021). COSEWIC Annual Report (Ottawa: Committee on the Status of Endangered Wildlife in Canada). Available online at: https://www.Canada.ca/en/environment-climate-change/services/species-risk-public-registry/publications/cosewic-annual-report-2017-2018.html.
Cubaynes H. C., Fretwell P. T., Bamford C., Gerrish L., Jackson J. A. (2019). Whales from space: Four mysticete species described using new VHR satellite imagery. Mar. Mammal Sci. 35, 466–491. doi: 10.1111/mms.12544
DFO (2005). Recovery potential assessment of Cumberland Sound, Ungava Bay, Eastern Hudson Bay and St. Lawrence beluga populations (Delphinapterus leucas). DFO Can. Sci. Advis. Sec. Res. Rep. 2005/036. 14 p. Available online at:: https://waves-vagues.dfo-mpo.gc.ca/library-bibliotheque/317270.pdf.
Diemer K. M., Conroy M. J., Ferguson S. H., Hauser D. D. W., Grgicak-Mannion A., Fisk A. T. (2011). Marine mammal and seabird summer distribution and abundance in the fjords of northeast Cumberland Sound of Baffin Island, Nunavut, Canada. Polar Biol. 34, 41–48. doi: 10.1007/s00300-010-0857-1
Ezer T., Hobbs R., Oey L. Y. (2008). On the movement of beluga whales in Cook Inlet, Alaska: Simulations of tidal and environmental impacts using a hydrodynamic inundation model. Oceanography 21, 186–195. doi: 10.5670/oceanog.2008.17
Fischbach A. S., Douglas D. C. (2021). Evaluation of satellite imagery for monitoring pacific walruses at a large coastal haulout. Remote Sens. 13, 1–18. doi: 10.3390/rs13214266
Fortune S. M. E., Young B. G., Ferguson S. H. (2020). Age- and sex-specific movement, behaviour and habitat-use patterns of bowhead whales (Balaena mysticetus) in the Eastern Canadian Arctic. Polar Biol. 43, 1725–1744. doi: 10.1007/s00300-020-02739-7
Fretwell P. T., Cubaynes H. C., Shpak O. V. (2023). Satellite image survey of beluga whales in the southern Kara Sea. Mar. Mammal Sci. 39, 1204–1214. doi: 10.1111/mms.13044
Fretwell P. T., Jackson J. A., Ulloa Encina M. J., Häussermann V., Perez Alvarez M. J., Olavarría C., et al. (2019). Using remote sensing to detect whale strandings in remote areas: The case of sei whales mass mortality in Chilean Patagonia. PloS One 14, 1–17. doi: 10.1371/journal.pone.0225209
Fretwell P. T., LaRue M. A., Morin P., Kooyman G. L., Wienecke B. (2012). Correction: An Emperor Penguin Population Estimate: The First Global, Synoptic Survey of a Species from Space. PloS One 7 (4), 10.1371. doi: 10.1371/annotation/32c246eb-3b73-4410-a44c-b41ddae11fc5
Fretwell P. T., Staniland I. J., Forcada J. (2014). Whales from space: Counting southern right whales by satellite. PloS One 9, 1–10. doi: 10.1371/journal.pone.0088655
Fryxell J. M., Sinclair A. R., Caughley G. (2014). Wildlife ecology, conservation, and management (Third Edition). (Chichester, West Sussex, UK: John Wiley & Sons Ltd.).
LaRue M. A., Rotella J. J., Garrott R. A., Siniff D. B., Ainley D. G., Stauffer G. E., et al. (2011). Satellite imagery can be used to detect variation in abundance of Weddell seals (Leptonychotes weddellii) in Erebus Bay, Antarctica. Polar Biol. 34, 1727–1737. doi: 10.1007/s00300-011-1023-0
LaRue M. A., Stapleton S. (2018). Estimating the abundance of polar bears on Wrangel Island during late summer using high-resolution satellite imagery: a pilot study. Polar Biol. 41, 2621–2626. doi: 10.1007/s00300-018-2384-4
Marcoux M., Young B. G., Asselin N. C., Watt C. A., Dunn J. B., Ferguson S. H. (2016). Estimate of Cumberland Sound beluga (Delphinapterus leucas) population size from the 2014 visual and photographic aerial survey. DFO Can. Sci. Advis. Sec. Res. Doc. 2016/037, iv + 19. p. Available online at: https://publications.gc.ca/collections/collection_2016/mpo-dfo/Fs70-5-2016-037-eng.pdf.
Martin M. J., Halliday W. D., Storrie L., Citta J. J., Dawson J., Hussey N. E., et al. (2023). Exposure and behavioral responses of tagged beluga whales (Delphinapterus leucas) to ships in the Pacific Arctic. Mar. Mammal Sci. 39, 387–421. doi: 10.1111/mms.12978
Matthews C. J. D., Dispas A., Mosnier A. (2022). Evaluating satellite imagery for Atlantic walrus (Odobenus rosmarus rosmarus) stock assessment – a pilot study. Can. Tech. Rep. Fish. Aquat. Sci. 3492, v + 25. p. Available online at: https://publications.gc.ca/collections/collection_2022/mpo-dfo/Fs97-6-3492-eng.pdf.
McMahon C. R., Howe H., Van Den Hoff J., Alderman R., Brolsma H., Hindell M. A. (2014). Satellites, the all-seeing eyes in the sky: Counting elephant seals from space. PLoS One 9, 1–5. doi: 10.1371/journal.pone.0092613
Miller R., D’Sa E. (2005). “Bio-optical properties of coastal waters,” Remote Sensing of Coastal Aquatic Environments, pp. 129–155. doi: 10.1007/978-1-4020-3100-7
Orr J. R., Joe R., Evic D. (2001). Capturing and handling of white whales (Delphinapterus leucas) in the Canadian arctic for instrumentation and release. Arctic 54, 299–304. doi: 10.14430/arctic789
Patenaude N. J., Richardson W. J., Smultea M. A., Koski W. R., Miller G. W., WüRsig B., et al. (2002). Aircraft sound and disturbance to bowhead and beluga whales during spring migration in the Alaskan Beaufort Sea. Mar. Mammal Sci. 18, 309–335. doi: 10.1111/j.1748-7692.2002.tb01040.x
Richard P. R. (2013). Size and trend of the Cumberland Sound beluga whale population 1990 to 2009. DFO Can. Sci. Advis. Secr. Res. Doc. 2012/159, iii + 28. p. Available online at: https://waves-vagues.dfo-mpo.gc.ca/library-bibliotheque/347932.pdf.
Richard P. R., Stewart D. B. (2008). Information relevant to the identification of critical habitat for cumberland sound belugas (Delphinapterus leucas). DFO Can. Sci. Advis. Sec. Res. Doc. 2008/085. iv + 24 p. Available online at: https://waves-vagues.dfo-mpo.gc.ca/library-bibliotheque/336597.pdf.
Richard P. R., Stewart D. B. (2009). Information relevant to the identification of critical habitat for cumberland sound belugas (Delphinapterus leucas). October 3848, 28.
SARA. (2023). Species at Risk Act / Loi sur les espèces en péril. Available at:https://laws-lois.justice.gc.ca/eng/acts/S-15.3/.
Senigaglia V., de Stephanis R., Verborgh P., Lusseau D. (2012). The role of synchronized swimming as affiliative and anti-predatory behavior in long-finned pilot whales. Behav. Processes 91, 8–14. doi: 10.1016/j.beproc.2012.04.011
Sherbo B. A. H., Iacozza J., O’Hara A., Zhao S. T., Ghazal M., Matthews C. J. D. (2023). Validation of satellite imagery for quantitative population assessment and monitoring of Atlantic walrus. Remote Sens. Applications: Soc. Environ. 32, 101065. doi: 10.1016/j.rsase.2023.101065
Smith A. J., Higdon J. W., Richard P., Orr J., Bernhardt W., Ferguson S. H. (2017). Beluga whale summer habitat associations in the Nelson River estuary, western Hudson Bay, Canada. PloS One 12, 1–20. doi: 10.1371/journal.pone.0181045
Smith T. G., Martin A. R. (1994). Distribution and movements of belugas, Delphinapterus leucas, in the Canadian High Arctic. Can. J. Fisheries Aquat. Sci. 51, 1653–1663. doi: 10.1139/f94-166
Stewart J. B., Hudson J. M., Sherbo B. A., Watt C. A. (2024). Estimating beluga whale abundance from space: using drones to ground-validate VHR satellite imagery. Remote Sens. Ecol. Conserv. doi: 10.1002/rse2.396
Storrie L., Loseto L. L., Sutherland E. L., MacPhee S. A., O’Corry-Crowe G., Hussey N. E. (2023). Do beluga whales truly migrate? Testing a key trait of the classical migration syndrome. Movement Ecol. 11, 1–13. doi: 10.1186/s40462-023-00416-y
Watt C. A. (2021). Catch statistics for beluga (Delphinapterus leucas) harvested from the Eastern High Arctic - Baffin Bay and Cumberland Sound populations from 1977-2020. Canadian Technical Report of Fisheries and Aquatic Sciences 3444, vii + 18 p.
Watt C. A., Carlyle C. G., Hornby C. A., Sherbo B. A. H. (2023). Eastern High Arctic–Baffin Bay beluga whale (Delphinapterus leucas) estuary abundance and use from space. Front. Mammal Sci. 2. doi: 10.3389/fmamm.2023.1208276
Watt C. A., Marcoux M., Ferguson S. H., Hammill M. O., Matthews C. J. D. (2021a). Population dynamics of the threatened Cumberland Sound beluga (Delphinapterus leucas) population. Arctic Sci. 7, 545–566. doi: 10.1139/as-2019-0030
Watt C. A., Marcoux M., Hammill M. O., Montsion L., Hornby C., Charry B., et al. (2021b). Abundance and total allowable landed catch estimates from the 2017 aerial survey of the Cumberland Sound beluga (Delphinapterus leucas) population. DFO Can. Sci. Advis. Sec. Res. Doc. 2021/050. iv + 33 p. Available online at: https://publications.gc.ca/collections/collection_2021/mpo-dfo/fs70-5/Fs70-5-2021-050-eng.pdf.
Williams R., Ashe E., Gaut K., Gryba R., Moore J. E., Rexstad E., et al. (2017). Animal counting toolkit: A practical guide to small-boat surveys for estimating abundance of coastal marine mammals. Endangered Species Res. 34, 149–165. doi: 10.3354/esr00845
Resource identification initiative.
Keywords: abundance estimation, imagery analysis, whale detection, very high resolution satellite imagery, WorldView
Citation: Sherbo BAH, Belanger AM, Charry B and Watt CA (2024) Using satellite imagery to estimate abundance of Cumberland Sound beluga whales (Delphinapterus leucas) in 2021. Front. Mar. Sci. 11:1422907. doi: 10.3389/fmars.2024.1422907
Received: 25 April 2024; Accepted: 07 August 2024;
Published: 13 September 2024.
Edited by:
Maritza Sepulveda, Universidad de Valparaiso, ChileReviewed by:
David C. Douglas, United States Department of the Interior, United StatesCopyright © 2024 Sherbo, Belanger, Charry and Watt. This is an open-access article distributed under the terms of the Creative Commons Attribution License (CC BY). The use, distribution or reproduction in other forums is permitted, provided the original author(s) and the copyright owner(s) are credited and that the original publication in this journal is cited, in accordance with accepted academic practice. No use, distribution or reproduction is permitted which does not comply with these terms.
*Correspondence: Bryanna A. H. Sherbo, QnJ5YW5uYS5TaGVyYm9AZGZvLW1wby5nYy5jYQ==; Cortney A. Watt, Q29ydG5leS5XYXR0QGRmby1tcG8uZ2MuY2E=
Disclaimer: All claims expressed in this article are solely those of the authors and do not necessarily represent those of their affiliated organizations, or those of the publisher, the editors and the reviewers. Any product that may be evaluated in this article or claim that may be made by its manufacturer is not guaranteed or endorsed by the publisher.
Research integrity at Frontiers
Learn more about the work of our research integrity team to safeguard the quality of each article we publish.