
94% of researchers rate our articles as excellent or good
Learn more about the work of our research integrity team to safeguard the quality of each article we publish.
Find out more
ORIGINAL RESEARCH article
Front. Mar. Sci., 24 September 2024
Sec. Marine Pollution
Volume 11 - 2024 | https://doi.org/10.3389/fmars.2024.1422057
 Martina Furdek Turk1*
 Ivna Vrana1
 Radmila Milačič2Janez Ščančar2Jelena Dautović1Irena Ciglenečki1
 Nevenka Mikac1
This work presents a spatial and temporal distribution of tributyltin (TBT) and TBT pollution assessment of the Croatian Adriatic coast in the period 2016 – 2023. The monitoring of TBT pollution was carried out within the Water Framework Directive (2000/60/EC) and the Marine Strategy Framework Directive (2008/56/EC). TBT concentrations were measured at 63 sites in coastal and transitional waters in three compartments - water, sediments and mussels. The ranges of TBT concentrations were <0.06 – 6.40 ng(TBT)/L in the water column, <1 – 2546 ng(TBT)/g(d.w.) in sediments, and <1 – 655 ng(TBT)/g(d.w.) in mussels, while transitional waters were in general more polluted than coastal waters. Monitoring of TBT concentrations in water showed that 30% of monitored sites were continuously polluted with TBT with average annual concentrations exceeding AA-EQS [0.2 ng(TBT)/L], while 20% of the sites had concentrations in sediments above the proposed EQS for sediments [1.6 ng(TBT)/g(d.w.)]. In mussels, TBT was detected at 70% of the sites with more than 60% of the sites exceeding the OSPAR criteria [12.6 ng(TBT)/g(d.w.)], indicating that the occurrence of imposex in gastropods at these sites is very likely. Only a slight decrease in TBT levels was observed over the investigated period, but concentrations at most contaminated sites did not fall below the EQS. This study shows that, despite the ban of TBT-based antifouling paints more than 15 years ago (except for public and military vessels), contamination of the Croatian Adriatic coast with TBT still exists and regular monitoring is essential. The TBT distribution was primarily determined by the vicinity of the pollution source, i.e. shipping traffic, but the role of physicochemical parameters, such as dissolved organic carbon (DOC) and transparency of the water column, should not be disregarded as well as the influence of hydrodynamics in the transitional waters. Although monitoring of TBT concentrations in water is an established approach to assess recent pollution, this long-term study has shown that mussels can be the most reliable indicator of pollution in a given area over the last several months.
Tributyltin (TBT) is listed in water policy as one of the priority hazardous substances, while its presence in the environment is exclusively of anthropogenic origin. Its main application refers to antifouling paints in which it has been used as biocide since the 1960s (Omae, 2003). It was considered the most effective antifouling biocide used throughout history, as it was extremely effective against a variety of fouling communities even at concentrations as low as 0.01 to 1 mg/L, with one coating being effective for up to five years (Omae, 2003). TBT was used intensively for more than two decades until the devastating effects on aquatic life began to be revealed. Today, it is considered as the most toxic pollutant that has been intentionally introduced into the aquatic environment on a daily basis over such a long period of time, and the case of TBT is one of the most striking examples of human impact on the natural environment affecting the fitness of natural populations (Lagadic et al., 2018; Šrut et al., 2023). Although numerous papers have been published on this topic over the last three decades, it still attracts a great deal of attention.
Tributyltin has numerous negative effects on non-target aquatic species; it is a strong endocrine disruptor and has immunotoxic effects on aquatic invertebrates as well as negative effects on the functionality of microbial communities (Dubey and Roy, 2003; Da Silva et al., 2023). It is also known as a DNA-hypomethylating agent and causes non-adaptive epigenetic alterations in various animals, including mollusks, fish and mammals (Šrut et al., 2023). A detailed overview of its toxicity is given in several recent reviews (Antizar-Ladislao, 2008; Beyer et al., 2022; Da Silva et al., 2023). The most profound effect of TBT is the induction of imposex in gastropods, an irreversible superimposition of male sexual characteristics on females, which occurs even at environmental concentrations as low as few ng(TBT)/L and can substantially impair the female reproductive ability (Beyer et al., 2022). Although triphenyltin (TPhT) also has an inducing effect on the development of imposex, albeit in a limited number of species and at much higher concentrations than TBT (Laranjeiro et al., 2016), the occurrence of imposex is considered as a TBT-specific biological effect and imposex is widely used as a bioindicator of TBT pollution. Indeed, it has been proposed as a biomonitoring tool in the assessment of ecological quality status under the Water Framework Directive (WFD) (Laranjeiro et al., 2015; Erdelez et al., 2017; Cacciatore et al., 2018a).
These serious consequences in the aquatic environment led to the use of TBT in antifouling paints being banned in many countries around the world, including whole of Europe. In 2001, the International Maritime Organization (IMO) adopted the AFS Convention and called for a global ban on TBT paints. The European Union implemented the Convention through Regulation 782/2003/EC, with 2008 as the final deadline for the complete ban on the use and removal of old TBT coatings from ships. As in the whole of Europe, TBT has also been banned in Croatia since 2008 (NN 10/2008). However, this regulation did not apply to military and public vessels until 2022 (NN 109/2022).
The global ban has been partially successful and a decline in TBT levels and incidence of imposex has been reported both in Europe and worldwide (e.g., Castro et al., 2012; Cuevas et al., 2014; Langston et al., 2015; Nicolaus and Barry, 2015; Laranjeiro et al., 2018; Cacciatore et al., 2018b; Harrison et al., 2020). However, many studies over the last decade continue to report a high incidence of imposex as well as persistent pollution by TBT in various coastal environments, both in Europe (e.g., Mikac et al., 2022a; Raudonytė-Svirbutavičienė et al., 2023; Chouba et al., 2024; Filipkowska and Kowalewska, 2019; Concha-Graña et al., 2021; Beyer et al., 2022; Kucharski et al., 2022) and around the world (e.g., Metelkova et al., 2022; Gomez et al., 2024; Bandara et al., 2021; Paz-Villarraga et al., 2015; Quintas et al., 2019).
Once TBT enters the marine environment, it undergoes processes such as photolytic and microbiological degradation, bioaccumulation by biota and adsorption to particles that settle out, allowing TBT to eventually end up in sediments (Hoch, 2001). The behavior of TBT is determined by its lipophilic and hydrophobic properties, while its fate and the contribution of each individual process is determined by various environmental factors. While physicochemical parameters, such as pH, temperature, salinity, and dissolved organic carbon (DOC) determine its solubility, bioavailability and partitioning between solid and soluble fraction (Inaba et al., 1995; Arnold et al., 1998; Fang et al., 2017), the presence of UV light and oxygen promotes its photolytically and microbial degradation (Rodriguez-Gonzalez et al., 2013; Furdek et al., 2016). In the water column, it degraded quite rapidly due to effective photolytic and microbial degradation (half-life of several days to weeks; Rodriguez-Gonzalez et al., 2013), but not all TBT is degraded before being settled to sediments. Namely, in the aquatic environment, TBT has low solubility and is readily adsorbed on suspended particle matter (SPM) which eventually settle to sediments (log Kd > 3.5; e.g., Berg et al., 2001; Furdek et al., 2016). Tessier et al. (2007) in microcosms study showed that almost 70% of TBT ended up in the sediments after two weeks, while Furdek Turk et al. (2020) studied the relation between butyltins and inorganic Sn in sediments and concluded that only a small portion of TBT (< 10%) reached the sediment before being degraded in the water column. In sediments, TBT is persistent and degrades slowly, with half-lives of several years to decades (Omae, 2003; Furdek et al., 2016), which makes sediments not only a reservoir but also a potential long-term source of pollution to the water column. Many studies demonstrated that TBT can be desorbed from the sediments, but these were either laboratory experiments (Berg et al., 2001; Burton et al., 2004; Gomez et al., 2024) or studies in which the diffusion of TBT from the sediments was assessed based on its concentrations in the pore water (Briant et al., 2016; Burton et al., 2005). However, field studies on this topic are scarce; while ones considered desorption of TBT from undisturbed sediments is insignificant (Stuer-Lauridsen and Dahl, 1995; Formalewicz et al., 2019), others demonstrated that TBT can be desorbed to a small extent into the water column (Point et al., 2007; Furdek Turk et al., 2020). The role of contaminated sediments as a potential source of TBT to the water column has never been fully clarified.
There are two main EU directives that aim to protect the aquatic environment from anthropogenic influences and achieve and maintain its good status. These are Water Framework Directive 2000/60/EC (WFD), which provides a framework for action in the field of water policy, and the Marine Strategy Framework Directive 2008/56/EC (MSFD), which establish a framework for action in the field of marine environmental policy. In both, TBT is listed as a priority pollutant whose levels in the environment, both freshwater and marine, should be regularly monitored. The level of pollution should be assessed on the basis of the relevant environmental criteria, i.e. environmental values that protect aquatic organisms from both acute and chronic effects. For the water column these criteria are defined as Environmental Quality Standards (EQS) - maximum allowable concentration [MAC-EQS; 1.5 ng(TBT)/L] and annual average concentration [AA-EQS; 0.2 ng(TBT)/L], but for sediments and biota these criteria are still not defined by EU directives. An EQS for TBT in sediments of 1.6 ng(TBT)/g(d.w.) has recently been proposed and is under discussion (SCHEER, 2023). On the other hand, OSPAR (Oslo – Paris Convention, i.e. Convention for the protection of the marine environment of the North-East Atlantic) has established Environmental Assessment Criteria (EAC) for TBT in mollusks; the lower EAC [EAClow= 12.0 ng(TBT)/g(d.w.)] is defined as the threshold for protection of all marine species from chronic effects and the upper EAC [EAChigh=175 ng(TBT)/g(d.w.)] as the threshold for protection from acute toxic effects (OSPAR, 2004). According to the directives, in Croatia, as in all other EU Member States, monitoring of TBT levels should be implemented for ongoing assessment of environmental status in both coastal and transitional waters.
This research presents the data obtained through the monitoring of TBT pollution of the entire Croatian Adriatic coast, which is carried out within the framework of the European WFD and MSFD. The objectives of this study are: i) the assessment of TBT pollution of the Croatian Adriatic coast in the period 2016 – 2023 based on its distribution in the water column, mussel tissues and surface sediments; ii) the comparison of the assessment of pollution based on three different compartments (water column, sediments, biota); iii) the comparison of TBT pollution of coastal and transitional waters; iv) the evaluation of TBT distribution in relation to physicochemical parameters of the water column; v) the assessment of the temporal trend of TBT levels in the period 2016 – 2023; vi) the assessment of the seasonal distribution of TBT in the water column over a year.
The research area refers to the coastal zone of the eastern Adriatic Sea, which is a part of the Mediterranean Sea (Figure 1). The Adriatic Sea is a small and relatively shallow sea (74% of the surface refers to a depth of up to 200 m). The total length of the coastline is 5835 km, of which 1777 km is on the mainland coast and 4058 km on the islands, while the air distance between the end points of the coastline is 526 km. The coefficient of intendedness is 11.10, which makes the coastline a highly indented area with many bays and channels and more than 1200 islands, 67 of which are inhabited (Duplančić Leder et al., 2000). The coastal zone is a densely populated area and a well-known tourist destination with active nautical tourism. There are 106 nautical ports, 67 of which are marinas, as well as several large harbors and shipyards (according to the Croatian Statistical Office in 2013). Most of the coastal area is under strong anthropogenic influence caused by urbanization, intense shipping activities, tourism and industry.
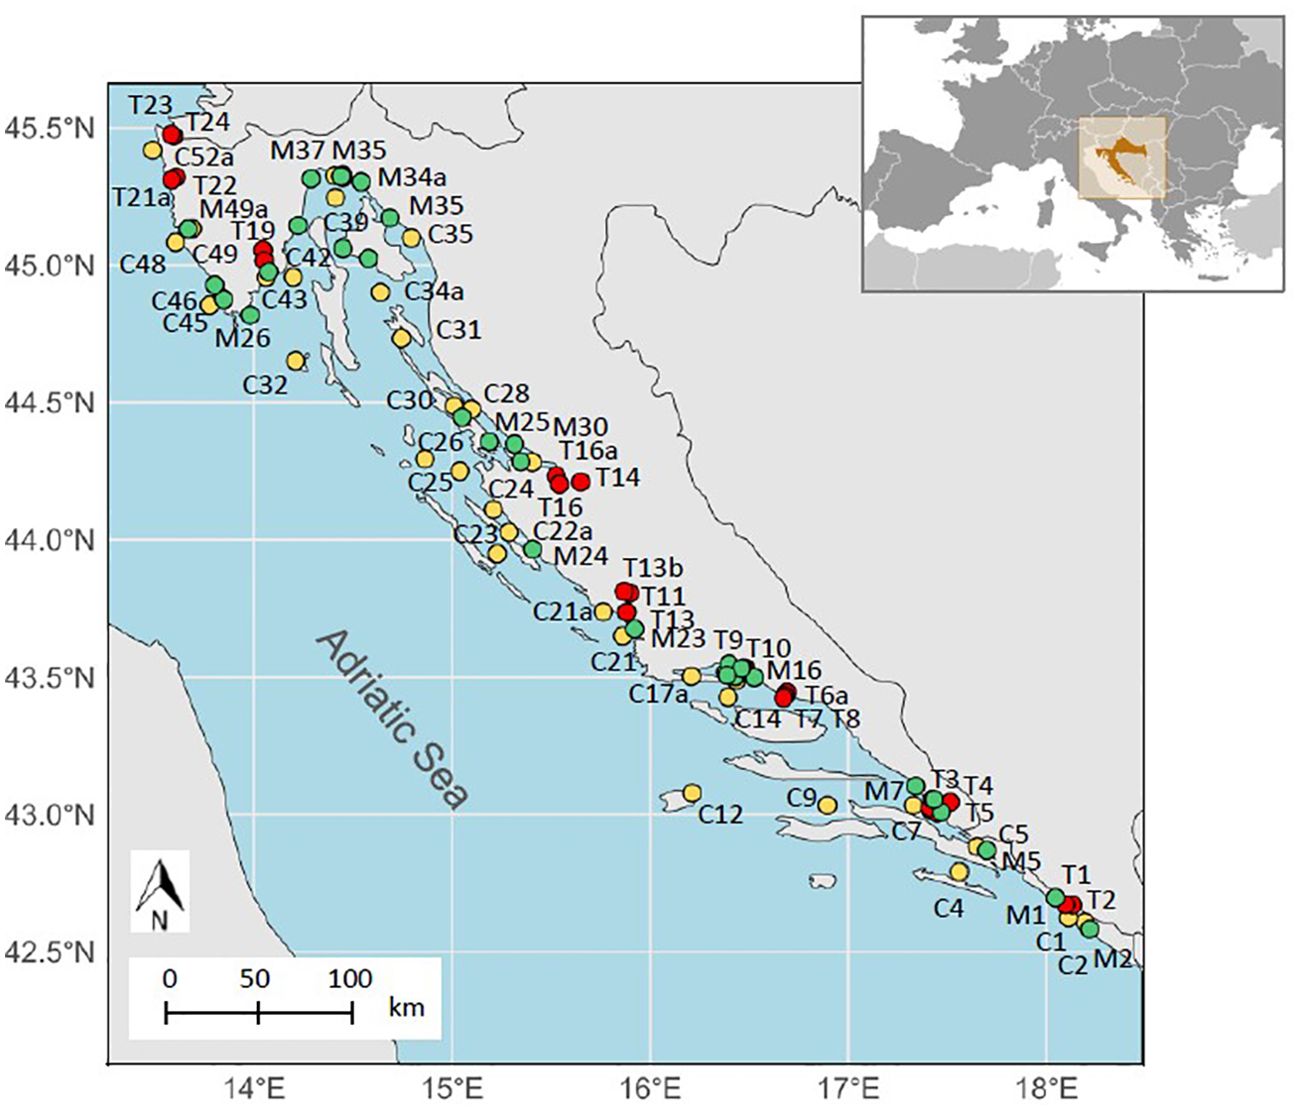
Figure 1. Map of sampling sites in coastal and transitional waters at Croatian Adriatic coast [C – coastal waters (yellow), T – transitional waters (red), M – mussels (green)].
The study area includes both coastal and transitional waters. According to the WFD, coastal waters are those water bodies that are located within one nautical mile seaward of the nearest point on the baseline from which the width of territorial waters is measured. Transitional waters are waters in estuaries that are partially saline due to their proximity to coastal waters (seawater) but are influenced by river inflows (freshwater). In Croatia, transitional waters have been identified in the estuaries of 10 rivers (going from the north to the south: Dragonja, Mirna, Raša, Rječina, Zrmanja, Krka, Jadro, Cetina, Neretva and Ombla). These rivers are generally small and flow through the karstic terrain and, therefore, do not carry large amounts of material that could be deposited in estuaries.
Monitoring under the WFD consists of surveillance and operational monitoring. Surveillance monitoring was carried out at a sufficient number of sites to assess the overall status of all water bodies along the entire coast. On the other hand, operational monitoring was carried out at those sites which are previously established as contaminated and are usually under the high anthropogenic pressure, such as urban harbors. In WFD monitoring, TBT pollution of transitional and coastal waters was assessed based on TBT levels in the water and sediments. In addition, mussels were analyzed for their TBT content as part of the MSFD monitoring (Descriptor 8). The map of sampling locations is shown in Figure 1, while the description of each site, including geographical coordinates, water depth and a brief description of the site, can be found in Supplementary Table S1 (for transitional waters), Supplementary Table S2 (for coastal waters) and Supplementary Table S3 (for mussel sampling sites).
The surveillance monitoring was conducted at 31 sites in coastal waters and 20 sites in transitional waters, while operational monitoring was conducted at 12 sites identified as potential hotspots of pollution (6 in coastal waters and 6 in transitional waters) (Figure 1; Supplementary Tables S1, S2). Transitional waters include 10 estuaries, with several sites covering the inner and outer parts of each estuary. The surveillance monitoring was carried out one year in the transitional waters (2016, 2018, 2020 and 2022) and the other year in the coastal waters (2017, 2019 and 2021). Sediment and seawater samples were then collected at each site (except in 2018 and 2019, when water samples were not collected). Operational monitoring sites were sampled every year from 2016 to 2022 in both coastal and transitional waters. In both surveillance and operational monitoring, the water column was sampled seasonally (3 – 6 campaigns per year), while sediments were sampled once a year (July – September). Salinity and temperature were measured in situ with CTD (conductivity-temperature-depth) probe (Sea-Bird SBE 25), while pH was measured with a pH meter (Mettler-Toledo, SevenCompact S210). Transparency was determined as the depth of disappearance of a white Secchi disk (diameter 30 cm) when viewed from the deck of a ship. In addition, dissolved organic carbon (DOC) in the water column and total organic carbon (TOC) in the sediments were measured.
The monitoring program established under the MSFD included the analysis of TBT concentrations in mussels’ tissue at 31 coastal sites. This monitoring began in 2017 and was carried out annually until 2023 (except 2018 when mussels were not collected). The mussels were collected within the same water bodies where water and sediment were collected, but usually not at the same locations (Figure 1; Supplementary Table S3). They were collected along the coastline where they were available, in smaller or large ports, in the urban areas as well as on the rocky shores away from the urban areas.
Water samples were collected using a ˝butterfly˝-type water sampler. In the surveillance monitoring, samples were taken only from the surface layer (depth of 0.5 m), while in the operational monitoring samples were taken from both surface and bottom layers. The depth at which the bottom water samples were taken varied from site to site and was determined by the depth of the water column at a particular location. Samples were transferred to clean dark glass bottles (1 L) and acidified with concentrated HNO3 to a pH of 2 immediately after sampling. They were stored in the dark at a temperature of 4°C until analyzes. The analyzes were carried out within 3 weeks of sampling.
The sampling of sediments (0 - 5 cm) was carried out with a grab sampler. The sediments were frozen within a few hours of sampling and transported frozen to the laboratory. They were freeze-dried or air-dried in the dark at 20°C, sieved (2 mm) and homogenized by grinding. The dried samples were stored at -20°C until the analyzes, which were carried out within 6 months of sampling.
The mussels Mytilus galloprovincialis were collected from the docks, rocky shores or boat strands, depending on availability. To reduce the influence of biological factors on TBT accumulation, such as reproductive cycle and metabolism rate, mussels were collected in early spring (March to April) before the spawning season. The size of the mussels was 3 – 6 cm (age 1 – 2 years). The gender of the mussels was not determined. Approximately 30 specimens were collected from each sampling site, placed in a clean plastic bag and transported to the laboratory in a refrigerated container. The soft tissue was removed from the shells, mixed together and homogenized in a blender, and freeze-dried. The dried samples were stored at -20°C until analyzes, which were performed within three months of sampling.
The analytical method used for the analysis of TBT in seawater is described in Furdek et al. (2012). In brief, TBT was extracted from 300 ml of non-filtered seawater, while simultaneous extraction and derivatization in a sodium acetate-acetic acid buffer (pH 4.8) was performed with NaBEt4 (1%, w/v) and hexane, and mechanical shaking for 30 min at 350 rpm. Instrumental analyzes were performed using a gas chromatograph (GC, Agilent 6890) coupled to an inductively coupled plasma mass spectrometer (ICP-MS, Agilent 7900). Quality control was performed by a recovery experiment with known amounts of TBT. The limit of quantification was 0.06 ng(TBT)/L.
The analytical methods used for the analysis of TBT in sediments and mussels are described in Furdek Turk et al. (2020) and Furdek et al. (2012), respectively. TBT was extracted from 2 g of dried sediments with acetic acid and ultrasonic-assisted stirring (30 min, 55 Hz), and from 0.7 g of dried mussel tissue (whole tissue) with 0.1 mol/L HCl in methanol and ultrasonic-assisted stirring (30 min, 55 Hz). For both sediments and tissues, derivatization of compounds in the extract was performed in sodium acetate-acetic acid buffer (pH 4.8) with NaBEt4 (1%, w/v) and transferred to hexane by mechanical shaking at 350 rpm for 30 min. The analyzes were performed using a gas chromatograph (GC, Varian CP 3800) with pulsed flame photometric detector (PFPD, Varian) or GC (Agilent 8890) coupled to a triple quadrupole mass spectrometer with inductively coupled plasma (ICP-QQQ, Agilent 8900). Quality control of the analytical procedure was performed by analyzing the certified reference materials (CRM) for mussels (CE 477, ERM, European Commission, Geel, Belgium) and marine sediments (PACS 2, Ottawa, Canada). The quantification limit was 1.0 ng(TBT)/g(d.w.) for both matrices. The accuracy of all three methods was further confirmed by successful participation in the international proficiency tests for TBT determination in water, sediment and biota (WEPAL-QUASIMEME Proficiency Tests). The analyzes were performed in duplicate.
The concentrations of DOC were determined in filtered (glass fiber GF/F filter, Whatman, pore-size 0.7 μm) seawater samples by the high-temperature catalytic oxidation (HTCO) method with non-dispersive infrared (NDIR) detection using a TOC-VCPH carbon analyzer (Shimadzu, Japan), as described in Dautović et al. (2017). The TOC analyzes in the sediment samples were performed using the same method, with SSM-5000A module (Shimadzu, Japan) in a stream of pure oxygen at 900°C with a mixture of Pt/Si and CoO catalyst, calibrated with glucose. To remove the inorganic carbon, the sample was acidified (2 M HCl) and left overnight at a temperature of about 40°C (Dautović et al., 2023). Both methods are accredited according to HRN EN ISO/IEC 17025:2017 (certificate no. 1577). The analyzes were performed in duplicate.
The data were statistically analyzed using Statistica 7.0 (StatSoft, Inc.). For the calculation of average concentrations, the measurement result was set to half of the value of the limit of quantification if the concentration was below the limit of quantification (< LOD). The average concentrations were expressed as mean ± standard deviation. As the data were not normally distributed (Shapiro-Wilk normality test), a Kruskal-Wallis and Mann-Whitney U tests were performed to examine whether the concentrations differed significantly between the groups.
The annual average concentrations (AAC) of TBT detected in the water column at 37 sites in coastal waters are shown in Figure 2, while the individual concentrations detected in each sampling campaign (season) at each site during the year are shown in Supplementary Figure S1 (surveillance monitoring) and Supplementary Figure S3a (operational monitoring). In addition, the basic statistical data of the entire data set presented in this study are listed in Table 1. During the surveillance monitoring conducted at 31 sites in 2017 and 2021, TBT was detected in the surface waters at 6 sites (19% of sites) in 2017 and 10 sites (32% of sites) in 2021, with similar levels in both years (Figure 2). The AAC ranged from < LOQ to 0.41 ± 0.27 ng(TBT)/L, while the average of all AACs for 2017 and 2021 was 0.058 ± 0.062 and 0.064 ± 0.076 ng(TBT)/L, respectively. TBT was only detected at 4 sites (C16a, C24, C27 and C30) in both annual campaigns. In contrast, TBT was detected in each year at each of the 6 sites sampled annually in 2017 – 2022 as part of operational monitoring; the AAC then ranged from < LOQ to 0.99 ± 1.38 ng(TBT)/L, while the average of all AAC (considering all sites in a year) was similar for all years and ranged from 0.44 ± 0.39 (in 2022) to 0.55 ± 0.30 ng(TBT)/L (in 2018). The highest single concentration of 2.93 ng (TBT)/L was detected at site C15a in summer 2018 (Supplementary Figure S3a). The most contaminated sites were the port of Split (C15a), Kastela Bay (C16, C16a, C17a), the area in front of the port of Zadar (C24), Bakar Bay (C37), the port of Rijeka (C38) and the port of Pula (C45). As expected, the results showed a much higher contamination of the operational monitoring sites (Mann-Whitney U test, p < 0.01). The decreasing trend in TBT levels in the period 2017 – 2022 was generally not observed; only at sites C17a and C45 a slight but statistically insignificant decrease in TBT levels was observed. An increase in TBT levels over the years has been observed at site C16, although this is not statistically significant.
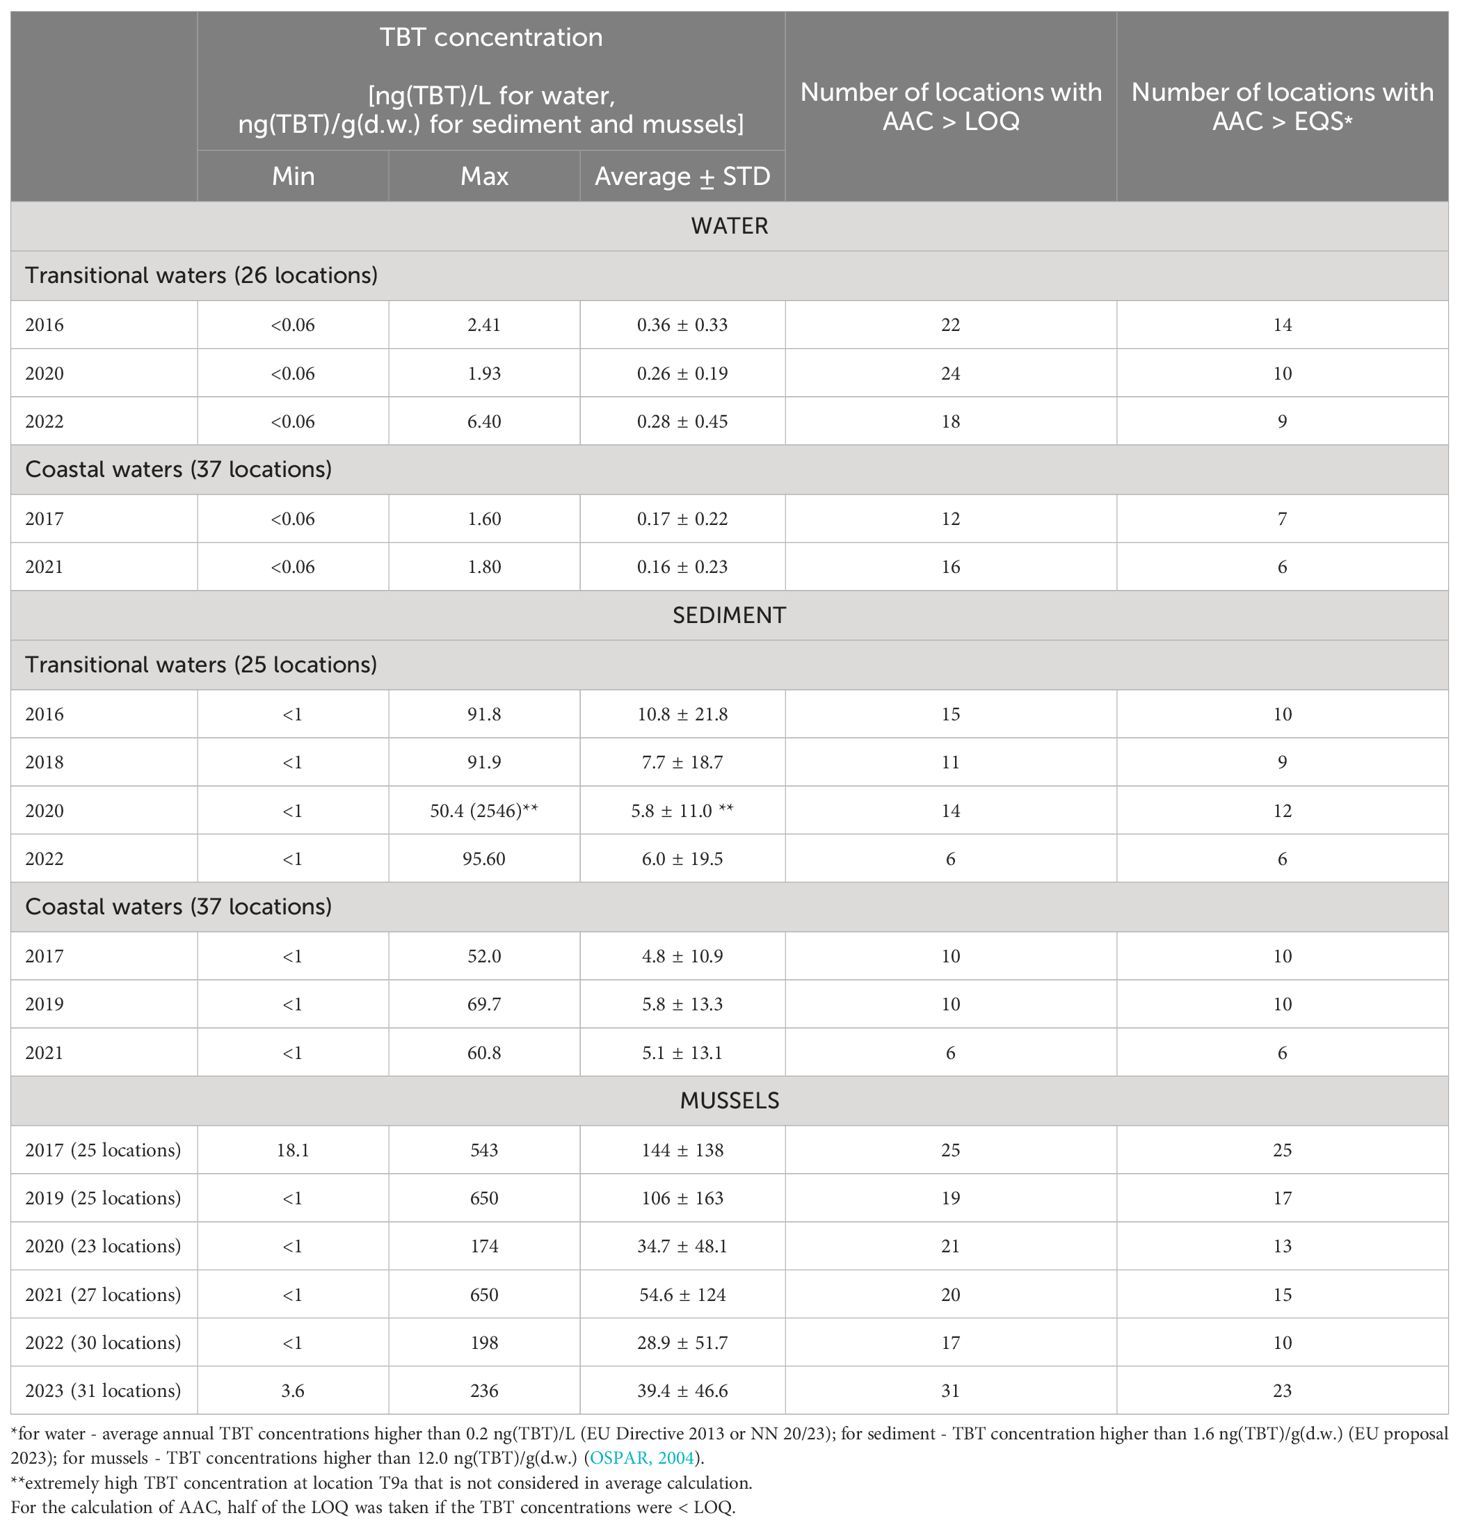
Table 1. Basic statistical data on TBT concentrations in seawater, sediments and mussels determined in the period 2016 - 2023 as part of the surveillance and operational monitoring of Croatian Adriatic waters.
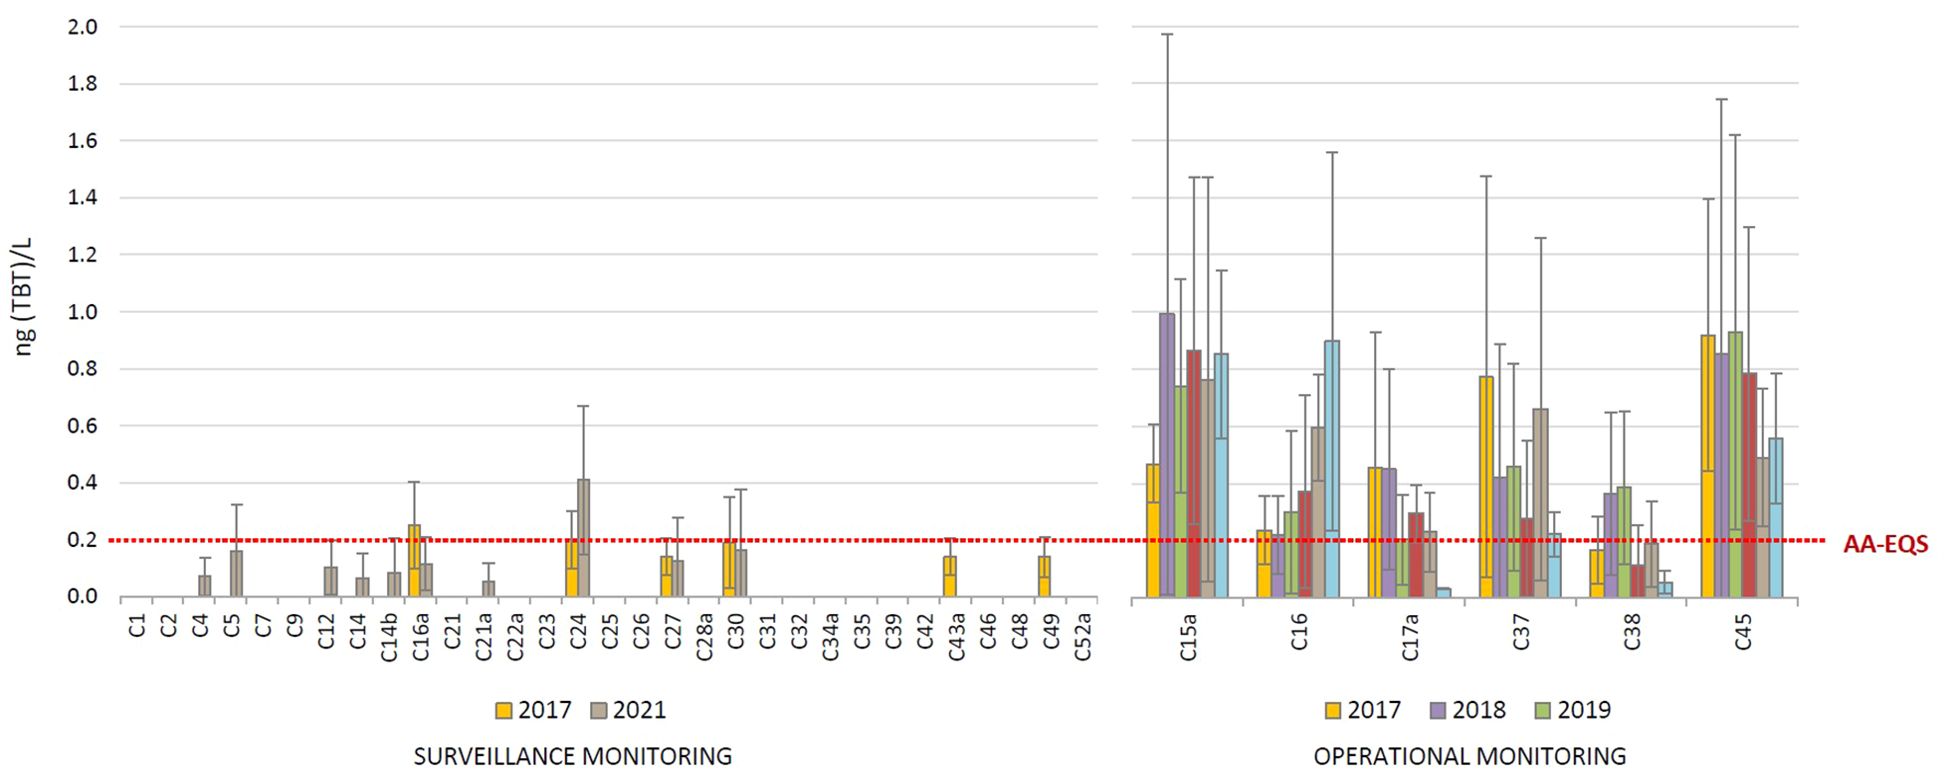
Figure 2. Average annual tributyltin (TBT) concentrations in the surface layer of coastal waters, determined in the period 2017 - 2022 as part of the surveillance and operational monitoring of the Croatian Adriatic within Water Framework Directive (2000/60/EC). (AA-EQS, annual average concentration - Environmental Quality Standard).
The average annual TBT concentrations detected in the surface waters of the transitional waters are shown in Figure 3, while the individual concentrations detected in each sampling campaign (season) at each site during the year are shown in Supplementary Figure S2 (surveillance monitoring) and Supplementary Figure S3b (operational monitoring). In general, TBT levels and the frequency of TBT detections were higher in transitional waters than in coastal waters. The surveillance monitoring of transitional waters was carried out at 20 sites in 2016, 2020 and 2022; TBT was detected at 70, 95 and 65% of the sites, respectively. It was detected in at least one annual campaign, while at 8 sites it was detected in all three years (T2, T5b, T7, T8, T10, T20, T21 and T22). In general, the highest concentrations were detected at sites T2, T5a, T5b, T10, T20 and T24. The highest single concentration of 6.40 ng (TBT)/L was recorded at site T5b in May 2022 (Supplementary Figure S2c). The AAC ranged from < LOQ to 1.82 ± 3.07 ng(TBT)/L, while the average of all AAC (considering all sites per year) was 0.36 ± 0.20, 0.26 ± 0.21 and 0.28 ± 0.47 ng(TBT)/L in 2016, 2020 and 2022, respectively. Although the decrease in TBT levels was not generally observed during investigated period, concentrations at some specific sites (T4a, T8, T13b, T14, T17a, T20, T21 and T22) decreased over the years. In the frame of the operational monitoring carried out annually in the period 2016 – 2022, TBT was detected at 6 investigated sites in each year (except at site T3, where it was not detected in 2021 – 2022). The average annual concentrations at individual sites were in the range from < LOQ to 1.59 ± 0.88 ng(TBT)/L. The average of all AAC (taking into account all sites per year) was highest in 2016 (0.52 ± 0.55 ng(TBT)/L) and 2020 (0.41 ± 0.30 ng(TBT)/L), but similar in 2018, 2019, 2021 and 2022 (from 0.20 ± 0.17 to 0.28 ± 0.26 ng(TBT)/L). The sites investigated as part of operational monitoring are more polluted compared to surveillance monitoring sites, although the difference is not as pronounced as for coastal waters. Finally, the most polluted sites in transitional waters were T5b (Neretva estuary, port of Ploče), T10 (Jadro estuary), T13 (Krka estuary), T18 (Rječina estuary) and T20 (Raša estuary).
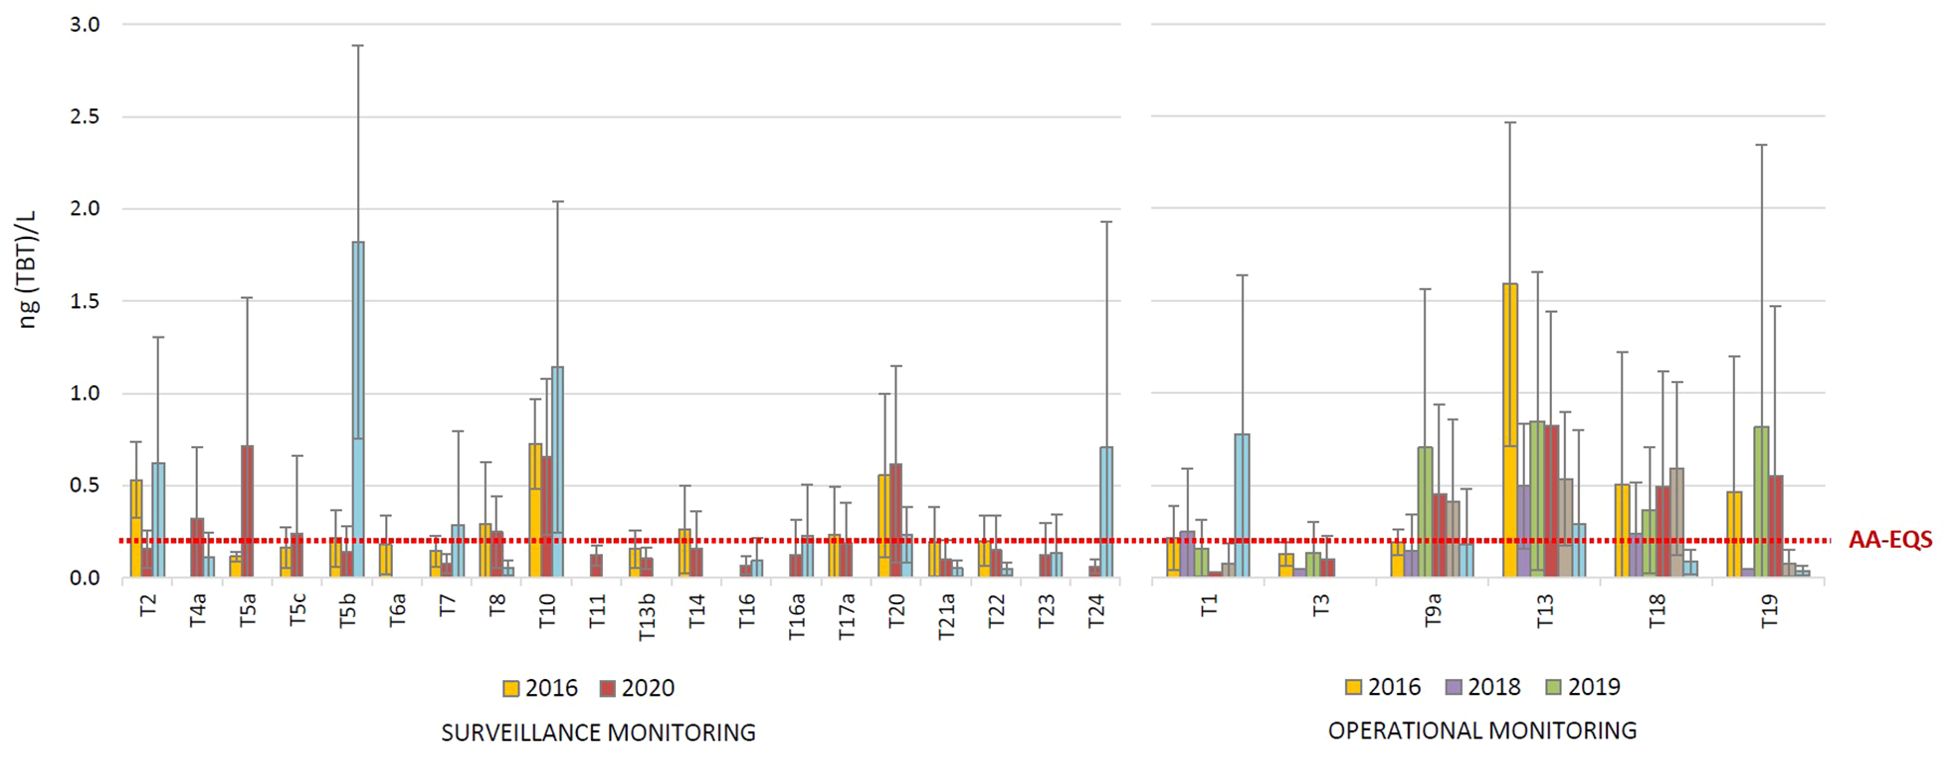
Figure 3. Average annual tributyltin (TBT) concentrations in the surface layer of transitional waters, determined in the period 2016 - 2022 as part of the surveillance and operational monitoring of the Croatian Adriatic within Water Framework Directive (2000/60/EC). (AA-EQS, annual average concentration - Environmental Quality Standard).
The seasonal distribution of TBT in the water column is shown in Supplementary Figures S1, S2 (for surveillance monitoring) and in Supplementary Figure S3 (for operational monitoring) where individual concentrations detected in each sampling campaign (season) at each site are presented. In the surveillance monitoring of coastal waters, the higher concentrations of TBT were more frequently detected in the winter season (i.e. November to February; average is 0.055 ± 0.13 ng(TBT)/L) than in spring (i.e. March to May; average is 0.004 ± 0.019 ng(TBT)/L) and summer (i.e. June to September; average is 0.032 ± 0.089 ng(TBT)/L) (Supplementary Figure S1); however, the concentrations in winter were not significantly higher compared to summer and spring seasons. On the other hand, in the big city ports studied as part of the operational monitoring, higher concentrations were generally found in the summer season, and were significantly higher than those in winter (Kruskal-Wallis test; p < 0.01). The average of all concentrations detected in summer months was 0.74 ± 0.38 ng(TBT)/L, while in spring and winter was 0.43 ± 0.23 and 0.32 ± 0.14 ng(TBT)/L, respectively (Supplementary Figure S3a). In the transitional waters, considering both surveillance (Supplementary Figure S2) and operational monitoring sites (Supplementary Figure S3b), higher TBT concentrations were found in spring and summer than in winter season (Kruskal-Wallis test; p < 0.05); an average of all concentrations detected in spring, summer and winter season was 0.35 ± 0.87, 0.30 ± 0.49 and 0.14 ± 0.18 ng(TBT)/L, respectively.
As part of the operational monitoring, TBT was determined in both the surface and bottom layers of the water column at 6 sites in coastal waters and 6 sites in transitional waters. The AAC determined in the surface and bottom waters are shown in Figure 4. In coastal waters, TBT concentrations in the surface layer were generally somewhat higher (up to 2-fold) than in the bottom layer. At the transitional water sites, however, concentrations in the bottom layer were higher (up to 15-fold) than in the surface layer, with the only exception of site T13, where higher concentrations (10-14-fold) were measured in the surface layer.
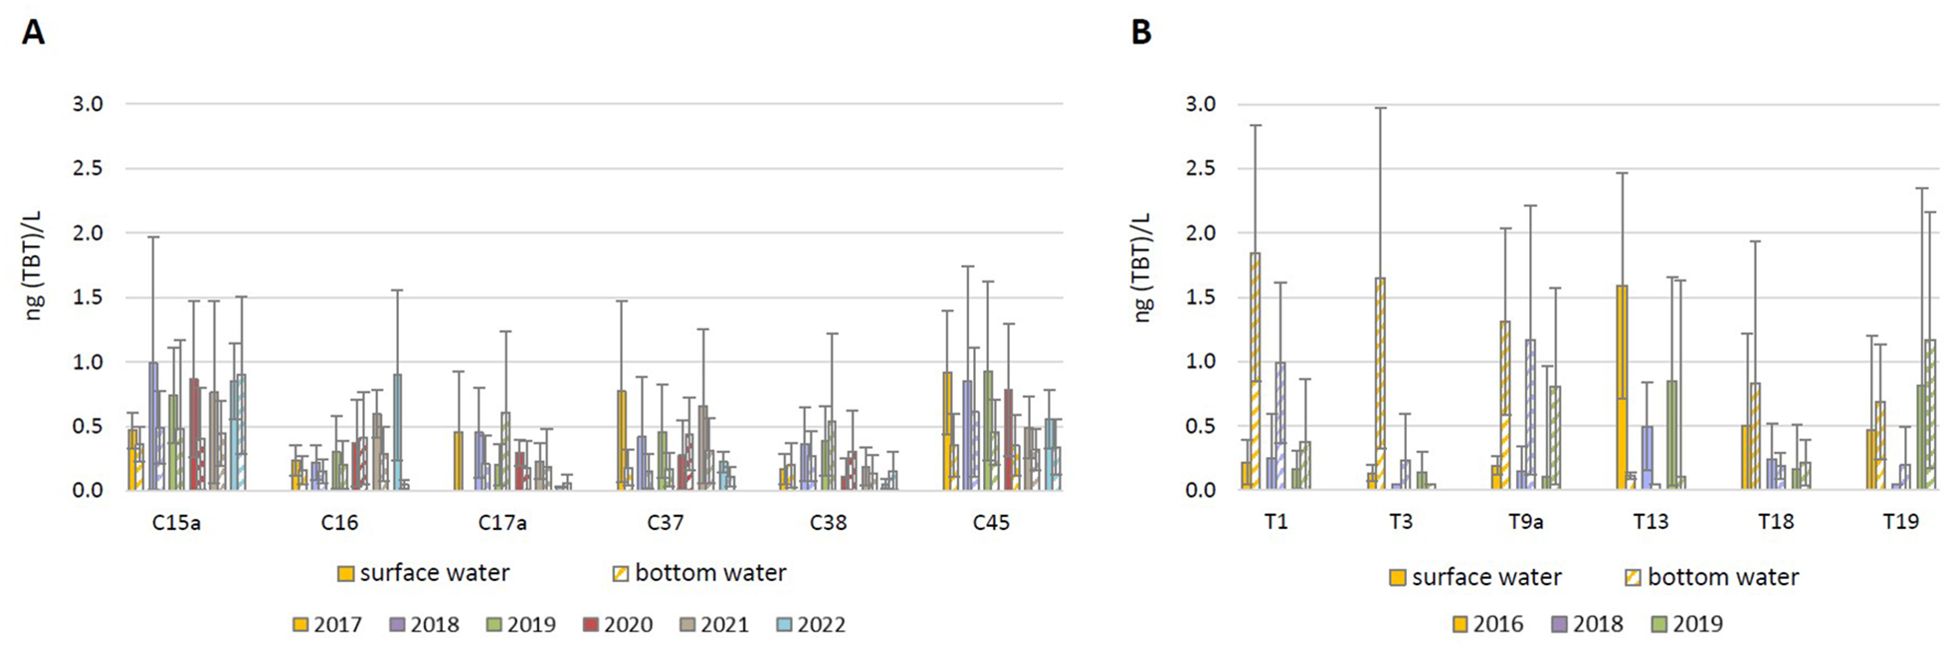
Figure 4. Average annual tributyltin (TBT) concentrations in the surface and bottom water layers at 6 sites in (A) coastal waters and (B) transitional waters, determined in the period 2016 - 2022 as part of the operational monitoring of the Croatian Adriatic within Water Framework Directive (2000/60/EC).
The TBT concentrations determined in the surface sediments of the coastal waters in the period 2017 – 2022 are shown in Figure 5. At the surveillance monitoring sites, TBT was detected at 11 sites (35% of the sites) in concentrations from < LOQ to 69.7 ng(TBT)/g(d.w.). In 2017, it was detected at 4 sites (C23, C34a, C39 and C42), in 2019 at 5 sites (C9, C14, C21, C35 and C43a) and in 2021 at only 2 sites (C14b and C24). TBT was not detected at any of the sites in more than one annual campaign. In contrast, TBT was detected at all 6 operational monitoring sites in almost every year of the period 2017 – 2022, in concentrations from 4.8 to 52.5 ng(TBT)/g(d.w.). The simultaneous pollution of sediment (Figure 5) and water column (Figure 2) was only detected at 4 sites (C14, C14b, C24 and C43a). The exceptions are operational monitoring sites where TBT pollution was confirmed by high TBT concentrations both in waters and in sediments. A clear decreasing trend over time could not be observed at any of these sites, as TBT concentrations were either consistently high or fluctuated over the years; however, the increased TBT levels in 2022 compared to previous years were not observed at any of the sites. The highest long-term sediment contamination was observed at sites C15a (Port of Split), C37 (Bakar Bay) and C45 (Port of Pula).
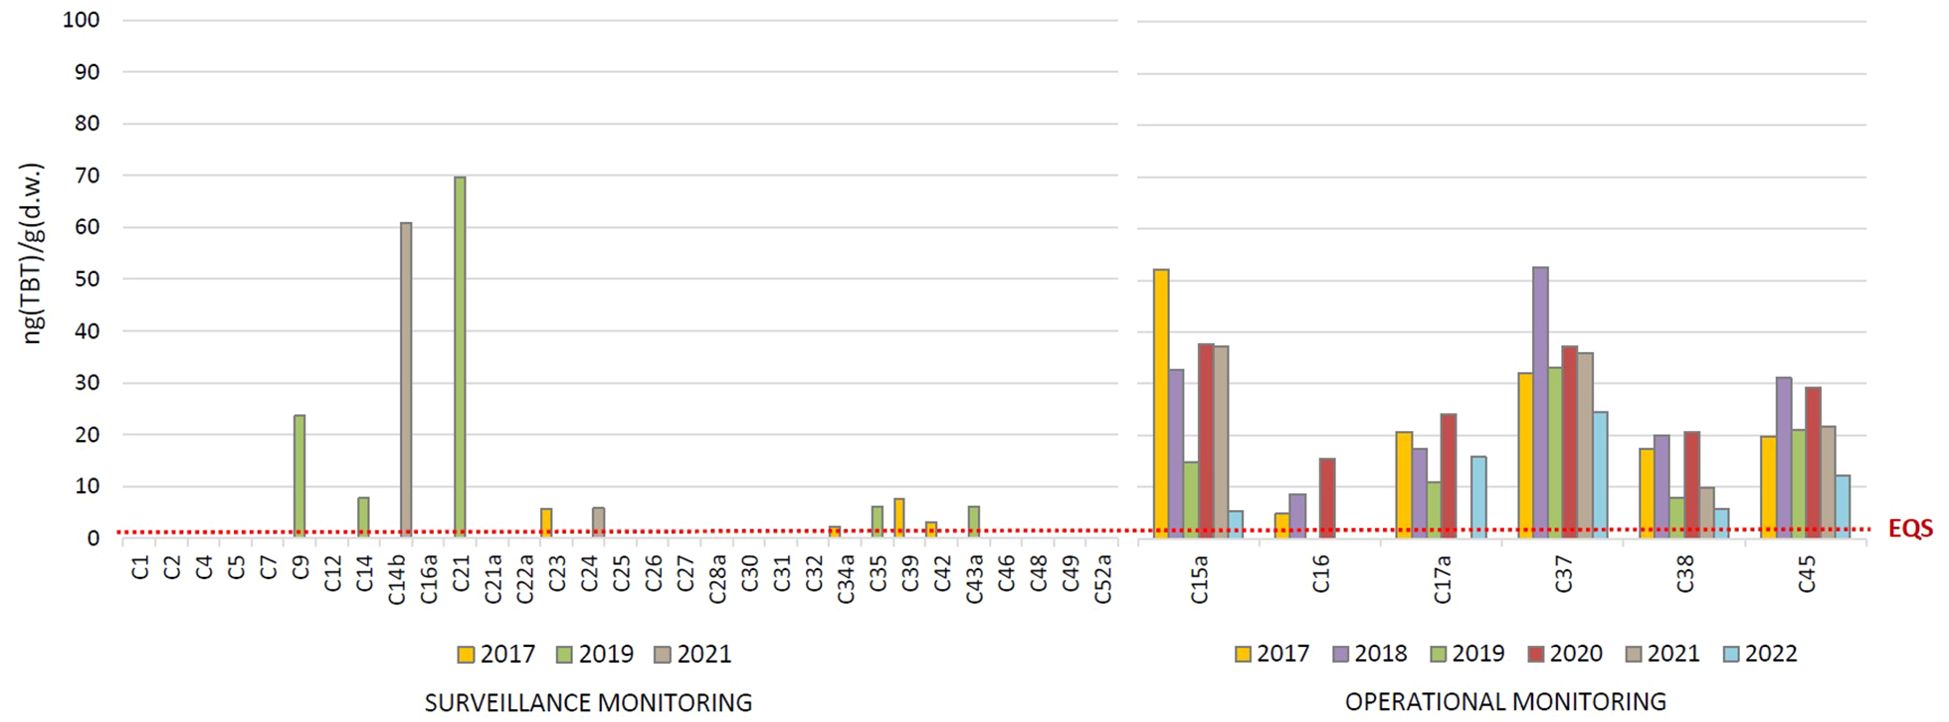
Figure 5. Tributyltin (TBT) concentrations in the surface sediments of coastal waters, determined in the period 2017 - 2022 as part of the surveillance and operational monitoring of the Croatian Adriatic within Water Framework Directive (2000/60/EC). (EQS, Environmental Quality Standard).
The TBT concentrations determined in the surface sediments of the transitional waters in the period 2016 – 2022 are shown in Figure 6. TBT was detected in sediments at 11 out of 19 (58%) surveillance monitoring sites in the concentration range between 1.0 and 58.5 ng(TBT)/g(d.w.); in 2016, 2018 and 2020 it was detected at 7 – 9 sites, but in 2022 the number of sites decreased to 2 (sites T2 and T10). On the other hand, TBT was detected at each of the 6 operational monitoring sites in concentrations from < LOQ to 93.3 ng(TBT)/g(d.w.) (except the extremely high concentration of 2547 ng(TBT)/g(d.w.) detected at site T9a in 2020), while sites T3 and T19 were much less contaminated compared to sites T1, T9a, T13 and T18. The long-term TBT pollution over the entire period 2016 – 2022 was determined at 6 sites of operational monitoring (T1, T2, T9a, T10, T13 and T18). Only at two of these sites (T1 and T2 – the estuary of the Ombla River) a decreasing trend in TBT concentrations was observed during the period studied, while concentrations at the other sites were either variable (T9a, T13, T18) or consistently high (T10). The highest pollution of sediments in the transitional waters was observed in the estuary of the Ombla River (T1, T2), the Jadro river (T9a, T10), the Krka River (T13) and the Rječina river (T18). The locations where the highest TBT levels were detected in the sediments were not always the same as in the water column, even though both types of samples were taken at the same location (Figures 3, 6). In general, the surface sediments in the transitional waters (Figure 6) were slightly more contaminated with TBT than in the coastal waters (Figure 5), even though the difference in pollution is not statistically significant and not as pronounced as for the water column (Figures 2, 3).
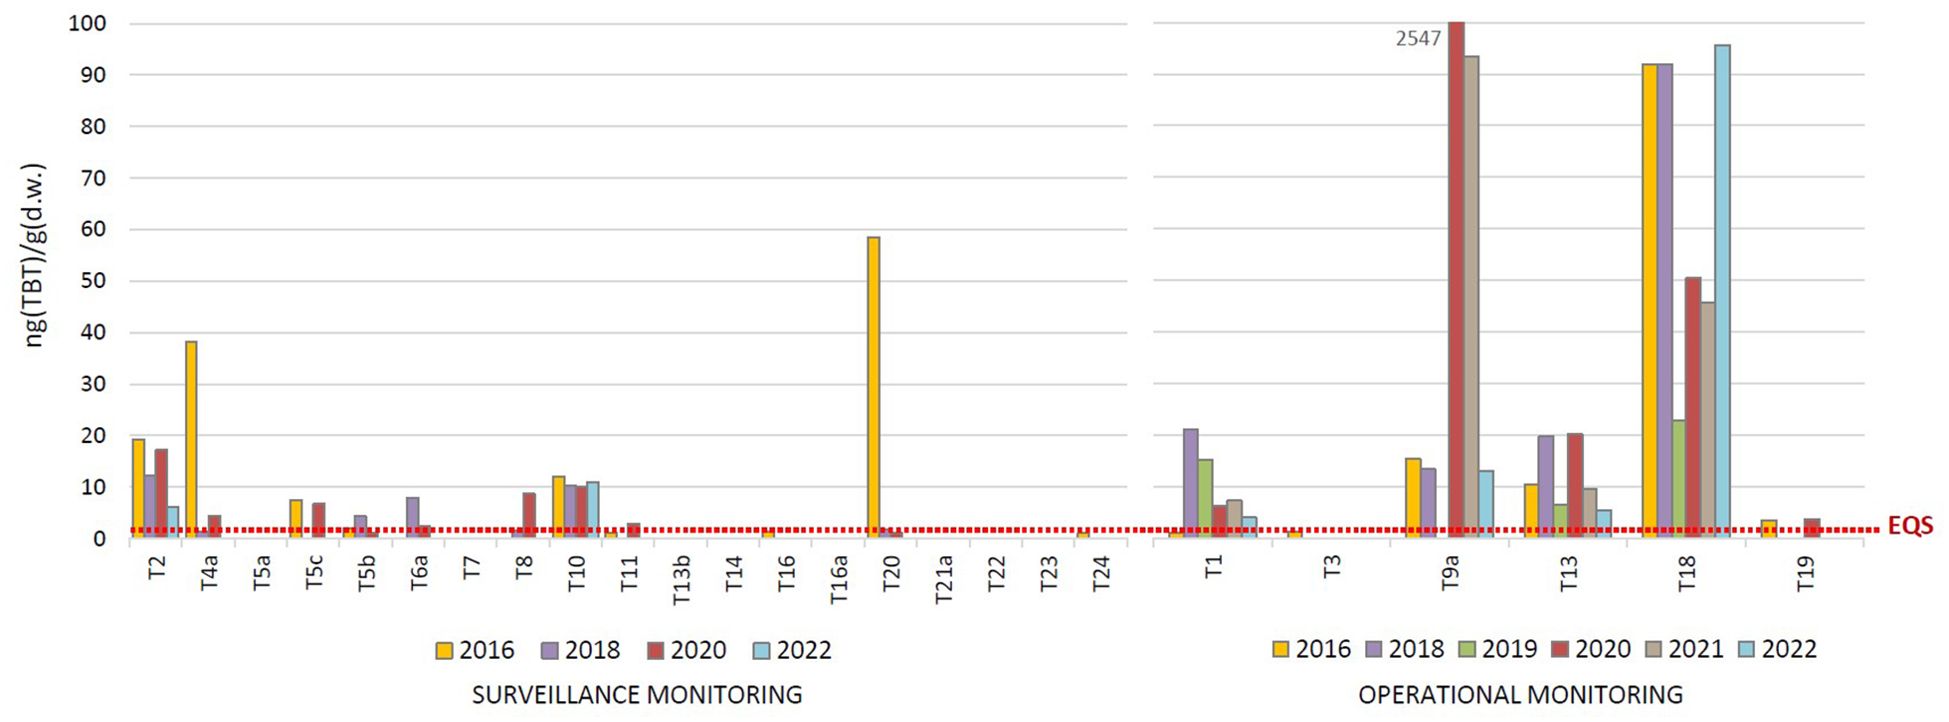
Figure 6. Tributyltin (TBT) concentrations in the surface sediments of transitional waters, determined in the period 2016 - 2022 as part of the surveillance and operational monitoring of the Croatian Adriatic within Water Framework Directive (2000/60/EC). (EQS, Environmental Quality Standard).
The spatial distribution of TBT in mussels sampled in coastal waters at 23 - 31 sites (depending on the year) in the period 2017 – 2023 is shown in Figure 7. In general, TBT was detected in mussels’ whole tissue at more than 75% of the sites, while in 2017 and 2023 it was detected at all sites. The exception is 2022, when it was detected at 43% of the sites. The individual concentrations ranged from <1 to 655 ng(TBT)/g(d.w.), while the average annual concentrations (considering all sites in a year) ranged from 28.9 ± 51.7 (2022) to 144.4 ± 137.6 ng(TBT)/g(d.w.) (2017), being significantly higher in 2017 than in 2019 - 2023. The high TBT levels [> EAChigh of 175 ng(TBT)/g(d.w.)] were found both in large city ports (M15a, M38 and M45) and in small local ports (M2, M23, M24 and M46). At half of the investigated sites, no decrease in TBT levels was observed over the entire period (M1, M7, M14, M15a, M16, M16b, M16a, M32, M37, M42, M43a, M45, M49 and M49a), while at other sites a decreasing trend in TBT concentrations from 2017 – 2019 to 2023 could be observed (M2, M2a, M7b, M23, M24, M27, M28a, M30, M38, M39 and M46) (Figure 7).
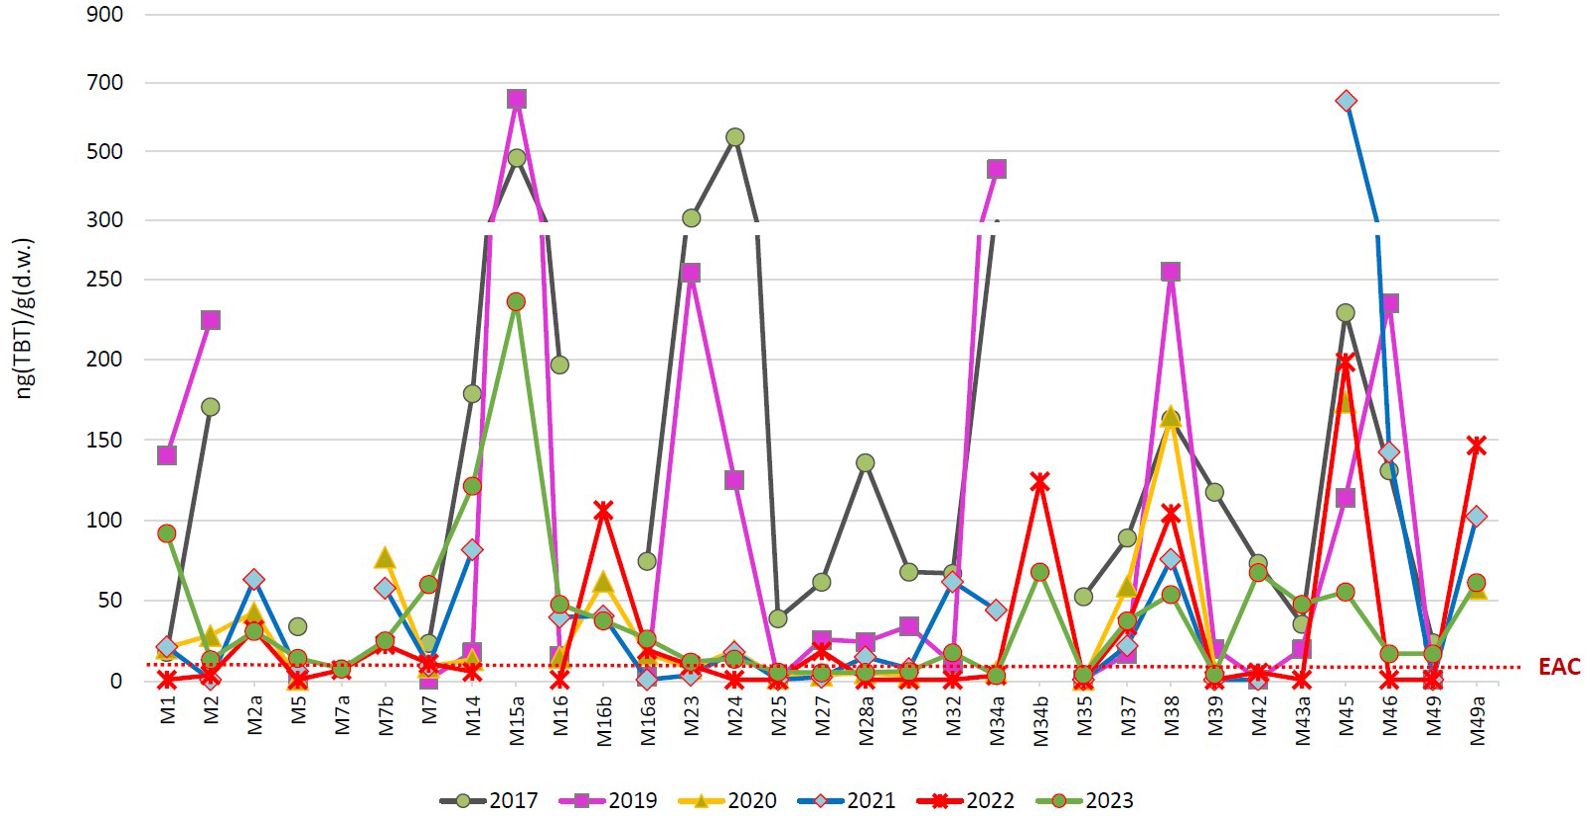
Figure 7. Tributyltin (TBT) concentrations in mussels M. galloprovinciallis determined in the period 2017 - 2023 as part of the monitoring of coastal waters of the Croatian Adriatic within Marine Strategy Framework Directive (2008/56/EC). (EAC, Environmental Assessment Criteria).
Physicochemical parameters of the water column, i.e. temperature, salinity, pH and transparency, are given in Supplementary Table S4 (for coastal waters) and Supplementary Table S5 (for transitional waters). The temperature ranged from 4.8 to 28.0°C, with an average temperature of 17.2 ± 1.6°C in the coastal waters and 16.8 ± 2.1°C in the transitional waters. The pH ranged from 7.2 to 8.6, with the average value in the transitional waters (8.1 ± 0.2) being similar to that in the coastal waters (8.2 ± 0.0). Salinity ranged from 20.0 to 39.1 in the coastal waters, with an average value of 36.8 ± 2.3 and 38.1 ± 0.4, in the surface and bottom layers, respectively. In the transitional waters, salinity ranged from 0.2 to 28.5; an average value in the surface layer (20.7 ± 12.2) was significantly lower than in the bottom layers (30.2 ± 6.4) (Mann-Whitney U-test; p<0.05), and it was lower in the inner part of the estuary and higher in the outer part of the estuaries. One of the main characteristics of Croatian karst estuaries is the vertical stratification in terms of salinity and the pronounced halocline. The transparency, measured as the depth of disappearance of a Secchi disk, was between 0.2 and 28 m in the transitional waters, and between 2.5 and 37.8 m in the coastal waters. The transparency in the coastal waters was significantly higher than in the transitional waters (Mann-Whitney U-test, p<0.05), while average values were 14.9 ± 4.3 and 5.8 ± 4.3 m, respectively.
In addition, the concentration of organic matter in TOC and DOC fraction was measured, and the results are summarized in Dautović et al. (2023). The highest single DOC concentration of 3.778 mg/L was measured in the bottom layer of the water column at site T1 (May 2022), while the lowest concentration of 0.362 mg/L was measured in the surface layer at site T17a (winter 2022). The average annual concentrations at a given site in coastal waters ranged from 0.727 ± 0.146 (C37 in 2022) to 1.400 ± 0.477 mg/L (C42 in 2021), with the average of all concentrations being 1.007 ± 0.099 mg/L. The higher concentrations were measured at sites C15a, C16, C27, C32, C37, C42, C43a, C45, C46, C48, and C52a. In transitional waters, DOC concentrations ranged from 0.506 ± 0.112 (T9a in 2016) to 1.536 ± 0.478 mg/L (T21a in 2019), while the average of all concentrations was 0.988 ± 0.189. The higher concentrations were measured at sites T5b, T10, T11, T13, T14, T16a, T19, T20, T22, T23, and T24. The DOC concentrations in the coastal waters were significantly higher than in the transitional waters (Mann-Whitney U-test, p<0.05). In coastal waters, the DOC concentrations significantly differ between seasons (Krusal-Wallis, p<0.05), and were highest in summer and lowest in winter. In the transitional waters, DOC concentrations were significantly higher in summer than in spring and winter (Krusal-Wallis, p<0.05). Based on the calculated average DOC concentrations, the status of all coastal and transitional waters can be described as oligotrophic (<1.44 mg/L), with the exception of sites T21a (in 2016 and 2020) and T18 (in 2018), which are mesotrophic (1.44 – 2.50 mg/L).
The TOC concentration in the sediments ranged from 0.1% (P1 in 2016, P3 in 2016 and 2022) to 6.1% (C37 in 2019). Considering all sampling campaigns, the average of all TOC concentrations measured in the sediments of transitional waters was 1.4 ± 0.8%, and was thus significantly higher than in the sediments of coastal waters (1.2 ± 1.2%) (Mann-Whitney U-test, p<0.05). The higher concentrations in coastal waters were measured at sites C21a, C37, C43a and C45, and at sites T5b, T9a, T10, T11, T13, T18, T23 and T24 in the transitional waters.
The monitoring of TBT pollution carried out within the framework of the WFD and MSFD showed the widespread pollution of the coastal environment of the Croatian Adriatic in the period 2016 – 2023. Both the spatial and temporal distribution of TBT in water column and sediments, as well as the level of pollution, varied among sites. The transitional waters in the estuaries were in general more polluted with TBT than coastal waters, while the TBT distribution detected in mussels further confirmed the widespread pollution of coastal waters. Low levels of pollution occur sporadically in areas far from the coast, but the most polluted are coastal areas where intensive shipping traffic takes place, such as large city ports and bays within urban areas, as well as river estuaries.
The level of TBT pollution was assessed on the basis of the relevant environmental criteria. The percentage of sites where TBT was detected (i.e. TBT concentration > LOQ) and the percentage of sites where the measured TBT concentrations were above the environmental criteria (i.e. TBT concentration > EQS or EAC) are shown separately for each sample type and the sampling year in Figure 8. The lowest percentage of samples containing TBT relates to sediments (16 – 27% in coastal waters and 24 – 60% in transitional waters), the slightly higher percentage relates to waters (32 – 43% in coastal waters and 69 – 92% in transitional waters) and the highest percentage relates to mussels (57 – 100%). However, the TBT content did not exceed the environmental criteria at all sites. TBT in the water was above AA-EQS of 0.2 ng(TBT)/L at 15 – 20% of the sites in coastal waters and at 35 – 50% of the sites in transitional waters. In sediments, it was above the proposed EQS of 1.6 ng(TBT)/g(d.w.) at 15 – 30% of the sites in coastal waters and at 20 – 50% of the sites in transitional waters. The worst environmental status was assessed on the basis of TBT detected in mussels as concentrations were above the EAClow at 30 – 70% of the sites (depending on the year, Figure 8), while at 30% of the sites were above the EAChigh at some point during the investigated period. At all these sites where TBT is above the EQS or EAC, negative effects on marine biota are expected and the occurrence of imposex in gastropods is very likely.
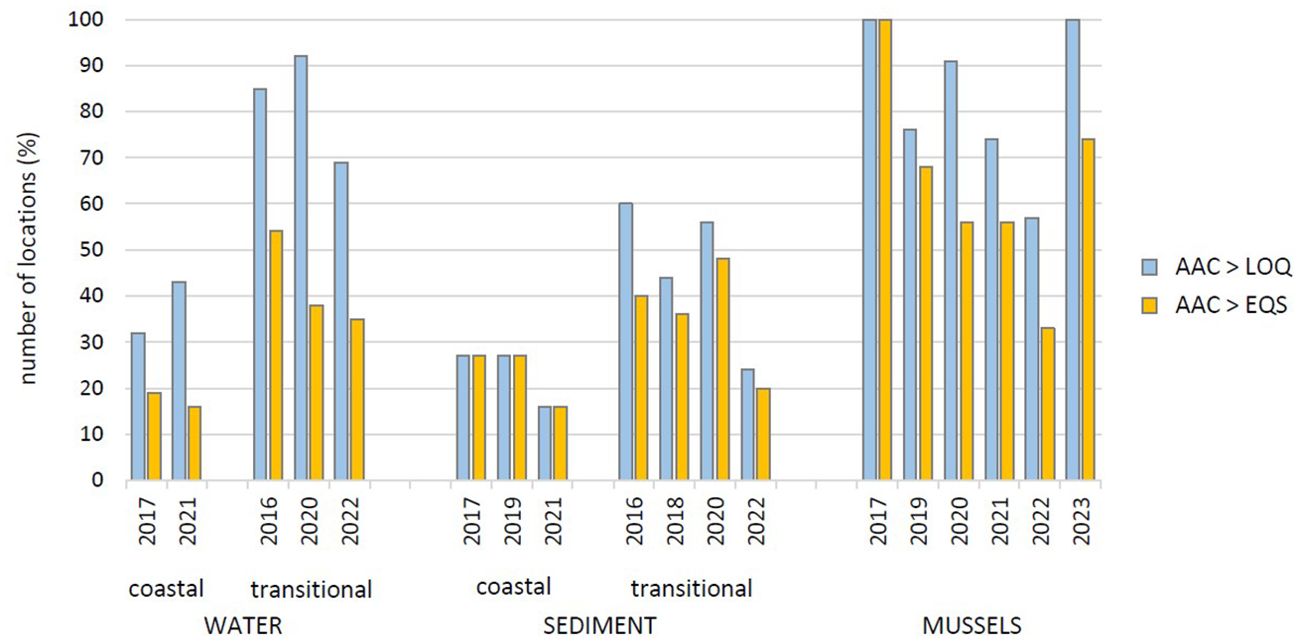
Figure 8. The assessment of tributyltin (TBT) pollution based on the percentage of locations where TBT was detected in water, sediment and mussels (i.e. where AAC > LOQ) and where the measured TBT concentrations were above the environmental criteria (i.e. where AAC > EQS or EAC). (AAC, Annual Average Concentrations; LOQ, Limit of Quantification; EQS, Environmental Quality Standards; EAC, Environmental Assessment Criteria).
The results presented in this study show that the coastal environment of the Croatian Adriatic was still contaminated with TBT in 2023, as the levels in mussels were above the EAC values at more than 60% of the sites. This suggests that TBT has recently entered the waters through the ongoing use of banned TBT-based antifouling paints, which are apparently still produced and available on the market (Uc-Peraza et al., 2022). The contaminated sediments should not be disregarded as a potential source of pollution of a water column, nor should paint particles usually found in the sediments near service hoists (Turner, 2010; Furdek Turk et al., 2020). Recent studies in the Nordic countries have shown that subsurface layers of old TBT paints that are not properly removed from the boat represent a significant source of TBT pollution (Lagerström et al., 2017, 2019). Some studies have also identified urban runoff and wastewater treatment effluents as a potential source of TBT to the marine environment (Cornelissen et al., 2008; Chahinian et al., 2013), but their contribution to the overall TBT pollution is rarely discussed in the literature.
There are two main approaches to tackling the problem of the ongoing pollution. First, both regulatory authorities and non-governmental organizations should act to control the illegal market and prevent the use of TBT-based antifouling paints. Although the ban on the trade and use of these paints applies to all ships, regardless of their length and purpose (1907/2006/EC), only ships of 400 gross tonnage or more in weight and ships of 25 meters or more in length, are required to be inspected or have a declaration of compliance with the regulation. Smaller ships do not have to be controlled (782/2003/EC), and therefore recreational craft and fishing vessels are not subject to any control of the antifouling paints used. This control should be implemented, but also the methodology for the routine control of antifouling paint applied should be developed. For example, Lagerström et al. (2019) proposed a simple method for rapid screening and identification of vessels coated with banned organotin paint by measuring Sn on the hulls with a portable X-ray fluorescence (XRF) spectrometer. The second approach refers to the measures that should be taken to eliminate pollution in contaminated areas. Since dredging of contaminated sediments may lead to recontamination of the water column with TBT, alternative methods for in situ remediation should be considered, such as capping of contaminated sediments, but the application of these alternative methods is still under investigation (Lofrano et al., 2017). As the natural remediation of TBT-contaminated sediments is a slow process, current research topic is to define biotechnological processes that could accelerate the bioremediation, but this methodology is still far from commercial application (Cruz et al., 2015).
In coastal areas, as expected, the most polluted areas are those under strong anthropogenic influence that are exposed to intensive ship traffic, such as large city ports that handle the traffic of large ships (C15a, C38, C45), areas in front of large ports (C14b, C24) and various coastal bays and urban areas (C16, C17a, C37) (Figures 2, 4). Other coastal sites show minimal or no pollution of both the water and the sediment, but most of these sites are not exposed to intensive ship traffic as they are located in deeper waters more than 1 km from the coast or in channels between islands. On the other hand, the TBT concentrations measured in mussels indicate widespread recent TBT pollution in the coastal region, both in urban areas and in large ports (M15a, M16, M16b, M38, M37, M45) as well as in small ports used by the local population to moor their boats (M1, M2, M14, M23, M24, M46, M49a), but also in areas that are only occasionally exposed to shipping traffic without ships being detained (M16a, M34b, M43a, M49) (Figure 7). The fresh input of TBT into the water column at the most polluted sites (C15a, C16, C17a, C37, C38 and C45; Figure 2) is confirmed by higher (up to 3 times) TBT concentrations measured in the surface than in the bottom water layer (Figure 4A).
The transitional waters are assessed to be more polluted with TBT than the coastal waters (Mann-Whitney U-test, p<0.05). The estuaries of all 10 rivers were classified as polluted with TBT, considering both TBT in the water and in the sediments (Figures 3, 5). The observed difference in pollution between coastal and transitional waters can primarily be explained by the distance from the pollution source and hydrodynamic conditions at a given site. Namely, while most sites in coastal waters are located away from the shore in deep waters, sites in estuaries are located closer to shore, in shallow waters or narrow channels. Offshore areas are under the influence of currents that favors the dilution of pollutants in large water volume. As TBT is only occasionally introduced into these areas, it is diluted or degraded in the deep-water column and only a minor quantity, if all, may reach the sediments. As there is no large port located at the mouth of river in any estuary, more polluted sites in transitional waters are in general located in the outer part of the estuary - T2 (Ombla estuary), T8 (Cetina estuary), T10 (Jadro estuary) and T18 (Rječina estuary) or in the middle part - T13 (Krka estuary – near city port).
The observed TBT distributions in coastal and transitional waters were investigated in relation to the physicochemical parameters such as salinity, pH, temperature, DOC and transparency of the water column. In general, low salinity increases the solubility of TBT (Fang et al., 2017; Inaba et al., 1995), which can lead to higher levels of dissolved TBT in the water column. In this study, apart from the fact that generally higher TBT concentrations were found in the transitional waters, the relationship between salinity and TBT distribution within the individual estuary was not found. Due to the lower salinity, the pH in transitional waters may be lower than in coastal areas, while even a small decrease in pH can shift the speciation of TBT from neutral TBTOH (which dominates in seawater at pH 8) to the higher fraction of cationic species (TBT+) (pKa of TBT is 6.51; Burton et al., 2004; Fang et al., 2017). This could significantly alter the behavior of TBT during sediment-water partitioning by increasing its adsorption to the negatively charged surface of organic material and mineral particles. As most of the estuaries studied are located in the carbonate environment, a pH below 8 (pH 7.6 – 7.9; Supplementary Table S5) is only determined at 4 sites (T17a, T19, T21a and T23), but increased TBT levels were observed only in the water column of the site T17a. However, when discussing the influence of salinity and pH on the behavior of TBT it should have in mind that this relationship is complex, and also depends on the composition of the mineral and organic fractions to which TBT is bound. Consequently, the observations on how salinity affects the behavior of TBT are often contradictory in the literature (Burton et al., 2004; Hoch and Schwesig, 2004; Fang et al., 2017).
Although the average temperature in the coastal waters was slightly higher than in the transitional waters, no correlation was found between the TBT distribution and the temperature of the water column in either the transitional waters or the coastal waters. On the other hand, the observed TBT distributions could be determined by the transparency of the water column. A higher transparency indicates a better penetration of UV light, which leads to a more efficient degradation of TBT by photolysis. Lower TBT levels in coastal compared to transitional waters can therefore be associated with a significantly higher transparency of the water column in coastal waters (Mann-Whitney U-test, p<0.05). In addition, the DOC content can influence the distribution of TBT by increasing its residence time in the water column. The complexation of TBT with DOC in solution prevents its degradation as well as its sorption on particles and deposition in sediments (Tessier et al., 2007). However, the correlation between DOC and TBT was not found in the water coulumn of both transitional and coastal waters, when considering all data (all sites in all sampling campaigns) or when considering the seasons separately (summer, spring, winter).
The relationship between DOC and TBT distribution, and the role of transparency of the water column on the determined TBT distributions, was further investigated considering only the operational monitoring sites where continuous and similar level of TBT input can be assumed. A significant negative correlation was established between transparency and TBT concentrations in the water column of coastal waters (Spearman, r=-0.83, p<0.05). A significant positive correlation was also found between TBT and DOC in the coastal waters in 2020 and 2022 (Spearman, r=0.48, 0.52; p<0.05; Supplementary Figure S4). These results indicate that these parameters may have an important role in TBT behavior and may influence TBT distribution in the water column. However, these correlations were not found for transitional waters, indicating that TBT distribution in estuaries should be explained by various environmental factors. Many studies investigated the effects of salinity, pH, temperature and DOC on the distribution of TBT in estuaries, but did not reach the same conclusion; while some studies have reported that pH and organic matter play an important role (Buggy and Tobin, 2006; Chen et al., 2022), others found no relationship between salinity, temperature, DOC or pH and TBT distribution (Bancon-Montigny et al., 2004; Sheikh et al., 2007; Concha-Graña et al., 2021). This is somewhat expected because estuaries are complex dynamic mixing zones where freshwater from rivers interacts with seawater, resulting in a change in water chemistry that can affect the speciation, behavior and distribution of TBT, while each estuary is a unique and specific environment (Chen et al., 2022). In addition, estuaries are regions of intense deposition of suspended particles; this occurs due to the influence of the seawater cations on the aggregation of colloidal material, which eventually settles in the sediments leading to the enhanced input of pollutants into the sediments (Mosley and Liss, 2019). However, significantly higher TBT levels in sediments of transitional waters were not observed in this study.
Finally, when investigating the distribution of TBT in the water column within the estuary, the effects of waves and tidal currents on the resuspension of sediments and the resulting desorption of TBT should not be disregarded. Bancon-Montigny et al. (2004) concluded that the TBT levels in the water column was primarily correlated with river flow, while Chen et al. (2022) studied the distribution of TBT during the tidal change and found that the dissolved TBT in the water column increased during the change from flood to ebb current, while SPM with high loads of TBT reached the highest levels during the change of water currents. They concluded that currents caused the resuspension and advective transport of surface sediments, resulting in the input of TBT into the water column. High salinity of seawater in the bottom layer could reduce the adsorption capacity of TBT, which could promote its load into the water column (Chen et al., 2022). Tidal currents as a dominant factor in the remobilization of SPM-associated pollutants have also been found for other hydrophobic organic pollutants such as polychlorinated biphenyls (PCBs) and polycyclic aromatic hydrocarbons (PAHs) (Cailleaud et al., 2009). In this study, it was found that the TBT concentration detected in the bottom water was higher than in the surface water layer at sites in the inner part of the estuaries where water depth was <10 m (T1, T3, T9a, T18, T19; Figure 4B; Mann-Whitney U-test, p<0.05 – for T1, T3 and T9a). Obviously, resuspension of sediments and desorption of TBT from the sediment particles into the water column occurs at these shallow sites. The significant correlation found between TBT levels in sediments and bottom waters at operational monitoring sites in coastal waters (Spearman, r=0.59, p<0.05; Supplementary Figure S5) may indicate the sorption-desorption process at the sediment-water interface, which further support the assumption that sediments act as a secondary source of TBT for the water column.
In conclusion, when discussing TBT distribution in a given environment, it is often difficult to separate the contribution of fresh TBT input due to the ongoing use of TBT paints from the fraction of old TBT that may enter the water column from contaminated sediments, as well as to distinguish clearly the contribution of various environmental factors and physicochemical processes on the behavior and fate of TBT. In this study, as expected, the TBT distribution was primarily determined by the distance from the source of pollution, i.e. shipping traffic, but the role of DOC and transparency of the water column should not be disregarded, as well as the role of hydrodynamics, especially in the transitional waters.
The level of pollution was assessed on the basis of the TBT distribution in the three compartments - water, sediments and mussels. In general, not all three compartments indicate the same level of pollution of a given area (Figure 8). The TBT distribution in mussels indicates higher pollution in coastal waters than seawater and sediments content, while transitional waters are assessed as slightly more polluted based on TBT levels in the water column than in sediments (Figure 8). Furthermore, the sediments are not polluted at all sites where the pollution is present in the water column, and vice versa (Figures 2–5). Consequently, the correlation between the TBT distributions in the different matrices was not found.
The main reason why mussels in coastal waters indicate a higher level of TBT pollution of a given area compared to water and sediments is that mussels were collected directly from the coast in areas more exposed to shipping traffic, whereas seawater and sediments were often collected further from the coast at the sites only occasionally exposed to shipping traffic (Figure 1; Supplementary Tables S1-S3). Another reason is the low persistence of TBT in the water column compared to its efficient bioaccumulation in mussels. Namely, TBT in the water column degrades rather fast by photolysis and microbial activity, with half-lives (t1/2) of several days to weeks (Rodriguez-Gonzalez et al., 2013); therefore, the analysis of seawater provides information on the momentary TBT concentration at the time of sampling. On the other hand, TBT as a lipophilic compound accumulates efficiently in mussels, while mussels have a limited ability to metabolize it; the steady state between uptake and depuration is reached after 60 – 90 days (Salazar and Salazar, 1996; Gomez-Ariza et al., 1999), while the depuration half-life values ranged from several days to 60 days (Page et al., 1995). Therefore, the concentration in mussels reflects the average level of pollution at a given site over the last several months. Although the reliable conclusion on recent pollution could be drawn on the basis of determined TBT levels in seawater and mussels and the knowledge of its degradation kinetics and half-lives in these compartments, data on TBT degradation products [monobutyltin (MBT) and dibutyltin (DBT)] would be beneficial for a more accurate assessment of recent pollution.
In contrast to seawater and mussels, the distribution of TBT in sediments indicates past pollution over a much longer period of time. This is because TBT input into the sediments is determined by the sedimentation rate, which means that the surface sediment layer may indicate the TBT input over a last few years. In sediments, TBT is very persistent as degrades slowly with a half-life in a range of years to decades (Viglino et al., 2004; Furdek et al., 2016). Therefore, it is often difficult to evaluate whether the determined TBT concentration in sediment is the result of its input from the water column over the investigated period, or slow degradation. Moreover, its distribution and persistence in sediments is strongly influenced by sediment properties such as grain size, mineral composition and especially the amount of TOC (Burton et al., 2004, 2006; Hoch et al., 2002; Hoch and Schwesig, 2004). Organic carbon not only influences the adsorption of TBT, but also influences its degradation efficiency, resulting in higher TBT persistence in sediments rich in organic matter (Furdek et al., 2016). Although higher TBT levels were found in some sediments with higher TOC content, no correlation between the TBT and TOC was found in the sediments, neither in coastal nor in transitional waters (Supplementary Figure S6). However, the sediments were generally not rich in organic matter; indeed, TOC < 1% was measured in 30 and 70% of the sediments from transitional and coastal waters, respectively. These sediments have limited capacity to retain TBT even when pollution is present in the water column, and therefore may not provide a reliable assessment of actual TBT pollution level of a given environment (Furdek Turk et al., 2020). Another factor that can determine the TBT content in sediments is the depth of the water column. Considering efficient TBT degradation in the water column (Rodriguez-Gonzalez et al., 2013), the deeper the water column is the greater is the probability that TBT will be degraded before it reaches the sediment. This may explain the unpolluted sediments in deeper coastal waters (Figure 5) and the lower TBT levels in bottom compared to the surface layer of the water column in coastal waters (Figure 4A).
When assessing pollution level of a given area, this discrepancy in assessment based on different types of samples should be considered. Although monitoring TBT concentrations in the water column is a good indicator of recent TBT input at a given site, this long-term study has shown that mussels may be the most reliable indicator of TBT pollution that has occurred in a given area in recent months. Finally, the distribution of TBT in all three compartments – seawater, sediments and mussels – showed the high pollution of large city ports (C15a, C38, C45) and urbanized and industrialized coastal bays such as Kaštela Bay (C16, C16a, C17a) and Bakar Bay (C37).
For 6 operational monitoring sites in coastal and transitional waters, where monitoring was carried out 3 – 6 times in each year during the investigated period, an average TBT concentration for each season is shown in Figure 9 (spring: March to May; summer: June to September; winter: October to February). The seasonal distributions show contrasting seasonal trends between coastal and transitional waters (Figure 9; Supplementary Figure S3). In coastal waters, significantly higher TBT levels were found in summer (Kruskal-Wallis test; p<0.01); this is because these locations are exposed to heavy ship traffic in the summer season and increased concentrations at this time of year are not unexpected. On the other hand, in transitional waters the higher concentrations at all sites were observed in the spring season. At this time of the year, a lower salinity of surface water was observed as well, which is due to increased rainfalls and river flows, suggesting an influence of river flow on TBT distribution. The same was found in other studies and discussed as the higher river inflow that increase the load of TBT but also cause the turbulence and sediment disturbance, which leads to remobilization of TBT from the particulate to the dissolved fraction (Bancon-Montigny et al., 2004; Sheikh et al., 2007; Raudonytė-Svirbutavičienė et al., 2023). The seasonal variations in TBT concentrations may be the result of seasonally variable environmental factors such as intensity of shipping traffic, but also river flow and precipitation, DOC, temperature and UV irradiation. In that manner, the seasonal variations in TBT concentrations are reported in many studies, but the variations were site-specific, so the maximum TBT levels are reported in different seasons (Sheikh et al., 2007; Quintas et al., 2019; Chouba et al., 2024). In this study, the determined seasonal TBT distribution could not be explained by physicochemical parameters of the water column.
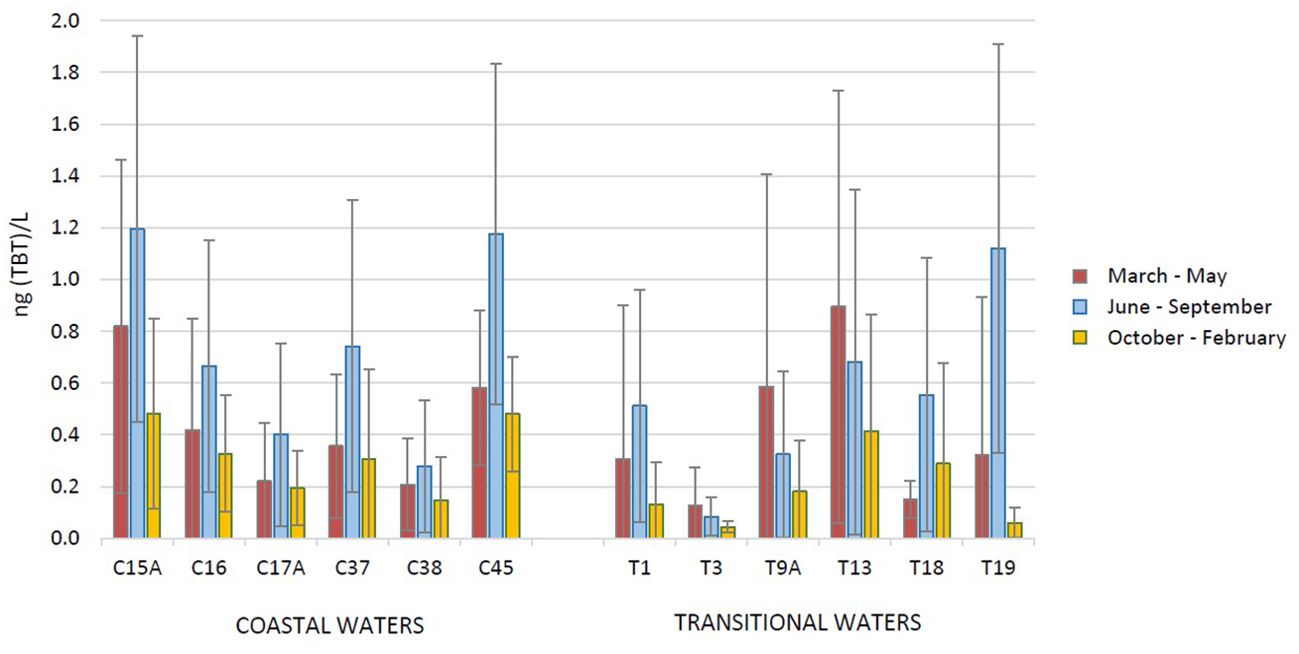
Figure 9. Seasonal distribution of tributyltin (TBT) concentrations in surface water at 6 sites in coastal and transitional waters, determined in the period 2016 – 2022 as part of the operational monitoring of the Croatian Adriatic within Water Framework Directive (2000/60/EC) [average concentrations in spring (March to May), summer (June to September) and winter (October to February)].
The general temporal trends in TBT pollution from 2016 to 2023 can be assessed by looking at the frequency of sites where TBT was detected or was above the EQS in each year during this period (Figure 8). A more detailed insights into the temporal trends in TBT levels can be gained by looking at the temporal distribution patterns at each individual site (Figures 2–5, 7). TBT levels in the sediments of coastal waters showed a slight decrease in pollution; the percentage of sites where TBT was > LOQ or > EQS was lower in 2021 than in previous campaigns (Figure 8). However, TBT levels at the most polluted operational monitoring sites were high and variable throughout the period, but generally lower in 2022 than in previous years (Figure 5). On the other hand, sediments in the transitional waters showed more obvious decrease in pollution, but concentrations were still above the EQS for sediments at 20% of sites in 2022 (Figure 8), while the significant decrease in TBT levels was only observed in the Ombla river estuary (sites T1 and T2) (Figure 6). However, the actual temporal trends of pollution over such a short period of time cannot be accurately estimated from the change of TBT concentrations in sediments, as TBT in 0 – 5 cm thick sediment layer reflects input over several years or more. The sedimentation rate in the Adriatic varies from a few mm/year in the open waters (Petrinec et al., 2012) to a maximum of 50 mm/year in the coastal bays (Mikac et al., 2022b). The observed trends are therefore more an indication of the TBT degradation rate and its persistence in these sediments than of the actual TBT input into these environments.
In general, TBT distribution in the water column indicates a slow decrease in pollution in both coastal and transitional waters, but 16 and 35% of the sites in coastal and transitional waters, respectively, were still found polluted in 2021 – 2022. In contrast, mussels showed a continuous decrease in pollution from 2017 to 2022, but with another significant increase of TBT levels in 2023; then, all sites were polluted with TBT and concentrations in mussels were above the EAC values at more than 70% of the sites.
The first assessment of TBT pollution on the Croatian Adriatic coast refers to the period 2010 – 2012 (Furdek et al., 2012; Furdek Turk et al., 2020). This study has shown that today, 10 years after the first assessment, the contamination of the coastal area with TBT has generally decreased. However, the comparison of these two studies is probably not entirely trustworthy, as the first study mainly covered locations where TBT contamination was expected, such as marinas, ports and shipyards, while the regular monitoring gives an overview of the entire coastal area. In conclusion, the situation regarding TBT pollution of coastal areas in Croatia is slowly improving, but further monitoring of the environmental status is needed in the coming years.
A review of the literature data on TBT pollution in Europe over the last decade shows that in some coastal areas TBT pollution is still an environmental problem that is far from being solved more than a decade after it was banned (Table 2). The data presented in Table 2 indicate that pollution of the Croatian Adriatic coast with TBT is comparable with the pollution of other coastal areas in Europe. However, these recent studies are mainly focused on sediments, which are not a reliable indicator of the level of current TBT input to the environment; meanwhile, many of these studies cover only one or several sites. Therefore, on the basis of the data listed in Table 2 it is difficult to draw a general conclusion about the overall level of recent pollution with TBT in European coastal waters, but it is believed that the level of pollution in Europe has generally decreased over the last two decades. However, there are many studies showing that there are numbers of hotspots where TBT pollution is persistent, particularly in sediments (Beyer et al., 2022). Although in all EU Member States the TBT concentrations are regularly monitored, the published data on TBT levels in the seawater are only a few, showing that TBT is still present in the water column in concentrations that could have both chronic and acute toxic effects on aquatic biota (Table 2; this study; Concha-Graña et al., 2021; Chouba et al., 2024).
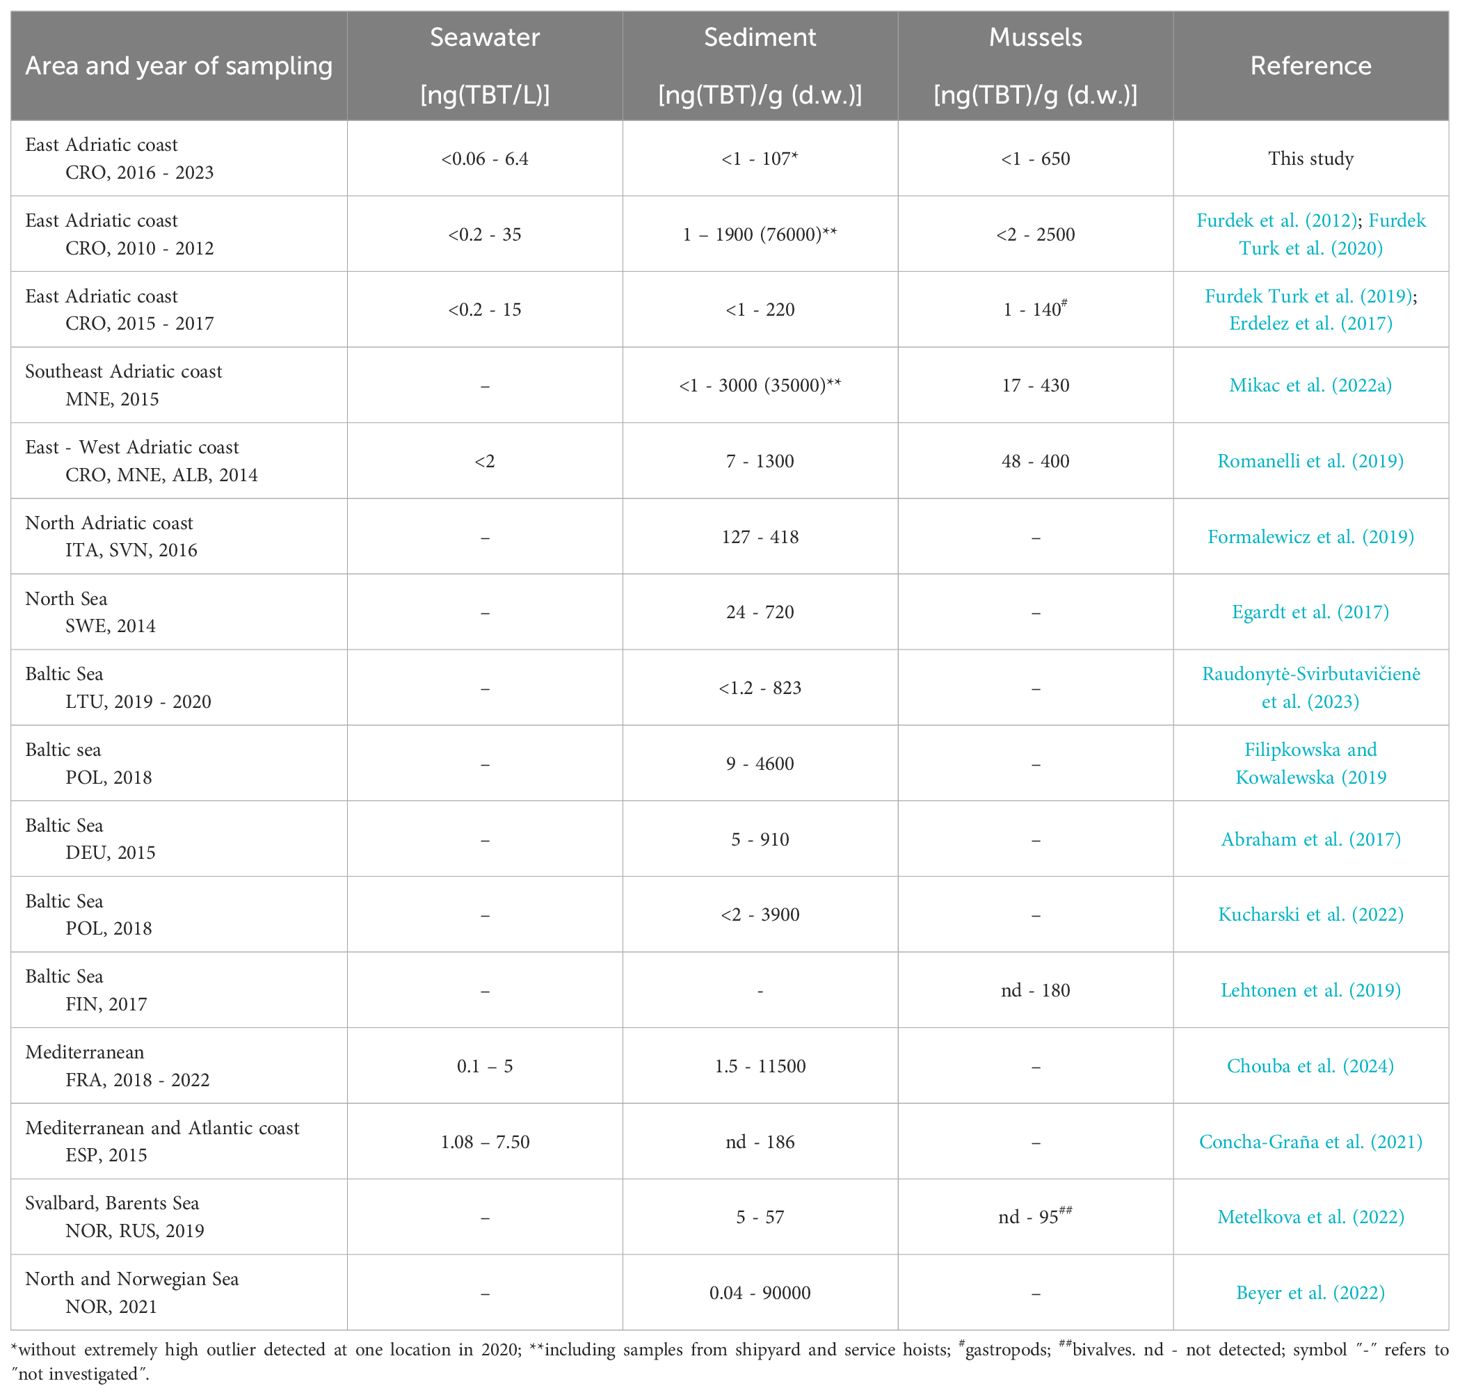
Table 2. Literature data on tributyltin (TBT) concentrations (minimum and maximum values) in seawater, sediments and biota from European coastal areas reported in the last decade.
The original contributions presented in the study are included in the article/Supplementary Material. Further inquiries can be directed to the corresponding author.
The manuscript presents research on animals that do not require ethical approval for their study.
MFT: Conceptualization, Formal analysis, Investigation, Methodology, Writing – original draft. IV: Formal analysis, Writing – review & editing. RM: Methodology, Writing – review & editing. JŠ: Methodology, Writing – review & editing. JD: Investigation, Writing – review & editing, Formal analysis. IC: Investigation, Methodology, Writing – review & editing. NM: Conceptualization, Methodology, Project administration, Investigation, Validation, Writing – review & editing.
The author(s) declare financial support was received for the research, authorship, and/or publication of this article. The monitoring within WFD was financed by the Hrvatske vode (legal entity for water management in Croatia), while monitoring within MSFD was financed by Ministry of Environmental Protection and Energy.
The authors thank Dr. Maja Ivanić and Dr. Niko Bačić for their contribution in TBT analyzes, and all those who assisted in sampling. All of the data published in this manuscript are in the ownership of the Hrvatske vode. The authors thank the Croatian authorities for permission to publish data which are in their ownership.
The authors declare that the research was conducted in the absence of any commercial or financial relationships that could be construed as a potential conflict of interest.
All claims expressed in this article are solely those of the authors and do not necessarily represent those of their affiliated organizations, or those of the publisher, the editors and the reviewers. Any product that may be evaluated in this article, or claim that may be made by its manufacturer, is not guaranteed or endorsed by the publisher.
The Supplementary Material for this article can be found online at: https://www.frontiersin.org/articles/10.3389/fmars.2024.1422057/full#supplementary-material
Abraham M., Westphal L., Hand I., Lerz A., Jeschek J., Bunke D., et al. (2017). TBT and its metabolites in sediments: Survey at a German coastal site and the central Baltic Sea. Mar. pollut. Bull. 121, 404–410. doi: 10.1016/j.marpolbul.2017.06.020
Antizar-Ladislao B. (2008). Environmental levels, toxicity and human exposure to tributyltin (TBT)-contaminated marine environment. A review. Environ. Int. 34, 292–308. doi: 10.1016/j.envint.2007.09.005
Arnold C. G., Ciani A., Müller S. R., Amirbahman A., Schwarzenbach R. P. (1998). Association of triorganotin compounds with dissolved humic acids. Environ. Sci. Technol. 32, 2976–2983. doi: 10.1021/es980114z
Bancon-Montigny C., Lespes G., Potin-Gautier M. (2004). Organotin survey in the Adour-Garonne basin. Water Res. 38, 933–946. doi: 10.1016/j.watres.2003.10.038
Bandara K. R. V., Chinthaka S. D. M., Yasawardene S. G., Manage P. M. (2021). Modified, optimized method of determination of tributyltin (TBT) contamination in coastal water, sediment and biota in Sri Lanka. Mar. pollut. Bull. 166, 112202. doi: 10.1016/j.marpolbul.2021.112202
Berg M., Arnold C. G., Müller R. S., Mühlemann J., Schwarzenbach R. P. (2001). Sorption and desorption behaviour of organotin compounds in sediment-pore water systems. Environ. Sci. Technol. 35, 3151–3157. doi: 10.1021/es010010f
Beyer J., Song Y., Tollefsen K. E., Berge J. A., Tveiten L., Helland A., et al. (2022). The ecotoxicology of marine tributyltin (TBT) hotspots: A review. Mar. Environ. Res. 179, 105689. doi: 10.1016/j.marenvres.2022.105689
Briant N., Bancon-Montigny C., Freydier R., Delpoux S., Elbaz-Poulichet F. (2016). Behaviour of butyltin compounds in the sediment pore waters of a contaminated marina (Port Camargue, South of France). Chemosphere 150, 123–129. doi: 10.1016/j.chemosphere.2016.02.022
Buggy C. J., Tobin J. M. (2006). Seasonal and spatial distributions of tributyltin in surface sediment of the Tolka Estuary, Dublin, Ireland. Environ. pollut. 143 (2), 294–303. doi: 10.1016/j.envpol.2005.11.025
Burton E. D., Phillips I. R., Hawker D. W. (2004). Sorption and desorption behaviour of tributyltin with natural sediments. Environ. Sci. Technol. 38, 6694–6700. doi: 10.1021/es049291s
Burton E. D., Phillips I. R., Hawker D. W. (2005). In-situ partitioning of butyltin compounds in estuarine sediments. Chemosphere 59, 585–592. doi: 10.1016/j.chemosphere.2004.10.067
Burton E. D., Phillips I. R., Hawker D. W. (2006). Tributyltin partitioning in sediments: effect of aging. Chemosphere 63, 73–81. doi: 10.1016/j.chemosphere.2005.07.048
Cacciatore F., Brusà R. B., Noventa S., Antonini C., Moschino V., Formalewicz M., et al. (2018b). Imposex levels and butyltin compounds (BTs) in Hexaplex trunculus (Linnaeus 1758) from the northern Adriatic Sea (Italy): Ecological risk assessment before and after the ban. Ecotoxicol. Environ. Saf. 147, 688–698. doi: 10.1016/j.ecoenv.2017.09.027
Cacciatore F., Noventa S., Antonini C., Formalewicz M., Gion C., Berto D., et al. (2018a). Imposex in Nassarius nitidus (Jeffreys 1867) as a possible investigative tool to monitor butyltin contamination according to the Water Framework Directive: a case study in the Venice Lagoon (Italy). Ecotoxicol. Environ. Saf. 148, 1078–1089. doi: 10.1016/j.ecoenv.2015.12.039
Cailleaud K., Forget-Leray J., Peluhet L., LeMenach K., Souissi S., Budzinski H. (2009). Tidal influence on the distribution of hydrophobic organic contaminants in the Seine Estuary and biomarker responses on the copepod Eurytemora affinis. Environ. Pollut 157 (1), 64–71. doi: 10.1016/j.envpol.2008.07.026
Castro Í.B., Rossato M., Fillmann G. (2012). Imposex reduction and residual butyltin contamination in southern Brazilian harbors. Environ. Toxicol. Chem. 31, 947–954. doi: 10.1002/etc.1793
Chahinian N., Bancon-Montigny C., Brunel V., Aubert G., Salles C., Marchand P., et al. (2013). Temporal and spatial variability of organotins in an intermittent Mediterranean river. J. Environ. Manage. 128, 173–181. doi: 10.1016/j.jenvman.2013.05.004
Chen C., Chen L., Huang Q., Zhang W., Leung K. M. (2022). Pulsed distribution of organotins in the turbidity maximum zone of the Yangtze Estuary throughout a tidal cycle. Mar. pollut. Bull. 178, 113600. doi: 10.1016/j.marpolbul.2022.113600
Chouba C., Pringault O., Domeau A., Delpoux S., Causse L., Marie M., et al. (2024). Added value of water column spatiotemporal monitoring to assess variability of trace metal elements and organotin compounds in Mediterranean harbours. J. Mar. Sci. Eng. 12, 399. doi: 10.3390/jmse12030399
Concha-Graña E., Moscoso-Pérez C., Fernández-González V., López-Mahía P., Gago J., León V. M., et al. (2021). Phthalates, organotin compounds and per-polyfluoroalkyl substances in semiconfined areas of the Spanish coast: Occurrence, sources and risk assessment. Sci. Total Environ. 780, 146450. doi: 10.1016/j.scitotenv.2021.146450
Cornelissen G., Pettersen A., Nesse E., Eek E., Helland A., Breedveld G. D. (2008). The contribution of urban runoff to organic contaminant levels in harbour sediments near two Norwegian cities. Mar. pollut. Bull. 56, 565–573. doi: 10.1016/j.marpolbul.2007.12.009
Cruz A., Anselmo A. M., Suzuki S., Mendo S. (2015). Tributyltin (TBT): a review on microbial resistance and degradation. Crit. Rev. Environ. Sci. Technol. 45, 970–1006. doi: 10.1080/10643389.2014.924181
Cuevas N., García Alonso J. I., Larreta J., Rodríguez J. G., Sariego C., Zorita I. (2014). Monitoring the effectiveness of the European tributyltin regulation on the Basque coast (northern Spain) by assessing imposex in two gastropod species (Nassarius reticulatus and Nassarius nitidus). Chem. Ecol. 30, 636–642. doi: 10.1080/02757540.2014.894991
Da Silva R. C., Teixeira M. P., de Paiva L. S., Miranda-Alves L. (2023). Environmental health and toxicology: Immunomodulation promoted by endocrine-disrupting chemical tributyltin. Toxics. 11, 696. doi: 10.3390/toxics11080696
Dautović J., Simonović N., Dominović I., Zovko Z., Ciglenečki I. (2023). “Dissolved organic carbon (DOC) in coastal and transitional waters of Eastern Adriatic,” in Proceedings of 8th Croatian water conference, Croatian waters in food and enery production. (Zagreb: Hrvatske vode), 513–521.
Dautović J., Vojvodić V., Tepić N., Ćosović B., Ciglenečki I. (2017). Dissolved organic carbon as potential indicator of global change: A long-term investigation in the northern Adriatic. Sci. Total Environ. 587, 185–195. doi: 10.1016/j.scitotenv.2017.02.111
Dubey S. K., Roy U. (2003). Biodegradation of tributyltins (organotins) by marine bacteria. Appl. Organomet. Chem. 17, 3–8. doi: 10.1002/aoc.394
Duplančić Leder T., Ujević T., Čala M., Viđak I. (2000). Categorization and number of islands in the Republic of Croatia. Period. Biol. 102, 281–284.
Egardt J., Nilsson P., Dahllöf I. (2017). Sediments indicates the continued use of banned antifouling compounds. Mar. pollut. Bull. 125, 282–288. doi: 10.1016/j.marpolbul.2017.08.035
Erdelez A., Furdek Turk M., Štambuk A., Župan I., Peharda M. (2017). Ecological quality status of the Adriatic coastal waters evaluated by the organotin pollution biomonitoring. Mar. pollut. Bull. 123, 313–323. doi: 10.1016/j.marpolbul.2017.08.039
Fang L., Xu C., Li J., Borggaard O. K., Wang D. (2017). The importance of environmental factors and matrices in the adsorption, desorption, and toxicity of butyltins: a review. Environ. Sci. pollut. Res. 24, 9159–9173. doi: 10.1016/j.marpolbul.2019.06.050
Filipkowska A., Kowalewska G. (2019). Butyltins in sediments from the southern baltic coastal zone: Is it still a matter of concern, 10 years after implementation of the total ban? Mar. pollut. Bull. 146, 343–348. doi: 10.1016/j.marpolbul.2019.06.050
Formalewicz M. M., Rampazzo F., Noventa S., Gion C., Petranich E., Crosera M., et al. (2019). Organotin compounds in touristic marinas of the northern Adriatic Sea: occurrence, speciation and potential recycling at the sediment-water interface. Environ. Sci. pollut. Res. 26, 31142–31157. doi: 10.1007/s11356-019-06269-6
Furdek M., Mikac N., Bueno M., Tessier E., Cavalheiro J., Monperrus M. (2016). Organotin persistence in contaminated marine sediments and porewaters: In situ degradation study using species-specific stable isotopic tracers. J. Hazard. Mater. 307, 263–273. doi: 10.1016/j.jhazmat.2015.12.037
Furdek M., Vahčič M., Ščančar J., Milačič R., Kniewald G., Mikac N. (2012). Organotin compounds in seawater and mussels Mytilus galloprovincialis along the Croatian Adriatic coast. Mar. pollut. Bull. 64, 189–199. doi: 10.1016/j.marpolbul.2011.12.009
Furdek Turk M., Ivanić M., Dautović J., Bačić N., Mikac N. (2020). Simultaneous analysis of buttyltins and total tin in sediments as a tool for the assessment of tributyltin behaviour, long-term persistence and historical contamination in the coastal environment. Chemosphere 258, 127303. doi: 10.1016/j.chemosphere.2020.127307
Furdek Turk M., Ivanić M., Bergant M., Ščančar J., Mikac N. (2019). TBT pollution monitoring on the Croatian Adriatic coast, in Proceedings of 7th Croatian water conference, Croatian waters in environmental and nature protection. Eds. Vizner M., Biondić D., Holjević D. (Zagreb: Hrvatske vode), 555–563.
Gomez N. A., Lompré J. S., Ferrando A., Garrido M., Domini C. E. (2024). Update on the status of the contamination by organotin compounds in sediment of Nuevo Gulf, Argentina. Insights from field and experimental studies. Mar. pollut. Bull. 200, 116087. doi: 10.1016/j.marpolbul.2024.116087
Gomez-Ariza J. L., Morales E., Giraldez I. (1999). Uptake and elimination of tributyltin in clams, Venerupis decussata. Mar. Environ. Res. 47, 399–413. doi: 10.1016/S0141-1136(98)00129-9
Harrison T. D., Gilmour G., McNeill M. T., Armour N., McIlroy L. (2020). Survey of imposex in Nucella lapillus as an indicator of tributyltin pollution in Northern Irish coastal waters 2004 to 2017. Mar. pollut. Bull. 159, 111474. doi: 10.1016/j.marpolbul.2020.111474
Hoch M. (2001). Organotin compounds in the environment. Appl. Geochem. 16, 719–743. doi: 10.1016/S0883-2927(00)00067-6
Hoch M., Alonso-Azcarate J., Lischick M. (2002). Adsorption behavior of toxic tributyltin to clay-rich under various environmental conditions. Environ. Toxicol. Chem. 21, 1390–1397. doi: 10.1002/etc.5620210709
Hoch M., Schwesig D. (2004). Parameters controlling the partitioning of tributyltin (TBT) in aquatic systems. Appl. Geochem. 19, 323–334. doi: 10.1016/0043-1354(94)00283-D
Inaba K., Shiraishi H., Soma Y. (1995). Effects of salinity, pH and temperature on aqueous solubility of four organotin compounds. Water Res. 29 (5), 1415–1417. doi: 10.1016/0043-1354(94)00283-D
Kucharski D., Giebułtowicz J., Drobniewska A., Nałęcz-Jawecki G., Skowronek A., Strzelecka A., et al. (2022). The study on contamination of bottom sediments from the Odra River estuary (SW Baltic Sea) by tributyltin using environmetric methods. Chemosphere 308, 136133. doi: 10.1016/j.chemosphere.2022.136133
Lagadic L., Katsiadaki I., Biever R., Guiney P. D., Karouna-Renier N., Schwarz T., et al. (2018). Tributyltin: advancing the science on assessing endocrine disruption with an unconventional endocrine-disrupting compound. Rev. Environ. Contam. T 245, 65–127. doi: 10.1007/398_2017_8
Lagerström M., Strand J., Eklund B., Ytreberg E. (2017). Total tin and organotin speciation in historic layers of antifouling paint on leisure boat hulls. Environ. pollut. 220, 1333–1341. doi: 10.1016/j.envpol.2016.11.001
Lagerström M., Yngsell D., Eklund B., Ytreberg E. (2019). Identification of commercial and recreational vessels coated with banned organotin paint through screening of tin by portable XRF. J. Hazard. Mater. 362, 107–114. doi: 10.1016/j.jhazmat.2018.09.038
Langston W. J., Pope N. D., Davey M., Langston K. M., O’ Hara S. C. M., Gibbs P. E., et al. (2015). Recovery from TBT pollution in English Channel environments: a problem solved? Mar. pollut. Bull. 95, 551–564. doi: 10.1016/j.marpolbul.2014.12.011
Laranjeiro F., Sánchez-Marín P., Barros A., Galante-Oliveira S., Moscoso-Pérez C., Fernández-González V., et al. (2016). Triphenyltin induces imposex in Nucella lapillus through an aphallic route. Aquat. Toxicol. 175, 127–131. doi: 10.1016/j.aquatox.2016.03.005
Laranjeiro F., Sánchez-Marín P., Galante-Oliveira S., Barroso C. (2015). Tributyltin pollution biomonitoring under the Water Framework Directive: proposal of a multi-species tool to assess the ecological quality status of EU water bodies. Ecol. Indic. 57, 525–535. doi: 10.1016/j.ecolind.2015.04.039
Laranjeiro F., Sanchez-Marin P., Oliveira I. B., Galante-Oliveira S., Barroso C. (2018). Fifteen years of imposex and tributyltin monitoring along the Portuguese coast. Environ. pollut. 232, 411–421. doi: 10.1016/j.envpol.2017.09.056
Lehtonen K. K., d'Errico G., Korpinen S., Regoli F., Ahkola H., Kinnunen T., et al. (2019). Mussel caging and the weight of evidence approach in the assessment of chemical contamination in coastal waters of Finland (Baltic Sea). Front. Mar. Sci. 6. doi: 10.3389/fmars.2019.00688
Lofrano G., Libralato G., Minetto D., De Gisi S., Todaro F., Conte B., et al. (2017). In situ remediation of contaminated marine sediment: an overview. Environ. Sci. pollut. Res. 24, 5189–5206. doi: 10.1007/s11356-016-8281-x
Metelkova L., Zhakovskaya Z., Kukhareva G., Voskoboinikov G., Zimina O. (2022). Organotin compounds (OTs) in surface sediments, bivalves and algae from the Russian coast of the Barents Sea (Kola Peninsula) and the Fram Strait (Svalbard Archipelago). Environ. Sci. pollut. 29, 34659–34669. doi: 10.1007/s11356-021-18091-0
Mikac N., Furdek Turk M., Petrović D., Bigović M., Krivokapić S. (2022a). First assessment of butyltins (BuTs) contamination of the Montenegrin coast (Southeast Adriatic): Tributyltin (TBT) poses a threat to the marine ecosystem. Mar. pollut. Bull. 185, 114270. doi: 10.1016/j.marpolbul.2022.114270
Mikac N., Sondi I., Vdović N., Pikelj K., Ivanić M., Lučić M., et al. (2022b). Origin and history of trace elements accumulation in recent Mediterranean sediments under heavy human impact. A case study of the Boka Kotorska Bay (Southeast Adriatic Sea). Mar. pollut. Bull. 179, 113702. doi: 10.1016/j.marpolbul.2022.113702
Mosley L. M., Liss P. S. (2019). Particle aggregation, pH changes and metal behaviour during estuarine mixing: review and integration. Mar. Freshw. Res. 71, 300–310. doi: 10.1071/MF19195
Nicolaus E. E. M., Barry J. (2015). Imposex in the dogwhelk (Nucella lapillus): 22-year monitoring around England and Wales. Environ. Monit Assess. 187, 1–14. doi: 10.1007/s10661-015-4961-0
Omae I. (2003). Organotin antifouling paints and their alternatives. Appl. Organomet. Chem. 17, 81–105. doi: 10.1002/aoc.396
OSPAR (2004). OSPAR/ICES Workshop on the evaluation and update of background reference concentrations (B/RCs) and ecotoxicological assessment criteria (EACs) and how these assessment tools should be used in assessing contaminants in water, sediment and biota. Final report, OSPAR commission.
Page D. S., Dassanayake T. M., Gilfillan E. S. (1995). Tissue distribution and depuration of tributyltin for field-exposed Mytilus edulis. Mar. Environ. Res. 40, 409–421. doi: 10.1016/0141-1136(95)92646-L
Paz-Villarraga C. A., Castro Í. B., Miloslavich P., Fillmann G. (2015). Venezuelan Caribbean Sea under the threat of TBT. Chemosphere 119, 704–710. doi: 10.1016/j.chemosphere.2014.07.068
Petrinec B., Franić Z., Ilijanić N., Miko S., Štrok M., Smodiš B. (2012). Estimation of sedimentation rate in the Middle and South Adriatic Sea using 137Cs. Rad. Protect. Dos. 151, (1) 102–111. doi: 10.1093/rpd/ncr449
Point D., Monperrus M., Tessier E., Amouroux D., Chauvaud L., Thouzeau G., et al. (2007). Biological control of trace metal and organometal benthic fluxes in a eutrophic lagoon (Thau Lagoon, Mediterranean Sea, France). Estuar. Coast. Shelf Sci. 72, 457–471. doi: 10.1016/j.ecss.2006.11.013
Quintas P. Y., Alvarez M. B., Arias A. H., Garrido M., Marcovecchio J. E. (2019). Spatiotemporal distribution of organotin compounds in the coastal water of the Bahía Blanca estuary (Argentina). Environ. Sci. pollut. R. 26, 7601–7613. doi: 10.1007/s11356-019-04181-7
Raudonytė-Svirbutavičienė E., Jokšas K., Stakėnienė R. (2023). On the effectiveness of tributyltin ban part II: Temporal and spatial trends of organotin pollution in intense sediment accumulation areas and dumping sites of the Baltic Sea. J. Haz. Mat. Adv. 10, 100294. doi: 10.1016/j.hazadv.2023.100294
Rodriguez-Gonzalez P., Bouchet S., Monperrus M., Tessier T., Amouroux D. (2013). In situ experiments for element species-specific environmental reactivity of tin and mercury compounds using isotopic tracers and multiple linear regression. Environ. Sci. pollut. R. 20, 1269–1280. doi: 10.1007/s11356-012-1019-5
Romanelli G., Berto D., Calace N., Amici M., Maltese S., Formalewicz M., et al. (2019). Ballast water management system: Assessment of chemical quality status of several ports in Adriatic Sea. Mar. pollut. Bull. 147, 86–97. doi: 10.1016/j.marpolbul.2017.12.030
Salazar M. H., Salazar S. M. (1996). “Mussels as bioindicators: Effects of TBT on survival, bioaccumulation, and growth under natural conditions,” in Organotin - environmental fate and effects. Eds. Champ M. A., Selignam P. F. (Chapman and Hall, London), 306–330. doi: 10.1007/978-94-009-1507-7_15
SCHEER - Scientific Committee on Health, Environmental and Emerging Risks (2023). Scientific Opinion on “Draft Environmental Quality Standards for Priority Substances under the Water Framework Directive”, European Commission.
Sheikh M. A., Tsuha K., Wang X., Sawano K., Imo S. T., Oomori T. (2007). Spatial and seasonal behaviour of organotin compounds in protected subtropical estuarine ecosystems in Okinawa, Japan. Int. J. Environ. Anal. Chem. 87, 847–861. doi: 10.1080/03067310701415629
Šrut M., Sabolić I., Erdelez A., Grbin D., Furdek Turk M., Bakarić R., et al. (2023). Marine pollutant tributyltin affects DNA methylation and fitness of banded murex (Hexaplex trunculus) populations. Toxics 11, 276. doi: 10.3390/toxics11030276
Stuer-Lauridsen F., Dahl B. (1995). Source of organotin at a marine water/sediment interface – a field study. Chemosphere 30, 831–845. doi: 10.1016/0045-6535(94)00444-Y
Tessier E., Amouroux D., Morin A., Christian L., Thybaud E., Vindimian E., et al. (2007). (Tri)Butyltin biotic degradation rates and pathways in different compartments of a freshwater model ecosystem. Sci. Total Environ. 388 (1-3), 214–233. doi: 10.1016/j.scitotenv.2007.08.047
Turner A. (2010). Marine pollution from antifouling paint particles. Mar. pollut. Bull. 60, 159–171. doi: 10.1016/j.marpolbul.2009.12.004
Uc-Peraza R. G., Castro Í. B., Fillmann G. (2022). An absurd scenario in 2021: Banned TBT-based antifouling products still available on the market. Sci. Total Environ. 805, 150377. doi: 10.1016/j.scitotenv.2021.150377
Keywords: tributyltin (TBT), monitoring, pollution, seawater, mussels, sediments, EU directives
Citation: Furdek Turk M, Vrana I, Milačič R, Ščančar J, Dautović J, Ciglenečki I and Mikac N (2024) Spatial and temporal distribution of tributyltin in the coastal environment of the Croatian Adriatic (2016-2023): TBT remains a cause for concern. Front. Mar. Sci. 11:1422057. doi: 10.3389/fmars.2024.1422057
Received: 23 April 2024; Accepted: 23 July 2024;
Published: 24 September 2024.
Edited by:
Federica Cacciatore, ISPRA Italian Institute for Environmental Protection and Research, ItalyReviewed by:
J. German Rodriguez, Technological Center Expert in Marine and Food Innovation (AZTI), SpainCopyright © 2024 Furdek Turk, Vrana, Milačič, Ščančar, Dautović, Ciglenečki and Mikac. This is an open-access article distributed under the terms of the Creative Commons Attribution License (CC BY). The use, distribution or reproduction in other forums is permitted, provided the original author(s) and the copyright owner(s) are credited and that the original publication in this journal is cited, in accordance with accepted academic practice. No use, distribution or reproduction is permitted which does not comply with these terms.
*Correspondence: Martina Furdek Turk, bWZ1cmRla0BpcmIuaHI=
Disclaimer: All claims expressed in this article are solely those of the authors and do not necessarily represent those of their affiliated organizations, or those of the publisher, the editors and the reviewers. Any product that may be evaluated in this article or claim that may be made by its manufacturer is not guaranteed or endorsed by the publisher.
Research integrity at Frontiers
Learn more about the work of our research integrity team to safeguard the quality of each article we publish.