 Carmen Navarro-Guillén1*
 Eirik Degré Lorentsen2
 Erick Perera1
 Manuel Yúfera1
 Ingrid Bakke2
 Olav Vadstein2
- 1Departamento de Biología Marina y Acuicultura, Instituto de Ciencias Marinas de Andalucía (ICMAN-CSIC), Puerto Real, Spain
- 2Department of Biotechnology and Food Science, Norwegian University of Science and Technology (NTNU), Trondheim, Norway
Gut microbial communities are highly dynamic and respond to factors such as diet and host metabolism. However, there is limited information about how these responses can generate community dynamics at different time scales, such as circadian rhythms. The aim of the present study was to characterize variations along a daily cycle in the gut microbiota of fish on different feeding regimes. In addition, an estimation of the potential contribution of the gut bacterial community to the digestive process of the fish was assessed. The greater amberjack (Seriola dumerili) was used as experimental species, a promising species for Mediterranean aquaculture. Fish were randomly distributed in two different feeding regimes, in triplicate rearing tanks. Feeding regimes were continuous feeding and time-restricted feeding (three meals per day). Fish feces for RNA-based amplicon sequencing and bacterial proteolytic capacity were sampled along a 24h cycle. Time-restricted fed fish exhibited changes in the composition of the active bacterial community promoted by feeding, thus revealing two types of bacterial community profiles: “pre-feeding” and “active-feeder” profiles. Continuous-fed fish maintained an “active-feeder” community profile throughout the whole day. Bray-Curtis and Sørensen similarity indicated that differences in the composition between the two community profiles were mainly driven by the absence/presence of infrequent ASVs (amplicon variant sequences). The potential proteolytic bacterial activity tended to be higher before feeding. Thus, gut microbiota could be a key factor to understanding fish digestion, playing a role in interactions with host metabolism. In conclusion, our results suggest that feeding pattern and time of sampling are important parameters when assessing the microbiome’s contribution to host metabolism.
1 Introduction
During the last years numerous scientific publications focused on farmed finfish microbiome, and specially on that living inside the digestive tract have been published (Egerton et al., 2018; Kim et al., 2021; Naya-Català et al., 2022; Luan et al., 2023). The gut microbiome is linked with roles involving different physiological functions, like defense against diseases, modulation of the immune response, nutrient absorption, regulation of metabolic processes and synthesis of vitamins. In that sense, fish microbiome research may benefit the aquaculture industry by giving rise to effective manipulations of the microbial communities to enhance immunity and health. Such knowledge may promote sustainable solutions to the challenges the sector is currently facing, such as high stocking density, metabolic diseases, water quality, and antibiotics abuse (Perry et al., 2020; Diwan et al., 2022).
Gut microbial communities are highly dynamic and respond to factors such as diet and host metabolism. These responses to different variables can generate community dynamics at different timescales. Knowledge about temporal natural fluctuations is lacking, which can give insight about factors influencing the stability or instability of the microbiota. The timescales for responses to perturbations may inform us about adaptation strategies that are taking place in the community to optimize the microbial ecosystem (Schlomann and Parthasarathy, 2019). Understanding these dynamics is important to both gaining insights into the ecosystem and into its correlation with the functioning of host physiology. For example, wild great apes exhibit seasonal fluctuations in gut microbiota driven by diet and rainfall patterns (Hicks et al., 2018). On a shorter timescale, light-dark cycles, feeding time or daily temperature fluctuations may stimulate circadian rhythms. In humans, gut microbiota exhibits rhythmicity over the day, with different taxa dominating the gut microbial community at different times in the day (Thaiss et al., 2014; Reitmeier et al., 2020; Wang et al., 2022). In wild meerkats (Suricata suricatta), there are seasonal fluctuations in gut microbiota composition. However, the most noticeable oscillations were those with a diurnal basis (Risely et al., 2021). Accordingly, in laboratory mice the fluctuations were recorded at dusk, the period when mice become active and start feeding (Thaiss et al., 2016).
Feeding/fasting cycles are one of the main drivers of diel oscillations in gut environment. Natural feeding and fasting cycles result in a dynamic milieu in terms of nutrient availability, luminal pH, and secondary metabolites. However, only few studies assessed whether the gut microbiome is similarly dynamic, and the role this dynamism plays in host metabolism (Zarrinpar et al., 2014). In mice, gut microbiome exhibited daily cyclical variation in a variety of feeding pattern conditions. Mice fed ad libitum showed cyclical fluctuations in specific members of the gut microbiome. The α-diversity of the gut microbiome fluctuated with the time of the day, rising with feeding and falling with fasting. By contrast, when mice were submitted to a time-restricted feeding overall species numbers were reduced and α-diversity did not fluctuate; rather it stayed constantly low (Zarrinpar et al., 2014; Dantas Machado et al., 2022). Similarly, in humans the timing of eating plays a key role in shaping the composition of the gut microbiota and the gene transcription network (Thaiss et al., 2014; Zeb et al., 2023).
In fish, gut microbiota develops from the eggs (chorion-associated bacteria), the surrounding water and the first feed. This initial colonizing bacteria is species-specific, with inter-species variations (Egerton et al., 2018; Vadstein et al., 2018). Like in humans, it appears the diversity of bacteria increases as fish develop, although a relatively stable gut microbiota is established within the first days of life, considered the “core microbiota”, and is supported through host system selective pressures regardless of environmental parameters (Roeselers et al., 2011). Sullam et al. (2012) pointed to diet, habitat and host phylogeny as the most likely influencers of fish gut microbiota diversity, presenting substantial intra- and inter-species diversity. Although there are a wide range of studies characterizing gut bacterial communities in different fish species of commercial interest, and also how specific variables can affect these communities (Parma et al., 2019; Dias et al., 2021; Kim et al., 2021; Moroni et al., 2021; Navarro-Guillén et al., 2021; Vargas-Albores et al., 2021; Ghori et al., 2022; Reinoso et al., 2023; Zheng et al., 2023; Mes et al., 2024), there is limited knowledge on the characterizations of cyclic fluctuations at different timescales. Seasonal fluctuations in gut microbiota composition, linked to fluctuations in water temperature, have been described for the Atlantic salmon (Salmo salar) (Zarkasi et al., 2014) and a few species of freshwater fish (Hagi et al., 2004). At the diel timescale, daily fluctuations in bacteria abundance, composition and diversity have been described for the Chinese mitten crab (Eriocheir sinensis), with the higher community richness observed at 18:00h and the lowest at 24:00h (Yu et al., 2021). In maroon clownfish (Premnas biaculeatus) fed once per day, the most substantial change in microbiome composition was between “fed” and “un-fed” states, with differences in both community composition and α-diversity (Parris et al., 2019). In greater amberjack (Seriola dumerili) the diurnal dynamics and metabolic activity of the gut bacterial community have been characterized by RNA-based amplicon sequencing. Feeding was pointed as the main driver modulating these temporal dynamics, with a shift in the composition of the active bacterial community between pre- and post-feeding samplings (Navarro-Guillén et al., 2023a).
The present study aimed to determine whether the variations along a daily cycle in the gut microbiota are affected by cyclical fluctuations in feeding. For that, two different feeding regimes were tested: 1) time-restricted feeding, in which fish were fed three meals daily, and 2) continuous feeding, in which the factor “feeding time” was suppressed and feed was supplied continuously along the day. In addition, an estimation of the potential contribution of the gut bacterial community to the digestive process of the fish was assessed. We used the greater amberjack as experimental species, a marine fish species of great interest for the aquaculture industry worldwide due to its fast growth and excellent flesh quality (Sicuro and Luzzana, 2016). Greater amberjack exhibits a voracious appetite, and to maintain high growth rates during the juvenile stage it has to be fed several times a day. Thus, providing a suited model to assess how gut bacterial community dynamics are affected by feeding regime will help to identify and better understand the relationship it may have for host physiology and fitness.
2 Materials and methods
2.1 Fish rearing, experimental protocol and sampling
Greater amberjack juveniles were supplied by Futuna Blue España S.L. (El Puerto de Santa María, Cádiz, Spain) and transferred to the ICMAN-CSIC experimental facility (REGA ES110280000311). Juveniles were randomly distributed in six 1 m3 cylindroconical tanks (28 fish tank-1) with three replicate tanks per feeding regime. Tanks belonged to three different RAS systems (two tanks per RAS). Juveniles with 106.1 ± 19.0 g wet body weight (mean ± SD) were reared under continuous light and two different feeding regimes; continuous feeding (CF) and time-restricted feeding (TRF). For the CF regime the daily feed ration was provided continuously over 24h using belt feeders, whereas for the TRF regime it was provided manually and divided in three daily meals during an 8h window (40% of total daily ration was supplied at 08:00 h, 25% at 12:00 h, and the remaining 35% at 16:00 h, feeding usually took<5 min). Fish were fed a commercial diet (Europa 22, Skretting, Burgos, Spain. Composition shown in Supplementary Table 1) at a daily feeding rate of 4% fish biomass for both experimental groups. Water salinity was 33.2 ± 0.4 g L-1, oxygen was maintained above 85% saturation, pH was 8.0 ± 0.1 and NH4 + NH3< 0.25 mg N L-1. After 15 days under these conditions, twelve fish per feeding regime (4 fish per tank) were sampled at each sampling point over a 24 h cycle. For sampling fish were fed as usual. Samplings were at 08:00 (before TRF-group first meal), 10:00, 12:00 (after TRF-group second meal), 16:00 (after TRF-group third meal), 20:00, 00:00 and 04:00 h. Sampling procedure was performed as described in Navarro-Guillén et al. (2023b). Sampled fish were euthanized with an overdose of phenoxyethanol (77699, Sigma-Aldrich) and rinsed with ethanol to avoid contamination of the intestinal samples with skin microbiota. The rectum of each fish was aseptically excised and feces were collected by stripping. Feces were maintained at -80°C until analysis.
All experimental procedures complied with the Guidelines of the European Union Council (2010/63/EU) for the use and experimentation of laboratory animals and were reviewed and approved by the Spanish National Research Council (CSIC) bioethical committee and Spanish National Veterinary Authority for project THERMODIGEST- RTI2018-096134-B-I00 (REF: 02/07/2019/107).
2.2 Characterization of the active gut bacterial communities
In the present study amplicon sequencing was based on RNA extracts (using reverse transcribed cDNA), thus, this work does not describe bacterial community composition in terms of relative abundance of taxa (as DNA-based amplicon sequencing does). It rather describes the relative abundance of the 16S rRNA copies, thus reflecting the distribution of the active taxa within the bacterial community (Navarro-Guillén et al., 2023a).
2.2.1 RNA and DNA extraction
Feces samples were freeze-dried before analyses, weighed and transferred to sterile Precellys-tubes containing an approximately 2 mm thick layer of 1.4 mm zirconium oxide beads (Bertin Technologies), and 800 µl DNA/RNA shield (Zymo Research). Samples were homogenized using a Precellys 24 (Bertin Technologies) at 5500 rpm, 2 pulses, 30 seconds. DNA and RNA were extracted by using the Quick-DNA/RNA™ Magbead kit (Zymo Research), and the Kingfisher™ Flex (Thermo Fisher), following the protocol and Kingfisher script provided by Zymo Research. The eluted DNA and RNA concentrations were determined with QUBIT™ 3 (Invitrogen), using QUBIT™ dsDNA HS and QUBIT™ RNA HS assay kits, respectively, according to producer’s protocol. cDNA was made from the RNA by using the iScript™ cDNA synthesis kit (BioRad) following the manufacturer’s protocol. Reactions (20 µl total volume) were conducted with 4 µl 5x iScript Reaction Mix, 1 µl iScript Reverse Transcriptase, 10 µl RNA template and 5 µl nuclease-free water.
2.2.2 Amplicon library preparation
PCR was conducted to amplify the variable regions 3 and 4 of the bacterial 16S rRNA genes by using broad-coverage bacterial primers, cDNA was used as template. PCR reactions (25 µl total volume) were conducted with 0.3 µM of each primer, Ill341F_KL (5′-TCGTCGGCAGCGTCAGATGTGTATAAGAGACAGNNNNCCTACGGGN-3′) and Ill805R (5′-GTCTCGTGGGCTCGGAGATGTGTATAAGAGACAGNNNNGACT CANVGGGTATCTAAKCC-3′), 0.2 mM of each dNTP, 0.4 U Phusion Hot Start polymerase (Thermo Scientific) and 1 µl cDNA as template. The cycles for the PCR reaction were performed in a T100™ Thermal Cycler (BioRad), using the following cycling conditions: an initial denaturation step at 98°C for 60 s; 38 cycles of 98°C for 15 s, 55°C for 20 s, and 72°C for 20 s; and a final elongation step of 5 minutes at 72°C. The resulting PCR-products were purified and normalized using the SequalPrep™ Normalization plates (96-well plates, Invitrogen) following the producer’s protocol. The amplicons were indexed in a second PCR using the Nextera® XT Index Kit v2. The PCR conditions were as described above, except that 2.5 µl of the purified normalized PCR products together with 2.5 µl of each indexing primer were used. The same cycling program as described above was used, but with only 10 cycles. After the indexing, the samples were purified and normalized using the SequalPrep™ Normalization plates following the producer’s protocol. Samples were pooled and concentrated using an Amicon® Ultra 0.5 ml centrifugal filter (30K membrane, Merck Millipore). The DNA concentration and purity were determined with a NanoDrop™ One Microvolume Spectrophotometer (Thermo Scientific™). The amplicon library was sequenced in a MiSeq run (Illumina, San Diego, CA) with v3 reagents (Illumina) and 300 paired-end at the Norwegian Sequencing Centre (NSC), University of Oslo.
2.2.3 Processing of the amplicon sequencing data
The sequencing data were processed by using the USEARCH V11 and UNOISE 3 pipeline (Edgar, 2010; Edgar 2016a). Taxonomy assignment was done based on the SINTAX script (Edgar, 2016b), using a confidence value threshold of 0.8 and included the RDP reference data set (version 15). The resulting amplicon sequence variant (ASV) table was processed in Excel. All chloroplasts, eukaryotes, and abundant ASVs from kit blanks and non-template controls were removed. After quality filtering and chimera removal, a total of 5,215,287 sequence reads were obtained with an average of 31,996 ± 23,631 (± SD) per sample. Finally, the ASV table was normalized to 3,000 reads per sample (the lowest read count observed for a sample) prior to multivariate analyses to avoid bias due to sequencing depth.
2.2.4 qPCR
To compare the amount of DNA and rRNA representing the 16S rRNA gene in the samples, qPCR was conducted. To generate a standard with known concentration for qPCR, end-point PCR was performed for some of the samples using the broad-coverage qPCR primers RT.966F (GCAACGCGMRGAACCTTACCTA) and RT.1089R (SGGACTTAACCSAACATYTCA) (Skjermo et al., 2015). The resulting PCR products were purified using the QIAquick® PCR Purification Kit (Qiagen), following the producers’ protocol. The DNA concentration of the purified PCR products was determined with the NanoDrop™ One Microvolume Spectrophotometer (Thermo Scientific). A serial dilution of one of the purified PCR products was used as a standard for the determination of copy numbers by qPCR in each round of qPCR. The qPCRs were run in triplicates using containing SYBR® Green master mix (Thermo Scientific) with the two primers at a final concentration of 0.3 mM each and DNA-free water to a total volume of 20 µl. For each sample, qPCRs were run both with cDNA and DNA as template (4 µl per reaction). The default program QuantStudio™ 5 Real-Time PCR System (Applied Biosystems™) for quantification based on standard curves was applied. To estimate copy-number for the samples, CT-values for dilution series of the standards were plotted against log copy number/µl. Linear regression resulted in an equation that was used to calculate copy-numbers for cDNA and DNA of the samples by using CT-values from the qPCR.
2.3 Estimation of the potential bacterial contribution to the fish digestive process
2.3.1 Bacterial isolation and extracts preparation
The potential bacterial contribution to digestion was estimated in feces from fish submitted to time-restricted feeding sampled at 0 and 4h postprandial. Sampling times were selected based on the observed changes in the composition of the active bacterial community from the RNA-based amplicon sequencing. Feces of 5 fish per sampling point were weighted and mechanically homogenized in phosphate-buffered saline (PBS, pH 7.4, 1:2 w:v) using an Ultra-Turrax® Homogenizer (IKA-Werke, Germany) and centrifuged for 10 min at 500 g at 4°C (Eppendorf 5417R, Germany) for debris removal. The supernatants were filtered through 0.22 µm filters (Costar® Spin-X® Centrifuge Tube Filter, Corning) for 20 min at 14000 g at 4°C. After filtration the filters were washed three times with PBS to remove dissolved proteins. Washing times were selected based on a preliminary test where bovine serum albumin (BSA) was added to the samples before filtering, and served as marker for the removal of proteins in the feces (host enzymes and bacterial exoenzymes). Serial washing was performed and SDS-PAGE (5% stacking gel, 13% separating gel) was used to determine the presence BSA in the filtered fraction after each washing step. No BSA was recorded after washing the samples three times, thus, this procedure was considered efficient for the removal of luminal proteins from the big size fraction. Washings (small size fraction) from each sample were pooled and considered “Total enzymes in digesta”, containing both, host luminal enzymes and bacterial exoenzymes. The fecal bacteria retained in the filter were lysed and eluted using PBS containing 1% Triton 100-X, and this fraction was considered “Bacterial enzymes”. All samples were kept in ice during the process described above, to avoid enzymes denaturation and/or damage. To determine the activity level and composition of proteases in both fractions enzymatic assays and zymograms were used, respectively (see below). In addition, amylase activity level, as biomarker of carbohydrases activity, was also analyzed.
2.3.2 Determination of enzyme activity
For protease activities, the fluorogenic substrates Boc-Gln-Ala-Arg-7- methylcoumarin hydrochloride (BOC, B4153-Sigma-Aldrich) and N-SuccinylAla-Ala-Pro-Phe-7-amido-4-methylcoumarin (S9761, Sigma-Aldrich) were used for trypsin and chymotrypsin analyses, respectively. Substrates were diluted in dimethyl sulfoxide (DMSO), to a final concentration of 20 μM. For analysis, 5 μL of these substrates, 190 μL of 50 mM Cacodylate buffer, 0.02 mM CaCl2, 0.3 M NaCl buffer (pH 6.5) and 15 μL of the extract were added to the microplate (Rotllant et al., 2008). Fluorescence was measured at 355 nm (excitation) and 460 nm (emission).
Ultra Amylase Assay Kit (E33651, Molecular Probes), was used for amylase analysis. The substrate contained in this kit is a starch derivative labeled with a fluorophore dye. Substrate was diluted according to manufacturer instructions to a final concentration of 200 μg/mL. For analysis, 50 μL of the substrate solution and 15 μL of the extract were added to the microplate. Fluorescence was measured at 485 nm (excitation) and 538 nm (emission).
All enzymatic activity analyses were performed at room temperature (25 °C). The liberation of the fluorophore was kinetically followed during 5 min in a microplate reader (Agilent BioTek Synergy Neo2, BioTek Instrument, Inc.).
The potential bacterial contribution to the fish digestive process was estimated using the following formula:
where Bact activity and Digesta activity are the activity levels measured in the bacterial and digesta fractions, respectively, and pre and post make reference to the sampling time, pre- or post-feeding, respectively.
2.3.3 Zymograms of proteases and amylase
Substrate-SDS-PAGE (5% stacking gel, 13% separating gel) was used to determine the composition of proteases in the total and bacterial extracts (Perera et al., 2008; Navarro-Guillén et al., 2022). Gels were run at 30 mA constant current and 4°C in a vertical electrophoresis device (Mini-PROTEAN 3, Bio-Rad, USA). The gels were then immersed in a 3% casein solution for 20 min at 4°C to allow the diffusion of casein into the gel and incubated at 37°C for 40 min to allow the proteases to digest the gel-embedded substrate. The gels were washed with tap water and stained with 0.1% Coomassie Brilliant Blue in 45% methanol with 10% acetic acid and finally destained in 10% methanol with 10% acetic acid solution. Because of the presence of casein the gel stains blue, except in areas with proteolytic activity. Unreduced molecular weight markers (14.4 - 116kDa, Thermo Scientific, USA) were used to determine apparent molecular weights. For protease classification, the same substrate-SDS-PAGE procedure was used, but enzyme extracts were incubated with inhibitors for 60 min at 37°C before electrophoresis. Inhibitors used were 0.5 mM TLCK, 0.3 mM TPCK and 50 µM SBTI (Navarro-Guillén et al., 2022). The absence of bands in the presence of specific inhibitors indicates a specific type of protease. Given the limited efficiency of some inhibitors to completely abrogate the activity of fish enzymes, reduced intensity of band was also taken as indicative of type of protease, as the same amount of protein were always loaded into the gel (2.6 μg of protein).
Substrate-SDS-PAGE for amylase was performed in a 5% stacking gel and a 13% separating gel (modified from Chávez-Rodríguez et al., 2020). Electrophoresis was carried out under the same conditions as for proteases. The gel was immersed in a 1% starch solution for 20 min at 4°C to allow the diffusion of starch into the gel and incubated at 37°C overnight to allow amylase to digest the gel-embedded substrate. Subsequently, the gel was washed and stained with an iodine/KI solution (10%) until clear bands were visualized on the dark background. Molecular weight markers (14.4 - 116kDa, Thermo Scientific, USA) without a reducing agent were used to determine apparent molecular weight.
2.4 Statistical analysis
Statistical differences in fish growth was tested by one-way ANOVA. When significant differences were identified, means of groups were compared by the Post hoc multiple comparisons Tukey’s test. Before analyses, the ANOVA assumptions of normality and homogeneity of variance were tested using the Shapiro-Wilk and Levene’s tests, respectively (SPSS version 27). Cohen’s f index was calculated to report effect size between groups. Effect size was classified as small (f ≥ 0.10), medium (f ≥ 0.25), large (f ≥ 0.40) and very large (f ≥ 1.3) (Chen and Chen, 2010). Statistical analyses of active bacterial community composition, based on the ASV table, were performed using the program package PAST version 3 (Hammer et al., 2001). Principal coordinate analysis (PCoA) (Davis, 1986) was based on Bray-Curtis and Sørensen similarities (Bray and Curtis, 1957; Wolda, 1981). To test for differences in the composition of the active community between sample groups, we applied one- and two-way PERMANOVA based on Bray-Curtis and Sørensen similarities (Anderson, 2001). For analysis of the variation in the relative and absolute potential activity of specific taxa for each feeding regime, one-way ANOVA was used with sampling time as factor. Post hoc multiple comparisons were carried out using Tukey’s test (SPSS v26, IBM). All statistical analyses were considered significant at p< 0.05. Quantification of absolute activity was done by multiplying relative potential activity of ASVs (fraction of reads) by the number of bacterial 16S-RNA copies in each sample quantified by qPCR (Barlow et al., 2020). All results are given as mean ± standard deviation (SD).
3 Results
Fish body weight at the end of the experimental period was, on average, 129.28 ± 26.56 g, which entails a daily growth rate of 1.5% (% of initial body weight). No statistical differences were found between experimental groups.
3.1 Quantitative bacterial density and activity in the fish feces
Bacterial density, measured as 16S rDNA gene copies per mg DW feces, was stable along the day for the CF group with an average of 5.00×10⁵ rDNA copies per mg DW feces. By contrast, the TRF group showed oscillations in bacterial density along the day, ranging from 3.20×10⁴ at pre-feeding time (08:00h) to 2.06×10⁶ at 16h after first-meal (00:00h), with a medium effect size (fCohen = 0.35) (Figure 1A). We used the number of 16S rRNA copies as an estimate of bacterial activity, and observed a similar temporal pattern. While bacterial activity was stable along the day in CF group (1.47×10⁵ rRNA copies per mg DW feces, on average), the bacteria community from TRF showed temporal dynamics in activity. Bacterial activity peaked at 2 and 12h post initiation of feeding (2.91x10⁵ and 1.36×10⁶ rRNA copies per mg DW feces, respectively), with an activity statistically higher at 12h compared to those measured at the other times and a large effect size (fCohen = 0.47, Figure 1B). For the specific bacterial activity (16S rRNA:16S rDNA ratio), no temporal variations were found in feces from the CF group, while for the TRF group a large effect size was observed (fCohen = 0.70) for specific activity, peaking at 2h postprandial (Figure 1C).
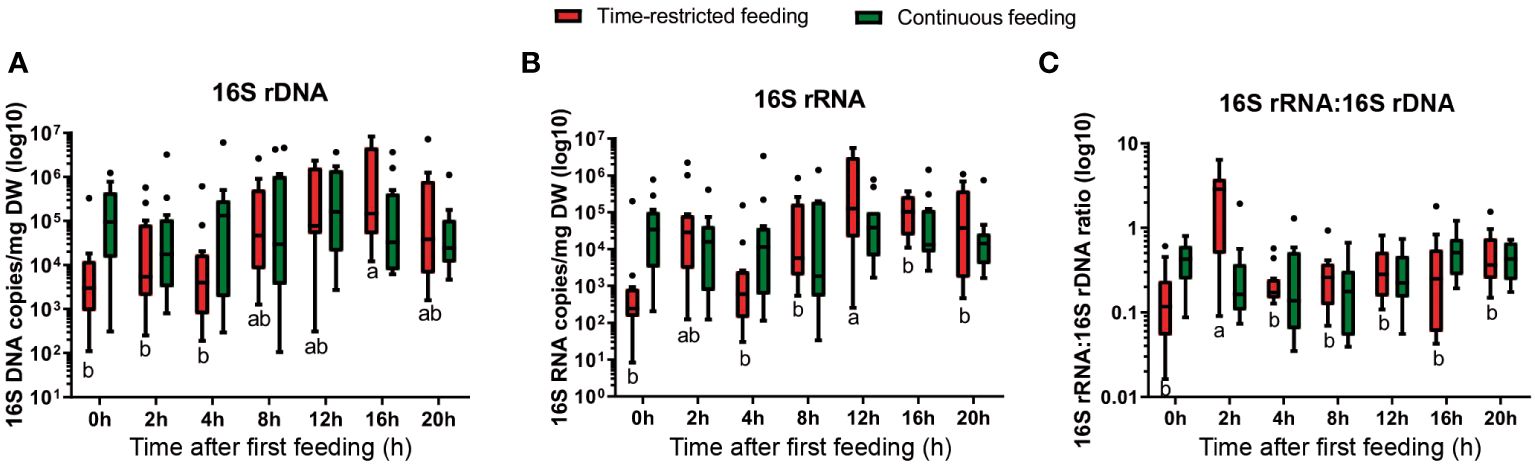
Figure 1 Box and whisker plots for bacterial density (A; 16S rDNA gene copies), activity (B; 16S rRNA copies) and specific activity (C; 16S rRNA:16S rDNA ratio) in feces (copies per mg DW feces) from greater amberjack with time-restricted (red) or continuous feeding (green) at the different sampling points (n = 12 per treatment). Different letters mean statistical differences between sampling points for each treatment. Boxes extend from the 25th to 75th percentiles, the line within the boxes is plotted at the median. Whiskers are drawn down to the 10th percentile and up to the 90th. Data points outside this interval are represented as individual dots.
3.2 Composition of the active bacterial gut community
The Illumina sequencing based on 16S rRNA amplicons had a total of 1649 ASVs. We only observed a temporal variation in the composition of the active bacterial community in feces from TRF-fish.
Relative abundance of phyla based on the rRNA amplicon sequencing, expressed as percent of the total number of reads, is shown in Table 1. The active bacterial community in both experimental groups was dominated by Proteobacteria, Actinobacteria, Firmicutes, Bacteriodetes and Acidobacteria. Before feeding, the active bacteria community of TRF group was dominated by Proteobacteria, whose relative abundance decreased to a minimum at 16h postprandial, range 86.6 to 51.7% at 0 and 16 h, respectively. The phylum Actinobacteria showed an inverse pattern, with a trend to increase after feeding. The maximum abundance was recorded at 16h postprandial (from 2.5 to 32.1% of the relative abundance). Although no statistically significant, effect size was large for Firmicutes (fCohen = 0.86), which showed an increased value in relative abundance at 8h postprandial. For the CF fish, no significant variations in the active bacterial community were detected for any of the more abundant phyla. On average, Proteobacteria, Actinobacteria and Firmicutes had a relative abundance over the daily cycle of 66.0 ± 16.0, 14.9 ± 11.4 and 9.7 ± 7.4%, respective.
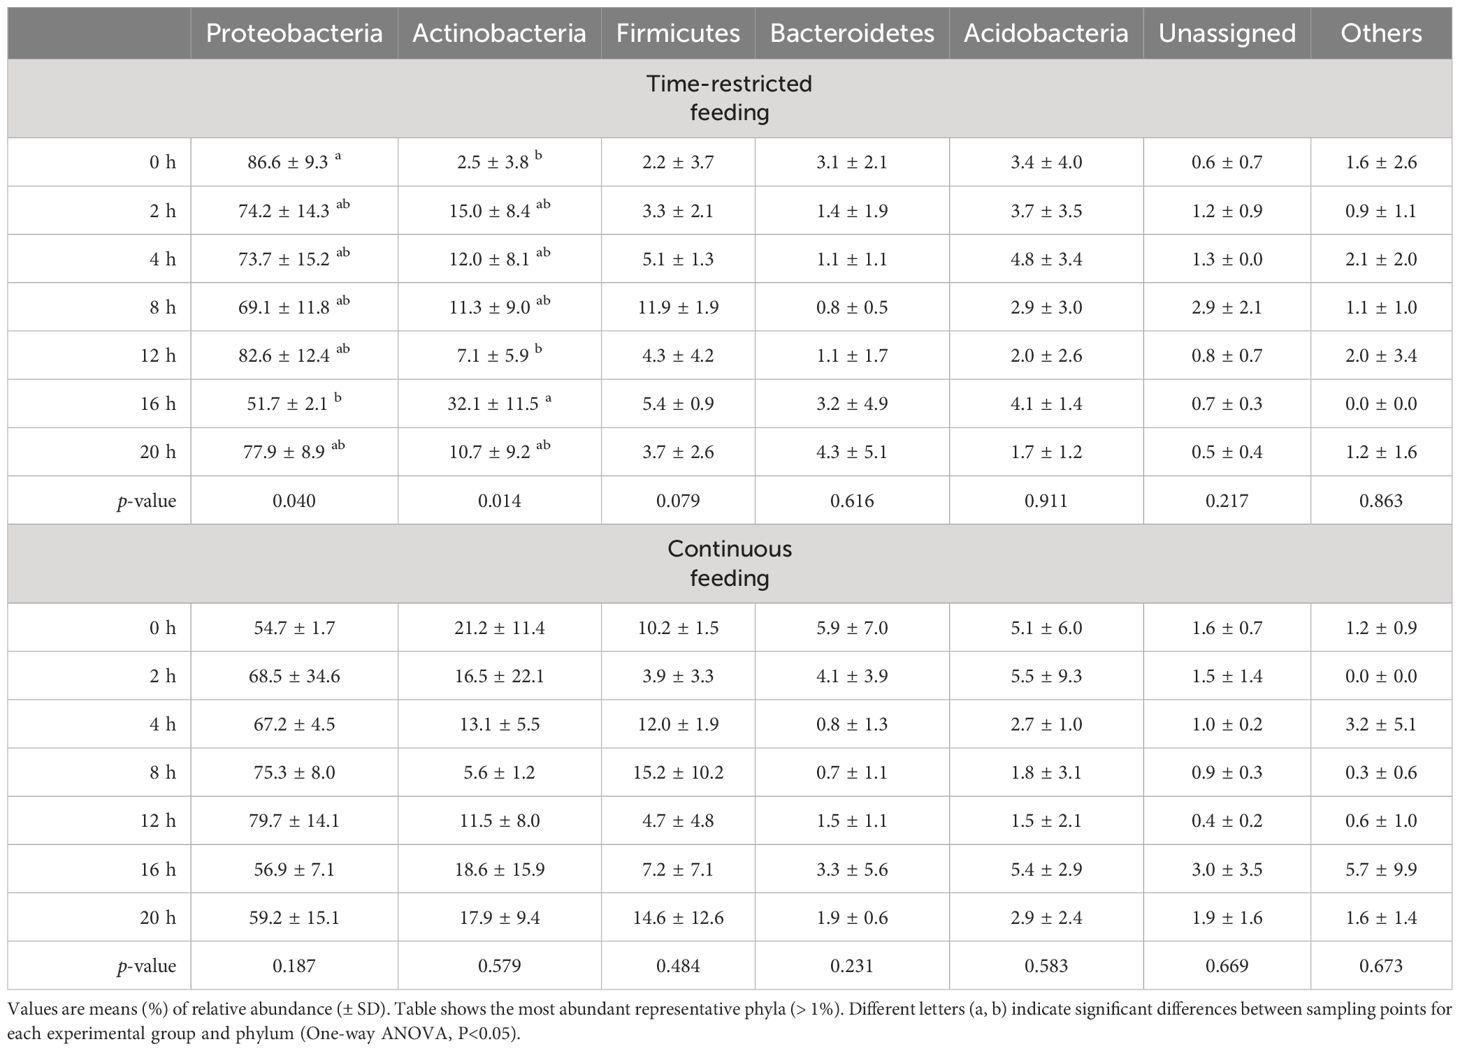
Table 1 Relative abundance of phyla based on the rRNA amplicon sequencing (expressed as percentage of the total number of reads) in feces of greater amberjack juveniles submitted to time-restricted or continuous feeding and sampled at 0, 2, 4, 8, 12, 16 and 20 hours post-first feeding.
When analyzing the active bacterial community at the phylum level in terms of absolute RNA copies (relative abundance multiplied by rRNA copies number), differences in the temporal patterns were observed for Actinobacteria and Firmicutes in the TRF-group. Both phyla increased their absolute abundance after feeding, reaching maximum values at postprandial times 16 and 8h, for Actinobacteria and Firmicutes respectively. Opposite to when expressed as relative data, no temporal variations were detected for the phylum Proteobacteria. Likewise, no temporal differences in absolute abundance were observed for any phylum in CF group. Absolute abundance is shown in Supplementary Table 2.
The time-restricted feeding regime also modulated the composition of the active community at the order level (Figure 2). Feeding promoted a decrease in relative abundance of Pseudomonadales and Xanthomonadales reaching their minimum at 8 and 12h, respectively (p< 0.001 for both, Figure 2A). An increase in the relative abundance was detected for Vibrionales, Lactobacillales and Microccocales, which reached their maximum at postprandial times 12, 8 and 16h, respectively (p = 0.001, 0.005 and 0.004, respectively). Before feeding (postprandial time 0h) the active gut community was dominated by Pseudomonadales, whereas after feeding Vibrionales became the most dominating order at all sampling points, except for postprandial time 16h, when an increase in relative abundance of Pseudomonadales was observed. For the CF fish, no temporal variation was detected at the order level (p > 0.05 for all orders). Vibrionales was the dominating order at all sampling points.
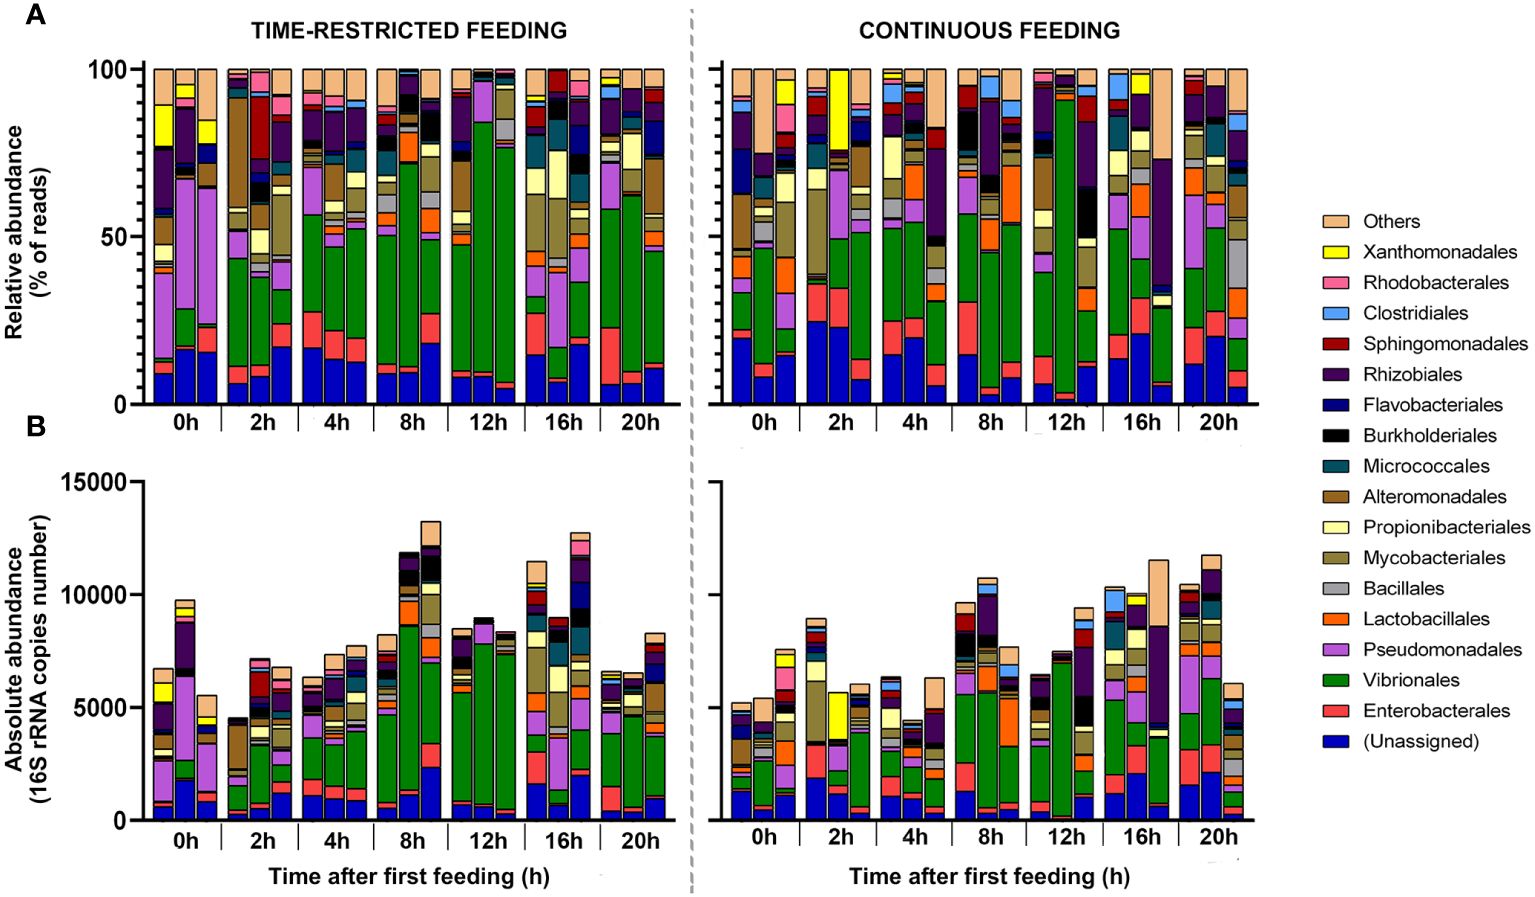
Figure 2 Structure of the active bacterial community at the order level, expressed as relative (A) and absolute abundances (B) in feces of greater amberjack juveniles submitted to time-restricted (left) or continuous (right) feeding regimes. Samples were taken at 0 hours (pre-feeding) and 2, 4, 8, 12, 16 and 20 hours post-first meal (n = 12 per stacked bar). Time points are referred to TRF-group feeding schedule. The plots represent the most abundant orders (> 1% of total reads).
When analyzing absolute RNA copies at order level (Figure 2B), results supported the temporal patterns described for the relative abundance. For TRF fish, feeding promoted a decrease in the absolute abundance of Pseudomonadales and Xanthomonadales, while Vibrionales, Lactobacillales and Microccocales increased. Feeding also resulted in an increase in the absolute abundance of the order Mycobacteriales, whose activity peaked at 16h postprandial. For the CF fish the composition of the active bacteria community in terms of absolute RNA copies was also stable along the day, with Vibrionales as the order with the highest absolute abundance in all sampling points (2,066.0 ± 1,673.6 16S rRNA copies).
Alpha diversity indices (richness and evenness) revealed statistical differences between sampling points for the TRF group (Figure 3). Richness was significantly higher at postprandial time 8h compared to 12 and 20h. While evenness was higher at postprandial time 4h compared to pre-feeding (0h) and postprandial time 12h. CF group did not present any pattern for the alpha diversity indices. Both groups presented considerable variation between individuals. Nevertheless, effect size was large for all groups (fCohen > 0.4) except for evennes in the CF group (fCohen = 0.23).
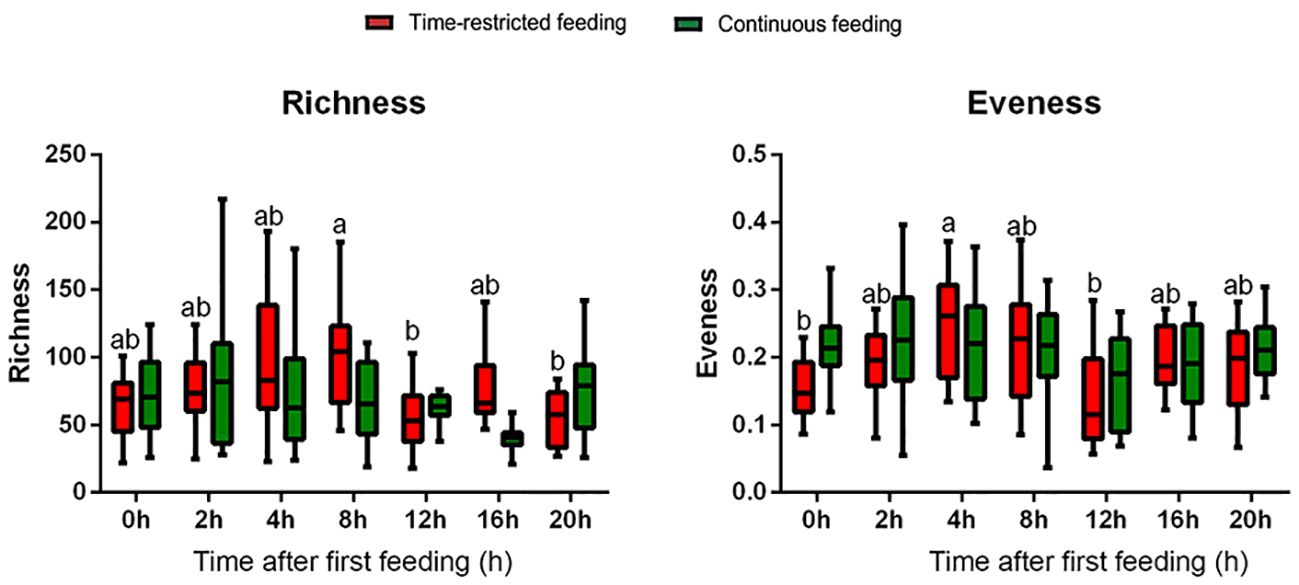
Figure 3 Box-and-wishers plots of the alpha diversity indices (richness and evenness) based on 16S sRNA sequencing of feces in greater amberjack juveniles submitted to time-restricted (red) and continuous (green) feeding regimes. Samples taken at 0, 2, 4, 8, 12, 16 and 20 hours post-first meal (referred to TRF-group feeding schedule). Boxes extend from the 25th to 75th percentiles, the line within the boxes is plotted at the median. Whiskers are drawn down to the 10th percentile and up to the 90th. Different lowercase letters mean statistical differences between sampling points for each treatment.
Two-way PERMANOVA based on Sørensen similarity revealed significantly different fish microbiota between sampling times (p = 0.0001) but not between feeding regimes (p = 0.1559). A statistical interaction between both factors was also observed (p = 0.0074). When samples were ordinated by a Principal Coordinate Analysis (PCoA) based on Sørensen similarity, 11.33% of the variance in the dataset was explained by the coordinate 1 and 7.16% by coordinate 2 (Figure 4). A clear separation of pre-feeding samples from TRF group was observed. These samples were excluded from the 95% confidence ellipses. Results from one-way PERMANOVA comparing both experimental groups at each sampling point are shown in Table 2. Based on Bray-Curtis similarity, no significant differences in fish gut microbiota were observed. By contrast, based on Sørensen similarity the potentially active bacterial community at 0h was statistically different between TRF and CF groups, and close to be significantly different at the end of the day cycle (postprandial 16 and 20h). SIMPER analysis indicated ASVs 15, 8, 14 and 25 as responsible for more than 25% of the difference between the two experimental groups at 0h. These ASVs are assign to the genera Pseudomonas (ASV 14 and 15, 14.15%), Agrobacterium (ASV 8, 7.6%) and Alteromonas (ASV 20, 3.8%).
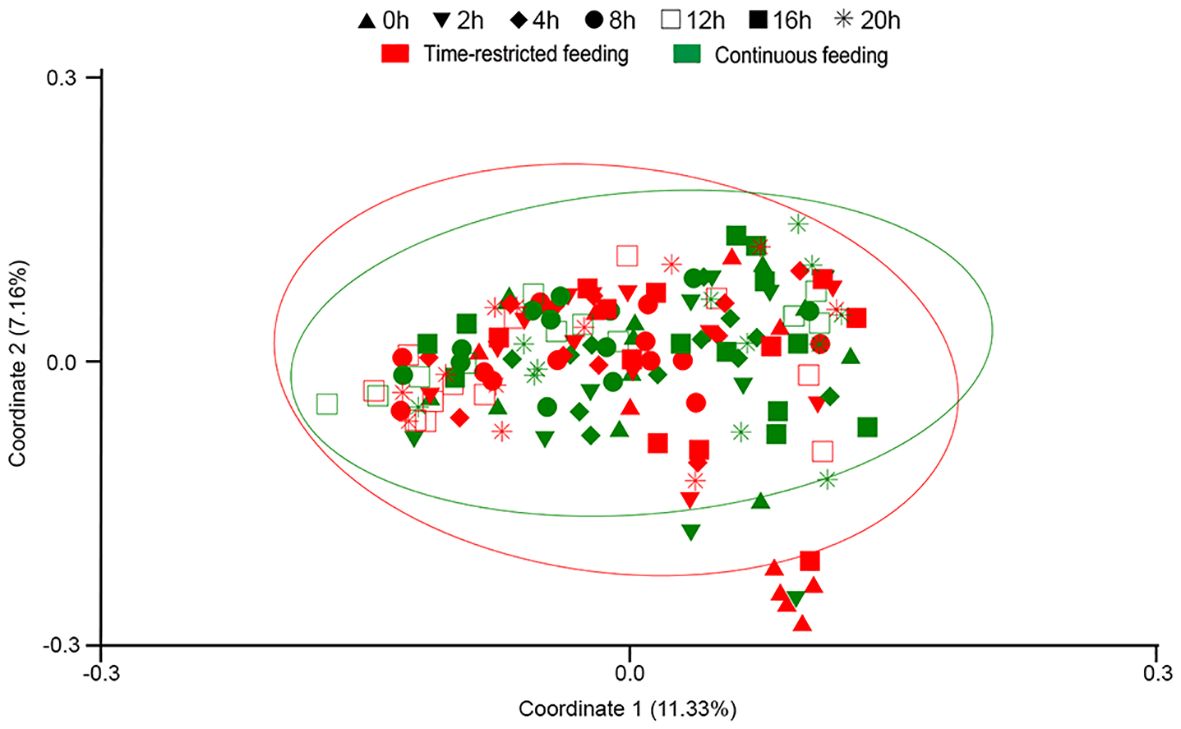
Figure 4 PCoA plot based on Sørensen similarity. Samples are from feces of greater amberjack juveniles submitted to time-restricted (red) and continuous (green) and sampled at ▲ 0h (pre-feeding time), ▼ 2h, ♦ 4h, ● 8h, □ 12h, ■ 16h and, * 20h post-first meal. 95% confidence ellipses are represented.
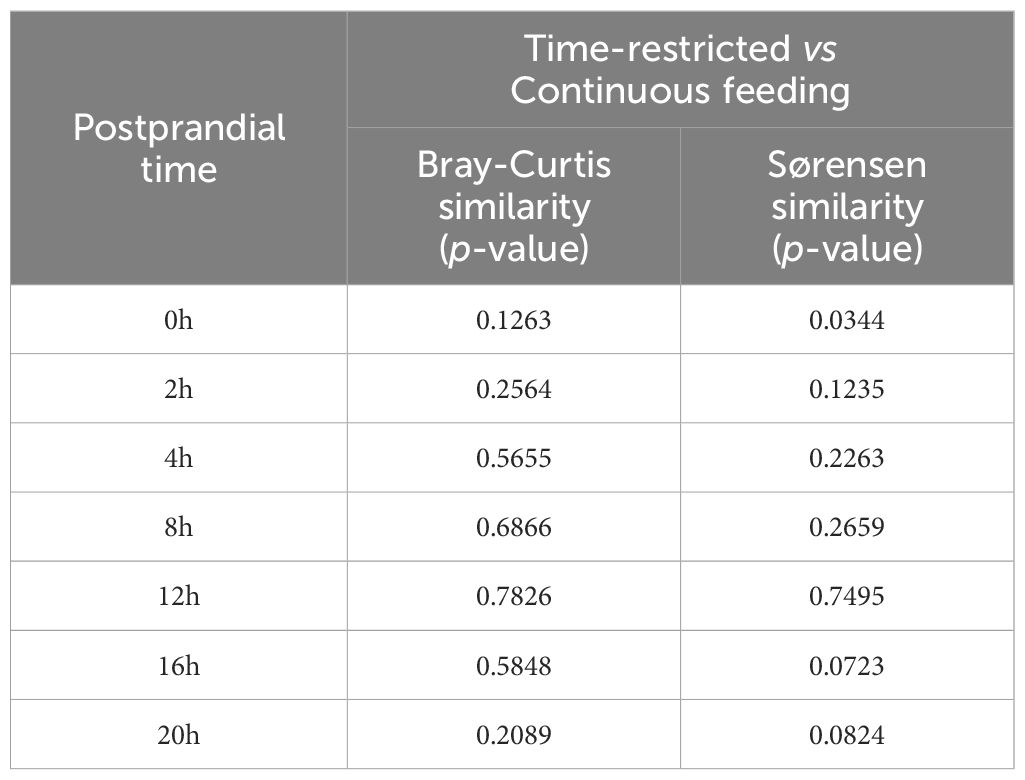
Table 2 One-way PERMANOVA results based on Bray-Curtis and Sørensen similarities for each sampling point between the two feeding regimes (time-restricted and continuous feeding).
3.3 Estimation of potential contribution of bacteria to the digestive process of fish
We proved that three washes with PBS were enough to completely clear BSA from the bacterial extract. Indeed, the major protein fractions were also removed and collected in the digesta fraction (Supplementary Figure 1).
The proteolytic activity (trypsin and chymotrypsin) in the bacterial fraction tended to decrease after feeding (Figure 5A). No amylase activity was detected. The opposite pattern was observed in the enzymatic pool within the digesta, where the activity of trypsin, chymotrypsin and amylase tended to increase after feeding (Figure 5B). However, the variations in activity were not statistically significant (p > 0.05). The potential contribution of the bacterial community to the proteolytic capacity of fish was higher for trypsin-like proteases (1.96%) than for chymotrypsin-like (0.84%) ones.
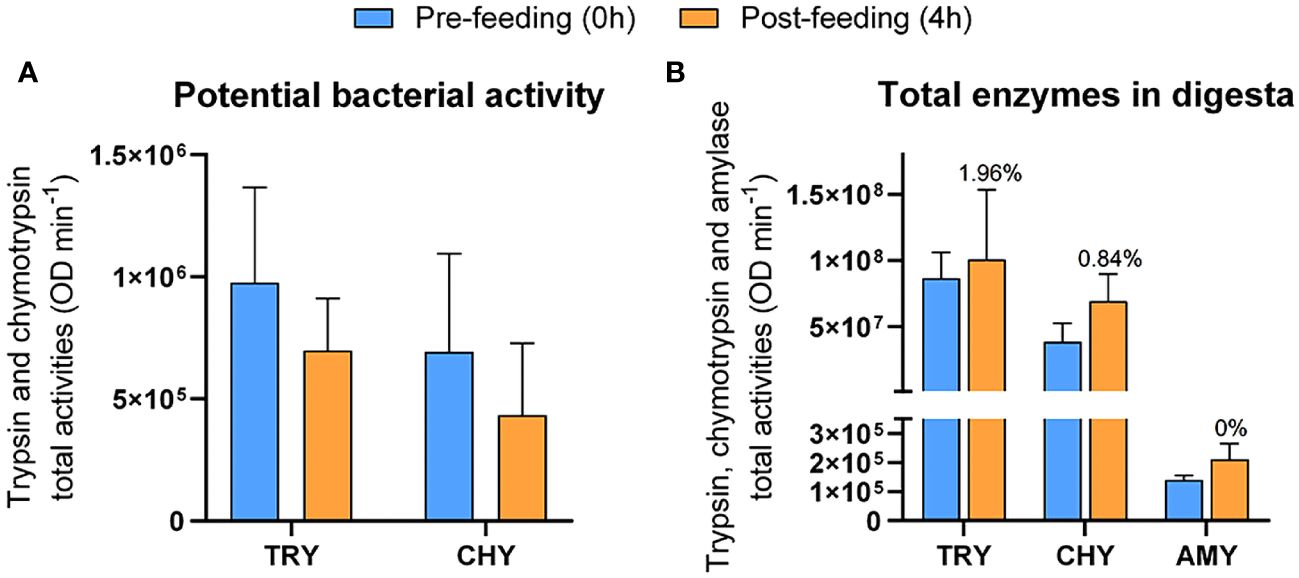
Figure 5 Total activity of digestive enzymes in the bacterial (A) and digesta (B) fractions from feces of greater amberjack juveniles under time-restricted feeding and sampled at 0h (pre-feeding, blue) and 4h (orange) postprandial. Numbers above columns indicate the potential percent contribution of bacteria to the fish digestive process for each enzyme.
Zymograms revealed 6 and 8 zones of caseinolytic activity for bacteria and digesta extracts, respectively (Figure 6A, control lanes). The molecular weights of the enzymes present in both extracts were similar. The three enzymes with higher molecular weight in the digesta extract were not found in the bacterial lanes. SBTI inhibited all bands, indicating they are serine proteases. In the bacteria extract, enzymes with the lowest and the highest electrophoretic mobility were total or partially inhibited by TPCK in addition to SBTI, revealing that these bands correspond to chymotrypsin enzymes (Figure 6A). In addition, one slightly active band was totally inhibited by SBTI and TLCK, which identified this enzyme as trypsin. For caseinolytic enzymes in the digesta, the three very active bands of similar molecular weight identified as chymotrypsins were also present. In addition, the band with the lowest electrophoretic mobility was also totally inhibited by TPCK and thus, identified as chymotrypsin. Bellow this band, two bands were partially inhibited by TLCK, corresponding to trypsin enzymes. The band of lowest molecular weight in both extracts was inhibited by SBTI, but not by TLCK and TPCK, but identified as trypsin according to a previous study (Navarro-Guillén et al., 2022). The same occurred with a band with middle-electrophoretic mobility in the digesta extract (identified with * in Figure 6A). We further explored the variations in activity in extracts coming from pre- (0h) and post-feeding fish (4h) (Figure 6B). No differences in isoenzymes composition were observed within bacteria or digesta extracts between sampling points.
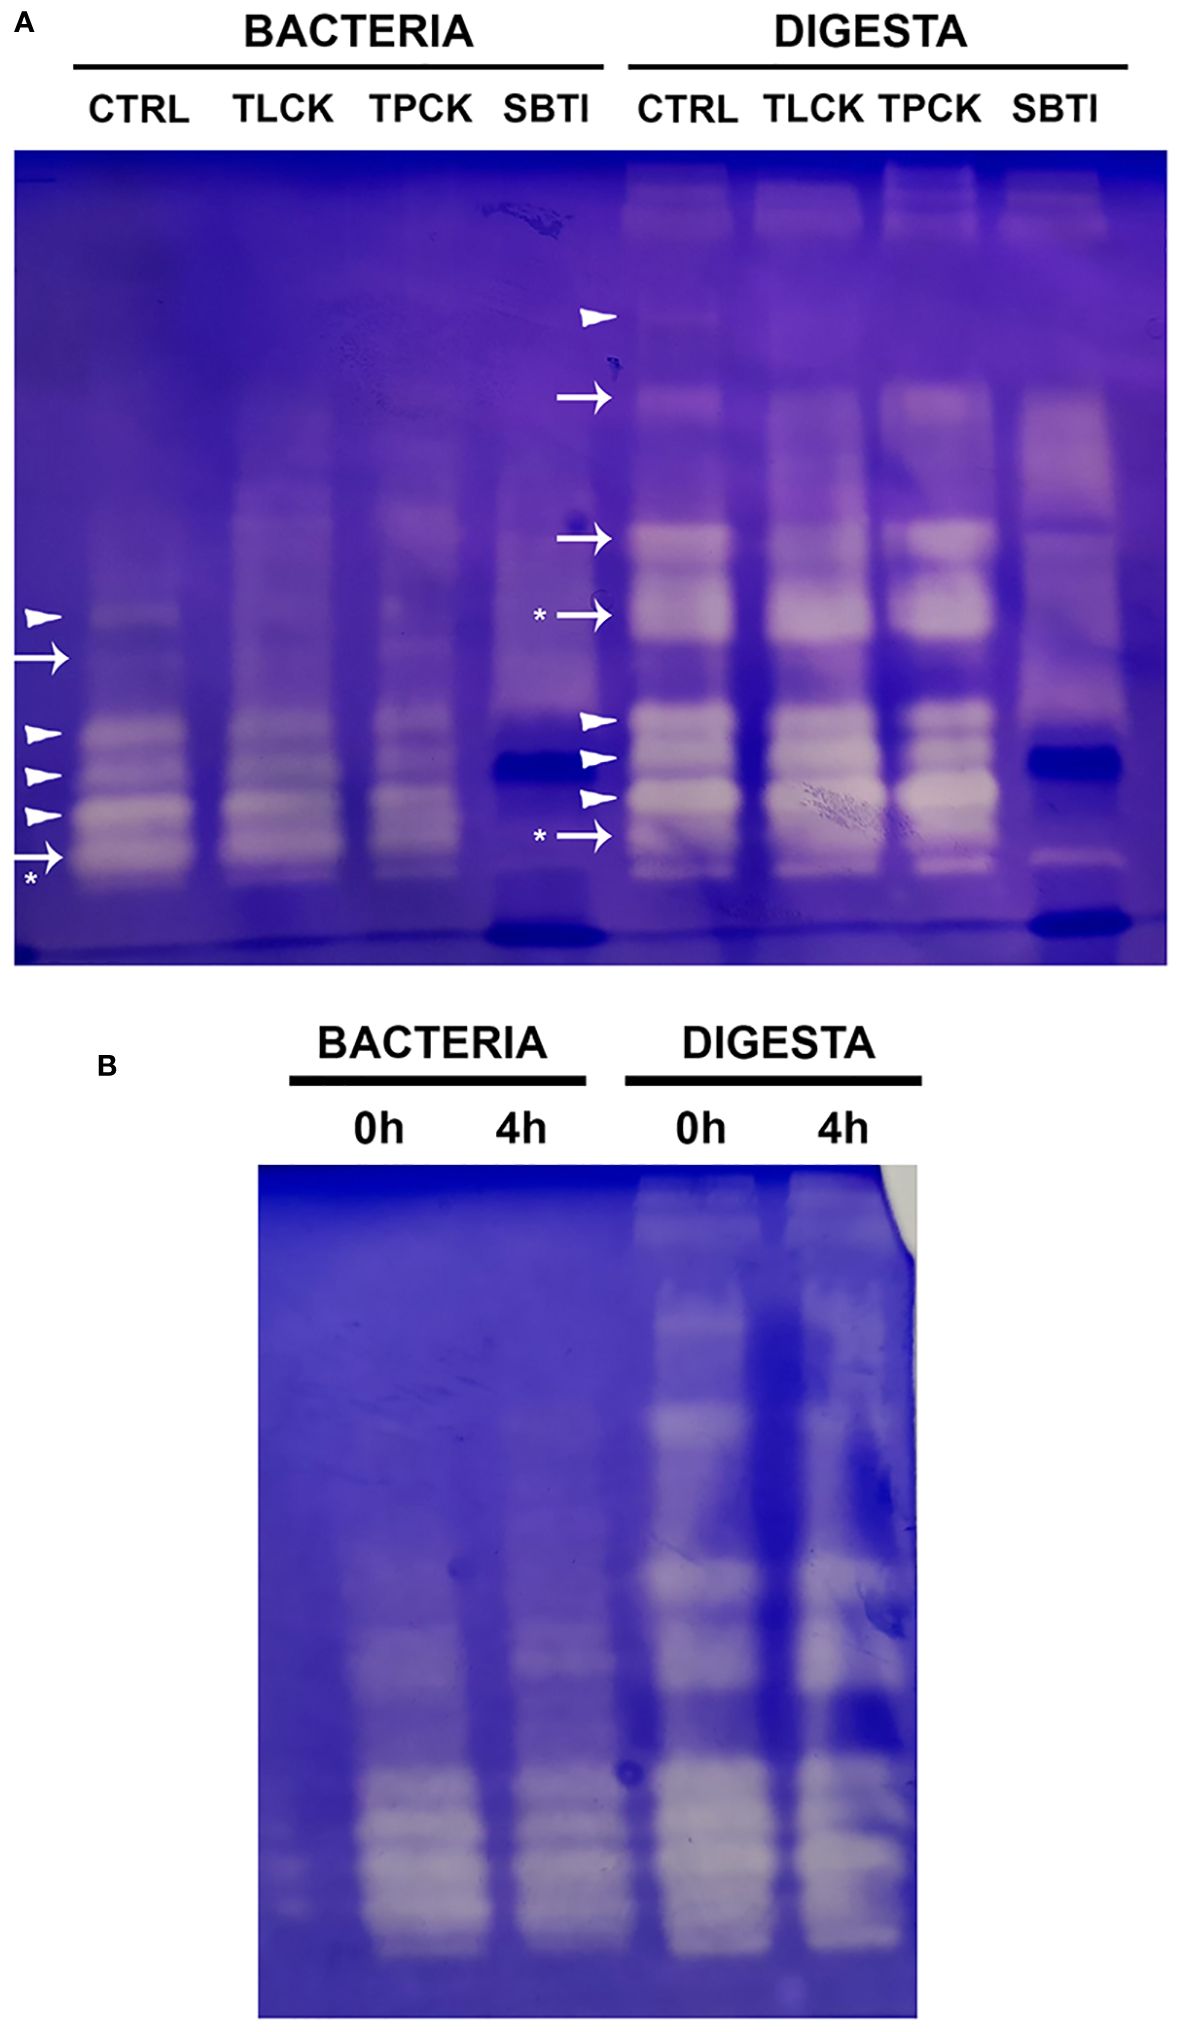
Figure 6 (A) SDS-PAGE showing bands with caseinolytic activity in bacterial and digesta extracts of greater amberjack juveniles under time-restricted feeding (Ctrl), and inhibition by specific inhibitors for trypsin (TLCK), chymotrypsin (TPCK) and serine proteinases (SBTI). Type of proteases is indicated in the control lane as follows: trypsin like proteinases (→) and chymotrypsin like proteinases (►) Asterisks mean identification based on a previous study Navarro-Guillén et al., 2022. (B) SDS-PAGE showing bands with caseinolytic activity in bacterial and digesta extracts from feces of greater amberjack juveniles under time-restricted feeding and sampled at 0 and 4h postprandial.
No active bands were identified in the zymogram for amylase neither for bacterial or digesta extracts.
4 Discussion
There is limited information for fish on how different variables can generate bacterial community dynamics at different time scales, such as circadian rhythms. Previously, we have showed that S. dumerili gut microbiota exhibited daily variations driven by feeding (Navarro-Guillén et al., 2023a). In the present study we explored further by evaluating the effects of deleting feeding time as synchronizer of gut microbiota dynamics, i.e. time-restricted versus continuous feeding. For that, we assessed the qualitative and quantitative gut microbiota dynamics and the potential contribution of bacteria to the digestive process of the fish.
The quantification of 16S rDNA genes through qPCR can be used as proxy of bacterial density. In addition, if the same procedure is performed with cDNA, obtained by reverse transcription of 16S rRNA, it can be interpreted as an estimation for activity (protein synthesis capacity) of the bacterial community (Wang et al., 2021; Navarro-Guillén et al., 2023a). Time-restricted feeding modulated the diurnal bacterial abundance and activity in feces, measured as 16S rDNA and 16S rRNA copies number, respectively. Interestingly, this temporal pattern disappeared under continuous feeding, demonstrating that feeding is the main synchronizer of gut microbiota dynamics. It is worth noting that the daily pattern of bacterial abundance and activity is coinciding with the pattern in transit of digesta through the posterior intestine in this species under the same rearing conditions (Navarro-Guillén et al., 2023b). Thus, both the maximum bacterial abundance and activity, and maximum amount of digesta in this intestinal segment were observed at 12-16h postprandial. In line with the objective of the present study, Thaiss et al. (2014) revealed fluctuations in mice microbiota function on the scale of hours over a daily cycle, by using shotgun metagenomic sequencing. In their study, mice were fed ad libitum during the dark phase under a photoperiod of 12h L:12h D. In feces collected 6h after starting the active-feeding phase (dark period) the predominant predicted bacterial functions were those involved in energy metabolism, DNA repair, and cell growth. By contrast in feces from the light phase (inactive phase for mice) it was functions related to bacteria “maintenance” such as detoxification, motility, environmental sensing, and bacterial chemotaxis which were dominating. The total gastrointestinal transit time in mice is around 6h (Padmanabhan et al., 2013), therefore, feces collected in the dark period corresponded to the first digesta reaching the rectum. Considering that in greater amberjack at 22°C total gastrointestinal transit time is around 16h (Navarro-Guillén et al., 2023b), data suggest that the increase in bacterial activity registered in the present study at 12h postprandial in TRF fish may relate to functions involved in energy metabolism and cell growth, which is supported by the peak in bacterial abundance (16S rDNA copies number) registered 4h later (16h postprandial). These daily variations in bacterial abundance and activity were absent in CF group. This indicates that changes in the luminal conditions in terms of nutrients, pH, and metabolites derived from feeding and fasting cycles, are key synchronizers of the bacterial community metabolism and dynamics. It must be examined in the greater amberjack how feeding induced variations in the gut environment but also in the host’s status translate into variations in biological processes performed by microbiota. Further studies using bacterial and host transcriptomics would clarify this issue.
Also, the taxonomic composition of the active bacterial community, i.e. as characterized based on rRNA, was modulated by the feeding rhythm. At the phylum level, Proteobacteria, Actinobacteria, Firmicutes, Bacteroidetes, and Acidobacteria dominated, with Proteobacteria as the most abundant phylum in the active community, accounting on average for 69.8%. The dominating phyla have previously been described as the dominant ones in greater amberjack intestinal ecosystem at both, larval and juvenile stages (Paralika et al., 2023; Navarro-Guillén et al., 2023a; Milián-Sorribes et al., 2024). The group with time-restricted feeding revealed diurnal variation in the composition of the active bacteria community driven by feeding activity. While the relative abundance of Proteobacteria tended to decrease after feeding, the relative abundance of Actinobacteria increased, reaching their minimum and maximum activity at 16h postprandial, respectively. An increase in Proteobacteria during fasting conditions has been described also for two other fish species, the leopard coral grouper (Plectropomus leopardus) and Nile tilapia (Oreochromis niloticus) (Kohl et al., 2014; Mekuchi et al., 2018). Such increase has been related to the fact that this phylum was the most abundant in the rearing water. Thus, the variation seems to be influenced by seawater drunk during the fasting period. Proteobacteria have been reported as dominant in greater amberjack rearing tanks in the facilities used in the present study (Navarro-Guillén et al., 2023a). CF group displayed an “active feeder”-community profile during the whole daily cycle, with no statistical significant fluctuations in abundance for any of the phyla and similar values in Proteobacteria and Actinobacteria abundances to those registered in TRF group during the period of feeding. Similarly, it has been reported in mice that time-restricted feeding promotes cyclical fluctuations in the gut microbiota, while these cyclical patterns were not detected in mice fed ad libitum (Zarrinpar et al., 2014).
At the order level, results were similar when expressed as relative or absolute abundance. In TRF group, the most noticeable changes were the decrease in Pseudomonadales with the reestablishment of feeding activity, and the dominance of the order Vibrionales during the feeding period. Interestingly, the bacterial community of CF fish was also dominated by Vibrionales during the complete 24h cycle. A correlation between the increase in Pseudomonas spp. abundance and fasting/restricted diet has been reported for Nile tilapia, Atlantic salmon and rainbow trout (Oncorhynchus mykiss) (Askarian et al., 2012; Kohl et al., 2014; Messina et al., 2023). This reorganization of the bacterial community linked to changes in host feeding rhythms may be explained by the bacteria capacity to metabolize substrates. When food intake is interrupted, bacteria capable of utilizing host-derived substrates (mucins, shed epithelial cells) proliferate to the detriment of bacteria strictly relying on dietary substrates (Ducarmon et al., 2023). Some members of the order Pseudomonadales display enzymatic activity capable of hydrolyzing host-derived substrates under fasting conditions, producing helpful metabolites to bacteria and the fish (Ray et al., 2012; Hinkel, 2020). On the other hand, feeding activity and the presence of chyme within the intestinal tract were accompanied by an increase in the potential activity of the order Vibrionales. The dominance of the order Vibrionales in the gut microbiota of actively feeding greater amberjack was previously reported by Navarro-Guillén et al. (2023a). Members of the order Vibrionales as Vibrio spp. or Photobacterium spp. are the dominant gut bacteria in several carnivorous fish species such as Atlantic cod (Gadus morhua), Atlantic halibut (Hippoglossus hippoglossus) and Snapper (Lutjanusn bohar) (Verner-Jeffreys et al., 2003; Smriga et al., 2010; Star et al., 2013). It has been proposed that these genera might aid digestion. Vibrio spp. isolated from marine fish intestines has been found to produce proteases, and along with Photobacterium spp. have also been reported to produce chitinases (Ray et al., 2012; Egerton et al., 2018).
In the present study, the bacterial community of CF fish kept similar richness and evenness throughout the day. The high variation between individuals and the absence of statistical significant temporal patterns can be explained by the fact that feed was spread along the day and, together with the social hierarchy observed in this species, fish did not probably eat all at the same time but alternately. Although, interestingly, at 12 and 16h the ASV richness was considerably less variable among the CF individuals. By contrast, the group with intermittent feeding had daily diurnal variations in both alpha diversity indices. Especially richness but also evenness decreased during the feed-restricted period. Fasting generally leads to a decrease in gut microbial diversity, as reported for the hybrid grouper (Epinephelus fuscoguttatus♀ × E. lanceolatus♂) and the leopard coral grouper (Mekuchi et al., 2018; Liu et al., 2020). The differences in beta diversity were statistically clearer when based on Sørensen similarity, but not when the PERMANOVA test was based on the Bray-Curtis similarity. PCoA revealed that the community of TRF fish before the first meal (0h) differed from all the other samples. These might be explained by the fact that in greater amberjack juveniles reared at 22°C, and under this feeding regime, the gut content is completely evacuated during the night, so this was the only batch of samples coming from individuals with empty gastrointestinal tract (Navarro-Guillén et al., 2023b). The presence of digesta within the gastrointestinal tract, and its related transit time, appears to be a major driver of temporal variation in gut microbiome. As discussed above, it is associated with gut microbial composition, and consequently with community diversity and functionality (Procházková et al., 2023). These differences in community structure driven by the intestine filling status became evident also in the results from the one-way PERMANOVA based on Sørensen similarity. Both experimental groups were statistically different at time 0h, before the feeding started in the TRF group, whereas no differences were observed when both groups were actively feeding (2 – 12h). In addition, the difference increased again between the CF and TRF samples at the end of the daily cycle (16 and 20h; p = 0.0723 and 0.0824, respectively) when the gut content started to decrease due to evacuation in the restricted group. Thus, including feeding patterns and time of sampling in microbiota-related studies will help to better understand the relation between gut microbiota, nutrition, and fish health.
The diverse bacterial community that inhabits the fish gut has an extensive metabolic repertoire that complements the activity of host enzymes, including functions such as aiding digestive function through the digestion of dietary substrates (Butt and Volkoff, 2019). In fact, germ-free rats excreted 87% more calories with the feces than conventional rats, compensating this loss by an 18% higher intake to maintain the same body weight (Wostmann et al., 1983). The present study assessed the potential direct contribution of the microbial community to the fish digestive process by using a routine laboratory assays. As it is difficult to discriminate between host and microbiota enzymes in the intestinal lumen, BSA was used as a protein marker to confirm that host enzymes were completely washed from the bacteria extract. This is clearly evidenced by the absence in the bacteria extract of some high active bands present in the digesta fraction. Thus, these techniques allow, for the first time, the quantitative estimation of the potential contribution of bacteria enzymes to host digestive process. The inhibition of caseinolytic activity in the zymogram corroborated the key role of trypsin and chymotrypsin-like enzymes in protein digestion in fish, but also in the extract from the bacterial community. Molecular weights were similar to those previously reported for caseinolytic enzymes in greater amberjack (Navarro-Guillén et al., 2022) and in bacteria (Lantz and Ciborowski, 1994). Trypsin and chymotrypsin activities were kept similar before and after feeding, although it tended to decrease in the bacterial extract. This decreasing pattern might arise from the secretion of bacteria enzymes promoted by a nutrient-rich milieu, partially contributing to the increase in activity in the digesta extract after feeding, or by changes in the structure of the microbiota community. The increase in activity in the digesta extract with feeding was expected because feeding induces the release of digestive pancreatic enzymes (Volkoff, 2016; Yúfera et al., 2019). After feeding, bacteria can also benefit from absorbable nutrients derived from digestion by the host. These host-bacteria interactions are denominated microbe-host co-metabolism (Zhang et al., 2023). In any case, potential proteolytic contribution of bacteria to total digestion under the current feeding conditions in this fish species would be, at maximum, 2%. It is worth highlighting that the present methodology may underestimate the direct contribution of bacteria to chemical digestion since does not consider the already released bacteria exoenzymes, which are washed into the digesta fraction.
Surprisingly, no amylase activity was detected in the bacterial extract although members of the orders Pseudomonas and Vibrionales are known to include amylase-producing bacteria as reported in other fish species (Ray et al., 2012). Amylase activity in the digesta was low compared to the proteolytic enzyme activity. Bairagi et al. (2002) did not detect amylolytic bacterial strains in the gastrointestinal tract of several carnivorous fish species, but did in herbivorous species. This indicates a possible co-evolution between microbial functionality and host feeding habit. Furthermore, by using our methodology with other enzyme substrates the understanding on the bacteria contribution to nutrients hydrolysis can be enlarged.
In conclusion, the present study characterized variations along a daily cycle in the gut microbiota of fish under different feeding regimes and assessed its potential contribution to the digestive process. The feeding and fasting cycles are key synchronizers of the bacterial community dynamics in terms of structure and metabolic activity. Time-restricted fed fish exhibited changes in the active bacterial community promoted by feeding, resulting in two types of community profiles: “pre-feeding” and “active-feeder” profiles. Continuous-fed fish maintained an “active-feeder” community profile the whole cycle. Bray-Curtis and Sørensen similarity indices indicated that differences between the two community profiles were mainly driven by the absence/presence of specific ASVs. The potential proteolytic bacterial activity tended to be higher before feeding, probably due to the capacity of gut bacteria to hydrolyze host-derived substrates in the absence of dietary nutrients. Thus, gut microbiota could be a key factor to understanding fish digestion, playing a role in interactions with host metabolism. Overall, our results suggest that feeding pattern and time of sampling are important parameters when assessing the microbiome’s contribution to host metabolism.
Data availability statement
The datasets presented in this study can be found in online repositories. The names of the repository/repositories and accession number(s) can be found below: https://www.ncbi.nlm.nih.gov/, PRJNA1092085.
Ethics statement
The animal study was approved by Spanish National Veterinary Authority and Spanish National Research Council bioethical committee. The study was conducted in accordance with the local legislation and institutional requirements.
Author contributions
CN-G: Conceptualization, Data curation, Formal analysis, Investigation, Methodology, Writing – original draft. ED-L: Formal analysis, Methodology, Writing – review & editing. EP: Conceptualization, Formal analysis, Methodology, Writing – review & editing. MY: Conceptualization, Funding acquisition, Investigation, Project administration, Writing – review & editing. IB: Formal analysis, Investigation, Methodology, Supervision, Writing – review & editing. OV: Conceptualization, Funding acquisition, Methodology, Supervision, Writing – review & editing.
Funding
The author(s) declare financial support was received for the research, authorship, and/or publication of this article. This research was funded by the project RTI2018-096134-B-I00 from the Spanish Ministry of Science, Innovation and Universities (MCIU), the State Research Agency (AEI) and the European Regional Development Fund (FEDER/ERDF) granted to MY, and by Coordination and Support Activity from the Research Council of Norway (contract 338107) granted to OV. CN-G was supported by the researcher contract DOC_01203 funded by the Andalusian Plan for Research Development and Innovation (PAIDI 2020).
Conflict of interest
The authors declare that the research was conducted in the absence of any commercial or financial relationships that could be construed as a potential conflict of interest.
Publisher’s note
All claims expressed in this article are solely those of the authors and do not necessarily represent those of their affiliated organizations, or those of the publisher, the editors and the reviewers. Any product that may be evaluated in this article, or claim that may be made by its manufacturer, is not guaranteed or endorsed by the publisher.
Supplementary material
The Supplementary Material for this article can be found online at: https://www.frontiersin.org/articles/10.3389/fmars.2024.1419805/full#supplementary-material
References
Anderson M. J. (2001). A new method for non-parametric multivariate analysis of variance. Aust. J. Ecol. 26, 32–46. doi: 10.1111/j.1442-9993.2001.01070.pp.x
Askarian F., Zhou Z., Olsen R. E., Sperstad S., Ringø E. (2012). Culturable autochtonous gut bacteria in Atlantic salmon (Salmo salar L.) fed diets with or without chitin. Characterization by 16S rRNA gene sequencing, ability to produce enzymes and in vitro growth inhibition of four fish pathogens. Aquaculture 326–329, 1–8. doi: 10.1016/j.aquaculture.2011.10.016
Bairagi A., Sarkar Ghosh K., Sen S. K., Ray A. K. (2002). Enzyme producing bacterial flora isolated from fish digestive tracts. Aquacult. Int. 10, 109–121. doi: 10.1023/A:1021355406412
Barlow J. T., Bogatyrev S. R., Ismagilov R. F. (2020). A quantitative sequencing framework for absolute abundance measurements of mucosal and lumenal microbial communities. Nat. Commun. 11, 2590. doi: 10.1038/s41467-020-16224-6
Bray J. R., Curtis J. T. (1957). An ordination of the upland forest communities of wisconsin. Ecol. Monogr. 27, 326–349. doi: 10.2307/1942268
Butt R. L., Volkoff H. (2019). Gut microbiota and energy homeostasis in fish. Front. Endocrinol. 10. doi: 10.3389/fendo.2019.00009
Chávez-Rodríguez L., Rodríguez-Viera L., Montero-Alejo V., Perdomo-Morales R., Mancera J. M., Perera E. (2020). A very active a-amylase and an inhibitor-based control of proteinases are key features of digestive biochemistry of the omnivorous Caribbean king crab Maguimithrax spinosissimus. J. Evol. Biochem. Physiol. 56, 550–564. doi: 10.1134/S0022093020060083
Chen S., Chen H. (2010). “Cohen's f statistic,” in Encyclopedia of research design. Ed. Salkind. N. J. (SAGE Publications, Inc, USA), 186–187.
Dantas Machado A. C., Brown S. D., Lingaraju A., Sivaganesh V., Martino C., Chaix A., et al. (2022). Diet and feeding pattern modulate diurnal dynamics of the ileal microbiome and transcriptome. Cell Rep. 40, 111008. doi: 10.1016/j.celrep.2022.111008
Dias D., Dardengo G. M., Engrola S., Navarro-Guillén C. (2021). Characterization and comparison of the digestive physiology of two scombrids, Katsuwonus pelamis and Sarda sarda, in the Gulf of Cádiz. PloS One 16, e0249541. doi: 10.1371/journal.pone.0249541
Diwan A. D., Harke S. N., Panche A. N. (2022). Aquaculture industry prospective from gut microbiome of fish and shellfish: An overview. J. Anim. Physiol. Anim. Nutr. 106, 441–469. doi: 10.1111/jpn.13619
Ducarmon Q. R., Grundler F., Le Maho Y., Wilhelmi De Toledo F., Zeller G., Habold C., et al. (2023). Remodelling of the intestinal ecosystem during caloric restriction and fasting. Trends Microbiol. 31, 832–844. doi: 10.1016/j.tim.2023.02.009
Edgar R. C. (2010). Search and clustering orders of magnitude faster than BLAST. Bioinformatics 26, 2460–2461. doi: 10.1093/bioinformatics/btq461
Edgar R. C. (2016a). UNOISE2: improved error-correction for illumina 16S and ITS amplicon sequencing. bioRxiv. doi: 10.1101/081257
Edgar R. C. (2016b). SINTAX: a simple non-Bayesian taxonomy classifier for 16S and ITS sequences. bioRxiv. doi: 10.1101/074161
Egerton S., Culloty S., Whooley J., Stanton C., Ross R. P. (2018). The gut microbiota of marine fish. Front. Microbiol. 9. doi: 10.3389/fmicb.2018.00873
Ghori I., Tubassam M., Ahmad T., Zuberi A., Imran M. (2022). Gut microbiome modulation mediated by probiotics: Positive impact on growth and health status of Labeo rohita. Front. Physiol. 9. doi: 10.3389/fphys.2022.949559
Hagi T., Tanaka D., Iwamura Y., Hoshino T. (2004). Diversity and seasonal changes in lactic acid bacteria in the intestinal tract of cultured freshwater fish. Aquaculture 234, 335–346. doi: 10.1016/j.aquaculture.2004.01.018
Hammer Ø., Harper D., Ryan P. (2001). Past: Paleontological statistics software package for education and data analysis. Palaeontol. Electron. 4, 1–9. Available at: https://palaeo-electronica.org/2001_1/past/past.pdf.
Hicks A. L., Lee K. J., Couto-Rodriguez M., Patel J., Sinha R., Guo C., et al. (2018). Gut microbiomes of wild great apes fluctuate seasonally in response to diet. Nat. Commun. 9, 1786. doi: 10.1038/s41467-018-04204-w
Hinkel L. A. (2020). The utilization of host-derived compounds by Gram-negative bacteria. (Burlington, USA: University of Vermont).
Kim P. S., Shin N. R., Lee J. B., Kim M. S., Whon T. W., Hyun D. W., et al. (2021). Host habitat is the major determinant of the gut microbiome of fish. Microbiome 9, 166. doi: 10.1186/s40168-021-01113-x
Kohl K. D., Amaya J., Passement C. A., Dearing M. D., McCue M. D. (2014). Unique and shared responses of the gut microbiota to prolonged fasting: a comparative study across five classes of vertebrate hosts. FEMS Microbiol. Ecol. 90, 883–894. doi: 10.1111/fem.2014.90.issue-3
Lantz M. S., Ciborowski P. (1994). Zymographic techniques for detection and characterization of microbial proteases. Methods Enzymol. 235, 563–594. doi: 10.1016/0076-6879(94)35171-6
Liu X., Shi H., He Q., Lin F., Wang Q., Xiao S., et al. (2020). Effect of starvation and refeeding on growth, gut microbiota and non-specific immunity in hybrid grouper (Epinephelus fuscoguttatus♀×E. lanceolatus♂) Fish Shellfish Immunol. 97, 182–193. doi: 10.1016/j.fsi.2019.11.055
Luan Y., Li M., Zhou W., Yao Y., Yang Y., Zhang Z., et al. (2023). The fish microbiota: Research progress and potential applications. Engineering 29, 137–146. doi: 10.1016/j.eng.2022.12.011
Mekuchi M., Asakura T., Sakata K., Yamaguchi T., Teruya K., Kikuchi J. (2018). Intestinal microbiota composition is altered according to nutritional biorhythms in the leopard coral grouper (Plectropomus leopardus). PloS One 13, e0197256. doi: 10.1371/journal.pone.0197256
Mes W., Lücker S., Jetten M. S. M., Siepel H., Gorissen M., van Kessel M. A. H. J. (2024). Feeding strategy and feed protein level affect the gut microbiota of common carp (Cyprinus carpio). Environ. Microbiol. Rep. 16, e13262. doi: 10.1111/1758-2229.13262
Messina M., Iacumin L., Pascon G., Tulli F., Tibaldi E., Cardinaletti G. (2023). Effect of feed restriction and refeeding on body condition, digestive functionality and intestinal microbiota in rainbow trout (Oncorhynchus mykiss). Fish Physiol. Biochem. 49, 169–189. doi: 10.1007/s10695-023-01170-z
Milián-Sorribes M. C., Martínez-Llorens S., Peñaranda D. S., Jauralde I., Jover-Cerdá M., Tomás-Vidal A. (2024). Growth, survival, and intestinal health alterations in Mediterranean yellowtail (Seriola dumerili) due to alternatives to fishmeal and fish oil. Curr. Issues Mol. Biol. 46, 753–772. doi: 10.3390/cimb46010049
Moroni F., Naya-Català F., Piazzon M. C., Rimoldi S., Calduch-Giner J., Giardini A., et al. (2021). The effects of nisin-producing Lactococcus lactis strain used as probiotic on gilthead sea bream (Sparus aurata) growth, gut microbiota, and transcriptional response. Front. Mar. Sci. 8. doi: 10.3389/fmars.2021.659519
Navarro-Guillén C., Degré Lorentsen E., Perera E., Yúfera M., Vadstein O. (2023a). Feeding and water temperature modulate the potential activity of gut microbiota in greater amberjack juveniles (Seriola dumerili). Front. Mar. Sci. 10. doi: 10.3389/fmars.2023.1236305
Navarro-Guillén C., do Vale Pereira G., Lopes A., Colen R., Engrola S. (2021). Egg nutritional modulation with amino acids improved performance in zebrafish larvae. PloS One 16, e0248356. doi: 10.1371/journal.pone.0248356
Navarro-Guillén C., Gilannejad N., Pérez-Hilario D., Martínez-Rodríguez G., Yúfera M. (2023b). Gut transit of daily consecutive meals in greater amberjack juveniles reared at different temperatures. Aquaculture 567, 739244. doi: 10.1016/j.aquaculture.2023.739244
Navarro-Guillén C., Yúfera M., Perera E. (2022). Biochemical features and modulation of digestive enzymes by environmental temperature in the greater amberjack, Seriola dumerili. Front. Mar. Sci. 9. doi: 10.3389/fmars.2022.960746
Naya-Català F., Piazzon M. C., Torrecillas S., Toxqui-Rodríguez S., Calduch-Giner J. À., Fontanillas R., et al. (2022). Genetics and nutrition drive the gut microbiota succession and host-transcriptome interactions through the gilthead sea bream (Sparus aurata) production cycle. Biology 11, 1744. doi: 10.3390/biology11121744
Padmanabhan P., Grosse J., Asad A. B., Radda G. K., Golay X. (2013). Gastrointestinal transit measurements in mice with 99mTc-DTPA-labeled activated charcoal using NanoSPECT-CT. EJNMMI Res. 3, 60. doi: 10.1186/2191-219X-3-60
Paralika V., Kokou F., Karapanagiotis S., Makridis P. (2023). Characterization of host-associated microbiota and isolation of antagonistic bacteria from greater amberjack (Seriola dumerili, Risso 1810) larvae. Microorganisms 11, 1889. doi: 10.3390/microorganisms11081889
Parma L., Yúfera M., Navarro-Guillén C., Moyano F. J., Soverini M., D'Amico F., et al. (2019). Effects of calcium carbonate inclusion in low fishmeal diets on growth, gastrointestinal pH, digestive enzyme activity and gut bacterial community of European sea bass (Dicentrarchus labrax L.) juveniles. Aquaculture 510, 283–292. doi: 10.1016/j.aquaculture.2019.05.064
Parris D. J., Morgan M. M., Stewart F. J. (2019). Feeding rapidly alters microbiome composition and gene transcription in the clownfish gut. Appl. Environ. Microbiol. 85, e02479–e02418. doi: 10.1128/AEM.02479-18
Perera E., Moyano F. J., Díaz M., Perdomo-Morales R., Montero-Alejo V., Alonso E., Carrillo O., et al. (2008). Polymorphism and partial characterization of digestive enzymes in the spiny lobster Panulirus argus. Comp. Biochem. Phys. B 150, 247–254. doi: 10.1016/j.cbpb.2008.03.009
Perry W. B., Lindsay E., Payne C. J., Brodie C., Kazlauskaite R. (2020). The role of the gut microbiome in sustainable teleost aquaculture. Proc. Biol. Sci. 287, 20200184. doi: 10.1098/rspb.2020.0184
Procházková N., Falony G., Dragsted L. O., Licht T. R., Raes J., Roager H. M. (2023). Advancing human gut microbiota research by considering gut transit time. Gut 72, 180–191. doi: 10.1136/gutjnl-2022-328166
Ray A. K., Ghosh K., Ringø E. (2012). Enzyme-producing bacteria isolated from fish gut: a review. Aquac. Nutr. 18, 465–492. doi: 10.1111/anu.2012.18.issue-5
Reinoso S., Gutiérrez M. S., Reyes-Jara A., Toro M., García K., Reyes G., et al. (2023). Feed regime slightly modifies the bacterial but not the fungal communities in the intestinal mucosal microbiota of cobia fish (Rachycentron canadum). Microorganisms 11, 2315. doi: 10.3390/microorganisms11092315
Reitmeier S., Kiessling S., Clavel T., List M., Almeida E. L., Ghosh T. S., et al. (2020). Arrhythmic gut microbiome signatures predict risk of type 2 diabetes. Cell Host Microbe 28, 258–272. doi: 10.1016/j.chom.2020.06.004
Risely A., Wilhelm K., Clutton-Brock T., Manser M. B., Sommer S. (2021). Diurnal oscillations in gut bacterial load and composition eclipse seasonal and lifetime dynamics in wild meerkats. Nat. Commun. 12, 6017. doi: 10.1038/s41467-021-26298-5
Roeselers G., Mittge E. K., Stephens W. Z., Parichy D. M., Cavanaugh C. M., Guillemin K., et al. (2011). Evidence for a core gut microbiota in the zebrafish. ISME J. 5, 1595–1608. doi: 10.1038/ismej.2011.38
Rotllant G., Moyano F. J., Andrés M., Díaz M., Estévez A., Gisbert E. (2008). Evaluation of fluorogenic substrates in the assessment of digestive enzymes in a decapod crustacean maja brachydactyla larvae. Aquaculture 282, 90–96. doi: 10.1016/j.aquaculture.2008.06.004
Schlomann B. H., Parthasarathy R. (2019). Timescales of gut microbiome dynamics. Curr. Opin. Microbiol. 50, 56–63. doi: 10.1016/j.mib.2019.09.011
Sicuro B., Luzzana U. (2016). The state of Seriola spp. other than yellowtail (S. quinqueradiata) farming in the world. Rev. Fish. Sci. Aquac. 24, 314–325. doi: 10.1080/23308249.2016.1187583
Skjermo J., Bakke I., Dahle S. W., Vadstein O. (2015). Probiotic strains introduced through live feed and rearing water have low colonizing success in developing atlantic cod larvae. Aquaculture 438, 17–23. doi: 10.1016/j.aquaculture.2014.12.027
Smriga S., Sandin S. A., Azam F. (2010). Abundance, diversity, and activity of microbial assemblages associated with coral reef fish guts and feces. FEMS Microbiol. Ecol. 73, 31–42. doi: 10.1111/j.1574-6941.2010.00879.x
Star B. K., Jakobsen S., Jentoft S., Haverkamp T. H. (2013). Next generation sequencing shows high variation of the intestinal microbial species composition in Atlantic cod caught at a single location. BMC Microbiol. 13, 248. doi: 10.1186/1471-2180-13-248
Sullam K. E., Essinger S. D., Lozupone C. A., O’Connor M. P., Rosen G. L., Knight R., et al. (2012). Environmental and ecological factors that shape the gut bacterial communities of fish: a meta-analysis. Mol. Ecol. 21, 3363–3378. doi: 10.1111/j.1365-294X.2012.05552.x
Thaiss C. A., Levy M., Korem T., Dohnalová L., Shapiro H., Jaitin D. A., et al. (2016). Microbiota diurnal rhythmicity programs host transcriptome oscillations. Cell 167, 1495–1510. doi: 10.1016/j.cell.2016.11.003
Thaiss C. A., Zeevi D., Levy M., Zilberman-Schapira G., Suez J., Tengeler A. C., et al. (2014). Transkingdom control of microbiota diurnal oscillations promotes metabolic homeostasis. Cell 159, 514–529. doi: 10.1016/j.cell.2014.09.048
Vadstein O., Attramadal K. J. K., Bakke I., Forberg T., Olsen Y., Verdegem M., et al. (2018). Managing the microbial community of marine fish larvae: A holistic perspective for larviculture. Front. Microbiol. 9. doi: 10.3389/fmicb.2018.01820
Vargas-Albores F., Martínez-Córdova L. R., Hernández-Mendoza A., Cicala F., Lago-Lestón A., Martínez-Porchas M. (2021). Therapeutic modulation of fish gut microbiota, a feasible strategy for aquaculture? Aquaculture 544, 737050. doi: 10.1016/j.aquaculture.2021.737050
Verner-Jeffreys D. W., Shields R. J., Bricknell I. R., Birkbeck T. H. (2003). Changes in the gut-associated microflora during the development of Atlantic halibut (Hippoglossus hippoglossus L.) larvae in three British hatcheries. Aquaculture 219, 21–42. doi: 10.1016/S0044-8486(02)00348-4
Volkoff H. (2016). The neuroendocrine regulation of food intake in fish: A review of current knowledge. Front. Neurosci. 10. doi: 10.3389/fnins.2016.00540
Wang X., Howe S., Deng F., Zhao J. (2021). Current applications of absolute bacterial quantification in microbiome studies and decision-making regarding different biological questions. Microorganisms 9, 1797. doi: 10.3390/microorganisms9091797
Wang H., Zhang H., Su Y. (2022). New insights into the diurnal rhythmicity of gut microbiota and its crosstalk with host circadian rhythm. Animals 12, 1677. doi: 10.3390/ani12131677
Wolda H. (1981). Similarity indices, sample size and diversity. Oecologia 50, 296–302. doi: 10.1007/BF00344966
Wostmann B. S., Larkin C., Moriarty A., Bruckner-Kardoss E. (1983). Dietary intake, energy metabolism, and excretory losses of adult male germfree Wistar rats. Lab. Anim. Sci. 33, 46–50.
Yu C., Li L., Jin J., Zhang B., Wei H., Zhao Y., et al. (2021). Comparative analysis of gut bacterial community composition during a single day cycle in Chinese mitten crab (Eriocheir sinensis). Aquac. Rep. 21, 100907. doi: 10.1016/j.aqrep.2021.100907
Yúfera M., Nguyen M. V., Navarro-Guillén C., Moyano F. J., Jordal A. O., Espe M., et al. (2019). Effect of increased rearing temperature on digestive function in cobia early juvenile. Comp. Biochem. Physiol. A 230, 71–80. doi: 10.1016/j.cbpa.2019.01.007
Zarkasi K. Z., Abell G. C. J., Taylor R. S., Neuman C., Hatje E., Tamplin M. L. (2014). Pyrosequencing-based characterization of gastrointestinal bacteria of Atlantic salmon (Salmo salar L.) within a commercial mariculture system. J. Appl. Microbiol. 117, 18–27. doi: 10.1111/jam.12514
Zarrinpar A., Chaix A., Yooseph S., Panda S. (2014). Diet and feeding pattern affect the diurnal dynamics of the gut microbiome. Cell Metab. 20, 1006–1017. doi: 10.1016/j.cmet.2014.11.008
Zeb F., Osaili T., Obaid R. S., Naja F., Radwan H., Cheikh Ismail L., et al. (2023). Gut microbiota and time-restricted feeding/eating: A targeted biomarker and approach in precision nutrition. Nutrients 15, 259. doi: 10.3390/nu15020259
Zhang Y., Chen R., Zhang D., Qi S., Liu Y. (2023). Metabolite interactions between host and microbiota during health and disease: Which feeds the other? Biomed. Pharmacother. 160, 114295. doi: 10.1016/j.biopha.2023.114295
Keywords: gut microbiota, bacteria activity, diel oscillations, feeding regime, fish physiology, digestive enzymes
Citation: Navarro-Guillén C, Degré Lorentsen E, Perera E, Yúfera M, Bakke I and Vadstein O (2024) The role of feeding as synchronizer of gut microbiota dynamics and its potential contribution to protein digestion in greater amberjack (Seriola dumerili). Front. Mar. Sci. 11:1419805. doi: 10.3389/fmars.2024.1419805
Received: 18 April 2024; Accepted: 26 June 2024;
Published: 09 July 2024.
Edited by:
Jose Fernando Lopez-Olmeda, University of Murcia, SpainReviewed by:
Adnan H. Gora, Central Marine Fisheries Research Institute (ICAR), IndiaGeorge Grant, Independent Researcher, Aberdeen, United Kingdom
Copyright © 2024 Navarro-Guillén, Degré Lorentsen, Perera, Yúfera, Bakke and Vadstein. This is an open-access article distributed under the terms of the Creative Commons Attribution License (CC BY). The use, distribution or reproduction in other forums is permitted, provided the original author(s) and the copyright owner(s) are credited and that the original publication in this journal is cited, in accordance with accepted academic practice. No use, distribution or reproduction is permitted which does not comply with these terms.
*Correspondence: Carmen Navarro-Guillén, Y2FybWVuLm5hdmFycm9AY3NpYy5lcw==