- 1Key Laboratory of Ocean Observation and Forecasting and Key Laboratory of Ocean Circulation and Waves, Institute of Oceanology, Chinese Academy of Sciences, Qingdao, China
- 2Pilot National Laboratory for Marine Science and Technology, Qingdao, China
- 3Center for Ocean Mega−Science, Chinese Academy of Sciences, Qingdao, China
- 4CAS Engineering Laboratory for Marine Ranching, Institute of Oceanology, Chinese Academy of Sciences, Qingdao, China
- 5University of Chinese Academy of Sciences, Beijing, China
- 6East China Sea Ocean Observation and Research Station, Institute of Oceanology, Chinese Academy of Sciences, Qingdao, China
The abnormal reduction of kelp production occurred in Rongcheng area of the Yellow Sea in 2021, which is closely related to the red tide. However, the relationship between the red tide event and the hydrodynamic environment remains unclear. In response to these issues, this study established a coupled physical-biological model which coupling the ROMS dynamic model with the RED_TIDE biological model for the Yellow Sea and Bohai Sea region, and discussed driving factors of this red tide. Based on this coupled model, various factors influencing the development of red tide were investigated, with a focus on analyzing the key factors contributing to the occurrence of the red tide event in the northern sea area of the Shandong Peninsula in 2021. The aggregation of dinoflagellate cells triggers red tide events. The distribution characteristics and concentration changes of dinoflagellate cells were studied by designing simulation experiments under different conditions to reflect the contributions of various influencing factors to red tide. According to observation data and simulation experiments, this study explored the effects of factors such as light conditions, tides, Yellow River runoff and wind field on the distribution and concentration of dinoflagellate cells. The variation of wind field can promote the proliferation and aggregation of dinoflagellate cells, serving as key factors in triggering red tide. The occurrence of red tide is a complex ecological phenomenon influenced by multiple factors, necessitating the comprehensive consideration of these factors to more accurately predict and prevent red tide events.
1 Introduction
The production of widespread kelp shows a significantly variation in the offshore water of Rongcheng, Shandong Province, China, in 2021. Previous study has shown that red tide is the direct cause of significant environmental changes during the decay process of kelp (Li et al., 2023). Studying the dynamic processes affecting red tide algae and their spatial and temporal distribution characteristics under the influence of external environmental factors and their own metabolism is crucial to the understanding of the structure and function of marine ecosystems. And by exploring the important driving factors of the red tide event in the sea area of Shandong Peninsula can improve the scientific understanding of marine ecological dynamic processes.
K The diversity of phytoplankton in the coastal waters of Shandong is very high, including many red tide species that can cause red tide. The climate of Shandong Peninsula and the nutrients input from land to offshore are conducive to the reproduction of red tide species. Moreover, the marine hydrological condition in the offshore waters of Shandong Peninsula is complex, affected by the Yellow Sea Warm Current, the Bohai Coastal Current, the Subei Coastal Current, and other currents, which provide conditions for red tide (Hu, 2006). The combined effects of temperature, ocean currents, eutrophication, tidal currents, runoff, and other factors make the coastal area of Shandong become a frequent area for red tide.
Since the red tide event of Noctiluca scintillans at the Yellow River Estuary recorded by Fei (1952), a total of 140 red tide events have been recorded in the offshore areas of Shandong until 2021. The red tide in Shandong mainly occurs from May to October every year, with the highest frequency in July. The sea areas where red tide occurred are mainly distributed in the coastal areas of Binzhou-Dongying, the Xiaoqinghe estuary, the coastal areas of Laizhou and Changdao, Sishili Bay in Yantai, Jiaozhou Bay in Qingdao, the coastal areas of Rushan in Weihai, and the coastal areas of Rizhao (Song et al., 2021). From November to December 2021, red tide caused by Akashiwo sanguinea and Gonyaulax polygramma bloomed in the northern sea area of Yantai and Weihai, Shandong Province. The red tide flowed into the kelp farming area of Rongcheng along the coastal currents, causing a widespread ulcerative disaster of Rongcheng kelp (Li et al., 2023).
There are also many studies on the causes, dynamic processes of generation and dissipation, and disaster prevention of red tide in the coastal areas of Shandong (Wu et al., 2001; Song et al., 2011, 2021). Zhao et al. (2016) proposed that the continuous increase in nitrogen input from land to the Yellow Sea and Bohai Sea has led to the significant increase in the frequency and area of red tide. The increase of nutrients such as nitrogen (N) and phosphorus (P) in the ocean is primarily due to human agricultural and industrial activities, which lead to the eutrophication. The increased input of nutrients from rivers aggravates the eutrophication, resulting in frequent red tide events (Xu et al., 2004). The formation mechanism of red tide is very complex. Although the specific causes of red tide have not been identified in detail, it is generally believed that the eutrophication in the ocean is the material basis for the occurrence of red tide, and temperature, salinity, nitrogen and phosphorus content are the main conditions for the occurrence of red tide, while air temperature, precipitation, and atmospheric pressure are the inducing factors of red tide (Fang et al., 2018).
The abnormal reduction of kelp production occurred in Rongcheng area of the Yellow Sea in 2021, which is closely related to the red tide. However, the relationship between the red tide event and the hydrodynamic environment remains unclear. This study discusses the main influencing factors of this red tide in the sea area to the north of Shandong Peninsula in 2021 by using the coupled physical-biological model.
The remainder of this paper is organized as follows. Section 2 describes the model configurations of physical and biological. Section 3 presents the modeling results. Section 4 discusses the contributions of various influencing factors to the concentration of dinoflagellate cells in the sea area of Shandong Peninsula. Finally, the conclusions are drawn in section 5.
2 Methods
2.1 Physical model
The circulation module is based on the Regional Oceanic Modeling System (ROMS), which is a three-dimensional hydrostatic, free-surface, primitive equation ocean model in an s-coordinate system (Shchepetkin and McWilliams, 2005). In the horizontal direction, the primitive equations are evaluated using boundary-fitted, orthogonal curvilinear coordinates on a staggered Arakawa C-grid. In the vertical direction, the primitive equations are discretized over variable topography using stretched terrain-following coordinates (Song and Haidvogel, 1994). The model domain is bounded by 36°N–41°N and 117°E–127°E (Figure 1) with a horizontal resolution of 1/30°×1/30°cosφ (where φ is latitude) and 26 sigma layers in the vertical direction.
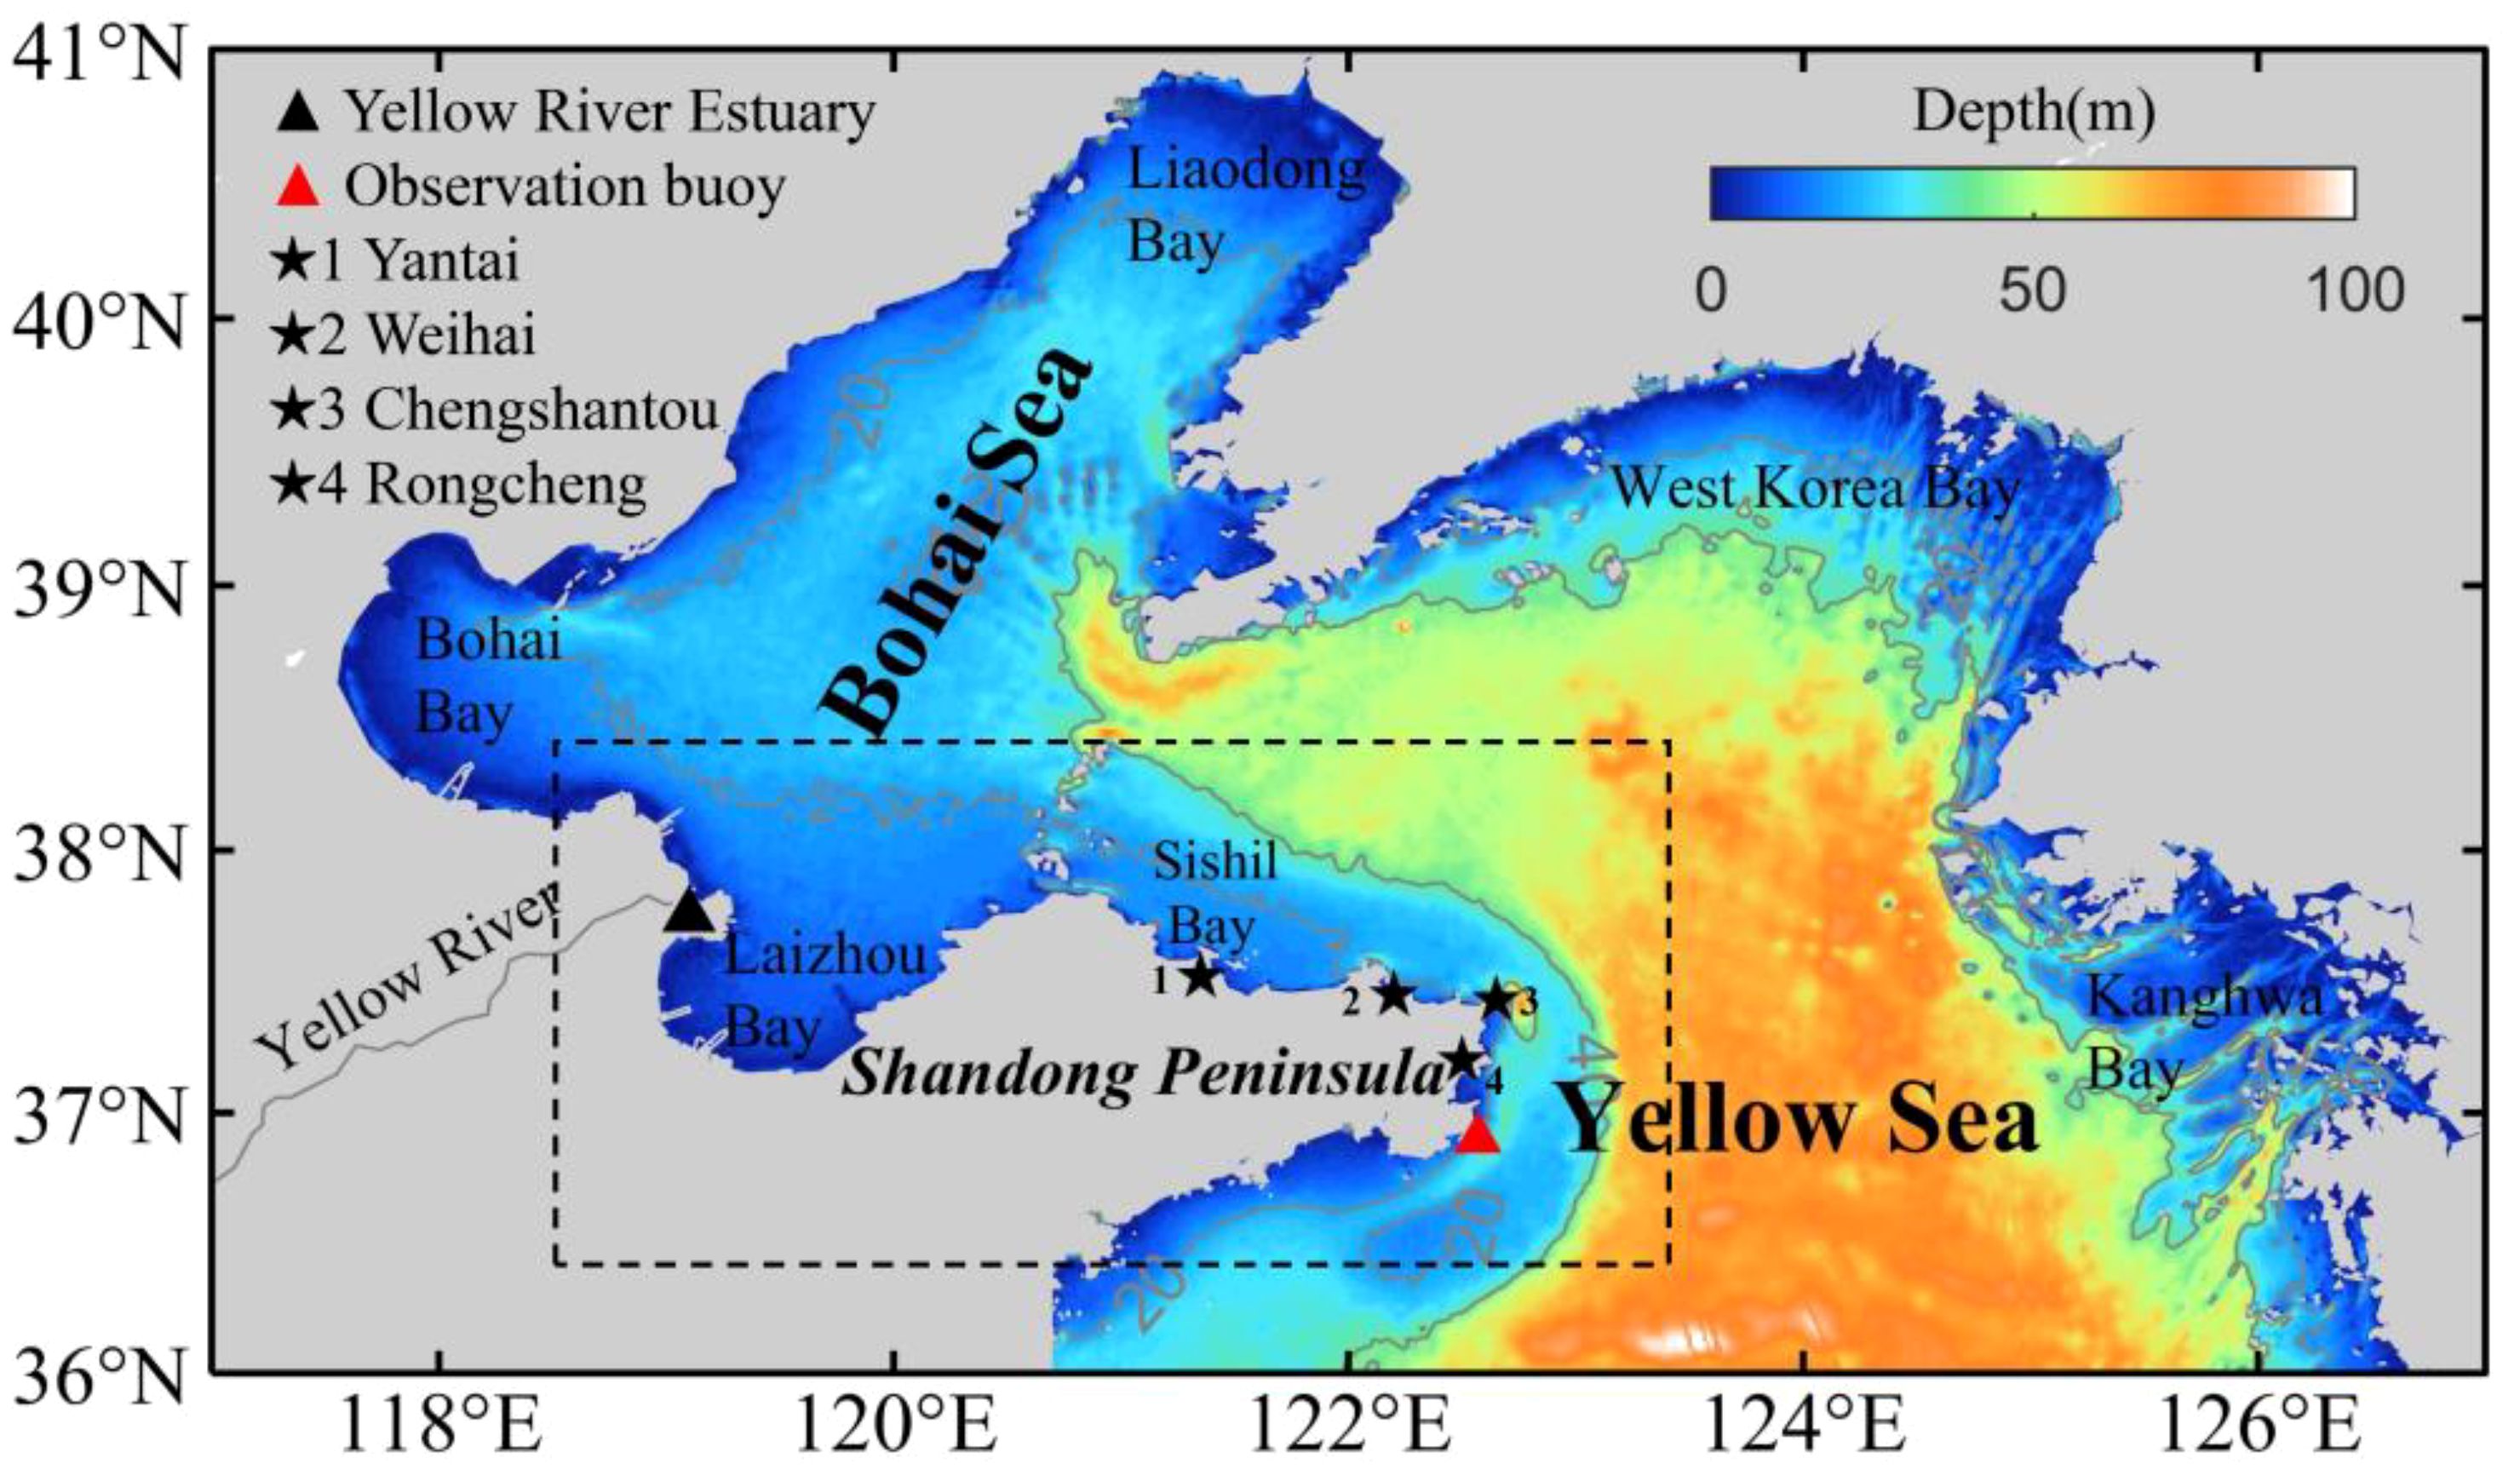
Figure 1. Bathymetric features of the Bohai Sea and the Northern Yellow Sea. The gray solid lines are the 20 m and 40 m isobaths. The black dashed box represents the main study area.
The bottom topography is extracted from the General Bathymetric Chart of the Oceans (GEBCO), which is a continuous global ocean and land topography model that provides elevation data in meters on a 15 arc-second interval grid (https://www.gebco.net/data_and_products/gridded_bathymetry_data/). Since the topography and shoreline distribution of the Yellow River Estuary can greatly affect the model results, we refined the topography based on the latest satellite images from the Google Earth Engine. The model is forced by climatological monthly heat flux, freshwater flux from the Comprehensive Ocean-Atmosphere Data Set (COADS) and tidal forcing (eight constituents, including M2, S2, N2, K2, K1, O1, P1, Q1) from the TPXO8, which is derived from Oregon State University Tidal Inversion Software (Diaz et al., 2002; Egbert and Erofeeva, 2002). The open boundary conditions and initial fields of temperature, salinity, current and elevation are interpolated from the coarse-resolution ocean model covering the Pacific Ocean (Yang et al., 2011). In addition, the model also considers the influence of the Yellow River runoff by setting the two grid points of the Yellow River runoff to be located at (119.30°E, 37.79°N) and (119.30°E, 37.81°N). The monthly-mean water discharge of the Yellow River is used from the measurements at Lijin Hydrological Station from the Yellow River Water Resources Bulletin of Yellow River Conservancy Commission of the Ministry of Water Resources (http://www.hwswj.com.cn/, Figure 2B). The monthly-mean temperature of this river is prescribed based on the climatological data.
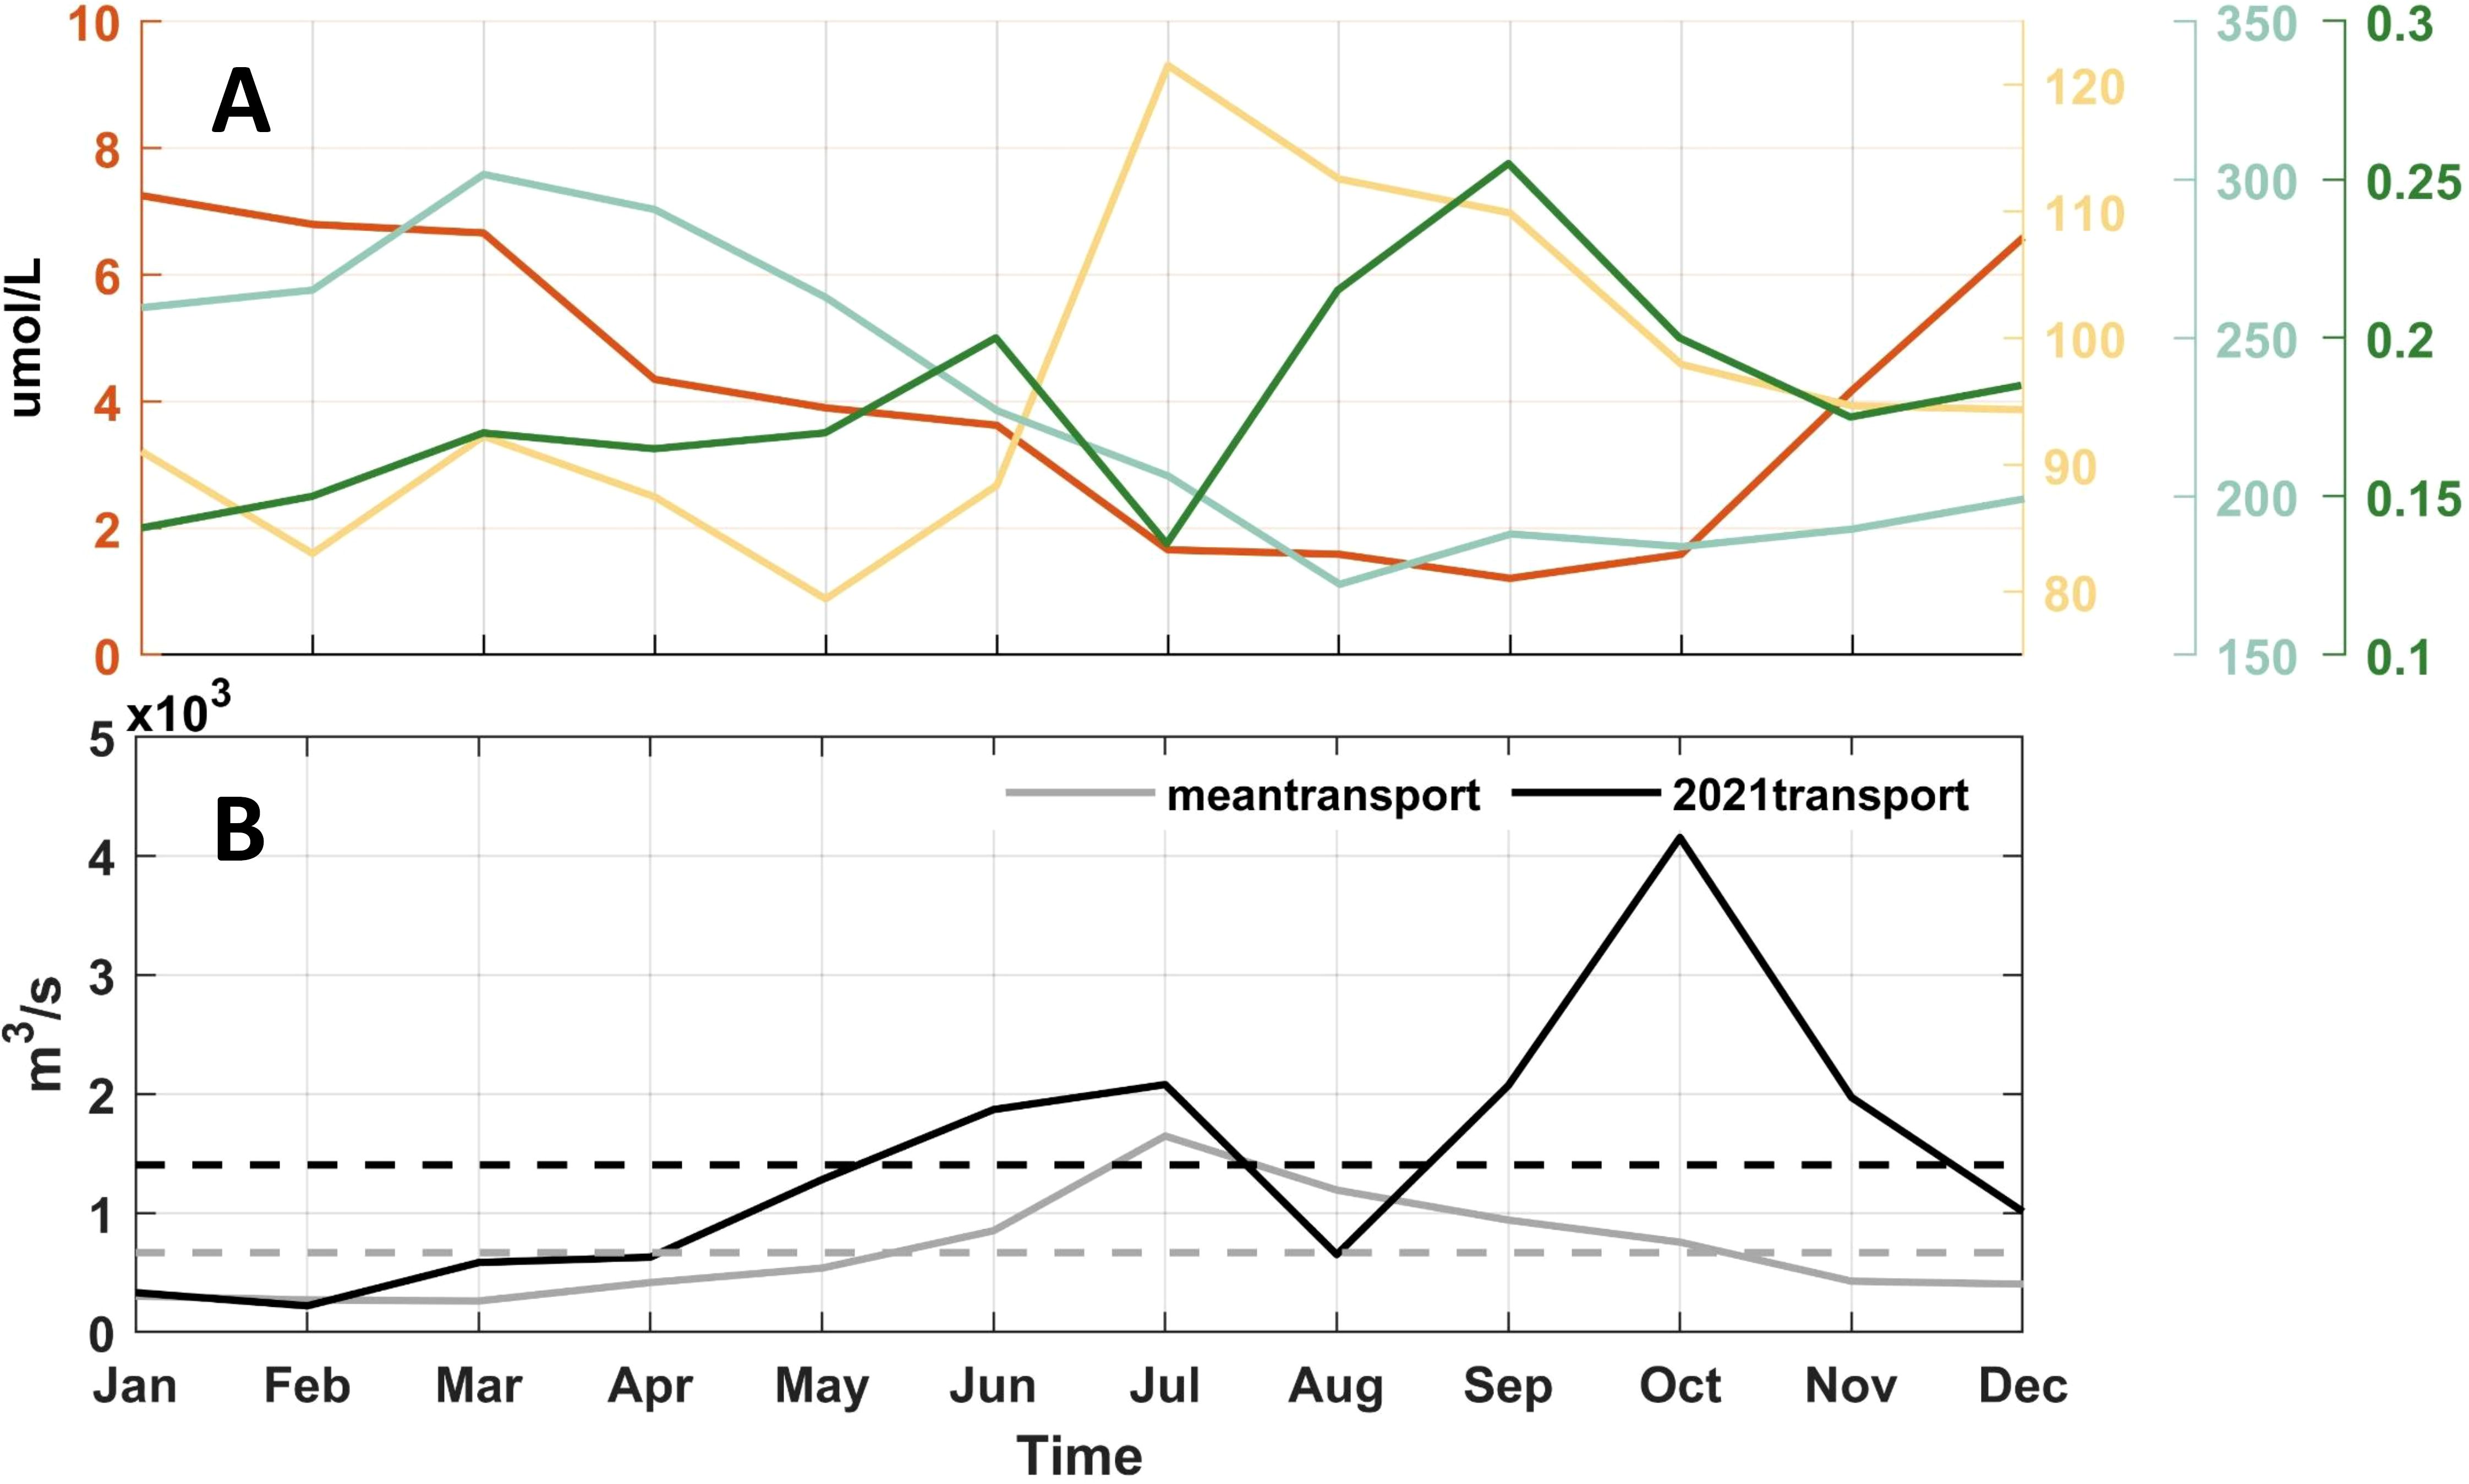
Figure 2. Monthly average (A) nutrient concentrations of ammonium, silicate, nitrate, phosphate (µmol/L), and (B) water discharge of the Yellow River (m3/s). The solid gray and black lines represent the monthly average discharge from 2010 to 2020 and 2021, respectively. The dashed gray and black lines represent the annual average discharge from 2010 to 2020 and 2021, respectively.
2.2 Biological model
The red tide biological model (RED_TIDE) is coupled with the physical model. The configuration conditions of the coupled model, including the calculation sea area, horizontal resolution, and vertical stratification, are identical to those of the physical model described in the previous section. The sea surface daily wind stress is calculated using the sea surface wind field data from the ERA5 reanalysis dataset produced by the Copernicus Climate Change Service (C3S) at ECMWF (Hersbach et al., 2023). To ensure that the simulation results are as close as possible to the actual situation in 2021, the input runoff file for the model uses the monthly mean runoff data of Yellow River at the Lijin Station in 2021, and the two-year average monthly nutrient concentrations data of the Yellow River in 2018 and 2019 from the survey based on Wang Y. et al. (2022), which are relatively close to the simulation time (Figure 2). Considering the relatively small annual mean nutrient concentration and runoff of other rivers in the study area, their influence is negligible. Therefore, this coupled model only considers land-source nutrient input from the Yellow River and excludes the nutrient input from atmospheric deposition and other rivers.
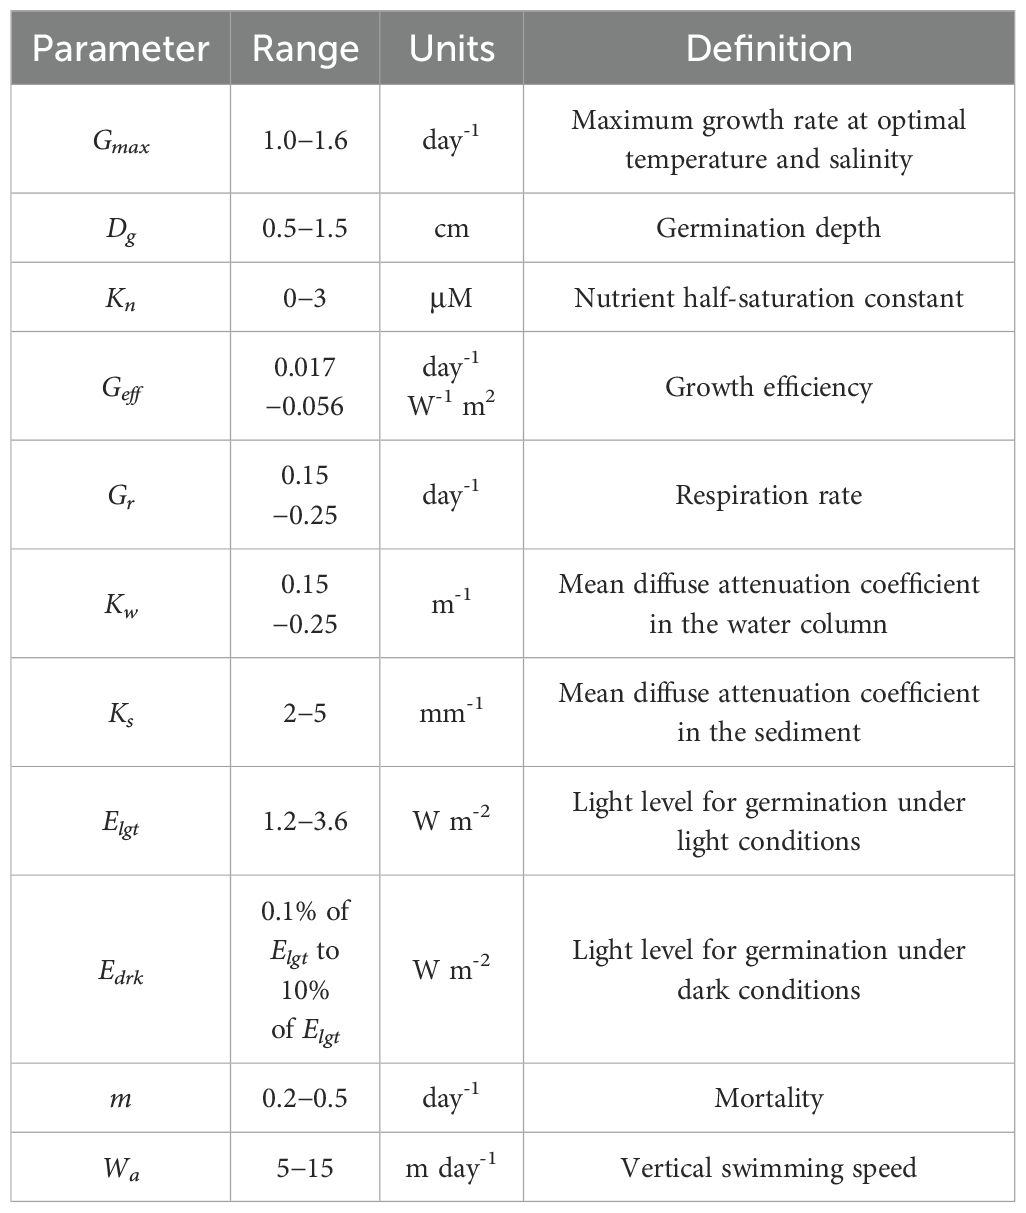
The biological module used in this study is the red_tide model for Alexandrium fundyense (Stock et al., 2005; He et al., 2008). This model contains parameterizations of dinoflagellate germination, as well as subsequent growth, swimming behavior and mortality (summarized in Table 1). Previous studies have shown that the red tide in the northern area of the Shandong Peninsula in 2021 was dominated by Akashiwo sanguinea and Gonyaulax polygramma (Li et al., 2023), both of which belong to the species of dinoflagellate. Thus, we use the same framework as that for the Alexandrium fundyense. The detailed description of these parameters can be referred to Stock et al., 2005. The evolution of dinoflagellate can be expressed as an advection-diffusion-reaction equation:
where C is the concentration of dinoflagellate cell, and Wa are the fluid velocity and dinoflagellate cell upward swimming speed, K is the diffusivity, G and m are the cell growth rate and mortality, and Fg is the germination flux from the sediment layer (cyst stage) to the water column (vegetative cell stage). Swimming velocity Wa is set at 10 m/day, a value determined by the laboratory work in early studies (Bauerfeind et al., 1986; Kamykowski et al., 1992). The growth rate G is dependent on temperature, salinity, and irradiance and nutrient concentration. The parameterizations for G, m and Fg can be referred to Stock et al. (2005).
The initial cell concentration is set to zero everywhere. The biological module involves the processes of encystment and excystment between cysts and vegetative cells. The setting of input cyst concentration can be referenced in Section 3.2. According to Li et al. (2023), water sample analysis of the area where the red tide occurred in 2021 indicated phosphorus limitation, with no nitrogen or silicon limitations detected. Therefore, the nutrient input for the model is set as phosphate. The three-dimensional dissolved inorganic phosphate (DIP) field for the initial and forcing files is obtained by interpolating the climatological monthly-averaged nutrient data from the World Ocean Atlas 2018 (WOA18, https://www.ncei.noaa.gov/data/oceans/woa/WOA18/).
The physical model was run for five years driven by climatological monthly-mean forcing, and then the coupled model was run for another year driven by repeated realistic forcing of 2021. The daily outputs of the model year were extracted for analysis.
3 Results
3.1 Model validation
The temperature data for model validation are derived from MODIS-Aqua (Moderate-resolution Imaging Spectroradiometer) and the observation data collected by the buoy of the Yellow Sea ocean observation and research station from OMORN (Offshore Marine Observation and Research Network) of the Chinese Academy of Sciences. The location of the buoy can be referred in Figure 1. Due to the water depth in the study area is relatively shallow, the distribution characteristics of temperature and salinity in the surface layer and bottom layer are similar. Therefore, this section mainly focuses on verifying the spatial distribution of sea surface temperature and salinity.
Figure 3 shows the comparison of the monthly mean sea surface temperature obtained from MODIS and the model simulation in January 2021. It can be seen that the spatial distribution of sea surface temperature simulated by ROMS is basically consistent in the Bohai Sea and the Yellow Sea. The simulated temperature in some areas of the Bohai Sea is slightly higher, while the simulation in other regions is in a better agreement with observations. Overall, due to the influence of solar radiation heat, the temperature gradually increases from northwest to southeast in the study area. The coastal waters are affected by the cold air from the land, resulting in lower temperature.
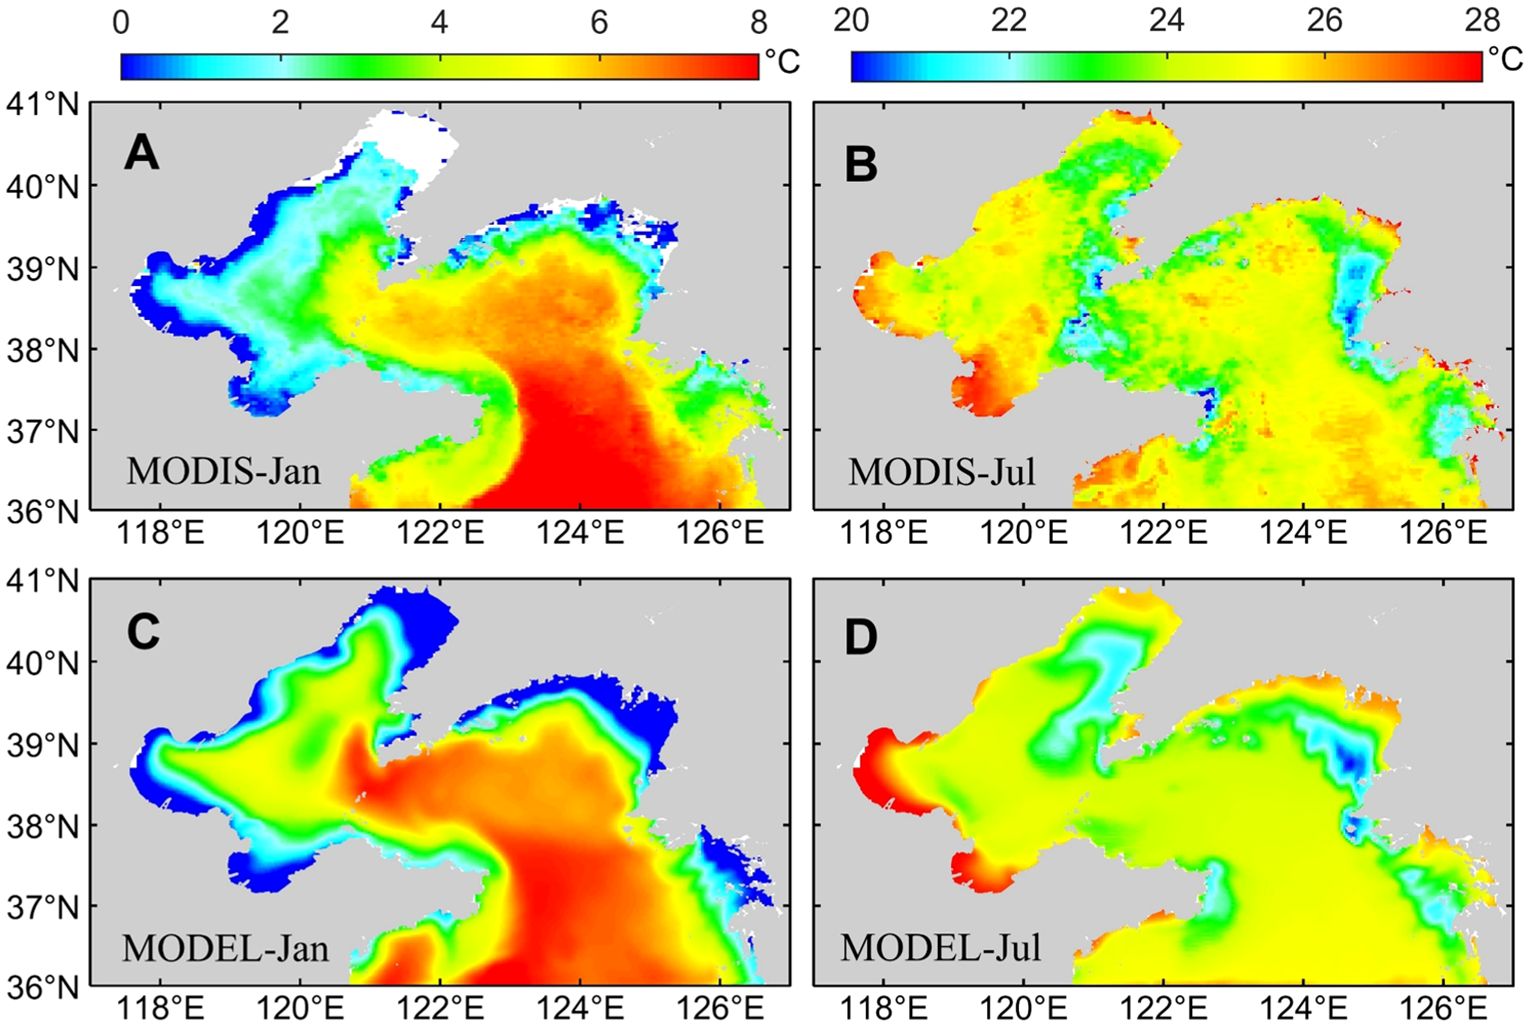
Figure 3. The monthly mean sea surface temperature of MODIS satellite observation data and model simulated in January and July 2021. MODIS data is from Parkinson (2003) (https://aqua.nasa.gov/modis).
There is a continuous low-temperature coastal zone in the Bohai Sea, which is mainly located at the Laizhou Bay, Bohai Bay, and Liaodong Bay, with a minimum of 0°C. The temperature in the internal sea area of the Bohai Sea is higher, and gradually decreases from the center to the surrounding. From the Bohai Bay to the Bohai Strait, the temperature gradually increases with the deepening of water depth, exhibiting the distribution characteristic of low temperature in shallow water and high temperature in deep water. It can be seen that there is a warm water tongue extending from the Yellow Sea to the Bohai Sea. It is generally believed that the axis of the tongue is the location of the residual current of the Yellow Sea Warm Current (Le and Mao, 1990). At the same time, the water temperature in the eastern part of the Bohai Sea is higher than that in the western part due to the influence of the residual current of the Yellow Sea Warm Current. Compared with the Bohai Sea, the sea surface temperature of the Yellow Sea is higher, ranging from 0 to 8°C, with the lowest temperature occurring in the West Korea Bay and the Kanghwa Bay. The most significant characteristic of the surface temperature distribution in the Yellow Sea is a high-temperature water tongue extending towards the interior of the Yellow Sea. The axial direction of the northward extending tongue of warm water is basically consistent with the Yellow Sea Trough, with the end of the tongue reaching the Bohai Sea, affecting most of the Yellow Sea. Moreover, there are southward coastal currents along the east and west sides of the Yellow Sea in winter, resulting in lower sea surface temperature.
In summer, the seawater temperature in Bohai Bay and Laizhou Bay can reach up to 28°C. There are cooler areas located off the southeast coast of the Liaodong Peninsula, the eastern tip of the Shandong Peninsula, and the western coast of the Korean Peninsula. The surface temperature distribution in the remaining sea areas is relatively uniform.
Because the focus of this study is the red tide event in the sea area to the north of Shandong Peninsula in the Rongcheng offshore area in 2021, the simulation results of the sea surface temperature in this area are compared with the measured temperature from the No. 16 buoy of the Yellow Sea Station. Figure 4A shows the daily variation of sea surface temperature in November 2021. The trends of both the simulated and measured temperatures changing with time are generally consistent with the gradual decrease in temperature, and the difference of monthly mean temperature is 0.12°C. The root mean square error (RMSE) and correlation coefficient are 0.56°C and 0.94, respectively. The simulation results of sea surface salinity in this area are compared with the measured salinity results from No. 16 buoy at the Yellow Sea Station. Figure 4B shows the daily variation of sea surface salinity in November 2021. The trends of both the simulated and measured salinity changing with time are generally consistent with the gradual increase in salinity, and the difference of monthly mean salinity is 0.95 PSU. The RMSE and correlation coefficient are 0.95 PSU and 0.98, respectively.

Figure 4. (A) Temperature and (B) salinity at 2m depth of Huanghai No. 16 buoy and model simulated in November 2021. The buoy data is from Yellow Sea ocean observation and research station of OMORN.
3.2 Distribution of dinoflagellate cells under different cyst simulation conditions
According to the results shown in Figure 5, compared with the average chlorophyll-a concentration over the years, the concentration of chlorophyll-a in December 2021 significantly increased, which was closely related to the red tide event that occurred in the northern sea area of Shandong Peninsula in December 2021. In order to explore the causes of this red tide event, the following studies were conducted.
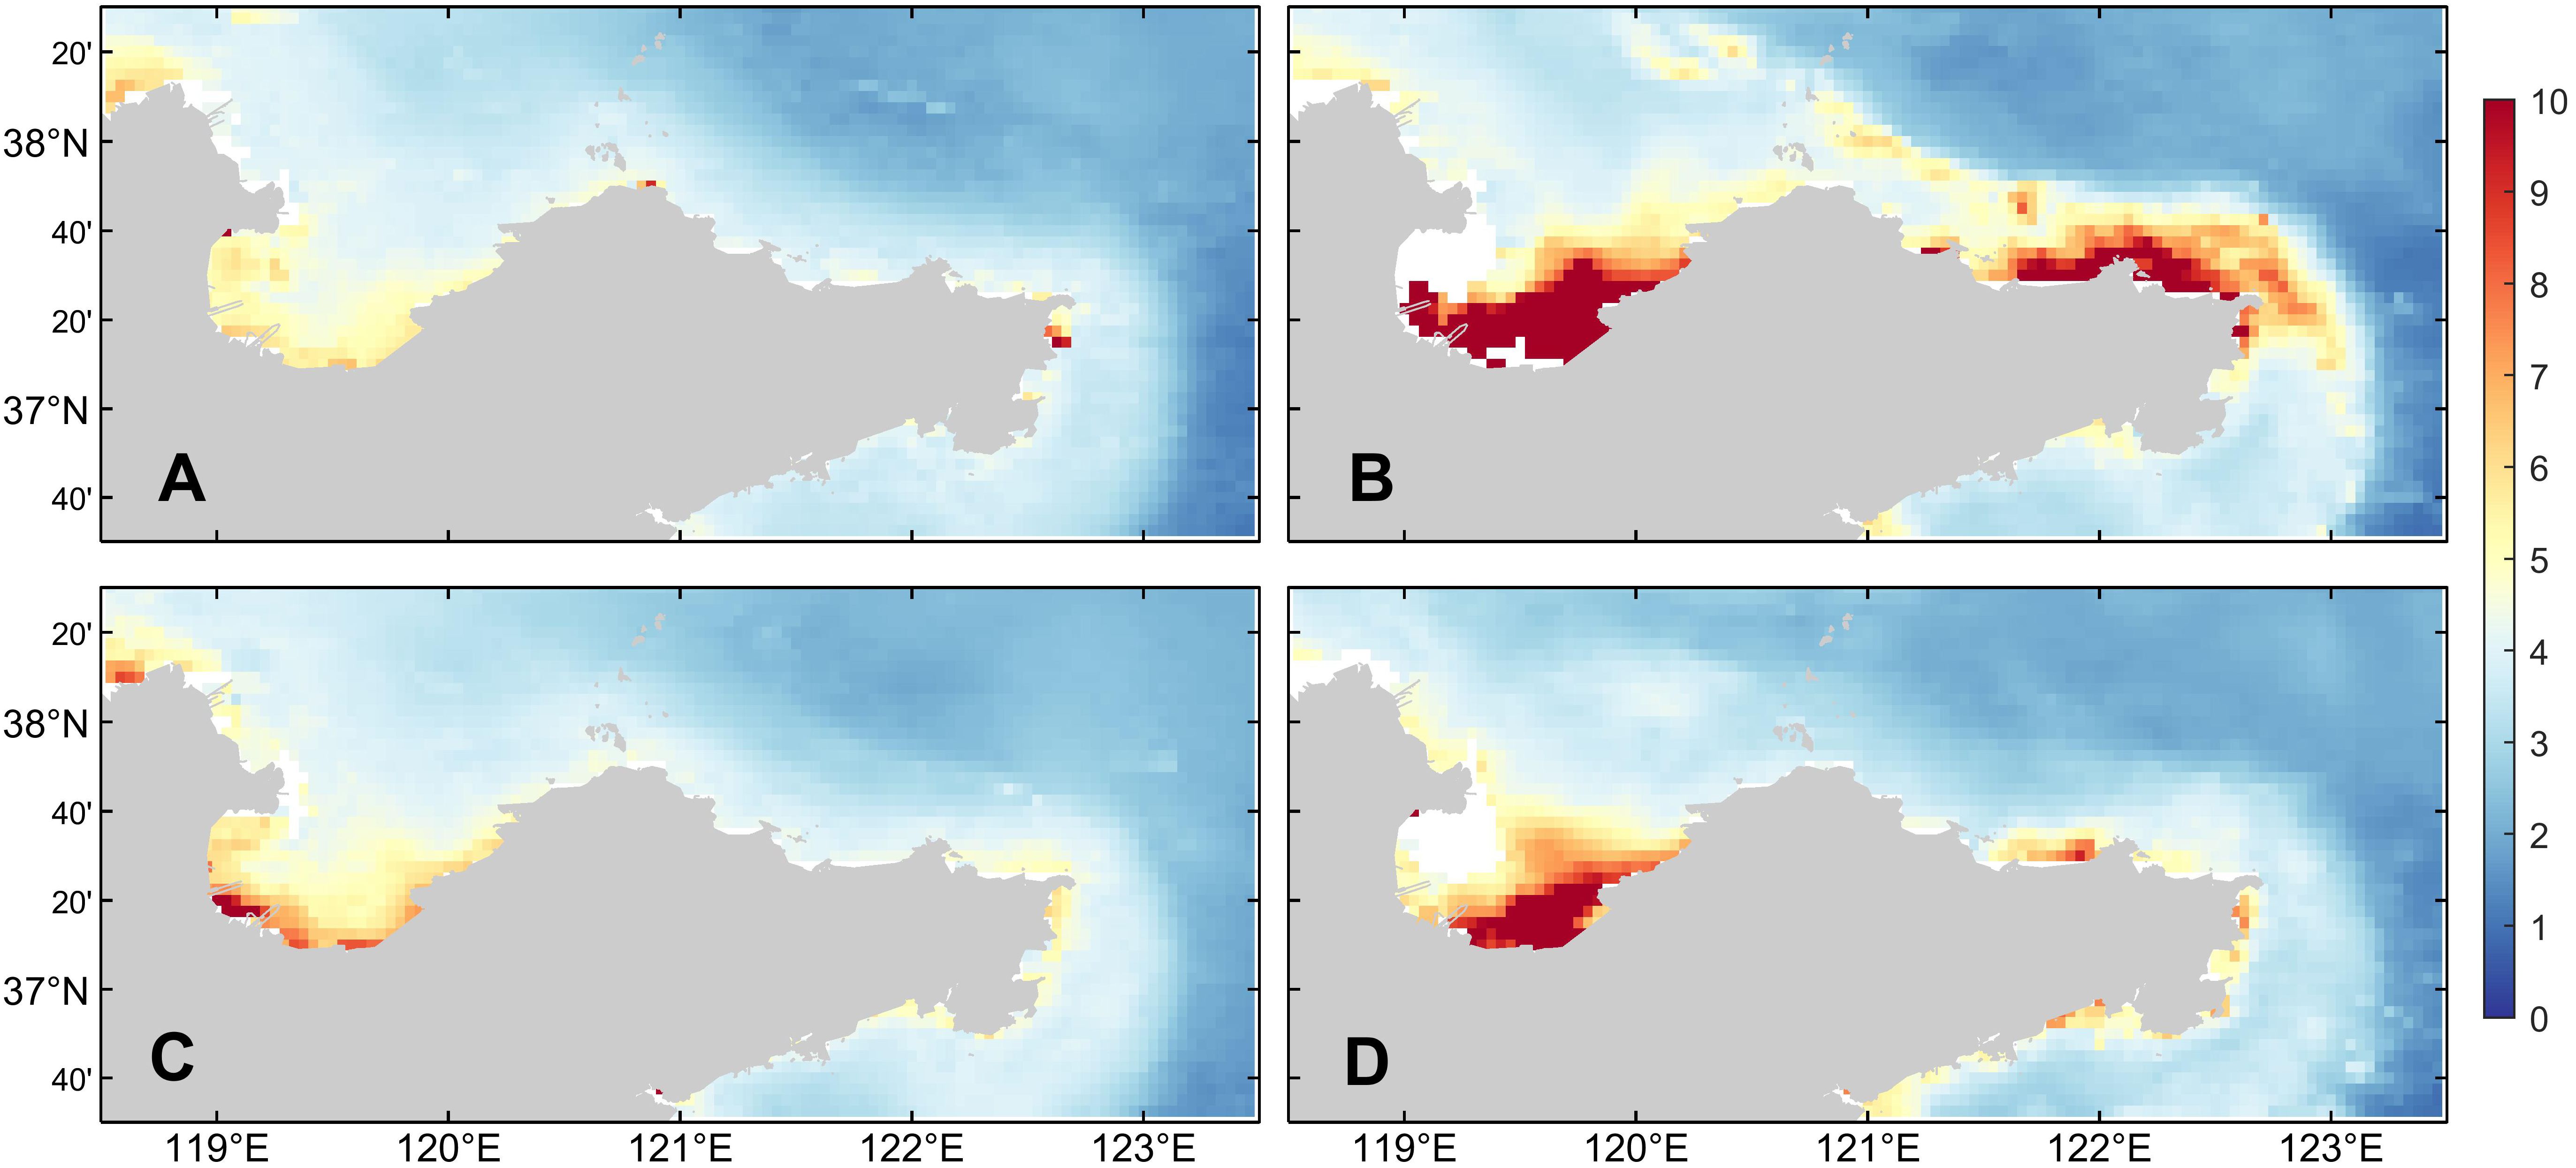
Figure 5. (A) The multi-year mean (2011-2020), (B) monthly mean chlorophyll a concentration (mg/m3) in December 2021, (C) multi-year mean, and (D) monthly mean chlorophyll a concentration in January 2022. The data is from MODIS.
Previous studies have shown that the red tide in the northern area of the Shandong Peninsula in 2021 was dominated by Akashiwo sanguinea and Gonyaulax polygramma (Li et al., 2023), both of which belong to the species of dinoflagellate. The cysts play an important role in the occurrence and disappearance of dinoflagellate cells, and under suitable conditions, they can germinate and provide a large number of swimming cells to the water, causing the occurrence of red tide events (Anderson et al., 1983; Anderson, 1998; Kremp, 2000).
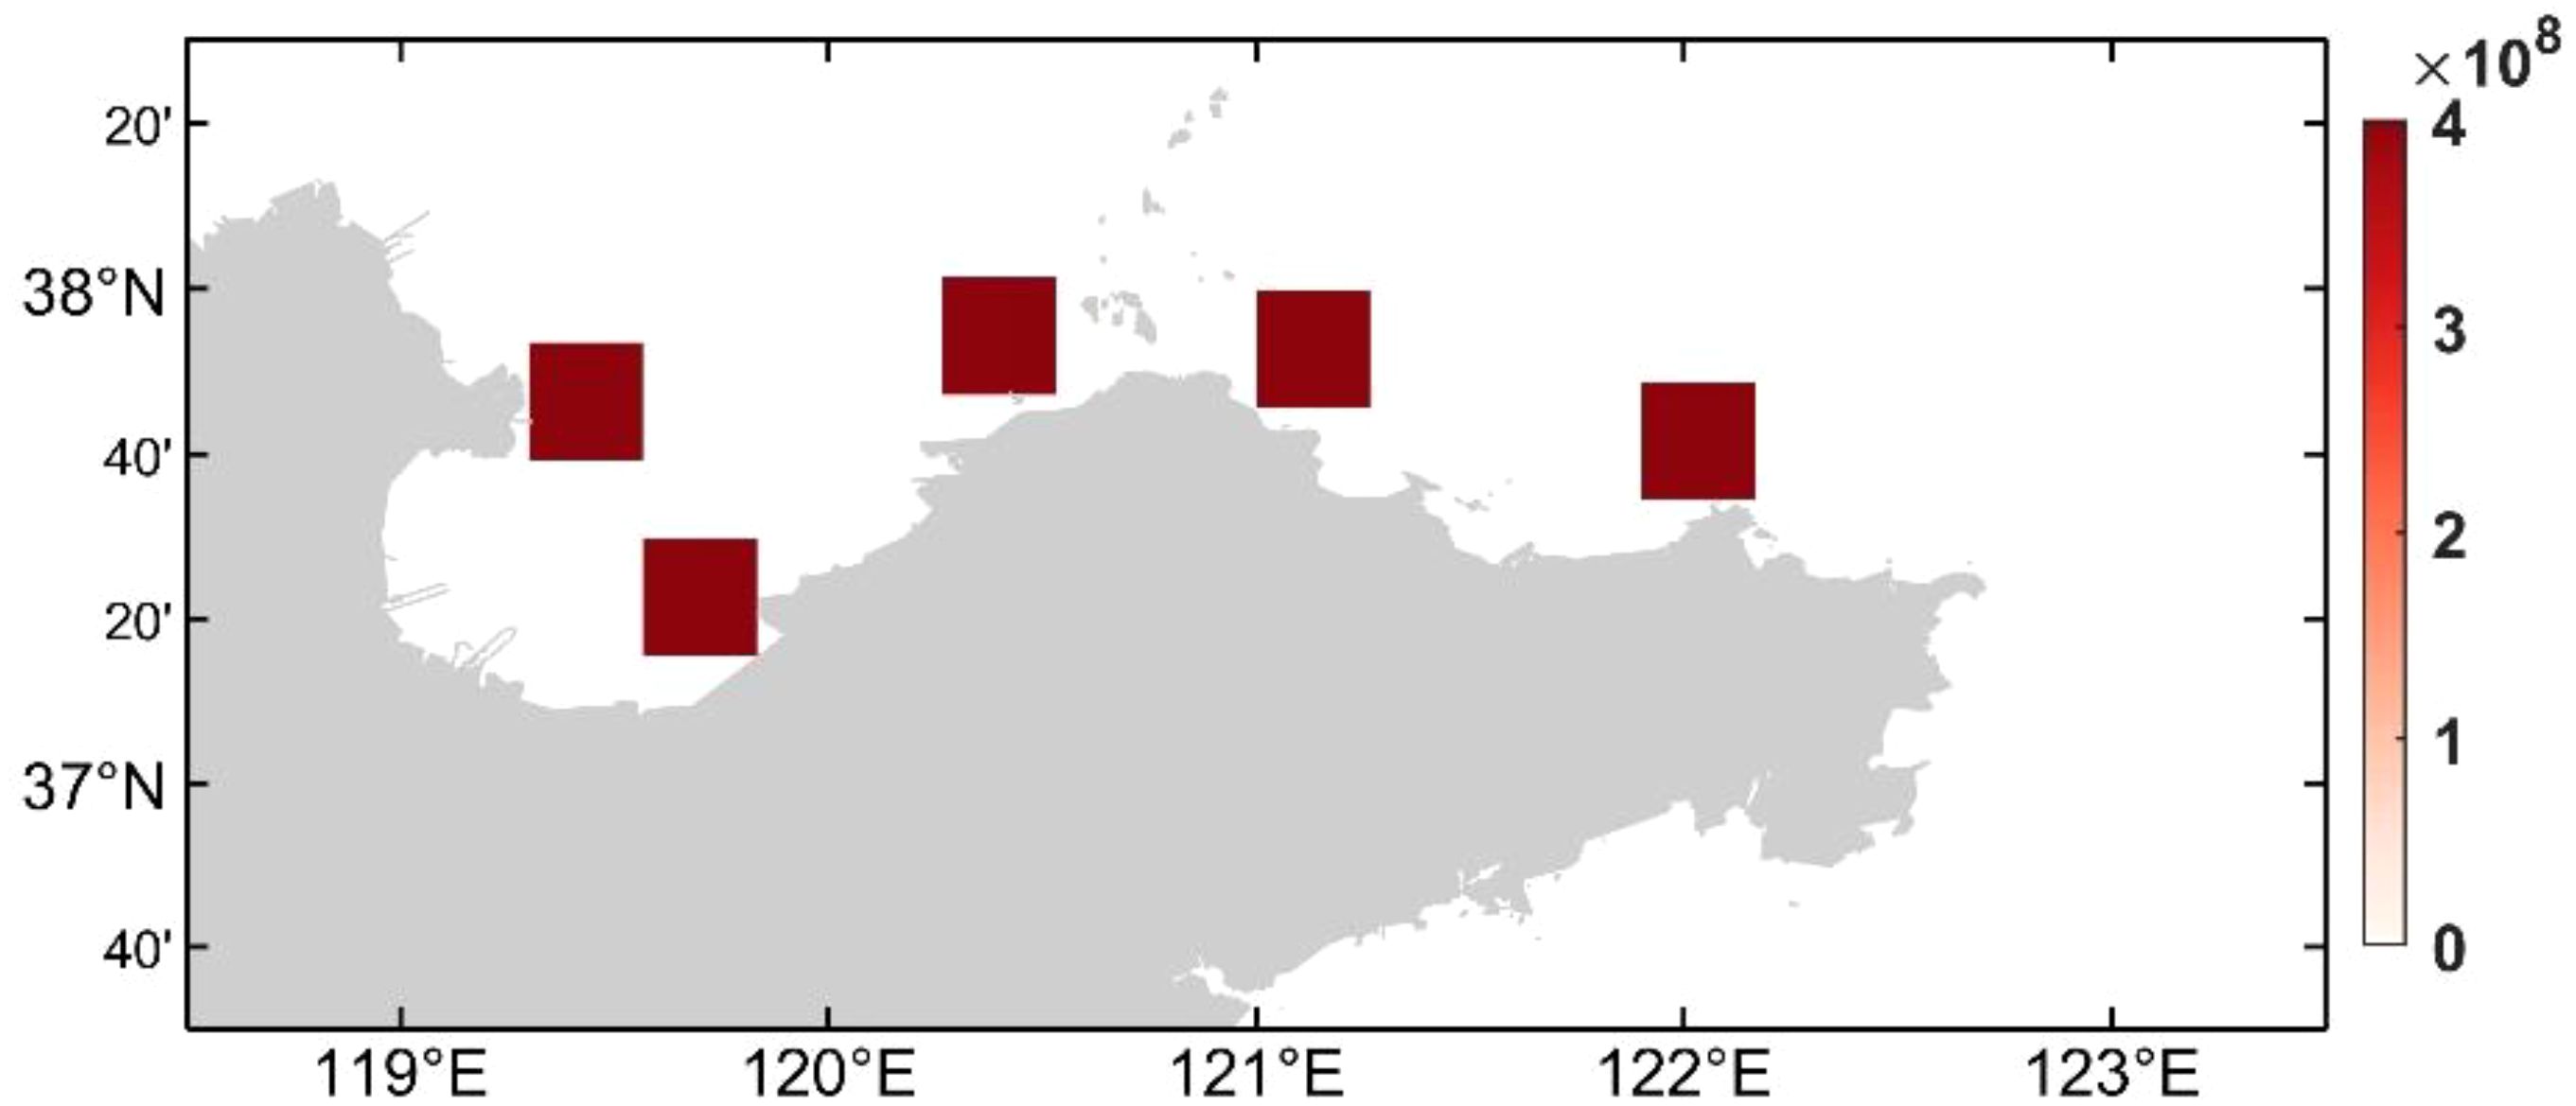
Due to the lack of survey data on the distribution of dinoflagellate cysts in the sea area of the Shandong Peninsula in 2021, the spatial distribution of dinoflagellate cysts is hypothesized in this section. We discuss the impacts of dinoflagellate cysts located in the Yellow River Estuary, Laizhou Bay, and the northern areas of Shandong Peninsula on the distribution of dinoflagellate cells. The cysts concentration is set to be 4×10⁸ cells/m2 based on the average cyst abundance in the Sishili Bay area of northern Shandong Peninsula, according to Liu et al. (2012). The distribution conditions of artificial benthic cysts are designed for areas size of 0.2°×0.2° located in different positions for simulation experiments (Figure 6). The distribution of cysts field closest to the actual situation is obtained by analyzing the simulation results.
By comparing the distribution of chlorophyll-a concentration and dinoflagellate cell concentration on December 7, 2021 (Figure 7), it can be seen that when the dinoflagellate cysts are concentrated at the Yellow River Estuary, they germinate into dinoflagellate cells and then enter the water and gradually spread and accumulate with the Yellow River runoff to Laizhou Bay, increasing the concentration of dinoflagellate cells. When the dinoflagellate cysts are concentrated in the eastern side of the Laizhou Bay, the dinoflagellate cells show a trend of spreading towards the western side of the Laizhou Bay. As a relatively closed bay, the Laizhou Bay has relatively slow water exchange, which can lead to the retention and accumulation of dinoflagellate cells within the bay. When the dinoflagellate cysts are concentrated in the northern sea area of Penglai, the coastal currents in winter drive the germinated dinoflagellate cells in the seawater to flow eastward, reaching as far as the waters near Jiming Island. When the dinoflagellate cysts are concentrated near Jiming Island, the dinoflagellate cells show an obvious eastward flow phenomenon during the flow of seawater, and there is also a trend of bypassing the Shandong Peninsula and flowing southward.
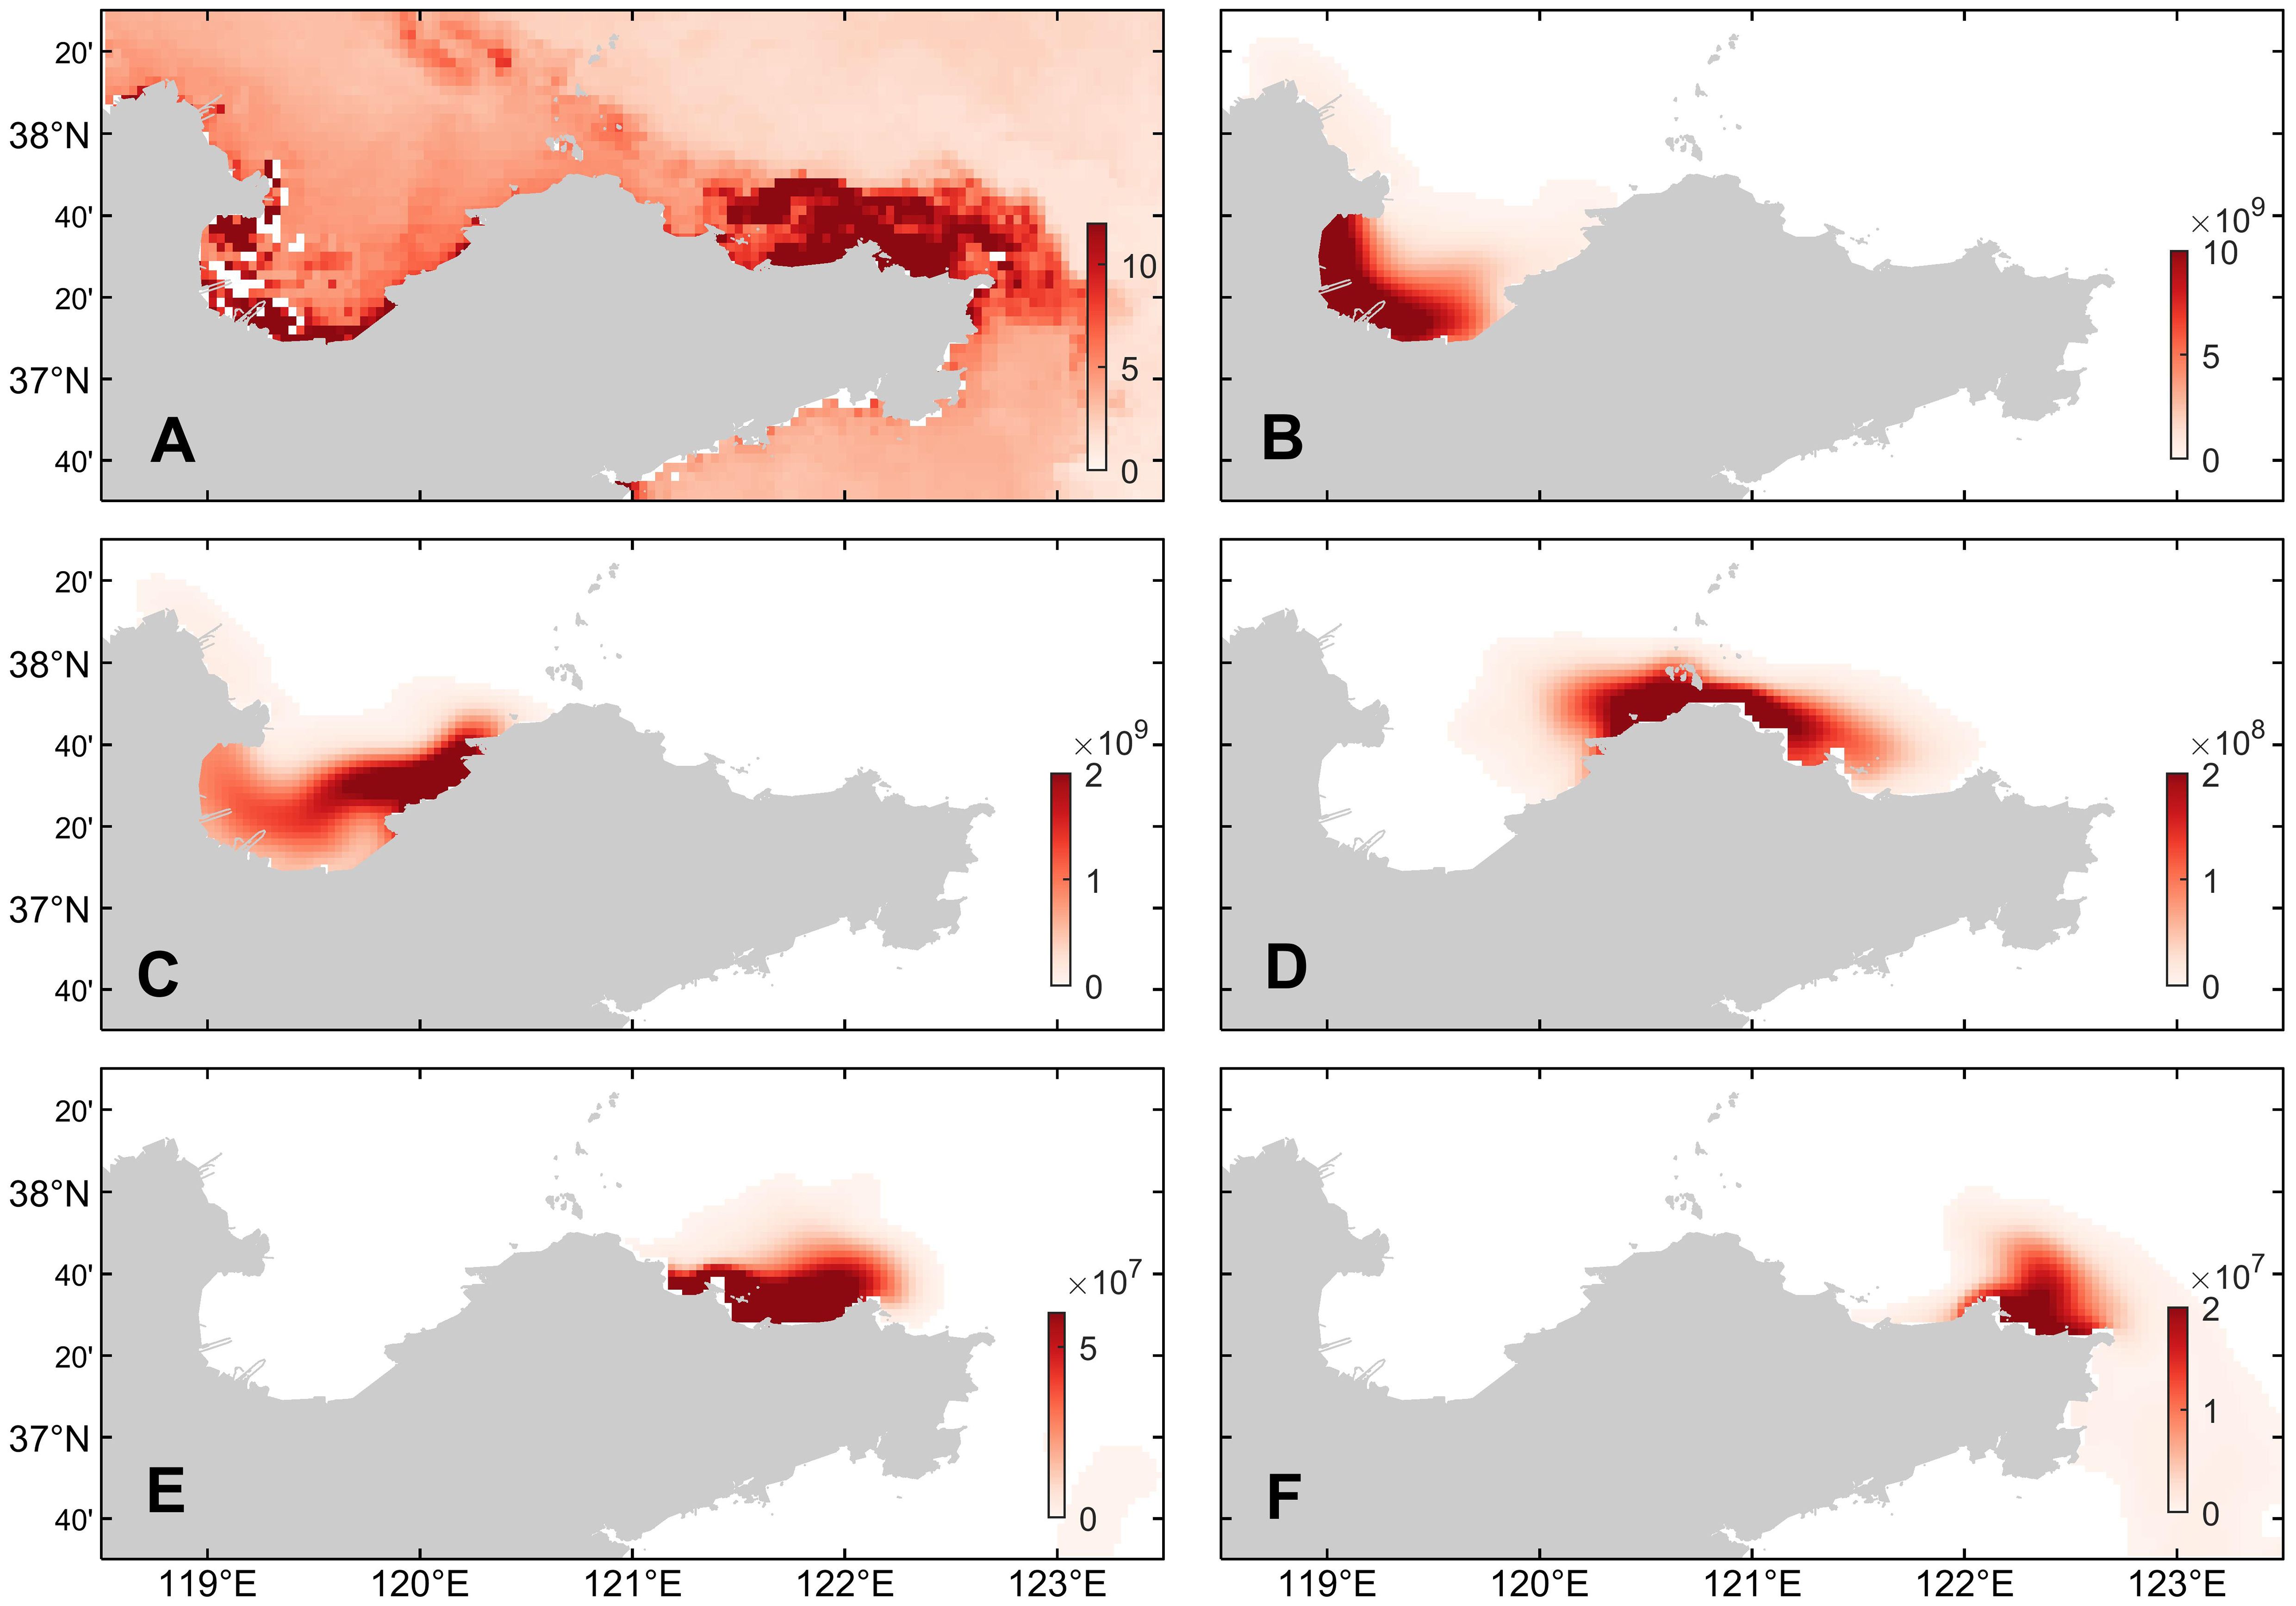
Figure 7. (A) The distribution of chlorophyll-a concentration (mg/m3) based on NOAA CoastWatch remote sensing data in the northern sea area of Shandong Peninsula on December 7, 2021 and (B–F) surface dinoflagellate cells concentrations (cell/m3) corresponding to the five simulated experiments under benthic cyst conditions at different locations (from west to east) in Figure 6. The NOAA CoastWatch data is from https://coastwatch.noaa.gov/erddap/griddap/noaacwNPPN20VIIRSchlociDaily.graph.
The analysis results indicate that when the high-value region of cyst abundance is mainly distributed in the sea area between Penglai and Jiming Island, the simulated results of dinoflagellate cell concentration are consistent with the significant increase of chlorophyll-a concentration in the offshore area of Yantai and Weihai in early December. Additionally, the distribution of chlorophyll-a concentration along the coast of the Laizhou Bay is also relatively prominent, which may be related to the existence of some cysts in the Yellow River Estuary and the Laizhou Bay area. Based on the above analysis results, the distribution of cysts is improved to simulate the more realistic distribution of dinoflagellate cell concentrations.
According to the results shown in Figure 8, the improved cysts field is closer to the actual situation, and the simulated distribution of dinoflagellate cells is consistent with the spatial distribution characteristics of chlorophyll-a. And the simulated dinoflagellate cell concentration can reach up to 109 cell/m3, which is consistent with the magnitude of the algal cell density of up to 3.5×10⁹ cell/m3 obtained by Li et al. (2023) according to the counting results of field samples.
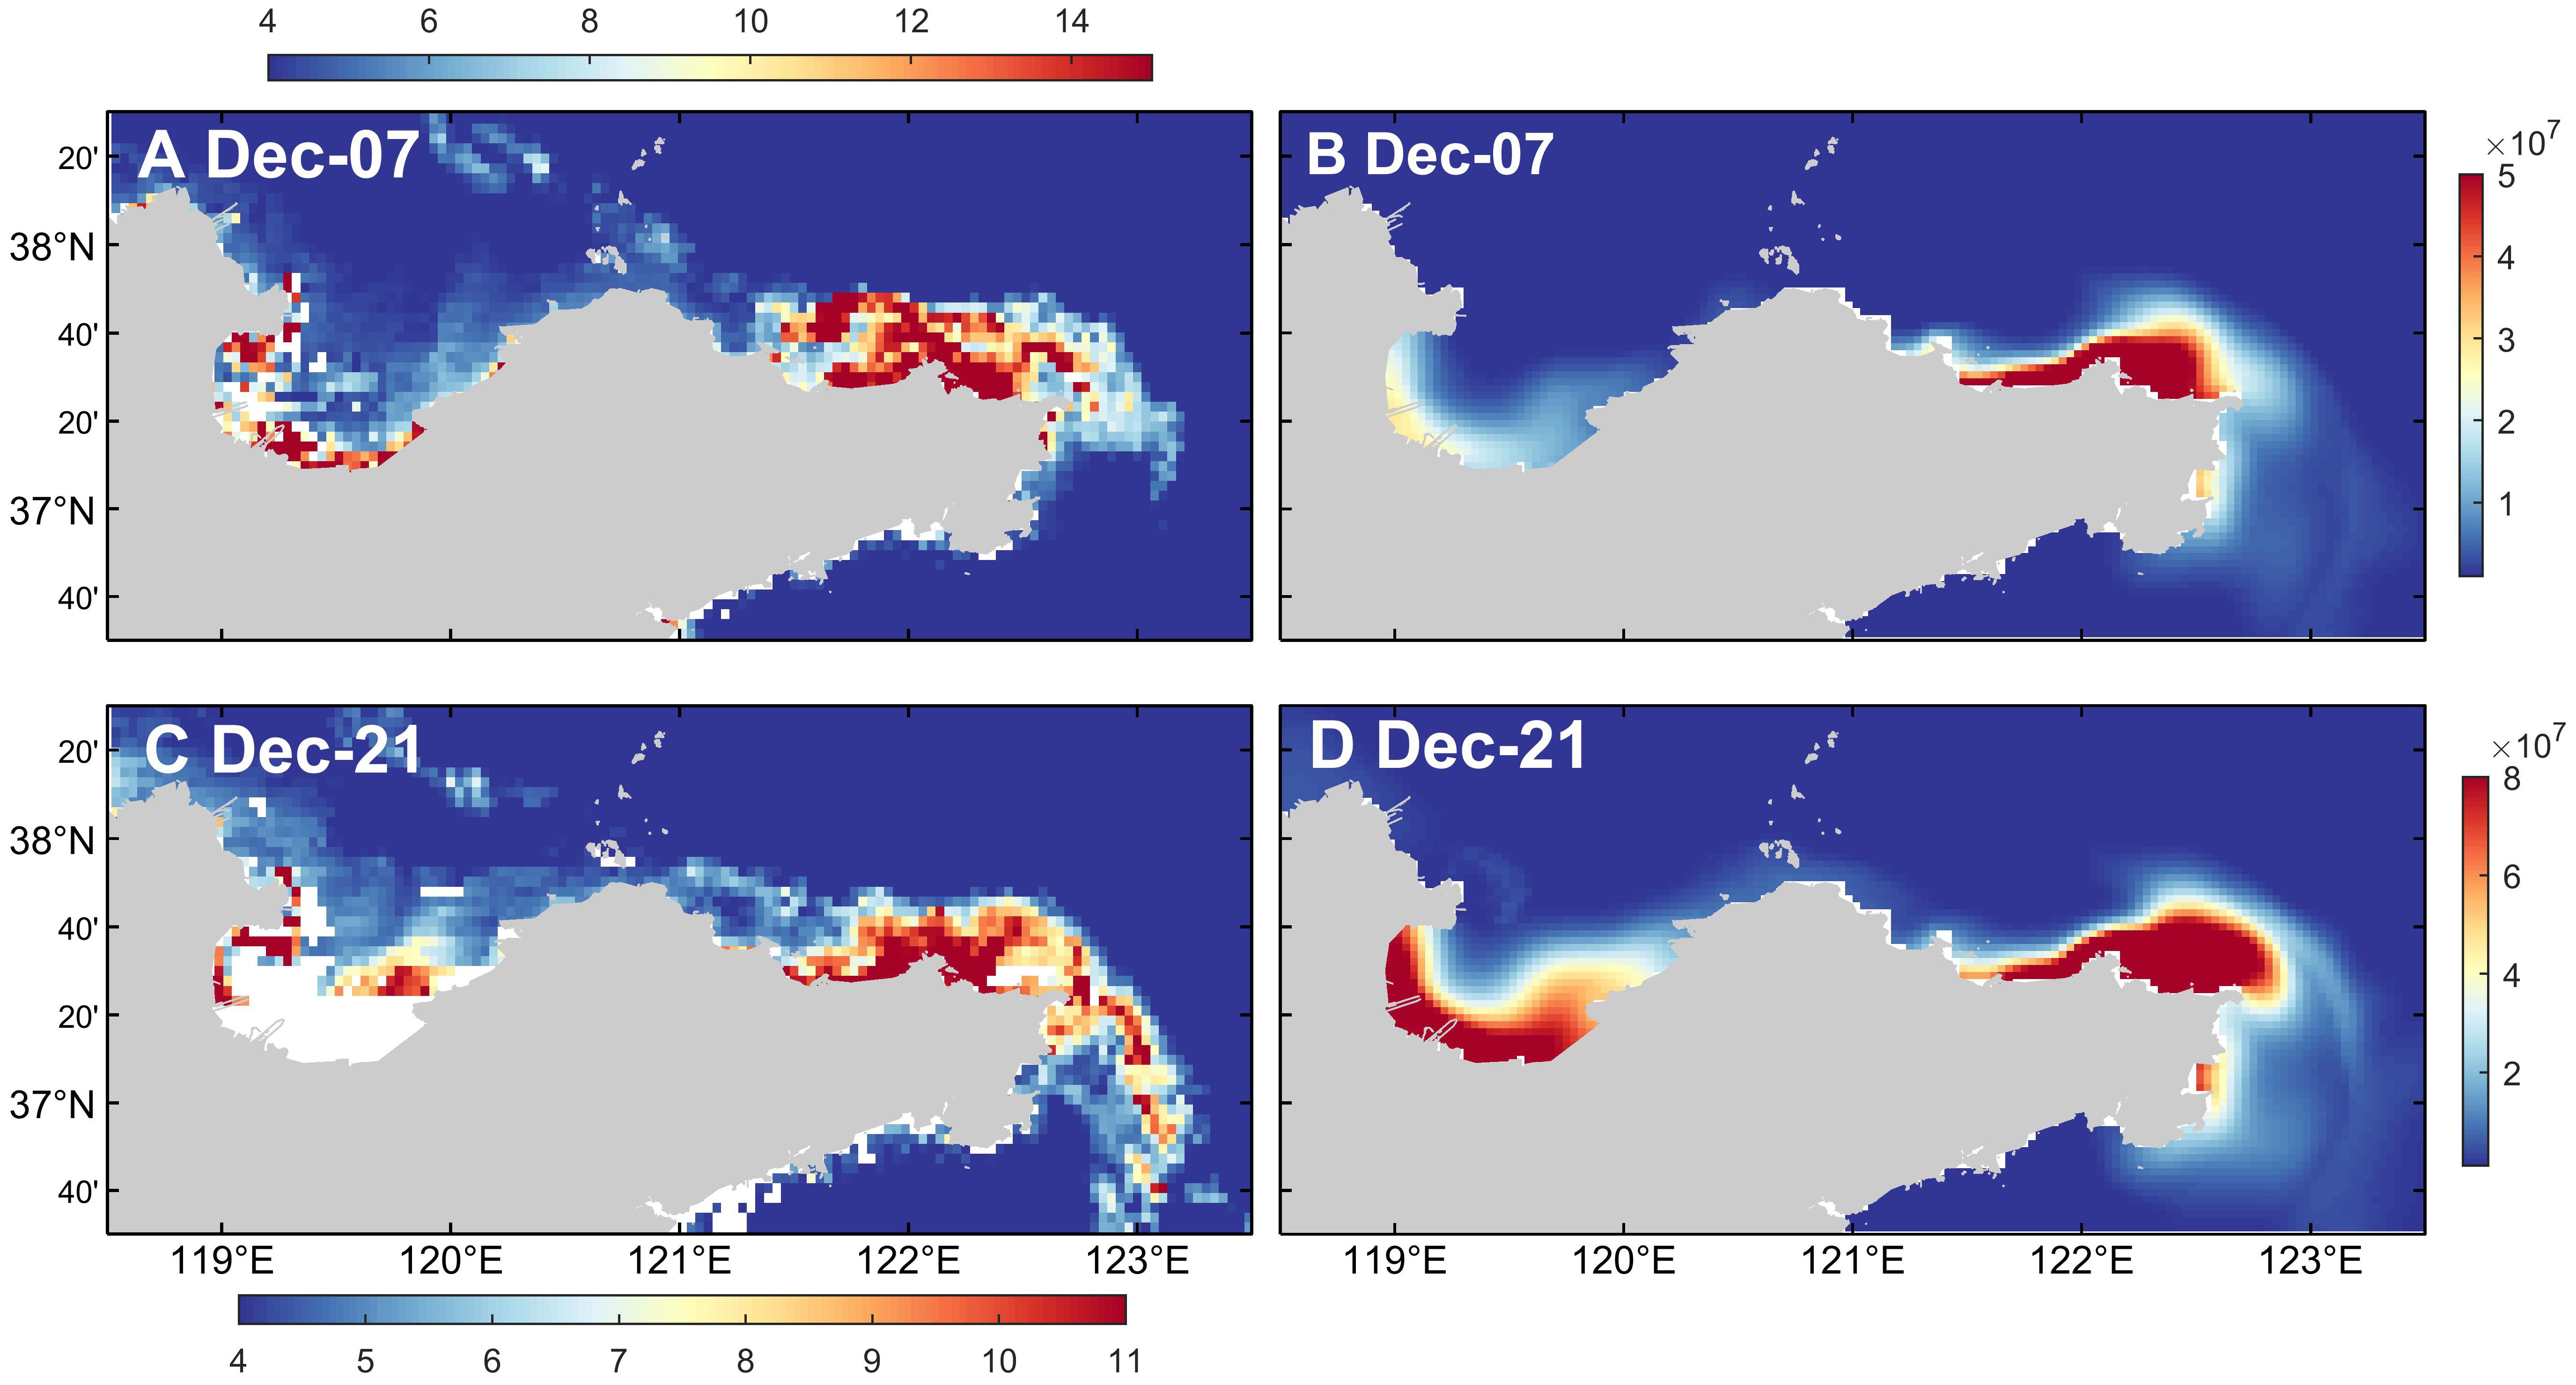
Figure 8. The distribution of (A, C) chlorophyll-a concentrations (mg/m3) and (B, D) surface dinoflagellate cells concentrations (cell/m3) in the northern sea area of Shandong Peninsula in December 2021.
3.3 Distributions of dinoflagellate concentration under different conditions
The factors influencing the growth and distribution of dinoflagellate cells include light conditions, tides, Yellow River runoff, and wind field. These factors all play crucial roles in the growth and reproduction of dinoflagellate cells. By designing experiments under different conditions, the distribution of dinoflagellate concentrations can be analyzed in response to these environmental factors.
The experiment using the improved cyst field simulation in Section 3.2 is regarded as the control run, and the results are compared with the simulation results without tidal forcing to study the effect of tides on the distribution of dinoflagellate cells. According to the results shown in Figure 9, there are significant differences in the distribution characteristics and concentrations of dinoflagellate in Laizhou Bay area in early and late December, while the differences in other areas are relatively small.

Figure 9. (A, B) The surface dinoflagellate cell concentration in the simulation experiment without tides and (C, D) the difference between it and the control run.
According to Figure 2B, compared with the multi-year average Yellow River runoff, the runoff in 2021 increases significantly. Therefore, we studied whether the red tide event in the northern sea area of Shandong Peninsula in December 2021 is related to the increase of freshwater input from the Yellow River. As shown in Figure 10, the overall distribution characteristics of dinoflagellate cells remain unchanged in the experiment using the multi-year average Yellow River runoff compared with the result of the control run, and there is still a tendency to spread around the Shandong Peninsula to the offshore area of Rongcheng in late December. After reducing the input of the Yellow River runoff, the concentration of dinoflagellate cells decreases significantly in Laizhou Bay and increases in the Yantai and Weihai coastal area. The experimental results without Yellow River runoff are similar to those of the multi-year average Yellow River runoff.
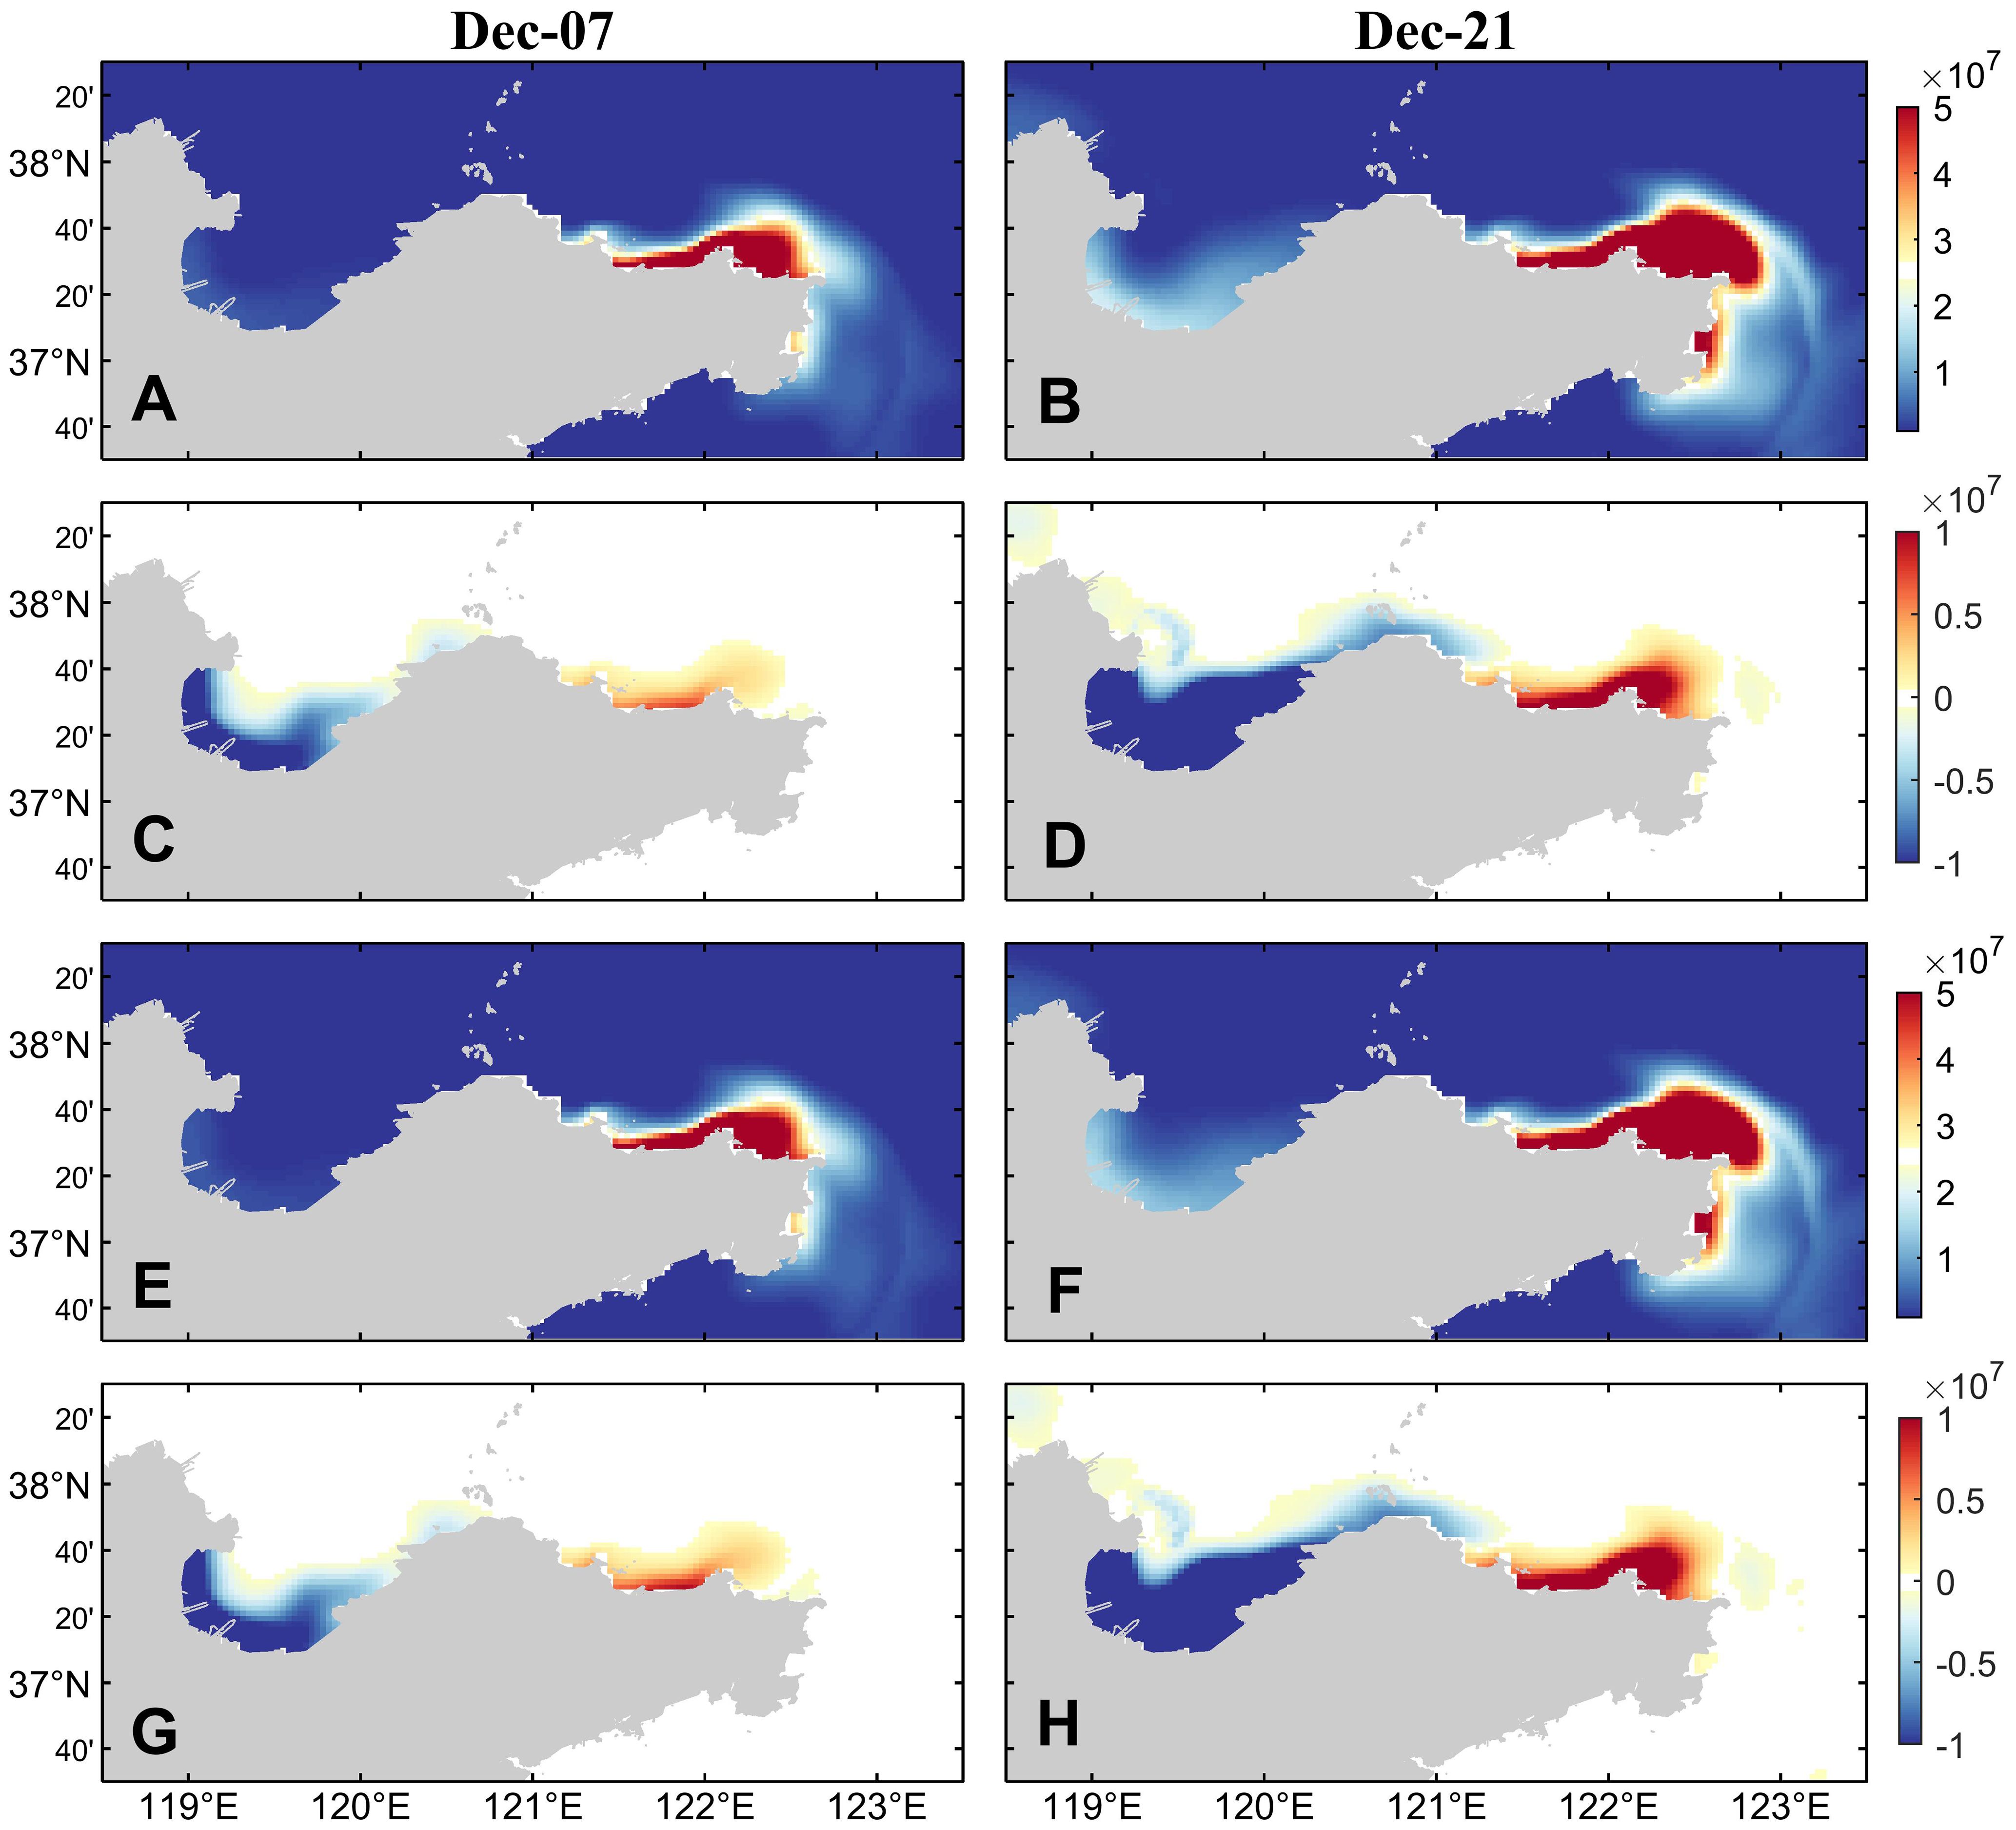
Figure 10. (A, B) The surface dinoflagellate cell concentration in the simulation experiment with multi-year average Yellow River runoff and (C, D) the difference between it and the control run. (E, F) The surface dinoflagellate cell concentration in the simulation experiment without Yellow River runoff and (G, H) the difference between it and the control run.
According to the results shown in Figure 11, neither the climatological wind field nor the simulation experiment without wind stress forcing can simulate red tide in the northern sea area of Shandong Peninsula in December 2021.
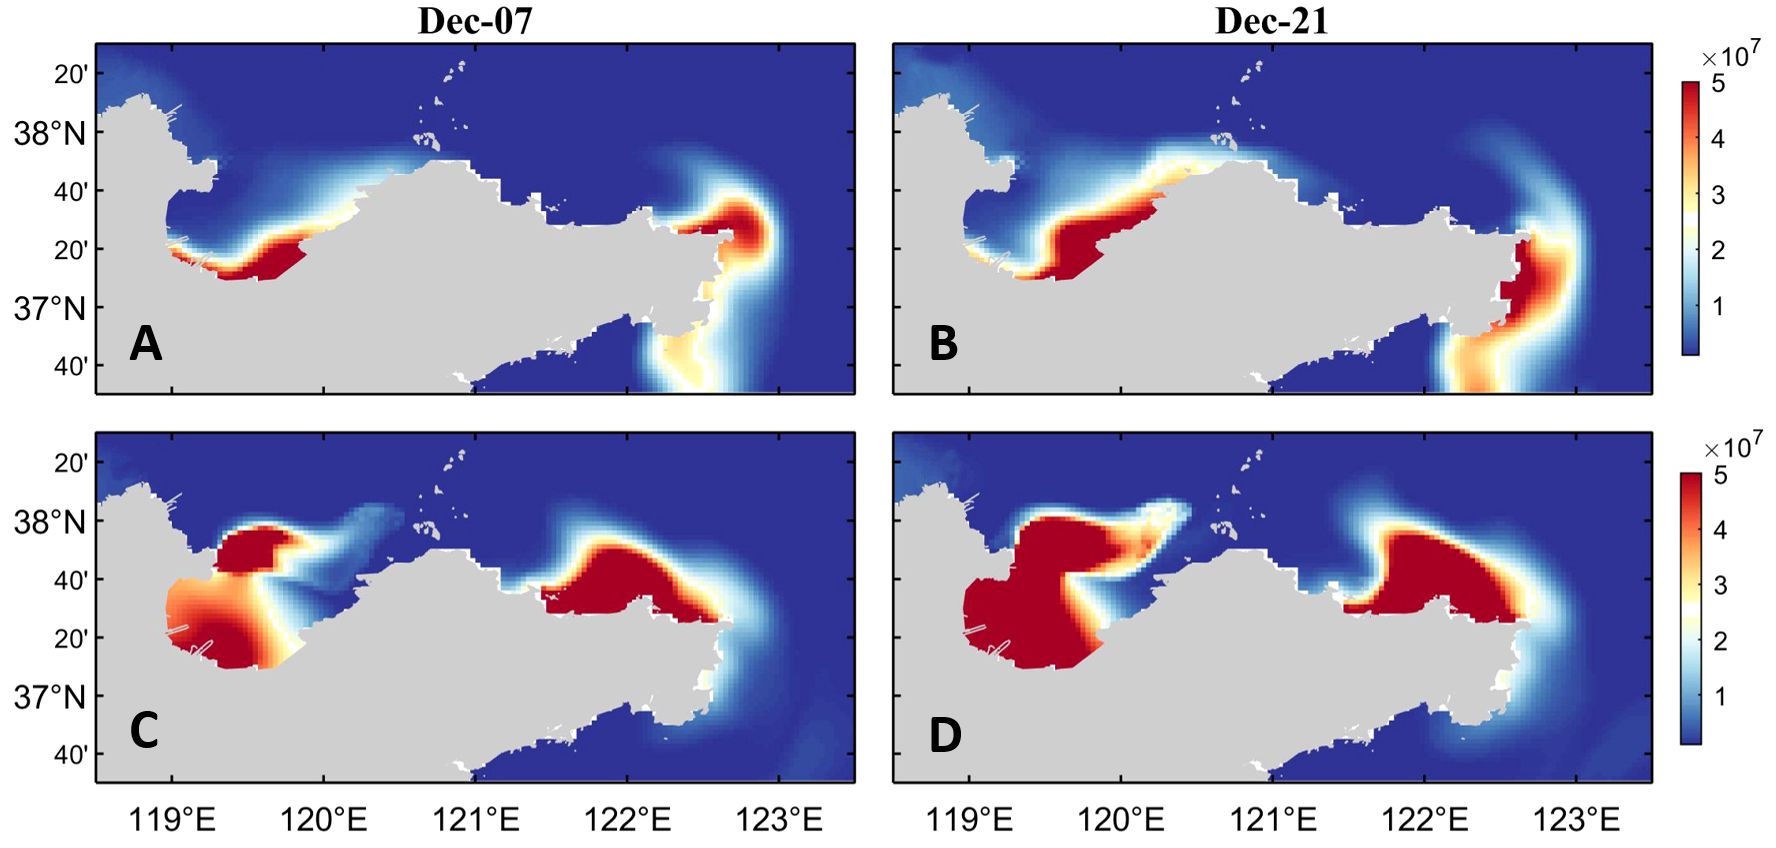
Figure 11. (A, B) The surface dinoflagellate cell concentration in the simulation experiment with climatological wind fields and (C, D) the surface dinoflagellate cell concentration in the simulation experiment without wind stress forcing.
4 Discussion
The evolution pattern of red tide is closely related to the variations of environmental factors. This section discusses the contributions of various influencing factors to the concentration of dinoflagellate cells in the sea area of Shandong Peninsula. The external environmental factors that affect the growth and distribution of dinoflagellate cells, including light conditions, tides, Yellow River runoff and wind field, all of which play important roles in the growth and reproduction of dinoflagellate cells and affect their distribution. The study of these influencing factors can help us better understand and predict the distribution patterns of dinoflagellate cells.
4.1 Light conditions
Light is one of the key factors for the photosynthesis of dinoflagellates. Adequate light can promote the growth and reproduction of dinoflagellates, so the light intensity will directly affect the distribution of dinoflagellate cells.
The concentration of total suspended matter (TSM) is an important indicator for water quality monitoring in coastal areas, and its distribution directly affects the transparency of seawater. The TSM concentration data used in this study are obtained from the European GlobColour Project (Maritorena et al., 2010). The concentration values are derived using a weighted average method from observations made by two satellites, OLCI-A and OLCI-B. The data possess a temporal resolution of 8 days and a spatial resolution of 4 km. Figure 12 shows the variations of TSM concentration in Ailian Bay (37.2°N, 122.6°E) in the offshore area of Rongcheng in December from 2019 to 2022. It can be seen that the TSM concentration in the offshore area of Rongcheng is mainly ranges from 10 to 70 g/m3 in December, and the monthly mean TSM concentrations from 2019 to 2022 are 52, 34, 21, and 44 g/m3, respectively. The variations of TSM concentration in most years show the increasing trend, while the concentration in 2021 shows a decreasing trend. Based on the MODIS data of Photosynthetically Available Radiation (PAR), the photosynthetically available radiation values in December from 2019 to 2022 in this region were calculated as 15, 15, 17, and 16 W/m2, respectively, with the PAR intensity in 2021 being higher than other years. Additionally, the Euphotic Zone Depth (Zeu) values in this region from 2019 to 2022 were estimated using the method proposed by Lyu et al. (2022) based on the Remote sensing reflectance (Rrs). The calculation formula is as follows:
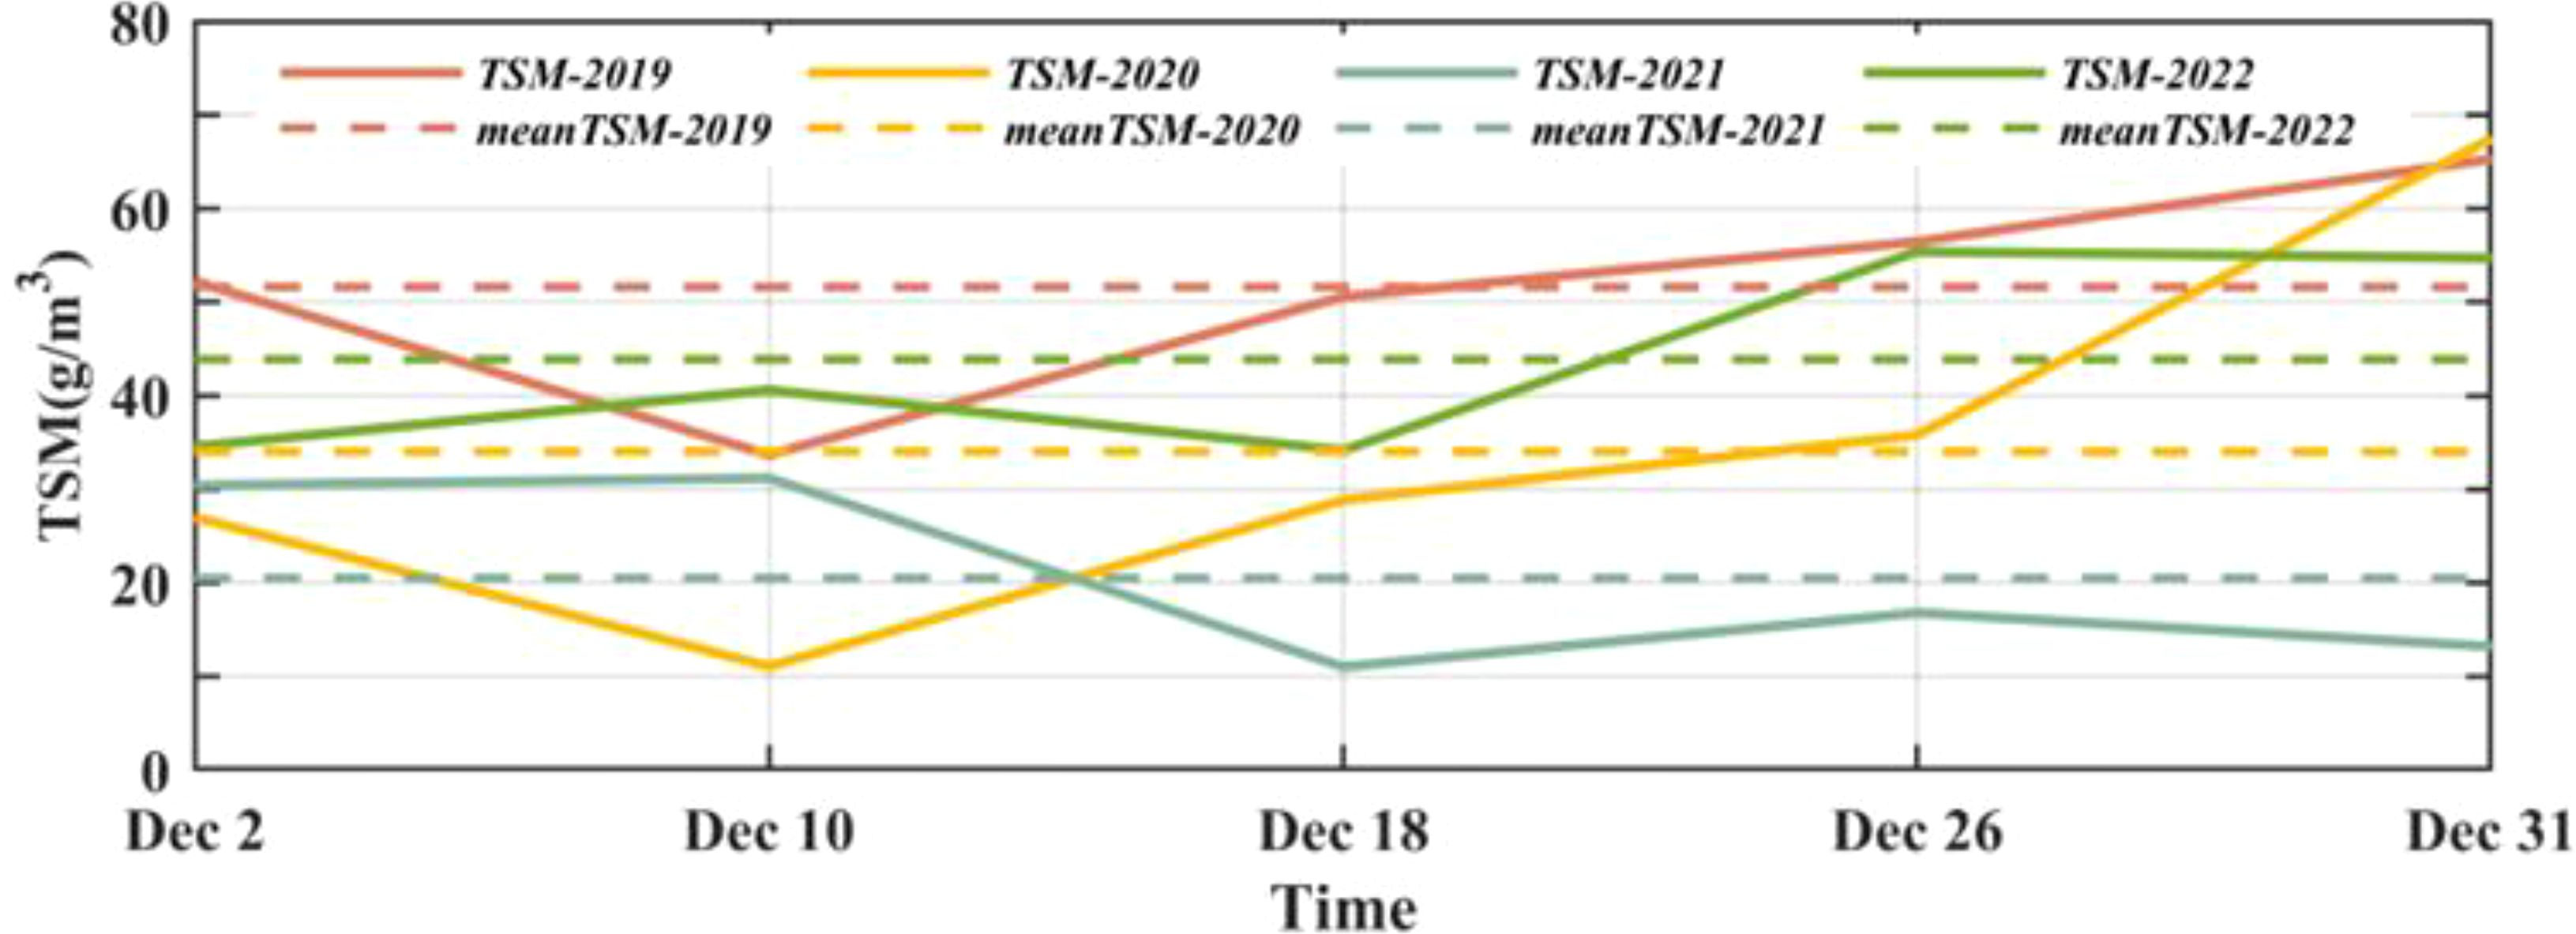
Figure 12. Variations in Total Suspended Matter (TSM) concentrations from December 2019 to December 2022 in Ailian Bay.
where . The Rrs data and PAR data used in this section from the Level 3 product of the MODIS sensor on the Aqua satellite, with a spatial resolution of 4 km. After calculation, the euphotic zone depths in Ailian Bay in December from 2019 to 2022 were 2.3, 2.6, 3.0, and 1.4 m, respectively. The euphotic zone depth in 2021 was significantly higher than in other years.
The previous study showed that the dominant red tide algae (dinoflagellates), which occurred in the northern sea area of Shandong Peninsula in December 2021, exhibited strong phototaxis by indoor pure culture experiments. Therefore, compared with other years, the TSM concentration in December 2021 decreases significantly, resulting in high seawater transparency and increases the light intensity, which prompts the massive reproduction of surface dinoflagellate cells and triggers red tide.
4.2 Tidal forcing
The seawater movement induced by tides can affect the transport and distribution of dinoflagellate in the seawater, thus influencing the formation and development of red tide. As shown in Figure 9, according to the analysis of surface tidal currents in the Yellow River Estuary and Laizhou Bay by Wang H. et al. (2022), the high-velocity areas in this region are mainly concentrated in the Yellow River Estuary and the northern part of Laizhou Bay. Therefore, when no tidal forcing is applied, the eastern flow of dinoflagellate cells in the water along the northern sea area of Shandong Peninsula is weakened, and the number of dinoflagellate cells reaching the northeastern sea area of Shandong Peninsula decreases, while more dinoflagellate cells gradually accumulate in Laizhou Bay. In addition, tides can also affect the vertical mixing and stratification structure of seawater. When there is no tidal effect, the water exchange is slow, and the seawater in the Laizhou Bay area is in a weakly stratified state, which is favorable to the formation of dinoflagellate cells and leads to the massive accumulation and reproduction of them in the bay (Wen et al., 2023).
Tides are one of the important hydrodynamic driving factors in the ocean. They can transport nutrients, organic matters, and other substances to different sea areas through the movement of tidal currents, providing nutrients for the growth of dinoflagellate cells. Tides may also affect the distribution characteristics of nutrients input from the Yellow River and the ocean by changing the transport of nutrients, which in turn influences the growth of dinoflagellate cells. However, the bloom of dinoflagellate still exists in the offshore waters of Rongcheng without tidal forcing, indicating that tides are not the cause of this red tide event.
4.3 Yellow River runoff
The Yellow River runoff can affect the flow field, temperature and salinity distribution, suspended matter content, and other factors at the estuary, and further influence the distribution of dinoflagellate cells. As shown in Figure 10, the reduction of the Yellow River runoff has an impact on the freshwater input to Laizhou Bay. As one of the important water sources in Laizhou Bay, the decrease of the Yellow River runoff directly affects the freshwater supply within the bay, leading to changes in salinity and affecting the growth environment of dinoflagellate. Dinoflagellate cells have a certain adaptability range for salinity, and their growth and reproduction may be inhibited when the salinity exceeds this range.
The impact of the Yellow River runoff on the growth of dinoflagellate cells is complex, which may either promote or have a negative impact on the growth of dinoflagellate cells. The degree of impact depends on the combined effect of multiple factors. However, the existence of dinoflagellate bloom in the offshore waters of Rongcheng under different conditions of Yellow River runoff, indicating that the Yellow River runoff is also not the cause of this red tide event.
4.4 Wind field
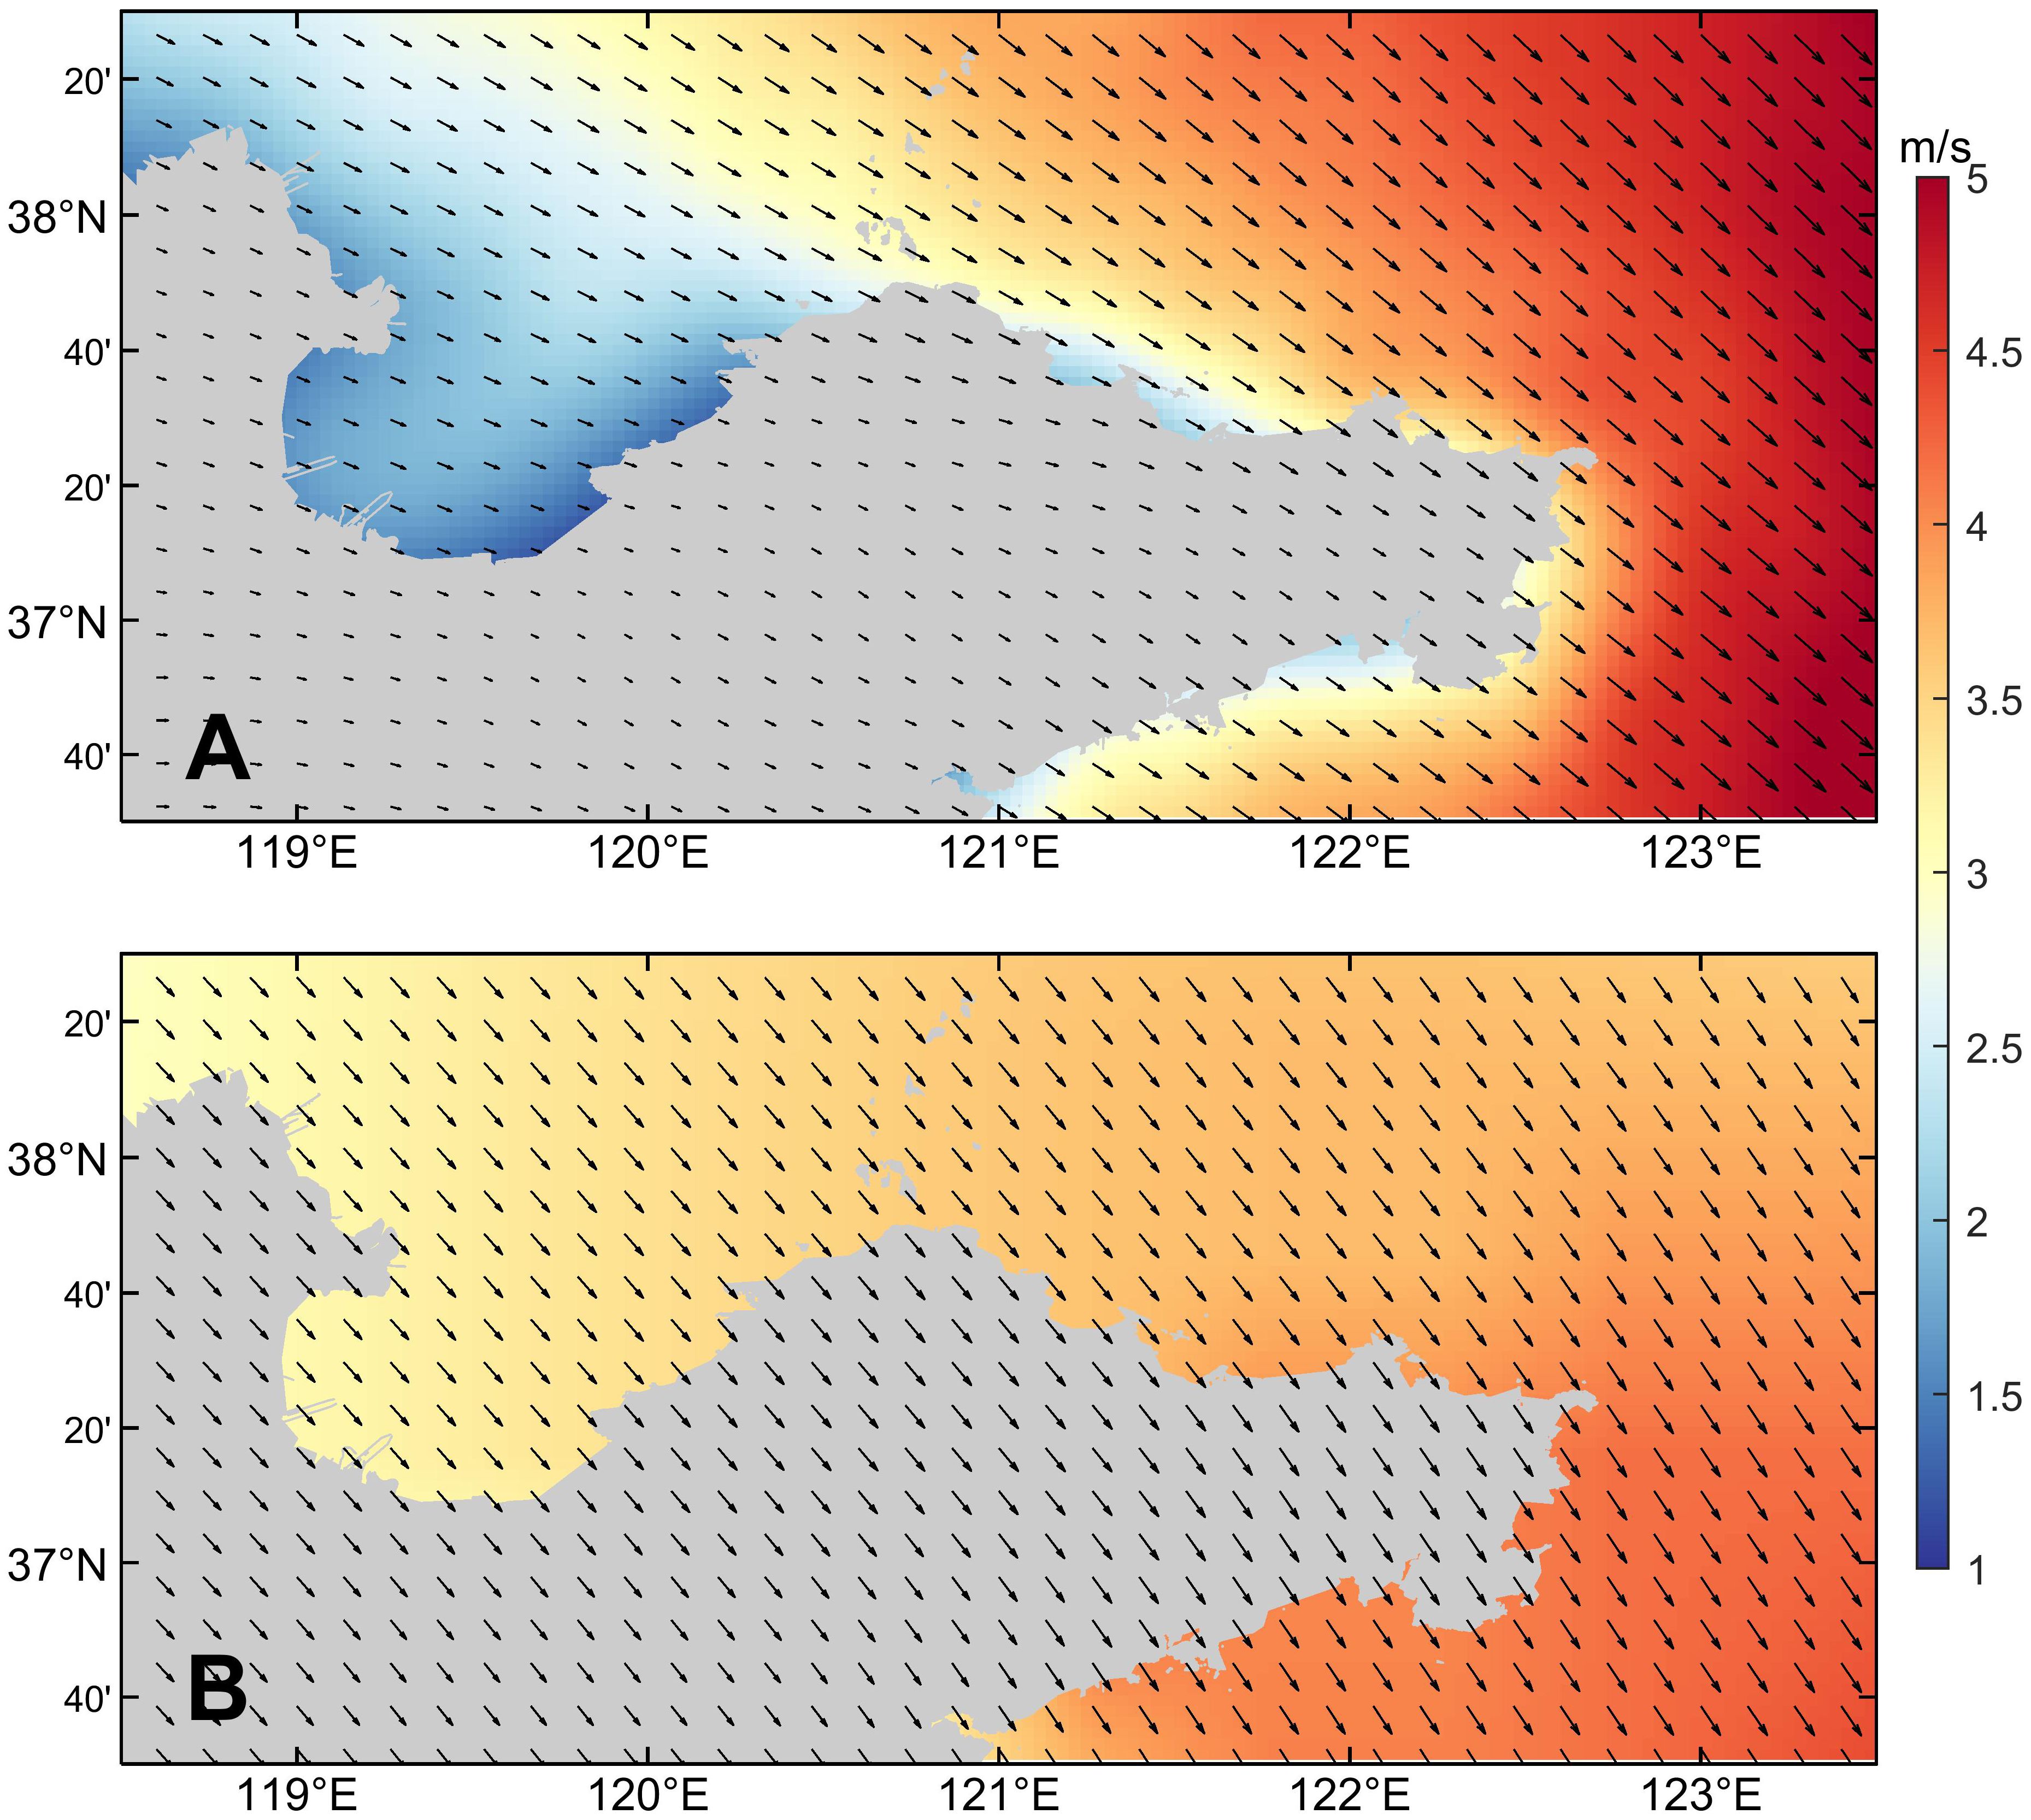
The wind field mainly drives the sea surface currents, such as coastal currents and offshore currents, causing the drift and diffusion of dinoflagellate cells in the water, thereby changing their distribution characteristics. According to the results shown in Figure 11, neither the climatological wind field nor the simulation experiment without wind stress forcing can simulate red tide in the northern sea area of Shandong Peninsula in December 2021. This indicates that wind field condition is one of the important environmental factors for the occurrence of this red tide event. According to the results shown in Figures 13 and 14, there are significant differences in the current field distribution under different wind conditions. The sea surface current field is mainly controlled by the wind field. In winter, under the control of the northerly wind, the current mainly flows southeastward along the coastline of Shandong Peninsula. When there is no wind stress, there is only the flow of the Yellow River into the sea. The nutrients input by the Yellow River runoff will promote the germination of a large number of dinoflagellate cells in the Yellow River Estuary and nearby sea areas. However, due to the limitation of the flow region, the dinoflagellate cells cannot flow with the water to the eastern area of Shandong Peninsula, and mainly accumulate in Laizhou Bay and the northern sea area of Yantai and Weihai. Compared to the current field results under actual wind condition, the surface current field distribution under climatological wind condition is more uniform, the concentration of dinoflagellate cells that should have been gathered in the northern sea area of Yantai and Weihai and triggered the red tide is significantly reduced, while the high concentration area of dinoflagellate cells moves southward. In addition, the high-value area of dinoflagellate cells in Laizhou Bay also shows a trend of moving eastward. It is speculated that the reason for this phenomenon may be that the variation of wind field causes the change of current field, further altering the intensity and direction of ocean currents, which leads to changes in the distribution of dinoflagellate cells.
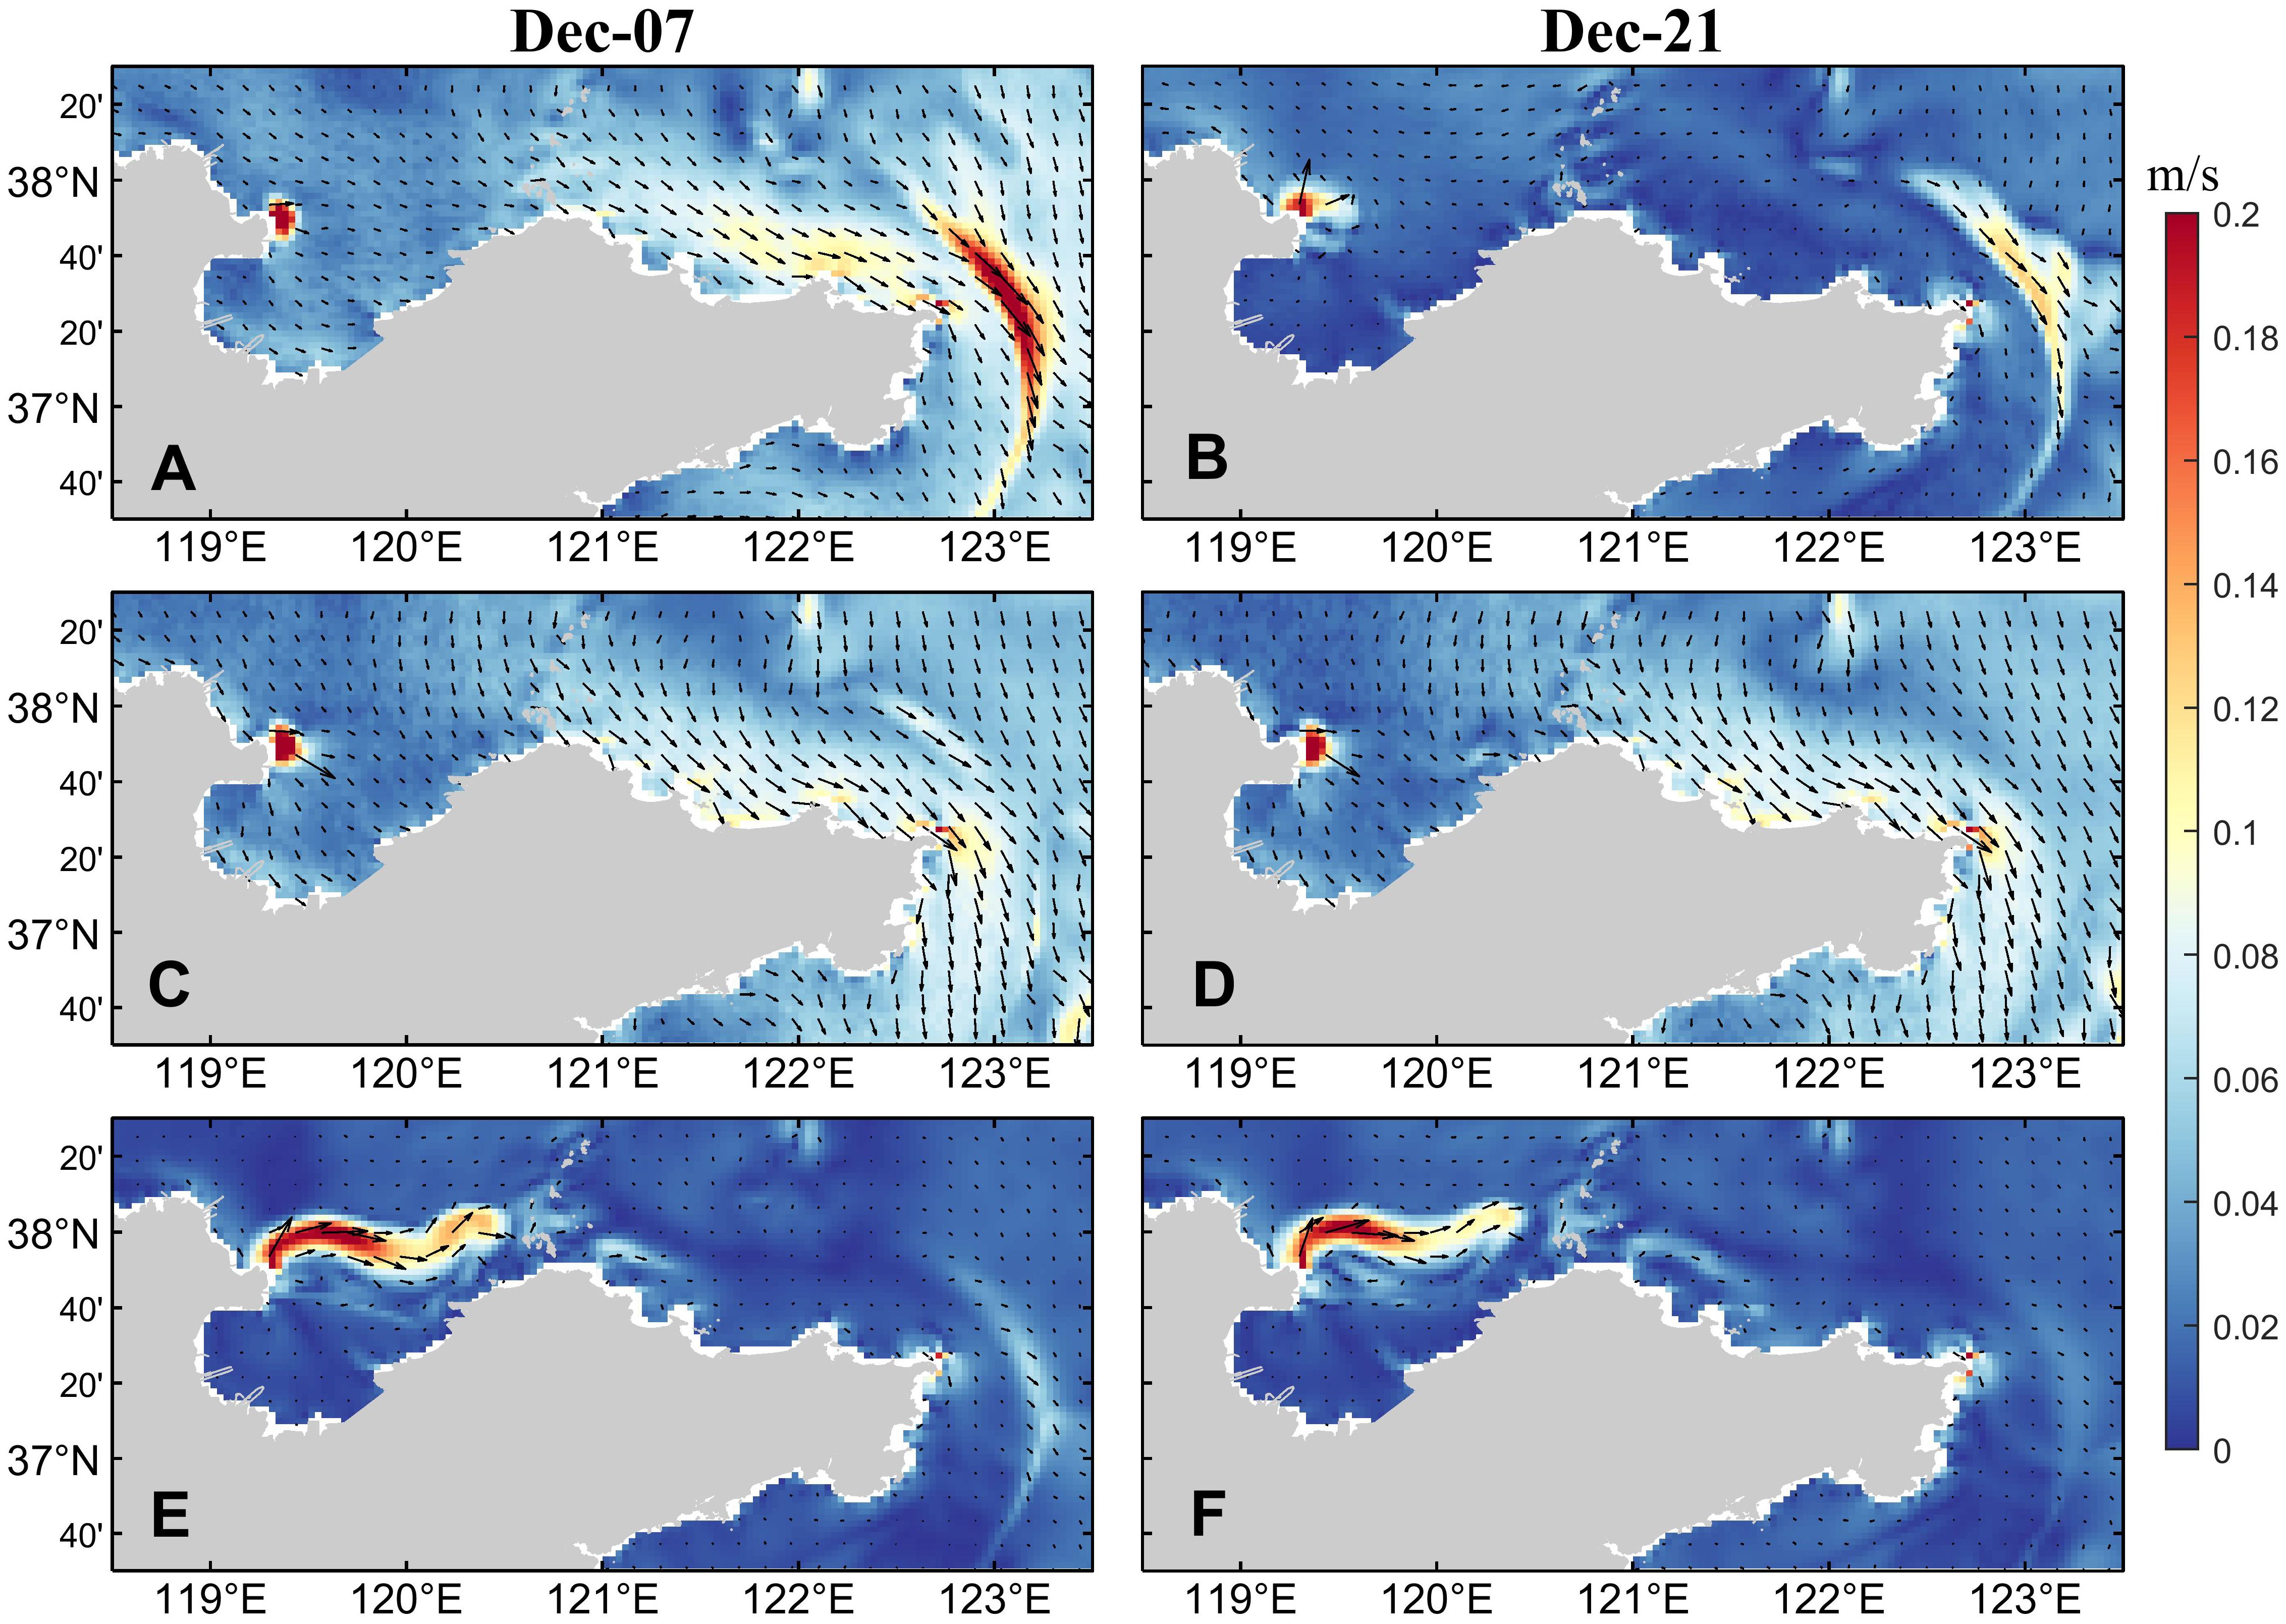
Figure 14. Sea surface current fields in (A, B) the control run, (C, D) the simulation experiment with the climatological wind field, and (E, F) the simulation experiment without wind stress forcing.
The influence of wind field on the concentration and distribution of dinoflagellate cells is multifaceted, involving many aspects such as mixing effect and nutrient distribution. Wind-induced waves and turbulence can enhance the vertical mixing of seawater, causing the water exchange at different layers. This mixing effect can change the vertical distribution of nutrients, thereby affecting the acquisition of nutrients by dinoflagellate cells. In addition, the mixing effect can also affect environmental factors such as the water temperature and salinity, which also have an important impact on the growth and reproduction of dinoflagellate cells. Under the effect of wind stress, nutrient-rich coastal waters may be transported to offshore areas or cause the accumulation of nutrients in specific areas. These changes can affect the utilization of nutrients by dinoflagellate cells, thereby affecting their growth rate and abundance.
In summary, the wind field is the main cause of this red tide event, which affects the concentration and distribution of dinoflagellate cells through several aspects. These influencing factors interact and restrict each other, jointly determining the dynamic changes of dinoflagellate cells in the marine environment. Therefore, the role of the wind field needs to be fully considered in the study of dinoflagellate cells.
5 Conclusions
The purpose of this study is to reproduce the timing and magnitude of the red tide event near the Shandong Peninsula and to find the key factors that affect the development of red tide, and to focus on analyzing the key causes of the red tide event in the northern sea area of Shandong Peninsula in 2021. The aggregation of dinoflagellate cells can trigger the red tide events, and the distribution characteristics and concentration variations of dinoflagellate cells are studied to reflect the contributions of various influencing factors to red tide by designing simulation experiments under different conditions.
The distribution of dinoflagellate cells concentration is influenced by multiple factors such as light conditions, tides, Yellow River runoff and wind field conditions. The interaction of these factors determines the growth, reproduction and aggregation patterns of dinoflagellate cells. Studies have shown that the key factor contributing to the red tide in the northern sea area of the Shandong Peninsula in 2021 is the wind field. Variations in the wind field served as the direct driving force behind this red tide event. By affecting ocean currents, mixing, and the distribution of algae, the wind field ultimately led to the occurrence of this red tide. Therefore, wind field is indispensable condition in the process of red tide occurrence.
In summary, the occurrence of red tide is a complex ecological phenomenon affected by multiple factors. It is necessary to comprehensively consider these factors to better predict and prevent the occurrence of red tide events in the future.
Data availability statement
The original contributions presented in the study are included in the article/supplementary material. Further inquiries can be directed to the corresponding author.
Author contributions
WJ: Writing – original draft, Writing – review & editing. CL: Investigation, Writing – review & editing. DY: Writing – review & editing. LX: Writing – review & editing. BY: Writing – review & editing.
Funding
The author(s) declare financial support was received for the research, authorship, and/ or publication of this article. This study was supported by Laoshan Laboratory Science and Technology Innovation Project (No.LSKJ202203700) and the Key Research Infrastructures in the Field Stations of Chinese Academy of Sciences (KFJ-SW-YW047) and Laoshan Laboratory Science and Technology Innovation Project (No. LSKJ2022020103 and LSKJ202202902). It was also supported by Yellow Sea ocean & East China Sea ocean observation and research station of OMORN.
Conflict of interest
The authors declare the research was conducted in the absence of any commercial or financial relationships that could be construed as a potential conflict of interest.
Publisher’s note
All claims expressed in this article are solely those of the authors and do not necessarily represent those of their affiliated organizations, or those of the publisher, the editors and the reviewers. Any product that may be evaluated in this article, or claim that may be made by its manufacturer, is not guaranteed or endorsed by the publisher.
References
Anderson D. M. (1998). Bloom dynamics of toxic Alexandrium species in northwestern U.S. Limnol. Oceanogr. 42, 1009–1022. doi: 10.4319/lo.1997.42.5_part_2.1009
Anderson D. M., Chisholm S. W., Watras C. J. (1983). The importance of life cycle events in the population dynamics of Gonyaulax tamarensis. Mar. Biol. 76, 179–189. doi: 10.1007/BF00392734
Bauerfeind E., Elbrachter M., Steiner R., Throndsen J. (1986). Application of Laser Doppler Spectroscopy (LDS) in determining swimming velocities in motile phytoplankton. Mar. Biol. 93, 323–327. doi: 10.1007/BF00401099
Diaz H., Folland C., Manabe P., Reynolds D., Woodruff S. (2002). Workshop on advances in the use of historical marine climate data. Bull. World Meteorological Organ. 51, 377–380.
Egbert G., Erofeeva S. (2002). Efficient Inverse Modeling of Barotropic Ocean Tides. J. Atmos. Ocean. Technol. 19 (2), 183–204.
Fang C., Song K., Shang Y., Ma J., Wen Z., Du J. (2018). Remote sensing of harmful algal blooms variability for Lake Hulun using adjusted FAI (AFAI) algorithm. J. Environ. Inf. 34, 108–122. doi: 10.3808/jei.201700385
He R., McGillicuddy D. J., Keafer B. A., Anderson D. M. (2008). Historic 2005 toxic bloom of Alexandrium fundyence in the western Gulf of Maine: 2, Coupled biophysical modeling. J. Geophysical Res. 113, C07040. doi: 10.1029/2007JC004602
Hersbach H., Bell B., Berrisford P., Biavati G., Horányi A., Muñoz Sabater J., et al. (2023). ERA5 hourly data on single levels from 1940 to present (Copernicus Climate Change Service (C3S) Climate Data Store (CDS)). doi: 10.24381/cds.adbb2d47
Kamykowski D., Reed R. E., Kirkpatrick G. J. (1992). Comparison of the sinking velocity, swimming velocity, rotation and path characteristics among six marine dinoflagellate species. Mar. Biol. 113, 319–328. doi: 10.1007/BF00347287
Kremp A. (2000). Distribution, dynamics and in situ seeding potential of Scrippsiella hangoei (Dinophyceae) cyst populations from the Baltic Sea. J. Plankton Res. 11), 2155–2169. doi: 10.1093/plankt/22.11.2155
Le K., Mao H. (1990). Wintertime structures of temperature and salinity of the southern Huanghai (Yellow) Sea and its current systems. Oceanologia Limnologia Sin. 21, 505–515.
Li X., Su L., Li X., Li J., Xu Y. (2023). Comprehensive analysis of large-scale saccharina japonica damage in the principal farming area of Rongcheng in Shandong province from 2021 to 2022. J. Agric. Sci. Technol. 25, 206–222. doi: 10.13304/j.nykjdb.2022.0728
Liu D., Shi Y., Di B., Sun Q., Wang Y., Dong Z., et al. (2012). The impact of different pollution sources on modern dinoflagellate cysts in Sishili Bay, Yellow Sea, China. Mar. Micropaleontol. 84, 1–13. doi: 10.1016/j.marmicro.2011.11.001
Lyu J., Wang S., Sun D., Nie J., Jiao H., Zhang H., et al. (2022). Remote sensing of spatial and temporal variations of euphotic zone depth in the Bohai Sea and Yellow Sea during recent 20 years, (2002-2020). Natl. Remote Sens. Bull. 26, 2507–2517. doi: 10.11834/jrs.20210414
Maritorena S., d’Andon O. H. F., Mangin A., Siegel D. A. (2010). Merged satellite ocean color data products using a bio-optical model: Characteristics, benefits and issues. Remote Sens. Environ. 114, 1791–1804. doi: 10.1016/j.rse.2010.04.002
Parkinson C. L. (2003). Aqua: An Earth-observing satellite mission to examine water and other climate variables. IEEE Trans. Geosci. Remote Sens. 41, 173–183. doi: 10.1109/TGRS.2002.808319
Shchepetkin A. F., McWilliams J. C. (2005). The Regional Ocean Modeling System: A split-explicit, free-surface, topography following coordinates oceanic model. Ocean Model. 9, 347–404. doi: 10.1016/j.ocemod.2004.08.002
Song X., Fu P., Jiang X., Liu L., Liu A., Cheng L., et al. (2021). Characteristics and trends of typical ecological disasters in coastal waters of Shandong Province. Ocean Dev. Manage. 38, 31–36. doi: 10.20016/j.cnki.hykfygl.2021.06.005
Song Y., Haidvogel D. B. (1994). A semi-implicit ocean circulation model using a generalized topography-following coordinate system. J. Comput. Phys. 115, 228–244. doi: 10.1006/jcph.1994.1189
Song X., Yuan Z., Sun Y., Shi Y., Jin Y., Bai Y., et al. (2011). The causes and bloom process of a red tide species- Chattonella marina in the coastal area of Rushan, Shandong Province. Oceanologia Limnologia Sin. 42, 425–430.
Stock C. A., McGillicudy D. J., Solow A. R., Anderson D. M. (2005). Evaluating hypotheses for the initiation and development of Alexandrium fundyense blooms in the western Gulf of Maine using a couple physical-biological model. Deep-Sea Res. II 52, 2715–2744. doi: 10.1016/j.dsr2.2005.06.022
Wang H., Qin H., Qiao S., Li F., Shi H., Zhang X. (2022). Effect of the yellow river runoff into the sea on the salinity of the waters near the estuary. Coast. Eng. 41, 115–127.
Wang Y., Zhang H., Wu N., Zhang G., Liu S. (2022). Monthly variation of nutrient concentration in the lower reaches of the yellow river and its response to the flood discharge event of the reservoir. Periodical Ocean Univ. China 52, 88–98. doi: 10.16441/j.cnki.hdxb.20210108
Wen G., Wang R., Wen C., Bai Y., Cao R., Si F., et al. (2023). A review on the formation mechanism and in-situ control of freshwater dinoflagellate bloom. China Environ. Sci. 43, 2239–2253. doi: 10.19674/j.cnki.issn1000-6923.20230131.006
Wu Y., Zhou C., Zhang Y., Pu X., Li W. (2001). Evolution and causes of formation of Gymnodinium Sanguineum bloom in Yantai Sishili Bay. Oceanologia Limnologia Sin. 32, 159–167.
Xu N., Lu S., Duan S., Li A., Liu Z. (2004). The influence of nutrients input on the red tide occurrence. Mar. Environ. Sci. 23, 20–24.
Yang D. Z., Yin B. S., Liu Z. L., Feng X. R. (2011). Numerical study of the ocean circulation on the East China Sea shelf and a Kuroshio bottom branch northeast of Taiwan in summer. J. Geophysical Res.: Oceans 116, C05015. doi: 10.1029/2010JC006777
Keywords: Yellow and Bohai Sea, red tide, coupled physical-biological model, dinoflagellate, harmful algal bloom
Citation: Jiang W, Liu C, Yang D, Xu L and Yin B (2024) Causes analysis of red tide event in the offshore sea of Rongcheng, Shandong Province, China based on a coupled physical-biological model. Front. Mar. Sci. 11:1417667. doi: 10.3389/fmars.2024.1417667
Received: 15 April 2024; Accepted: 30 July 2024;
Published: 22 August 2024.
Edited by:
Wen-Zhou Zhang, Xiamen University, ChinaReviewed by:
Pengfei Lin, Institute of Atmospheric Physics, Chinese Academy of Sciences (CAS), ChinaYang Feng, South China Sea Institute of Oceanology, Chinese Academy of Sciences (CAS), China
Copyright © 2024 Jiang, Liu, Yang, Xu and Yin. This is an open-access article distributed under the terms of the Creative Commons Attribution License (CC BY). The use, distribution or reproduction in other forums is permitted, provided the original author(s) and the copyright owner(s) are credited and that the original publication in this journal is cited, in accordance with accepted academic practice. No use, distribution or reproduction is permitted which does not comply with these terms.
*Correspondence: Dezhou Yang, eWFuZ2RlemhvdUBxZGlvLmFjLmNu
 Wenxin Jiang
 Changhua Liu6
 Dezhou Yang
 Lingjing Xu
 Baoshu Yin