 Shannon N. Coates1*
 David A. Sweeney1
 Erin A. Falcone1
 Stephanie L. Watwood2
 Brenda K. Rone1
 Stacy L. DeRuiter3Jay Barlow4
 Karin A. Dolan2Ronald P. Morrissey2Nancy A. DiMarzio2
 Susan M. Jarvis2
 Russel D. Andrews1
 Gregory S. Schorr1
- 1Foundation for Marine Ecology and Telemetry Research, Seabeck, WA, United States
- 2Ranges, Engineering and Analysis Department, Naval Undersea Warfare Center, Newport, RI, United States
- 3Department of Mathematics and Statistics, Calvin University, Grand Rapids, MI, United States
- 4Marine Mammal Institute, Oregon State University, Newport, OR, United States
Goose-beaked whales (Ziphius cavirostris) are deep-diving cetaceans known for their elusive nature and specialized foraging behavior. In 2019 and 2020, six telemetry tags were deployed on these whales in Southern California, resulting in 395 h of acoustic and diving data. Foraging dives were manually identified by the presence of echolocation pulses and buzzes, and generalized additive models assessed factors influencing foraging behavior. The median bathymetric depth at foraging sites was 1,419 m (IQR = 359), and the maximum dive depth was highly correlated with bathymetry depth. Individuals started echolocating on descent at a median depth of 410 m (IQR = 74); pulses were not observed shallower than 292 m. Echolocation ceased during the bottom phase for 81.6% of dives, at a median depth of 1,265 m (IQR = 472); pulses were not observed shallower than 587 m on ascent. The median depth of buzzes was 1,215 m (IQR = 479) with 63% occurring during the bottom phase. Deeper dives correlated with longer durations of diving and echolocation, greater echolocation end depths, and wider bottom phase echolocation depth inter-quartile range. The median difference between dive depth and bottom phase median echolocation depth was 98.3 m (IQR = 48.5), suggesting whales in this region forage in a narrow band close to the seafloor. In the San Nicolas Basin, individuals exhibited longer echolocation durations, produced more pulses, and started and ended echolocating at greater depths compared to adjacent regions. These records validate and expand upon previous studies, providing insights into factors influencing foraging behavior in an area with high anthropogenic disturbance.
1 Introduction
Beaked whales (family Ziphiidae) are poorly understood relative to many other cetaceans. Their cryptic behaviors (Johnson et al., 2004; Tyack et al., 2006; Baird et al., 2008; Schorr et al., 2014) and preferential use of deep water habitat (Waring et al., 2001) have historically limited the study of these species. In the early 21st century, growing recognition of beaked whale vulnerability to anthropogenic sounds, in particular the powerful sonar systems used by the military (Cox et al., 2005; Filadelfo et al., 2009), sparked growing conservation concerns. A notable instance was a mass stranding of beaked whales in the Bahamas, attributed to naval sonar (Balcomb and Claridge, 2001). As a result, research efforts for some species were prioritized in an effort to better understand the impacts human activities might be having on them (Simmonds and Lopez-Jurado, 1991; Fernández et al., 2005; Filadelfo et al., 2009; DeRuiter et al., 2013; Falcone et al., 2017). One of these efforts, a long-term study of goose-beaked whales (Ziphius cavirostris, most commonly referred to as Cuvier’s beaked whale prior to a suggested permanent name change (Rogers et al., 2024) and hereafter referred to as “Z. cavirostris”) in the Southern California Bight, found that Z. cavirostris are present year-round within the San Nicolas Basin (Falcone et al., 2009; Schorr et al., 2014; Curtis et al., 2020). This deep basin, which lies west of San Clemente Island, includes the United States Navy’s Southern California Anti-submarine Warfare Range (SOAR). SOAR is used heavily for training with military sonar systems, and thus provides a unique opportunity to collect data necessary for understanding the impacts of sonar and other potential anthropogenic stressors on Z. cavirostris (DeRuiter et al., 2013; Falcone et al., 2017).
Animal-borne tags have advanced our understanding of Z. cavirostris foraging behavior in the Ligurian Sea (Johnson et al., 2004), the Azores (Visser et al., 2021), the Bahamas (Joyce et al., 2017), the Western Atlantic (Shearer et al., 2019), Hawai’i (Baird et al., 2008), and the Southern California Bight (Schorr et al., 2014). In Southern California, Z. cavirostris have been reported diving to depths of up to 2,992 m and for as long as 137.5 min (Schorr et al., 2014). Their dive patterns are consistently bimodal, with long, deep dives typically followed by a series of shorter, shallower dives (Johnson et al., 2004; Tyack et al., 2006; Baird et al., 2008; Schorr et al., 2014). Echolocation pulses, indicative of foraging, are typically emitted during the descent into long, deep dives starting below 200 m and continue with occasional short pauses until the whale begins to ascend (Johnson et al., 2004; Tyack et al., 2006; Warren et al., 2017). The term “pulse” is used in lieu of “click” (which has been widely used in the literature) because of the distinctiveness of beaked whale echolocation calls and their resemblance to echolocating bats (Baumann-Pickering et al., 2013). Buzzes, defined as sequences of non-frequency modulated pulses with inter-pulse-intervals < 0.1 s (Johnson et al., 2004; Zimmer et al., 2005), are also emitted during deep dives and are associated with active pursuit of a prey item (Miller et al., 2004; Johnson et al., 2006; Tyack et al., 2006; Madsen et al., 2013; Visser et al., 2021). Z. cavirostris typically emit pulses and buzzes, and thus forage, between 600 and 2,000 m (Johnson et al., 2004; Tyack et al., 2006; Visser et al., 2021), with evidence suggesting foraging depth varies regionally (Barlow et al., in prep). The mean depths of deep dives in the Southern California Bight (1,401 m [Schorr et al., 2014] and 1,427 m [Barlow et al., 2020]) appear to be similar to those recorded in both the Azores (1,420 m; Visser et al., 2021), and Cape Hatteras (1,492 m; Shearer et al., 2019). However, they are several hundred meters deeper compared to the Ligurian Sea (1,070 m; Tyack et al., 2006), and Hawai’i (1,284 m; Baird et al., 2006). This regional variation is likely driven by prey type and distribution and limited by bathymetry in some regions. Stomach contents from stranded Z. cavirostris in the North Pacific showed a preference for cephalopods, typically found in deeper waters, along with some fishes and crustaceans also consumed (Adams et al., 2015; West et al., 2017). However, significant prey mass contributions from fish—primarily the giant grenadier (family Macrouridae), which also inhabit deep water environments—were only observed in specimens stranded in California (Adams et al., 2015). In the Western Pacific (e.g., Mariana Islands), crustaceans, though found at various depths, most often inhabit mid-water to deeper regions and may be a major diet component (West et al., 2017).
Several tag types have been used to study Z. cavirostris dive behavior. Low-Impact Minimally Percutaneous External-electronics Transmitter (LIMPET) tags (Schorr et al., 2014; Shearer et al., 2019) provide summarized dive information (dive depths and durations) via satellite transmission for periods of days to months. These small tags lack the ability to record acoustic data, a critical component for studying echolocation and more complex aspects of foraging behavior. Previous acoustic recording tag deployments (e.g., DTAGs) on beaked whales were attached via suction cups, with deployment durations up to 24 h (Johnson et al., 2004; DeRuiter et al., 2013; Warren et al., 2017). While these tags include high-resolution accelerometers in addition to acoustics, short attachment durations limit the scope of the records, which may include only a few foraging dives per individual. The recent development of the Sound and Motion Recording and Telemetry (SMRT) dart-attached archival tag (Wildlife Computers, Redmond, WA) has helped bridge the gap between data resolution and duration. These tags can provide continuous records of diving, acoustic behavior, and fine-scale kinematic activity for up to two weeks (Sweeney et al., 2022). Here, we use SMRT tags to explore factors influencing foraging behavior of Z. cavirostris within SOAR and neighboring regions of Southern California.
2 Materials and methods
2.1 Data collection
Medium-duration, dart-attached archival SMRT tags were deployed on six Z. cavirostris at SOAR from 2019–2020 (Figure 1). These Type A tags (Andrews et al., 2019) were anchored to the dorsal surface of the whale’s body using four medical-grade titanium darts with backward facing petals, capable of penetrating up to 6.7 cm into the tissue (Andrews et al., 2008). Each tag was equipped with onboard sensors that included a single hydrophone that recorded at a sampling rate of 96 kHz using lossless compression (Johnson et al., 2013) for efficient on-tag storage. The memory capacity of the tag allowed continuous sound recording for up to seven days for each deployment. Each tag included a built-in 150 Hz one-pole high-pass filter, and the upper -3 dB frequency limit is approximately 0.45 times the sampling rate, resulting in a recording bandwidth from 100 Hz to 44 kHz. Additional sensors included a pressure transducer that sampled depth at 1 Hz (with an effective resolution of 1 m), a tri-axial accelerometer that sampled at 100 Hz (50 Hz for one tag), a triaxial magnetometer sampled at 25 Hz, and Fastloc® GPS for estimating position at the water surface.
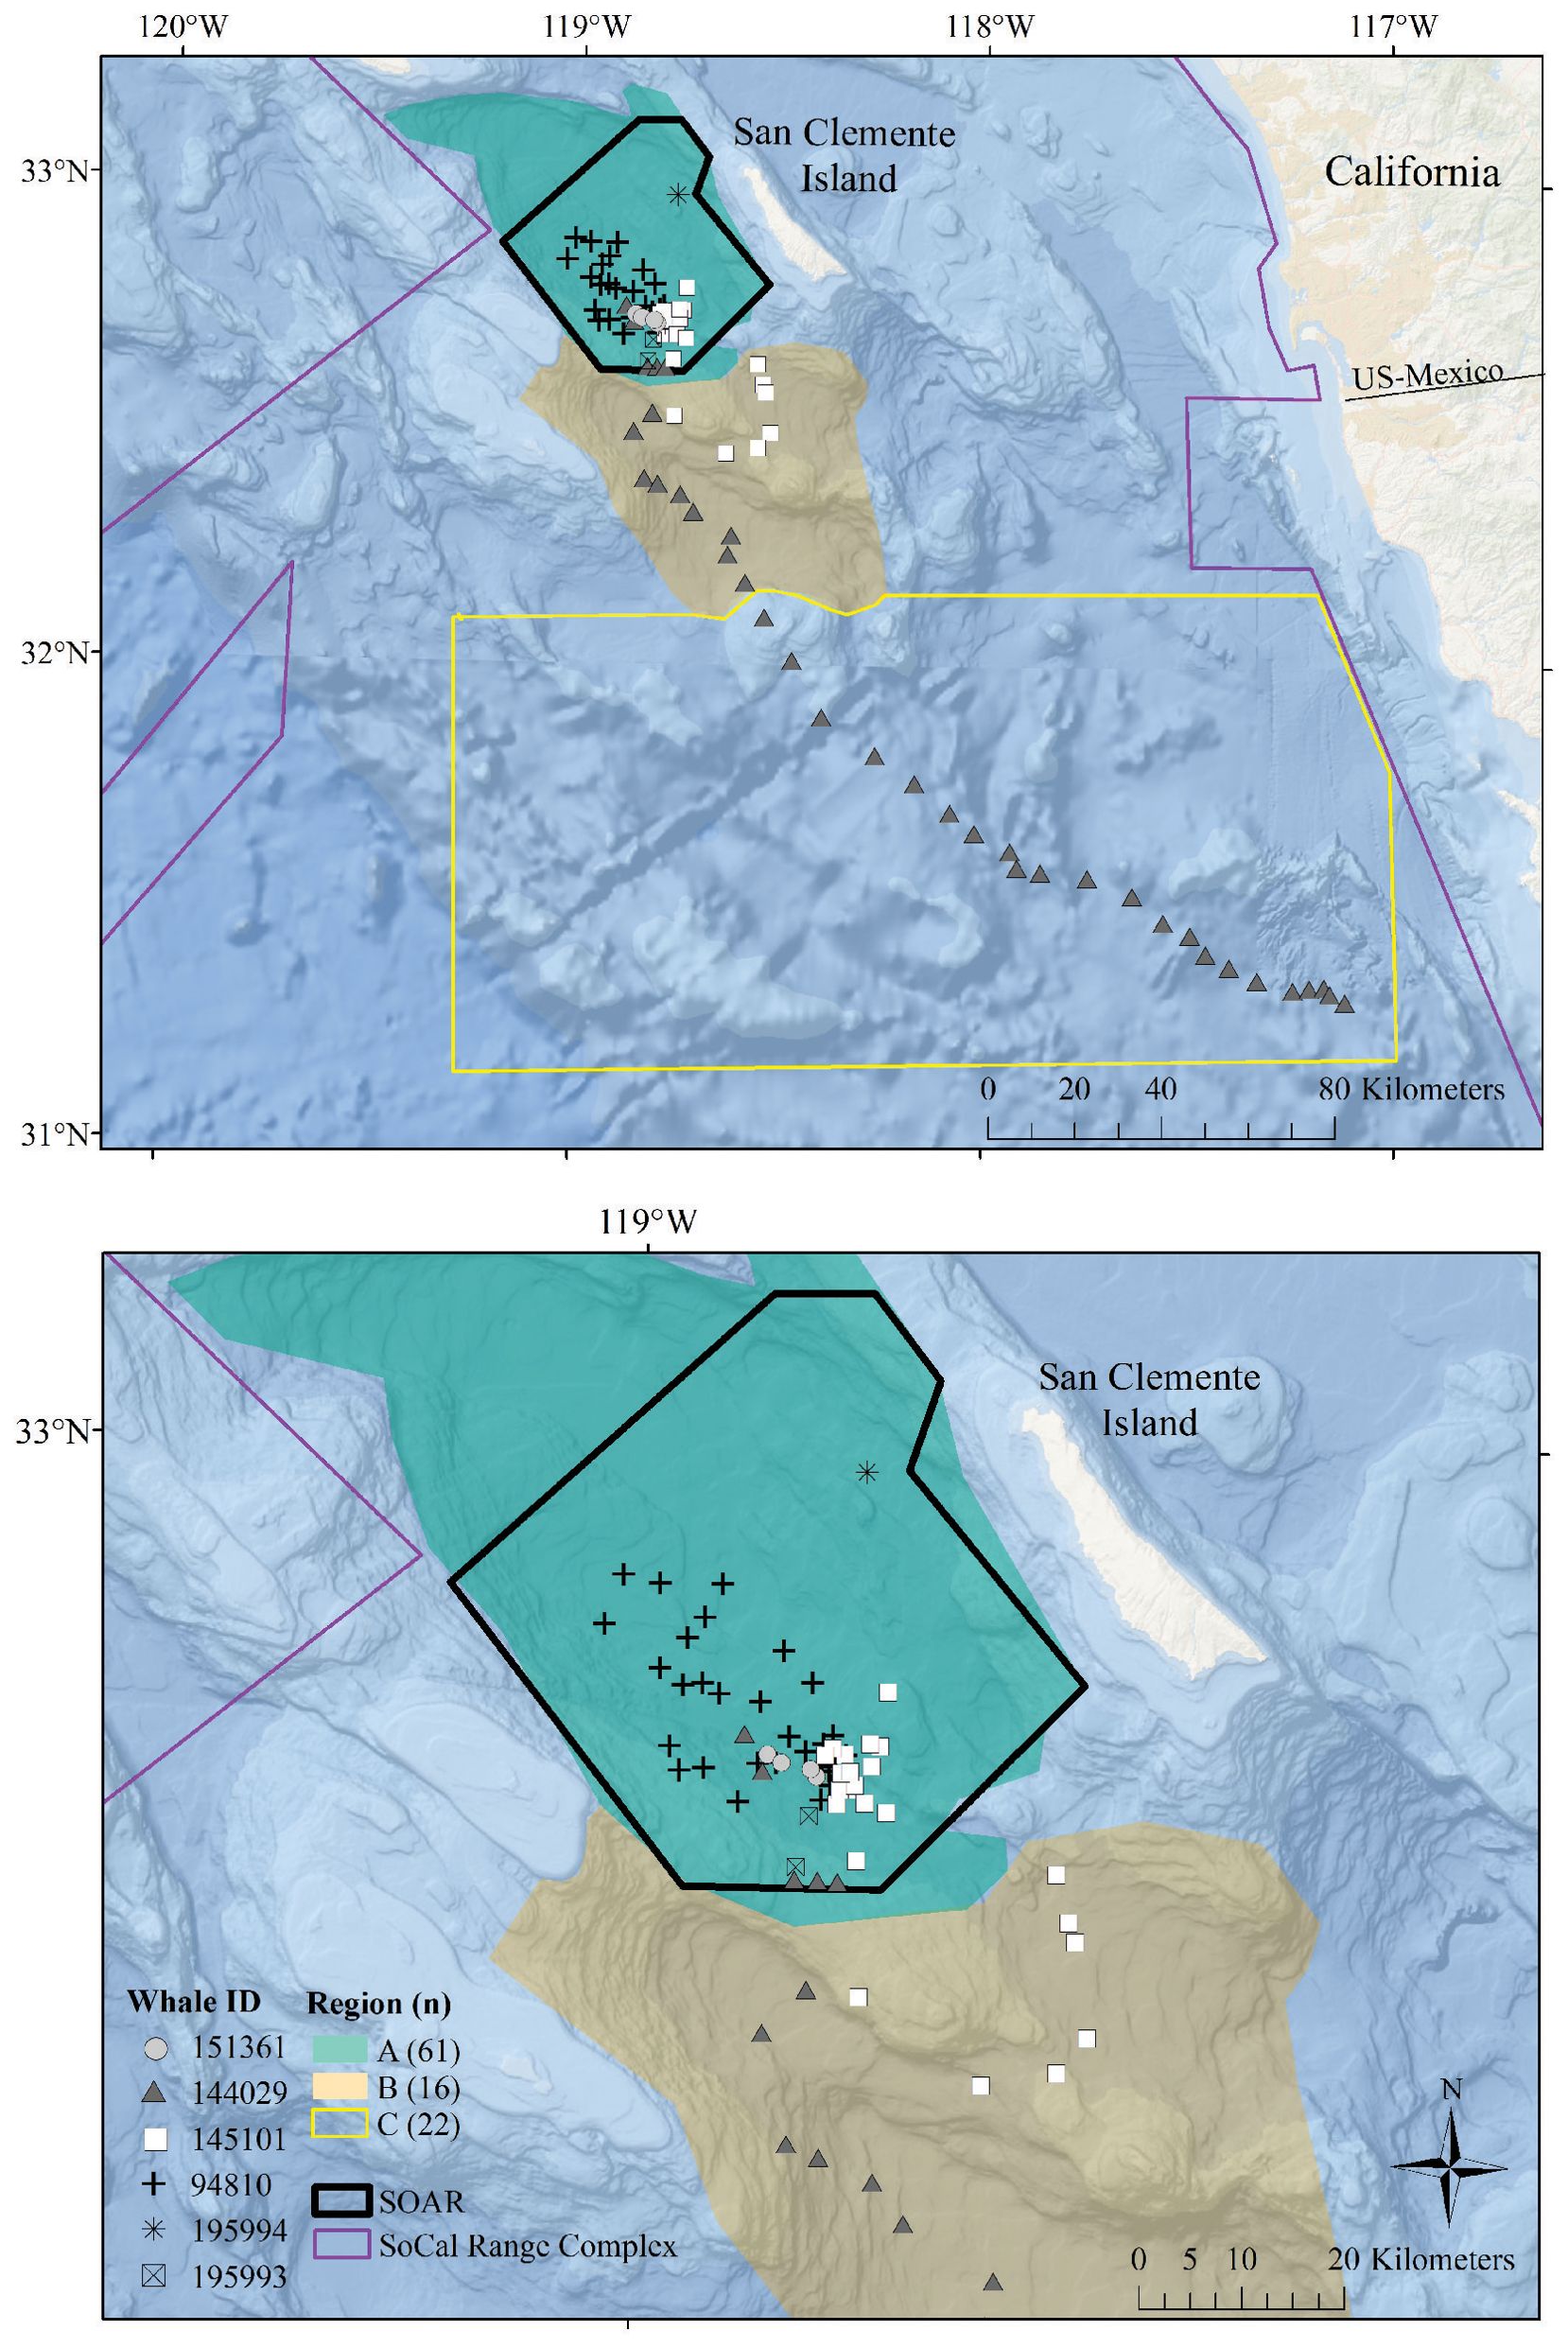
Figure 1. Map of the study area with locations of observed foraging dives. In each panel, the SOAR range is outlined in black, the regions used in comparison are color-coded, and foraging dives are plotted with a unique symbol for each tagged whale. The regions established for this analysis include Region A, the San Nicolas Basin; Region B, an area encompassing Tanner Canyon, East Cortez Bank, and the San Clemente Basin; and Region C, additional areas in the Southern California Range Complex located outside of Region A or B. The top panel displays the entire study area along with all dives from whale ID 144029, which traveled south into Mexican waters. The bottom panel provides a closer view of the dives that occurred within Region A and Region B.
2.2 Data analysis
SMRT tag audio files were reviewed using a semi-automated process to identify sounds emitted by the tagged whales and anthropogenic sounds. Audio files were initially processed using PAMGuard’s click detector and classifier module to identify beaked whale echolocation pulses and pulse trains (Gillespie et al., 2009). Next, we used PAMGuard’s spectrogram module in ViewerMode, with a Hann window duration of 10 s and a 2048-point fast Fourier transform incorporating a 50% overlap, to facilitate the precise logging of pulse start times during the review process. These spectrogram parameters yielded a frequency resolution of 23.4 Hz and a time resolution of 42.7 ms. Echolocation pulses from each tagged whale were differentiated from those produced by nearby conspecifics or delphinids based on the presence of relatively high spectral energy below 20 kHz (Johnson et al., 2009; Warren et al., 2017) and relatively consistent pulse amplitudes over sequences of pulses (Zimmer et al., 2005). Periods with overlapping pulse trains indicated more than one echolocating animal and were visually discernable through an irregular inter-pulse-interval and variation in pulse amplitude. Once a pulse or group of pulses was identified as originating from the tagged whale, they were grouped together, and the metadata for each pulse was stored. Buzzes have a lower amplitude level in tag recordings than regular echolocation pulses (Madsen et al., 2005; Jarvis et al., 2022) and can be masked in the recording by tag placement on the whale, flow noise, and/or possible electrical interference, this presented as a regular ticking sound in one of the shorter recordings from a tag that sustained minor damage. Consequently, buzzes cannot be as reliably or consistently detected within and across tags as pulses. Despite the challenges, the start time was logged for any buzzes that were audible in the acoustic record, visible in the spectrogram, or both, during pauses in the active echolocation by the tagged whale. The date and time of each pulse and buzz attributed to the tagged whale were saved to PAMGuard’s binary files and extracted for analysis using the PAMpal (v0.9.14) R package (Sakai, 2020).
Dives with echolocation pulses attributed to the tagged whale were classified as “foraging dives” (Johnson et al., 2004; Aguilar Soto et al., 2006; Tyack et al., 2006; DeRuiter et al., 2013; Alcázar-Treviño et al., 2021). Incomplete foraging dives (due to tag detachment mid-dive) and dives containing acoustic detections of mid-frequency active sonar (MFAS), echosounders, or explosives were excluded from the analysis. “Echolocation duration” was defined as the time from the first to last pulse attributed to the tagged whale within a dive; echolocation pulses assigned to other individuals were excluded. Dives were partitioned into three phases to assess the distribution of echolocation behavior across the descent, bottom, and ascent periods. The “bottom phase” of each dive was defined as the time between the first and last change in vertical direction of travel occurring below 73% of the maximum depth reached during the dive (“dive depth”) following the method used in (Sweeney et al., 2022); this threshold represented the deepest proportional start of echolocation across all foraging dives in the dataset (i.e., all whales were echolocating by the time they reached 73% of maximum dive depth). This was used to ensure the bottom phase statistics reflected the portion of each dive during which all whales were actively foraging, though some dives also included pulses outside the bottom phase. Dive “descents” and “ascents” were defined as the periods before and after the bottom phase, when the whales were traveling away from and back to the water’s surface, respectively.
Fastloc® GPS location estimates were processed via the Wildlife Computers Data Analysis Program (DAP version 3.580 and 3.610); locations with Fastloc® GPS solver residuals > 35 (Dujon et al., 2014) or time errors > +/- 3 s were omitted. Using the closest filtered Fastloc® location estimate in time to the dive start (the “dive start location”), solar elevation angles of each dive were calculated with the oce (v1.4-0) R package (Kelley and Richards, 2021). Dives were classified by time of day using the solar elevation angle at the dive start location as follows: dawn (–12° below to 6° above the horizon, in the morning), day (> 6°), dusk (6° to -12° in the evening), and night (< –12°) (http://www.esrl.noaa.gov/gmd/grad/solcalc/calcdetails.html; Falcone et al., 2017). The bathymetric depth at each foraging dive was estimated using filtered GPS positions within 12.7 min of the start or end of the dive (one standard deviation less than the average duration of non-foraging dives that exceeded 50 m for more than 30 s). If qualifying GPS locations were available within 12.7 min of both the start and end of the dive, we used the average location between the two points. Bathymetric depths were assigned to each foraging dive by averaging all bathymetric depths from NOAA’s Coastal Relief Model (3 arc s, Volume 7) within a 1 km radius of the foraging dive location. Assigned locations for each dive were plotted and subcategorized into the following oceanographic regions established for this analysis: Region A, the San Nicolas Basin; Region B, an area encompassing Tanner Canyon, East Cortez Bank, and the San Clemente Basin; and Region C, other areas in the southern portion of the Southern California Range Complex not within Region A or B (Figure 1).
2.3 Modeling foraging dive characteristics
Generalized additive models (mgcv (v1.8-38) R package; Wood, 2011) were used to assess factors influencing the following aspects of foraging behavior: echolocation start and end depths, median and inter-quartile ranges (IQR) of echolocation depth during the bottom phase (“bottom phase echolocation depth”), and dive and echolocation durations. Models were fitted using the Gamma distribution family with the log link function, used maximum likelihood, and included the following explanatory variables: time of day, oceanographic region, bathymetric depth, and dive depth. Continuous variables were fitted as smooth terms via shrinkage cubic regression splines with a basis dimension of five. Models were validated using the gratia (v0.6.0) R package (Simpson, 2021). Whale ID was included in each model as a random effect to account for individual differences.
Recognizing that bathymetric depth and dive depth were likely to be correlated (Joyce et al., 2017; Barlow et al., 2020), we assessed the relationship between these two predictors; results demonstrated a strong linear correlation (Figure 2) causing issues with concurvity in models. Bathymetric depth accuracy may vary as a function of the associated location accuracy and also where bottom topography is steep and/or irregular (e.g., it was not uncommon for dive depth to exceed the bathymetric depth); therefore, we retained only dive depth in the models. We used ANOVA (via the anova.gam R function) to calculate explanatory variable significance levels (Wood, 2011).
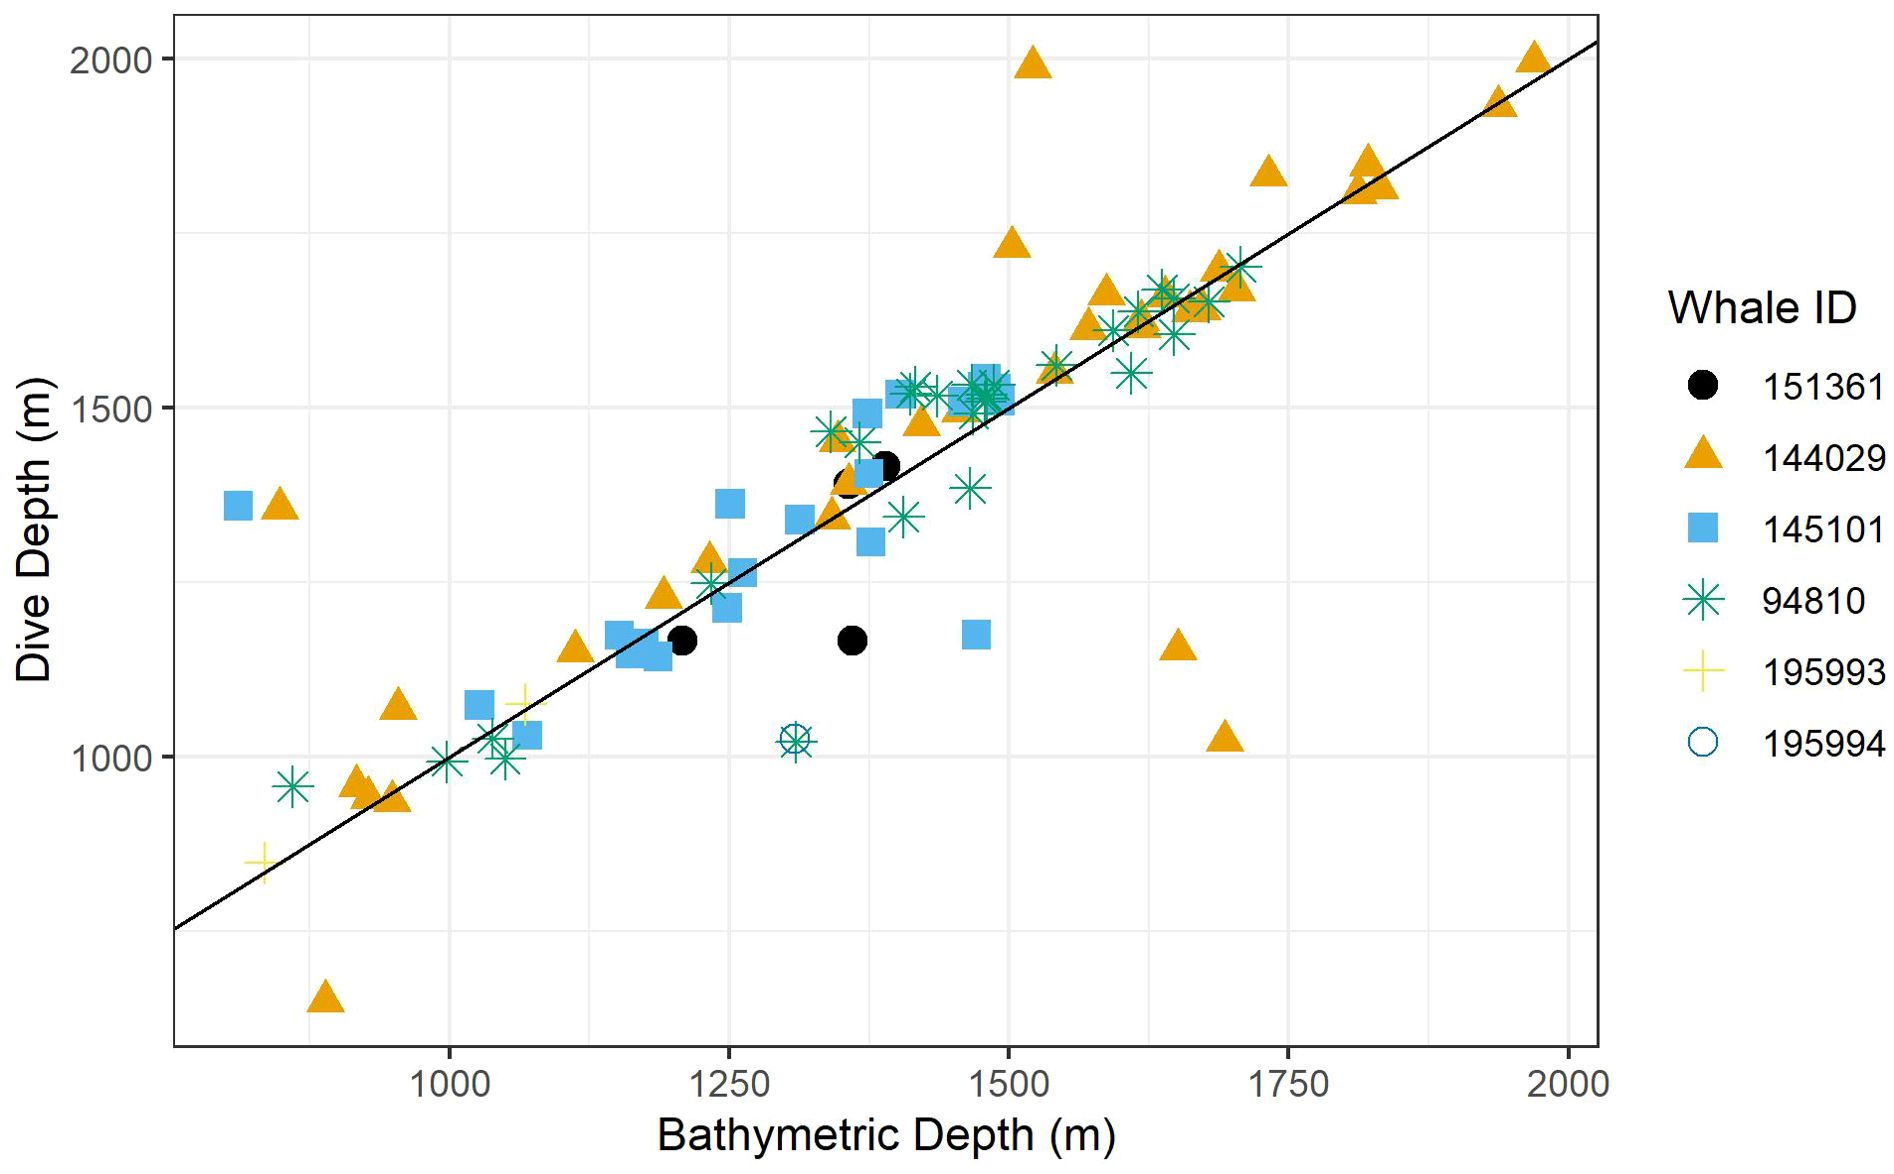
Figure 2. A scatter plot of dive depth (the maximum depth reached during the dive) versus estimated local bathymetric depth. Point shapes/colors distinguish between tagged whales, and the black line displays a 1:1 relationship.
3 Results
3.1 Summary of data
Six SMRT tags were deployed on Z. cavirostris within the SOAR boundary between January 2019 and January 2020, resulting in 395 h of concurrent depth, kinematic, and acoustic data (Table 1). A total of 129 dives containing echolocation pulses were recorded. Recording durations ranged from 1.9 to 127.3 h, with three of the six tagged whales, specifically 144029, 145101, and 94810, accounting for more than 90% of the data. Two tags reached the recording capacity of the tag; a third detached just prior to doing so. The remaining tags detached prematurely due to unknown reasons, though the shortest deployment had a suboptimal attachment.
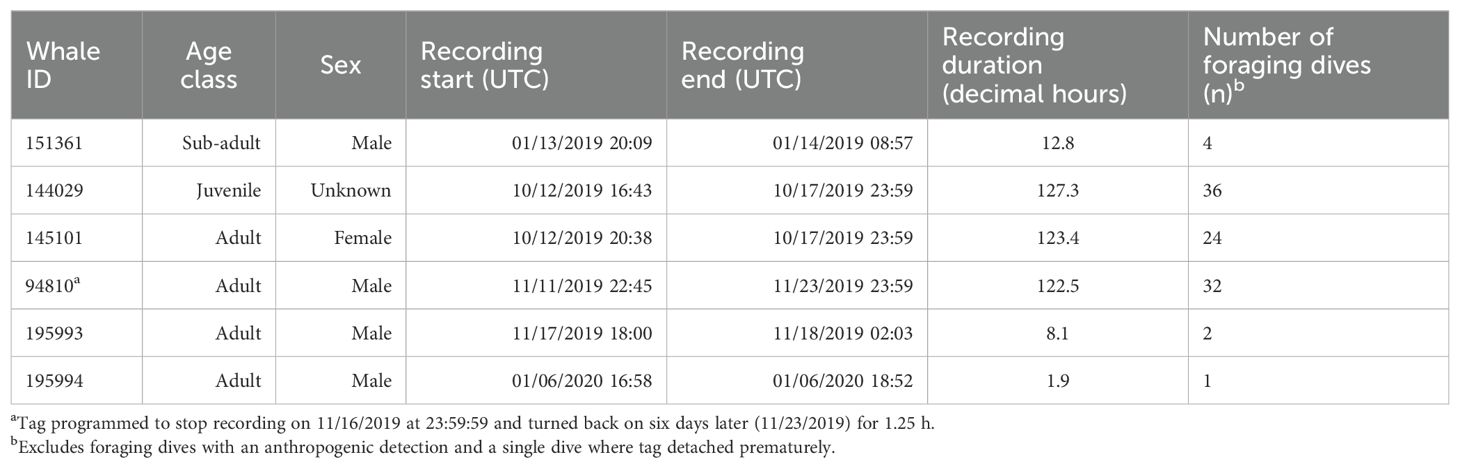
Table 1. Overview of Sound and Motion Recording and Telemetry tag deployments by individual.
After removing an incomplete foraging dive and those containing anthropogenic detections (n = 29), we identified 258,544 echolocation pulses and 2,018 buzzes from 99 foraging dives in the dataset (Table 2), though it is probable that some buzzes were missed due to masking caused by possible electrical interference and flow noise, especially on tags 151361 and 145101. The median dive depth was 1,466 m (IQR = 391), which corresponded closely with the median maximum echolocation depth of 1,451 m (IQR = 390). The median number of echolocation pulses per dive was 2,629 (IQR = 787) and the median pulse depth was 1,087 m (IQR = 492). The depth distributions of echolocation pulses and buzzes were similar. Both occurred mostly during the bottom phase, and thus their depths were correlated with dive depth, demonstrating two modes at around 950 m and 1,400 m. The distribution of buzzes was shifted slightly toward the deeper peak (Figure 3). Of the echolocation pulses observed, 37% occurred during the descent, 60% at the bottom, and 3% during the ascent (Figure 4). The median buzz depth was 1,215 m (IQR = 479) with 34% occurring during the descent, 63% at the bottom, and 2% during the ascent. One foraging dive had an unusual depth profile and a brief echolocation period that ended prior to the bottom phase, resulting in incalculable bottom phase echolocation statistics. This outlier was not included in the modeling; model results for the remaining 98 dives are provided in Table 3.
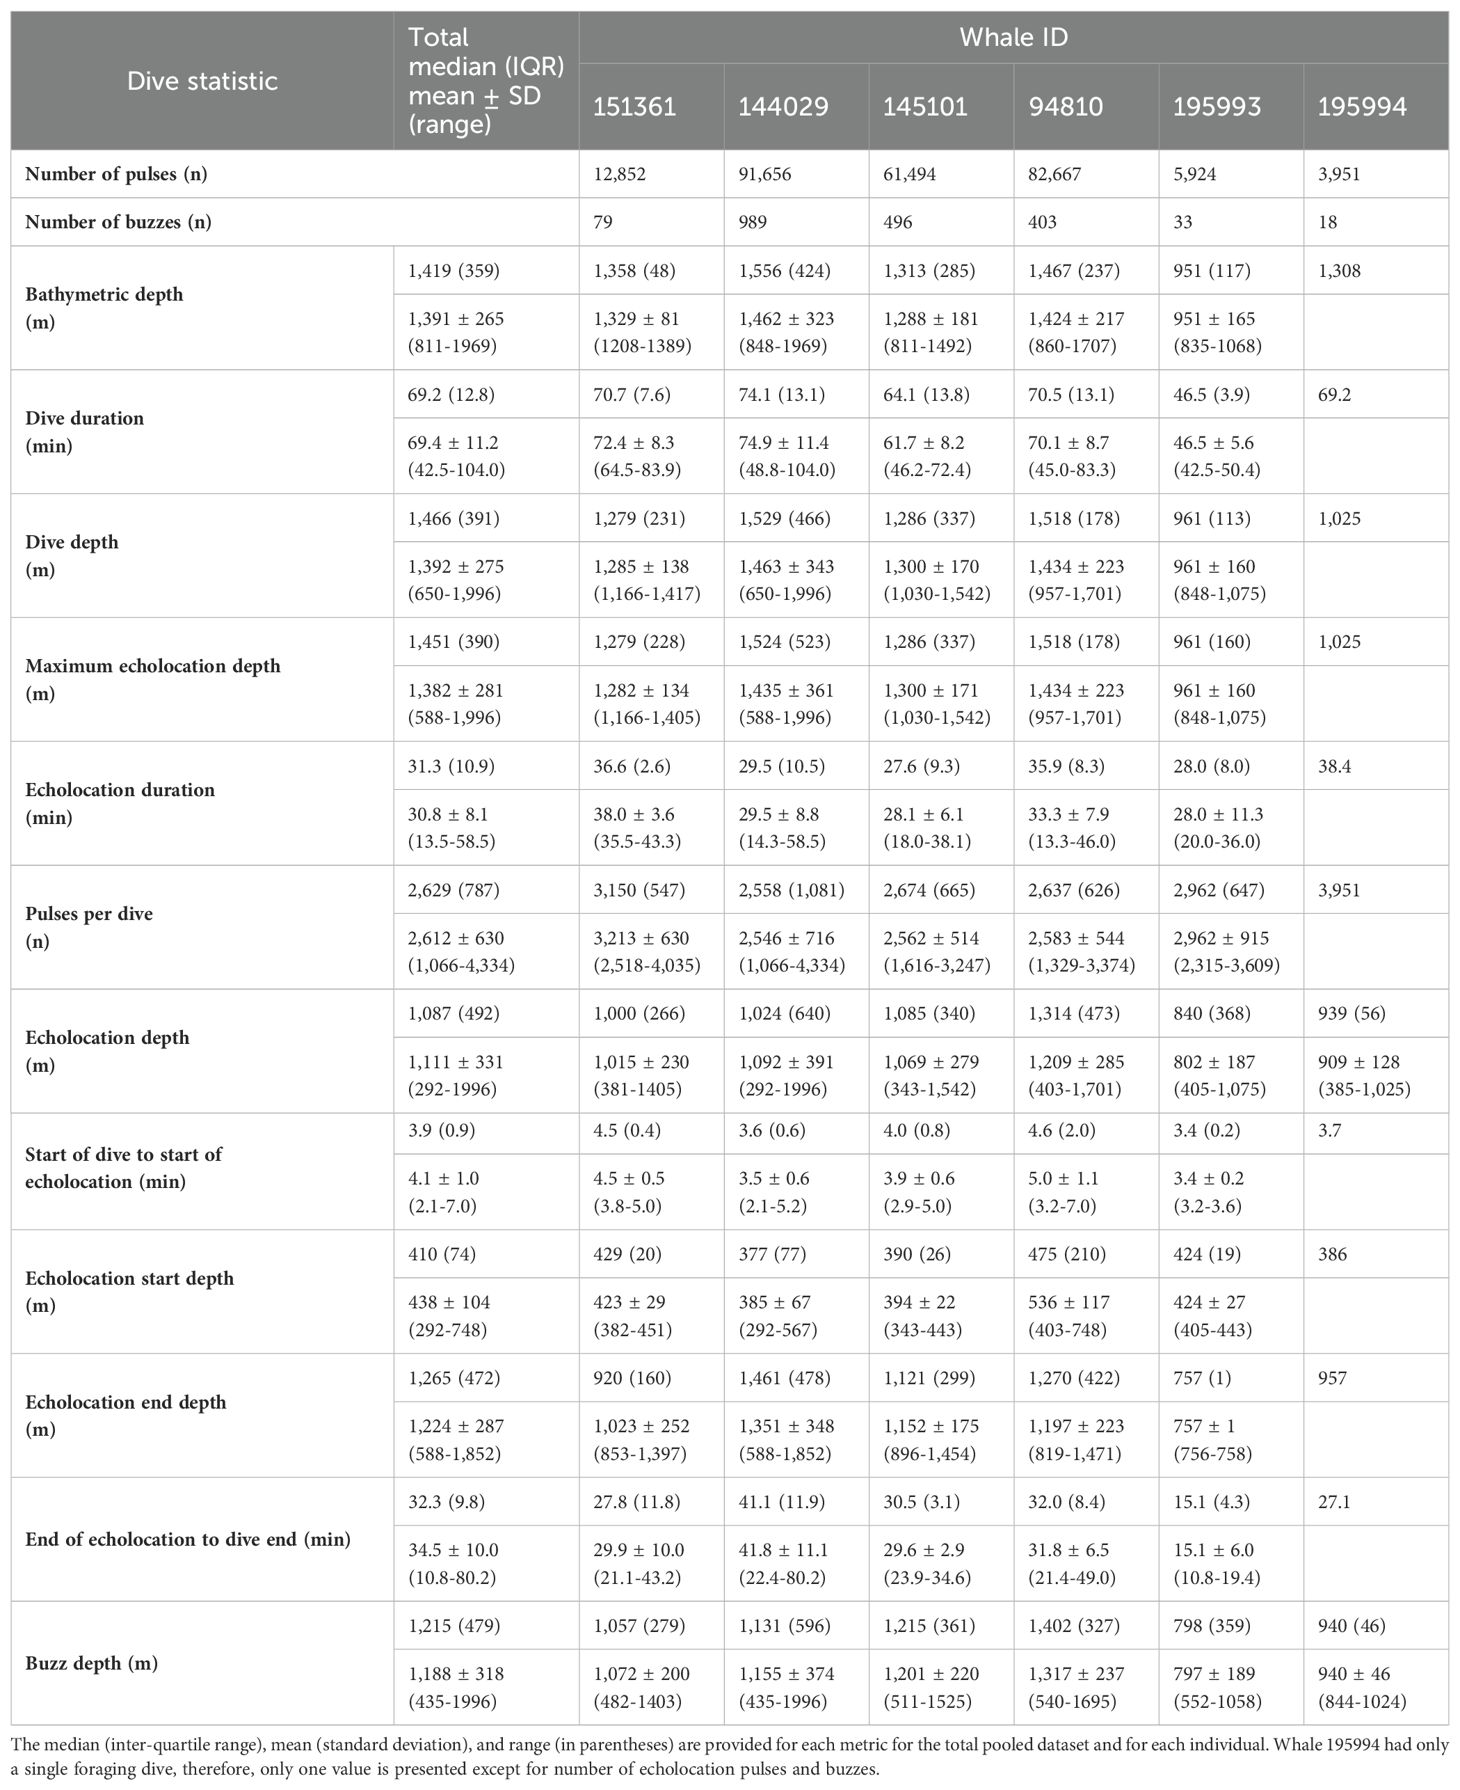
Table 2. Summary of foraging behavior for Z. cavirostris.
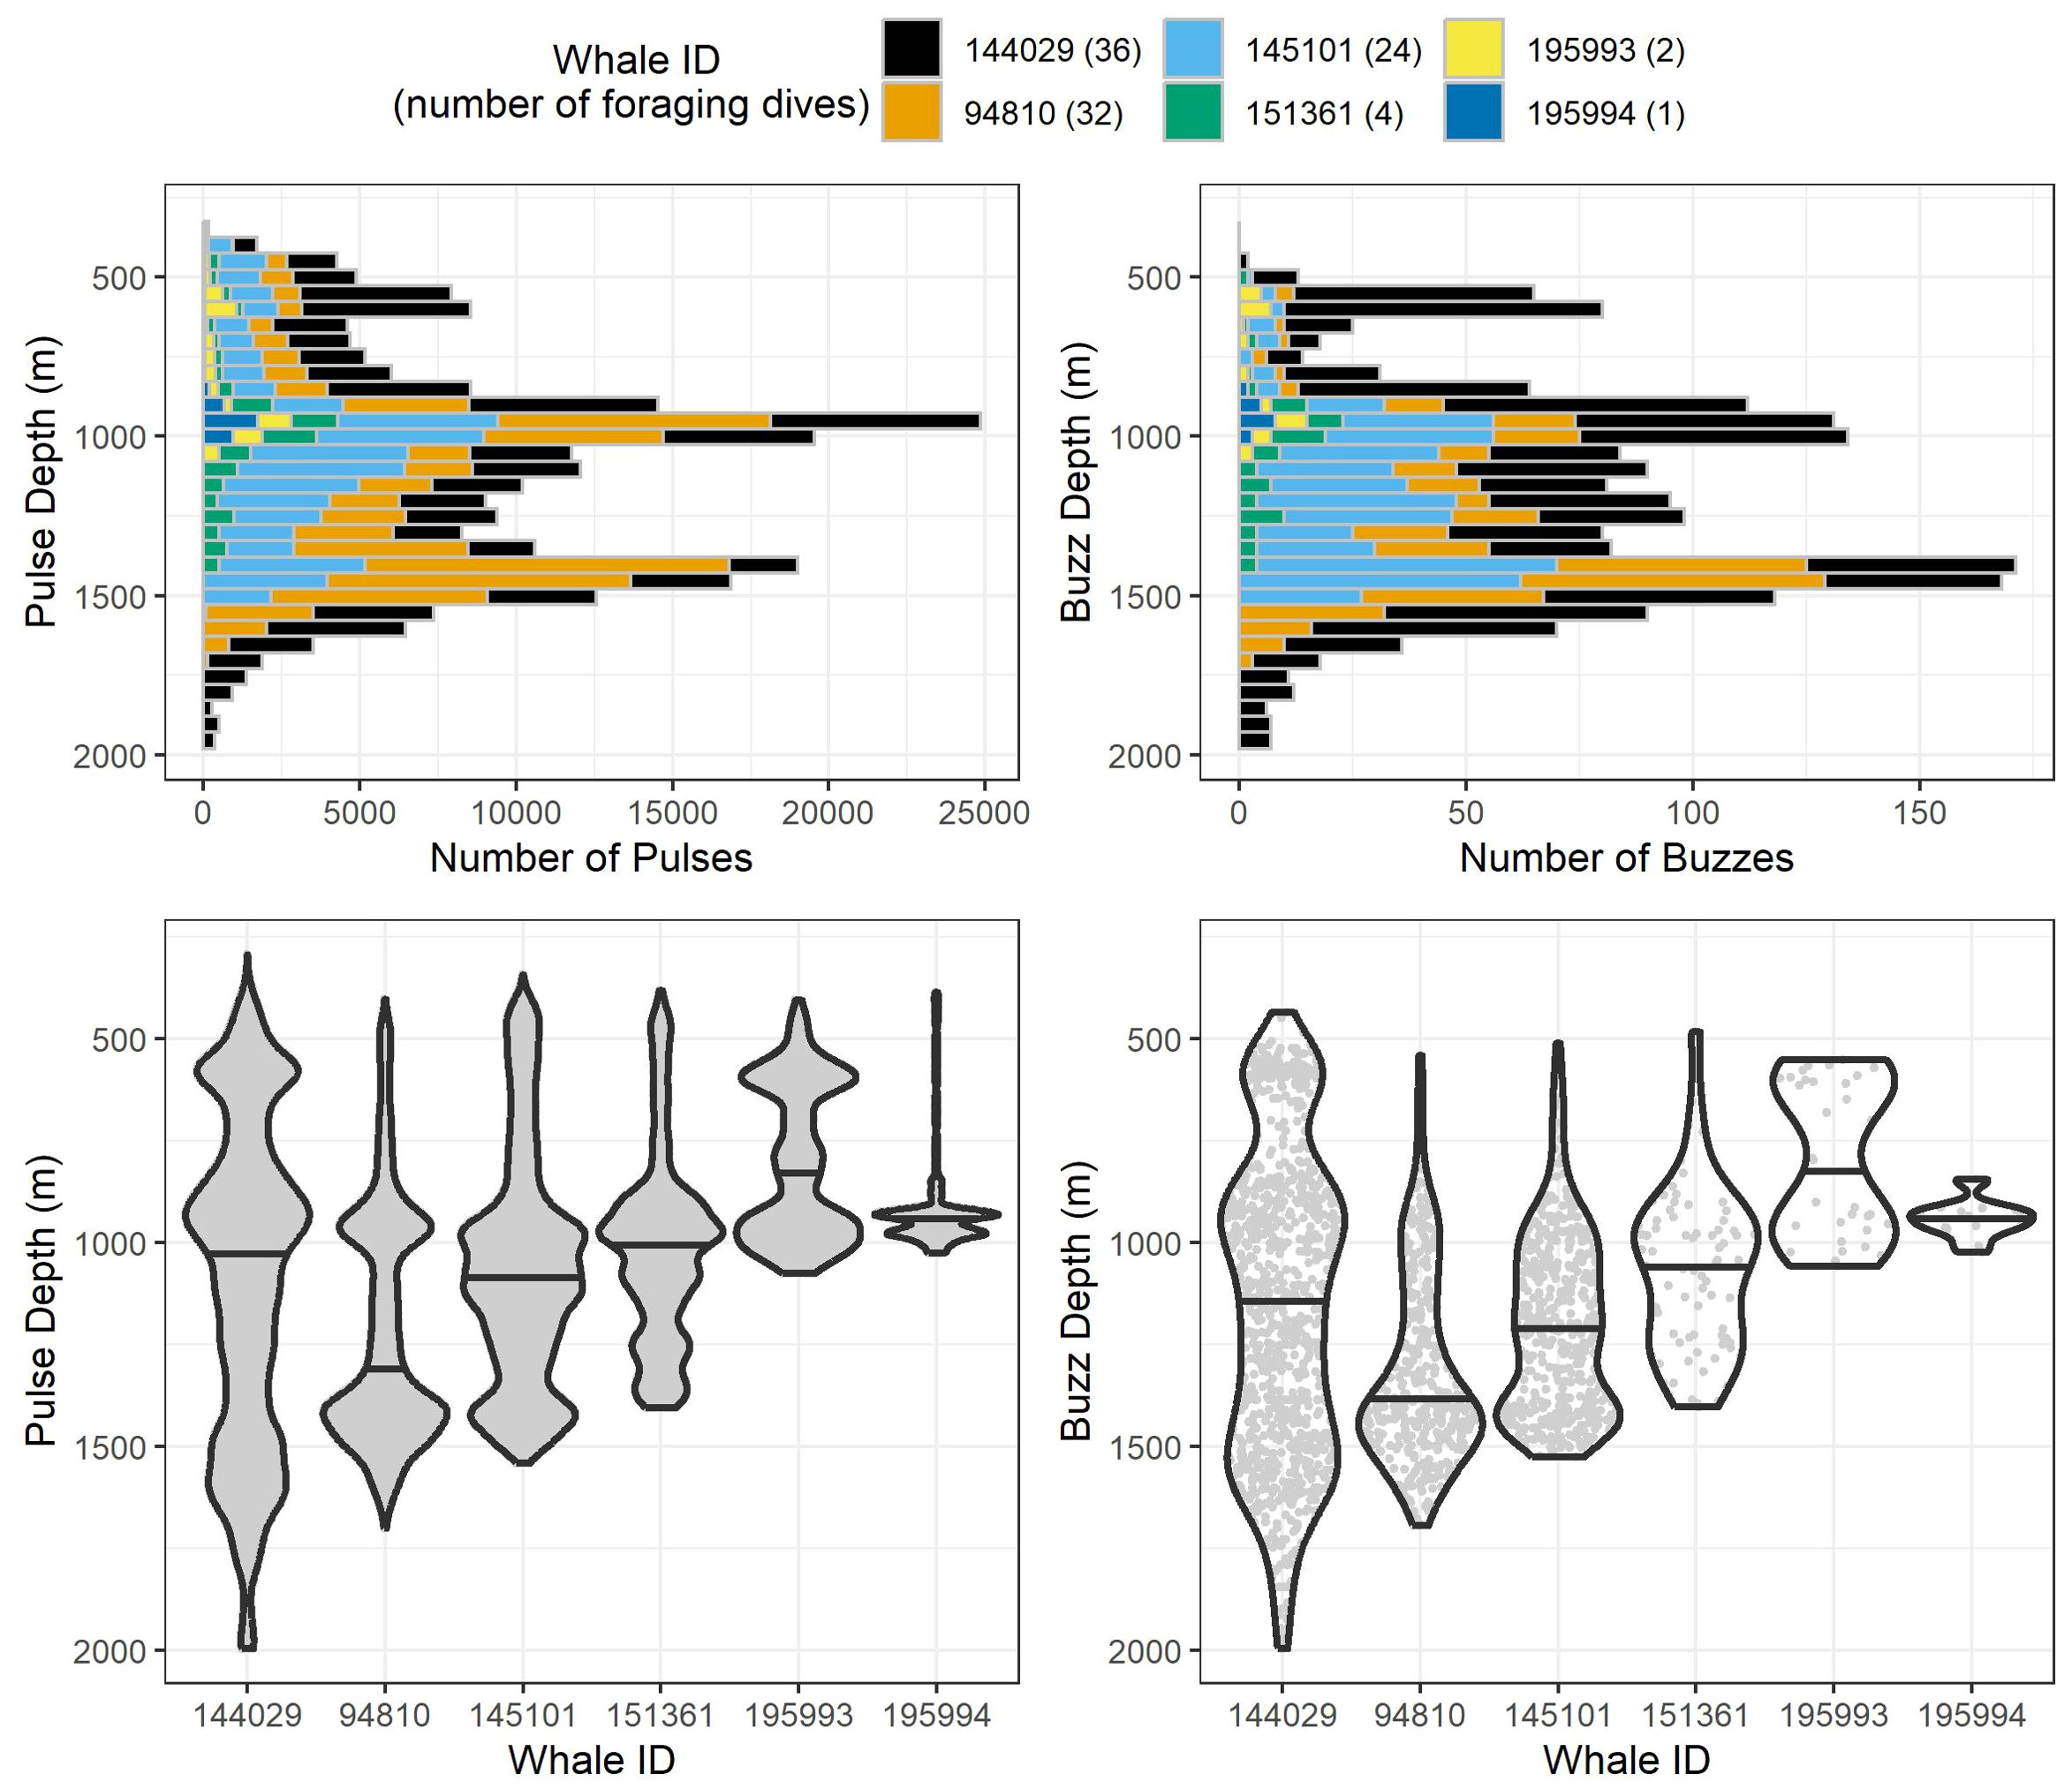
Figure 3. Stacked histograms (top) and violin plots (bottom) of observed pulse and buzz depths for all 99 analyzed foraging dives by the six whales tagged in this study. Histogram bin segments are colored by whale ID. Violin plots for each whale have the same maximum width regardless of the number of echolocations/buzzes recorded, and median values are represented by the black horizontal line for each whale. Within each violin plot are gray points for each individual echolocation/buzz to visualize sample sizes between whales.
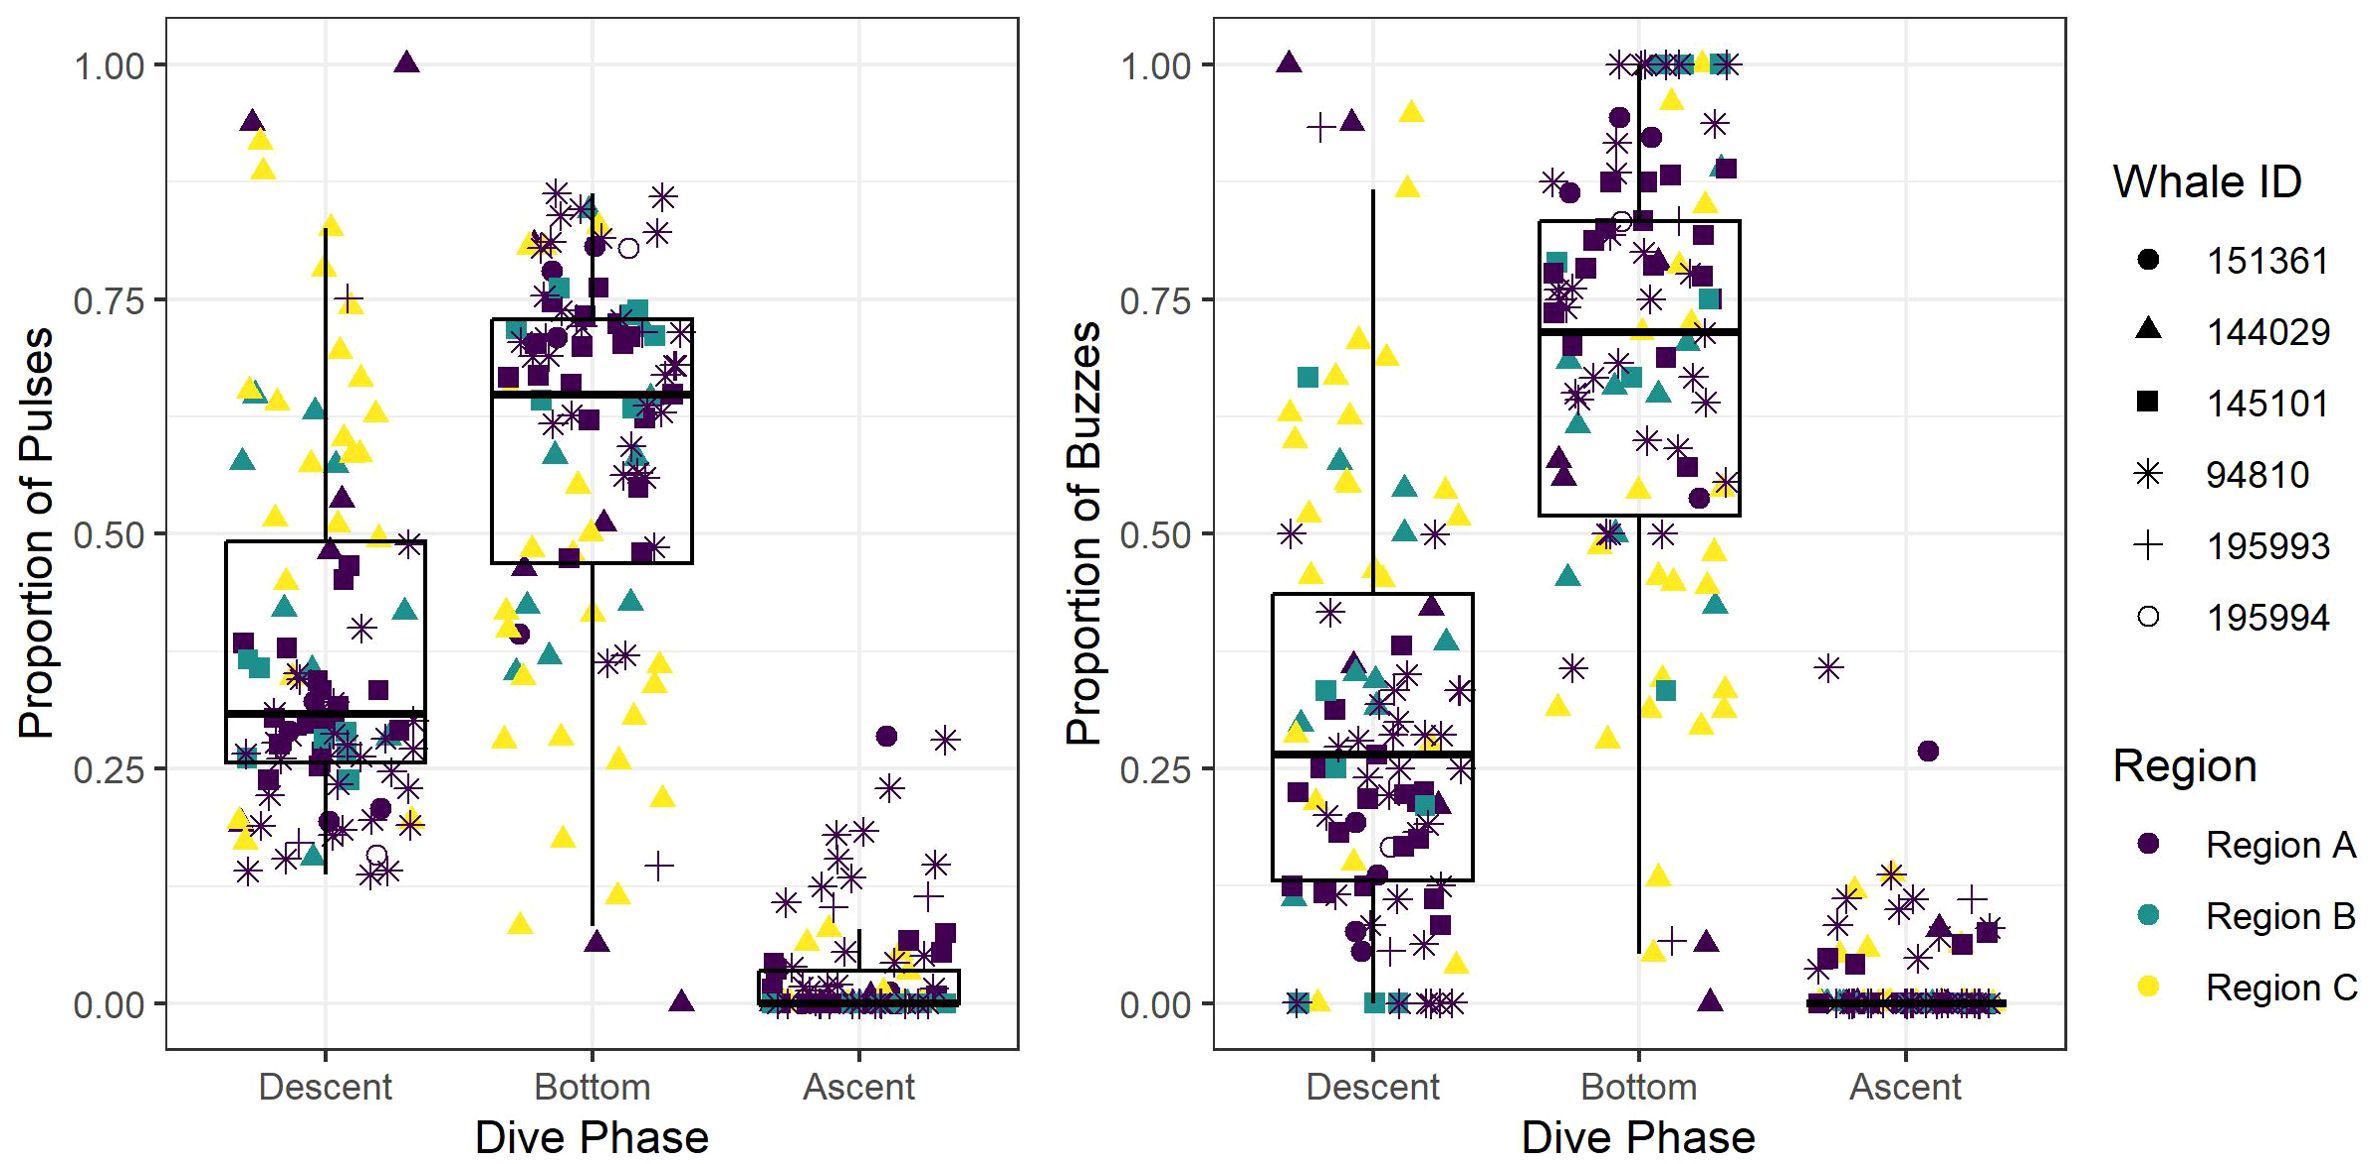
Figure 4. Box and whisker plot of the observed proportion of echolocation pulses and buzzes during three dive phases (descent, bottom, and ascent) across the study regions (Region A, Region B, and Region C). Box and whisker plot is overlayed with jittered points of observed values, and point colors and shapes distinguish between regions and tagged whales, respectively.
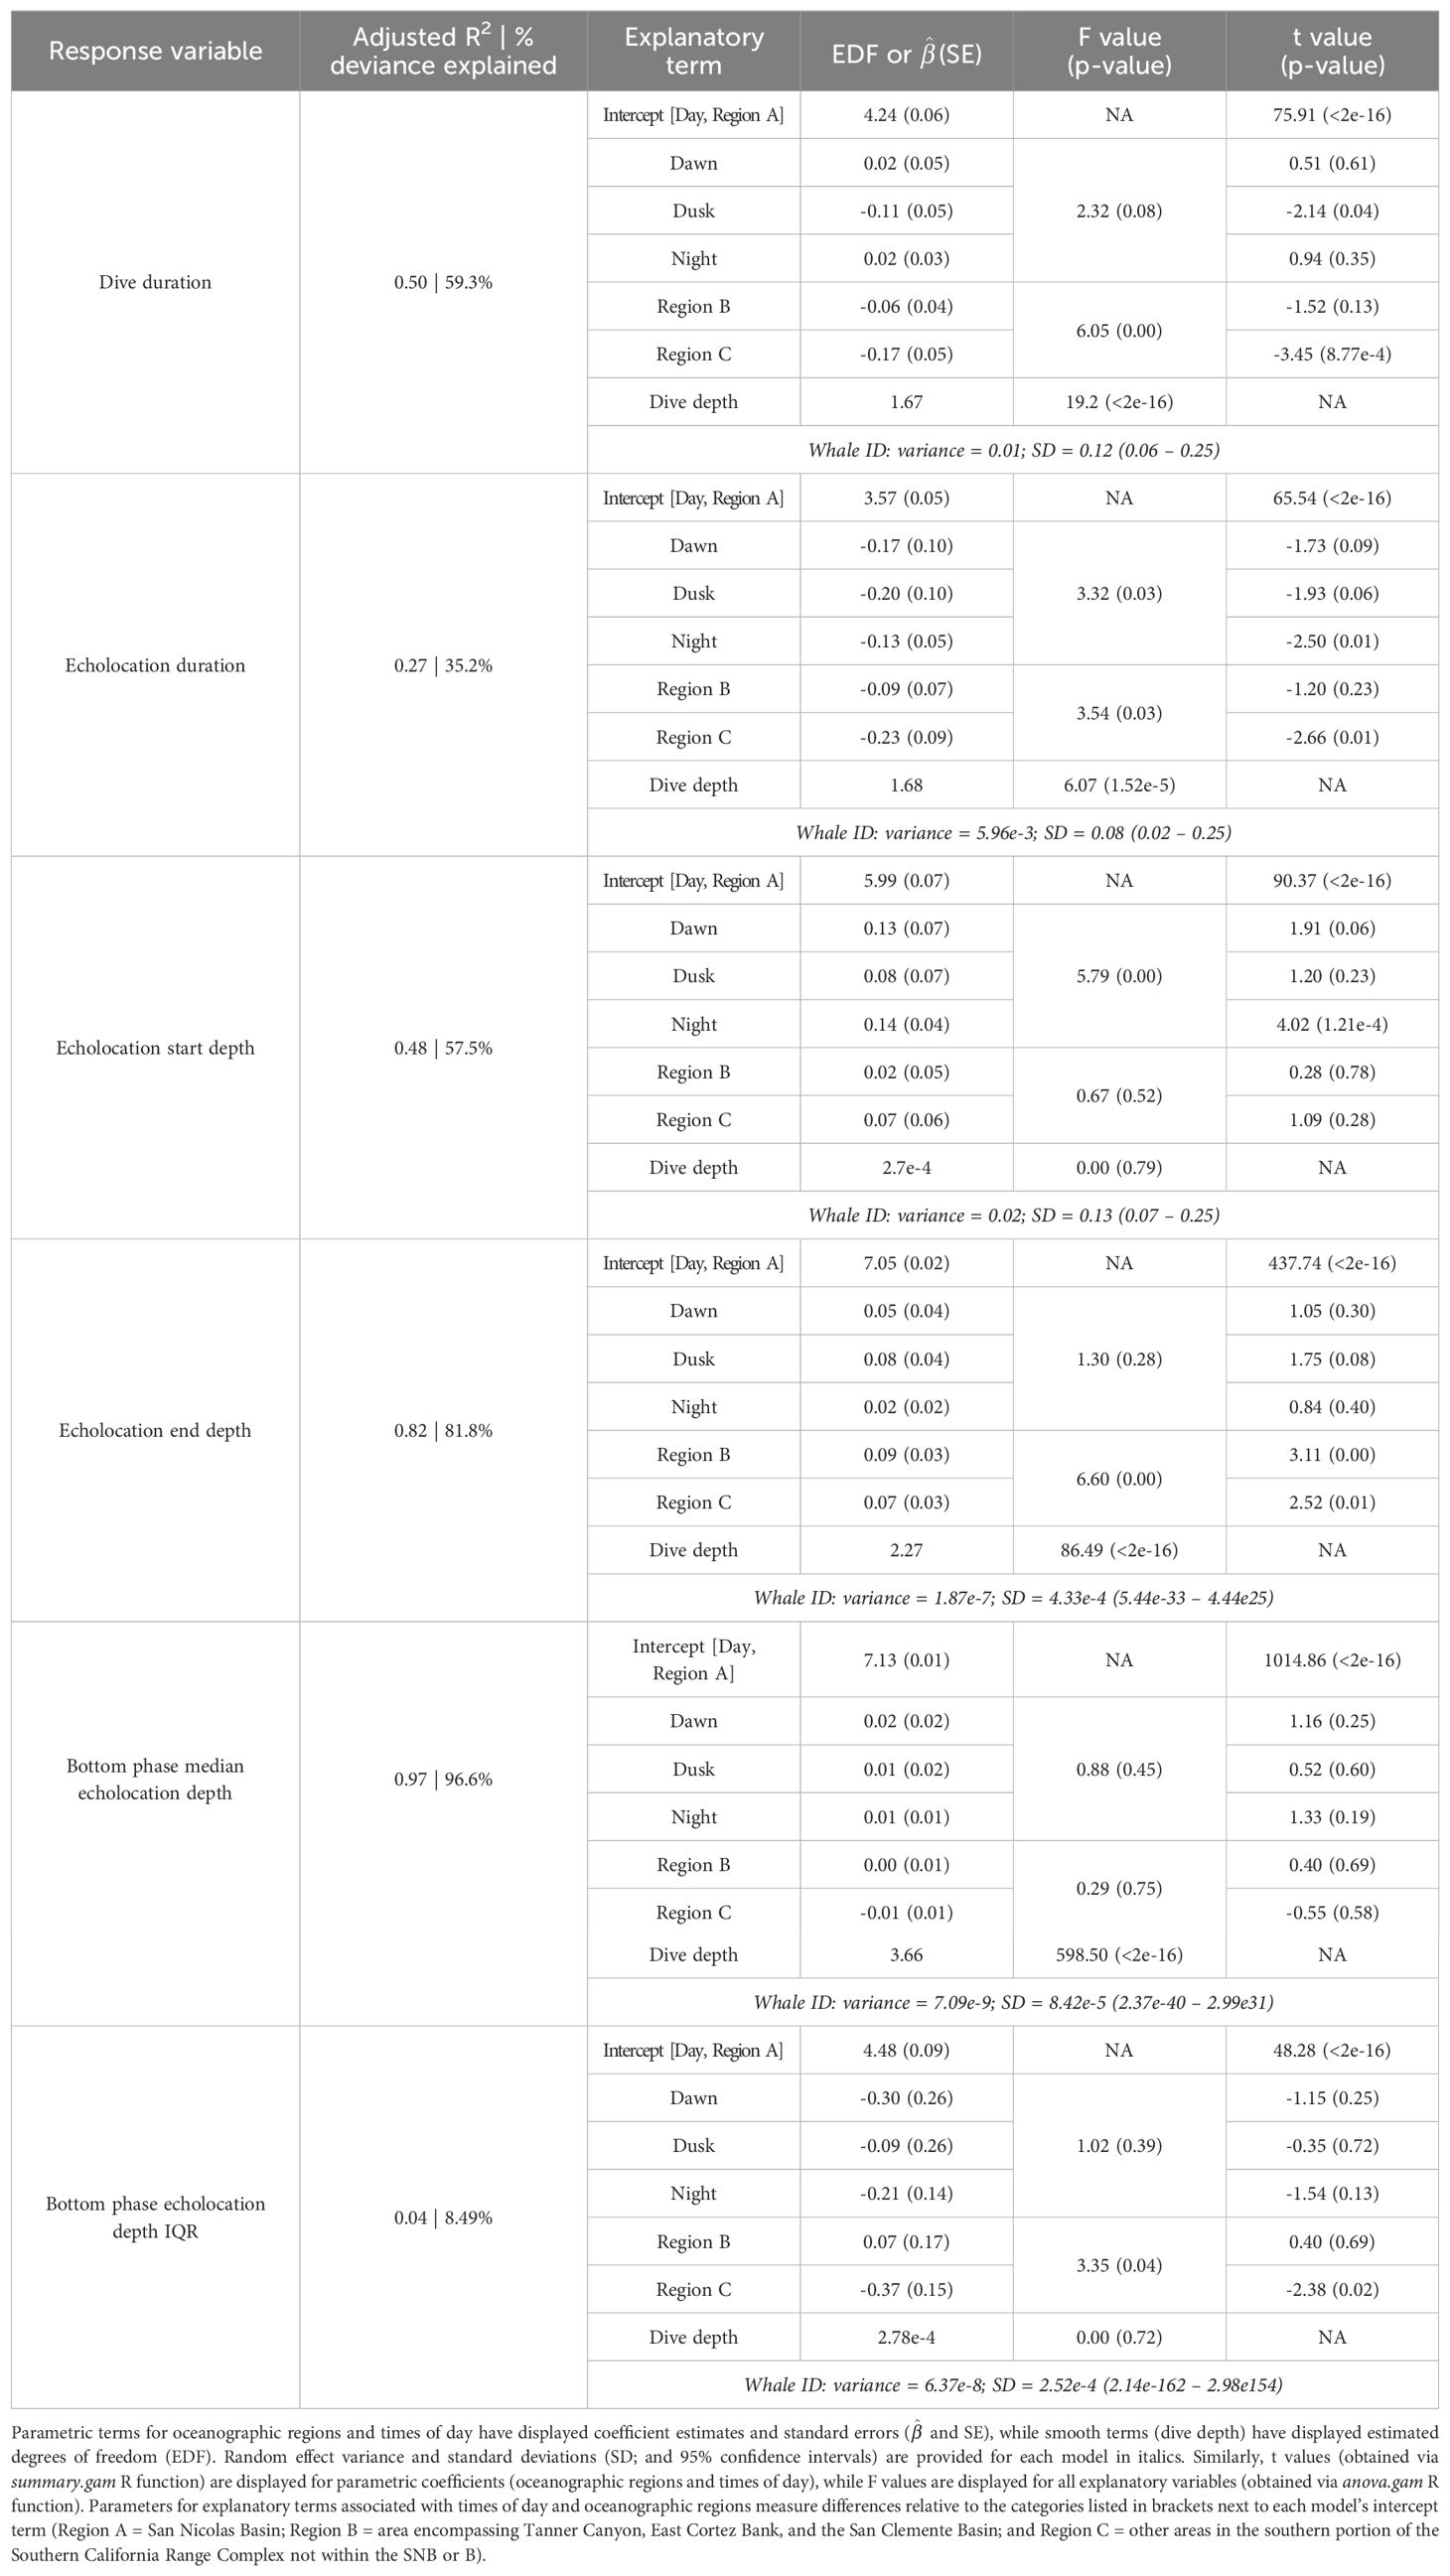
Table 3. Summary of model results for dive and echolocation behaviors of Z. cavirostris.
Foraging dives occurred in locations with bathymetric depths ranging from 811 to 1,969 m (median = 1,419; IQR = 359). As noted, dive depth and bathymetric depth were strongly correlated (r = 0.84), with the majority of dives reaching depths that were equal to or slightly exceeding the average bathymetry in the area where the whale was foraging (Table 2; Figure 2).
The median foraging dive duration was 69.2 min (IQR = 12.8). Echolocation durations had a median of 31.3 min (IQR = 10.9), accounting for 44.4% of the median dive duration. On descent into a foraging dive, echolocation began at a median of 3.9 min (IQR = 0.9) after leaving the surface and at a median depth of 410 m (IQR = 74; Supplementary Figure 1). Echolocation ended at a median depth of 1,265 m (IQR = 472). Median duration from the end of echolocation to surfacing was 32.3 min (IQR = 9.8; Table 2).
3.2 Effects of time of day
A total of 52 foraging dives occurred during the day and 35 occurred at night. While median foraging dive duration was slightly shorter during the day than at night (67.8 versus 73.9 min), the relationship between this and most other factors had no correlation with time of day (Table 3). However, whales had longer echolocation durations (median 33.2 versus 29.0 min; Figure 5) and began echolocating at shallower depths (median 399 m versus 434 m; Supplementary Figure 2) during the day than they did at night (p-values ≤ 0.01, Table 3). Buzzes could not be identified as consistently as pulses and thus were not modeled; however, they were found considerably more frequently during the day (n = 1,164) than at night (n = 608). Dives initiated during dawn and dusk were included in modeling and while several differences neared significance (e.g., dive and echolocation durations at dusk, and echolocation start depth at dawn), the small sample of dives occurring during these narrow time windows (n = 6 of each) limited inferential power of these comparisons (Table 3).
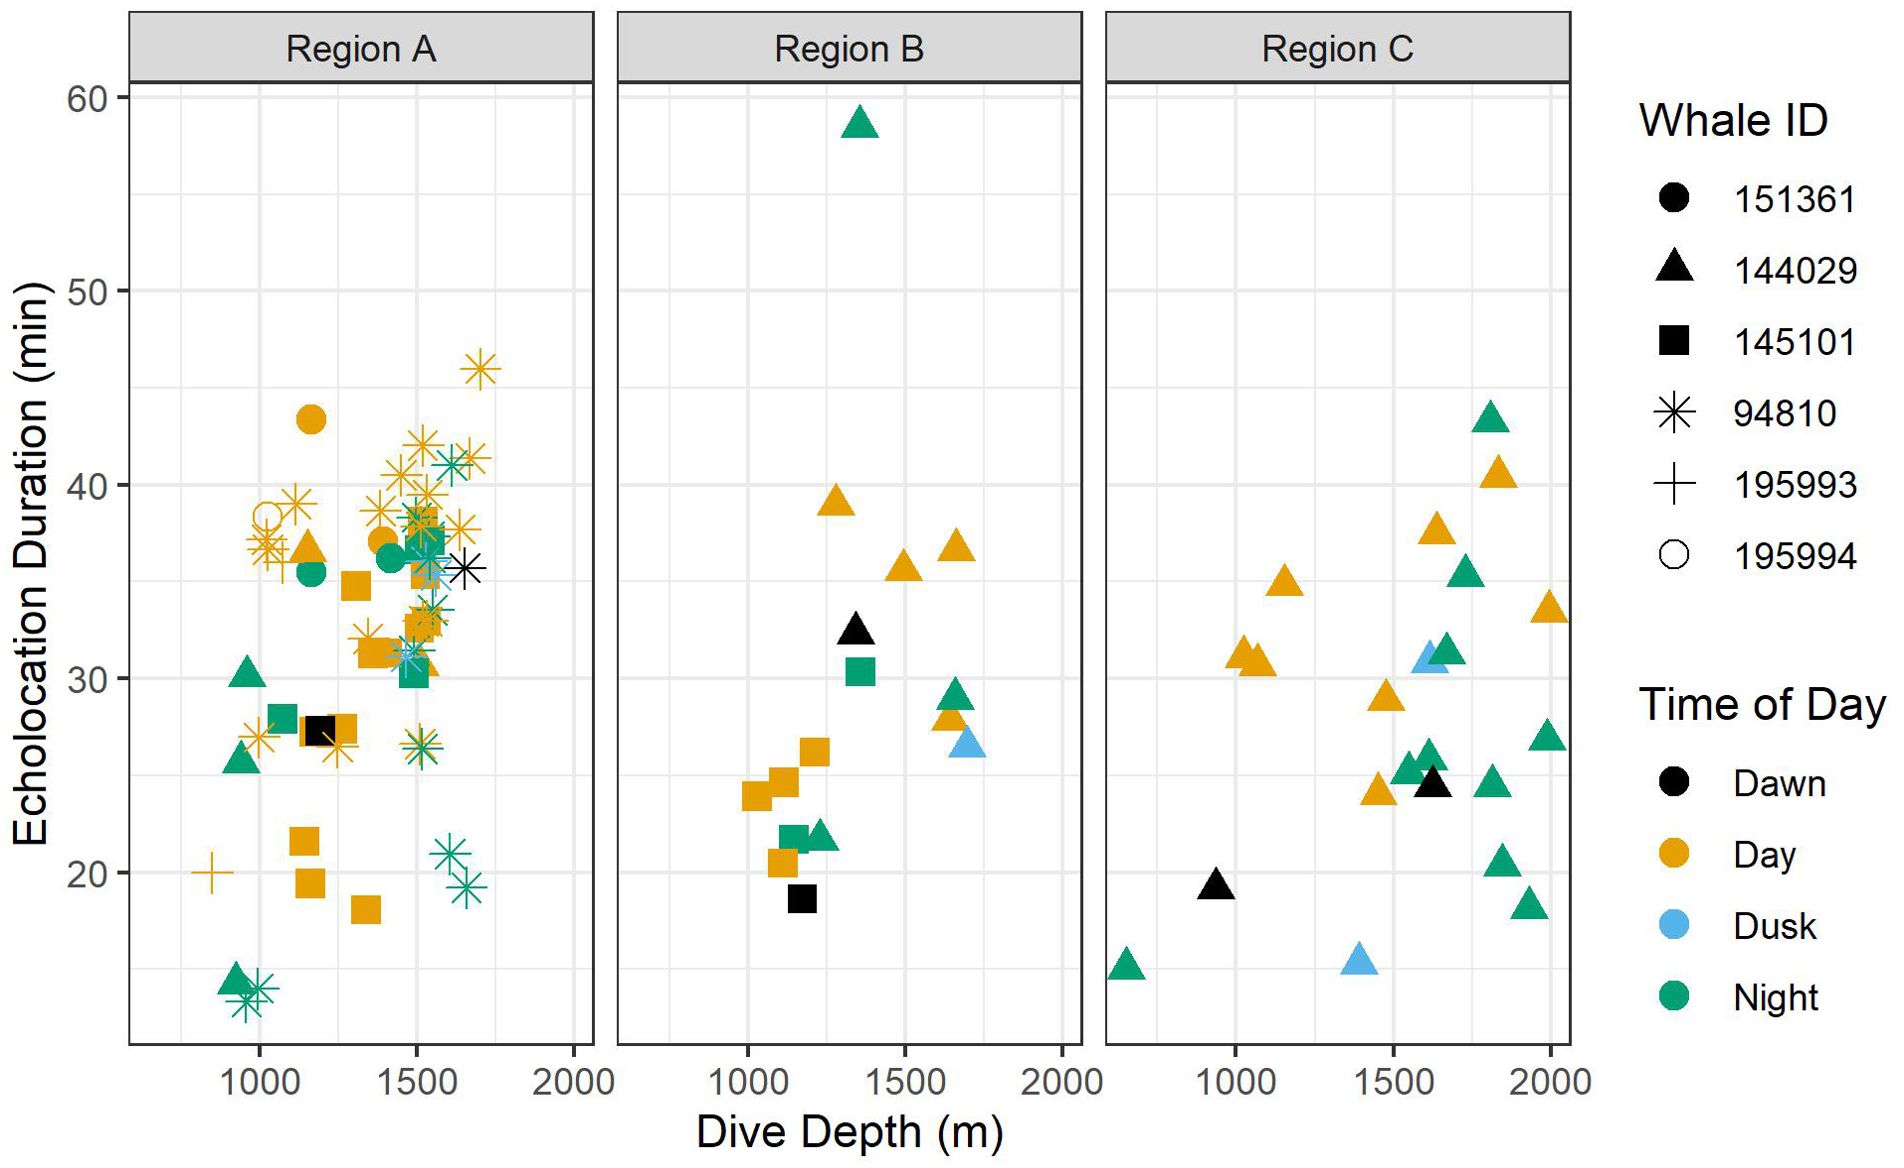
Figure 5. Scatter plots of echolocation duration by foraging dive depth. Colors indicate time of day, and shapes indicate whale ID. Data are displayed by oceanographic region.
3.3 Effects of oceanographic region
All foraging dives occurred within the greater Southern California Range Complex, with 61 dives in Region A (the San Nicolas Basin, from all six whales), 16 dives in Region B (from two whales), and 22 dives in Region C (one whale) (Figure 1; Supplementary Figure 3). In general, most observed metrics were similar in Regions A and B and more variable in Region C, where the shallowest (650 m), deepest (1,996 m), and longest (104 min) dives were all recorded. However, models suggested that while typically modest, a few notable regional differences do exist (Table 3). These included dive duration, with medians ranging from 68.2 min in Region A to 71.4 min in Region C (p-value ≤ 0.01; Supplementary Figure 3); echolocation duration, with medians ranging from 27.2 min in Region B to 33.5 min in Region A (p-value = 0.01; Figure 6); and echolocation end depth, with medians ranging from 1,548 m (deepest) in Region C to 1,127 m in Region A (p-value ≤ 0.01, Figure 6). Bottom phase echolocation depth IQRs were narrowest in Region C (p-value = 0.02; Figure 7), although only whale 144029 was recorded foraging in this region. Of the confirmed buzzes, 55% were identified in Region A (n = 1,122) with the majority of these recorded in the bottom phase.
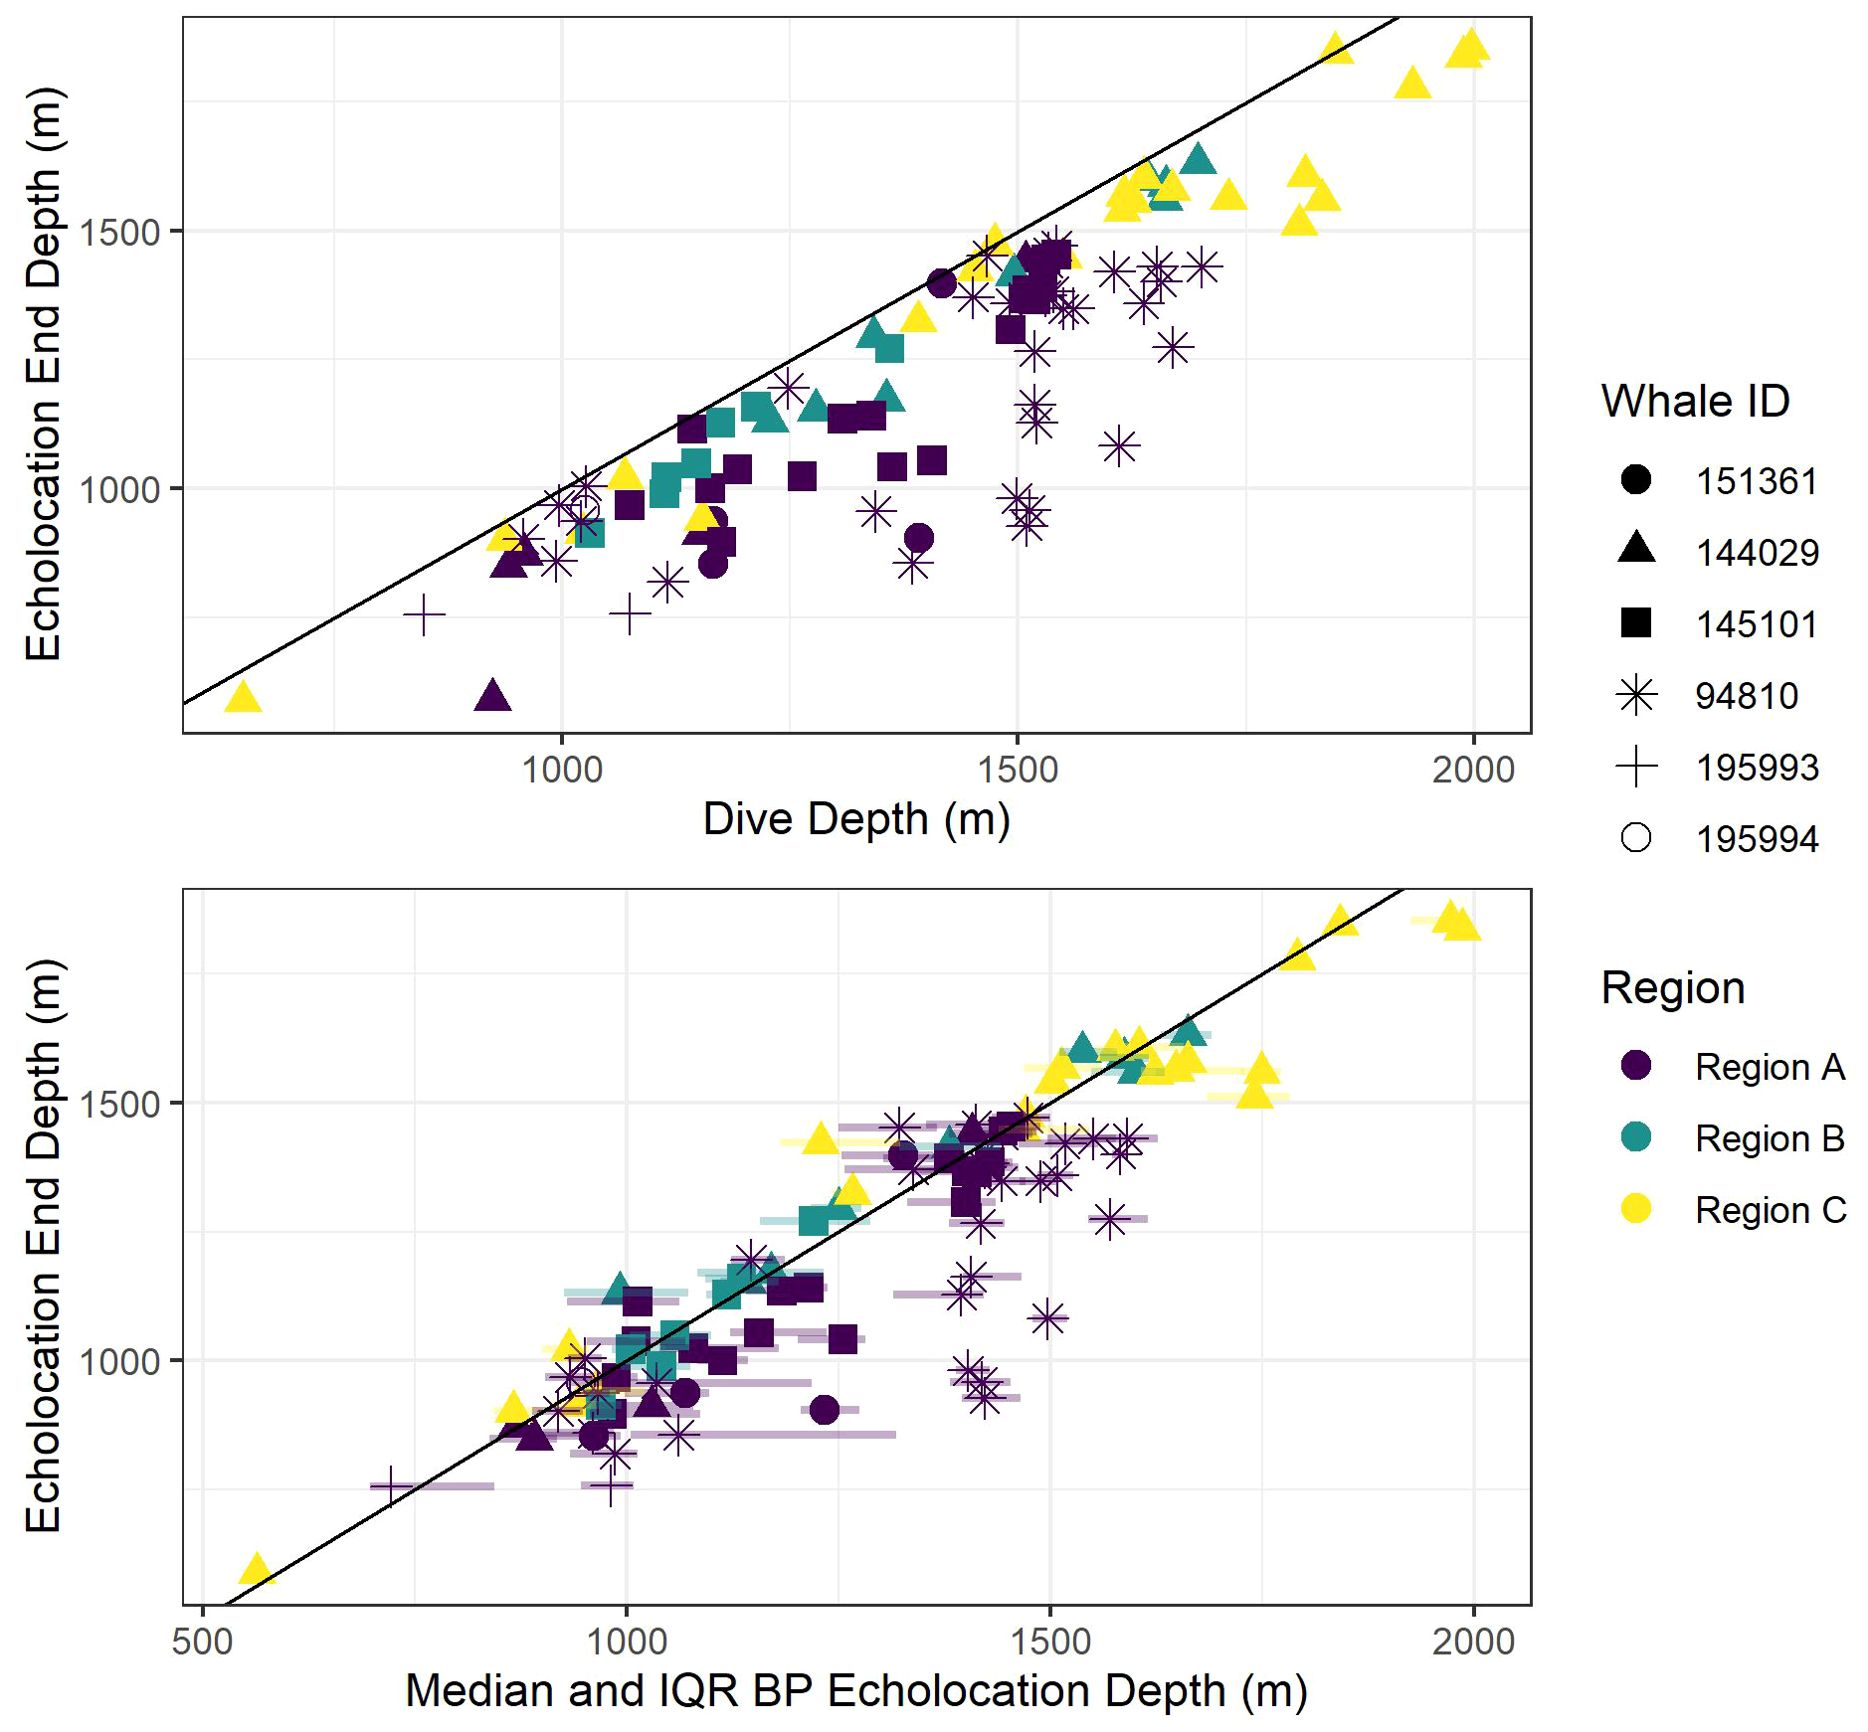
Figure 6. Scatter plot of echolocation end depths versus dive depth (top panel) and bottom phase (BP) echolocation depths (median and inter-quartile ranges (IQR; semi-transparent horizontal lines at each point stretching from 0.25 to 0.75 quantiles) bottom panel). The black diagonal line shows a 1:1 relationship between the axis variables to aid visual comparisons. Colors indicate oceanographic region, and shapes indicate whale ID.
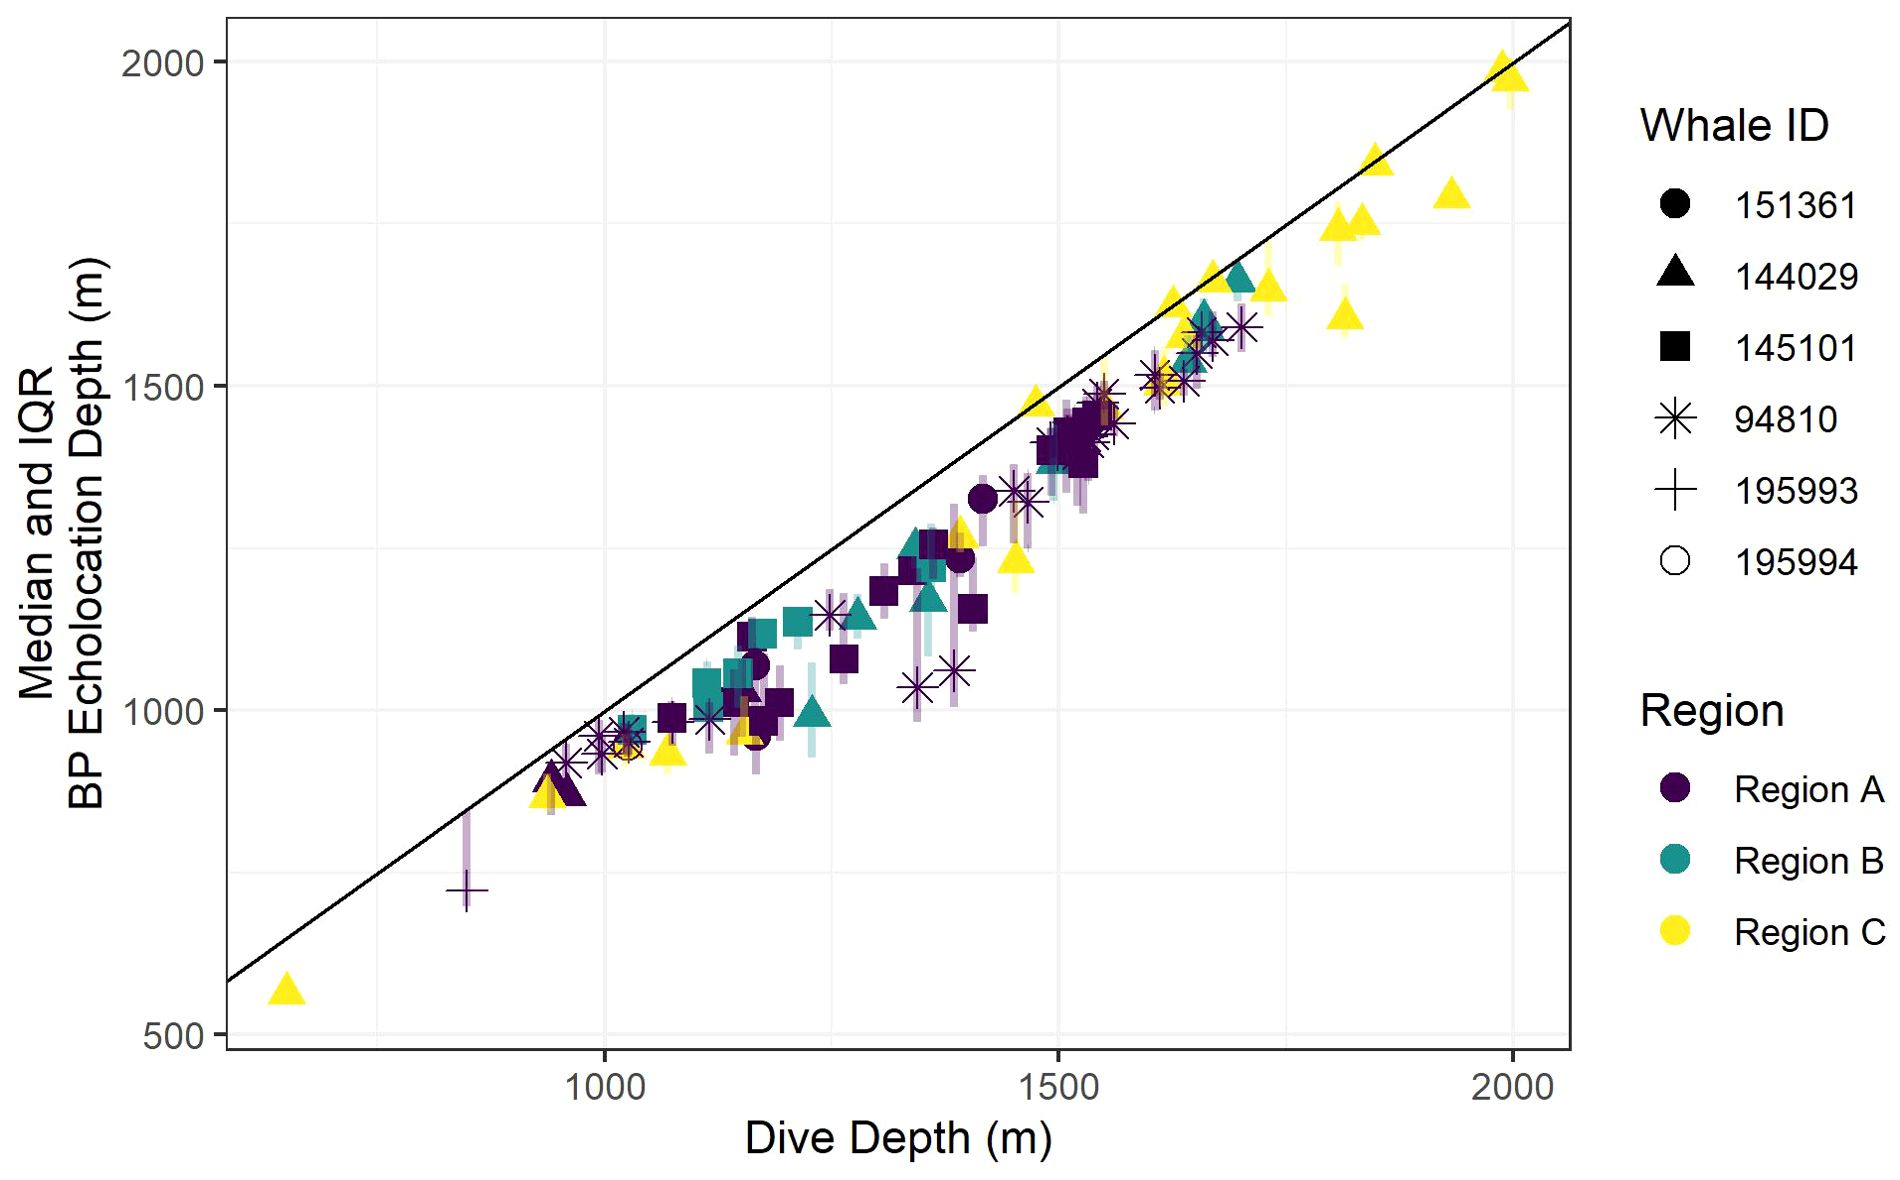
Figure 7. Scatter plot of median bottom phase (BP) echolocation depth (points) and inter-quartile ranges (IQR; semi-transparent vertical lines at each point stretching from 0.25 to 0.75 quantiles). The black diagonal line shows a 1:1 relationship between the axis variables to aid visualization of how far away from the seafloor (using dive depth as a proxy for bathymetric depth) whales tend to forage. Colors indicate oceanographic region, and shapes indicate whale ID.
3.4 Effects of dive depth
Models indicated strong positive relationships exist between dive depth and dive duration, echolocation duration, echolocation end depth, and bottom phase median echolocation depth (p-value ≤ 0.01; Table 3; Figure 8). The median difference between dive depth and bottom phase median echolocation depth was 98.3 m (IQR = 48.5; Figure 7), and the IQR of bottom phase echolocation depth itself had a median of 69.2 m (IQR = 50.3).
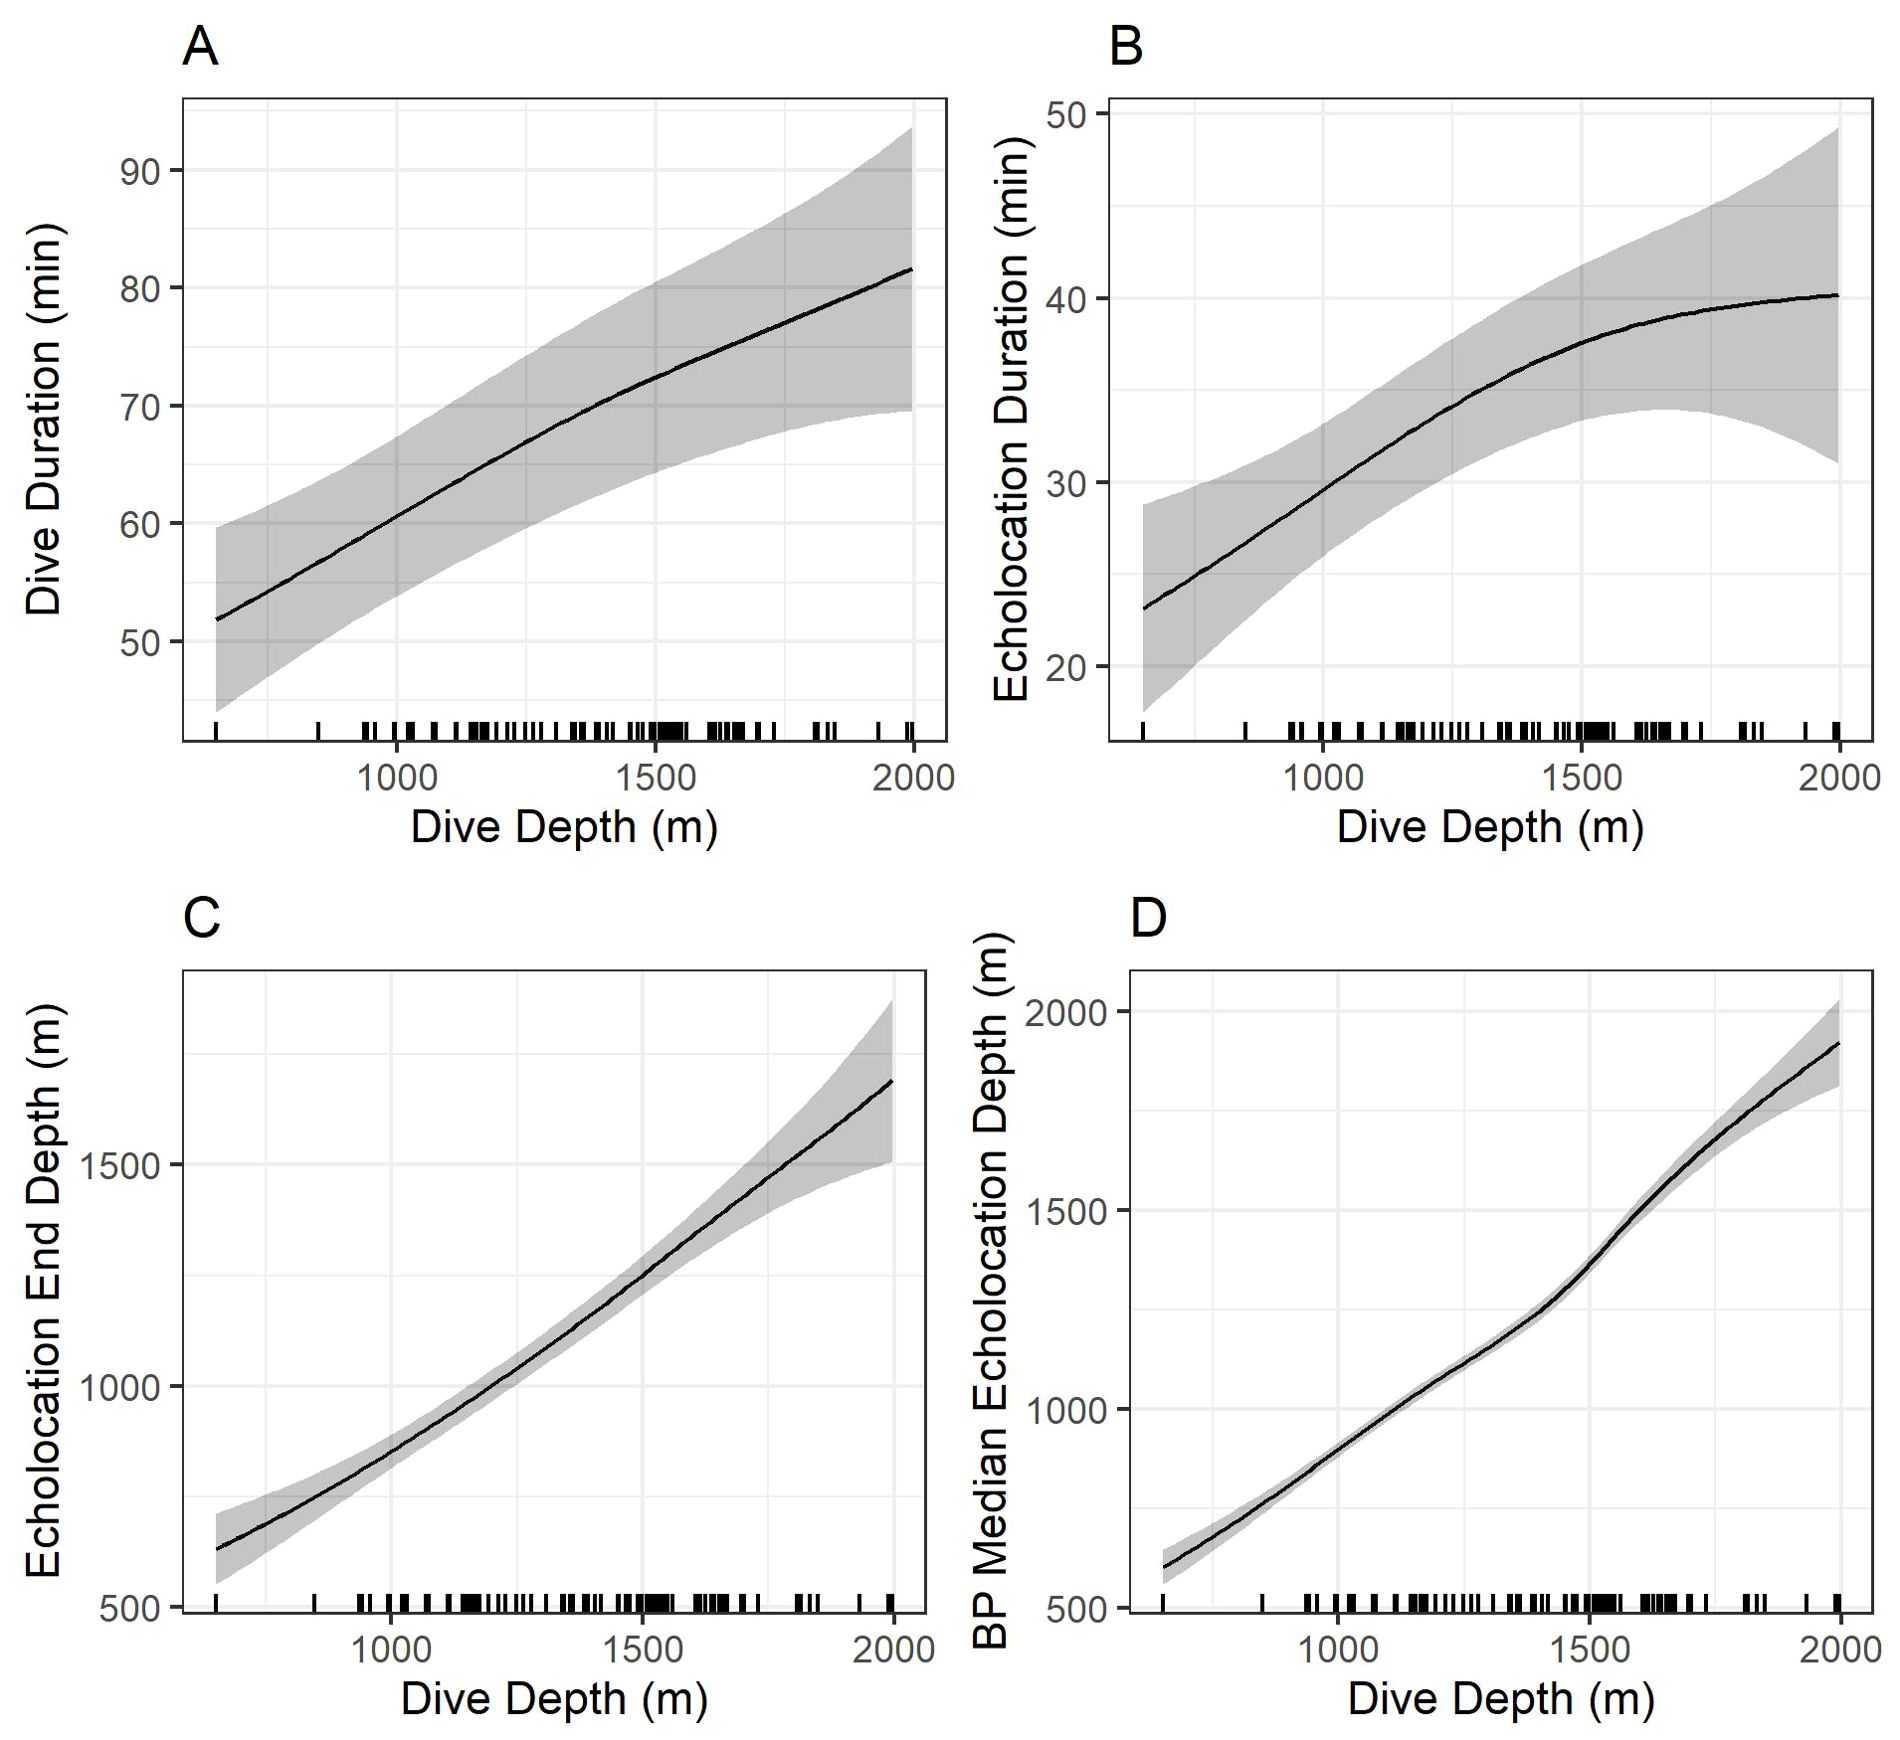
Figure 8. Model predictions showing the effects of foraging dive depth on dive duration (A), echolocation duration (B), echolocation end depth (C), and bottom phase echolocation depth (D) for which an association with dive depth was detected. Gray shading shows 95% confidence intervals. Marks along the x-axes show observed dive depths. Predictions were made by setting all other explanatory variables constant at the modal value. BP, bottom phase.
4 Discussion
The extended records of fine-scale behavioral data provided by the SMRT tags allowed us to both validate and expand upon the findings of prior studies of Z. cavirostris in Southern California and elsewhere. As with most prior tag deployments in this population, tagged individuals remained within the Southern California Range Complex, and primarily within the San Nicolas Basin (Region A) where they were tagged, with just one whale traveling into Mexican waters prior to the end of its deployment. However, the combination of detailed acoustic records and more accurate GPS location estimates over multiple days allowed us to investigate fine-scale foraging behavior over durations not previously possible, and to validate findings from previous work that have had to infer foraging effort in the absence of acoustic data (Schorr et al., 2014; Joyce et al., 2017; Shearer et al., 2019; Barlow et al., 2020).
4.1 Importance of benthic habitat
Prior studies using acoustic tags have found Z. cavirostris echolocate, and thus actively forage, at mean depths from 1,070 m (Ligurian Sea; Johnson et al., 2004; Tyack et al., 2006) to 1,420 m (Azores; Visser et al., 2021). In these regions, individuals started echolocating between 400-500 m and were more vocally active in their bottom phase highlighting the importance of mid-water/benthic habitat. Tyack et al. (2006) demonstrated that Z. cavirostris in the Ligurian Sea foraged in a broad layer from the mesopelagic to bathypelagic depths with a vocally active bottom phase. In the Azores, 60% of deep dives recorded were within 200 m of the seafloor and all dives that reached the bottom contained buzzes (Visser et al., 2021). In Southern California, prior studies suggested that benthic habitat was particularly important to foraging based on the strong relationship between maximum dive depth and the local bathymetry, despite the limitations of the technology (i.e., sparse, low-accuracy locations with very coarse dive shape) (Barlow et al., 2020). Using LIMPET tag data from Southern California, Barlow et al. (2020) inferred that animals spent the bottom phase of their dives foraging within 200 m of the seafloor in bathymetric depths less than 2,000 m. Our high-resolution diving and acoustic data confirm that active foraging typically occurs in a relatively narrow portion of the water column near the seafloor in this region (Figures 2, 7). Although buzzes were observed during the descent, they were almost twice as common in the bottom phase, suggesting that these whales may opportunistically pursue mid-water prey on their way to what appear to be preferred foraging depths nearer to the seafloor.
Z. cavirostris are known to be generalist predators that consume both schooling and solitary cephalopods, fish, and even crustaceans. Both Adams et al. (2015) and West et al. (2017) analyzed the stomach contents of stranded or bycaught Z. cavirostris (n = 1 and 16, respectively) in the North Pacific and found squid belonging to the family Gonatidae. In Southern California, the giant grenadier fish (Albatrossia pectoralis; family Macrouridae) has been reported contributing up to 12% of Z. cavirsotris prey mass (Adams et al., 2015; West et al., 2017). Giant grenadiers are the largest of the grenadiers, occurring along the continental slope from California through the Bering Sea to Japan at depths between 200 and 2,200 m (Novikov, 1970; Iwamoto and Stein, 1974). Juvenile and adult giant grenadiers are typically found near the bottom (Novikov, 1970) and are known to prey on cephalopods (Cranchiidae and Japatella sp.), with squid remains commonly found in their stomach contents (Pearcy and Ambler, 1974). Given that Z. cavirostris commonly forage in a narrow band (< 200 m) near the seafloor in our study area, this would suggest that much of their preferred prey occurs in the benthic zone, and that they may be targeting not only deepwater cephalopods, but large bottom fish that compete for the same cephalopod prey.
While direct studies of prey are virtually non-existent at the depths at which Z. cavirtostris forage, several lines of evidence support the importance of near-bottom habitat for this species. Visser et al. (2021) combined tagging and deepwater cephalopod eDNA sampling to suggest that deep diving predator species in the same region (in that case Z. cavirostris and G. griseus in the Azores) may niche partition not on different prey species, but by targeting different size classes of the same species in which larger individuals tend to migrate into deeper water. While the whales tagged in the Azores appeared to forage more broadly throughout the benthopelagic water column than whales in Southern California, many Z. cavirostris tagged there also reached the seafloor while foraging. Several studies using towed cameras to assess the seafloor (Woodside et al., 2006; Auster and Watling, 2010; Marsh et al., 2018) have described depressions in the seafloor that are theorized to be the result of foraging beaked whales interacting with the bottom sediment, presumably in pursuit of prey. This suggests that for species capable of foraging at such depths, the bottom may offer both larger prey and a potential prey handling advantage.
4.2 Time of day comparison
Previous studies have evaluated diel differences in diving patterns of Z. cavirostris and used these to infer changes in foraging throughout the day. Both Schorr et al. (2014) and Barlow et al. (2020) assessed diel patterns using LIMPET tags in Southern California and found deep, presumed foraging dives were slightly deeper and more frequent at night, noting that these findings were not consistent with foraging on vertically migrating prey. Z. cavirostris in the Bahamas, Hawai’i, and Cape Hatteras exhibited no changes in dive depths between day and night, suggesting preferred prey are not vertically migratory in those regions either (Baird et al., 2008; Joyce et al., 2017; Shearer et al., 2019). In our study regions, we found that whales began echolocating sooner and echolocated longer during the day than at night, regardless of how deep they ultimately went (Supplementary Figure 2); though these differences were noted, they were modest, on the order of a few minutes and tens of meters. These results support previous observations that whales are not feeding on vertically migrating prey here (Schorr et al., 2014; Barlow et al., 2020), though they may occasionally target mid-water prey on their way to their preferred foraging habitat near the bottom, where solar cycles have limited, if any, effect on their prey.
4.3 Regional comparison
Passive acoustic monitoring data from Southern California have detected a higher density of Z. cavirostris in the San Nicolas Basin compared to adjacent regions (Barlow and Schorr, 2018) and both tagging and photo-identification have suggested a high degree of individual residency to the region (Schorr et al., 2014; Curtis et al., 2020). One study, which used echosounders to collect prey density data within and adjacent to the Basin at depths up to 1,200 m over several days, detected high levels of spatial heterogeneity in deepwater prey layers (900 – 1,200 m) over relatively small scales (Benoit-Bird et al., 2016). Though these data did not reach the depths at which the whales in this study primarily foraged, the distribution of prey in the deepest sampling layers did generally reflect habitat use patterns of Z. cavirostris in this and prior work. In our study, whales exhibited longer echolocation durations, produced more echolocation pulses, had deeper echolocation start depths, and produced more buzzes in the bottom phase in the San Nicolas Basin than in adjacent regions. While data from outside the San Nicolas Basin are largely from a single whale (144029), these findings are consistent with whales targeting a reliable base of larger, more calorie-dense, but potentially more patchily distributed epibenthic prey in this area (Benoit-Bird et al., 2016). They typically bypass shallower layers that were detected in previous work, which may have higher numbers of smaller, more evenly distributed prey, in favor of more time searching at depth, ultimately with more total prey capture attempts than in adjacent regions. These findings also align with prior observations that whales in this basin are generally able to conduct fewer foraging dives per day to meet their nutritional needs (Schorr et al., 2014). This benefit would in turn explain recurrent use of this region despite the prevalence of anthropogenic acoustic disturbances (Barlow et al., 2020; Falcone et al., 2009; Curtis et al., 2020).
4.4 Individual variation
Another consideration when inferring behavior from a relatively small number of tags is the history of each tagged individual. This population has been the subject of a long-term photo-identification study since 2006 (Falcone et al., 2009; Curtis et al., 2020). Every whale but one, tag 144029, had a multi-year sighting history in the San Nicolas Basin. Tag 144029 was only sighted on the day it was tagged and based on its appearance, it was considerably younger than the other whales, presumed to be an older juvenile or very young subadult. This was the only whale to travel a significant distance south into Mexican waters, suggesting this whale was not a member of the resident population, and the San Nicolas Basin was unlikely to be its core habitat.
Perhaps unsurprisingly, the data from tag 144029 while outside the San Nicolas Basin included the most extreme observations in the study. This individual had the deepest dive, the longest dive duration, the greatest number of pulses in a single foraging dive, and the shallowest depth at which echolocation started. This whale also had the largest proportion of unusually shaped dive profiles, with some dives having descents that were interrupted seemingly by prey searching at depths shallower than the bottom phase before later resuming descents. Similarly, this whale had a more unusual distribution of pulse and buzz depths (Figure 3). Almost all of the foraging dives that had more pulses during the descent than the bottom phase came from this whale (Figure 4). Excluding this whale, 88.9% (56/63) of dives had more than 50% of their pulses during the bottom phase. This tendency to echolocate on descent may reflect foraging in midwater prey layers or a lack of familiarity with the habitat in which the whale was foraging, both within the San Nicolas Basin, relative to the more resident tagged whales that routinely forage there, and also as this whale moved into new habitat each day while traveling south. It also demonstrates the effect of defining the bottom phase as a function of typical echolocation patterns of whales foraging at the bottom of a relatively flat basin, and then applying it to a whale that is traveling through and foraging in very different habitat.
Another whale with notably different foraging habits was tag 145101, the only adult female in the dataset, who was associated with an older calf (estimated 2-3 years of age) at the time of tagging. Among the three whales with more than 120 h of data, her dives and echolocation periods were the shortest and shallowest, in part because she tended to remain in shallower habitat (Figure 1), but her median pulses per dive was slightly higher than the other two whales (Table 2). Though the weaning behavior of beaked whales is virtually unknown, and the close-range conspecific pulses detected on this tag were likely from the calf who was presumably also foraging nearby, this whale may have been lactating and had higher metabolic demands than the other whales in the study. While these observations are from a single animal over a relatively short period and should be treated with caution, they may suggest female beaked whales with attendant calves face the distinct challenge of maximizing their caloric intake while minimizing the demands of longer and deeper dives on their dependent offspring. This conflict is particularly relevant here, given foraging in this population is regularly disrupted by use of MFAS, and that when exposed, whales often conduct unusually long dives followed by unusually long periods of foraging disruption (Falcone et al., 2017). This example underscores the importance, and unique vulnerability, of mothers and calves in Population Consequences of Disturbance models, which seek to predict the long-term demographic effects of MFAS use on chronically exposed populations, since MFAS response potentially pushes the already constrained limits of both mother and calf (New et al., 2013; Booth et al., 2020).
5 Conclusion
The SMRT tags, with acoustic recordings over longer durations, have provided the first opportunity to assess the diving and vocal behavior of foraging Z. cavirostris within the Southern California Range Complex during periods without sonar use. Many of our findings confirm assumptions and expand upon observations of previous work, while also providing better resolution and new insights into factors that influence foraging locally. Key among these is the importance of near bottom habitat, particularly within the San Nicolas Basin. To the extent that fine scale prey metrics are necessary to model the effects of sonar exposure in this population (e.g., Southall et al., 2019), accurate measurements of prey species, size, and density within 200 m of the bottom are required, though they remain difficult to obtain with existing technology.
Our findings also underscore the importance of not only habitat but also individual life history in behavioral work with this species. There was considerable variation in all behavioral metrics within and among individuals even in the absence of military sonar, which is a known source of behavioral disruption. Accounting for age, sex, and prior exposure history may all be key in understanding response patterns of whales in this busy training area. Finally, the large samples of individual echolocation pulse rate data from these whales are valuable inputs to acoustic density estimates, which remain one of the best ways to assess beaked whale prevalence over large spatial areas.
Data availability statement
The raw data supporting the conclusions of this article will be made available by the authors, without undue reservation.
Ethics statement
The animal study was approved by U.S. National Marine Fisheries permits No. 20465 and 21163 and Marine Ecology and Telemetry Research Institutional Animal Care and Use protocols METR-AUP-2019-01. The study was conducted in accordance with the local legislation and institutional requirements.
Author contributions
SC: Writing – original draft, Writing – review & editing, Conceptualization, Data curation, Formal Analysis, Investigation, Methodology, Visualization. DS: Writing – original draft, Writing – review & editing, Conceptualization, Data curation, Formal Analysis, Investigation, Methodology, Software, Visualization. EF: Writing – original draft, Writing – review & editing. SW: Writing – original draft, Writing – review & editing. BR: Writing – original draft, Writing – review & editing. SD: Writing – original draft, Writing – review & editing. JB: Writing – original draft, Writing – review & editing. KD: Writing – original draft, Writing – review & editing. RM: Writing – original draft, Writing – review & editing. ND: Writing – original draft, Writing – review & editing. SJ: Writing – original draft, Writing – review & editing. RA: Writing – original draft, Writing – review & editing. GS: Writing – original draft, Writing – review & editing.
Funding
The author(s) declare financial support was received for the research, authorship, and/or publication of this article. Funding for fieldwork and tags was provided by the U.S. Navy Living Marine Resources Program (awards N3943016C1870 and N3943017C1985). Additional analysis support provided by the US Navy Pacific Fleet (award N6660422DF200. Development of the SMRT tag was funded by the Office of Naval Research.
Acknowledgments
We would like to thank the U.S. Navy Living Marine Resources program, Anu Kumar and Mandy Shoemaker in particular. We also thank the U.S. Navy Pacific Fleet for supporting analysis (Chip Johnson and Jessica Chen), and the Office of Naval Research (Michael Weise) for supporting the SMRT tag development. Development of the SMRT tag was a collaboration between Mark Johnson and many members of the team at Wildlife Computers. We thank our collaborators from the Marine Mammal Monitoring on Navy Ranges program at the Naval Undersea Warfare Center. Essential logistical support during field work operations was provided by the staff of the Southern California Tactical Training Range and personnel on San Clemente Island. We thank Frank and Jane Falcone for supporting our field operations. This study was conducted under U.S. National Marine Fisheries permits No. 20465 and 21163 and Marine Ecology and Telemetry Research Institutional Animal Care and Use protocols METR-AUP-2019-01.
Conflict of interest
The authors declare that the research was conducted in the absence of any commercial or financial relationships that could be construed as a potential conflict of interest.
Publisher’s note
All claims expressed in this article are solely those of the authors and do not necessarily represent those of their affiliated organizations, or those of the publisher, the editors and the reviewers. Any product that may be evaluated in this article, or claim that may be made by its manufacturer, is not guaranteed or endorsed by the publisher.
Supplementary material
The Supplementary Material for this article can be found online at: https://www.frontiersin.org/articles/10.3389/fmars.2024.1415602/full#supplementary-material
Supplementary Figure 1 | Image 1 - Scatter plot of echolocation start depth by echolocation end depth. Colors indicate dive depth, and shapes indicate whale ID. The red horizontal line indicates the median dive depth.
Supplementary Figure 2 | Image 2 - Scatter plot of echolocation start depth as a function of dive depth. Colors indicate time of day, and shapes indicate whale ID. The red vertical line indicates the median dive depth.
Supplementary Figure 3 | Image 3 - Scatter plot of foraging dive depth by dive duration. Colors indicate oceanographic region, and shapes indicate whale ID. The red vertical line indicates the median dive depth.
References
Adams J., Walker W. A., Burton E. J., Harvey J. T. (2015). Stomach contents of a Cuvier’s beaked whale (Ziphius cavirostris) stranded in Monterey Bay, California. Northwestern Nat. 96, 93–98. doi: 10.1898/NWN14-10.1
Aguilar Soto N., Johnson M., Madsen P. T., Tyack P. L., Bocconcelli A., Borsani J. F. (2006). Does intense ship noise disrupt foraging in deep-diving Cuvier’s beaked whales (Ziphius cavirostris)? Mar. Mammal Sci. 22, 690–699. doi: 10.1111/j.1748-7692.2006.00044.x
Alcázar-Treviño J., Johnson M., Arranz P., Warren V. E., Pérez-González C. J., Marques T., et al. (2021). Deep-diving beaked whales dive together but forage apart. Proc. R. Soc. B. 288, 20201905. doi: 10.1098/rspb.2020.1905
Andrews R. D., Baird R. W., Calambokidis J., Goertz C. E. C., Gulland F. M. D., Heide-Jørgensen M. P., et al. (2019). Best practice guidelines for cetacean tagging. J. Cetacean Res. Manage. 20, 27–66. doi: 10.47536/jcrm.v20i1
Andrews R. D., Pitman R. L., Ballance L. T. (2008). Satellite tracking reveals distinct movement patterns for Type B and Type C killer whales in the southern Ross Sea, Antarctica. Polar Biol. 31, 1461–1468. doi: 10.1007/s00300-008-0487-z
Auster P., Watling L. (2010). Beaked whale foraging areas inferred by gouges in the seafloor. Mar. Mammal Sci. 26, 226–233. doi: 10.1111/mms.2010.26.issue-1
Baird R. W., Webster D. L., McSweeney D. J., Ligon A. D., Schorr G. S., Barlow J. (2006). Diving behaviour of Cuvier’s (Ziphius cavirostris) and Blainville’s (Mesoplodon densirostris) beaked whales in Hawai’i. Can. J. Zool. 84, 1120–1128. doi: 10.1139/z06-095
Baird R. W., Webster D. L., Schorr G. S., McSweeney D. J., Barlow J. (2008). Diel variation in beaked whale diving behavior. Mar. Mammal Sci. 24, 630–642. doi: 10.1111/j.1748-7692.2008.00211.x
Balcomb K. C. III, Claridge D. E. (2001). A mass stranding of cetaceans caused by naval sonar in the Bahamas. Bahamas J. Sci. 8, 2–12.
Barlow J., Schorr G. (2018). Drifting acoustic spar buoy recorder (DASBR) deployments in the san nicolas basin in january 2018 (U.S. Department of Commerce), NOAA Technical Memorandum NMFS-SWFSC-595. doi: 10.7289/V5/TM-SWFSC-598
Barlow J., Schorr G. S., Falcone E. A., Moretti D. (2020). Variation in dive behavior of Cuvier’s beaked whales with seafloor depth, time-of-day, and lunar illumination. Mar. Ecol. Prog. Ser. 644, 199–214. doi: 10.3354/meps13350
Baumann-Pickering S., McDonald M. A., Simonis A. E., Solsona Berga A., Merkens K. P., Oleson E. M., et al. (2013). Species-specific beaked whale echolocation signals. J. Acoust. Soc. Am. 134, 2293–2301. doi: 10.1121/1.4817832
Benoit-Bird K. J., Southall B. L., Moline M. A. (2016). Predator-guided sampling reveals biotic structure in the bathypelagic. Proc. R. Soc. B: Bio. Sci. 283, 20152457. doi: 10.1098/rspb.2015.2457
Booth C. G., Sinclair R. R., Harwood J. (2020). Methods for monitoring for the population consequences of disturbance in marine mammals: a review. Front. Mar. Sci. 7, 115. doi: 10.3389/fmars.2020.00115
Cox T. M., Ragen T. J., Read A. J., Vos E., Baird R. W., Balcomb K., et al. (2005). Understanding the impacts of anthropogenic sound on beaked whales. J. Cetacean Res. Manage. 7, 177–187. doi: 10.47536/jcrm.v7i3
Curtis K. A., Falcone E. A., Schorr G. S., Moore J. E., Moretti D. J., Barlow J., et al. (2020). Abundance, survival, and annual rate of change of Cuvier’s beaked whales (Ziphius cavirostris) on a Navy sonar range. Mar. Mammal Sci. 37 (2), 399–419. doi: 10.1111/mms.12747
DeRuiter S. L., Southall B. L., Calambokidis J., Zimmer W. M., Sadykova D., Falcone E. A., et al. (2013). First direct measurements of behavioural responses by Cuvier’s beaked whales to mid-frequency active sonar. Biol. Lett. 9, 20130223. doi: 10.1098/rsbl.2013.0223
Dujon A. M., Lindstrom T., Hays G. C. (2014). The accuracy of Fastloc-GPS locations and implications for animal tracking. Methods Eco. Evol. 5, 1162–1169. doi: 10.1111/2041-210X.12286
Falcone E. A., Schorr G. S., Douglas A. B., Calambokidis J., Henderson E., McKenna M. F., et al. (2009). Sighting characteristics and photo-identification of Cuvier’s beaked whales (Ziphius cavirostris) near San Clemente Island, California: a key area for beaked whales and the military? Mar. Biol. 156, 2631–2640. doi: 10.1007/s00227-009-1289-8
Falcone E. A., Schorr G. S., Watwood S. L., DeRuiter S. L., Zerbini A. N., Andrews R. D., et al. (2017). Diving behaviour of Cuvier’s beaked whales exposed to two types of military sonar. R. Soc. Open Sci. 4, 170629. doi: 10.1098/rsos.170629
Fernández A., Edwards J. F., Rodriguez F., Espinosa de los Monteros A., Herráez P., Castro P., et al. (2005). “Gas and fat embolic syndrome” involving a mass stranding of beaked whales (family Ziphiidae) exposed to anthropogenic sonar signals. Vet. Pathol. 42, 446–457. doi: 10.1354/vp.42-4-446
Filadelfo R., Mintz J., Michlovich E., D’Amico A., Tyack P. L., Ketten D. R. (2009). Correlating military sonar use with beaked whale mass strandings: What do the historical data show? Aquat. Mamm. 35, 435–444. doi: 10.1578/AM.35.4.2009.435
Gillespie D., Gordon J., McHugh R., McLaren D., Mellinger D. K., Redmond P., et al. (2009). PAMGUARD: Semiautomated, open-source software for real-time acoustic detection and vocalization of cetaceans. J. Acoust. Soc. Am. 125, 2547. doi: 10.1121/1.4808713
Iwamoto T., Stein D. L. (1974). A systematic review of the rattail fishes (Macrouridae: gadiformes) from Oregon and adjacent waters. Occas. Pap. Calif. Acad. Sci. 111, 1–79. doi: 10.5962/bhl.part.15932
Jarvis S. M., DiMarzio N., Watwood S., Dolan K., Morrissey R. (2022). Automated detection and classification of beaked whale buzzes on bottom-mounted hydrophones. Front. Remote Sens. 3, 941838. doi: 10.3389/frsen.2022.941838
Johnson M., Aguilar de Soto N., Madsen P. T. (2009). Studying the behaviour and sensory ecology of marine mammals using acoustic recording tags: a review. Mar. Ecol. Prog. Ser. 395, 55–73. doi: 10.3354/meps08255
Johnson M., Madsen P. T., Zimmer W. M., Aguilar de Soto N., Tyack P. L. (2006). Foraging Blainville’s beaked whales (Mesoplodon densirostris) produce distinct click types matched to different phases of echolocation. J. Exp. Biol. 209, 5038–5050. doi: 10.1242/jeb.02596
Johnson M., Madsen P. T., Zimmer W. M., Aguilar de Soto N., Tyack P. L. (2004). Beaked whales echolocate on prey. Proc. Biol. Sci. 271, S383–S386. doi: 10.1098/rsbl.2004.0208
Johnson M., Partan J., Hurst T. (2013). Low complexity lossless compression of underwater sound recordings. J. Acoust. Soc. Am. 133, 1387–1398. doi: 10.1121/1.4776206
Joyce T. W., Durban J. W., Claridge D. E., Dunn C. A., Fearnbach H., Parsons K. M., et al. (2017). Physiological, morphological, and ecological tradeoffs influence vertical habitat use of deep-diving toothed-whales in the Bahamas. PloS One. 12, e0185113. doi: 10.1371/journal.pone.0185113
Kelley D., Richards C. (2021). Oce: Analysis of Oceanographic Data. R package version 1.4-0. Available online at: https://CRAN.R-project.org/package=oce.
Madsen P. T., Aguilar de Soto N., Arranz P., Johnson M. (2013). Echolocation in Blainville’s beaked whales (Mesoplodon densirostris). J. Comp. Physiol. A. 199, 451–469. doi: 10.1007/s00359-013-0824-8
Madsen P. T., Johnson M., Aguilar de Soto N., Zimmer W. M., Tyack P. (2005). Biosonar performance of foraging beaked whales (Mesoplodon densirostris). J. Exp. Biol. 208, 181–194. doi: 10.1242/jeb.01327
Marsh L., Huvenne V. A., Jones D. O. (2018). Geomorphological evidence of large vertebrates interacting with the seafloor at abyssal depths in a region designated for deep-sea mining. R. Soc. Open Sci. 5, 180286. doi: 10.1098/rsos.180286
Miller P. J., Johnson M. P., Tyack P. L. (2004). Sperm whale behaviour indicates the use of echolocation click buzzes ‘creaks’ in prey capture. Proc. R. Soc. B. 271, 2239–2247. doi: 10.1098/rspb.2004.2863
New L. F., Moretti D. J., Hooker S. K., Costa D. P., Simmons S. E. (2013). Using energetic models to investigate the survival and reproduction of beaked whales (family Ziphiidae). PloS One. 8, e68725. doi: 10.1371/journal.pone.0068725
Novikov N. P. (1970). Biology of Chalinura pectoralis in the North Pacific. Soviet fisheries investigations in the Northeastern Pacific. Part V (in Russian). All-Union Sci. Res. Institute Mar. Fisheries Oceanography (VNIRO) Proc. 70, 304–331.
Pearcy W. G., Ambler J. W. (1974). Food habits of deep-sea macrourid fishes off the Oregon coast. Deep Sea Res. Part 1 Oceanogr. Res. 21, 745–759. doi: 10.1016/0011-7471(74)90081-3
Rogers A. D., Lavelle A., Baird R. W., Bender A., Borroni A., Hinojasa G. C., et al. (2024). A call to rename Ziphius cavirostris the goose-beaked whale: promoting inclusivity and diversity in marine mammalogy by re-examining common names. Mar. Mam Sci. 40, e13150. doi: 10.1111/mms.13150
Sakai T. (2020). PAMpal: Load and Process Passive Acoustic Data. R package version 0.9.10. Available online at: https://cran.r-project.org/web/packages/PAMpal/index.html.
Schorr G. S., Falcone E. A., Moretti D. J., Andrews R. D. (2014). First long-term behavioral records from Cuvier’s beaked whales (Ziphius cavirostris) reveal record-breaking dives. PloS One. 9, e92633. doi: 10.1371/journal.pone.0092633
Shearer J. M., Quick N. J., Cioffi W. R., Baird R. W., Webster D. L., Foley H. J., et al. (2019). Diving behaviour of Cuvier’s beaked whales (Ziphius cavirostris) off Cape Hatteras, North Carolina. R. Soc. Open Sci. 6, 181728. doi: 10.1098/rsos.181728
Simmonds M. P., Lopez-Jurado L. F. (1991). Whales and the military. Nature. 351, 448–448. doi: 10.1038/351448a0
Simpson G. (2021). _gratia: Graceful ggplot-Based Graphics and Other Functions for GAMs Fitted using mgcv. R package version 0.7.3. Available online at: https://gavinsimpson.github.io/gratia/.
Southall B. L., Benoit-Bird K. J., Moline M. A., Moretti D. (2019). Quantifying deep-sea predator–prey dynamics: Implications of biological heterogeneity for beaked whale conservation. J. Appl. Ecol. 56, 1040–1049. doi: 10.1111/1365-2664.13334
Sweeney D. A., Schorr G. S., Falcone E. A., Rone B. K., Andrews R. D., Coates S. N., et al. (2022). Cuvier’s beaked whale foraging dives identified via machine learning using depth and triaxial acceleration. Mar. Ecol. Prog. Ser. 692, 195–208. doi: 10.3354/meps14068
Tyack P. L., Johnson M., Aguilar Soto N., Sturlese A., Madsen P. T. (2006). Extreme diving of beaked whales. J. Exp. Biol. 209, 4238–4253. doi: 10.1242/jeb.02505
Visser F., Merten V. J., Bayer T., Oudejans M. G., de Jonge D. S. W., Puebla O., et al. (2021). Deep-sea predator niche segregation revealed by combined cetacean biologging and eDNA analysis of cephalopod prey. Sci. Adv. 7, eabf5908. doi: 10.1126/sciadv.abf5908
Waring G. T., Hamazaki T., Sheehan D., Wood G., Baker S. (2001). Characterization of beaked whale (Ziphiidae) and sperm whale (Physeter macrocephalus) summer habitat in shelf-edge and deeper waters off the northeast US. Mar. Mammal Sci. 17, 703–717. doi: 10.1111/j.1748-7692.2001.tb01294.x
Warren V. E., Marques T. A., Harris D., Thomas L., Tyack P. L., Aguilar de Soto N., et al. (2017). Spatio-temporal variation in click production rates of beaked whales: Implications for passive acoustic density estimation. J. Acoust. Soc. Am. 141, 1962–1974. doi: 10.1121/1.4978439
West K. L., Walker W. A., Baird R. W., Mead J. G., Collins P. W. (2017). Diet of Cuvier’s beaked whales (Ziphius cavirostris) from the North Pacific and a comparison with their diet world-wide. Mar. Ecol. Prog. Ser. 574, 227–242. doi: 10.3354/meps12214
Wood S. N. (2011). Fast stable restricted maximum likelihood and marginal likelihood estimation of semiparametric generalized linear models. J. R. Stat. Soc. Ser. B (Stat Methodol). 73, 3–36. doi: 10.1111/j.1467-9868.2010.00749.x
Woodside J. M., David L., Frantzis A., Hooker S. K. (2006). Gouge marks on deep-sea mud volcanoes in the eastern Mediterranean: Caused by Cuvier’s beaked whales? Deep-Sea Res. 53, 1762–1771. doi: 10.1016/j.dsr.2006.08.011
Keywords: goose-beaked whale, Cuvier’s beaked whale, tagging, diving behavior, acoustic behavior, echolocation, foraging behavior, Southern California Bight (USA)
Citation: Coates SN, Sweeney DA, Falcone EA, Watwood SL, Rone BK, DeRuiter SL, Barlow J, Dolan KA, Morrissey RP, DiMarzio NA, Jarvis SM, Andrews RD and Schorr GS (2024) Insights into foraging behavior from multi-day sound recording tags on goose-beaked whales (Ziphius cavirostris) in the Southern California Bight. Front. Mar. Sci. 11:1415602. doi: 10.3389/fmars.2024.1415602
Received: 10 April 2024; Accepted: 05 August 2024;
Published: 04 September 2024.
Edited by:
Xuelei Zhang, Ministry of Natural Resources, ChinaReviewed by:
Annamaria DeAngelis, Northeast Fisheries Science Center (NOAA), United StatesAndrew Read, Duke University, United States
Copyright © 2024 Coates, Sweeney, Falcone, Watwood, Rone, DeRuiter, Barlow, Dolan, Morrissey, DiMarzio, Jarvis, Andrews and Schorr. This is an open-access article distributed under the terms of the Creative Commons Attribution License (CC BY). The use, distribution or reproduction in other forums is permitted, provided the original author(s) and the copyright owner(s) are credited and that the original publication in this journal is cited, in accordance with accepted academic practice. No use, distribution or reproduction is permitted which does not comply with these terms.
*Correspondence: Shannon N. Coates, c2NvYXRlc0BtYXJlY290ZWwub3Jn