
94% of researchers rate our articles as excellent or good
Learn more about the work of our research integrity team to safeguard the quality of each article we publish.
Find out more
METHODS article
Front. Mar. Sci., 20 August 2024
Sec. Ocean Observation
Volume 11 - 2024 | https://doi.org/10.3389/fmars.2024.1415374
This article is part of the Research TopicBest Practices in Ocean ObservingView all 85 articles
 Carlo Mantovani1*
 Jay Pearlman2
 Anna Rubio3
 Rachel Przeslawski4
 Mark Bushnell5
 Pauline Simpson6
 Lorenzo Corgnati1
 Enrique Alvarez7
 Simone Cosoli8
 Hugh Roarty9
Ocean practices, intended as a wide spectrum of methodologies supporting ocean-related research, operations, and applications, are constantly developed and improved to enable informed decision-making. Practices start from the idea of an individual or a group and often evolve towards what can be called good or best practices. This bottom-up approach may in principle result in different paths for the evolution of each practice, and ultimately generate situations where it is not clear to a new user how to compare two practices aiming at the same objective, and determine which one is best. Also, although a best practice is supposed to be the result of a multi-institutional collaborative effort based on the principles of evidence, repeatability and comparability, a set of individual requirements is not yet defined in literature for a practice to be considered a good, better, and ultimately a best practice. This paper proposes a method for addressing those questions and presents a new maturity model for ocean practices, built upon existing maturity models for systems and software, developed and adopted in the last decades. The model provides attributes for assessing both the maturity of the practice description and its implementation. It also provides a framework for analyzing gaps and suggesting actions for practice evolution. The model has been tested against a series of widely adopted practices and the results are reported and discussed. This work facilitates a common approach for developing and assessing practices, from which greater interoperability and trust can be achieved.
A best practice has been defined as a “methodology that has repeatedly produced superior results relative to other methodologies with the same objective; to be fully elevated to a best practice, a promising method will have been adopted and employed by multiple organizations” (Pearlman et al., 2019).
Best practices provide significant benefits, and the use of shared and well-documented methods support global and regional interoperability across the value chain, from requirement setting, through observations, to data management and ultimately to the end user applications and societal impacts (Figure 1). By offering transparency, best practices engender trust in data and information. They facilitate capacity development through their documentation. They further maintain provenance for data and information.
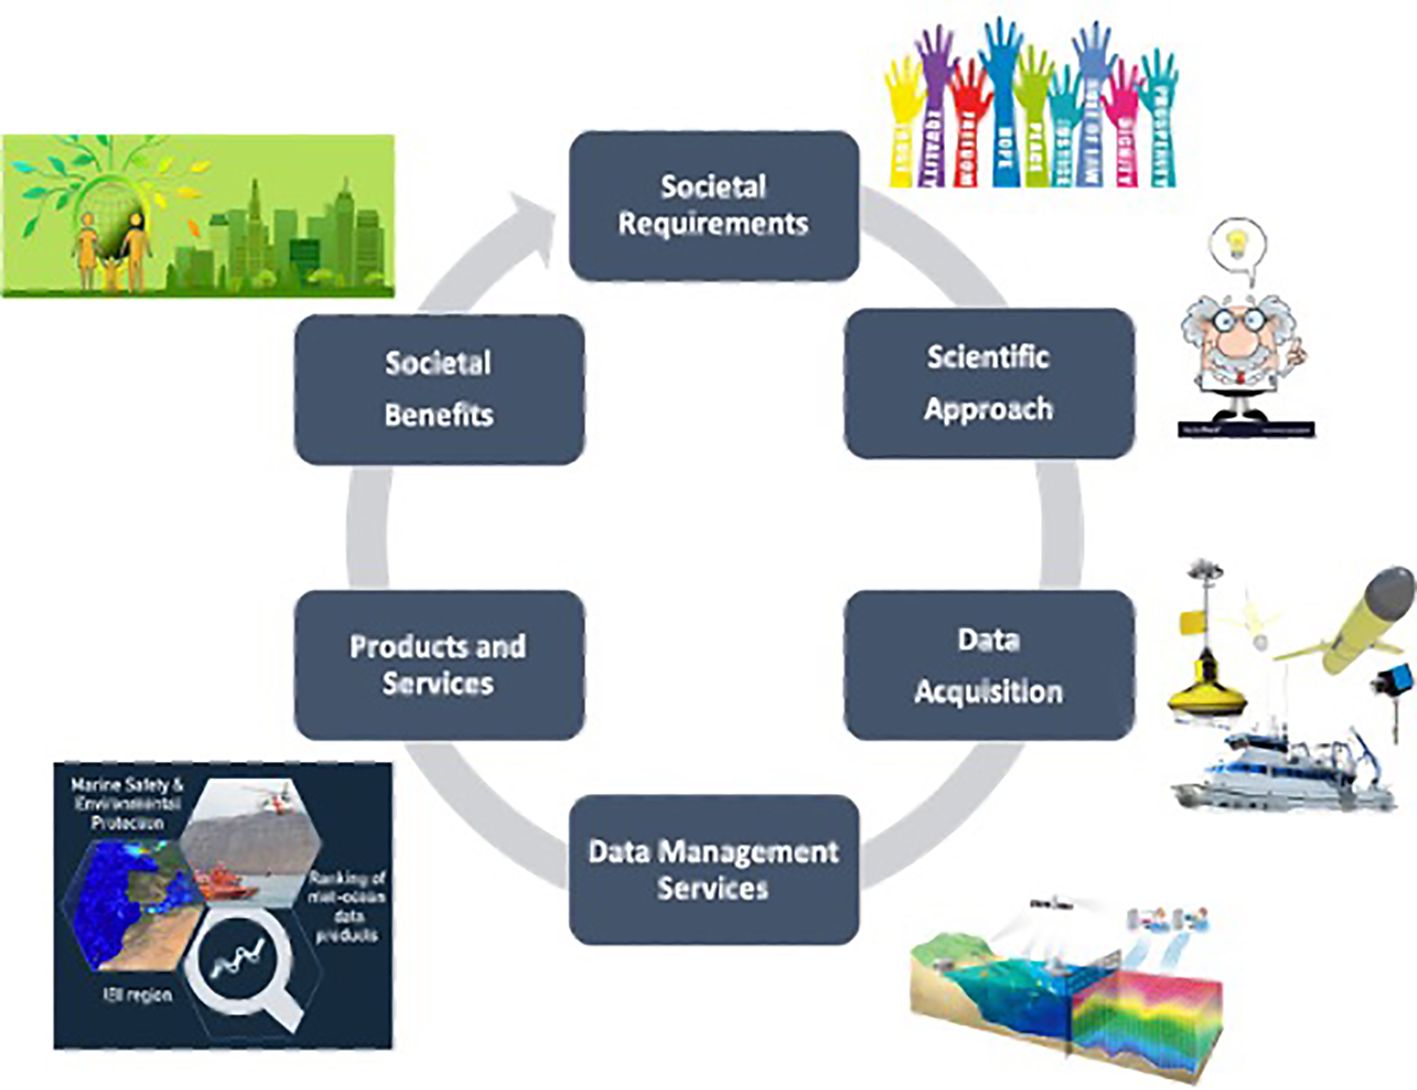
Figure 1. Ocean observing value chain.
Formally defined, documented practices should ensure that people knowledgeable in the field can successfully execute the practice and have the same outcomes that the process creators achieved. As a practice matures, broader adoption will test the practice in many environments to ascertain the applicability to diverse regional missions where, for example, low-cost solutions may be required.
In formulating a maturity model for ocean practices, key questions should be addressed as a practice matures: which method can be considered a best practice, and is there a measure of maturity to identify best practices? Does the process described in the practice follow guidelines or standards produced by experts? Is the documentation easily findable and allow easy readability? Is the practice documentation format consistent with machine-to-machine discoverability? Has the practice been reviewed by independent experts? (Hörstmann et al., 2020). For operational systems, questions relating to long term implementation should also be addressed (Mantovani et al., 2023).
This paper focuses on the maturity characteristics of a practice, both its implementation and its documentation. It addresses the above questions and forms a new maturity model identifying the attributes which enable a practice to become a good, better or best practice. The existence of a sufficiently detailed maturity model is beneficial in many ways. A maturity model will be a guide for practices to enable users to choose a more mature practice. For new (or reluctant) users, a better practice has documentation that is sufficient for consistent replication. If the document structure and related metadata follow a standard format, users can more easily compare practices. Users will know what is needed to implement a practice or if there are quality assurance procedures when using a practice. For mature practices, user feedback mechanisms will also help with selection. For practice developers, the maturity model offers clear guidelines for continuous improvement of practices. It can foster inter-institutional and international collaboration toward practice standardization.
The ocean-focused model derives from work over many decades on defining the maturity of space systems, software development and, more recently, project management. These are presented in the next section 2. The new maturity model is presented in section 3. Then, in section 4, the maturity model is evaluated through application to three case studies: High Frequency Radar (HFR), Multibeam ocean floor monitoring and quality assurance for sea level observations. An assessment is also carried out for current GOOS/OBPS-endorsed practices.
For a maturity model to be of continuing value, certain tradeoffs should be considered. For example, if a model is general, it can last without review for a long time, but it does not provide very specific guidelines for evaluating and evolving a practice. On the other hand, specific criteria can provide guidance for evolving practices, but they should be reviewed regularly in order to keep up with technology evolution. Practices across disciplines can vary and a maturity model may not be appropriate for all practices if the level descriptions are too specific. A summary of the benefits and challenges is provided in Table 1.
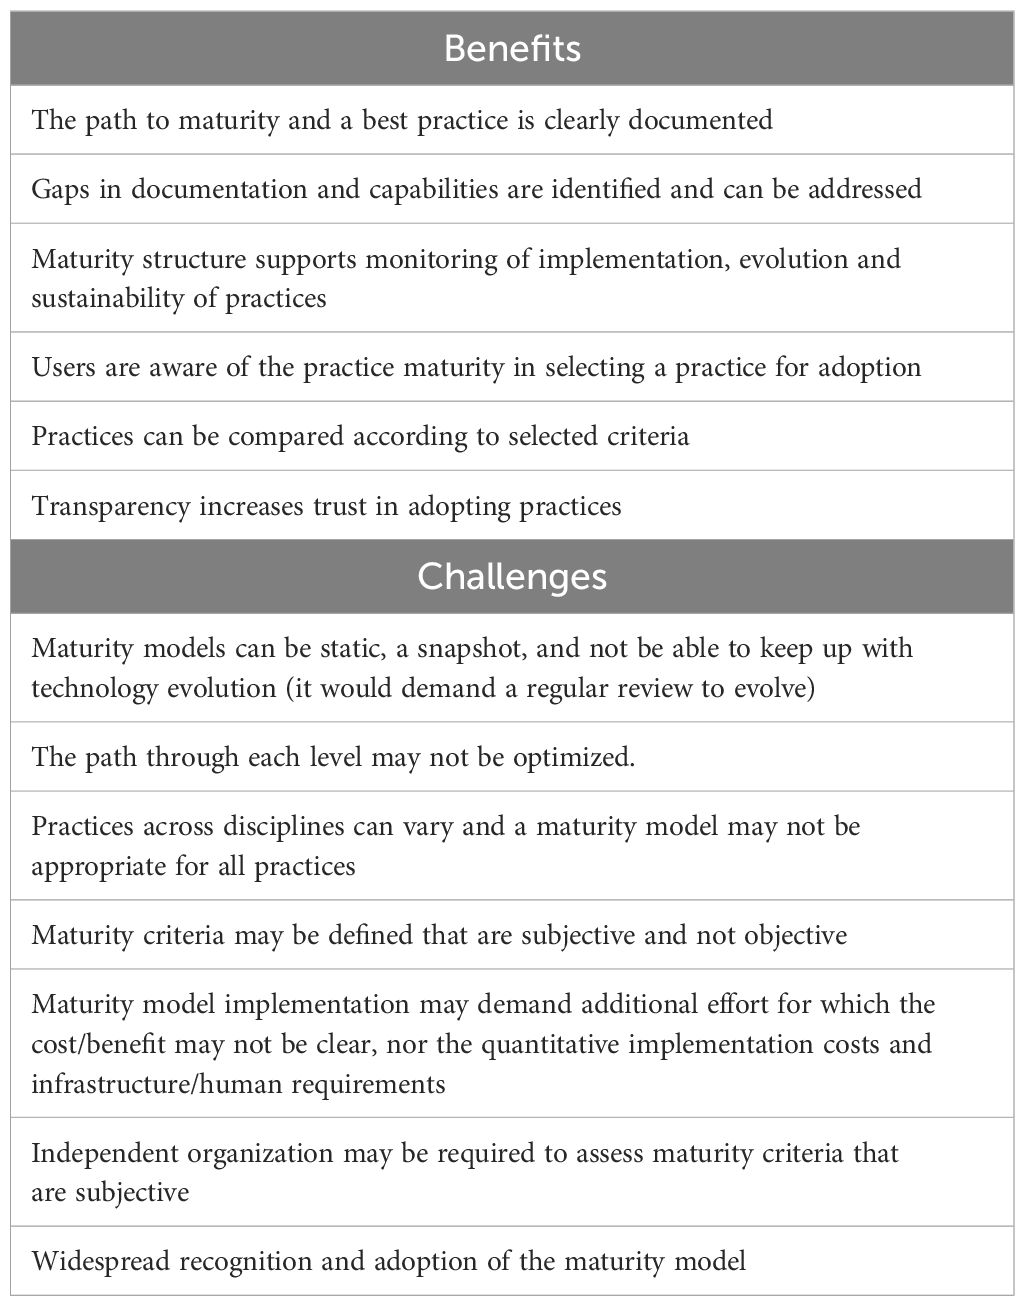
Table 1. Benefits and challenges in using practices maturity models.
Maturity models usually comprise three or more levels of maturity from initial concept to a fully mature practice. The ocean community currently uses three level maturity models. The Framework for Ocean Observing (FOO) (Lindstrom et al., 2012) and the Ocean Best Practices System (OBPS) (OceanBestPractices System (OBPS), 2024) each has three levels. For the OBPS, these are:
Concept: A practice is being developed at one institution(s) but has not been agreed to by the community; requirements and form for a methodology are understood (but practice may not be documented).
Pilot or Demonstrated: Practice is being demonstrated and validated; limited consensus exists on widespread use or in any given situation.
Mature: Practice is well demonstrated for a given objective, documented and peer reviewed; practice is commonly used by more than one organization.
While the three levels represent a logical progression of maturity, their description does not provide enough detail to accurately identify the appropriate level for a practice. It is unclear at what point a practice becomes a good practice or even a better practice. The three-level maturity scale is also focused on the practice itself, but does not account for aspects such as training, user feedback, routine updates, nor guidance on how to write and make available practice documentation.
In project management, software development and system development, the number of levels typically range between four and nine. For long term projects that are complex, include many different teams and last one or more decades, maturity models with more levels may be used. NASA ran complex space system developments, monitoring technology from inception to space flight hardware over decades. They used a nine level Technology Readiness Level maturity model (Hirshorn and Jefferies, 2016). Similarly, NOAA has a nine level system as an idea evolves to a mature system (NOAA, 2019).
Experience developing and using maturity models in industry and academia suggests that a five level structure may be optimum for most applications (Chrissis et al., 2011). Maturity models are broadly used in industry. They cover a wide range of subject areas where they are used to monitor the efficiency of business processes (Tarhan et al., 2016; Lutkevich, 2024) such as project management (Rosenstock et al., 2000; Pennypacker and Grant, 2002) or software development (ISO/IEC 15504). The models have several objectives: benchmark internal performance; catalyze performance improvements; and create and evolve a common language to understand performance. The latter supports a commitment to foster the engagement of all stakeholders. The degree of maturity described in these business models is done through assigning levels related to the degree to which processes are documented and followed (Newsom, 2024).
For software development, there are complementary paths for assessing maturity, e.g. International Standards Organization (ISO) 9001 standards (ISO 9001:2015, 2024) or the Capability Maturity Model (CMM) (Lutkevich, 2024). The main difference between CMM and ISO 9001 lies in their respective purposes: ISO 9001 specifies a minimal acceptable quality level for software processes, while CMM establishes a framework for continuous process improvement. ISO in collaboration with the International Electrotechnical Commission (IEC) has also provided a series of guidelines known as the Software Process Improvement and Capability Determination (SPICE) framework (ISO/IEC 15504). CMM is more explicit than the ISO standard in defining the means to be employed. For its implementation, the CMM describes a five-level evolutionary path of increasingly organized and systematically more mature processes (Figure 2) (Lutkevich, 2024). IOOS chose a five-level model in their 2010 blueprint for full capability (U.S. IOOS Office, 2010).
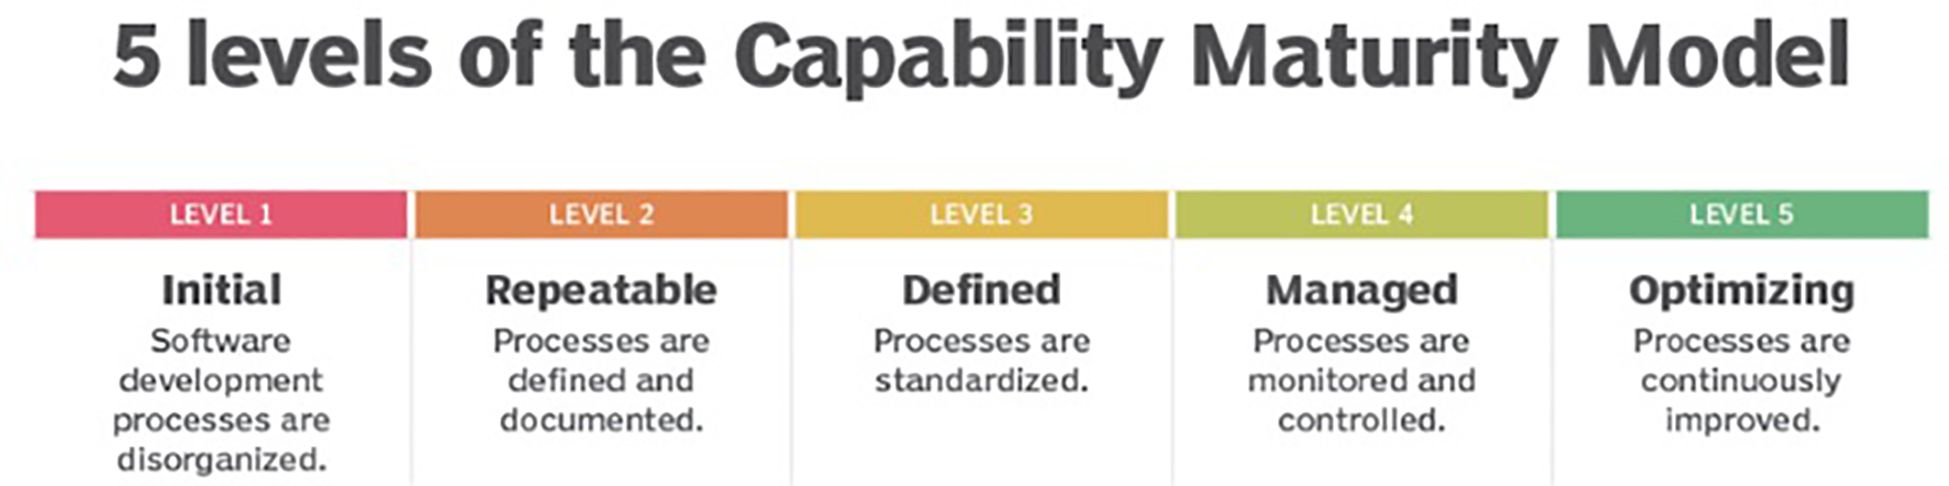
Figure 2. Five levels of the capability maturity model, adapted from (Lutkevich, 2024).
The ocean maturity model defined in this paper also uses five levels. Five levels offer a granularity that has enough detail to differentiate between maturity levels without being overly intricate. The five levels, with appropriate sublevels, allow organizations to identify areas to focus their efforts for improvement.
A key question to be considered in designing an ocean-focused five level maturity model is how can the five levels be formulated to stimulate evolution from a practice to an endorsed, widely-adopted best practice. The description of levels in Figure 2 for software evolution provides a foundation. For oceans, levels one and two are similar to the software model and are focused on taking ad hoc practice of level 1 and moving it toward a repeatable practice (Level 2). In Level 3, practices should be open, defined and fully documented so they can be replicated by other experts. At Level 4, the practices are well developed and adopted across multiple institutions. Level 5 includes mature practices which are even more widely implemented, have user feedback and are endorsed by experts. Figure 3 offers a very high level sketch of what each level is. This would not suffice by itself. More details at each level are necessary and are provided in Section 3.1 below.
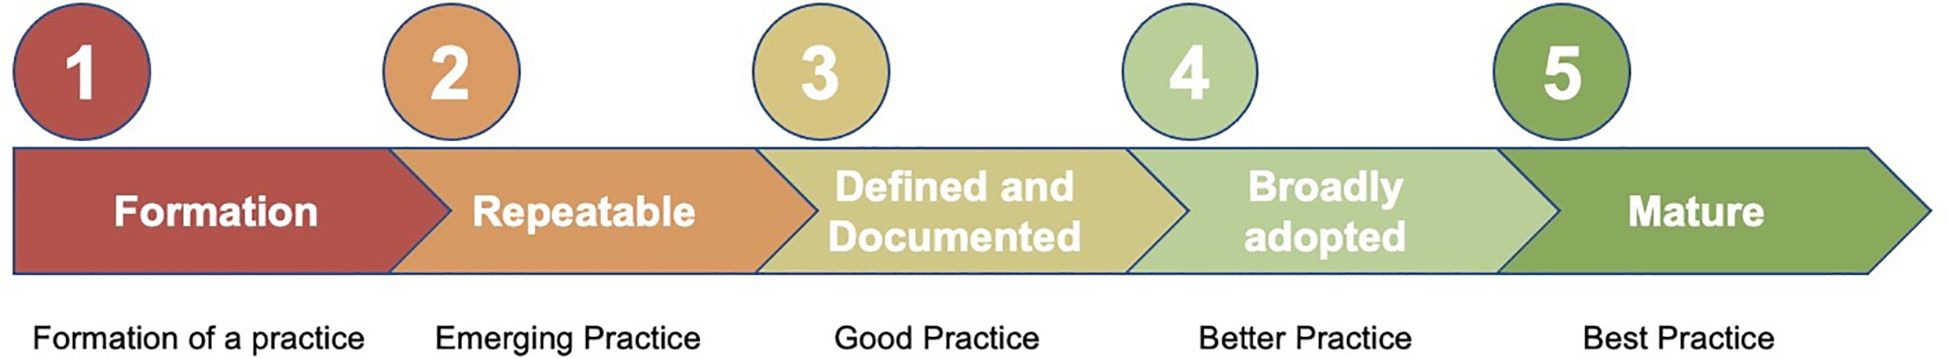
Figure 3. Five levels of ocean practice maturity model.
The maturity model levels described above have been expanded in a number of attributes that are inspired by four foundational elements. First is multi-institutional adoption and use of the practice. Second is complete and open documentation of the practice including the process description and related metadata. The documentation should be in a sustained repository. Third is community engagement and feedback in evolving and endorsing the practice. Fourth is sustaining the practice and its related experience. This would involve, for example, training in its use and updates relevant to changing technologies.
There are two parallel processes included in maturity assessments. First is the maturity of a practice and its documentation. The second is the maturity of the implementation of the practice, particularly for operational systems. Both the practice maturity and the implementation maturity are considered in building the maturity model. The new ocean maturity model described in this paper is designed to support diverse elements of the ocean value chain, which includes observations, modeling and applications. It strikes a balance so that enough detail is included to support practice evolution while still offering criteria general enough to keep the maturity model stable and valid over time. For best practices to evolve, tools to monitor implementation are needed as well as feedback loops with users (Przeslawski et al., 2021). Ideally, there is a central repository which collects feedback information, supports optimization and keeps track of the evolution. The evolution of practice maturity is promoted at all levels. The implementation maturity is visible only in levels four and five when the practice is mature enough to be considered for an operational or complex research environment. For example, Level 5 in Table 2 includes user feedback loops, diagnostic tools and protocols for evolution.
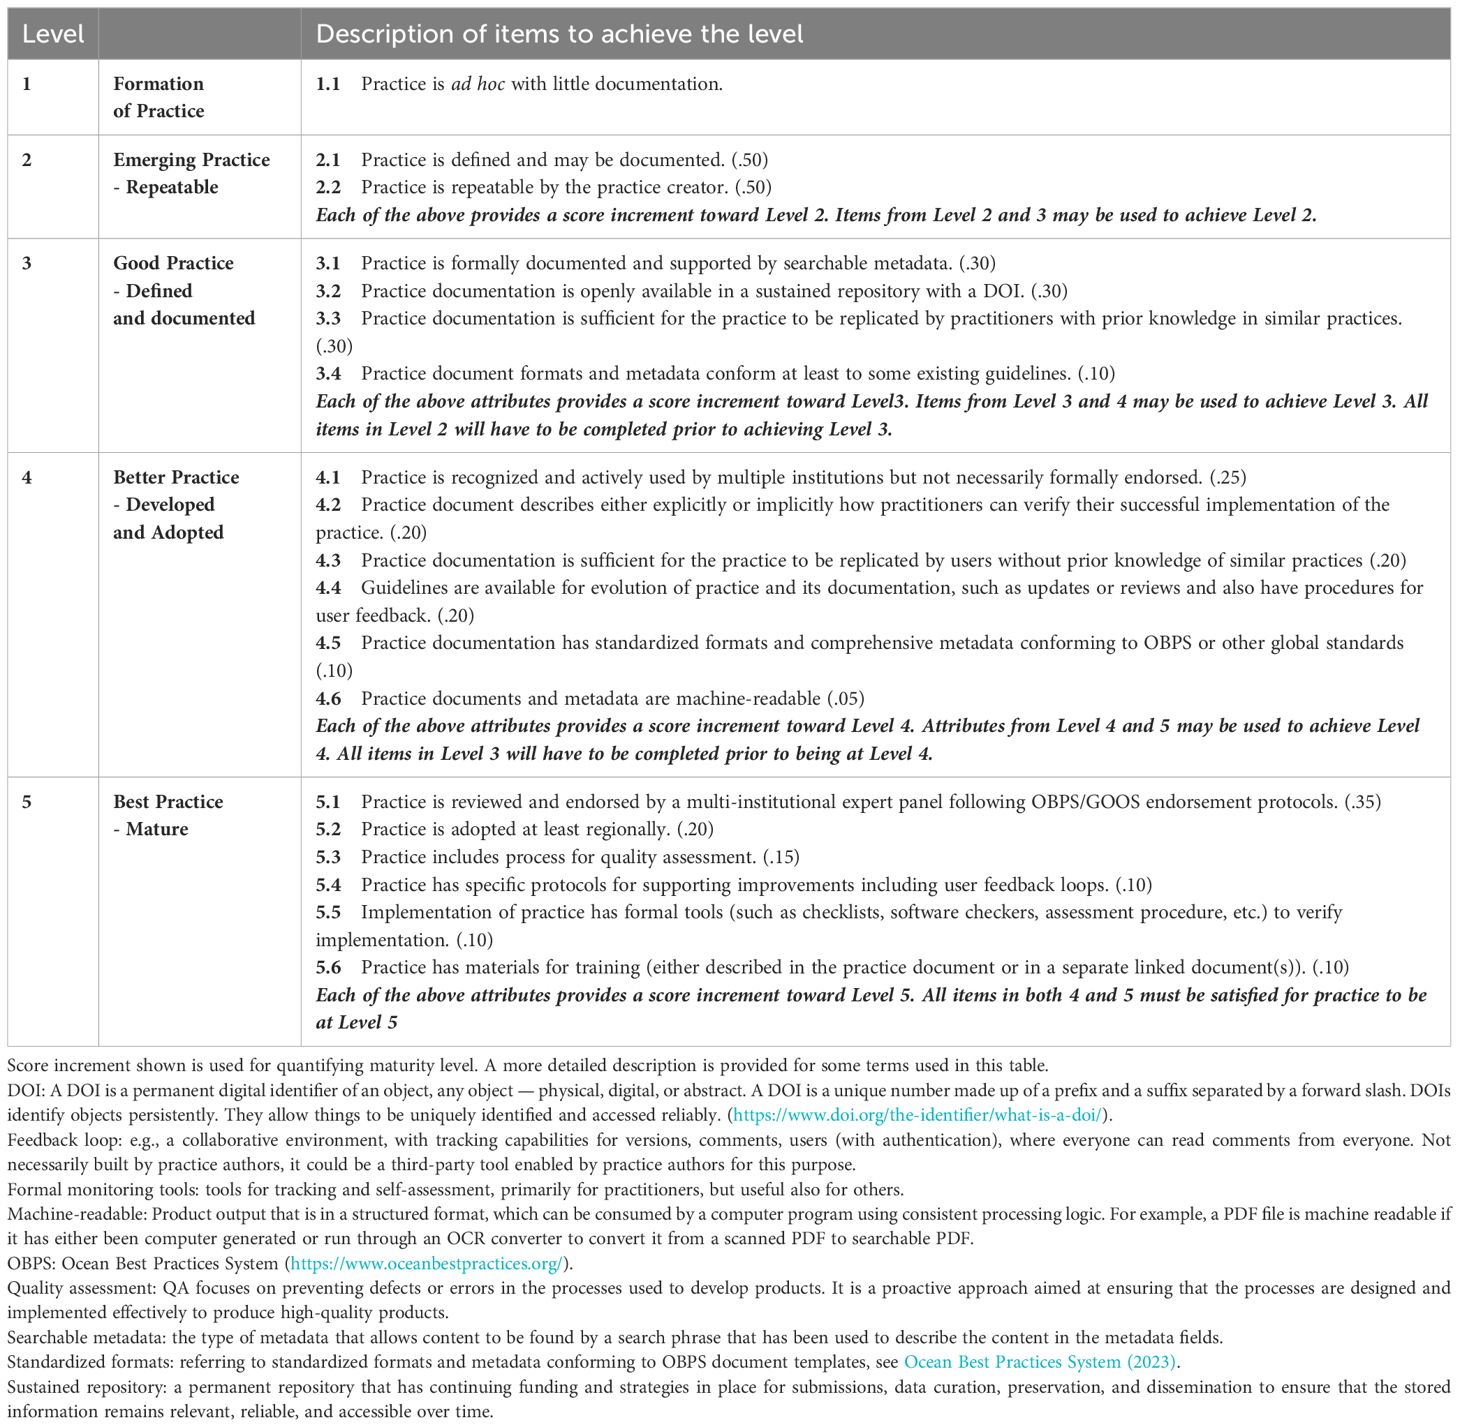
Table 2. The five levels of maturity for ocean practices and the attributes required to reach a level.
In defining the attributes for each level, there are many trade-offs about what constitutes a good, better or best practice. Applying these maturity assessment criteria to practices is a combination of fact and judgment. In defining the attributes of each level, there was a focused effort to make as many of them quantitative and to minimize subjective judgements. Additionally, in some cases, two similar attributes are assigned to two different levels. In this case, at the higher level, the attribute is more formal in its structure or more pervasive in its use. For example, in Level 4, a practice is used by multiple institutions while in Level 5, the practice is adopted at least regionally. Similarly, in Level 4 a practice document describes how practitioners can verify their successful implementation of the practice, while in Level 5 implementation of practice has formal tools to accomplish this task.
Level 5 introduces endorsement. To guide users in method selection, an endorsement process was developed through a collaboration of the Global Ocean Observing System (GOOS) and OBPS which provides guidelines for endorsement (Hermes, 2020; Przeslawski et al., 2023). Based on this experience, OBPS has defined an endorsement process that can be extended to a broader range of disciplines (Bushnell and Pearlman, 2024). An example of an endorsed practice is the Ocean Gliders Oxygen SOP V1. (Lopez-Garcia et al., 2022).
In applying labels to levels four and five, it is recognized that better or best could be relative to a specific environment. A better practice for the coastal regions and a better practice in open ocean may be best for their locations, but may differ in their description and implementation. Thus, multiple practices may exist simultaneously for the same high level objective. For example, measurements of dissolved oxygen in seawater are quite commonly used by biologists as a measure of water quality. Low oxygen levels stress organisms and anoxic conditions create dead zones. Oxygen levels are also used by physical oceanographers as water mass tracers to estimate how much time has passed since deep water was last in contact with the atmosphere, requiring measurements with a higher accuracy. To make the measurements, a wide variety of practices may be employed, each with benefits and drawbacks. It is best to modify the traditional titrimetric method used in open ocean waters when making the same measurement in coastal waters with high organic loads (American Public Health Association (APHA), 1976).
Assignment of maturity level for a process must be transparent and be easily used by those employing the maturity model as a tool for self-assessing the maturity of their practice. It must also allow straightforward interpretation by users who want to decide whether to adopt a practice. To this end, a quantitative scoring system was defined for assessing a practice. The score for a level is built on specific scores for each attribute of that level, so that the sum is the number “one”. This is valid for all the levels. While the assignment of “one” as the sum is arbitrary, it makes the assessment within and across levels more straightforward. Another factor in the scoring is that a weighting is introduced to recognize that not all attributes at a given level are equally important when progressing to a good, better or best practice. This was done assigning non-uniform scores to attributes, within each level. Attribute scores, thus their priority rating within each level, are based on the authors’ experience and inputs from other experts in the ocean community. Since the number of attributes is not the same for each level, but their score has to sum one within each level, individual attribute scores from different levels are not meant to be comparable, i.e. a concept of absolute priority is not defined.
Using this scoring, the calculation of the maturity level for a practice looks at the items needed to achieve each level (see Table 2) and follows a few simple rules. To be awarded as fully compliant with a level, a score of 1.0 is required in that level (i.e. all the attributes are fulfilled in that level). However, there will be times in the evolution of a practice when not all of the attributes to achieve a level have been satisfied, and at the same time attributes from the next higher levels have been satisfied. To not restrict developers, the score for a level can be obtained as the sum of all the scores of the fulfilled criteria for that level and the one above it. There is an additional facet that to be declared at a certain level, all items in the lower levels must be completed. Synthesizing this approach in other words, maturity Level N is obviously achieved when all attributes are fulfilled from Level 1 to N. In a more realistic case in which not all the levels are fully completed, Level N can be achieved when: a) all the attributes from levels from 1 to N-1 are fully satisfied and b) attributes fulfilled in Level N and Level N+1 give a score >=1. Levels N+2 and above cannot contribute to an additional score, in order to encourage a balanced evolution of the practice.
For an example of the assessment calculation see Table 3. The table considers a practice that has completed Level 2 and is working toward recognition at Level 3. It has satisfied three of four attributes for Level 3 and has a score of 0.70, but does not yet have a score of 1.00 at Level 3. However, it may use actions from Level 4 that it has completed to get credit toward Level 3 completion, but it cannot use any activities from two levels higher, in this case, Level 5. In the case of Table 3, three attributes of Level 4 are satisfied: the practice document describes how practitioners can verify their successful implementation of the practice, the practice has been submitted to a sustained repository in a standardized format, and practice documents and metadata are machine-readable, which together have an associated score of 0.35. Adding this to the 0.70 from Level 3 attributes that are satisfied, gives a total score of 1.05 and the practice is acknowledged to be at Level 3, a “good practice”. It is also necessary that all items at lower levels (in this case Levels 1 and 2) have been fully completed so that there are no residual holes in the maturity evolution. The rationale for not using scores from two levels above the current level is to focus the maturity evolution at no more than two levels and not have an effort distributed across the entire maturity spectrum. This helps users more clearly understand if a practice is good, better or best.
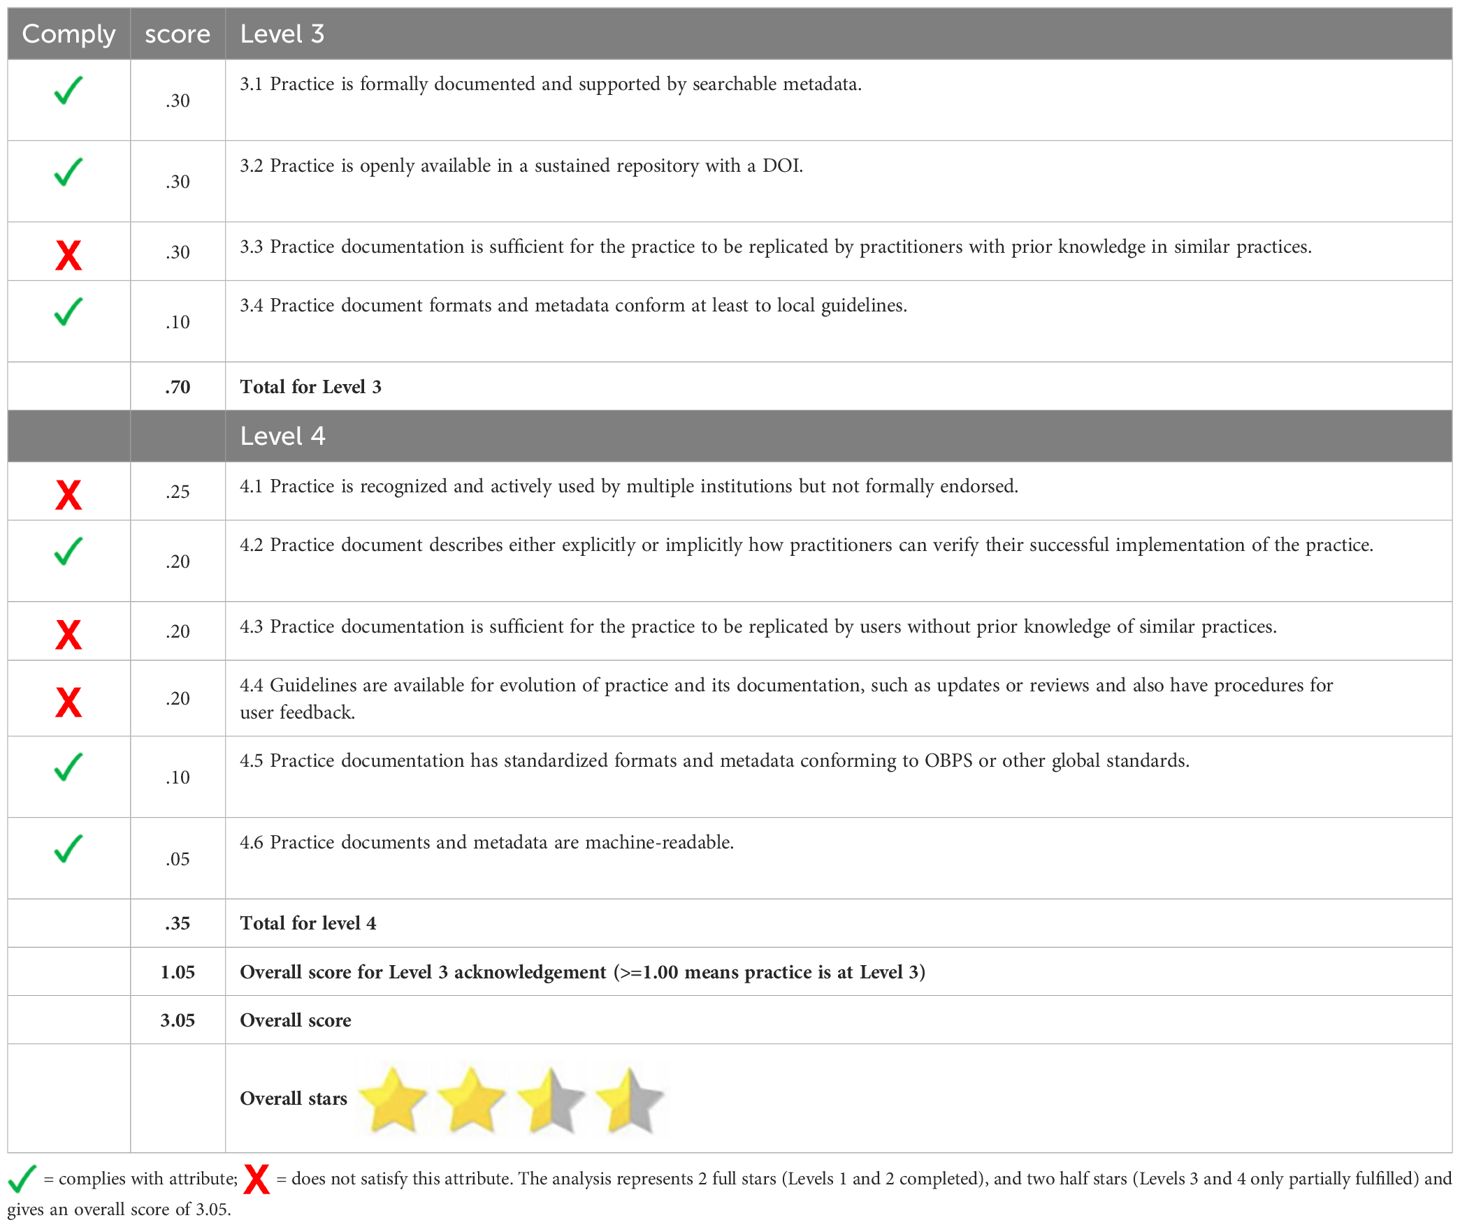
Table 3. Example of scoring in the maturity mode.
In order to consider the full capability of a practice in terms of readiness for each level and to provide a quick visual and complementary reference for users of the scoring results above, a practice can be assigned from one to five stars corresponding to its maturity level attributes. The number of full stars indicates that a specific level has been completed. Half stars may be used for completion of a partial level. Since this is a qualitative score, a half star does not mean the achievement of a score of 0.50 in that level; it means that some score was achieved in that Level. A qualitative score of 5 stars is equal to the quantitative score of 5.00, meaning that the practice is a “Best Practice” and has fulfilled all attributes in the maturity model. The quantitative score and the number of stars may change as the practice matures. Specific examples of this scoring system are given in the next section where documented practices related to three ocean observing practices are considered, and the maturity assessment is done.
In this section, three practices are provided and analyzed to understand how the maturity scale is applied. These include practices related to different ocean observing technologies and methodologies: High Frequency Radar (HFR), a multi-beam scanner and a sea level quality control process. While these are all observations, they represent various segments of ocean observing. In addition, interviews were conducted with lead authors on seven OBPS/GOOS endorsed practices to consider whether these practices are good, better or best practices. A summary of the lead author self-assessment from the interviews, giving the maturity rating, is provided in section 4.4.
All the exemplars in this section 4 have completed the attributes of Level 1, 2 and 3, and therefore have a guaranteed starting score of 3 (and 3 full stars). Thus, the discussions and tables below focus on Level 4 and 5. For the three examples of HFR, multi-beam scanner and sea level quality control, the maturity tables include comments on each attribute to better understand how the factors are applied in the ratings.
In oceanography, HFR is a remote sensing technology employed for monitoring ocean surface currents, waves, and wind direction. Operating in the HF radio frequency band (3-30 MHz), these radar systems extract ocean surface current velocity information from the Doppler shift induced by the movement of the ocean surface (Gurgel, 1994; Gurgel et al., 1999; Lorente et al., 2022; Reyes et al., 2022). They are typically deployed in networks along coastlines, providing information in extended coastal zones and up to 200 km from the shoreline.
HR radars are complementary to other existing instruments used in oceanography for monitoring ocean currents and waves. Traditional oceanographic methods often involve deploying buoys or drifters, or moored Acoustic Doppler Current Profilers (ADCs or ADCPs). More conventional instrumentation can be limited in spatial and/or temporal coverage and may not provide real-time data, and do not sample the upper layer of the water column where the ocean-atmosphere exchanges are most pronounced. HFRs provides non-intrusive, wide-area coverage of coastal regions, offering real-time data at high spatial and temporal resolution from an easily accessible shore location. Their primary output is a 2-dimensional map of ocean surface currents. Gridded or single-point waves (significant wave height, period, direction) and wind (direction) data can be derived also (Roarty et al., 2019a).
Challenges of HFR technology and related research activities are multiple and are synthesized in recent papers (Rubio et al., 2017; Roarty et al., 2019b; de Vos et al., 2020; Lorente et al., 2022; Reyes et al., 2022). Given the multiple applications in operational oceanography, a priority identified by the research community was the efficient and standardized management of near real time HFR-derived velocity maps. To obtain surface current vectors, an HFR installation must include at least two radar sites, each one measuring the radial velocity component in its look direction when operated in standard monostatic configuration. Different sources of uncertainty in the velocity estimation can be related to variations of the radial current component within the radar scattering patch or over the duration of the radar measurement; incorrect antenna patterns or errors in empirical first order line determination, the presence of environmental noise (Rubio et al., 2017). Also, in the combination from radials additional geometric errors can affect the accuracy of the HFR data, like the Geometric Dilution Of Precision (GDOP) (Chapman et al., 1997).
The need of ensuring best data quality for near-real time (NRT) data products motivated the community to work on the definition of a practice including the most suited QA/QC protocols, based on metrics which could be computed, with a reasonable computational effort, directly from the received data and a set of reference threshold values.
Two practices related to HFR technology are analyzed in this section. They both refer to Quality Control of HFR data and have been developed in two different regions, Europe and Australia.
A first practice is selected from the Joint European Research Infrastructure for Coastal Observatories (JERICO) inventory: Recommendation Report 2 on improved common procedures for HFR QC analysis, JERICO-NEXT Deliverable 5.14, Version 2.0 (Corgnati et al., 2024).
In 2014, EuroGOOS initiated the HFR Task Team to advance the establishment of an operational HFR network in Europe. The focus was on coordinated data management and integrating basic products into major marine data distribution platforms. A core group of this task team was then involved in a series of projects (Lorente et al., 2022) that supported the development of practices for HFR system operations including surface currents data management.
The project deliverable JERICO-NEXT D5.14 is the practice describing the data model to be applied to HFR derived surface current data required for complying with international standards. This document, which is available from the OBPS, illustrates the practice maturity which relies on standards (NetCDF data format, CF conventions, INSPIRE directives) and widely accepted procedures (QARTOD manual, US HFR network best practices), and has been drafted in the multi-institutional context mentioned above.
A second practice is selected from the Ocean Radar Facility at the University of Western Australia (UWA) (de Vos et al., 2020; Cosoli and Grcic, 2024). The practice is also provided in the oBPS repository. The Ocean Radar Facility at the University of Western Australia (UWA) is part of Australia’s Integrated Marine Observing System (IMOS) and was first established in 2009. Best practices and workflows were established in collaboration with the Australian Ocean Data Network (AODN) to document near real-time (NRT) and delayed-mode (DM) data flow, planning, clarify responsibilities, improve communication, ensure transparency, and aid in deployment reporting. These are refreshed periodically to reflect changes in network settings and hardware or software upgrades. Standard practices include using near-surface currents from independent platforms to optimize radar settings and assess QA/QC tests quantitatively. Optimized thresholds are then established based on regional variability in current regimes for both near real-time and delayed mode products rather than being set a-priori.
Maturity of the Practices associated with each of these HFR applications are assessed. The different levels of maturity associated with these practices (Level 4 and Level 5) are detailed in Table 4.
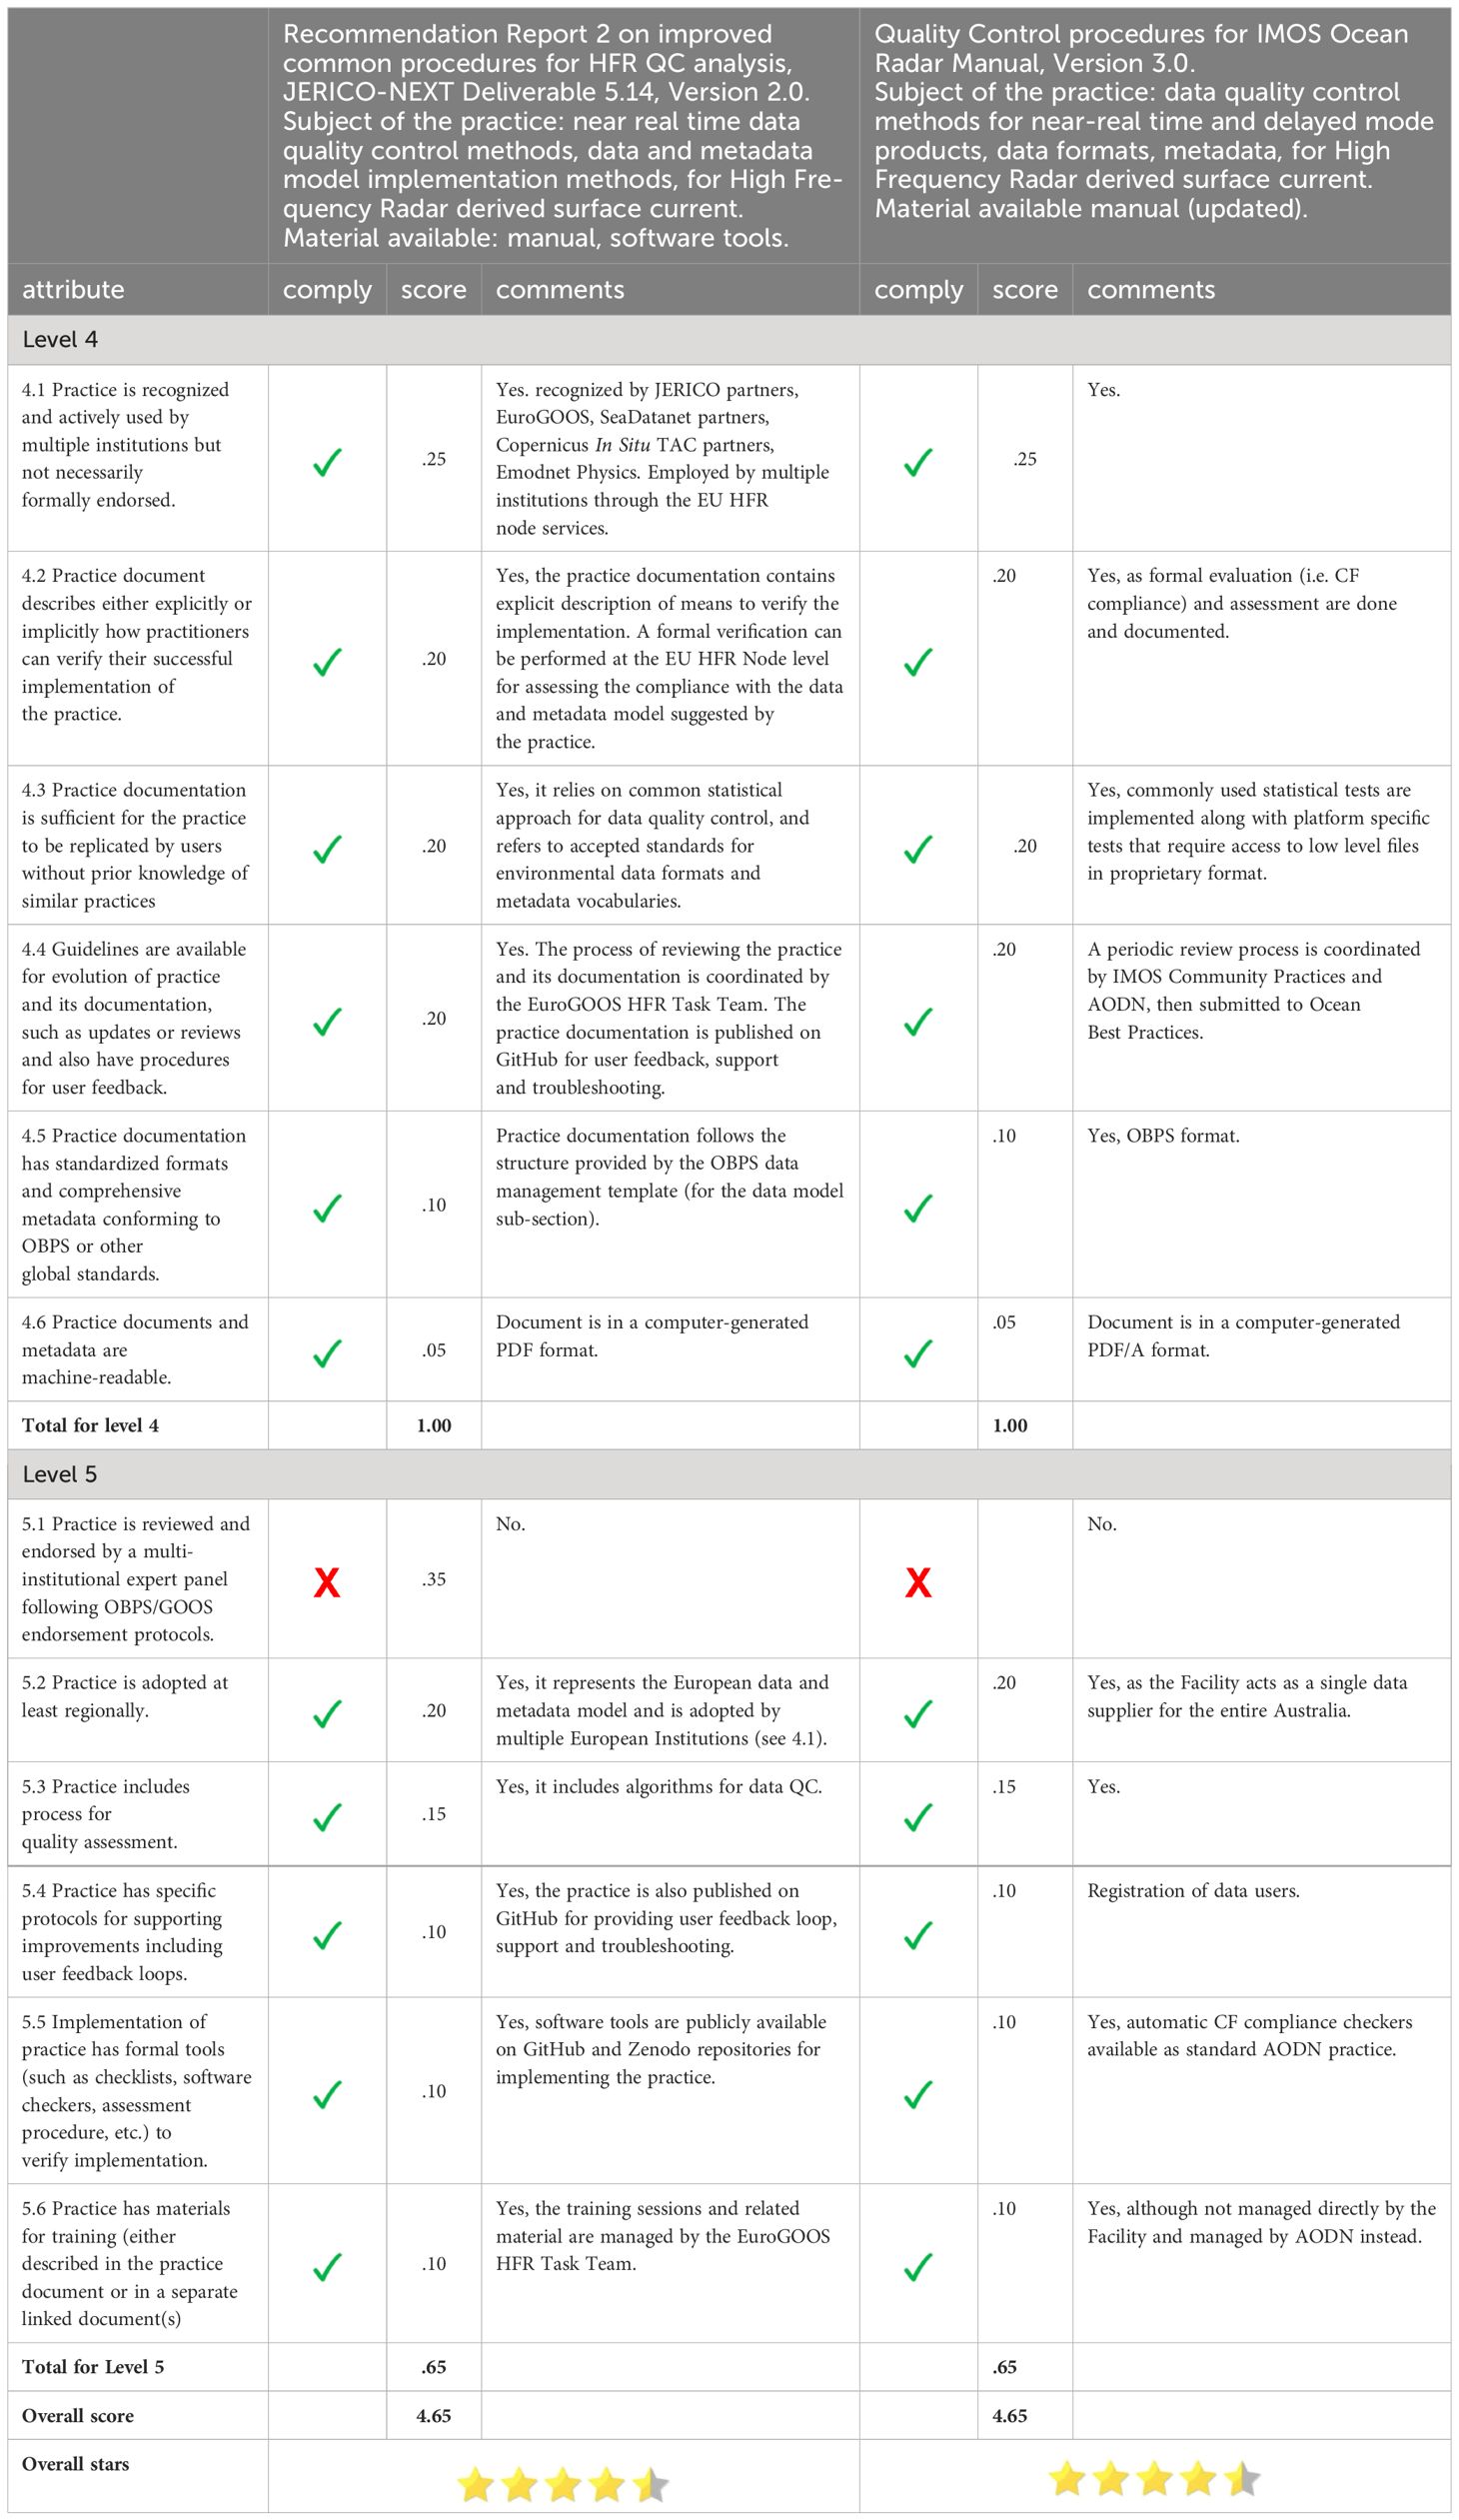
Table 4. Maturity assessment of HFR practices.
Level 4: for (Corgnati et al., 2024) attributes of level 4 are fully satisfied. In particular, thanks to the commitment of the EuroGOOS HFR Task Team and its operational asset, the European HFR Node (EU HFR Node), in promoting the multi-institutional adoption and implementation of the European QC, data and metadata model for real-time HFR data, specific procedures for regularly reviewing and updating the data model practice documentation, for providing feedback loops with users, for providing training on the data model application and for providing means for assessing the correct adoption of the data model are in place and described in the practice documentation. The EU HFR Node also provides an operational service for collecting HFR data, quality checking and converting them according to the QC and data model: this workflow operationally checks adherence to file format conventions and metadata in the NRT and DM pipelines.
(Cosoli and Grcic, 2024) reported that all Level 4 attributes are met, however acknowledging that advanced skill levels may be required to replicate some of the proposed tests and approaches. Feedback loops are received directly from the data users when inconsistencies are noted in the data products or clarification about data formats and content are needed. Also, the data collection center (Australian Ocean Data Network, AODN) operationally checks adherence to file format conventions and metadata in their NRT and DM pipelines. AODN also ensures the Ocean Radar Facility satisfies standard IMOS community practices.
Level 5: for (Corgnati et al., 2024) attributes of level 5 are partially satisfied (5 out of 6). The aforementioned commitment and operational service provided by the EuroGOOS HFR Task Team and the EU HFR Node promote the global adoption of the practice and support its evolution. The missing attribute relates to the formal endorsement of the practice. This step is still being implemented.
(Cosoli and Grcic, 2024) report that 5 out of 6 level 5 attributes are met, however consensus is reached in regards to the fundamental need of thorough review and endorsement.
The comparison is included here as another potential for using the maturity model. If there are similar practices with the same objective, there is interest in assessing if convergence between the practices into a single practice can be achieved. The parties (Corgnati et al., 2024; Cosoli and Grcic, 2024) have agreed to pursue this as the maturity of both practices is nearly the same. The convergence effort was motivated by the maturity model analyses of this use case and envisions an investigation for other practices adopted in the same field, e.g. the QARTOD manual for HFR data QC (U.S. Integrated Ocean Observing System, 2022b), aiming at the production of a unique and endorsed reference practice for the international HFR community. The subject of convergence will be further discussed in a dedicated future document. Also, the dialogue will be extended to other national and regional HFR networks (Roarty et al, 2019b; Jena et al., 2019b) aiming at a global HFR practices harmonization and maturity model application.
Multibeam echosounders are marine acoustic systems that create data based on the interaction between underwater sound waves and physical obstacles, the latter of which can either be on the seabed or in the water column. Data acquisition involves a transmitter which emits multiple sound pulses at a given time and a receiver which receives this sound pulse. The difference in time between the send and receive signal will result in a depth measurement (bathymetry), and the strength of the return of the emitted pulse can be used to infer seabed hardness (backscatter). The main use of multibeam echosounders is to generate high resolution maps of the physical features of the seafloor over a broad spatial area. These maps can then be used for a range of purposes, including characterizing key seabed features (Post et al., 2022; Wakeford et al., 2023), choosing benthic sampling locations (Bax and Williams, 2001), and producing habitat maps (Misiuk and Brown, 2024). Acoustic techniques can also be used to detect and predict the spatial extent of broad ecological communities such as kelp and sessile invertebrates (Rattray et al., 2013; Bridge et al., 2020). All of these contribute to establishment and management of marine parks (Lucieer et al., 2024). Occasionally multibeam is used to detect change based on data acquired from repeated surveys (Rattray et al., 2013).
Until recently, multibeam practices were not unified or publicly accessible, making it challenging to collate and compare data from different surveys particularly in relation to characterizing and managing Australia’s vast marine park network (Przeslawski et al., 2019). The current version of the Australian Multibeam Guidelines was released in 2020 as a national best practice to guide multibeam data collection, processing and distribution (Picard et al., 2020). This version has higher maturity, than previous iterations, thus providing a useful example for the entire maturity assessment framework described in Table 5:
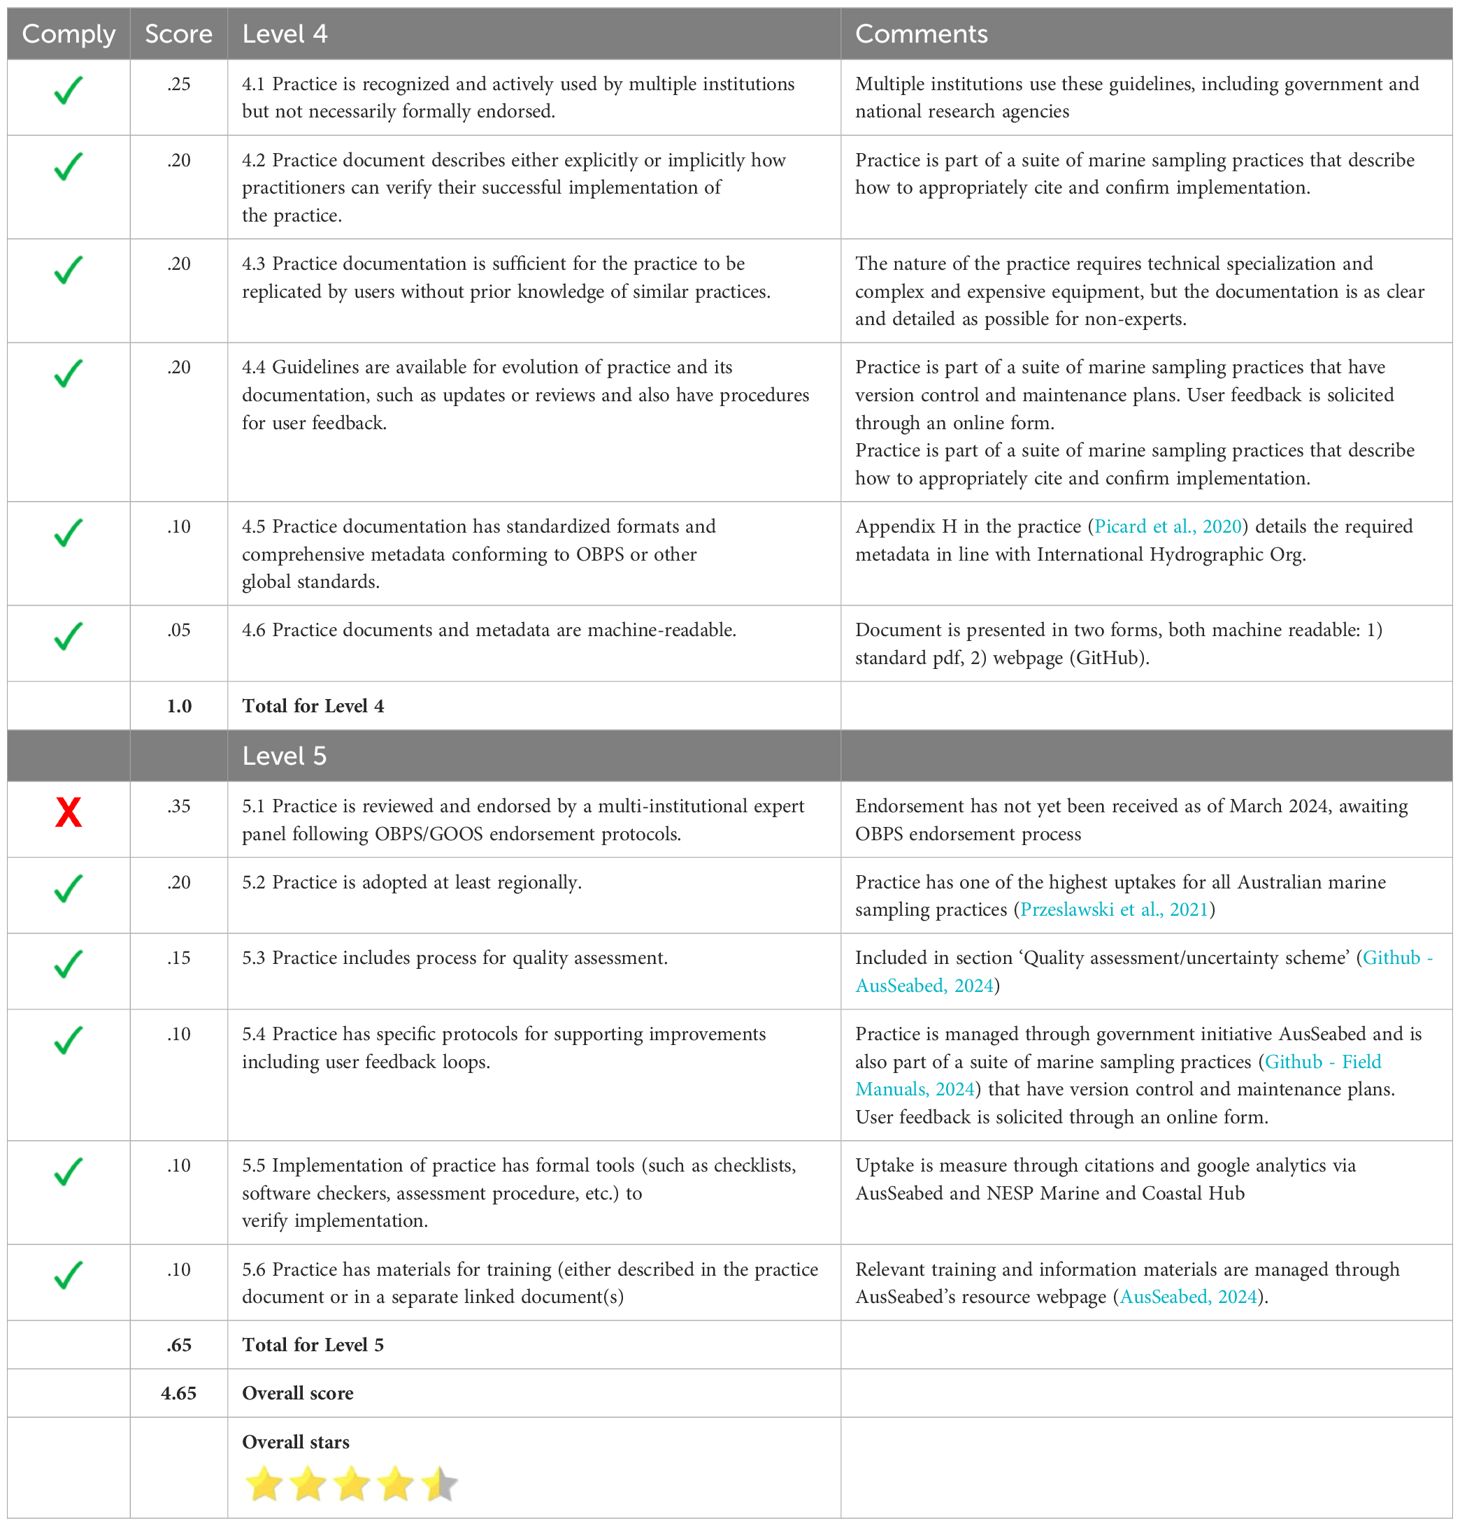
Table 5. Maturity assessment of Multibeam practice.
● Level 1-2: Prior to 2018, the multibeam practices used within Australia were separately developed and internally documented among relevant institutions. Practitioners were unable to discover most of these in-house practices, and each was written for various purposes (e.g. research and monitoring, hydrographic charting) and to varying levels of detail.
● Level 3: In 2018, national multibeam guidelines were independently released by two different consortiums, AusSeabed and the NESP Marine Biodiversity Hub (Przeslawski et al., 2019), each of which represented multiple institutions. The practices were released and promoted, and they were lodged on national government webpages, as well as the OBPS Repository.
● Level 4: In 2020, the previous two guidelines were merged into a new version and released as part of the national marine sampling best practices for Australian waters (Przeslawski et al., 2023). This version began to be adopted by multiple institutions in Australia (e.g. Geoscience Australia, CSIRO, Australian Hydrographic Office), with rapidly increasing uptake and impact.
● Level 5: By 2024, the Australian Multibeam Guidelines were broadly used throughout Australia as a best practice for seabed mapping and hydrographic mapping. Their maintenance is the responsibility of the AusSeabed Steering Committee, and various related training and data tools are available through (AusSeabed, 2024). The Australian Government recommends them in their permit applications for marine park monitoring and research. Formal endorsement will be sought by the OBPS process established in 2024 (Bushnell and Pearlman, 2024). When this is completed, the guidelines will be at Level 5 maturity.
Water levels are measured using a variety of technologies. Examples include pressure sensors, acoustic rangefinders (guided or unguided), floats/encoder systems, and more recently microwave rangefinders. Applications requiring ever-decreasing latencies have only increased with the need for dissemination in real-time. These include support for safe and efficient maritime commerce, storm surge and inundation observations, and even tsunami observations (Edwing, 2019). reports the economic benefits of real-time observations, including sea level observations provided each six minutes, are on the order of $10M per year, while accidents are substantially reduced.
“It seems a very simple task to make correct tidal observations; but in my experience, I have found no observations which require such constant care and attention…” - Alexander Dallas Bache, Second Superintendent of the Coast Survey, 1854.
Flaws often detected in real-time include data spikes, invariant flat line, abrupt offsets/shifts, telemetry dropouts, and other equipment failures (Figure 4). Real-time QC can decrease down time and reduce repair costs by alerting operators to data flaws more quickly and assisting with troubleshooting. Other flaws seen in water level data, such as slow sensor drift, platform subsidence, and errors associated with biofouling, cannot be detected in real time.
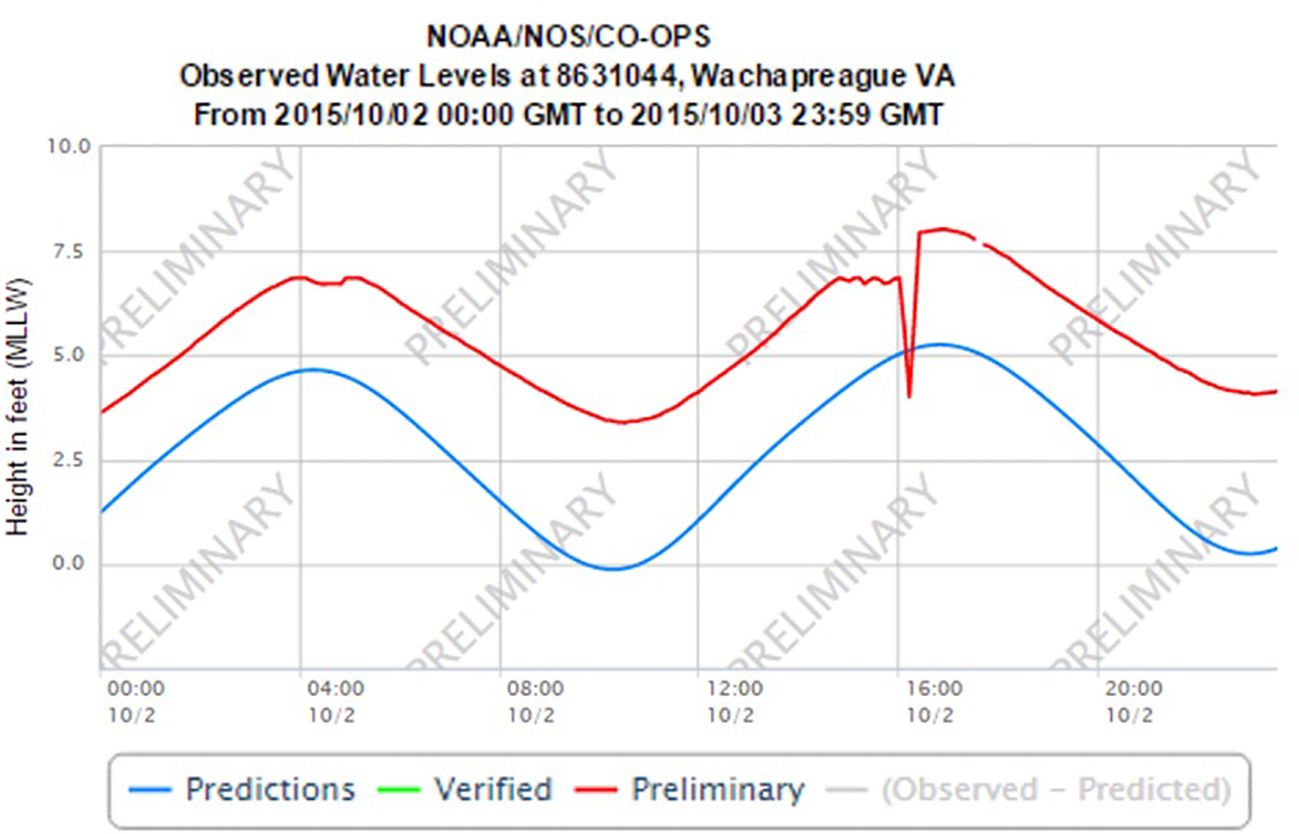
Figure 4. The flawed data disseminated in real-time on October 02, 2015, are associated with a storm surge which brought water levels too close to the acoustic sensor. The abrupt shift seen shortly after 16:00 on 10/02/15 is the result of shifting to an alternative sensor at this site.
The Quality Assurance/Quality Control of Real-Time Oceanographic Data (QARTOD) project began as a grassroots effort in 2003. Approximately 75 oceanographers and data managers met at NOAA’s National Data Buoy Center to initiate an effort to standardize the quality control of a variety of observations. Several years later, the first manuals were drafted, but there was no authority ready to accept them. In 2013, the U.S. Integrated Ocean Observing System (U.S. IOOS Office, 2010) program adopted the QARTOD project. Today a total of thirteen manuals (U.S. Integrated Ocean Observing System, 2022a) have been created and endorsed by IOOS.
Rigorous community input is the key to the creation of a QARTOD manual. Initially a small committee of subject matter experts (SME) produces the first draft, which is then reviewed by a larger group of users. The edited draft is then reviewed again by all relevant IOOS partners National Oceanic and Atmospheric Administration (NOAA), U.S. Army Corps of Engineers (USACE), Environmental Protection Agency (EPA), etc. The resultant draft is further reviewed by international agencies with interest in the effort, and then the initial SME committee provides a final review. The manual is submitted to IOOS for acceptance and signed by the Director of IOOS. The manual is posted to the IOOS web site and submitted to both the NOAA Institutional Repository and the OBPS repository. Throughout this process, an adjudication matrix is maintained to record comments and responses. The manuals are updated periodically to ensure that they remain relevant, accurate, and incorporate emergent QC capabilities. This QARTOD process is fully described in the QARTOD Project Plan Update 2022-2026 (U.S. Integrated Ocean Observing System, 2022a), and in Prospects for Real-Time Quality Control Manuals, How to Create Them, and a Vision for Advanced Implementation (U.S. Integrated Ocean Observing System, 2020).
The practices described in the manuals have been incorporated internationally by governmental and private sector entities. They have also been used in the classroom by graduate-level program. The manuals are intended to provide guidance to a broad variety of observers and capabilities. Each manual describes a series of increasingly challenging tests, identified as either required, recommended, and suggested, thus allowing for a variety of data management capabilities to participate in real-time quality control.
Initially, the target audience for the QC manuals was the eleven IOOS Regional Associations (RA), which cover the entire coast of the US and represent a geographically distributed group of users. The RAs are required to adopt QARTOD QC standards to obtain Regional Coastal Observing Systems (RCOS) certification.
For this example, the real-time water level QC (RT WL QC) is evaluated for its maturity level (see Table 6). The RT WL QC manual (U.S. Integrated Ocean Observing System, 2021) was first created in 2014, updated in April 2016, and again in March 2021. A total of 271 comments were logged from 33 individuals representing 20 institutions who contributed to the manual.
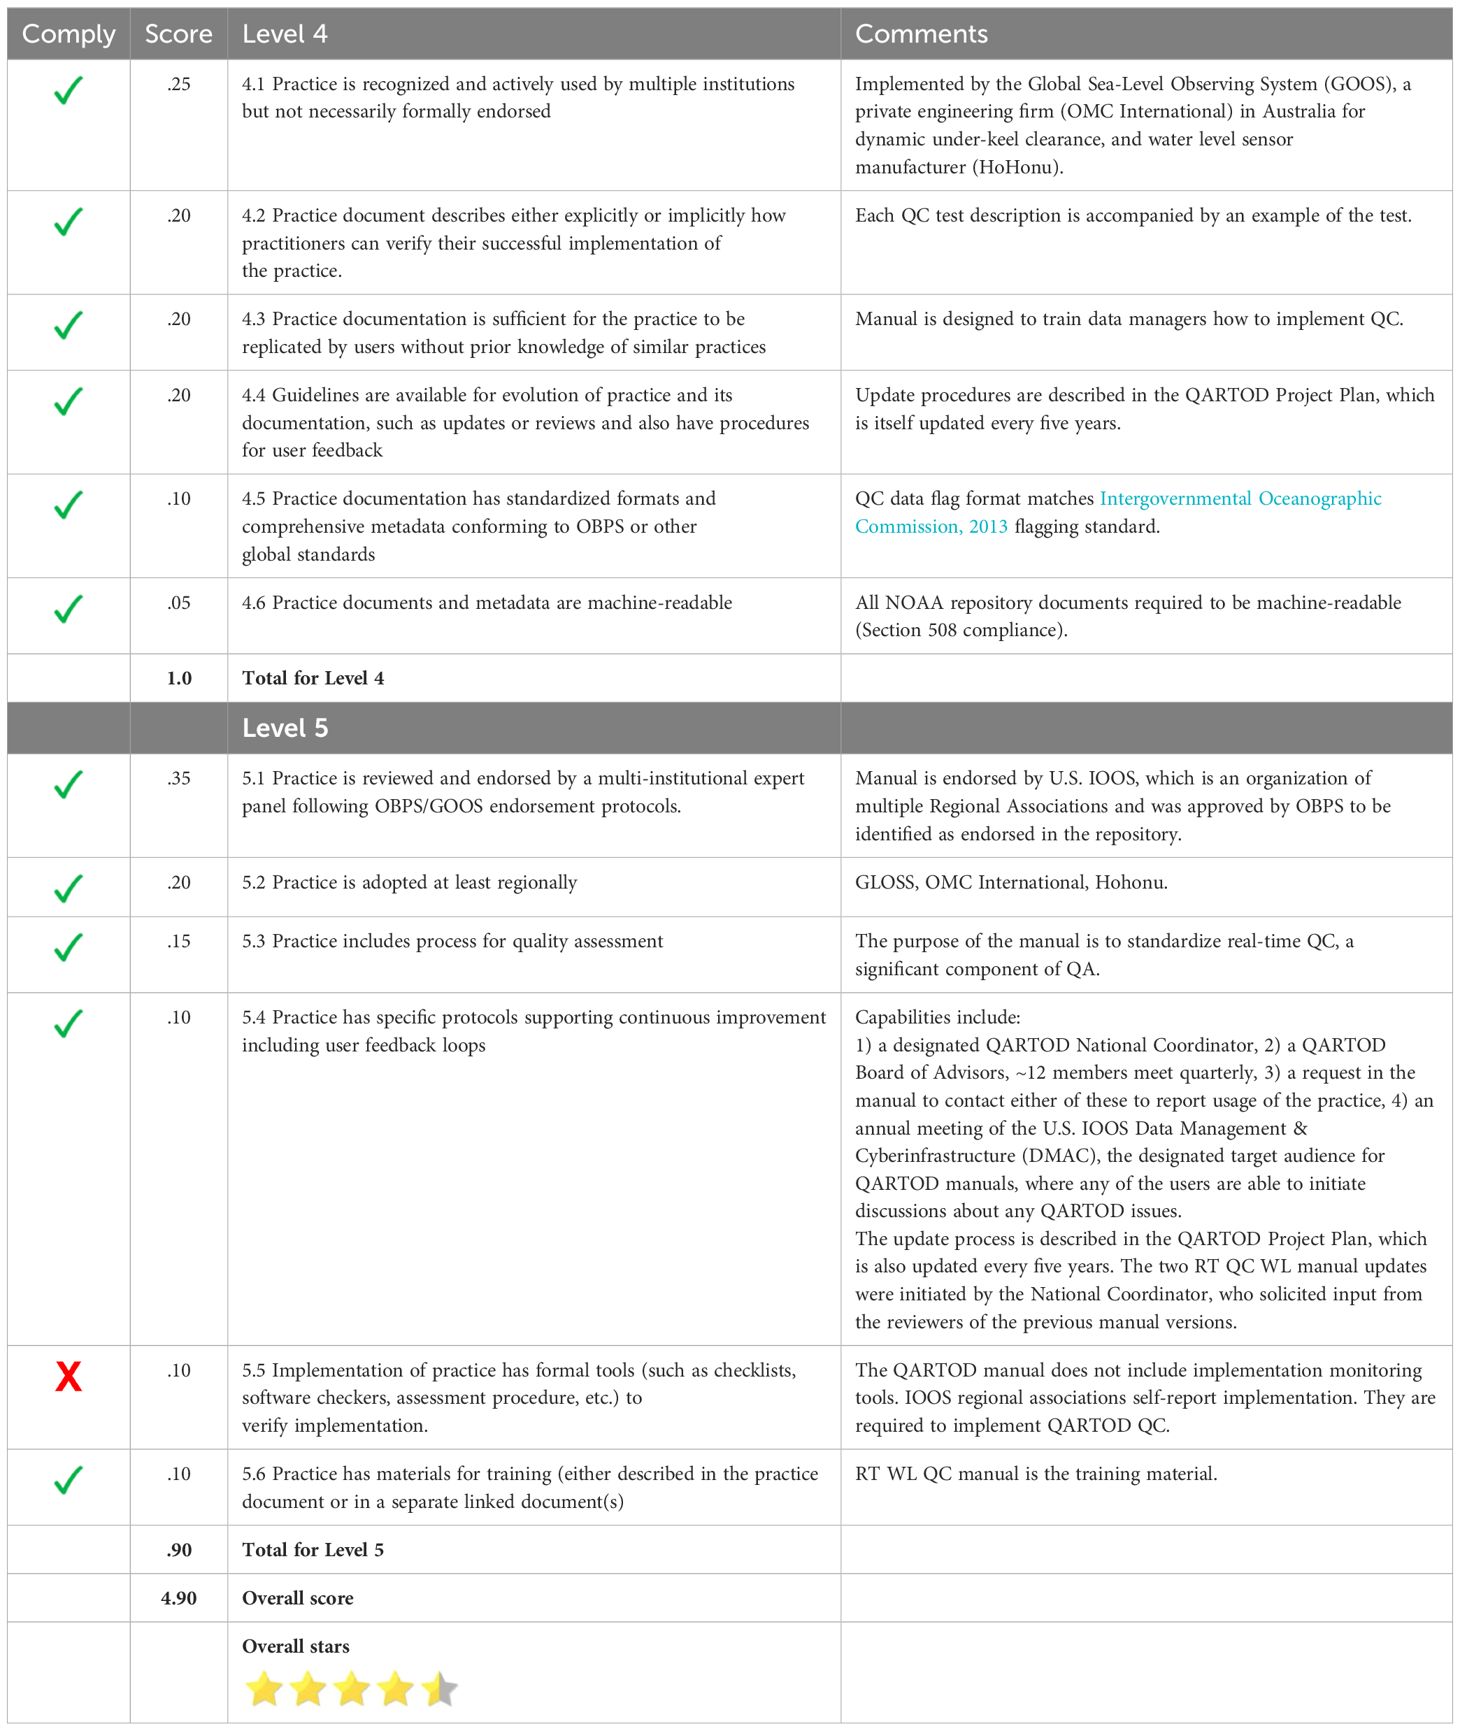
Table 6. Maturity assessment of QARTOD Real-Time Water Level Quality Control practice.
Level 1-2: The initial RT WL QC manual exceeded Levels 1 and 2 upon publication.
Level 3: All QARTOD manuals satisfy Level 3 guidelines.
Level 4: Documented examples of institutions implementing the QARTOD RT WL QC manual include:
1. In (UNESCO/IOC, 2020), the use of QARTOD WL QC tests is described for the Global Sea-Level Observing System (GLOSS, 2024).
2. In (Hofmann and Healy, 2017), the authors describe using the RT WL QC manual for the calculation of vessel dynamic under-keel clearance in Australian ports.
3. HoHonu, a commercial manufacturer of water level gauges (Hohonu, 2024). On their frequently asked questions page they state “Processed QA/QC data - “Cleaned” data following QARTOD methodologies, implemented over four years of collaboration with SECOORA, Axiom Data Science, and NOAA CO-OPS”.
Regarding sufficient practice documentation, indeed the purpose of QARTOD manuals is to convey standardized QC practices to the eleven U.S. IOOS regional association data managers. Collectively, these data managers have used the QC manuals to create GitHub pages which further support standardization.
All QARTOD manuals are posted on the U.S. IOOS web page (U.S IOOS Website, 2024), and reside on both the NOAA Institutional Repository (NOAA repository, 2024) and the OBPS repository. Because the QARTOD acronym is quite unique, an internet search using any engine makes the manuals readily findable.
The process for updating all QARTOD manuals is described in the QARTOD project plan update (U.S. Integrated Ocean Observing System, 2022a), and as previously noted, this has been conducted twice for this manual. The format for the results of the QC tests (QC data flags) is described in (U.S. Integrated Ocean Observing System, 2020), which adheres to the IOC standard described in (Intergovernmental Oceanographic Commission, 2013).
All documents in the NOAA Institutional Repository are required to be Section 508 (U.S. Access Board, 2024) compliant. Section 508 compliance is a machine-readable U.S. standard designed to enable disabled individuals equal access to documents. As of January 18, 2018, all government documents posted online are required to be Section 508 compliant.
Level 5: QARTOD RT WL QC tests have been implemented by multiple international entities. The manual focuses on quality control, a critical aspect of quality assessment. Feedback is obtained through quarterly QARTOD Board of Advisors meetings and broadly distributed requests for comments during manual updates by the National Coordinator. These updates are either incremental (no change to QC tests already implemented) or substantial updates (requested by the community and requiring changes to an implemented test), as described in U.S. Integrated Ocean Observing System (2022a). Finally, the purpose of the manual is in fact to train data managers in the activity of data quality control in real time.
Interviews were done with the primary author of each of seven practices endorsed by GOOS/OBPS and held in the Ocean Best Practices System Repository. See Table 7. All the practices had completed the attributes of Levels 1, 2 and 3. As a result, they are not included in the table, and only Levels 4 and 5 are shown.
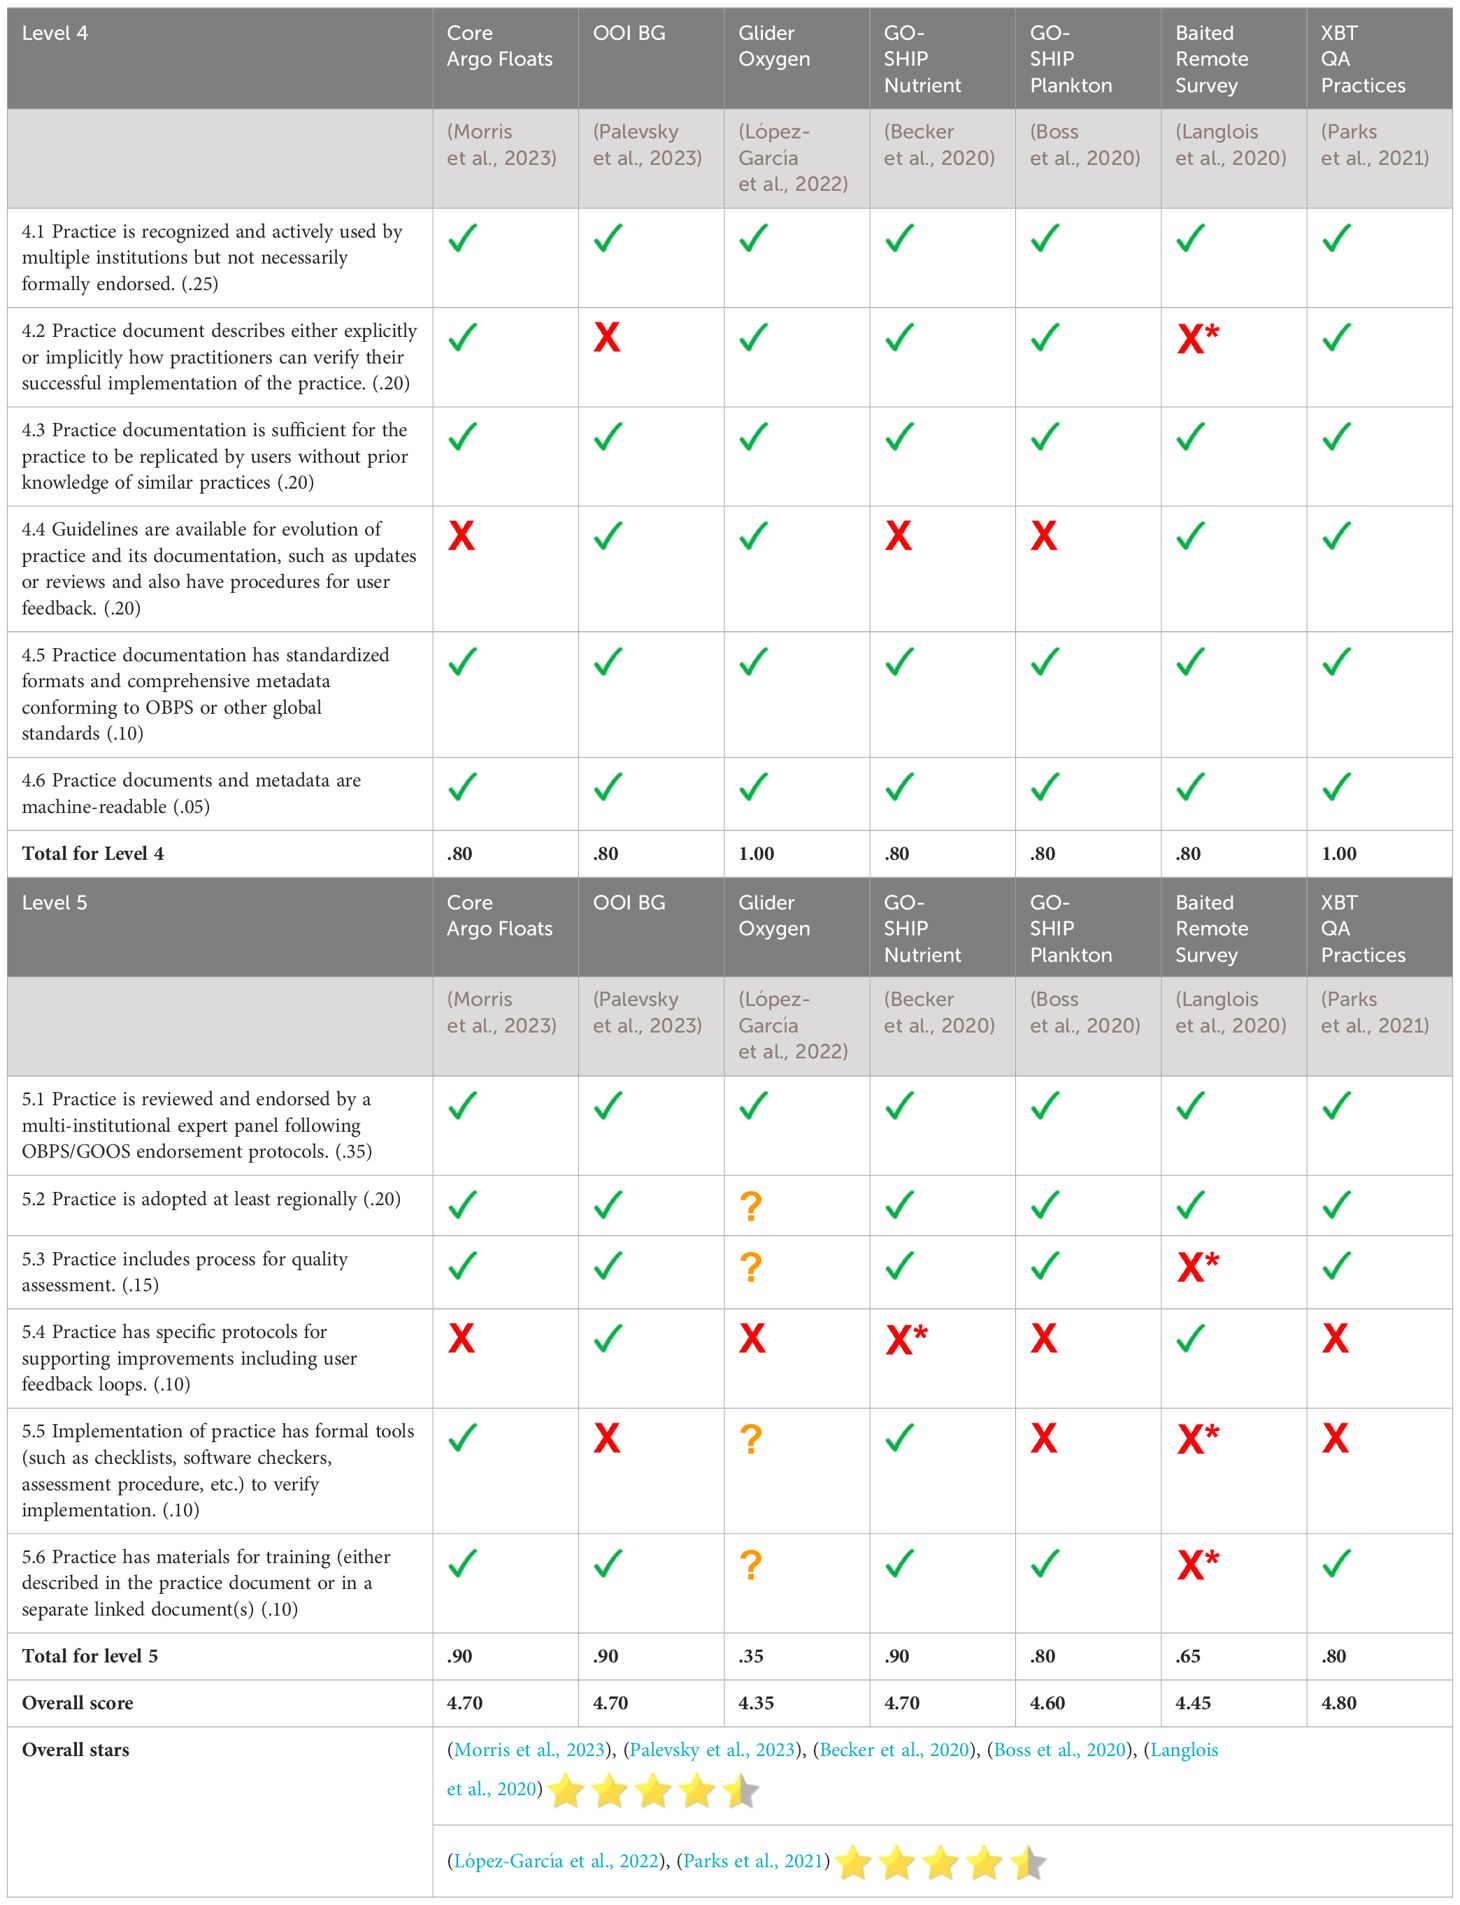
Table 7. Overview of endorsed practice assessment by practices lead authors. In the table, V means a practice complies with the attribute, X means a practice does not comply with the attribute (X* - a new version will be published soon which is compliant in this area), and? means there is not sufficient information to determine compliance. Since the interviews, the maturity model was refined to clarify the attributes.
The interviews covered both practice maturity and the ease or difficulty of using the attributes in each of the maturity levels. The assessment served as a way to see where there were gaps in the practice capabilities that should be addressed in moving to a fully mature best practice (Level 5). Generally, the endorsed practices included guidance in duplicating the practice, most of the time by experts and at times by new users. This is understandable, for some of these practices, as technologies like DNA applications in the GO-SHIP plankton endorsed practice require expertise for their implementation.
It is important to recognize that endorsement is not synonymous with being a mature best practice. The endorsement criteria (Bushnell and Pearlman, 2024) and (Hermes, 2020) do not include all attributes of a Level 5 mature practice. The differences are attributes such as continuous improvement and training. Thus, to be mature, a practice must be endorsed. On the other hand, an endorsed practice may not include all the attributes to be fully mature. In the interviews summarized in Table 7, these differences are apparent.
The responses of the lead authors for their endorsed practices are given in Table 7. According to the scoring system of the maturity model, where credit can be given on the attribute of the next higher level, all of the endorsed practices were at Level 4 “Better Practice”. There are several attributes in Level 5 that are not addressed by most of the practices. These include guidelines and protocols for continuous improvement, formal monitoring for implementation and documented training materials. These are a foundation for sustaining and improving practices and are essential for a best practice. During the interviews, many of the lead authors agreed that these elements are important and indicated that, as a result of the interviews, they will be addressed in the next version of the practice. Setting such goals for practices is one benefit of the maturity model.
Whether the issue is climate, marine litter or productivity of aquaculture, practices are created and evolve to observe and analyze conditions to support decision making. There are many practices in ocean research and applications which are created to address a particular measurement for understanding the ocean and coastal environment. Sometimes these practices align or are naturally complementary. Sometimes there are different approaches for the same end goal. This presents a problem for practitioners to decide which method to use as they engage in new projects or applications.
An important question is what is a good practice or, ultimately, what is a best practice?
To address these questions in a systematic way, a maturity model for ocean practices was developed. The model is built upon the experience over the last four decades in creating maturity models for systems and software. There are challenges in doing this, relating to the degree of generality or specificity that is needed for a practical model. General models endure, useful for strategic guidance; more detailed models are effective for assessing the exact status of maturity but may need to evolve more often.
For oceans, a five level model was chosen to provide a balance between generality and specificity. The model has detailed attributes at each level to make the assessment more quantitative. In addition, the attributes identify actions needed to move toward higher levels of maturity. In the process, the model addresses both the maturity of the practice description (documentation) and maturity of its implementation. The implementation maturity and, in particular, the sustainability and evolution of the practice are generally not addressed by experts and yet are essential to foster regional and global interoperability of practices.
The model was tested against practices with widespread adoption, some of which were also formally endorsed using a GOOS/OBPS endorsement process. In this testing, it was observed that a number of Level 5 attributes were not satisfied. These relate to sustainment and evolution of the practice. In testing practices with reference to the maturity model, practice authors agreed that there are gaps in their practice attributes and that the model was very useful in defining next steps for upgrading the practice to a best practice.
Propagating the maturity model to encourage widespread use is needed and will be done through incorporation of the model by various organizations as they guide ocean research and applications. Additional attributes for the model are under study. One question is whether there should be an attribute in the maturity matrix to credit a practice that is usable for a wide range of stakeholders with different resource availability. OBPS has a task team to address this, looking at applicability of practices in regions with limited human or infrastructure resources. This is important. The challenge is to define quantitative criteria to measure this attribute on a global scale. It is anticipated that this topic and others will be addressed in the next evolution of the maturity model.
In summary, the maturity model can identify key gaps in the evolution of a practice. It provides a definition for good, better, and best practices. The maturity model is a “living” concept which is expected to evolve over time. The work here provides a necessary foundation for widespread dialog on maturing and globalizing practices to support understanding processes, interoperability, and trust.
The original contributions presented in the study are included in the article/supplementary material. Further inquiries can be directed to the corresponding author.
CM: Conceptualization, Writing – original draft, Writing – review & editing, Methodology, Visualization. JP: Conceptualization, Methodology, Visualization, Writing – original draft, Writing – review & editing. AR: Conceptualization, Methodology, Visualization, Writing – original draft, Writing – review & editing. RP: Conceptualization, Methodology, Visualization, Writing – original draft, Writing – review & editing. MB: Conceptualization, Methodology, Visualization, Writing – original draft, Writing – review & editing. PS: Conceptualization, Methodology, Visualization, Writing – original draft, Writing – review & editing. LC: Conceptualization, Methodology, Visualization, Writing – original draft, Writing – review & editing. EA: Conceptualization, Methodology, Visualization, Writing – original draft, Writing – review & editing. SC: Conceptualization, Methodology, Visualization, Writing – original draft, Writing – review & editing. HR: Conceptualization, Methodology, Visualization, Writing – original draft, Writing – review & editing.
The author(s) declare financial support was received for the research, authorship, and/or publication of this article. The Funders are not responsible for any use that may be made of the information it contains. LC, CM, JP, AR, PS, received funding from the JERICO-S3 European Union’s Horizon 2020 research and innovation programme under grant agreement No. 871153. Project Coordinator: Ifremer, France. LC, CM, JP, AR, PS, received funding from EuroSea, the European Union’s Horizon 2020 research and innovation programme under grant agreement No. 862626. Project Coordinator: GEOMAR, Germany. JP and PS received funding from ObsSea4Clim. ObsSea4Clim “Ocean observations and indicators for climate and assessments” is funded by the European Union. Grant Agreement number: 101136548. DOI: 10.3030/101136548. Contribution nr. #1. Project Coordinator Danmarks Meteorologiske Institut (DMI). EA has received funding from Mercator Ocean International. MB received funding support from the U.S. Integrated Ocean Observing System (U.S. IOOS®) under prime contract 1305-M2-21F-NCNA0208. SC received funding from Australia's Integrated Marine Observing System, enabled by the National Collaborative Research Infrastructure Strategy (NCRIS). JP and PS received support under the European Climate, Infrastructure and Environment Executive Agency (CINEA) under contract number CINEA/EMFAF/2023/3.5.1/SI2.916032 “Standards and Best Practices in Ocean Observation” CINEA/2023/OP/0015.
The authors would like to thank lead authors of endorsed practices that have engaged in the testing of the maturity model. These include (in alphabetical order) Susan Becker, Emmanuel Boss, Tim Langlois, Patricia Lopez-Garcia, Tammy Morris, Hilary Palevsky, Justine Parks. Australia’s Integrated Marine Observing System (IMOS) is enabled by the National Collaborative Research Infrastructure Strategy (NCRIS). It is operated by a consortium of institutions as an unincorporated joint venture, with the University of Tasmania as Lead Agent. The work of the IOC Ocean Best Practices System, co-sponsored by GOOS and IODE, has provided a foundation for the development of this paper. This includes the procedures for endorsement of practices done collaboratively by GOOS and OBPS.
RP was employed by company RPS Australia Asia Pacific and MB was employed by CoastalObsTechServices LLC.
The remaining authors declare that the research was conducted in the absence of any commercial or financial relationships that could be construed as a potential conflict of interest.
All claims expressed in this article are solely those of the authors and do not necessarily represent those of their affiliated organizations, or those of the publisher, the editors and the reviewers. Any product that may be evaluated in this article, or claim that may be made by its manufacturer, is not guaranteed or endorsed by the publisher.
American Public Health Association (APHA) (1976). Standard Methods for the Examination of Water and Wastewater. 14th Edition (Washington DC: American Public Health Association), 1193.
AusSeabed (2024). A collaborative national seabed mapping initiative that is central to the Australian seabed information ecosystem. Available online at: https://www.ausseabed.gov.au/ (Accessed April 9, 2024).
Bax N. J., Williams A. (2001). Seabed habitat on the south-eastern Australian continental shelf: context, vulnerability and monitoring. Mar. Freshw. Res. 52, 491–512. doi: 10.1071/MF00003
Becker S., Aoyama M., Woodward E. M. S., Bakker K., Coverly S., Mahaffey C., et al. (2020). GO-SHIP repeat hydrography nutrient manual: the precise and accurate determination of dissolved inorganic nutrients in seawater, using continuous flow analysis methods. Front. Mar. Sci. 7. doi: 10.3389/fmars.2020.581790
BIPM (2008). JCGM 100:2008. Evaluation of measurement data - Guide to the Expression of Uncertainty in Measurement (GUM) (Geneva: International Organization for Standardization).
Boss E., Waite A. M., Uitz J., Acinas S. G., Sosik H. M., Fennel K., et al. (2020). Recommendations for plankton measurements on the GO-SHIP program with relevance to other sea-going expeditions. SCOR Working Group 154 GO-SHIP Report. Sci. Committee Oceanic Res., 70. doi: 10.25607/OBP-718
Bridge T. C. L., Huang Z., Przeslawski R., Tran M., Siwabessy J., Picard K., et al. (2020). Transferable, predictive models of benthic communities inform marine spatial planning in a remote and data-poor region. Conserv. Sci. Pract. 2, e251. doi: 10.1111/csp2.251
Bushnell M., Pearlman J. (Eds.) (2024). Ocean Best Practices System Endorsement: Guidance for the Ocean Community, Version 2024-03-20 (Oostende, Belgium: Ocean Best Practices System), 8. doi: 10.25607/OBP-1983
Chapman R. D., Shay L. K., Graber H. C., Edson J. B., Karachintsev A., Trump C. L., et al. (1997). On the accuracy of HF radar surface current measurements: Intercomparisons with ship-based sensors. J. Geophys. Res. 102, 18,737–18,748. doi: 10.1029/97JC00049
Chrissis M. B., Konrad M. D., Shrum S. (2011). CMMI for Development: Guidelines for Process Integration and Product Improvement, 3rd Edition (Boston, MA, USA: Addison-Wesley Professional).
Corgnati L., Mantovani C., Novellino A., Rubio A., Mader J. (2024). “Recommendation Report 2 on improved common procedures for HFR QC analysis,” in JERICO-NEXT WP5-Data Management, Deliverable 5.14, Version 2.0 (IFREMER, Brest, France), 85. doi: 10.25607/OBP-944.2
Cosoli S., Grcic B. (2024). Quality Control procedures for IMOS Ocean Radar Manual. Version 3.0 (Hobart, Australia: Integrated Marine Observing System), 98. doi: 10.26198/5c89b59a931cb
de Vos S. J., Cosoli S., Munroe J. (2020). The traveling wave loop antenna: A terminated wire loop aerial for directional high-Frequency ocean RADAR transmission. Remote Sens 12, 2800. doi: 10.3390/rs12172800
Edwing R. F. (2019). NOAA’s physical oceanographic realTime system (PORTS®). J. Oper. Oceanogr. 12:sup2, S176–S186. doi: 10.1080/1755876X.2018.1545558
Github - AusSeabed (2024). Australian multibeam guidelines. Available online at: https://Australian-multibeam-guidelines.github.io/ (Accessed April 9, 2024).
Github - Field Manuals (2024). Field manuals for marine sampling to monitor Australian waters, introduction. Available online at: https://introduction-field-manual.github.io/ (Accessed April 9, 2024).
GLOSS (2024). The global sea level observing system. Available online at: https://www.gloss-sealevel.org/ (Accessed April 9, 2024).
Gurgel K. W. (1994). “Shipborne measurement of surface current fields by HF Radar,” in Proceedings of OCEANS’94 (Washington DC, USA: IEEE), III–I23.
Gurgel K. W., Antonischki G., Essen H. H., Schlick T. (1999). Wellen Radar (WERA): a new ground-wave HF Radar for ocean remote sensing. Coast. Eng. 37, 219–234. doi: 10.1016/S0378-3839(99)00027-7
Hermes J. (Ed.) (2020). GOOS Best Practices Endorsement Process. Version 1. (Paris, France: Global Ocean Observing System), 7. doi: 10.25607/OBP-926
Hirshorn S., Jefferies S. (2016). Final Report of the NASA Technology Readiness Assessment (TRA) Study Team (NASA). Available online at: https://ntrs.nasa.gov/api/citations/20170005794/downloads/20170005794.pdf (Accessed April 9, 2024).
Hofmann C., Healy J. (2017).Real-time quality control experiences using QARTOD in Australian ports. In: Australasian Coasts & Ports 2017: Working with Nature (Barton, ACT: Engineers Australia, PIANC Australia and Institute of Professional Engineers New Zealand). Available online at: https://omcinternational.com/wp-content/uploads/2019/07/Coasts-Ports-2017-Real-time-Quality-Control-Experiences-using-QARTOD-in-Australian-Ports.pdf (Accessed 21 March 2024).
Hohonu (2024). Available online at: https://www.hohonu.io/ (Accessed April 9, 2024).
Hörstmann C., Buttigieg P. L., Simpson P., Pearlman J., Karstensen J., Waite A. M. (2020). Towards a Best Practice for Developing Best Practices in Ocean Observation (BP4BP): Supporting Methodological Evolution through Actionable Documentation (Paris, France: UNESCO), 33. (Intergovernmental Oceanographic Commission Manuals and Guides No. 84). (IOC/2020/MG/84). doi: 10.25607/OBP-781
Intergovernmental Oceanographic Commission (2013). “Ocean data standards volume 3,” in Recommendation for a Quality Flag Scheme for the Exchange of Oceanographic and Marine Meteorological Data, vol. 54. (UNESCO-IOC, Paris, France), 5. Annexes. (Intergovernmental Oceanographic Commission Manuals and Guides. doi: 10.25607/OBP-6
ISO/IEC 15504 (SPICE). Available online at: https://www.plays-in-business.com/isoiec-15504-spice/ (Accessed April 9, 2024).
ISO 9001:2015 (2024). Quality management systems, Requirements. Available online at: https://www.iso.org/standard/62085.html (Accessed April 9, 2024).
Jena B., Arunraj K. S., Suseentharan V., Tushar K., Karthikeyan T. (2019). Indian coastal ocean radar network. Curr. Sci. 116, 372–378. doi: 10.18520/cs/v116/i3/372-378
Langlois T., Goetze J., Bond T., Monk J., Abesamis R. A., Asher J., et al. (2020). A field and video annotation guide for baited remote underwater stereo-video surveys of demersal fish assemblages. Methods Ecol. Evol. 11, 1401–1409. doi: 10.1111/2041-210X.13470
Lindstrom E., Gunn J., Fischer A., McCurdy A., Glover L. K., Alverson K., et al. (2012). A Framework for Ocean Observing. (Paris, France: UNESCO), 25. (IOC Information Document 1284, Rev. 2). doi: 10.5270/OceanObs09-FOO
López-García P., Hull T., Thomsen S., Hahn J., Queste B. Y., Bastien Y., et al. (2022). OceanGliders Oxygen SOP, Version 1.0.0. (OceanGliders), 55. doi: 10.25607/OBP-1756
Lorente P., Aguiar E., Bendoni M., Berta M., Brandini C., Cáceres-Euse A., et al. (2022). Coastal high-frequency radars in the Mediterranean – Part 1: Status of operations and a framework for future development. Ocean Sci. 18, 761–795. doi: 10.5194/os-18-761-2022
Lucieer V., Flukes E., Monk J., Walsh P. (2024). Geomorphometric maps of Australia’s Marine Park estate and their role in improving the integrated monitoring and management of marine ecosystems. Front. Mar. Sci. 10. doi: 10.3389/fmars.2023.1302108
Lutkevich B. (2024). Capability maturity model (CMM). Available online at: https://www.techtarget.com/searchsoftwarequality/definition/Capability-Maturity-Model (Accessed April 9, 2024).
Mantovani C., Pearlman J., Simpson P. (Eds.) (2023). JERICO-S3 Deliverable 5.2. Electronic Handbook for Mature Platforms: Mooring - HF Radar - FerryBox – Glider. Version 1.1. (Brest, France: IFREMER for JERICO-S3), 195. JERICO-S3-WP5-D5.2.-310123-V1.1). doi: 10.25607/OBP-1945
Misiuk B., Brown C. J. (2024). Benthic habitat mapping: A review of three decades of mapping biological patterns on the seafloor. Estuarine Coast. Shelf Sci. 296, 108599. doi: 10.1016/j.ecss.2023.108599
Morris T., Scanderbeg M., West-Mack D., Gourcuff C., Poffa N., Bhaskar T. V. S. U., et al. (2023). Best practices for Core Argo floats: Getting started, physical handling, metadata, and data considerations. Version 1. (Cape Town South Africa: South African Environmental Observation Network (SAEON)), 45. doi: 10.25607/OBP-1967
Newsom J. (2024). Process maturity levels. Available online at: https://www.stratechi.com/process-maturity-levels/ (Accessed 21 January 2024).
NOAA (2019). NOAA NAO 216-105B policy on research and development transitions. Available online at: https://www.noaa.gov/organization/administration/nao-216-105b-policy-on-research-and-development-transitions (Accessed March 21, 2024).
NOAA repository (2024). National Oceanic and Atmosferic Administration, institutional repository. Available online at: https://repository.library.noaa.gov/ (Accessed April 9, 2024).
Ocean Best Practices System (2023). “Best Practices document template: sensors,” in Version 2023-06-26 (International Oceanographic Data and Information Exchange (IODE) for Ocean Best Practices System, Oostende, Belgium), 8. doi: 10.25607/OBP-758
OceanBestPractices System (OBPS) (2024). Oostende, Belgium, International Oceanographic Data and Information Exchange (IODE) of UNESCO-IOC. Available online at: https://www.oceanbestpractices.org/ (Accessed 09 April 2024).
Palevsky H. I., Clayton S., Atamanchuk D., Battisti R., Batryn J., Bourbonnais A., et al. (2023). OOI Biogeochemical Sensor Data: Best Practices & User Guide, Version 1.1.1 (Woods Hole, MA, USA: Ocean Observatories Initiative, Biogeochemical Sensor Data Working Group), 135. doi: 10.25607/OBP-1865.2
Parks J., Bringas F., Hanstein C., Krummel L., Cowley R., Sprintall J., et al. (2021). XBT Operational Best Practices for Quality Assurance, Version 1.0. (San Diego, CA: Scripps Institution of Oceanography, Climate, Atmospheric Sciences, and Physical Oceanography, University of California), 32. doi: 10.25607/OBP-1720
Pearlman J., Bushnell M., Coppola L., Karstensen J., Buttigieg P. L., Pearlman F., et al. (2019). Evolving and sustaining ocean best practices and standards for the next decade. Front. Mar. Sci. 6, 19. doi: 10.3389/fmars.2019.00277
Pennypacker J. S., Grant K. P. (2002).Project management maturity: an industry-wide assessment. In: Paper presented at PMI® Research Conference 2002: Frontiers of Project Management Research and Applications, Seattle, Washington (Newtown Square, PA: Project Management Institute). Available online at: https://www.pmi.org/learning/library/pm-maturity-industry-wide-assessment-9000 (Accessed 29 February 2024).
Picard K., Leplastrier A., Austine K., Bergersen N., Cullen R., Dando N., et al. (2020). Australian Multibeam Guidelines [Version 2] (Canberra, Australia: NESP Marine Biodiversity Hub), 67. doi: 10.11636/Record.2018.019
Post A. L., Przeslawski R., Nanson R., Siwabessy J., Smith D., KirkendaleL A., et al. (2022). Modern dynamics, morphology and habitats of slope-confined canyons on the northwest Australian margin. Mar. Geol. 443, 106694. doi: 10.1016/j.margeo.2021.106694
Przeslawski R., Barrett N., Carroll A., Foster S., Gibbons B., Jordan A., et al. (2023). Developing an ocean best practice: a case study of marine sampling practices from Australia. Front. Mar. Sci. 10. doi: 10.3389/fmars.2023.1173075
Przeslawski R., Foster S., Gibbons B., Langlois T., Monk J. (2021). Impact and Outcomes of Marine Sampling Best Practices. (Canberra, Australia: National Environmental Science Program, Marine Biodiversity Hub. Geoscience Australia), 17. doi: 10.25607/OBP-1038
Przeslawski R., Foster S., Monk J., Barrett N., Bouchet P., Carroll A., et al. (2019). A suite of field manuals for marine sampling to monitor Australian waters. Front. Mar. Sci. 6. doi: 10.3389/fmars.2019.00177
Rattray A., Ierodiaconou D., Monk J., Versace V. L., Laurenson L. J. B. (2013). Detecting patterns of change in benthic habitats by acoustic remote sensing. Mar. Ecol. Prog. Ser. 477, 1–13. doi: 10.3354/meps10264
Reyes E., Aguiar E., Bendoni M., Berta M., Brandini C., Cáceres-Euse A., et al. (2022). Coastal high-frequency radars in the Mediterranean – Part 2: Applications in support of science priorities and societal needs. Ocean Sci. 18, 797–837. doi: 10.5194/os-18-797-2022
Roarty H., Cook T., Hazard L., Harlan J., Cosoli S., Wyatt L., et al. (2019b). The global high frequency radar network. Front. Mar. Sci. 6. doi: 10.3389/fmars.2019.00164
Roarty H., Klein J., Dante S., Cope A., Johnson S., Daugharty M. (2019a). “Evaluation of wave data from HF radar by the national weather service,” in 2019 IEEE/OES Twelfth Current, Waves and Turbulence Measurement (CWTM), San Diego, CA, USA, 1–4. doi: 10.1109/CWTM43797.2019.8955189
Rosenstock C., Johnston R. S., Anderson L. M. (2000). Maturity model implementation and use: a case study. (Project Management Institute, Seminars & Symposium). Available online at: https://www.pmi.org/learning/library/maturity-model-implementation-case-study-8882 (Accessed 05 March 2024).
Rubio A., Mader J., Corgnati L., Mantovani C., Griffa A., Novellino A., et al. (2017). HF radar activity in European coastal seas: next steps towards a pan-European HF radar network. Front. Mar. Sci. 4. doi: 10.3389/fmars.2017.00008
Tarhan A., Turetken O., Reijers H. A. (2016). Business process maturity models: a systematic literature review. Inf. Software Technol. 75, 122–134. doi: 10.1016/j.infsof.2016.01.010
UNESCO/IOC (2020). Quality Control of in situ Sea Level Observations: A Review and Progress towards Automated Quality Control, Vol. 1. Vol. 1. Ed. Pérez Gómez B., et al (Paris, France: UNESCO), 70. IOC Manuals and Guides No.83. doi: 10.25607/OBP-854
U.S. Access Board (2024). About the ICT accessibility 508 standards and 255 guidelines. Available online at: https://www.access-board.gov/ict/#about-the-ict-accessibility-standards (Accessed April 9, 2024).
U.S. Integrated Ocean Observing System (2020). Manual for the Use of Real-Time Oceanographic Data Quality Control Flags, Version 1.2. (Silver Spring, MD: U.S. Department of Commerce, National Oceanic and Atmospheric Administration, National Ocean Service, Integrated Ocean Observing System), 24. doi: 10.25923/w8y6-d298
U.S. Integrated Ocean Observing System (2021). Manual for Real-Time Quality Control of Water Level Data Version 2.1: A Guide to Quality Control and Quality Assurance of Water Level Observations, Vol. 47. doi: 10.25923/vpsx-dc82
U.S. Integrated Ocean Observing System (2022a). QARTOD Project Plan Update 2022–2026 Vol. 40 (Silver Spring, MD: U.S. Department of Commerce, National Oceanic and Atmospheric Administration, National Ocean Service, Integrated Ocean Observing System). doi: 10.25923/1tcg-ht56
U.S. Integrated Ocean Observing System (2022b). Manual for Real-Time Quality Control of High Frequency Radar Surface Current Data: a Guide to Quality Control and Quality Assurance for High Frequency Radar Surface Current Observations. Version 2.0 (Silver Spring, MD: U.S. Department of Commerce, National Oceanic and Atmospheric Administration, National Ocean Service, Integrated Ocean Observing System), 57. doi: 10.25923/4c5x-g538
U.S. IOOS Office (2010). U.S. Integrated Ocean Observing System: A Blueprint for Full Capability, Version 1.0 (Silver Spring, MD: U.S. Department of Commerce, National Oceanic and Atmospheric Administration, National Ocean Service, Integrated Ocean Observing System). Available online at: https://cdn.ioos.noaa.gov/media/2017/12/us_ioos_blueprint_ver1.pdf (Accessed 05 March 2024).
U.S IOOS Website (2024). U.S. Integrated Ocean Observing System website. Available online at: https://ioos.noaa.gov/ (Accessed April 9, 2024).
Keywords: ocean practices, best practices, maturity model, methodology, value chain, high frequency radar, multibeam, sea level
Citation: Mantovani C, Pearlman J, Rubio A, Przeslawski R, Bushnell M, Simpson P, Corgnati L, Alvarez E, Cosoli S and Roarty H (2024) An ocean practices maturity model: from good to best practices. Front. Mar. Sci. 11:1415374. doi: 10.3389/fmars.2024.1415374
Received: 10 April 2024; Accepted: 23 July 2024;
Published: 20 August 2024.
Edited by:
Toste Tanhua, Helmholtz Association of German Research Centers (HZ), GermanyReviewed by:
Anthony Bernard, South African Institute for Aquatic Biodiversity, South AfricaCopyright © 2024 Mantovani, Pearlman, Rubio, Przeslawski, Bushnell, Simpson, Corgnati, Alvarez, Cosoli and Roarty. This is an open-access article distributed under the terms of the Creative Commons Attribution License (CC BY). The use, distribution or reproduction in other forums is permitted, provided the original author(s) and the copyright owner(s) are credited and that the original publication in this journal is cited, in accordance with accepted academic practice. No use, distribution or reproduction is permitted which does not comply with these terms.
*Correspondence: Carlo Mantovani, Y2FybG8ubWFudG92YW5pQGNuci5pdA==
Disclaimer: All claims expressed in this article are solely those of the authors and do not necessarily represent those of their affiliated organizations, or those of the publisher, the editors and the reviewers. Any product that may be evaluated in this article or claim that may be made by its manufacturer is not guaranteed or endorsed by the publisher.
Research integrity at Frontiers
Learn more about the work of our research integrity team to safeguard the quality of each article we publish.