 Wenting Shi1,2,3
 Yabo Han
 Jun Sun
- 1Research Centre for Indian Ocean Ecosystem, Tianjin University of Science and Technology, Tianjin, China
- 2Southern Marine Science and Engineering Guangdong Laboratory (Zhuhai), Zhuhai, China
- 3Institute for Advanced Marine Research, China University of Geosciences, Guangzhou, China
This study examines the potential impacts of projected atmospheric carbon dioxide (pCO2) levels reaching 800 ppm by the end of the century, focusing on ocean acidification effects on marine ecosystems in the coastal areas of Bohai. We investigated how acidification affects the grazing patterns of microzooplankton using dilution techniques and ecophysiological methods. Our findings indicate that acidic conditions shift the phytoplankton community structure, changing dominant species. Elevated CO2 concentrations reduced grazing pressure on phytoplankton, with less steep declines in growth rates at 800 ppm CO2 (spring: 2.43 d−1 vs. 2.16 d−1, summer: −0.46 d−1 vs. −0.73 d−1, autumn: −0.45 d−1 vs. −0.90 d−1) and significant decreases in grazing pressure percentages (%Pp from 0.84 to 0.58 and %Pi from 0.64 to 0.46). Short-term acid exposure significantly increased superoxide dismutase activity in both microplankton (from 0.03 to 0.08 U mg−1, p<0.01) and nanoplankton (from 0.05 to 0.09 U mg−1, p<0.001), indicating an adaptive response to oxidative stress. These results highlight that elevated CO2 levels primarily boost phytoplankton growth by reducing microzooplankton grazing pressure, resulting in higher growth rates and a shift towards smaller-sized phytoplankton, reflecting complex short-term ecological responses to acidification. Further research is needed to understand the long-term effects of ocean acidification on microzooplankton and their role in marine secondary productivity.
1 Introduction
Ocean acidification is a decrease in the pH value of the ocean surface caused by carbon dioxide emissions, which has a profound impact on global biogeochemical cycles (Gattuso et al., 2018). This process disrupts marine ecosystem biogeochemical cycles, impacting nutrient cycling, productivity, and altering the composition of food chains and webs (Flynn et al., 2012). Ocean acidification adversely affects the survival and reproductive success of specific biological populations. As a result, these impacts extend to the broader ecological communities in which these populations exist (Pedersen and Hansen, 2003).
Advancements in acidification research have increasingly corroborated the adverse impacts of pH reduction on the survival, fecundity, and feeding behavior of microzooplankton, with implications for the oceanic carbon cycle and the transfer efficiency of energy to higher trophic levels (Hammill et al., 2018; Nelson et al., 2020). Nonetheless, investigations into the ecological ramifications of altered microzooplankton feeding behaviors under acidified conditions—particularly their protracted effects within natural environs—remain scant. Microzooplankton, pivotal in trophic cascades, bridge the microbial loop and the classical food chain (Azam et al., 1983; Caron and Hutchins, 2013). Prior inquiries have predominantly examined the influence of ocean acidification on the grazing rates of single microzooplankton species, with limited exploration into the impacts on natural communities feeding behaviors, thereby posing certain constraints. When organisms are exposed to high concentrations of CO2, they may struggle to reduce the internal CO2 concentration. This leads to an accumulation of CO2 and H+ in tissues and body fluids, which inhibits oxygen delivery. This condition is known as hyperacidemia. The physiological responses to hyperacidemia include impaired oxygen transport and delivery, which can significantly affect the organism’s overall health and functionality (Pörtner, 2008). Particularly, physiological responses such as microzooplankton sensitivity to hypercapnia are elusive in natural assemblages. Meunier et al. (2017) delineated both the direct and indirect effects of ocean acidification on a single species. Directly, acidification may induce a decrement in zooplankton pH value and enzymatic activity, thereby impinging on physiological functions. For calcifying taxa, for instance, acidification could erode their calcium carbonate structures (Christopher E. et al., 2021). The study reveals that ocean acidification leads to an increase in reactive oxygen species (ROS) and malondialdehyde (MDA) levels, indicative of heightened oxidative stress in marine organisms. Notably, the activities of enzymes such as superoxide dismutase (SOD), catalase (CAT), and alkaline phosphatase (AKP) initially rise before decreasing, illustrating a complex, nuanced response to acidified conditions. This pattern highlights the potential threat posed by ocean acidification, not only affecting physiological functions but also compromising immune defense mechanisms in marine life. Furthermore, these physiological changes have broader ecological implications. As (Ramaekers et al., 2022) suggested, zooplankton growth may be indirectly affected by the diminished quality of primary producers in environments with elevated pCO2 levels. This cascading effect from molecular changes to ecosystem dynamics underscores the far-reaching impact of ocean acidification. These observations suggest that the repercussions of ocean acidification on zooplankton are potentially twofold. This is linked to an associated decline in the quality of phytoplankton.
The response of the phytoplankton community to changes in environmental conditions may have the most significant indirect effect on the abundance, activity, and community composition of microzooplankton in the context of climate change. Phytoplankton serves as the primary food source for phytophagous microzooplankton, which directly or indirectly influences the quantity and composition of dissolved and particulate substances that enter the microbial food web, thereby serving as substrates for bacterial growth (Caron and Hutchins, 2013). Consequently, comprehending the impact of ocean acidification on the grazing rate and community dynamics of microzooplankton is essential for understanding the repercussions on both secondary productivity and primary productivity.
Contemporary research posits that ocean acidification may modify the feeding selectivity and efficiency of microzooplankton, subsequently affecting their ecological niche and functional role within the food web (Hammill et al., 2018). For instance, elevated acidification levels have been observed to skew certain microzooplankton preferences towards smaller prey, potentially restructuring community composition and trophic interactions (Hurd et al., 2018). Moreover, emerging research into the effects of acidification on the SOD activities in marine life, including microzooplankton, underscores the nuanced relationship between environmental stress factors and antioxidant defense mechanisms.
This study aims to fill the gap in current academic knowledge regarding the impact of ocean acidification on the feeding dynamics of microzooplankton communities. By employing a comprehensive methodology that merges controlled laboratory experiments with in-depth field studies, our aim is to accurately quantify how microzooplankton grazing rates vary under different acidification conditions. Moreover, this research will assess the broader implications of these changes on the structural and functional aspects of marine food webs. The expected outcomes of this study are poised to enhance our understanding of the ecological consequences of ocean acidification, providing crucial insights for the effective management and conservation of marine ecosystems.
2 Methods
2.1 Sample collection
Experiments were conducted at multiple points in time, including July, August, September, October of 2022, as well as March, April, and April of 2023. May and June. The sampling was collected surface seawater (<5m) from the coastal area of Bohai Sea in Tianjin, China (38°58’N, 117°50’E), filtered through a 200μm sieve, and filled in a 25L polyethylene bucket soaked in HCl in advance, which was quickly brought back to the laboratory for the preparation of acidified water. Instant temperature and pH were measured by S210-KpH meter (Mettller Toledo). For baseline community analysis, a 500ml aliquot of the initial water sample was reserved to examine the native microzooplankton and phytoplankton community structures. To analyze the fractionated chlorophyll a content, specific volumes of seawater were immediately filtered through 20μm and GF/F filter membrane (Whatman 47mm). The filter we use is Pall (4204), GFF membrane with a diameter of 25mm 0.2μm. Each fraction was then prepared in triplicate and stored at −20°C in a dark environment to prevent degradation.
2.2 Preparation of acidified seawater
Part of the collected seawater was filtered using a capsule filter and a GF/F membrane to make PFW (particle-free water). The PFW and initial seawater in the acidification group were mixed with high-pressure CO2 and CO2 enricher (CE100) for sufficient aeration to control the partial pressure of CO2 at 800 ppm. The non-acidification group used a fish pump for full aeration (approximately 30 minutes), with a standard atmospheric pressure of 400 ppm. The instant pH was measured by S210-KpH meter (Mettller Toledo) calibrated with pH 7 and 10 buffer solutions during the bubbling process. When the water sample was stable and the pH did not change, the aeration ended. The water samples were maintained at a constant temperature during the entire process.
2.3 Microzooplankton grazing experiment
In this experiment, we employed the dilution method, as outlined by (Landry and Hassett, 1982), to assess the grazing rate of microzooplankton and the intrinsic growth rate of phytoplankton. The particle-free water (PFW) was carefully mixed with the initial seawater sample in varying proportions: 20%, 40%, 60%, 80%, and 100%. During this process, we used the siphon method for sub-packaging to prevent bubble formation, ensuring that each culture flask was filled completely without leaving any air gaps.
Each dilution proportion was replicated in three parallel samples, forming the treatment groups. The 1.5 L culture flasks were incubated in an incubator, which was gently agitated every 2 hours to maintain uniform conditions. Light conditions simulated natural environmental cycles with a 12-hour light and 12-hour dark period. After the 24-hour incubation period, each culture flask was gently agitated to ensure uniformity, and the pH of the samples was accurately measured. To assess phytoplankton growth, chlorophyll-a samples were collected from each flask. This involved the graded filtration of a specific volume of seawater through filter membranes with varying pore sizes to separate different particle fractions. The chlorophyll-a samples were immediately stored in a dark environment at −20°C to prevent degradation.
The chlorophyll a concentration, derived from these samples, served as a key indicator for estimating the apparent growth rate (AGR) of phytoplankton. This method allowed us to measure changes in phytoplankton biomass as a response to varying microzooplankton grazing pressures under the different dilution treatments. The careful preservation and analysis of these samples were critical for accurately determining the ecological dynamics between microzooplankton and phytoplankton in the context of our study. The growth of phytoplankton is expressed as formula:
where t is the duration of the incubation in days, Po and Pt represent the initial and final concentrations of Chl a, respectively.
The apparent growth rate of phytoplankton
was calculated and linearly regressed with the actual dilution factor (ADF). The intercept of the equation was the intrinsic growth rate of phytoplankton (), and the slope was the grazing rate of zooplankton (m). According to the Equation 3, the net growth rate of phytoplankton (NGR), the grazing pressure of microzooplankton on phytoplankton standing stock (Pi), and the grazing pressure of microzooplankton on primary productivity (Pp) can be obtained:
2.4 Determination of SOD activity
The samples were immediately stored in a refrigerator (Haier DW-86L386) at −80°C after collection and filtration to maintain the activity before the determination of various indicators. SOD activity is a proxy for the cellular defense against reactive oxygen species, which are often elevated under stress conditions such as high CO2. For the determination of SOD activity, we employed a commercially available SOD assay kit, utilizing the WST-1 method, sourced from the Nanjing Jiancheng Institute of Bioengineering. The WST-1 method is a widely recognized technique for its sensitivity and accuracy in detecting SOD activity. It involves the use of a water-soluble tetrazolium salt that produces a water-soluble formazan dye upon reduction with a superoxide anion, allowing for the quantification of SOD activity based on the rate of the reduction process.
For the measurements, we used GF/F filters with a pore size of 0.2 µm and mesh screens with a pore size of 20 µm, consistent with those used for chlorophyll-a measurements. The samples were incubated at 37°C for 20 minutes according to the kit’s instructions, and absorbance was measured at 450 nm using a microplate reader. For SOD activity measurements, 5 ml samples were taken from each dilution gradient and averaged, excluding the initial seawater samples, focusing on comparing the differences between 400 ppm and 800 ppm CO2 concentrations.
2.5 Analysis of microzooplankton and phytoplankton community
Microplankton water samples were fixed with formaldehyde (final concentration 1%). Phytoplankton and microzooplankton samples were analyzed under RX50 optical microscope. After each 500mL sample was settled for one week, the supernatant was removed and shaken well. On the premise of ensuring that the microzooplankton and phytoplankton in the water sample were not shaken and broken, the species identification and individual counting were performed at 200× and 400× magnification.
The Microplankton and phytoplankton species were identified according to Isamu Y (Isamu, 1959), and Sun (Jun et al., 2002).
Phytoplankton community diversity was calculated according to the Shannon–Wiener (S–W) diversity index (H’) (Shannon, 1948):
where Pi represents the relative cell abundance of a species, i represents the numbers of the species, S represents the number of total species of phytoplankton in the samples collected.
The phytoplankton dominance index (Y) is calculated as follows:
ni: the number of a single species; N: the number of all species; fi: the frequency of occurrence of the species in the sample.
2.6 Statistical analysis
Canonical Correspondence Analysis (CCA) was conducted using Canoco 5.0 to analyze the cell abundance of species and environmental factors, with data sets transformed using log10(x+1). Hierarchical clustering was applied to perform a cluster analysis of phytoplankton, with the dissimilarity between different phytoplankton groups calculated using Primer 6 (version 6.1.12.0).
All measurements were replicated at least three times, and the data were expressed as mean values ± standard deviation (SD). ANOVA test was performed to compare the differences of various environmental and biological parameters between the 2 groups in present study. Significant differences were indicated at * p<0.05, ** p<0.02. Statistical analysis was performed using SPSS v. 16.0.
3 Result
3.1 Seasonal variation in phytoplankton community response to CO2 concentrations
3.1.1 Impact of elevated CO2 concentrations on phytoplankton size class distribution
At a CO2 concentration of 400 ppm, micro-phytoplankton were observed to have chlorophyll a proportions ranging from 42.60% to 72.19%. In contrast, nano-phytoplankton exhibited proportions varying from 27.81% to 57.40%, as detailed in Figure 1. This variability highlights the dynamic nature of the phytoplankton community structure, characterized by significant fluctuations in the dominance between these two size classes.
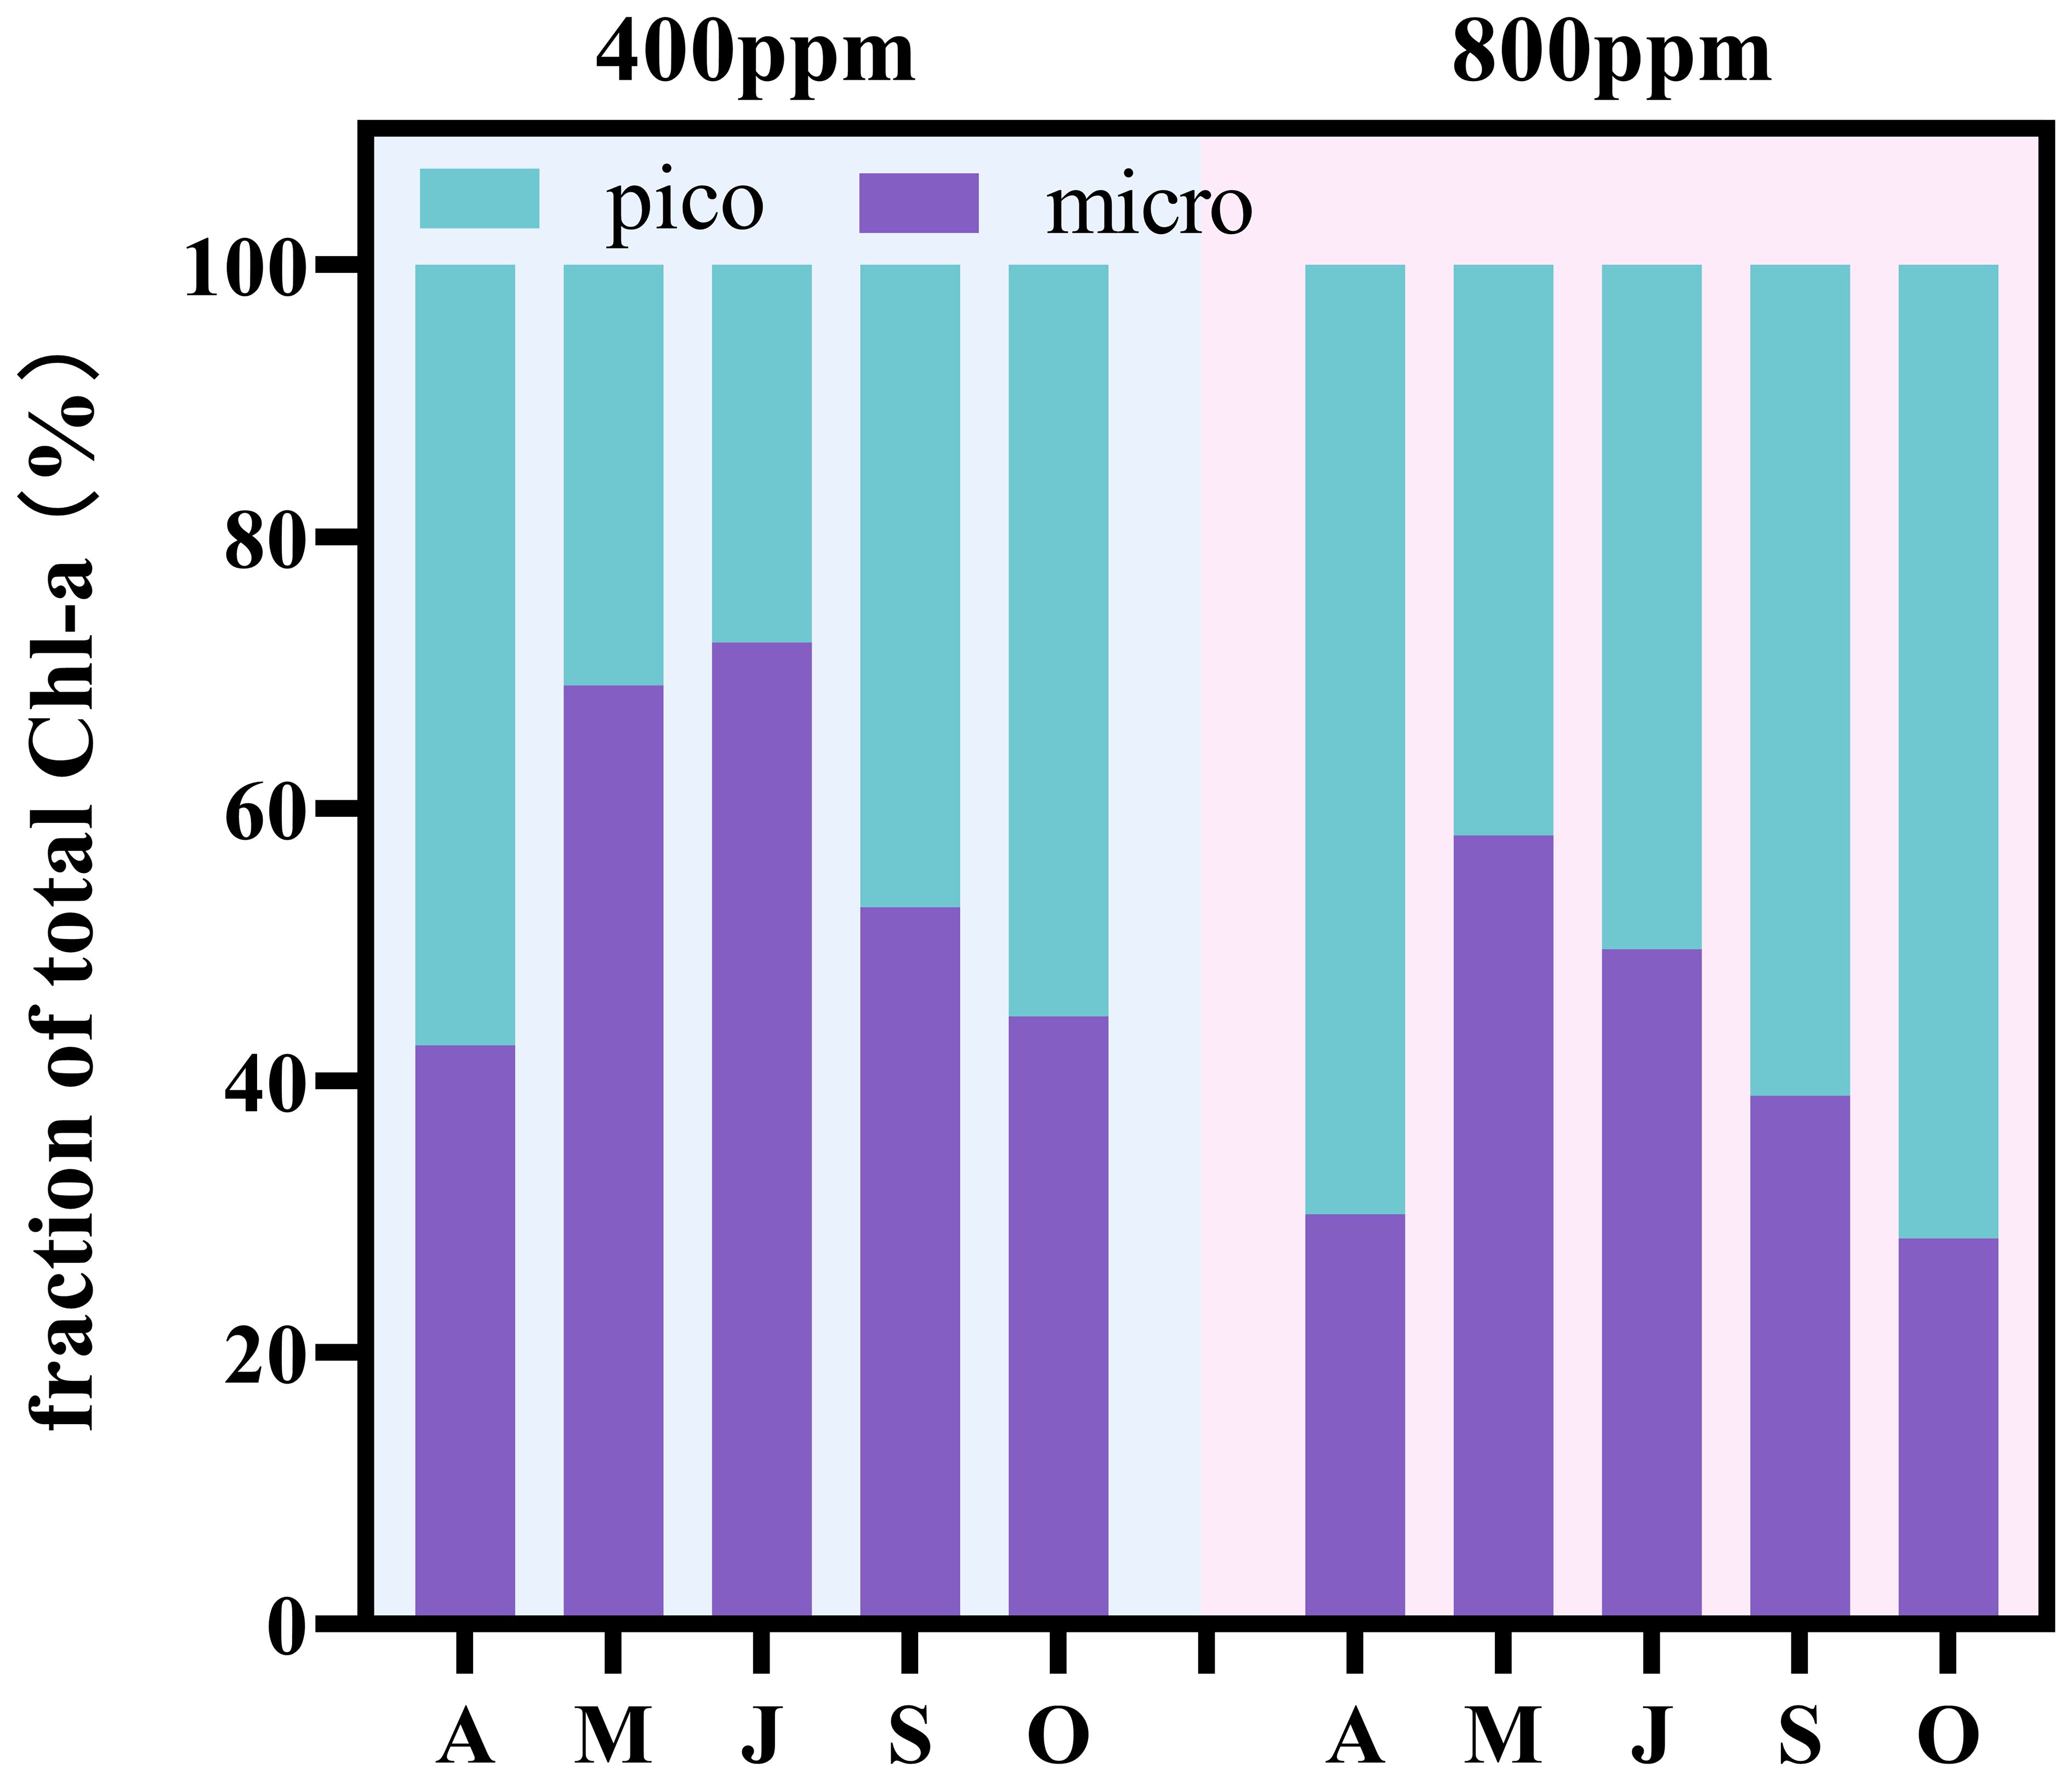
Figure 1 The proportion of total chlorophyll a accounted for by phytoplankton of different grain sizes.
In response to an increased CO2 concentration of 800 ppm, a distinct shift in the phytoplankton community was noted. Micro-phytoplankton chlorophyll a proportions declined to a range of 28.40% to 58.01%, while those of nano-phytoplankton increased to between 41.99% and 71.60%. This alteration in the size class distribution underscores a trend towards greater dominance of nano-phytoplankton under higher CO2 conditions (Figure 1). The observed shift suggests an ecological adaptation within the community, favoring smaller size classes as CO2 concentrations rise.
3.1.2 Spring responses
During the spring (Figure 2), at the standard atmospheric level of 400 ppm CO2, Chaetoceros tortissimus and Chaetoceros lauderi were amongst the most dominant, contributing to 14.87% and 13.29% of the community, respectively. At an elevated pCO2 of 800 ppm, the pie chart illustrates an adjustment in relative abundance with Chaetoceros pelagicus and Chaetoceros lorenzianus becoming more pronounced, possessing dominance (Y) indices of 0.14 and 0.12 (Table 1), respectively. This quantitative shift suggests a change in the relative fitness of these species under higher CO2, with potential implications for the structure and function of the spring phytoplankton community.
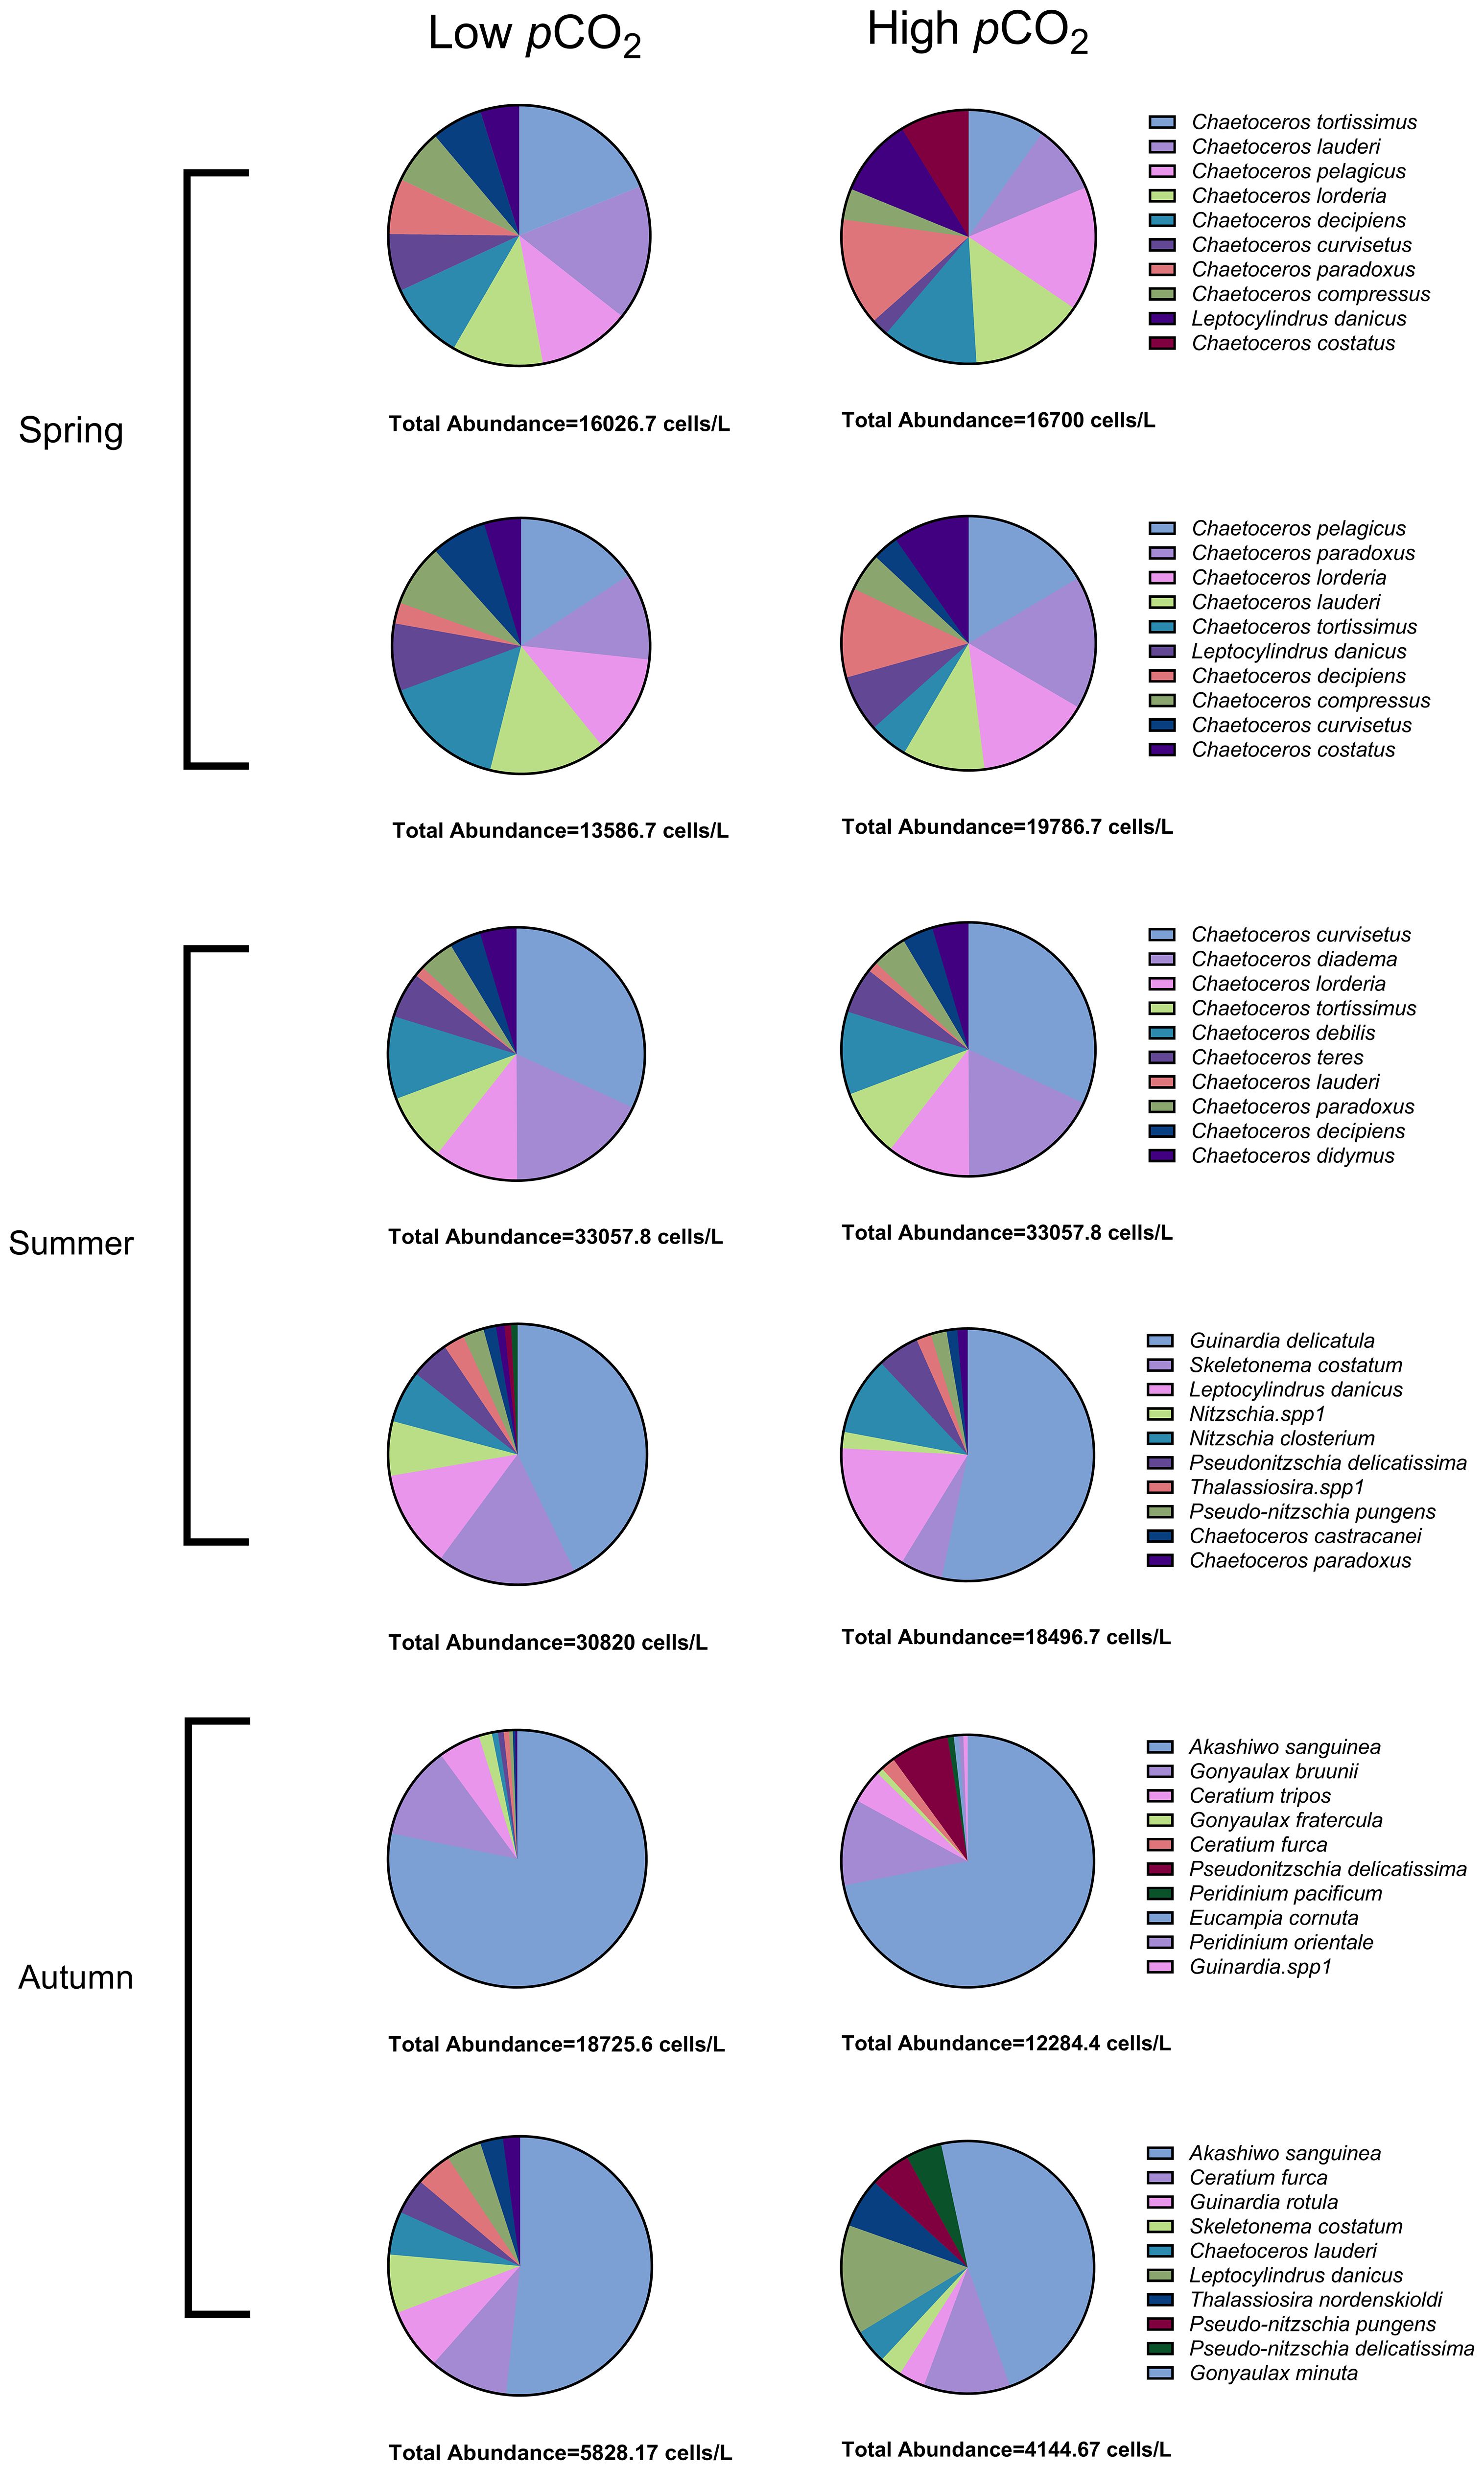
Figure 2 Seasonal phytoplankton community composition under different carbon dioxide conditions.
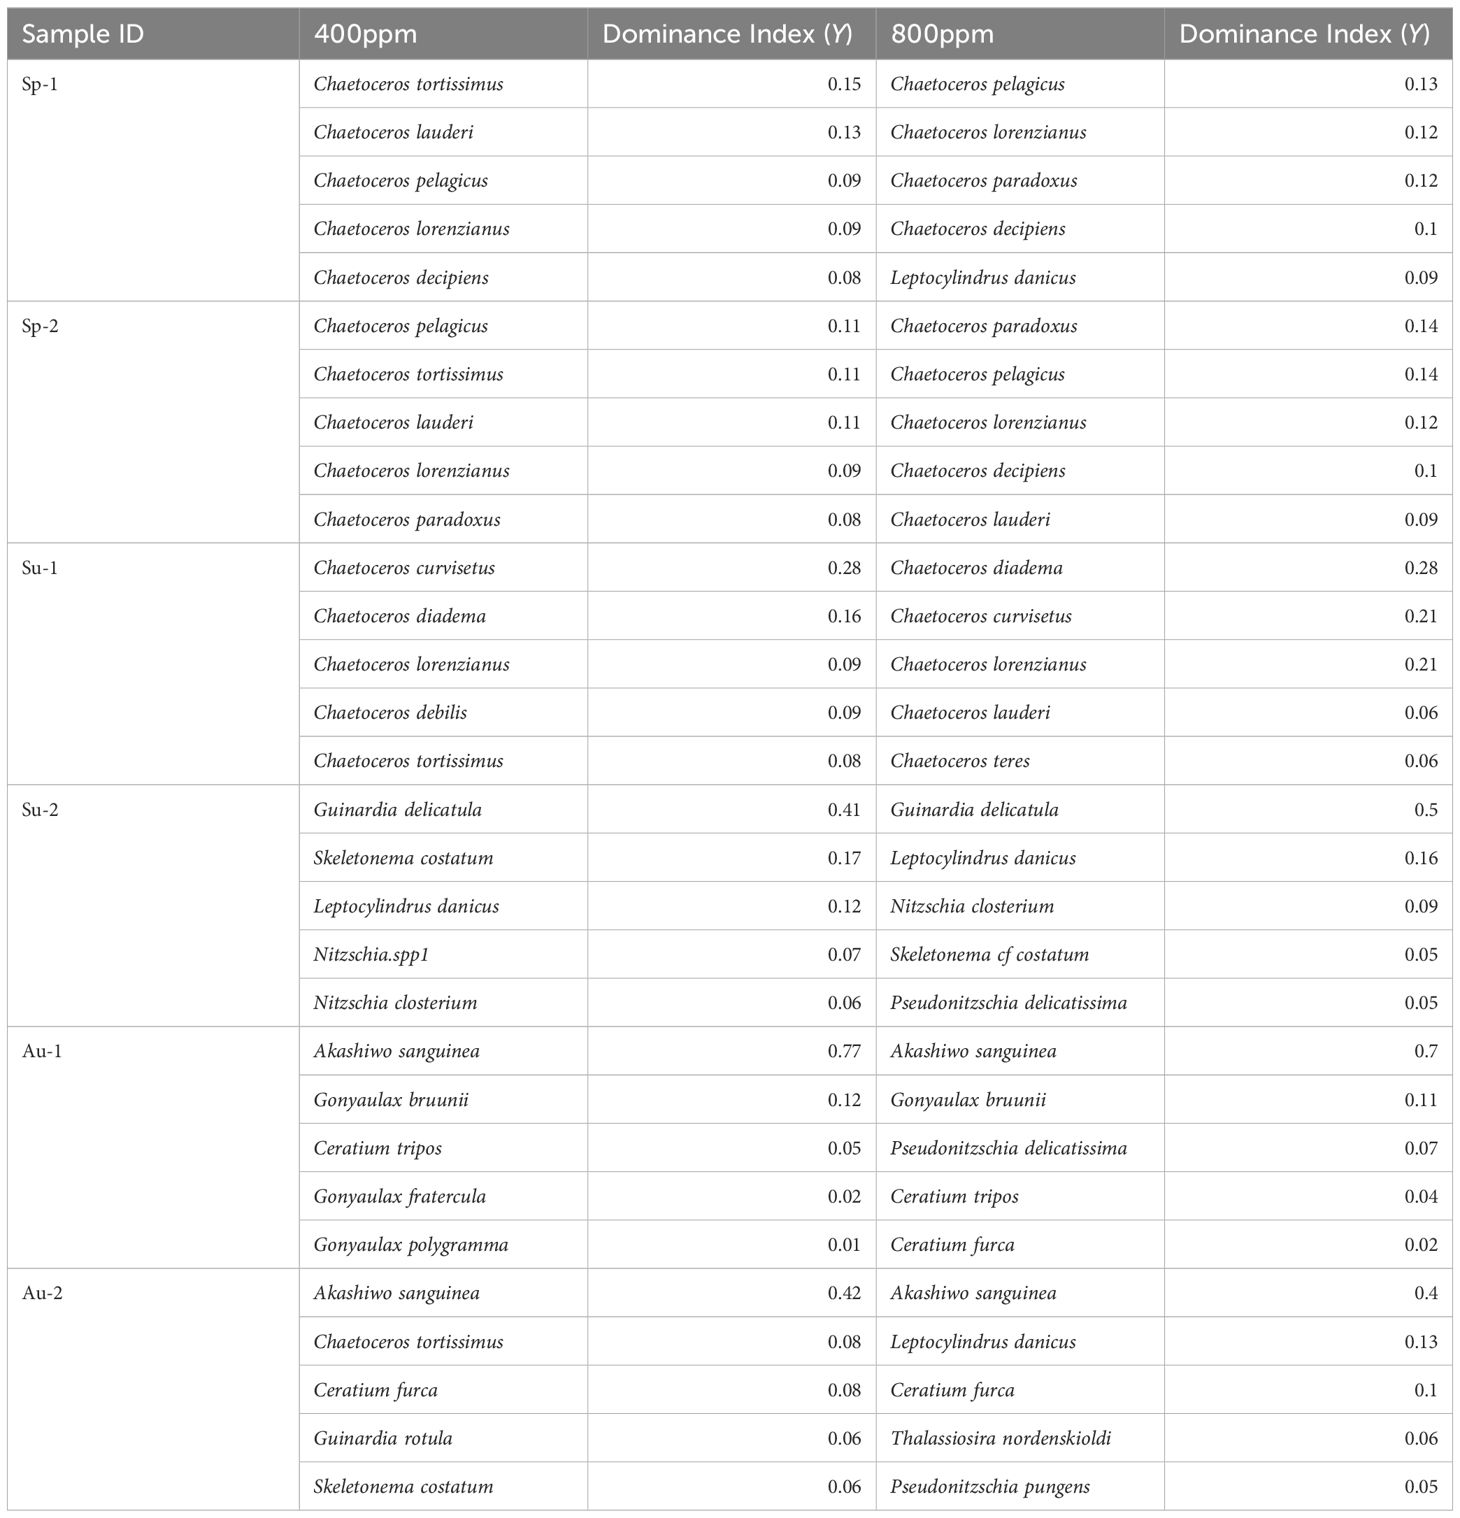
Table 1 The top six dominant species and their dominance index in the three seasons (spring, summer and autumn) calculated using Equation 7.
During the spring (Figure 3 A, S), under 400 ppm CO2 conditions, phytoplankton abundance is around 109 cells/L. However, under 800 ppm CO2 conditions, the abundance drops to approximately 108 cells/L. This suggests that elevated CO2 levels may suppress phytoplankton growth during the early spring months.
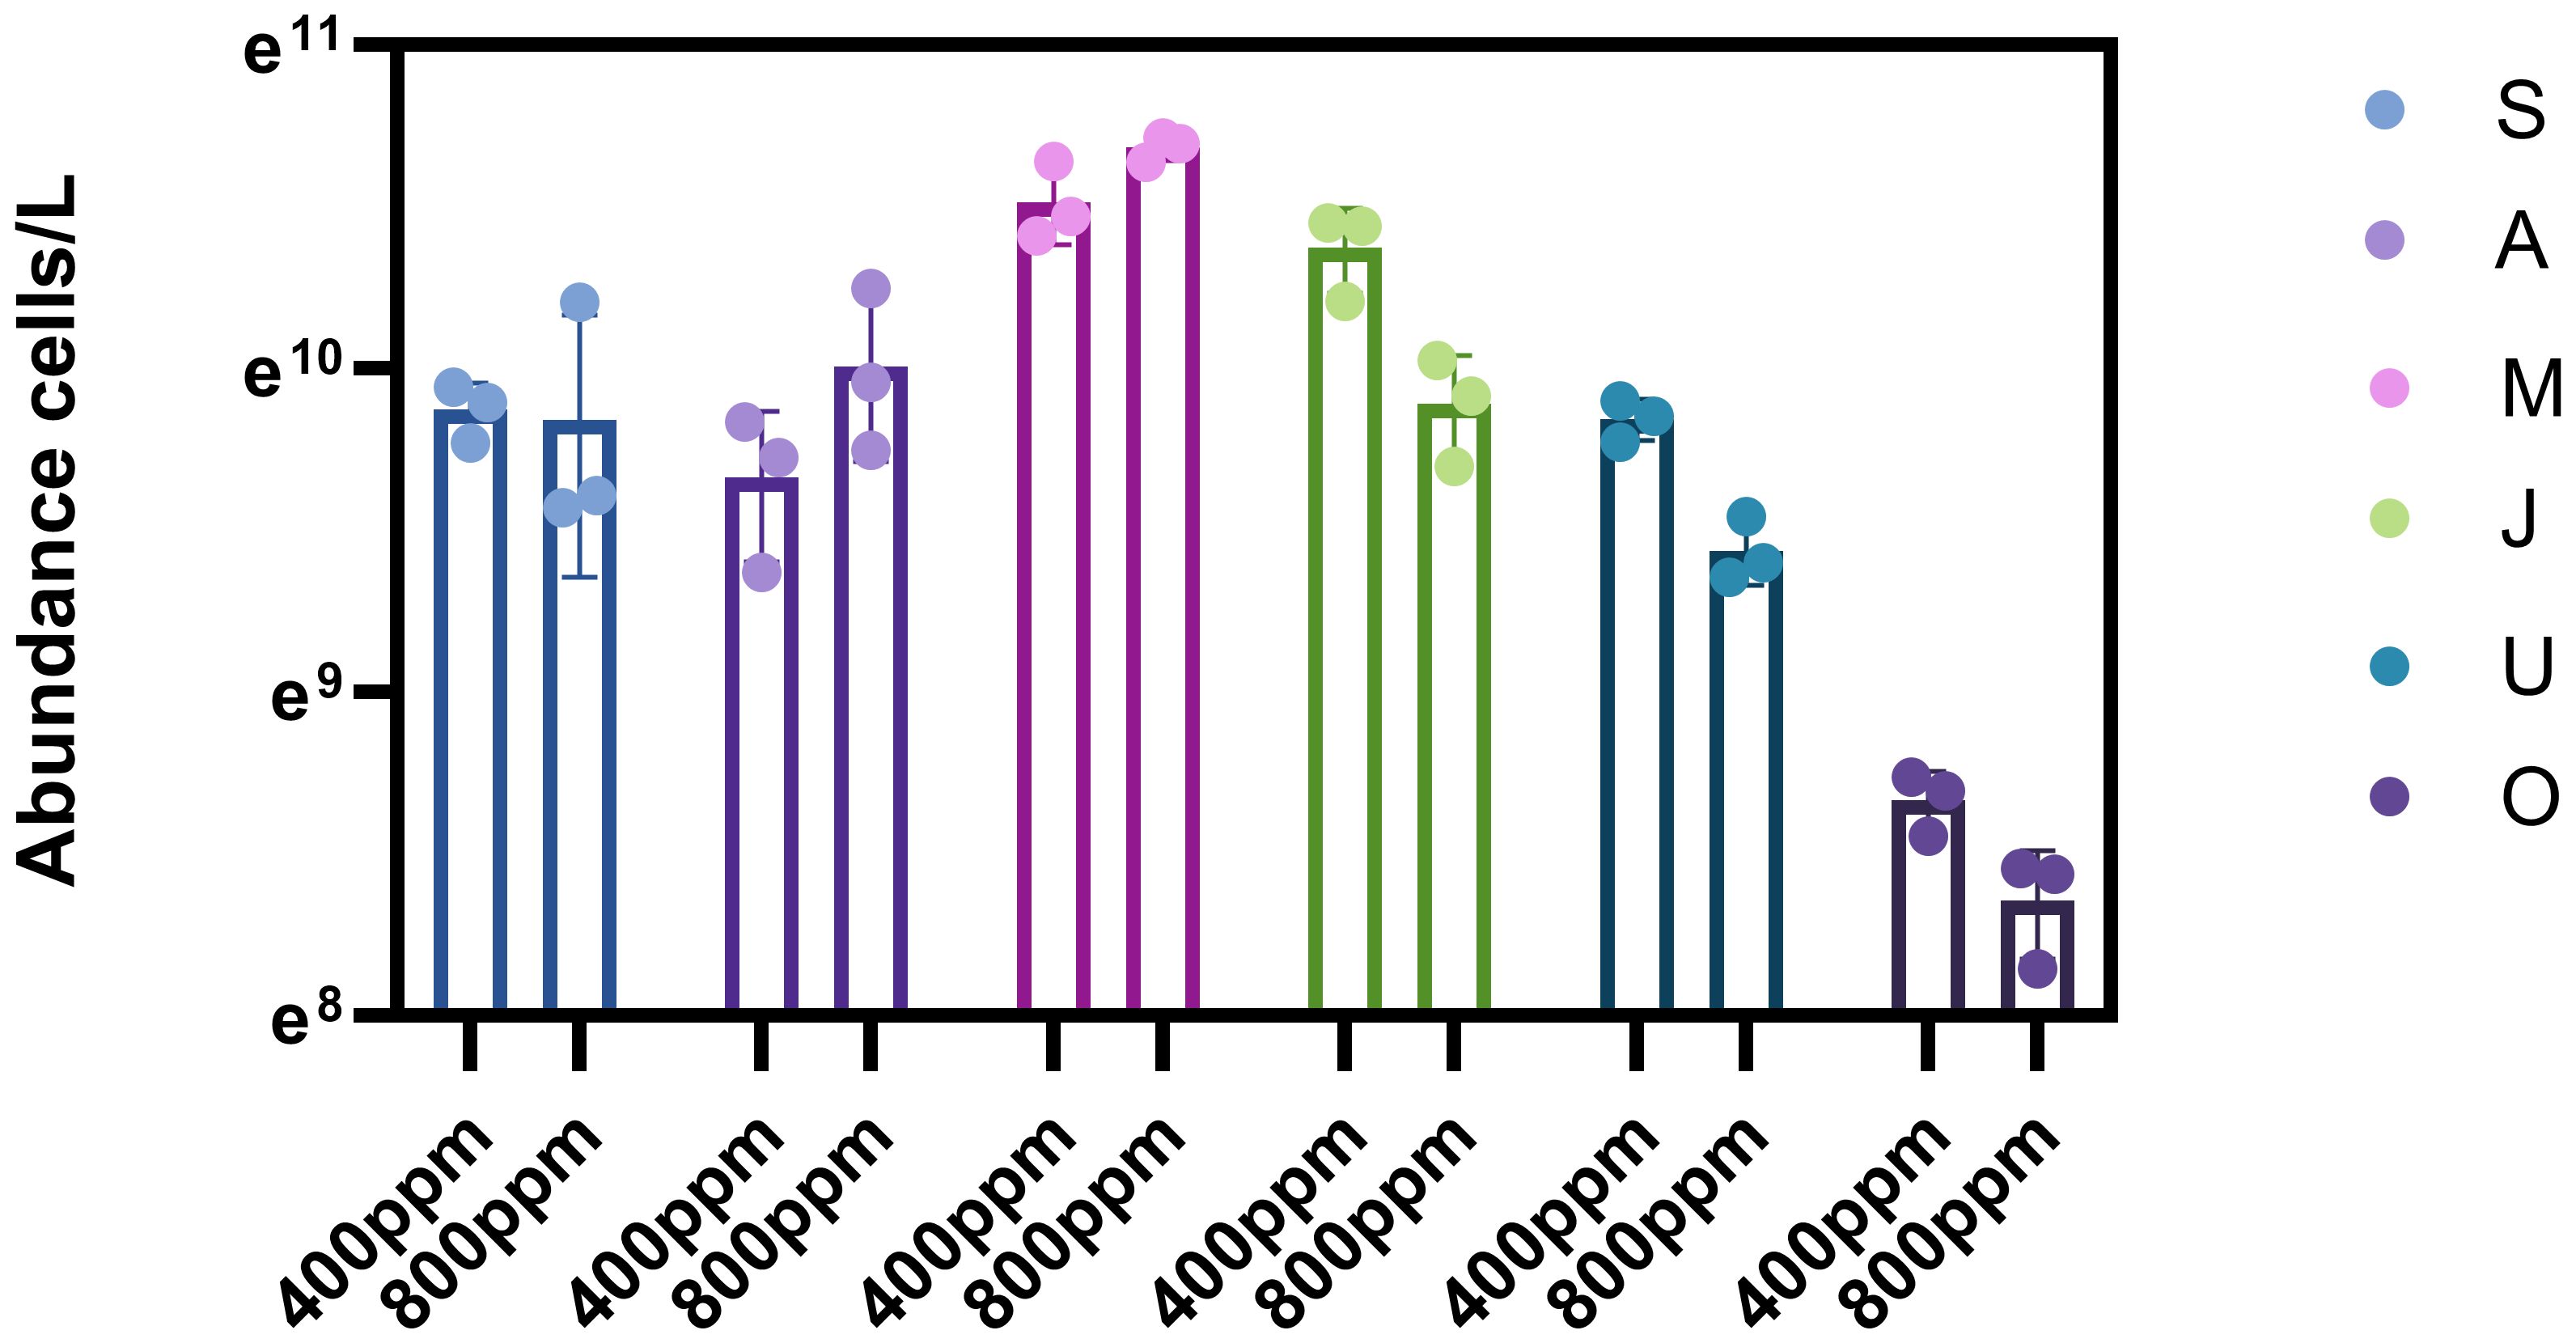
Figure 3 Phytoplankton abundance in spring, summer and autumn under different gradients of carbon dioxide partial pressure.
3.1.3 Summer responses
The summer season displayed a broader change in community structure with increasing pCO2. While Chaetoceros curvisetus remained relatively dominant at both CO2 levels (0.28 at 400 ppm and 0.28 at 800 ppm), the most noticeable change was the ascent of Guinardia delicatula, whose dominance index (Y) surged from 0.41 at 400 ppm to 0.50 at 800 ppm (Table 1). Figure 2 correspondingly reflect this ascendance, signaling a community restructuring likely induced by the physiological or ecological preferences of G. delicatula under acidified conditions.
A substantial increase in phytoplankton abundance is observed in summer (Figure 3 M, J). The peak abundance reaches up to 1010 cells/L under 400 ppm conditions and as high as 1011 cells/L under 800 ppm conditions, indicating a positive response to elevated CO2 levels and potentially enhancing phytoplankton productivity during this period of peak growth. Phytoplankton abundance remains high, around 1010 cells/L for both CO2 conditions, suggesting that the growth-promoting effect of elevated CO2 persists throughout the summer.
3.1.4 Autumn responses
The autumn season marked a particularly interesting shift, with the dominance (Y) of Akashiwo sanguinea declining slightly from 0.77 at 400 ppm to 0.70 at 800 ppm, as detailed in Table 2. This change is visually represented in the pie charts (Figure 2). Despite maintaining a high dominance index, the community’s composition exhibits a subtle yet discernible response to increased CO2 levels. Potential shifts in nutrient uptake rates or grazing pressures are likely contributing factors to the observed succession.
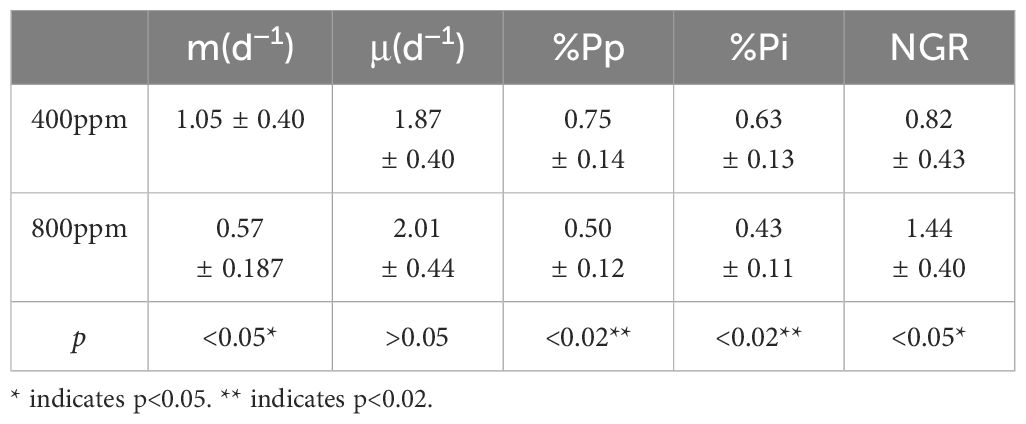
Table 2 Summary of microzooplankton grazing (md–1) rates and phytoplankton growth (μd–1) for all the dilution experiments and relevant experimental parameters.
In autumn (Figure 3 U, O), phytoplankton abundance remains high but starts to decline from summer peaks. The abundance is consistently around 1010 cells/L for both CO2 levels, indicating a stabilization of growth. By late autumn, the abundance under 800 ppm CO2 conditions is slightly higher than under 400 ppm, around 109 cells/L. This suggests a possible secondary growth phase or a delayed response to elevated CO2 levels in the later part of the growing season.
3.1.5 Cross-seasonal growth responses
The cross-seasonal comparison showcases how elevated pCO2 leads to differential responses within the phytoplankton assemblages, with some taxa like C. pelagicus showing an increase in dominance across multiple seasons (from 0.09 in spring at 400 ppm to 0.14 in spring at 800 ppm), whereas others, such as G. delicatula, demonstrate a pronounced seasonal response (surge in dominance index only during summer).
3.1.6 Species-specific growth responses
As depicted in Figure 4, it becomes evident that the response of phytoplankton species to elevated partial pressures of CO2 is complex and varied. C. pelagicus, a species of interest, demonstrates a heterogeneous response to increased pCO2 levels, with its growth rate fluctuating between minor increments (0.44), substantial increases (1.81), and instances of decline (−0.32). This variability suggests that the growth dynamics of C. pelagicus under elevated CO2 conditions are influenced by a multitude of environmental or physiological factors, leading to oscillating growth patterns.
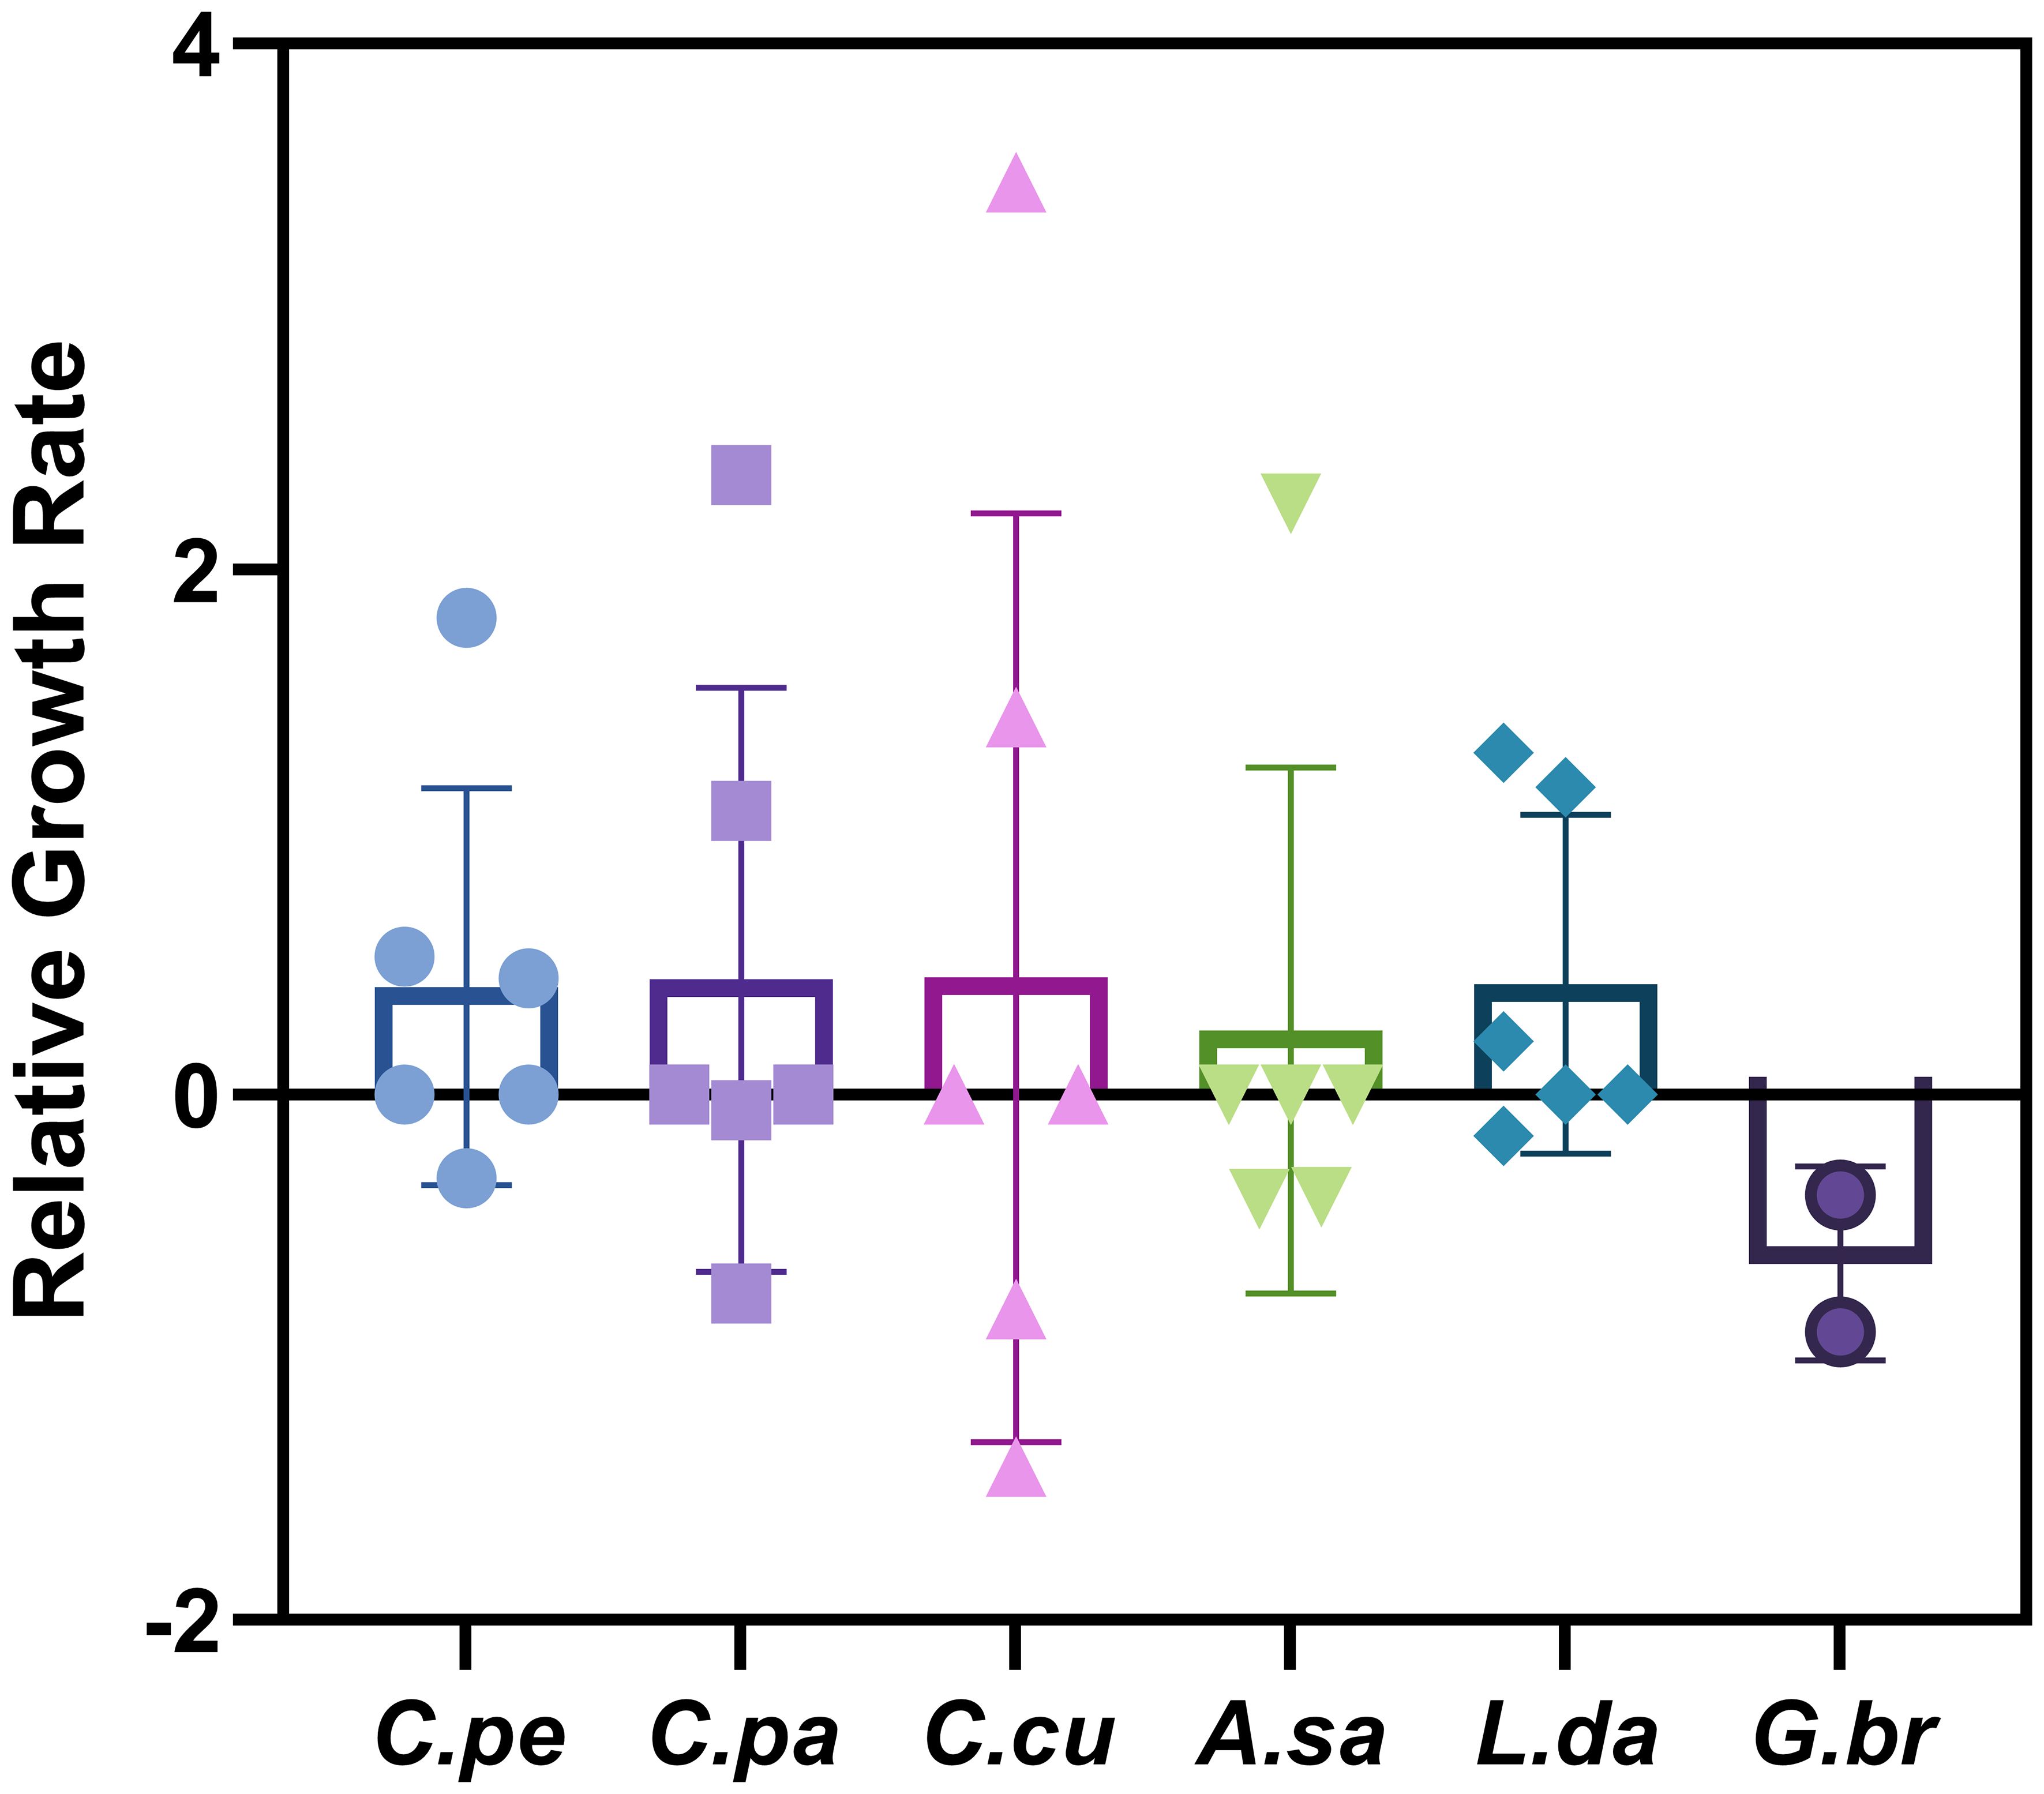
Figure 4 Relative growth rate of main dominant species after acidification. C.pe, Chaetoceros pelagicus; C.pa, Chaetoceros paradoxus; C.cu, Chaetoceros curvisetus; A.sa, Akashiwo sanguinea; L.da, Leptocylindrus danicus; G.br, Gonyaulax bruunii.
Similarly, Chaetoceros paradoxus exhibits significant growth rate enhancements, with a peak growth rate of 2.36 under elevated CO2 concentrations. Nevertheless, this species also experiences minor negative growth rates (−0.06), indicating that its response to increased CO2 levels is not consistently positive and may vary depending on specific environmental conditions or physiological states.
C. curvisetus reveals a pronounced variability in growth rates when subjected to enhanced CO2 levels, with growth rates experiencing substantial escalations up to 3.474896, as well as notable reductions to −1.42. Such marked fluctuations underscore the possibility of divergent responses to varying environmental or physiological conditions induced by elevated CO2 levels.
Leptocylindrus danicus displays enhanced growth under elevated CO2 concentrations, achieving growth rates as high as 1.30, indicative of adaptability or resilience to these conditions. In contrast, Gonyaulax bruunii exhibits a consistent decline in growth rates across all conditions tested, with a significant reduction to -0.90, suggesting a detrimental response to increased CO2 levels.
3.1.7 Physiological adaptations and environmental preferences
The analysis (Figure 5) identifies specific Chaetoceros species demonstrating varied responses to CO2ParPr and pH levels. Chaetoceros costatus and Chaetoceros decipiens are associated with elevated pCO2, suggesting an adaptive preference or tolerance to high CO2 conditions. Conversely, C. curvisetus and C. lauderi exhibit affinity for higher pH environments, indicating potential sensitivity to acidification, a byproduct of increased CO2 levels. This delineation underscores the physiological heterogeneity within the phytoplankton community, with certain species potentially leveraging elevated CO2 conditions to their advantage.
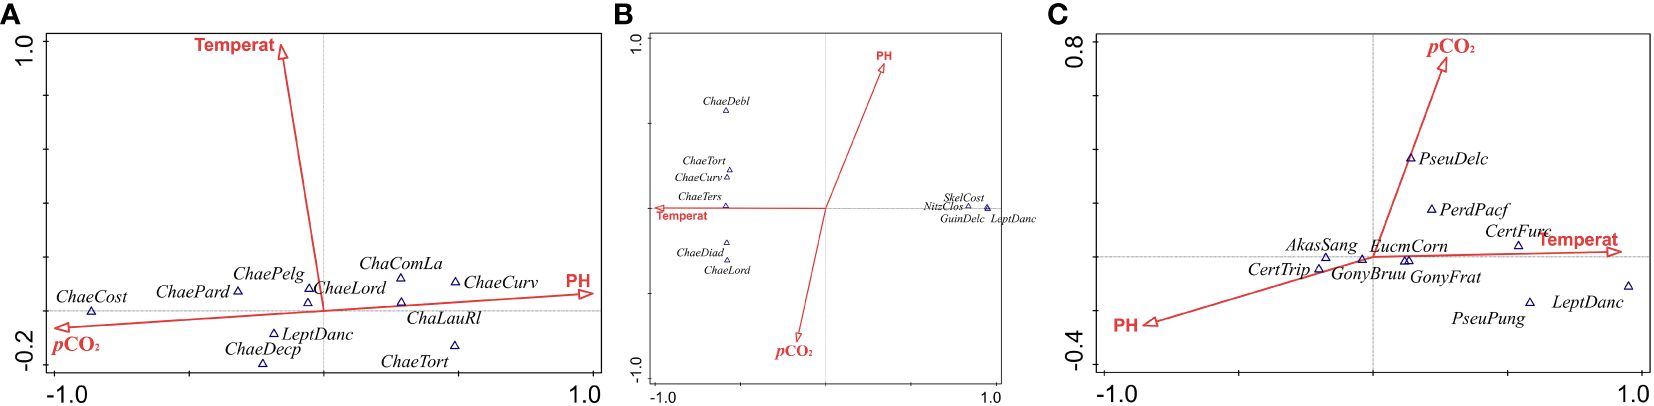
Figure 5 The relationship between dominant species and communities of phytoplankton and environmental factors in spring (A), summer (B) and autumn (C).
The CCA further reveals the thermal preferences of species like Chaetoceros diadema and C. lorenzianus, which align closely with the temperature vector, indicating a dependence on or adaptation to specific thermal conditions. The intermediate positioning of Skeletonema costatum and L. danicus between temperature and pH vectors suggests a broader ecological adaptability, allowing these taxa to thrive across a diverse range of environmental conditions.
Figure 5C accentuates the influence of pCO2 on species distribution, particularly highlighting Pseudonitzschia delicatissima and Peridinium pacificum as taxa strongly affected by elevated CO2 levels. Additionally, the proximity of Ceratium furca to the intersection of CO2 concentration and temperature gradients points to the critical role of these combined environmental factors in determining species distribution patterns. This suggests that the interplay between CO2 and temperature is pivotal in shaping the ecological dynamics of phytoplankton communities.
The CCA results collectively underscore the heterogeneity in physiological responses among phytoplankton to changes in pH and pCO2. This variability reflects the ecological diversity within the phytoplankton community, suggesting that certain taxa may possess adaptive advantages under scenarios of heightened CO2 levels and subsequent acidification.
The dendrogram (Figure 6) exhibits a stratified pattern of community associations. Increasing the CO2 concentration to 800 ppm, the clusters become more dispersed, signifying a divergent effect of acidification on the community structure. Notably, the 800 ppm autumn cluster demonstrates a broader spread, reflecting a potentially significant alteration of the phytoplankton assemblage in response to the combined effects of seasonality and elevated CO2 levels. The spring samples (Figure 6), regardless of CO2 treatment, show closer affinity, suggesting that the community composition during this period is less influenced by CO2 variations and more by the inherent seasonal growth dynamics driven by factors such as increased light intensity and nutrient availability typical of spring blooms.
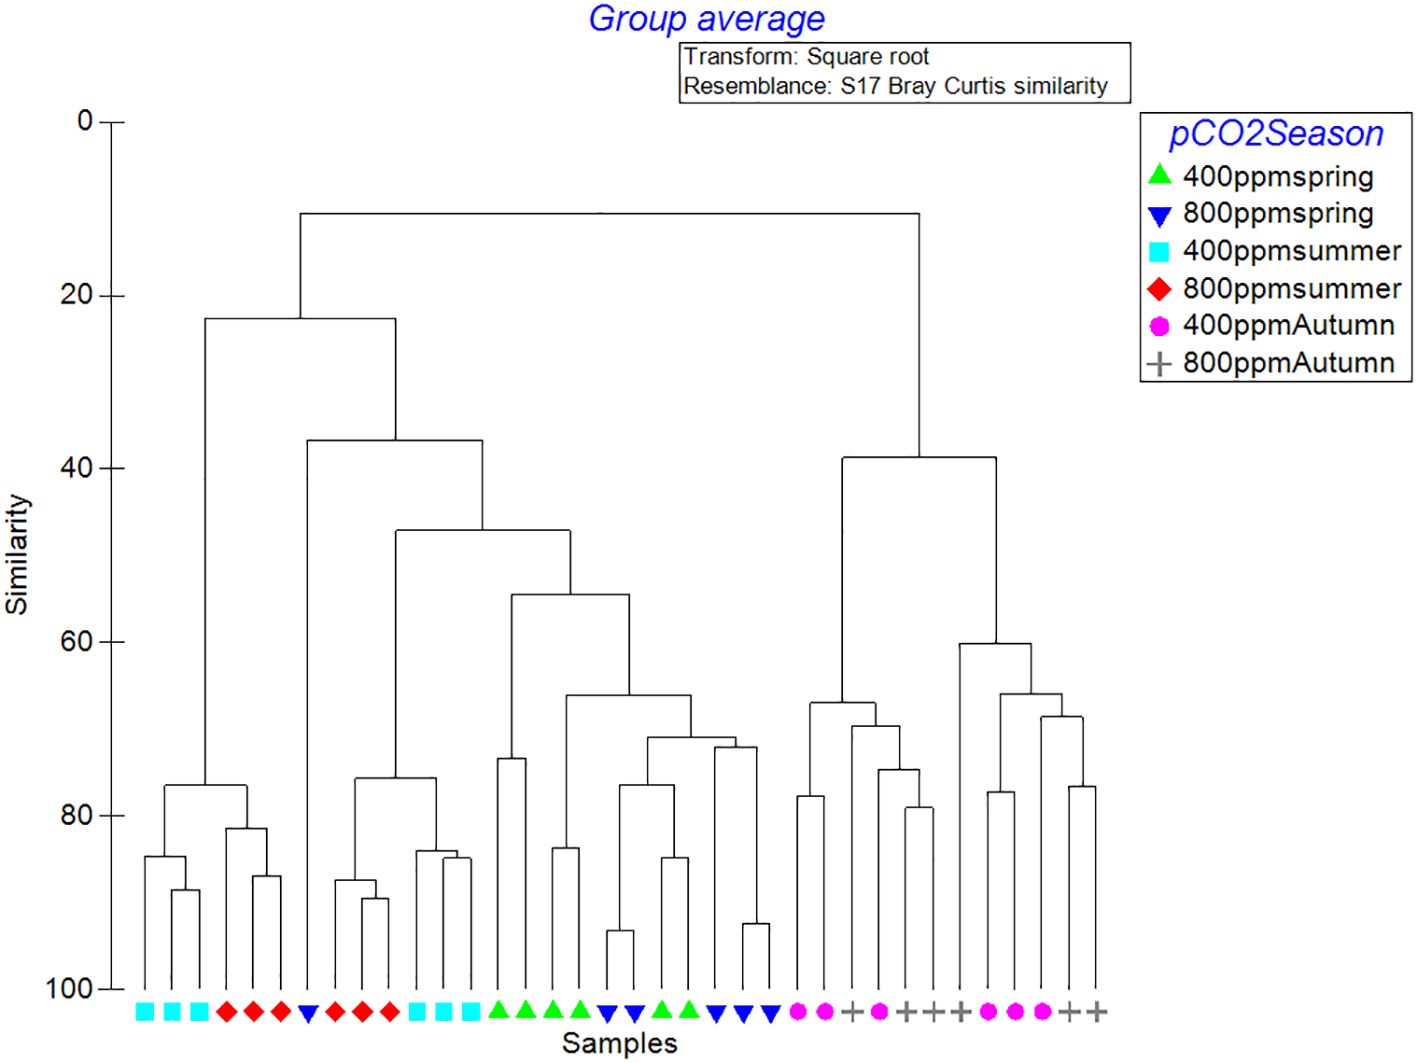
Figure 6 Hierarchical cluster analysis of seasonal and CO2 treatment groups based on Bray-Curtis similarity.
3.2 Microzooplankton grazing on phytoplankton in different pCO2 level
Throughout the seasons (Figure 7), a consistent trend emerges indicating that elevated CO2 concentrations lead to a reduction in grazing pressure on phytoplankton, as evidenced by the shallower slopes of apparent growth rate declines with increasing dilution factors. In spring, the decrease in growth rates was notably more pronounced at 800 ppm CO2 (2.43 d−1) compared to 400 ppm (2.16 d−1), suggesting that higher CO2 levels might mitigate grazing impacts, potentially due to acidification effects on zooplankton grazers or changes in phytoplankton palatability. This pattern persisted into summer and autumn, with reduced slopes observed at 800 ppm CO2, indicating a sustained reduction in grazing pressure under elevated CO2 conditions. Specifically, summer data ranged from −0.29 to −0.46 d−1 at 800 ppm, compared to −0.66 to −0.73 d−1 at 400 ppm, and in autumn, a less steep decrease was observed at 800 ppm (−0.45 d−1) versus 400 ppm (−0.90 d−1). These observations suggest that the interaction between phytoplankton growth and zooplankton grazing is significantly influenced by CO2-nduced environmental changes, reflecting potentially complex shifts in aquatic food web dynamics. The seasonally varying response highlights the intricacy of ecological interactions in response to CO2-induced acidification, underscoring the importance of considering seasonal dynamics when assessing the ecological impacts of rising atmospheric CO2 levels.
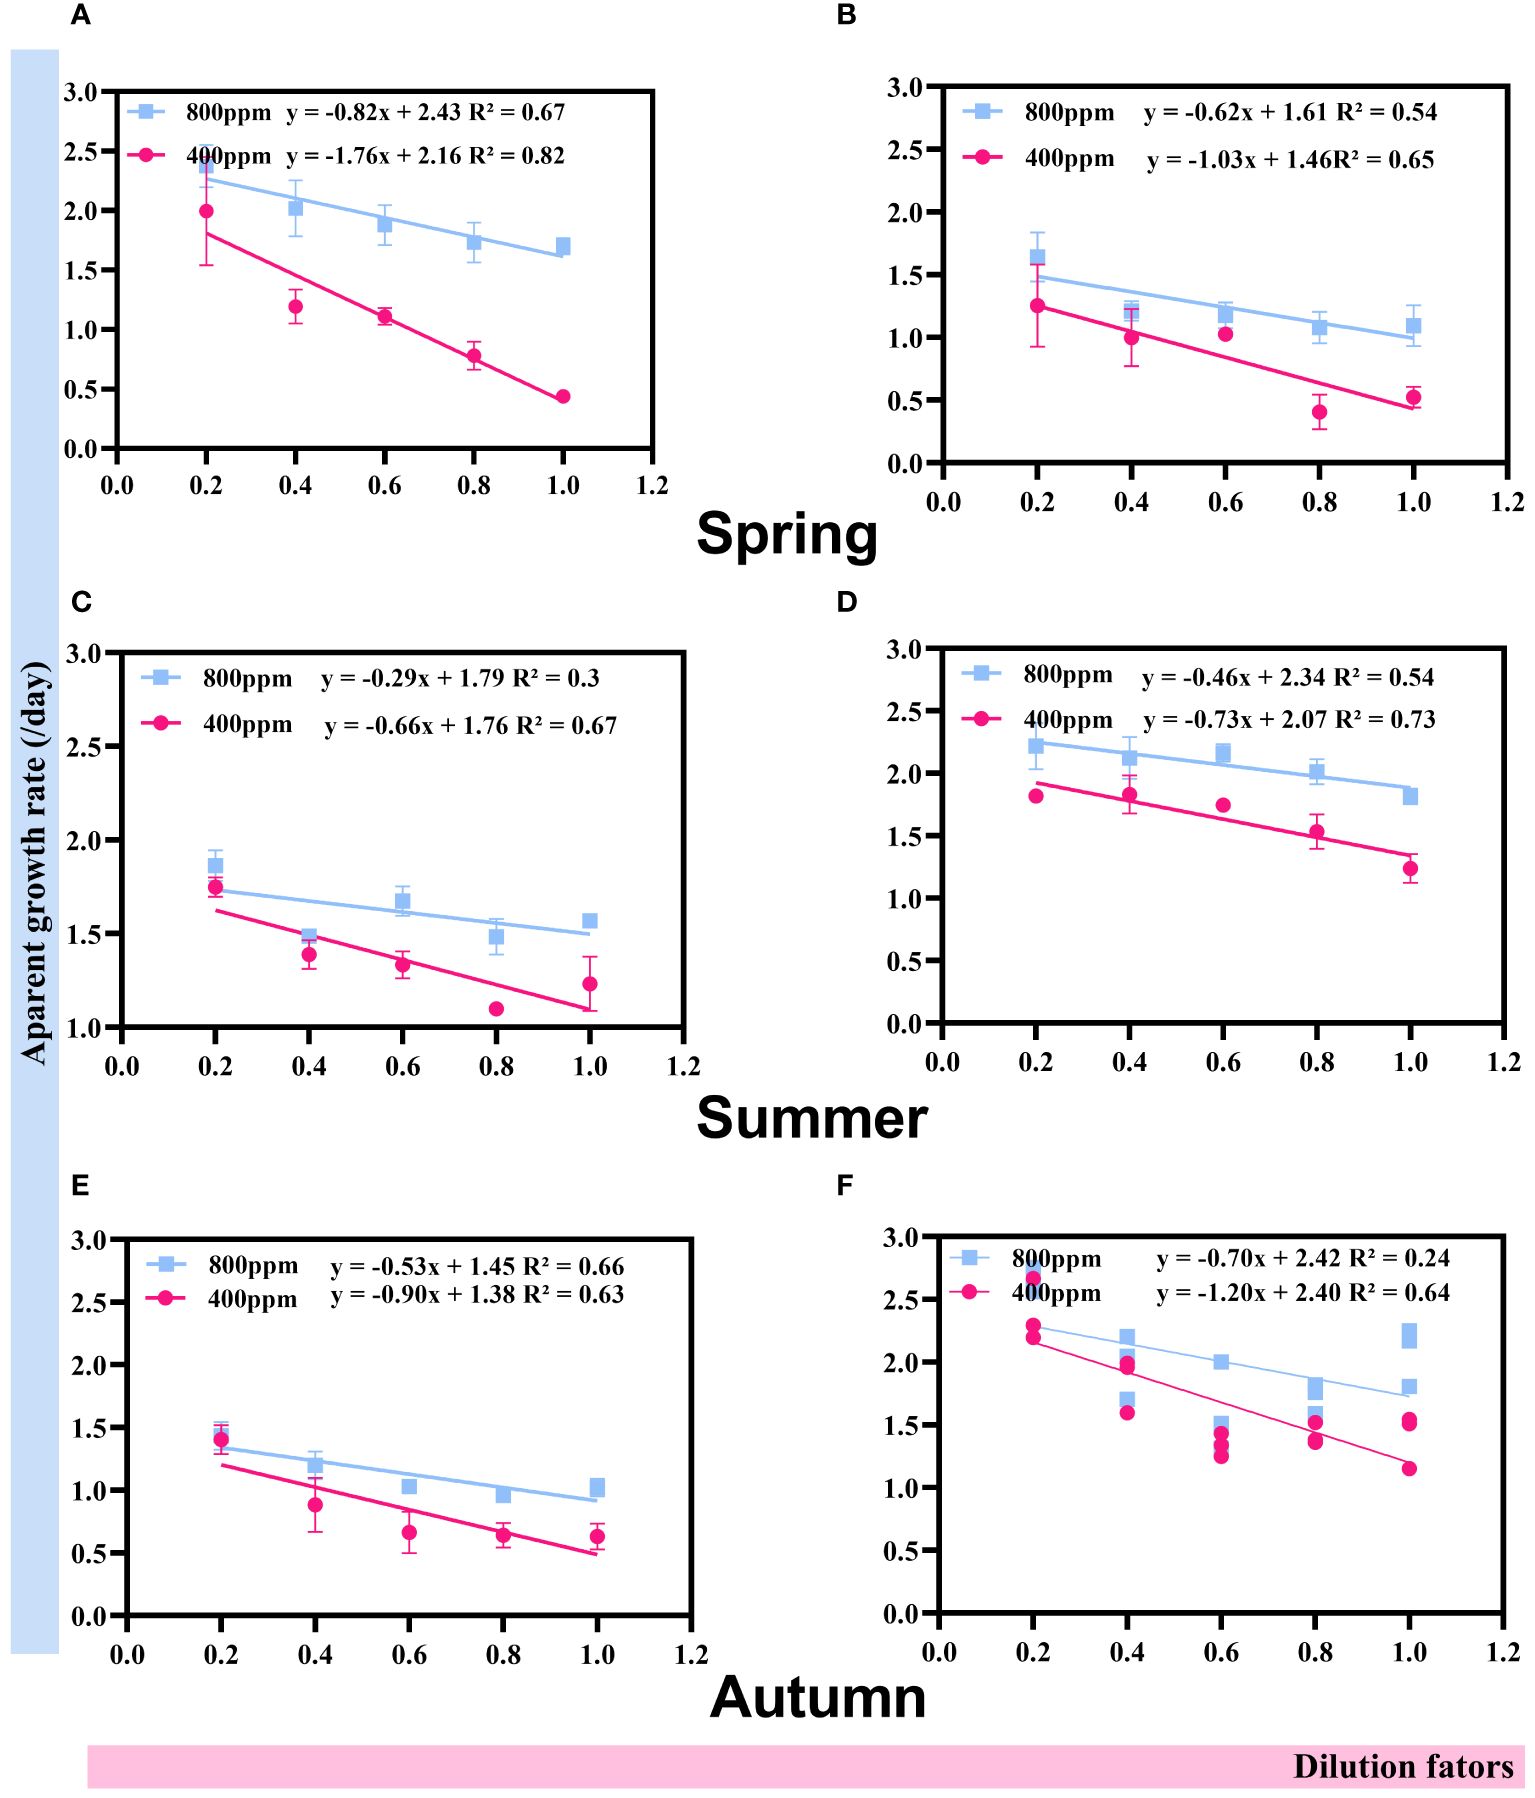
Figure 7 Regressions between apparent growth rates (day−1) and the dilution factors during spring, summer and autumn (A–F).
There was a clear decrease in %Pp and %Pi from 400 ppm to 800 ppm pCO2 calculated using Equation 4 and Equation 5. At 400 ppm, the phytoplankton population faced significant grazing pressure (%Pp: 0.84 to 0.46; %Pi: 0.64 to 0.39), while at 800 ppm, the pressure was alleviated (%Pp: 0.58 to 0.30; %Pi: 0.462 to 0.25), suggesting a shift in the predator-prey dynamic likely influenced by ocean acidification (Figure 8).
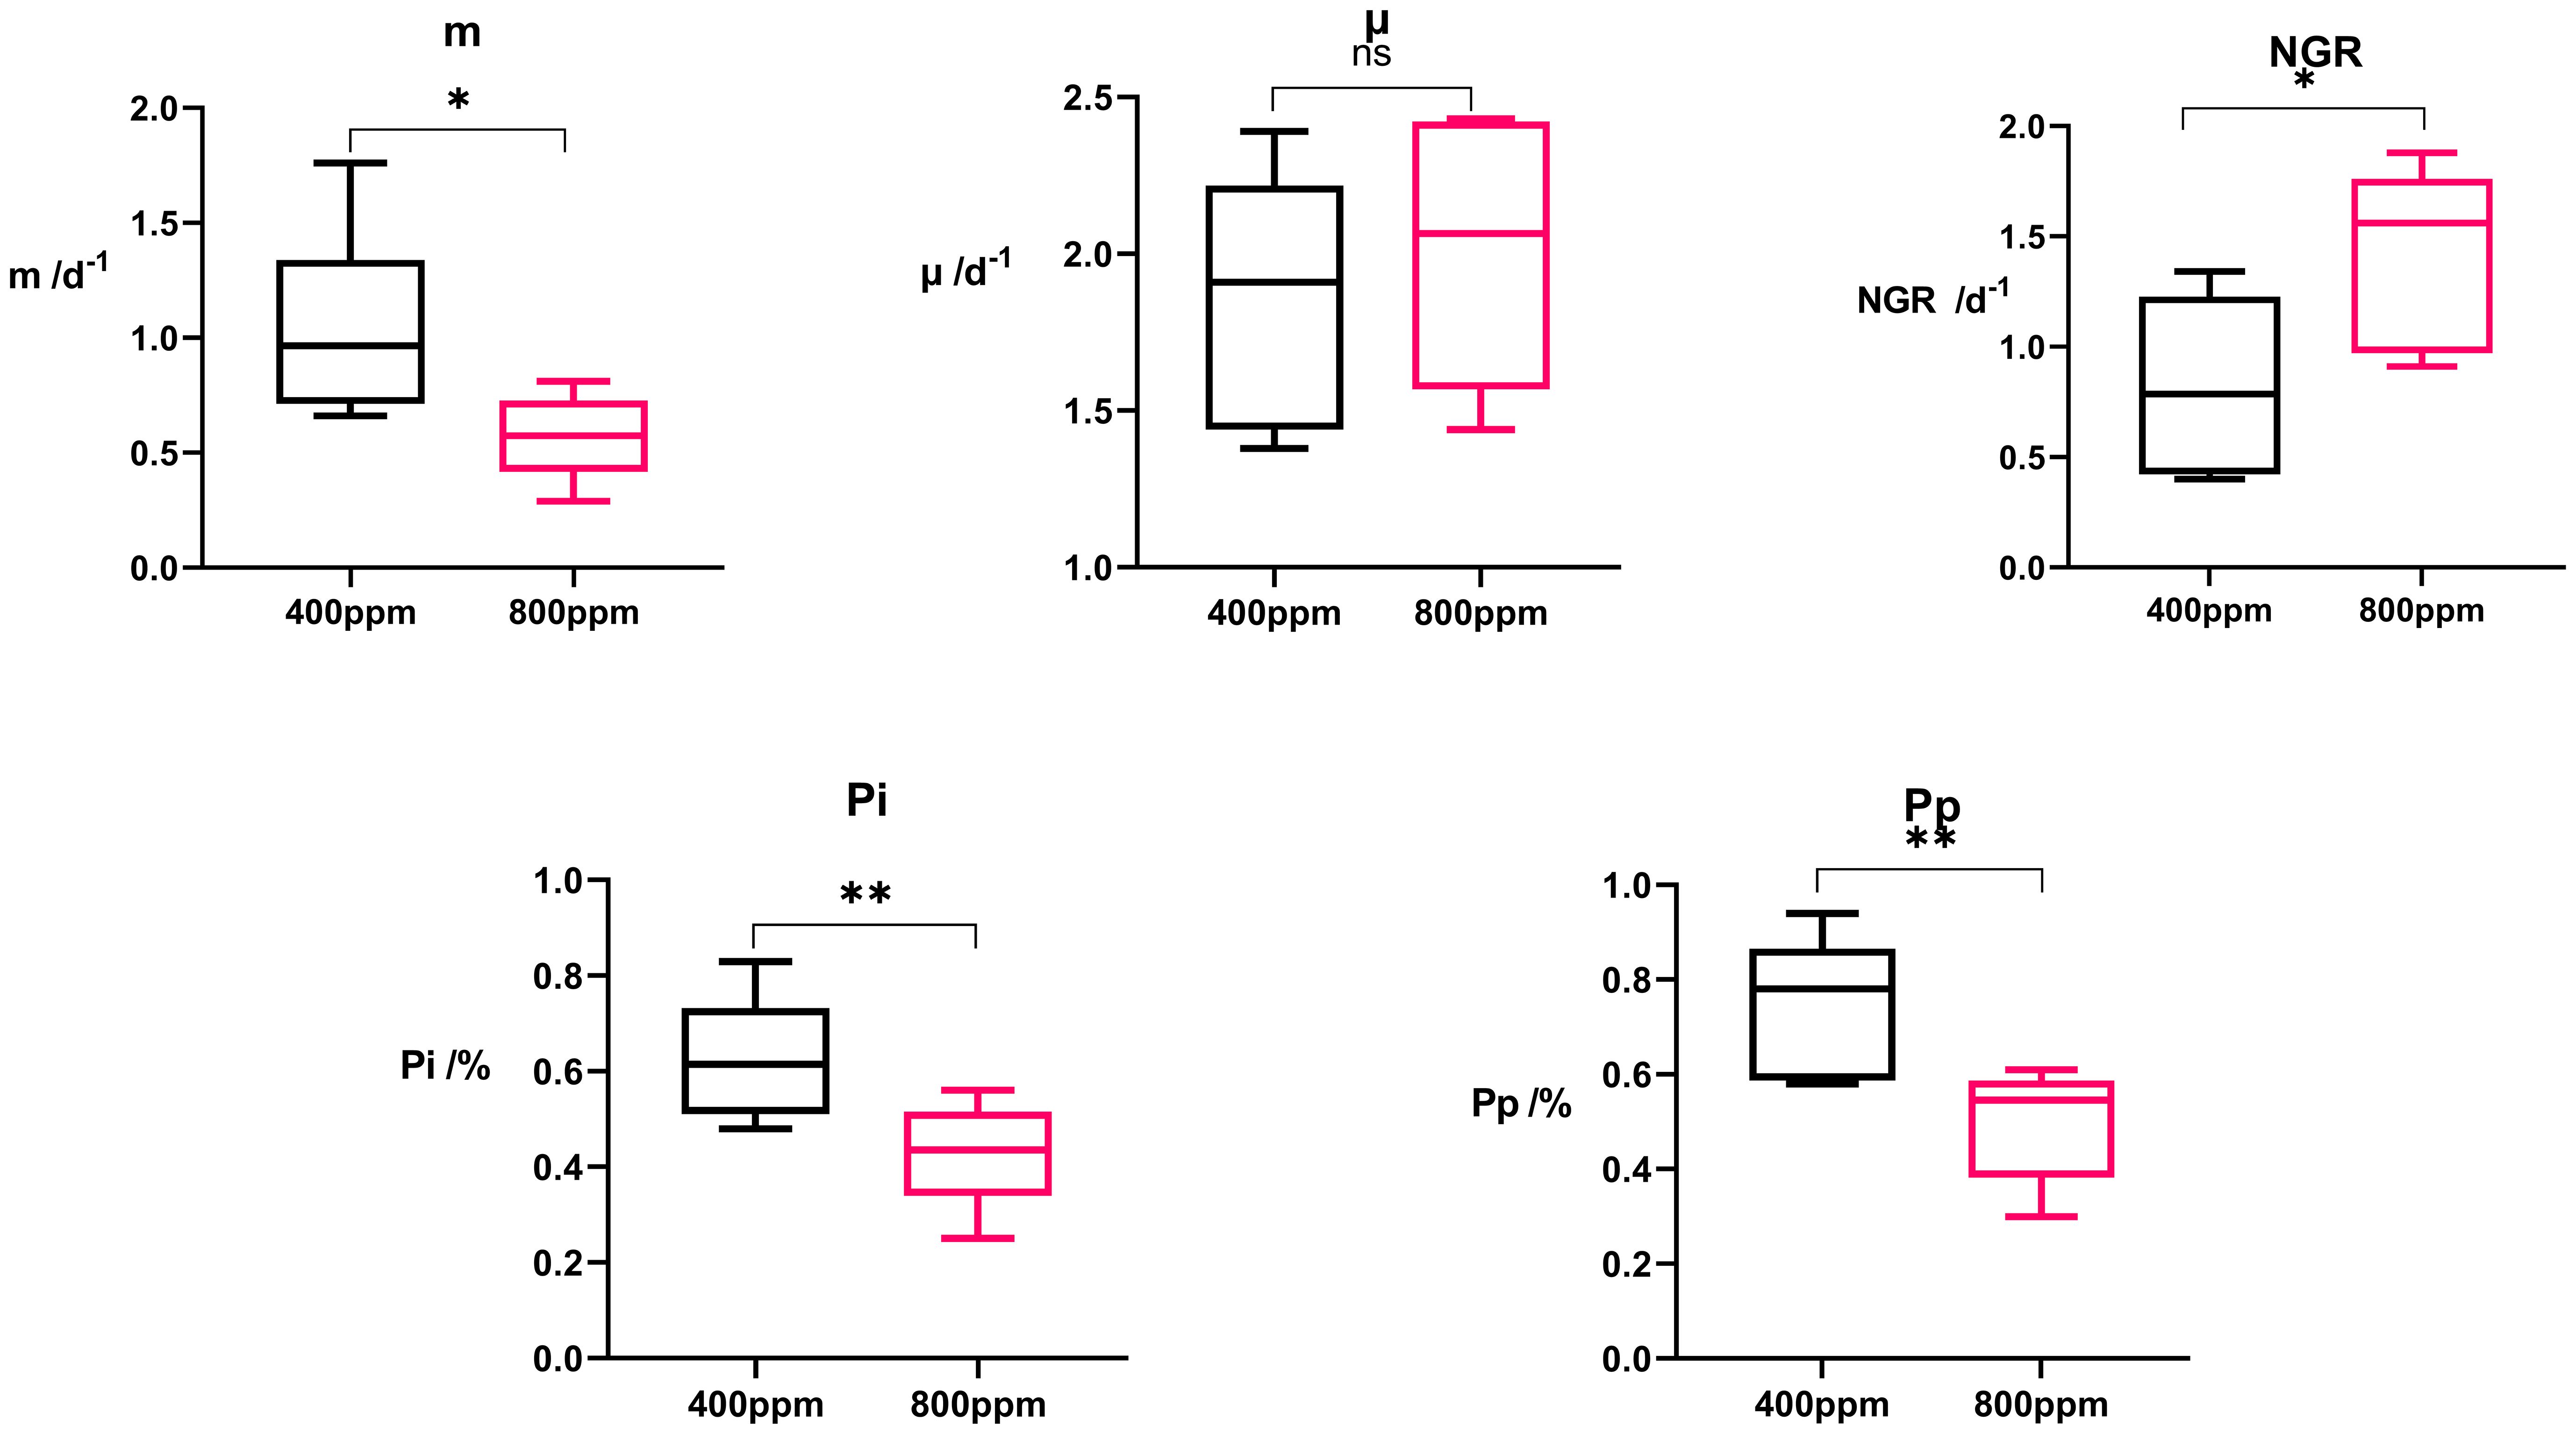
Figure 8 Box plot of microzooplankton grazing rate (m), apparent phytoplankton growth rate (μ), net growth rate (NGR) of phytoplankton, and the ratio of Pi to Pp. * indicates p<0.05. ** indicates p<0.02.
The net growth rate (NGR), calculated using Equation 3 which indicates the overall growth of the phytoplankton population after accounting for losses due to grazing, was generally higher under elevated pCO2 conditions (range: 0.99 to 1.88 d−1) compared to ambient CO2 levels (range: 0.43 to 1.38 d−1) (Table 2). To examine the potential CO2 fertilization effect calculated using Equation 1 and Equation 2, we used the intrinsic growth rates (μ) for evaluation, as μ represents growth in the absence of grazing/mortality. Our findings show that μ did not shift significantly with treatment, suggesting that the changes in NGR are more likely related to variations in predation pressure rather than enhanced growth due to CO2 fertilization.
The patterns discerned across different CO2 treatments elucidate a significant dynamic where increased partial pressure of CO2 appears to mitigate grazing pressures on phytoplankton, facilitating enhanced net growth rates. This phenomenon is likely attributed to a decrease in the grazing efficiency of microzooplankton under higher CO2 conditions. Consequently, these findings suggest a potential reduction in zooplankton’s top-down control over phytoplankton populations, which could be the result of direct effects of elevated CO2 on the physiological or behavioral aspects of both phytoplankton and zooplankton, as well as indirect effects on their interactions.
The correlation matrix analysis (Figure 9) reveals a non-uniform response of chlorophyll content to increased CO2 levels. Nano-phytoplankton chlorophyll content (P-Chl-a) demonstrates significant correlations with the diversity of microzooplankton (MZP H’) calculated using Equation 6, which could imply a linkage between primary producer biomass at the nano-scale and higher trophic levels. Micro-phytoplankton chlorophyll content (M-Chl-a) displays a less pronounced association with microzooplankton diversity. These observations suggest that the size-specific biomass of primary producers might influence microzooplankton community structures in disparate manners.
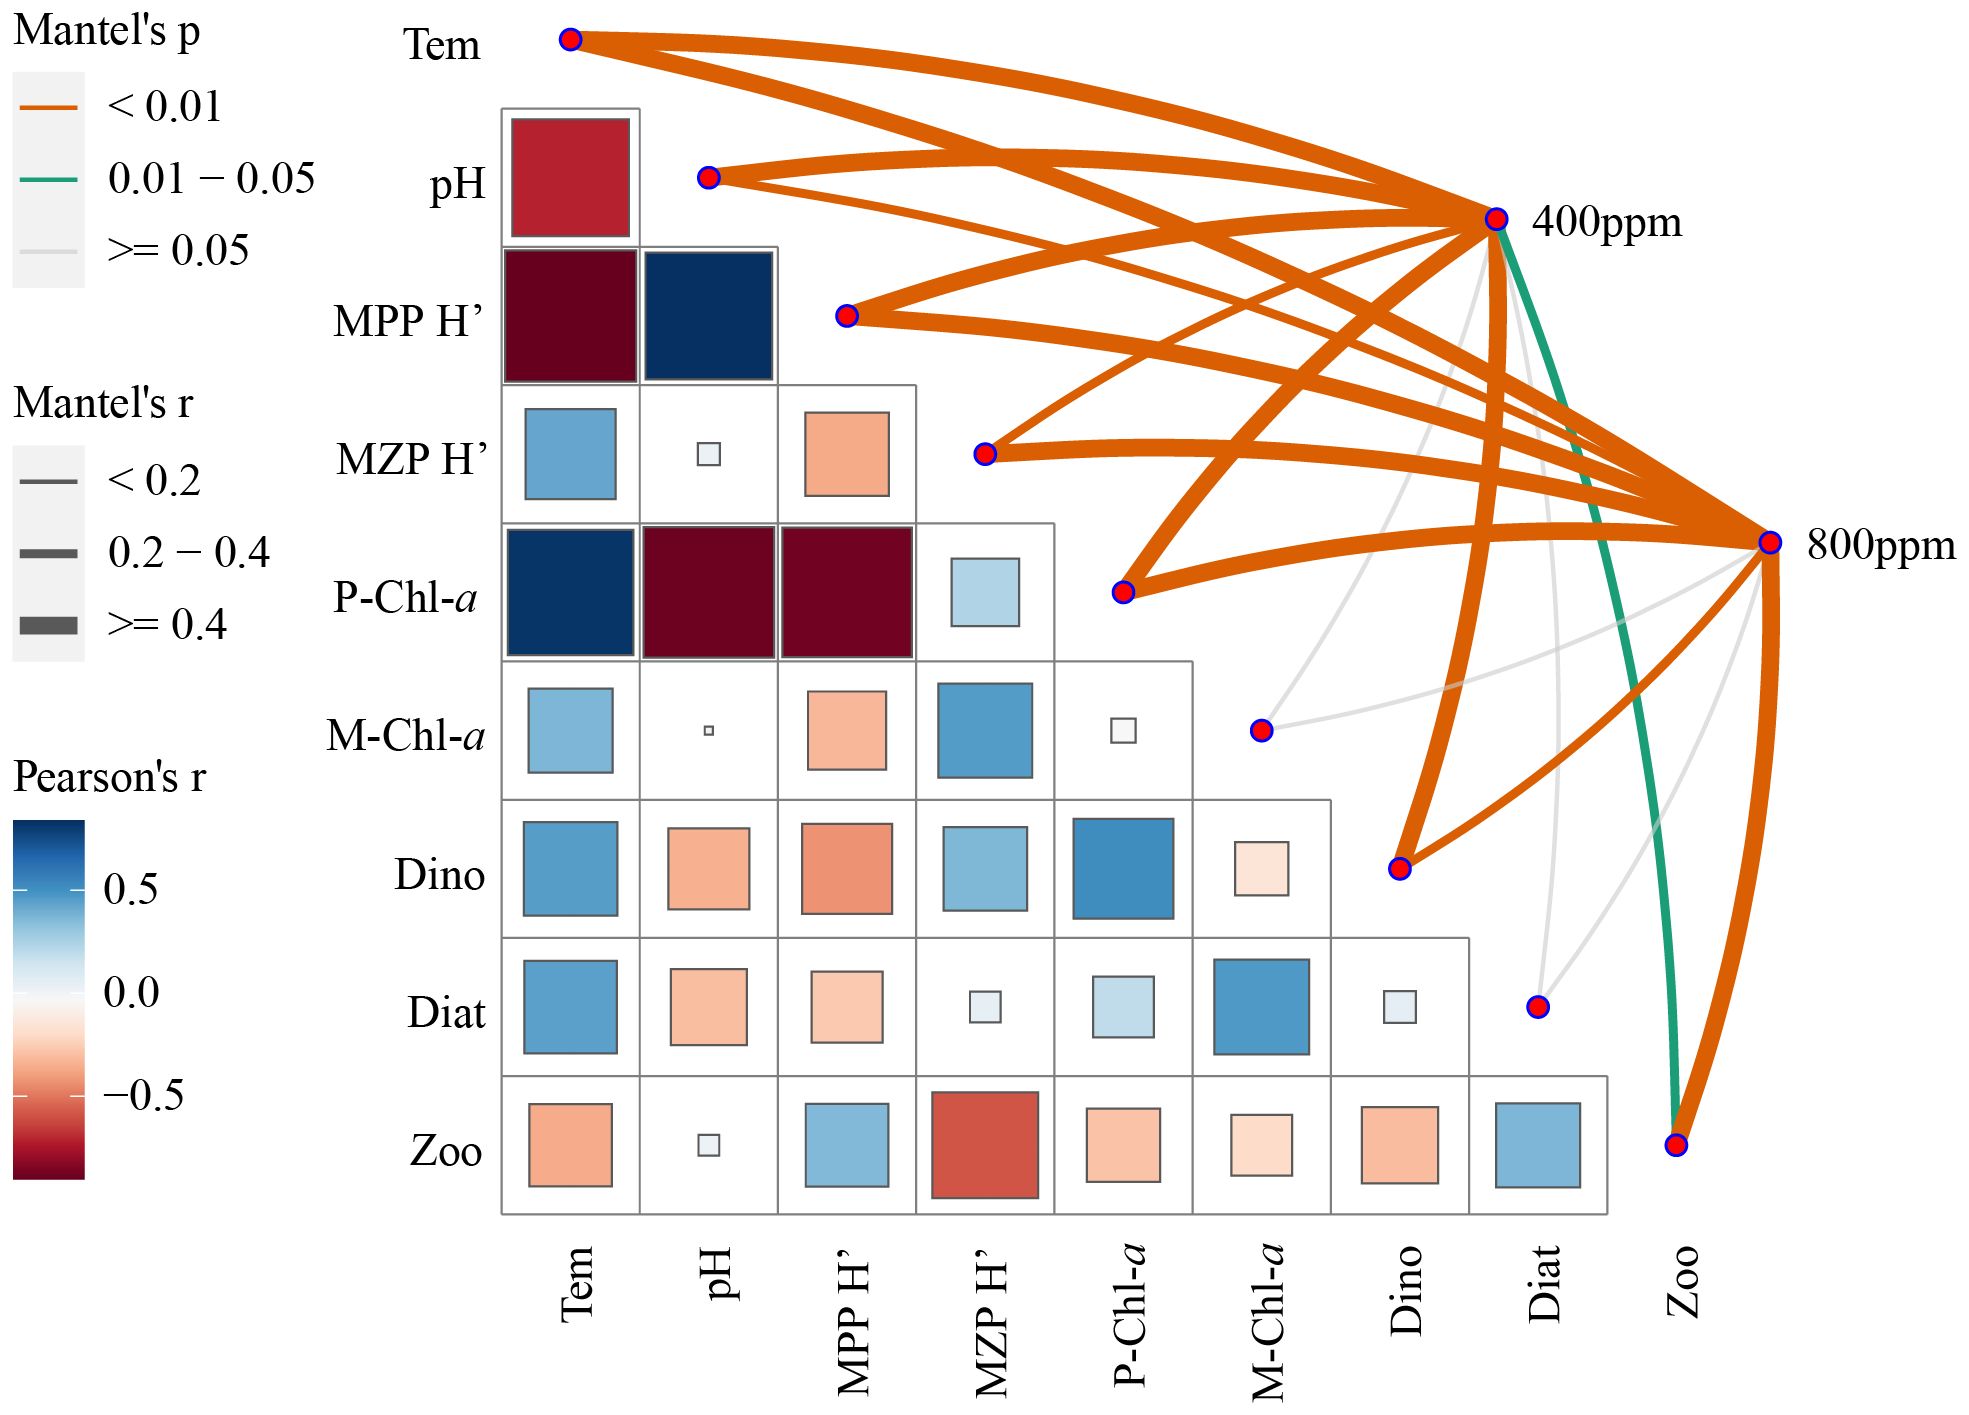
Figure 9 Correlation and significance of plankton diversity and environmental variables in response to different CO2 concentrations.
The significant negative correlation between pH and phytoplankton diversity (MPP H’) across CO2 treatments could be indicative of the direct impact of ocean acidification on phytoplankton community composition. It is apparent that as CO2 concentration increases and pH decreases, phytoplankton diversity tends to increase, possibly due to differential sensitivities of species to pH changes, leading to shifts in community structure.
The Mantel’s test results elucidate that the connections between environmental factors and the two CO2 concentration levels are most pronounced for pH, highlighting acidification as a direct and significant consequence of elevated CO2. However, the direct effects of CO2 on nano-phytoplankton and micro-phytoplankton chlorophyll contents appear to be less significant, suggesting that the chlorophyll concentration within these size classes may be regulated by a suite of indirect interactions and not solely by changes in CO2 concentration.
3.3 Effect of acidification on microzooplankton superoxide dismutase
The activity of the antioxidant enzyme SOD in micro and nanoplankton was quantified to assess the oxidative stress response to different CO2 concentrations (Figure 10). In microplankton, SOD activity increased significantly from 400 ppm to 800 ppm CO2 concentrations, with values rising from an average of 0.03 U mg−1 to 0.08 U mg−1(p<0.01). The marked increase in SOD activity suggests that microplankton experience heightened oxidative stress at elevated CO2 levels, triggering a pronounced cellular defense mechanism. For nanoplankton, a similar trend was observed. The SOD activity at 800 ppm CO2 was substantially higher than at 400 ppm, with values averaging around 0.09 U mg−1 compared to 0.05 U mg−1 at the lower CO2 concentration (p<0.001), reinforcing the finding that nanoplankton also exhibits a strong antioxidative response to increased CO2. The observed increase in SOD activity in both micro and nanoplankton under elevated CO2 conditions suggests that these communities may be actively countering the augmented oxidative stress associated with ocean acidification. This physiological response has implications for the resilience and adaptive capacity of planktonic organisms in the face of ongoing environmental changes.
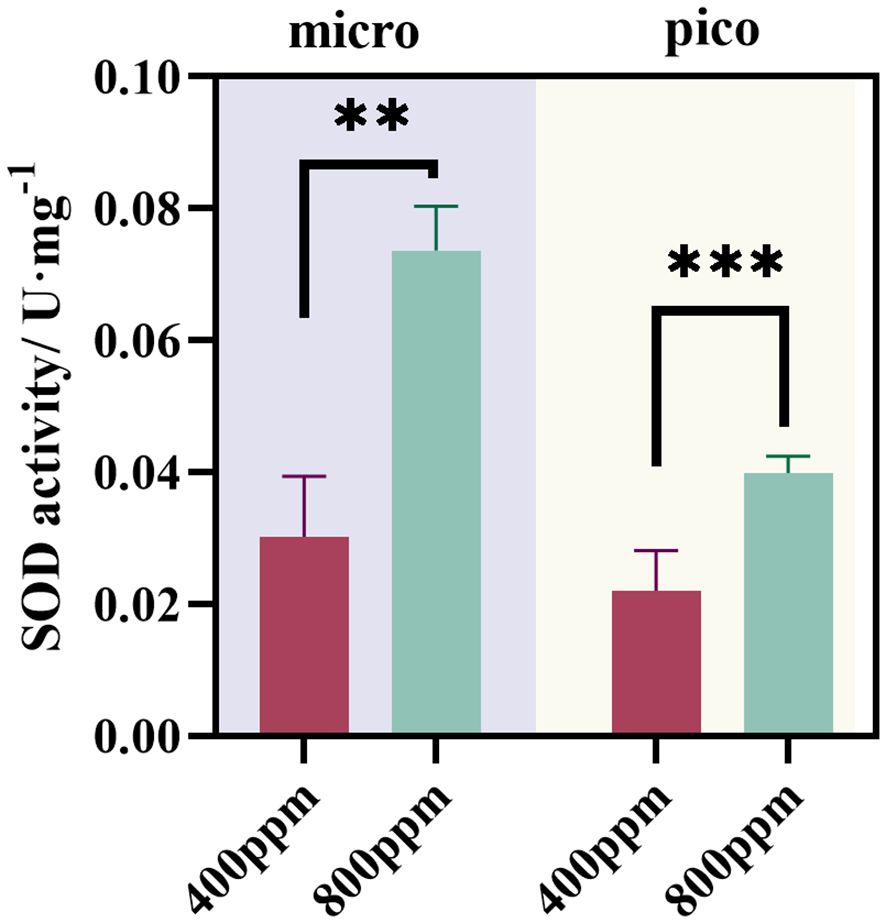
Figure 10 Influence of different CO2 concentrations on SOD activity (U·mg−1) of microzooplankton. * indicates p<0.05. ** indicates p<0.02.
4 Discussion
4.1 Impact of ocean acidification on community composition
The availability of inorganic carbon significantly impacts phytoplankton photosynthesis and the activity of carbon concentrating mechanisms (CCMs). While a decrease in CCM activity can enhance the carbon fixation rate, conserving energy for cellular growth and photosynthesis, thus promoting phytoplankton growth (Thangaraj and Sun, 2021), our findings indicate that the observed increases in net growth rate (NGR) and total phytoplankton abundance are more likely attributable to reduced grazing pressure rather than a direct CO2 fertilization effect. This conclusion is supported by the relatively stable intrinsic growth rates (μ) observed under varying CO2 treatments. Although different algal populations exhibit varying preferences and tolerances towards carbon dioxide, which may drive future shifts in phytoplankton community composition in the ocean (Caron and Hutchins, 2013), the immediate impact on NGR appears to be predominantly influenced by changes in predation dynamics.
In previous studies, it was believed that pCO2 had no discernible impact on the studied dinoflagellate and copepod species. However, in natural communities, some degree of physiological alteration in microzooplankton was observed (Meunier et al., 2017), aligning with the findings of Flynn et al. (2012). Even in cases where zooplankton is not directly affected by CO2 aeration-induced disturbances, short-term exposure to high carbon dioxide levels can still induce Hyperacidemia. Rose et al. (2009) observed that short-term increases in pCO2 and temperature led to higher microzooplankton abundance and grazing rates, indicating a strong response to these variables in the short term. Suffrian et al. (2008) similarly found that short-term pCO2 variations influenced microzooplankton grazing, although long-term effects were less pronounced.
Upon detailed examination of the predominant species across various seasons, as depicted in Figure 4, it becomes evident that the response of phytoplankton species to elevated partial pressures of CO2 is complex and varied. The proximity of Ceratium furca to the intersection of CO2 concentration and temperature gradients points to the critical role of these combined environmental factors in determining species distribution patterns. This suggests that the interplay between CO2 and temperature is pivotal in shaping the ecological dynamics of phytoplankton communities. Additionally, the repercussions of ocean acidification on primary productivity are propagated through the food chain, indirectly influencing microzooplankton.
The experimental findings of this study demonstrate that when coastal surface seawater, rich in nutrients, is exposed to acidification stress, there is a significant reduction in the proportion of micro-level phytoplankton community structure. Previous research by Collins (Collins et al., 2014) suggested that the growth rate of diatoms and eukaryotes in phytoplankton increased under acidification conditions. However, due to differential growth rates or selective grazing by microzooplankton, or acidification-induced reduction in silicon content of diatoms (Sharma et al., 2022), the grazing rate of microzooplankton decreased.
Furthermore, some scholars argue that algae with smaller particle sizes, such as ultramicro eukaryotic algae, Synechococcus, and Prochlorococcus, are more sensitive to elevated carbon dioxide levels (Hutchins et al., 2007; Levitan et al., 2010). Conversely, other studies propose that phytoplankton with larger particle sizes exhibit faster growth rates under acidification conditions, attributed to their smaller surface area ratio and reduced CO2 diffusion (Sun et al., 2022). Nano-phytoplankton is more suitable for grazing by microzooplankton in size (Sun et al., 2003). However, due to the decrease in food level or the unfavorable state of zooplankton, the grazing rate still showed a downward trend. Based on the study by Mayers et al. (2020), both picophytoplankton and nanophytoplankton can be grazed by microzooplankton at similar rates. The research utilized flow cytometry to compare grazing rates on different phytoplankton groups, including picoeukaryotes, nanoeukaryotes, and coccolithophores. The findings indicate that the grazing rates were similar across these groups, demonstrating that microzooplankton do not exhibit significant preference or avoidance based on the size or calcification of the phytoplankton. This suggests that the possession of coccoliths by coccolithophores, such as Emiliania huxleyi, does not provide effective protection against microzooplankton grazing, challenging the hypothesis that calcification serves as a defensive mechanism against predation.
4.2 Stress response of microzooplankton in high CO2 environment
When organisms are exposed to high levels of carbon dioxide, most organisms likely find it difficult to reduce the concentration of CO2 in their bodies, leading to the accumulation of CO2 and H+ in tissues and body fluids, thereby inhibiting the transport of oxygen (Pörtner, 2008), a physiological reaction known as Hyperacidemia. The SOD enzyme serves as an indicator of the oxidative stress response in organisms exposed to stressful environments. It can catalyze the disproportionation reaction of superoxide radicals to produce oxygen and hydroxyl radicals, thereby eliminating harmful superoxide radicals. In many organisms, the level of SOD is one of the important indicators to maintain the redox balance, which can characterize the effect of acidification environment on the growth of plankton to a certain extent. Some studies have shown that ocean acidification can reduce the activity of SOD in microzooplankton, thus affecting its antioxidant capacity. Under these conditions, the organism will produce ROS when threatened by external threats, and at the same time, it will also increase the activity of SOD to remove free radicals produced in the body to protect cells from oxidative damage (Wolfe-Simon et al., 2005).
In a study, the acidification conditions of seawater were simulated in the laboratory, and the activity of SOD enzyme in microzooplankton was measured. The activity of SOD in Prorocentrum dentatum and Karenia mikimotoi showed the same trend in the acidification culture system, that is, it increased first and decreased after two days (Zhang et al., 2022). In this study, the incubation time was only one day. It can be observed that the SOD activity of the mixed system of zooplankton and phytoplankton with two particle sizes increased significantly. The reason for this situation may be that the enzyme activity will cause its own adaptive regulation when it is oppressed by the living environment (Jahnke and White, 2003), so the SOD activity increases to eliminate the production of ROS. However, persistent damage may also lead to cell death and reduce the overall enzyme activity (Gao et al., 2019). Therefore, after a period of culture, the effect of stress on organisms is manifested as the inhibition of biological enzyme activity. Some studies also found that elevated CO2 concentration inhibited the activity of SOD in copepods, resulting in oxidative stress in copepods (Zhang et al., 2016). Other studies Meunier et al. (2017) also believe that ocean acidification may destroy the redox balance of microzooplankton (Melzner et al., 2009), making it more vulnerable to oxidative stress. Another study also discussed the effect of ocean acidification on the SOD level of microzooplankton. This study suggested that ocean acidification may have a negative impact on the health and survival of microzooplankton, because the decrease of SOD activity may lead to a decrease of antioxidant capacity, thus increasing the risk of cell damage (Zhang et al., 2012). Of course, in addition to SOD activity, ocean acidification has other effects on the reduction of grazing rate of microzooplankton, such as their metabolic rate and growth rate, but this effect is rapid and limited (Dam et al., 2021), and the adaptation mechanism of microzooplankton to ocean acidification environment needs further study.
From the physiological and biochemical point of view, ocean acidification may lead to a decrease in the level of SOD in plankton in the short term, thus affecting the antioxidant capacity of microzooplankton. In addition, ocean acidification may also have a negative impact on the grazing rate of microzooplankton, which may further affect the survival and ecosystem function of microzooplankton. To understand these effects, it is necessary to further study the response mechanisms under different species and environmental conditions.
4.3 The long-term impact of ocean acidification on the survival and ecological functions of microzooplankton
Figure 11 visually summarizes our findings, illustrating the complex ecological responses in the marine environment to anthropogenic CO2 emissions. Key trends include an increase in phytoplankton growth, primarily driven by reduced grazing pressure rather than the increased availability of carbon for photosynthesis. This reduction in grazing pressure allows for higher residual growth rates of phytoplankton. The growth is associated with shifts in community structure, notably a decrease in community particle size, suggesting a shift towards smaller-sized phytoplankton as a direct or indirect consequence of acidified conditions. The diagram also indicates altered grazing rates of microzooplankton, represented by the arrow, potentially reflecting an adaptive response to changes in prey availability or composition.
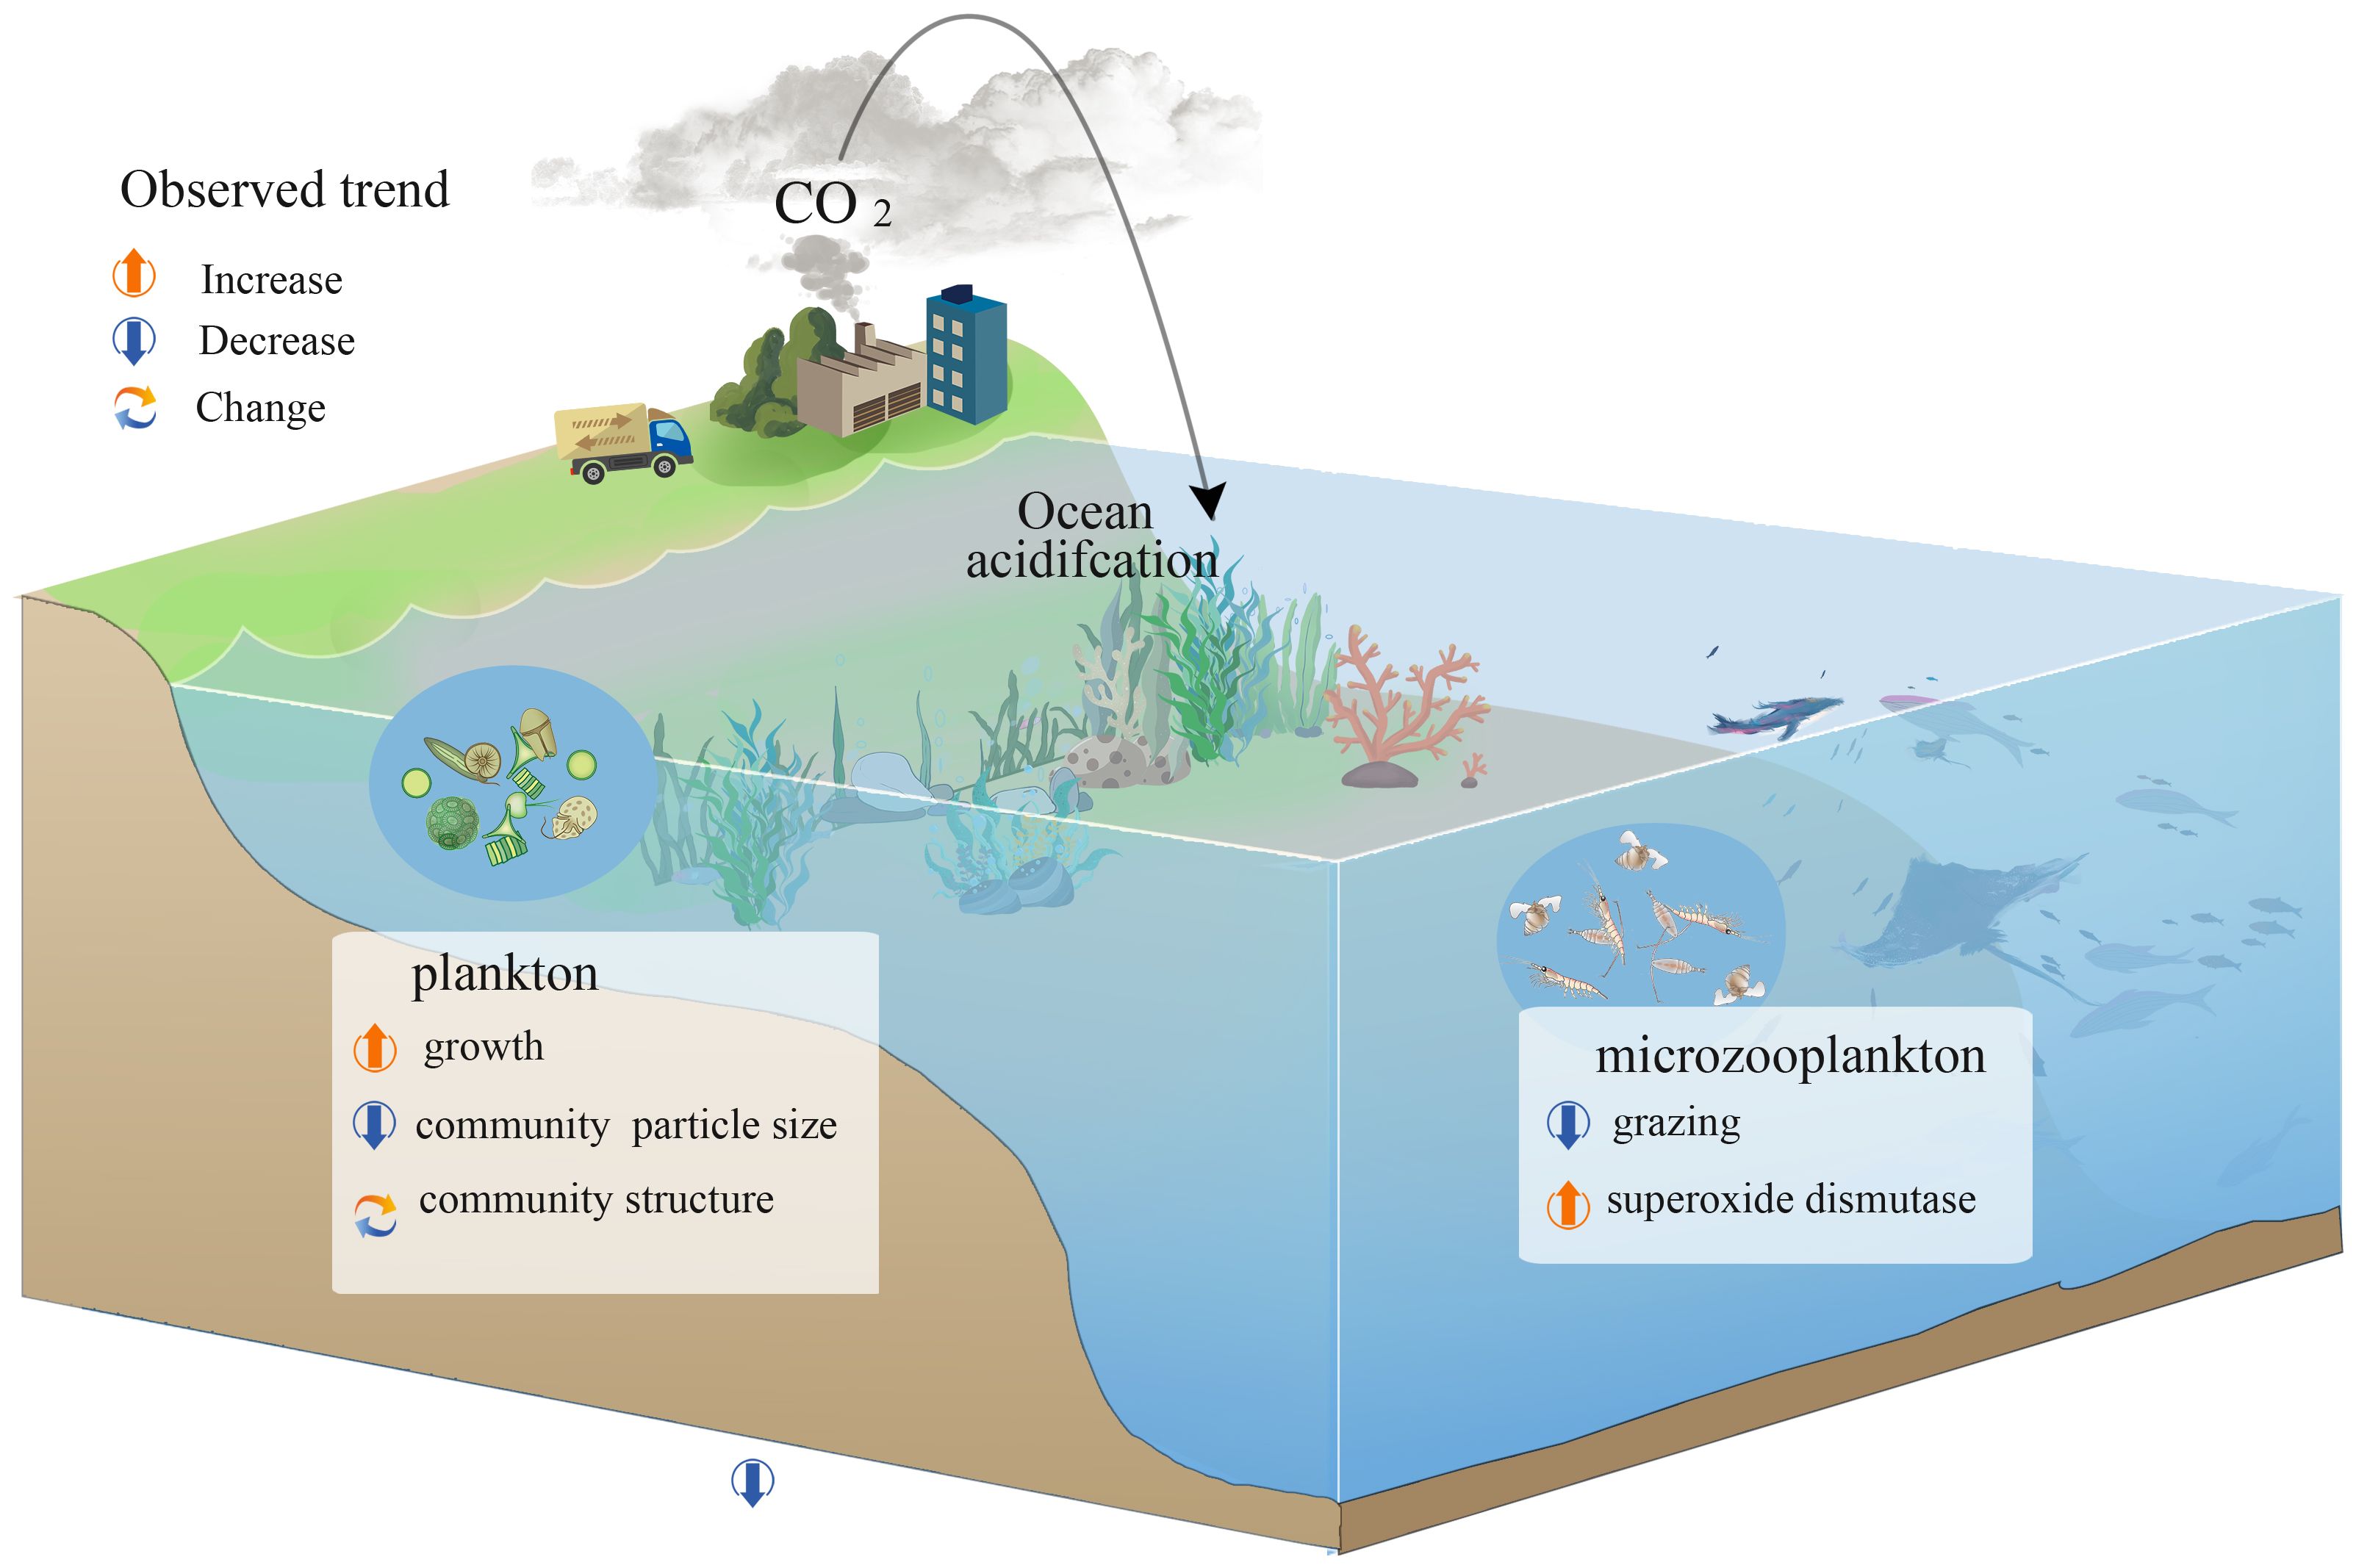
Figure 11 Schematic diagram of the impact of Ocean acidification on planktonic ecosystem dynamics.
In the study by Aberle et al. (2013), while long-term pCO2 changes did not significantly affect the composition and diversity of the microzooplankton community, short-term pCO2 variations elicited different ecological responses. The study highlighted that under high pCO2 conditions, there were observable shifts in phytoplankton community structure, such as the positive effect on dinoflagellates. However, these changes were often transient and did not persist over longer periods, possibly due to the high buffering capacity of complex natural systems and the inherent variability in phytoplankton species composition.
In the short term, pCO2-induced alterations can rapidly affect phytoplankton population dynamics, thereby influencing the availability of food for microzooplankton and their grazing behaviors. These short-term ecological shifts, although not sustained in the long term, indicate the microzooplankton community’s ability to quickly respond to environmental stressors. This suggests that while microzooplankton exhibit high tolerance to long-term ocean acidification, short-term changes in pCO2 levels can significantly impact their community dynamics.
This affects the productivity and stability of microzooplankton and phytoplankton in the acidified environment of seawater. As the grazing rate of microzooplankton decreased, the growth rate of phytoplankton increased, and as shown in Table 2, m<μ, the apparent growth rate of phytoplankton exceeded the grazing rate of microzooplankton, so the grazing pressure of microzooplankton on the standing stock of phytoplankton decreased. At the same time, the grazing pressure of microzooplankton on the potential productivity of phytoplankton is reduced, which means that in the acidified environment of seawater, the growth and production of phytoplankton will not be inhibited, which is related to the increase of net growth rate of phytoplankton, and the control effect of microzooplankton on phytoplankton is decreasing. Theoretical studies have shown that environmental stress has a strong impact on predators and a weak impact on prey, which is conducive to community rescue; on the contrary, it is not conducive to community rescue (Gilbert et al., 2014).
In the Mesocosm experiment designed by (Bell et al., 2019), it was observed that when the adaptability of zooplankton to water acidification was low, the predation stress on phytoplankton decreased, which may promote the evolutionary rescue of phytoplankton. However, if the predator was too sensitive, only phytoplankton survived, which may lead to the imbalance of energy flow and material cycle after a longer period.
5 Conclusion
In summary, the effects of ocean acidification on the grazing of microzooplankton are multifaceted. In this study, these effects led to a decrease in the standing grazing pressure of microzooplankton on phytoplankton and the grazing pressure of potential primary productivity. In the future studies, the effects of ocean acidification on secondary productivity and trophic communities still need more research and discussion.
Data availability statement
The raw data supporting the conclusions of this article will be made available by the authors, without undue reservation.
Author contributions
WS: Conceptualization, Formal analysis, Investigation, Methodology, Visualization, Writing – original draft, Writing – review & editing. XF: Software, Writing – review & editing. YH: Supervision, Writing – review & editing. JQ: Validation, Writing – review & editing. JS: Conceptualization, Methodology, Project administration, Resources, Supervision, Visualization, Writing – review & editing.
Funding
The author(s) declare financial support was received for the research, authorship, and/or publication of this article. This research was financially supported by the National Key R&D Program of China (2019YFC1407800), the National Natural Science Foundation of China (41876134), and the Changjiang Scholar Program of Chinese Ministry of Education (T2014253) to JS, also partly support by Projects of Southern Marine Science and Engineering Guangdong Laboratory (Zhuhai) (SMLSML2023SP218, SML2022005).
Conflict of interest
The authors declare that the research was conducted in the absence of any commercial or financial relationships that could be construed as a potential conflict of interest.
The reviewer SM declared a shared affiliation with the authors to the handling editor at the time of review.
Publisher’s note
All claims expressed in this article are solely those of the authors and do not necessarily represent those of their affiliated organizations, or those of the publisher, the editors and the reviewers. Any product that may be evaluated in this article, or claim that may be made by its manufacturer, is not guaranteed or endorsed by the publisher.
References
Aberle N., Schulz K. G., Stuhr A., Malzahn A. M., Ludwig A., Riebesell U. (2013). High tolerance of microzooplankton to ocean acidification in an Arctic coastal plankton community. Biogeosciences 10, 1471–1481. doi: 10.5194/bg-10-1471-2013
Azam F., Fenchel T., Field J., Gray J., Meyer-Reil L., Thingstad F. (1983). “The ecological role of water-column microbes in the sea,” in Foundations of Ecology II: Classic Papers with Commentaries. Eds. Miller T. E., Travis J. (University of Chicago Press, Chicago), 384–390. doi: 10.7208/chicago/9780226125534–024
Bell G., Fugère V., Barrett R., Beisner B., Cristescu M., Fussmann G., et al. (2019). Trophic structure modulates community rescue following acidification. Proc. R. Soc. B 286, 20190856. doi: 10.1098/rspb.2019.0856
Caron D. A., Hutchins D. A. (2013). The effects of changing climate on microzooplankton grazing and community structure: drivers, predictions, and knowledge gaps. J. Plankton Res. 35, 235–252. doi: 10.1093/plankt/fbs091
Christopher E. C., Comeau S., Kornder N. A., Perry C. T., Van Hooidonk R., DeCarlo T. M., et al. (2021). Global declines in coral reef calcium carbonate production under ocean acidification and warming. Proc. Natl. Acad. Sci. 118, e2015265118. doi: 10.1073/pnas.2015265118
Collins S., Rost B., Rynearson T. A. (2014). Evolutionary potential of marine phytoplankton under ocean acidification. Evolutionary Appl. 7, 140–155. doi: 10.1111/eva.12120
Dam H. G., deMayo J. A., Park G., Norton L., He X., Finiguerra M. B., et al. (2021). Rapid, but limited, zooplankton adaptation to simultaneous warming and acidification (preprint). Nat. Climate Change 11, 780–786. doi: 10.1038/s41558-021-01131-5
Flynn K. J., Blackford J. C., Baird M. E., Raven J. A., Clark D. R., Beardall J., et al. (2012). Changes in pH at the exterior surface of plankton with ocean acidification. Nat. Climate Change 2, 510–513. doi: 10.1038/nclimate1489
Gao K., Beardall J., Häder D. P., Hall-Spencer J. M., Gao G., Hutchins D. A. (2019). Effects of ocean acidification on marine photosynthetic organisms under the concurrent influences of warming, UV radiation, and deoxygenation. Front. Mar. Sci. 6. doi: 10.3389/fmars.2019.00322
Gattuso J.-P., Magnan A. K., Bopp L., Cheung W. W. L., Duarte C. M., Hinkel J., et al. (2018). Ocean solutions to address climate change and its effects on marine ecosystems. Front. Mar. Sci. 5. doi: 10.3389/fmars.2018.00337
Gilbert B., Tunney T. D., McCann K. S., Delong J. P., Vasseur D. A., Savage V. M., O'Connor M. I. (2014). A bioenergetic framework for the temperature dependence of trophic interactions. Ecology Letters. 17(8), 902–914. doi: 10.1111/ele.12307
Hammill E., Johnson E., Atwood T. B., Harianto J., Hinchliffe C., Calosi P., et al. (2018). Ocean acidification alters zooplankton communities and increases top-down pressure of a cubozoan predator. Global Change Biol. 24, e128–e138. doi: 10.1111/gcb.13849
Hurd C. L., Lenton A., Tilbrook B., Boyd P. W. (2018). Current understanding and challenges for oceans in a higher-CO2 world. Nat. Climate Change 8, 686–694. doi: 10.1038/s41558-018-0211-0
Hutchins D. A., Fu F.-X., Zhang Y., Warner M. E., Feng Y., Portune K., et al. (2007). CO2 control of Trichodesmium N2 fixation, photosynthesis, growth rates, and elemental ratios: Implications for past, present, and future ocean biogeochemistry. Limnology oceanography 52, 1293–1304. doi: 10.4319/lo.2007.52.4.1293
Jahnke L. S., White A. L. (2003). Long-term hyposaline and hypersaline stresses produce distinct antioxidant responses in the marine alga Dunaliella tertiolecta. J. Plant Physiol. 160, 1193–1202. doi: 10.1078/0176-1617-01068
Jun S., Dongyan L., Shimin Y., Jian G., Shuben Q. (2002). The preliminary study on phytoplankton community structure in the central Bohai Sea and the Bohai Strait and its adjacent area. Oceanologia et Limnologia Sinica. 33 (5), 461–471.
Landry M. R., Hassett R. P. (1982). Estimating the grazing impact of marine micro-zooplankton. Mar. Biol. 67, 283–288. doi: 10.1007/BF00397668
Levitan O., Kranz S. A., Spungin D., Prášil O., Rost B., Berman-Frank I. (2010). Combined effects of CO 2 and light on the N2-Fixing cyanobacterium Trichodesmium IMS101: a mechanistic view. Plant Physiol. 154, 346–356. doi: 10.1104/pp.110.159285
Mayers K. M., Poulton A. J., Bidle K., Thamatrakoln K., Schieler B., Giering S. L., et al. (2020). The possession of coccoliths fails to deter microzooplankton grazers. Front. Mar. Sci. 7. doi: 10.3389/fmars.2020.569896
Melzner F., Gutowska M. A., Langenbuch M., Dupont S., Lucassen M., Thorndyke M. C., et al. (2009). Physiological basis for high CO2 tolerance in marine ectothermic animals: pre-adaptation through lifestyle and ontogeny? Biogeosciences 6, 2313–2331. doi: 10.5194/bgd-6–4693-2009
Meunier C. L., Algueró-Muñiz M., Horn H. G., Lange J. A. F., Boersma M. (2017). Direct and indirect effects of near-future pCO2 levels on zooplankton dynamics. Mar. Freshw. Res. 68, 373–380. doi: 10.1071/MF15296
Nelson K. S., Baltar F., Lamare M. D., Morales S. E. (2020). Ocean acidification affects microbial community and invertebrate settlement on biofilms. Sci. Rep. 10, 3274. doi: 10.1038/s41598–020-60023–4
Pedersen F., Hansen P. (2003). Effects of high pH on the growth and survival of six marine heterotrophic protists. Mar. Ecol. Prog. Ser. 260, 33–41. doi: 10.3354/meps260033
Pörtner H. (2008). Ecosystem effects of ocean acidification in times of ocean warming: a physiologist’s view. Mar. Ecol. Prog. Ser. 373, 203–217. doi: 10.3354/meps07768
Ramaekers L., Pinceel T., Brendonck L., Vanschoenwinkel B. (2022). Direct effects of elevated dissolved CO2 can alter the life history of freshwater zooplankton. Scientific Reports 12 (1), 6134. doi: 10.1038/s41598-022-10094-2
Rose J. M., Feng Y., Gobler C. J., Gutierrez R., Hare C. E., Leblanc K., Hutchins D. A. (2009). Effects of increased pCO2 and temperature on the North Atlantic spring bloom. II. Microzooplankton abundance and grazing. Mar. Ecol. Prog. Ser. 388, 27–40. doi: 10.3354/meps08134
Shannon C. E. (1948). A mathematical theory of communication. Bell System Tech. J. 27, 379–423. doi: 10.1002/bltj.1948.27.issue-3
Sharma D., Biswas H., Bandyopadhyay D. (2022). Simulated ocean acidification altered community composition and growth of a coastal phytoplankton assemblage (Southwest coast of India, eastern Arabian Sea). Environ. Sci. pollut. Res. 29, 19244–19261. doi: 10.1007/s11356-021-17141-x
Suffrian K., Simonelli P., Nejstgaard J. C., Putzeys S., Carotenuto Y., Antia A. N. (2008). Microzooplankton grazing and phytoplankton growth in marine mesocosms with increased CO2 levels. Biogeosciences 5, 1145–1156. doi: 10.5194/bg-5-1145-2008
Sun J., Song X., Yin K., Liu D. (2003). Preliminary study of microzooplankton herbivory in Hong Kong in summer. Acta Ecologica Sin. 23, 712–724. doi: 10.3321/j.issn:1000–0933.2003.04.012
Sun J.-Z., Wang T., Huang R., Yi X., Zhang D., Beardall J., et al. (2022). Enhancement of diatom growth and phytoplankton productivity with reduced O2 availability is moderated by rising CO2. Commun. Biol. 5, 54. doi: 10.1038/s42003-022-03006-7
Thangaraj S., Sun J. (2021). Transcriptomic reprogramming of the oceanic diatom Skeletonema dohrnii under warming ocean and acidification. Environ. Microbiol. 23, 980–995. doi: 10.1111/1462-2920.15248
Wolfe-Simon F., Grzebyk D., Schofield O., Falkowski P. G. (2005). The role and evolution of superoxide dismutases in algae1: superoxide dismutases in algae1. J. Phycology 41, 453–465. doi: 10.1111/j.1529-8817.2005.00086.x
Zhang D., Li S., Wang G., Guo D., Xing K., Zhang S. (2012). Biochemical responses of the copepod Centropages tenuiremis to CO2-driven acidified seawater. Water Sci. Technol. 65, 30–37. doi: 10.2166/wst.2011.821
Zhang D., Guo D., Wang G., Li S. (2016). Response of antioxidant defense system in copepod Calanus sinicus Brodsky exposed to CO2-acidified seawater. Acta Oceanologica Sinica. 35, 82–88. doi: 10.1007/s13131-016-0870-5
Keywords: acidification, microzooplankton, grazing, superoxide dismutase activity, species composition
Citation: Shi W, Fu X, Han Y, Qin J and Sun J (2024) Impact of ocean acidification on microzooplankton grazing dynamics. Front. Mar. Sci. 11:1414932. doi: 10.3389/fmars.2024.1414932
Received: 09 April 2024; Accepted: 07 June 2024;
Published: 25 June 2024.
Edited by:
Haifeng Gu, State Oceanic Administration, ChinaReviewed by:
Jinlin Liu, Tongji University, ChinaSonia Munir, University of Karachi, Pakistan
Kyle M. J. Mayers, Norwegian Research Institute (NORCE), Norway
Copyright © 2024 Shi, Fu, Han, Qin and Sun. This is an open-access article distributed under the terms of the Creative Commons Attribution License (CC BY). The use, distribution or reproduction in other forums is permitted, provided the original author(s) and the copyright owner(s) are credited and that the original publication in this journal is cited, in accordance with accepted academic practice. No use, distribution or reproduction is permitted which does not comply with these terms.
*Correspondence: Jun Sun, cGh5dG9wbGFua3RvbkAxNjMuY29t