 Yuanfang Zhang
 Lin Deng
 Zaiming Ge1,2,4
 Lin Guo
 Qian P. Li
- 1State Key Laboratory of Tropical Oceanography, South China Sea Institute of Oceanology, Chinese Academy of Sciences, Guangzhou, China
- 2University of Chinese Academy of Sciences, Beijing, China
- 3School of Marine Sciences, Sun Yat-sen University, Zhuhai, Guangdong, China
- 4Laboratory for Earth Surface Processes, Ministry of Education, College of Urban and Environmental Sciences, Peking University, Beijing, China
The sediment biogeochemistry of phosphorus (P) and biogenic silica (BSi) in the southern South China Sea shelf (SSCS) is inadequate understood. Here, we examine the spatial distributions of P species and BSi in surface sediments across the Sunda Shelf and explore their relationships with satellite data of sea surface chlorophyll-a (Chla), suspended particulate matter (SPM), particulate organic carbon, particulate inorganic carbon, primary production (PP), and phytoplankton functional types. The total sediment P (TSP), in the range from 283.94 to 579.94 μg/g dry sediment, was dominated by inorganic P with higher levels in stations outside the Lupar and Saribas estuaries. The TSP was composed of seven different P species including Ca-IP and Ca-OP (58%), Detr-P (15%), Exch-P (11%), Fe-IP (10%), Ref-P (4%) and Ads-IP (2%) based on a sequential extraction method. The concentrations of various sediment P species were found significantly correlated with satellite climatological SPM, diatom biomass, and monthly climatological pico-PP revealing the importance of biological production for the sediment P storage, whereas the sediment BSi concentration showed no correlations with any of the above satellite products. An elevated R2 value in the regression of BSi with the in-situ depth-integrated Chla points to the need of developing satellite algorithms with vertical profiles from space. Finally, we argue that future studies of the SSCS sediment biogeochemistry may be benefited from data of hyperspectral and geostationary satellites.
1 Introduction
The biogeochemistry of phosphorus (P) and silicon (Si) are integral parts of the oceanic carbon cycle. P, as a key macronutrient, limits phytoplankton growth in oligotrophic oceans and plays an important role in the productivity of the oceans over geological time (Hecky and Kilham, 1988; Filippelli and Delaney, 1996; Paytan and McLaughlin, 2007). Si is required for the growth of diatoms and some sponges, and is closely linked to processes such as surface primary production, vertical carbon export, and sediment carbon storage (Ann Brewster, 1980; Conley, 1997; Rabouille et al., 1997; Ragueneau et al., 2006; Chou et al., 2012; Tréguer and de la Rocha, 2013).
Rivers and dust deposition are two important pathways for the delivery of P and Si from the land to the ocean (Baturin, 2003). In coastal waters, P can attach to particles or form minerals such as apatite, leading to P scavenge and settle on the seafloor (Goldhammer et al., 2010). Much of the P cycling takes place in coastal and shelf areas, which are critical zones for P deposition and transformation (Filippelli, 1997; Ruttenberg and Berner, 1993). The speciation of P in sediments is critical for understanding its cycling and bioavailability, which are influenced by the transformation and partitioning of reactive P species during the burial processes and upon the change of seawater physiochemistry (Ruttenberg, 1992). For instance, detrital apatite P characterized by slow formation kinetics, directly buried and slowly regenerating, influencing long-term phosphorus cycling. Besides, dissolved organic P released from sediments could support phytoplankton primary production (Andrieux and Aminot, 1997). In contrast, biogenic silica (BSi) in the coastal sediments is largely influenced by the opal production from siliceous plankton such as diatoms (Loucaides et al., 2012).
The South China Sea (SCS), one of the world’s largest marginal seas with a maximal depth of ~5000 m, is flanked by wide continental shelves to the north and south (Liu et al., 2010). This semi-enclosed sea is subject to a number of physical influences, including seasonal monsoons, river discharges, coastal upwelling, atmospheric deposition, mesoscale eddies, and Kuroshio intrusion (Gan et al., 2006; Hu and Wang, 2016; Liu et al., 2001b; Xue et al., 2004). Previous studies have reported spatial change in the sediment P speciation in the eastern coast of Hainan Island (B Yang et al., 2016) and in the northern Beibu Gulf (Dan et al., 2020), as well as the seasonal variability of P speciation in sedimentation particles in the Xisha region (Dong et al., 2016). However, our knowledge of sediment P variability is very sparse in the southern SCS, particularly in the Sunda Shelf. As far as the sediment Si is concerned, it has been suggested that the BSi in the Sunda Shelf sediment can be contributed by sponge spicules (Chou et al., 2012), while its spatial variability and influencing factors remain unexplored.
Satellite measurement remains the only means of quantifying chlorophyll-a concentration (Chla) at large scales with long-term records, due to the advantage of a synoptic view of the ocean surface from space over large scales (Hu et al., 2012). There are various ocean color algorithms developed to estimate the total primary production (PP) (Behrenfeld and Falkowsk, 1997) and the size-fractionated PP (Uitz et al., 2010; Brewin et al., 2017; Deng et al., 2023), as well as phytoplankton community structure (IOCCGSathyendranath, 2014) including both functional types and size classes (Uitz et al., 2006; Mouw et al., 2019). Here, we report the spatial variability in sediment BSi and various P species across the shelf-slope of the southern SCS from the inner Sunda Shelf to the deep basin region. We further explore the relationships of the cross-shelf change in sediment biogeochemistry with the varying satellite products such as PP, suspended particulate matter (SPM), the bulk Chla, and phytoplankton function types. The main purposes are to examine the sediment biogeochemistry of P and Si in the Sunda shelf of the southern SCS.
2 Materials and methods
2.1 Sample collection
Surface sediment and water samples were collected from 13 stations along a shelf-slope transect from the inner shelf to the deep basin by the R/V Shiyan-II in March-April 2021 in the southern region of the SCS (Figure 1). At each station, the discrete seawater samples in water column were collected using Niskin bottles mounted on the CTD. Surface sediments were collected using a stainless-steel grab sampler, sealed in polyethylene bags and stored frozen (-20°C) for future analysis. The stations of E12, E13 and E14 were in the slope, and the stations from C01 to C10 were in the shelf, with the southernmost station location near the Natuna Islands. Our sample depths ranged from 86 m to 600 m. These stations covered very different sediment zones with the predominance of silty sand and sandy mud over the shelf but the prevailing of silty clay and clay mud on the shelf-slope (Wang et al., 2016).
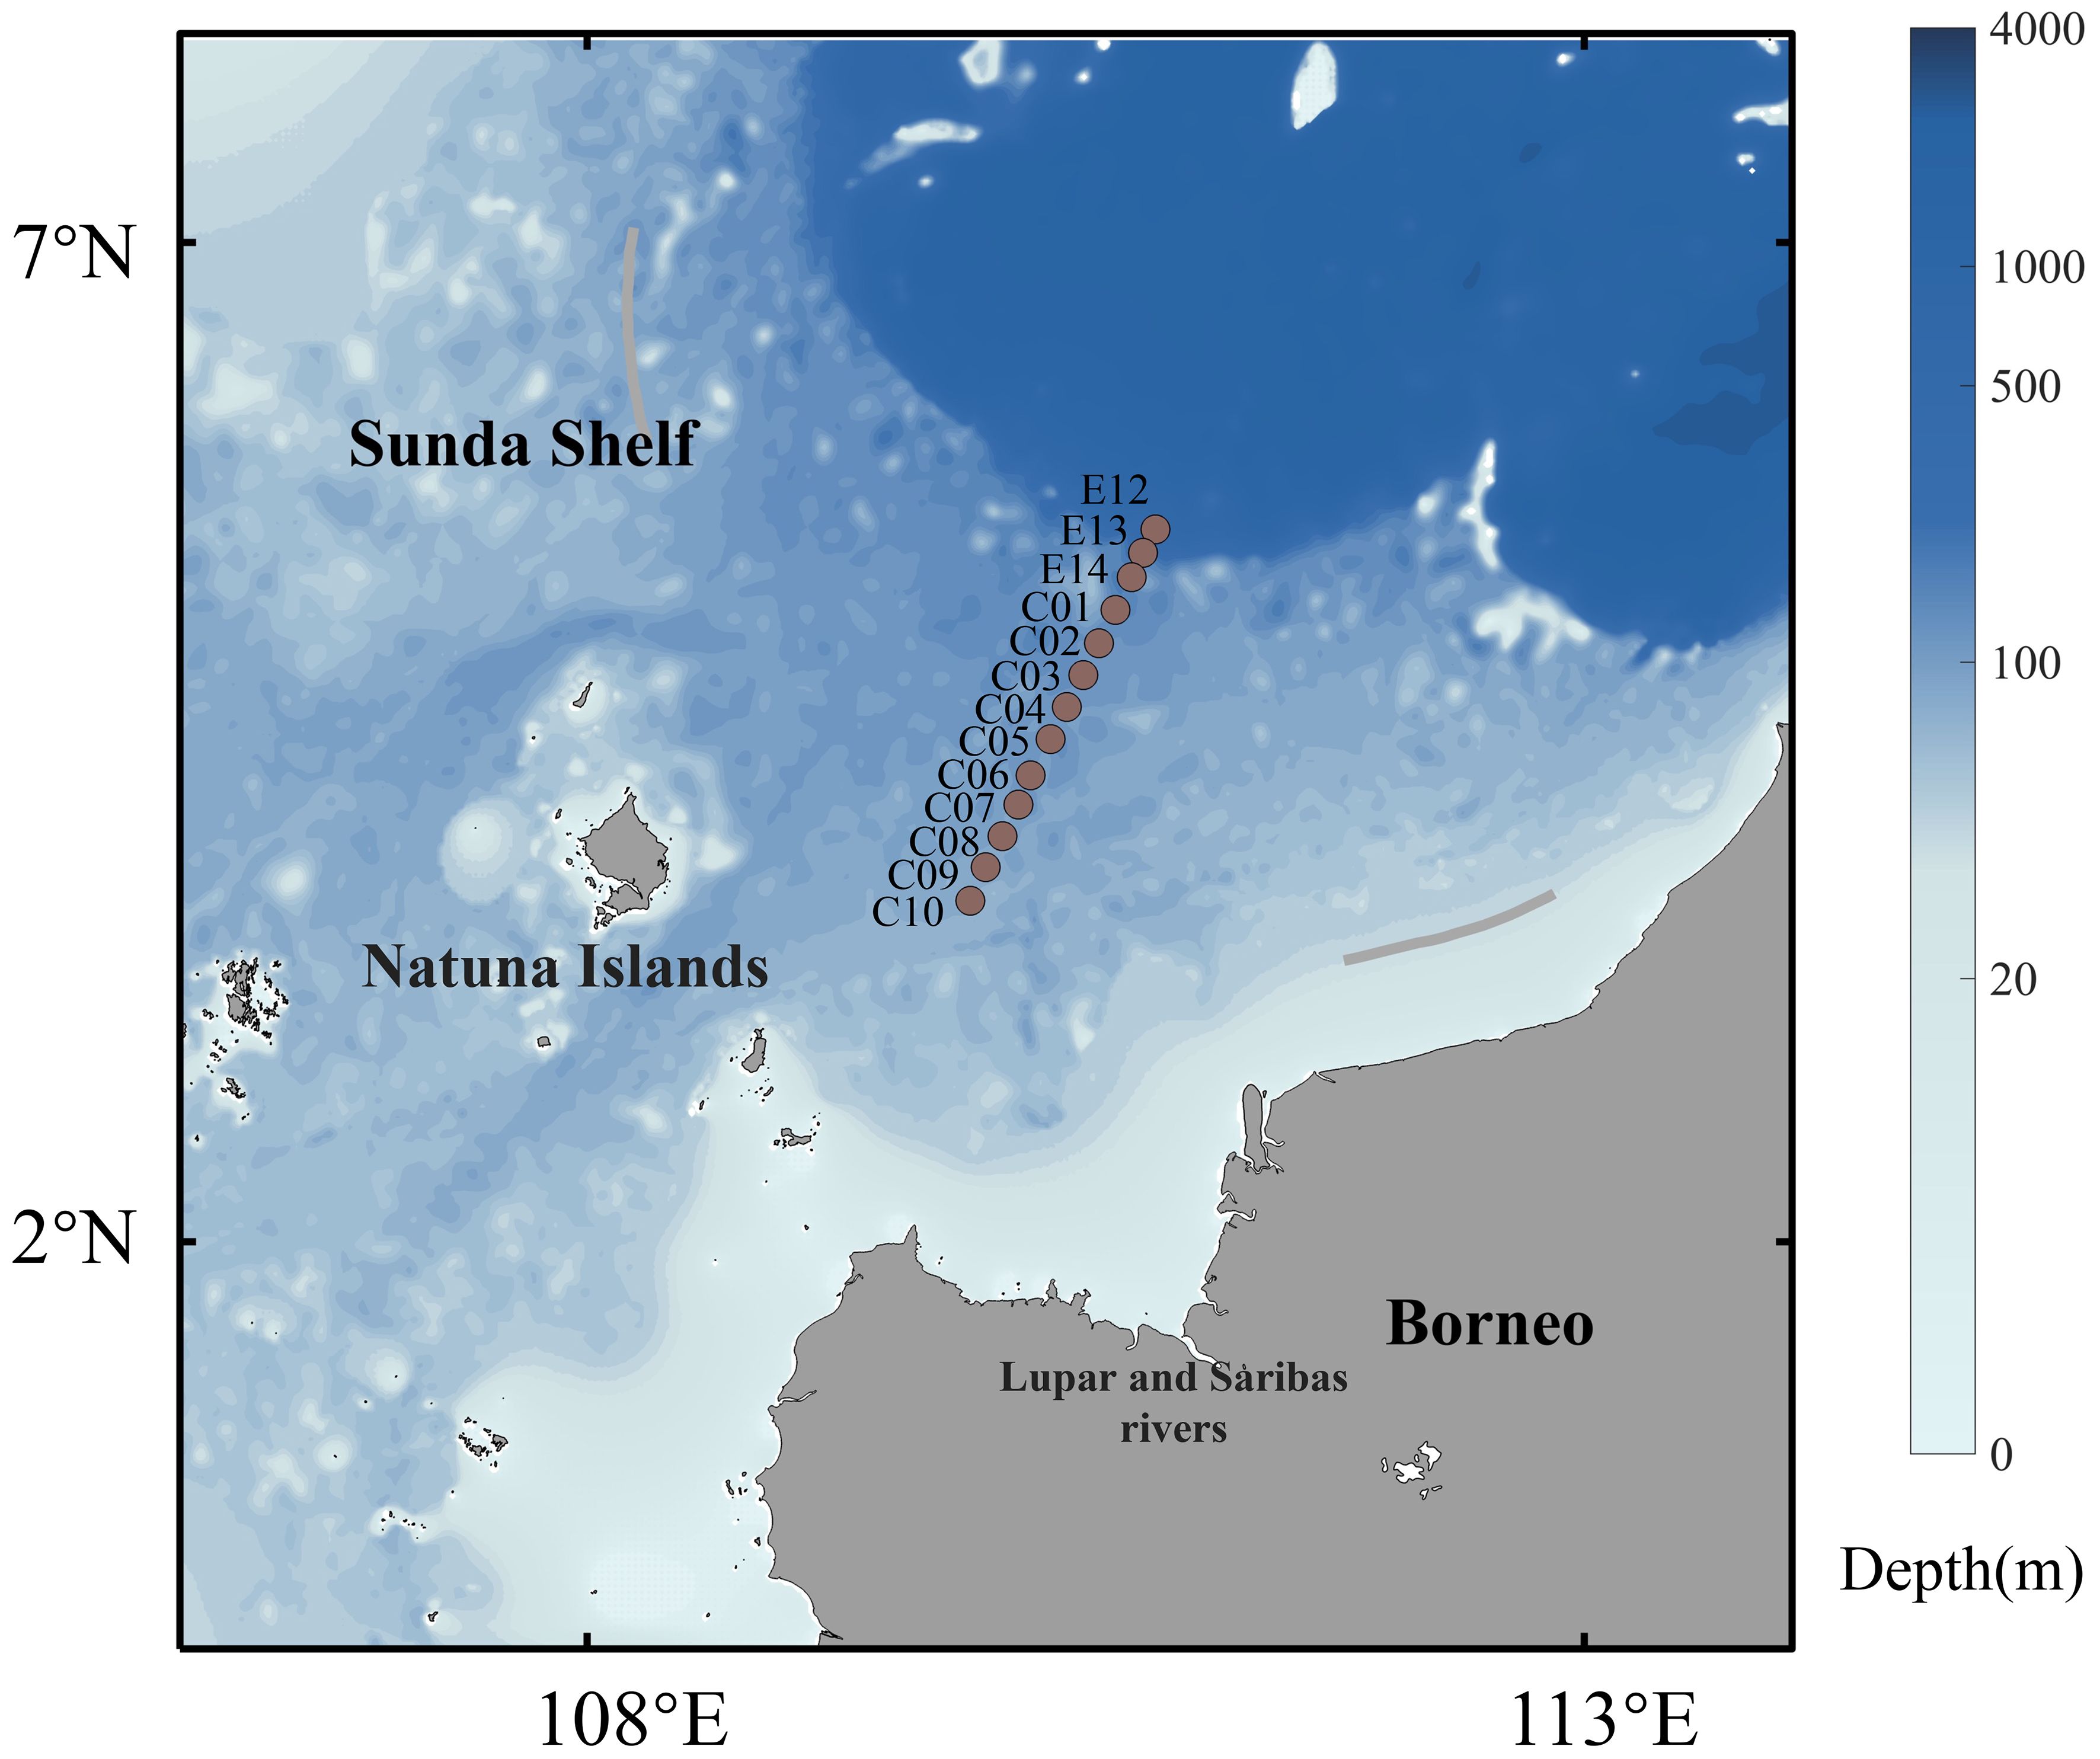
Figure 1 Schematic showing the geographical location of the southern South China Sea and map of the general study area and sampling stations (Brown circle).
2.2 Phosphorus fractionation
Sequential P extractions have been developed and utilized by a number of investigators to chemically separate different pools of P in soil and sediments (Ruttenberg, 1992; Zhang et al., 2004). In this study, a modified five-step sequential extraction (SEDEX) method (Dong et al., 2016) was used to operationally separates five different pools of P in sediments, including (1) exchangeable P (Exch-P), consist of the loosely adsorbed inorganic P (Ads-IP) and the exchangeable organic P (Exch-OP), (2) iron-bound inorganic P (Fe-IP), (3) calcium-associated P (Ca-P), which were the calcium phosphate minerals of the apatite group including Ca-bound inorganic P (Ca-IP) and Ca-bound organic P (Ca-OP), (4) detrital apatite P (Detr-P), and (5) refractory organic P (Ref-OP). Soluble reactive P (SRP) was accurately quantified at each step of the procedure. Total dissolved P (TDP) and dissolved organic P (DOP) were measured by determining TDP and then subtracting SRP from TDP prior to digestion. Sediment samples (0.5 g) were analyzed in polypropylene tubes, using 1 M MgCl2 for inorganic P extraction and different solutions for different phosphorus fractions over time. The TDP in the extracts was determined using a persulfate digestion method (Huang and Zhang, 2009), with a phosphomolybdenum blue method for final SRP measurement, achieving a P recovery rate of over 98%. Phosphate standards and reagents were of analytical grade and sample neutralization was performed only when necessary. The detection limit of P by the SEDEX method is 0.01 μM. Total sedimentary P (TSP) was determined by the same method as TDP after digestion. Particulate inorganic P (PIP) was derived from the sum of Ads-IP, Fe-IP, Ca-IP and Detr-P, whereas particulate organic P (POP) was calculated from the sum of Exch-OP, Ca-OP and Ref-OP.
2.3 Determination of biological silica
The BSi in the sediment was extracted with an alkaline solution of Na2CO3 and measured using silicon-molybdenum-blue colorimetric method (Dong et al., 2016). Approximately 150 mg of dried sediment was pre-treated with peroxide and hydrochloric acid to remove carbonates and organics, followed by centrifugation and filtration to remove residues. After drying overnight at 60°C, the sample was incubated in 40 ml of 2 mol L-1 Na2CO3 at 85°C for 5 hours, then centrifuged to collect supernatants for silicate analysis by UV-visible spectrophotometry at 812 nm. Rapid processing minimized the loss of dissolved silica. Working standards, prepared from fused silica standards diluted in Na2CO3 and Milli-Q water, were measured after the reduction of the silicon-molybdate complex for a minimum of 12 hours. Fresh reagents were used to ensure accuracy.
2.4 Satellite and hydrodynamic data
The climatology and monthly climatological satellite products of sea surface Chla, SPM, particulate organic carbon (POC), and particulate inorganic carbon (PIC) were obtained from the Moderate Resolution Imaging Spectroradiometer (MODIS) on board the Aqua satellite via https://oceancolor.gsfc.nasa.gov/l3/. Chl a data are derived from remotely sensed reflectance (Rrs) using the OCx/CI Chl a algorithm that takes into account the ratio between Rrs(blue) and Rrs(green) (O'Reilly and Werdell, 2019) or by exploits exploiting the difference between Rrs(Green) and a reference formed in a linear fashion between Rrs(blue) and Rrs(red) (Hu et al., 2019). POC are derived from a power-law algorithm applied to a blue/green band ratio (Stramski et al., 2008). The PIC are derived from normalized water-leaving radiances in two bands near 443 and 555 nm (Balch et al., 2005) or the spectral reflectance of the top of the atmosphere at three wavelengths near 670, 750 and 870 nm (Gordon et al., 2001). In addition, the data of monthly size-fractionated Chla and phytoplankton functional type-fractionated Chla were from the satellite products of the Copernicus Marine Service (CMEMS) via https://data.marine.copernicus.eu/ products, in which the size-fractionated Chla were derived for the pico-, nano- and micro phytoplankton while the phytoplankton functional type-fractionated Chla were for diatoms, dinophytes, green algae, haptophytes, prochlorophytes and prokaryotes from Xi et al. (2020) algorithm. Monthly climatological PP and size-fractionated PP (sfPP) were estimated from an SCS-tuned size-fractionated PP model (Deng et al., 2024). All of the above datasets had spatial resolutions of 4 km. The modelled eastward and northward water velocities (m/s) during the cruise sampling were also obtained from the CMEMS, which provides a gridded daily reanalysis product with a horizontal resolution of 0.083° and 50 standard levels. The annual mean sea surface temperature from 1991 and 2020 were estimated from NOAA OI SST dataset via https://psl.noaa.gov/data/gridded/data.noaa.oisst.v2.highres.html.
2.5 Statistical analyses
Correlations between surface sediment P and BSi with satellite measurements were assessed by the coefficient of determination (R2), mean bias deviation (MBD), the absolute percentage difference (MAPD), root mean-square deviation (RMSE), and median ratio of estimated to measured values (Fmed).
3 Results
3.1 Hydrography
The hydrographic characteristics derived from the vertical profiles of the CTD measurements showed similar vertical structures, but clear significant differences in characteristics between locations and sampling depths. There was much lower sea surface temperature for station E13 (18.98 ± 4.80°C) than the station C10 in the shallower coastal area (25.70 ± 1.21°C). A well-developed mixed layer was found from the sea surface to a depth of about ~20 m before a rapid dropdown of seawater temperature (Figure 2A). In contrast, salinity generally increased with depth at each station (Figure 2B). Surface salinity was slightly lower (0.4 PSU) for stations near the coast than the offshore, likely reflecting the impacts of the Lupar River. Consistent with temperature profile, there were distinct salinity variations at depths of about 25 m and depths between 80 and 140 m. The profiles of dissolved oxygen (DO) were similar to that of temperature (Figure 2C), decreasing with depth. The higher DO near the surface may be related to photosynthesis, as phytoplankton photosynthesis occurred and released oxygen in the sunlit surface water. With increasing depth, dissolved oxygen decreases, possibly due to reduced sunlight, reduced phytoplankton photosynthesis and relatively higher oxygen demand in deeper waters.
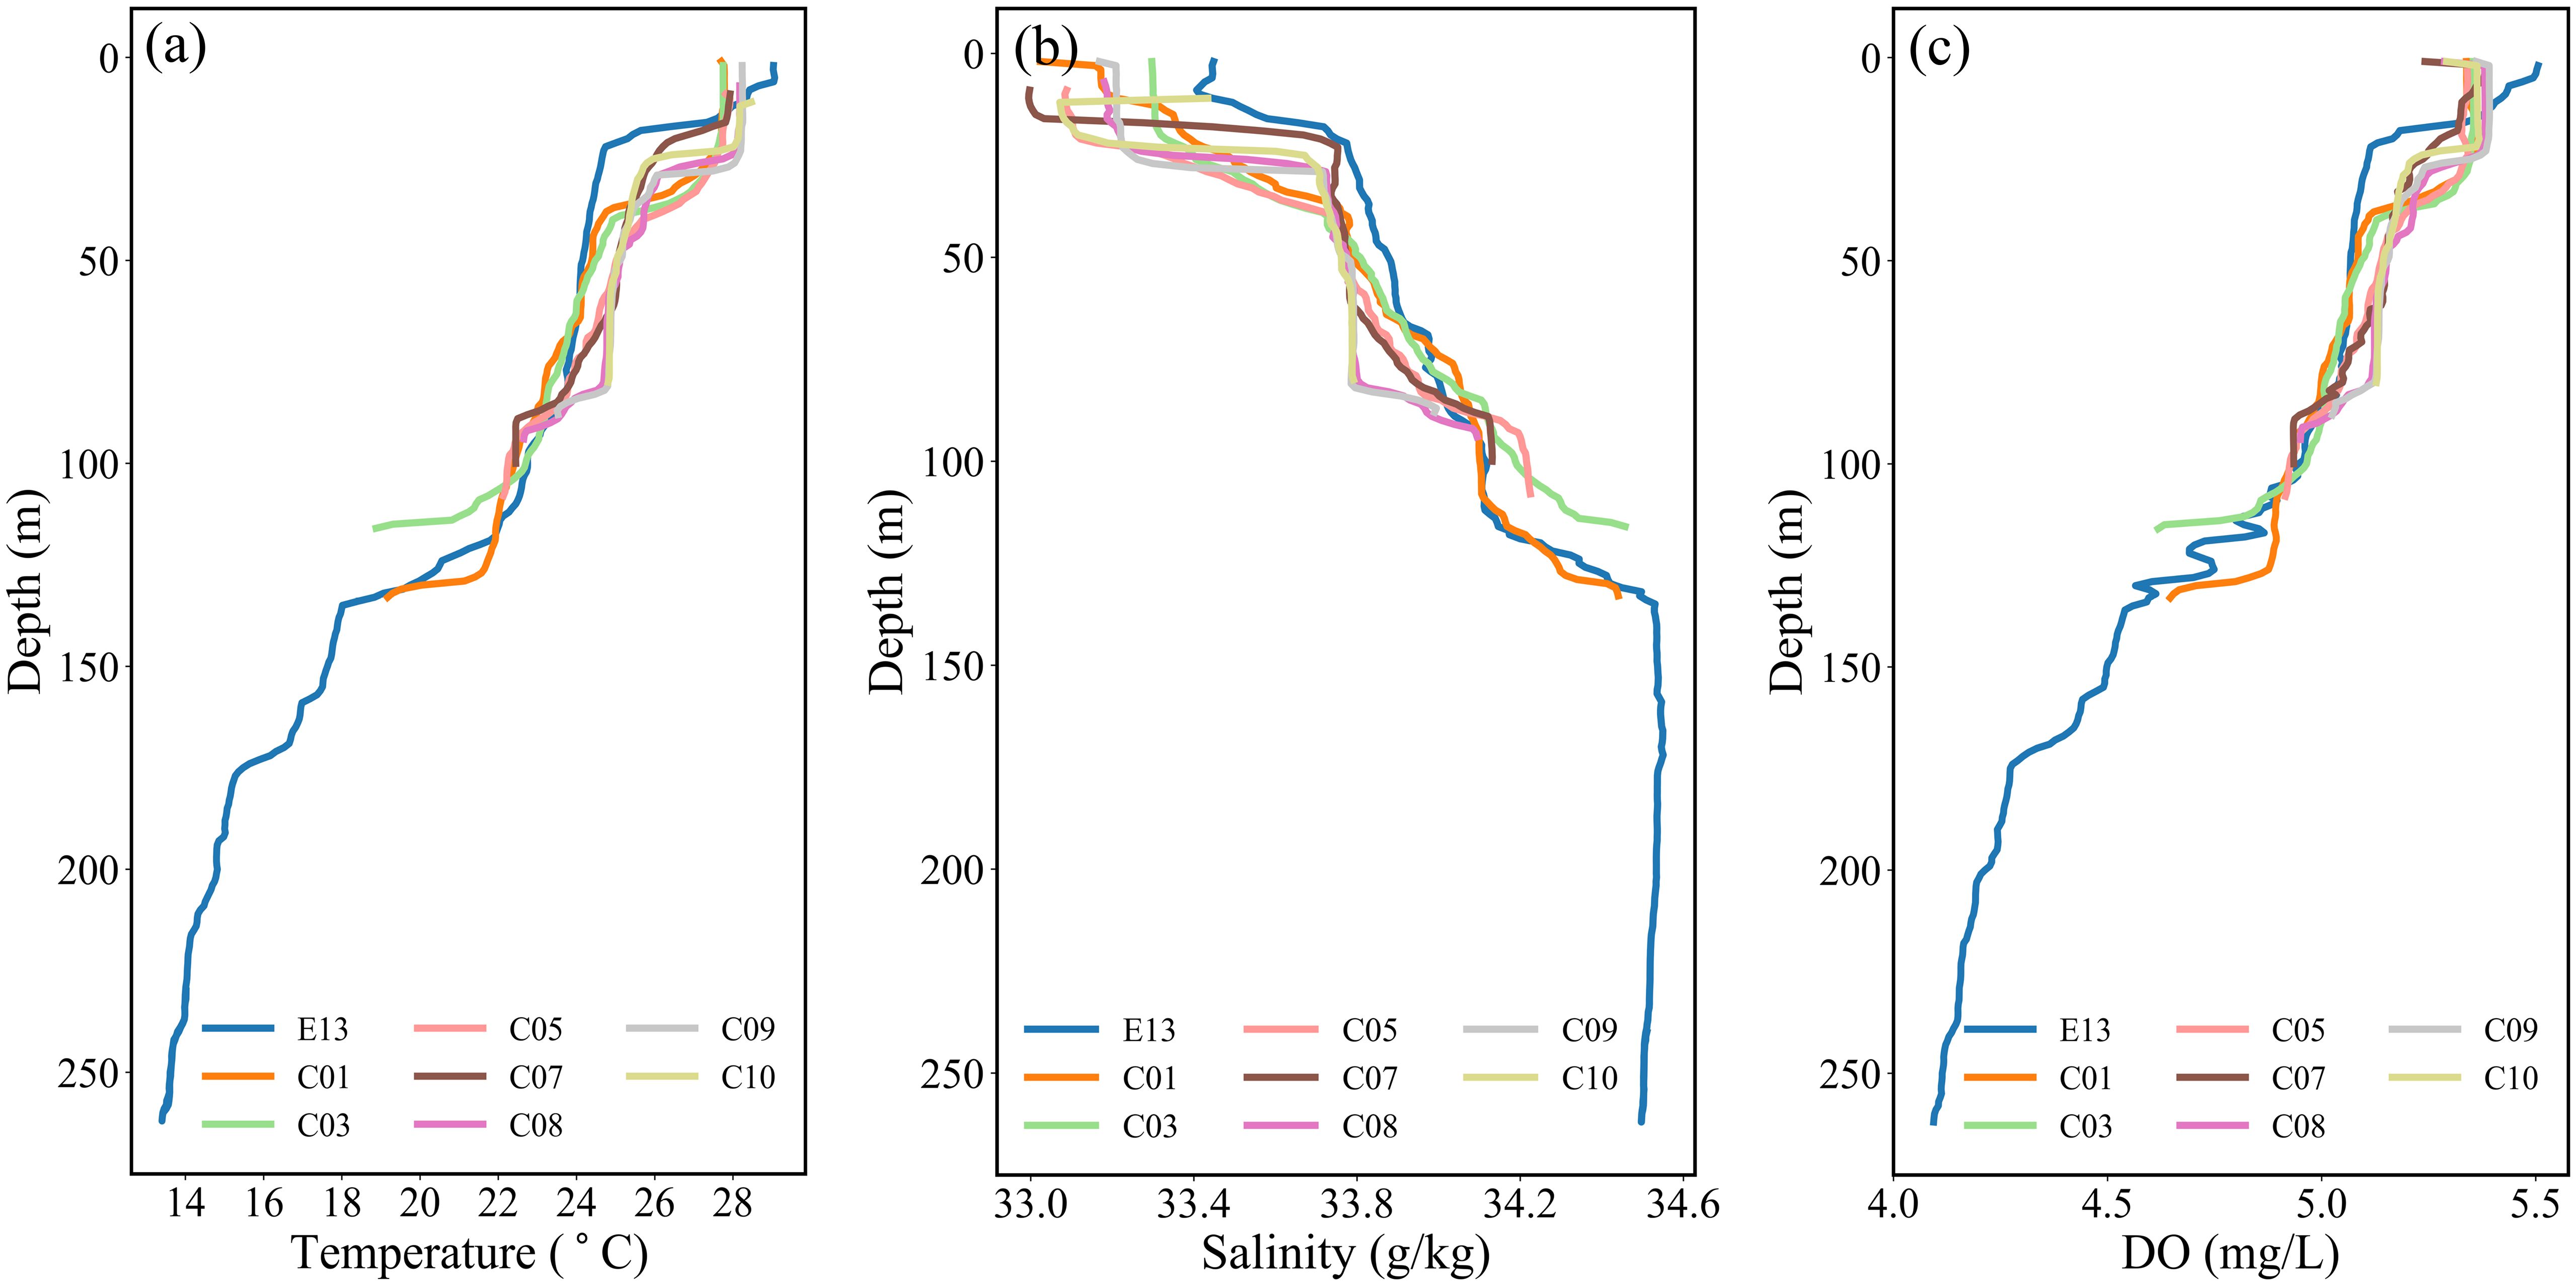
Figure 2 Vertical profiles of (A) temperature, (B) salinity, (C) dissolved oxygen for the stations o in the SSCS measured by CTD.
3.2 Patterns of sedimentary phosphorus speciation and biological silica along transection
Sedimentary P speciation and BSi showed large spatial variations in the Sunda Shelf (Figure 3). Significant differences were observed between the coastal stations (C04 - C10) and the offshore stations (E12 - C04) when station C04 is used as a boundary. The mean percentage of BSi in the sediments was 4.69% in the offshore stations, which is higher than in the coastal stations of 4.54%. A similar trend was observed for Ads-IP, with mean concentrations of 6.73 μg/g at offshore stations and 6.24 μg/g at coastal stations. Certain parameters were significantly lower at offshore stations compared to coastal stations, including Fe-IP from 44.25 μg/g nearshore to 36.97 μg/g offshore, Ca-OP from 163.97 μg/g to 114.71 μg/g, Ca-IP from 129.36 μg/g to 80. 01 μg/g, Detr-P from 75.61 μg/g to 53.1 5μg/g, PIP from 290.06 μg/g to 211.55 μg/g, POP from 191.67 μg/g to 141.68 μg/g and TSP from 481.73 μg/g to 353.23 μg/g. However, Exch-OP and Ref-P showed no significant variations between coastal and offshore stations. The most offshore station (E12) was characterized by a higher percentage of BSi (7.16%). The most coastal station was characterized by high concentrations of TSP and PIP (463.25 μg/g and 274.87 μg/g).
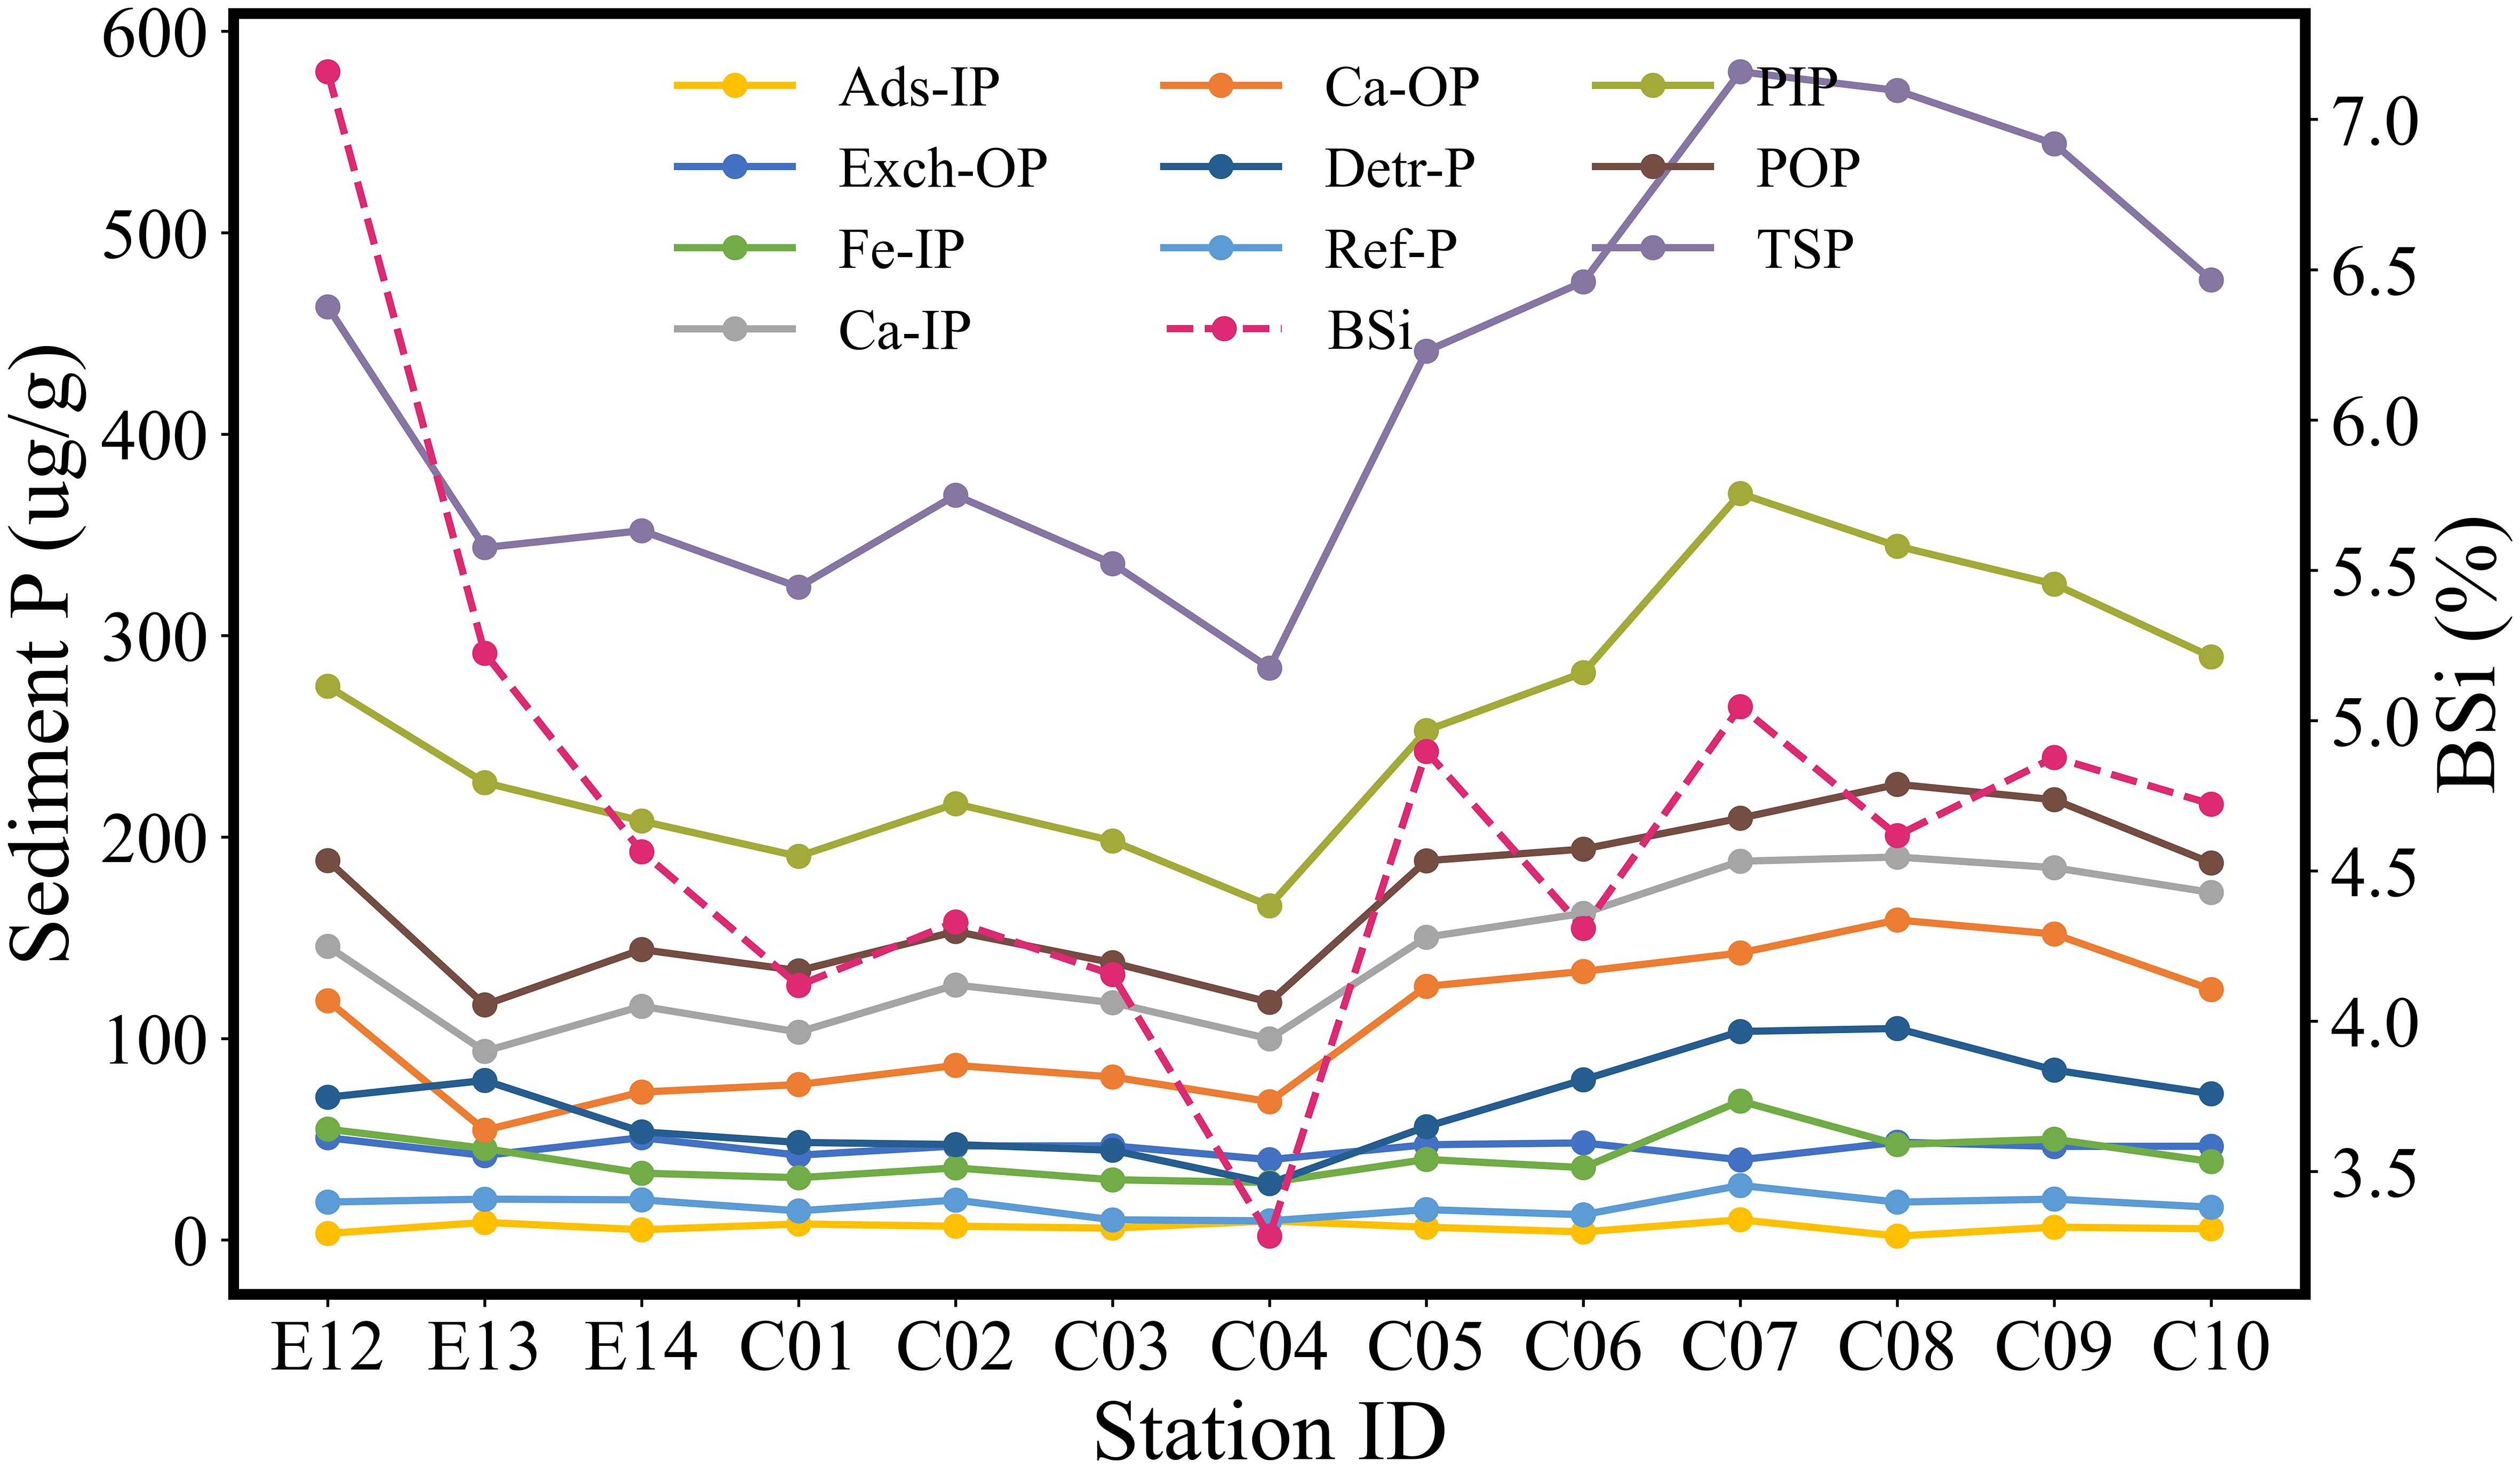
Figure 3 Variations of sedimentary P speciation and BSi along transection.
3.3 Spatial variation of sedimentary phosphorus speciation and biological silica
The spatial patterns of the TSP were the highest near 4°N and decreased towards the north, which could be attributed to the input of P from continental sources (Figures 4A-C). The distributions of POP and PIP were quite similar, suggesting a close connection between organic and inorganic P in particulate matter. All three parameters were characterized by a slight elevation at the northernmost station (E12), possibly indicating a distinction between deep water sediment deposition and shelf sources. Ads-IP was higher in the offshore stations (E12 to C04) than coastal stations (C04 to C10). Fe-IP and Ref-P were characterized by low values in the central region and high values at stations in the north and south. Ca-OP, Ca-IP, and Detr-P showed similar spatial distributions, with high concentrations near the southern coastal stations, lower concentrations in the central region, and slightly elevated concentrations at the northernmost offshore stations. Exch-OP did not show significant differences in mean values between coastal and offshore stations, but its spatial distribution showed that its highest values occurred at the northernmost station E12 (Figure 4J). The BSi was pronounced at the northernmost station, with a low value in the central area and a slightly elevated value at the coastal station.
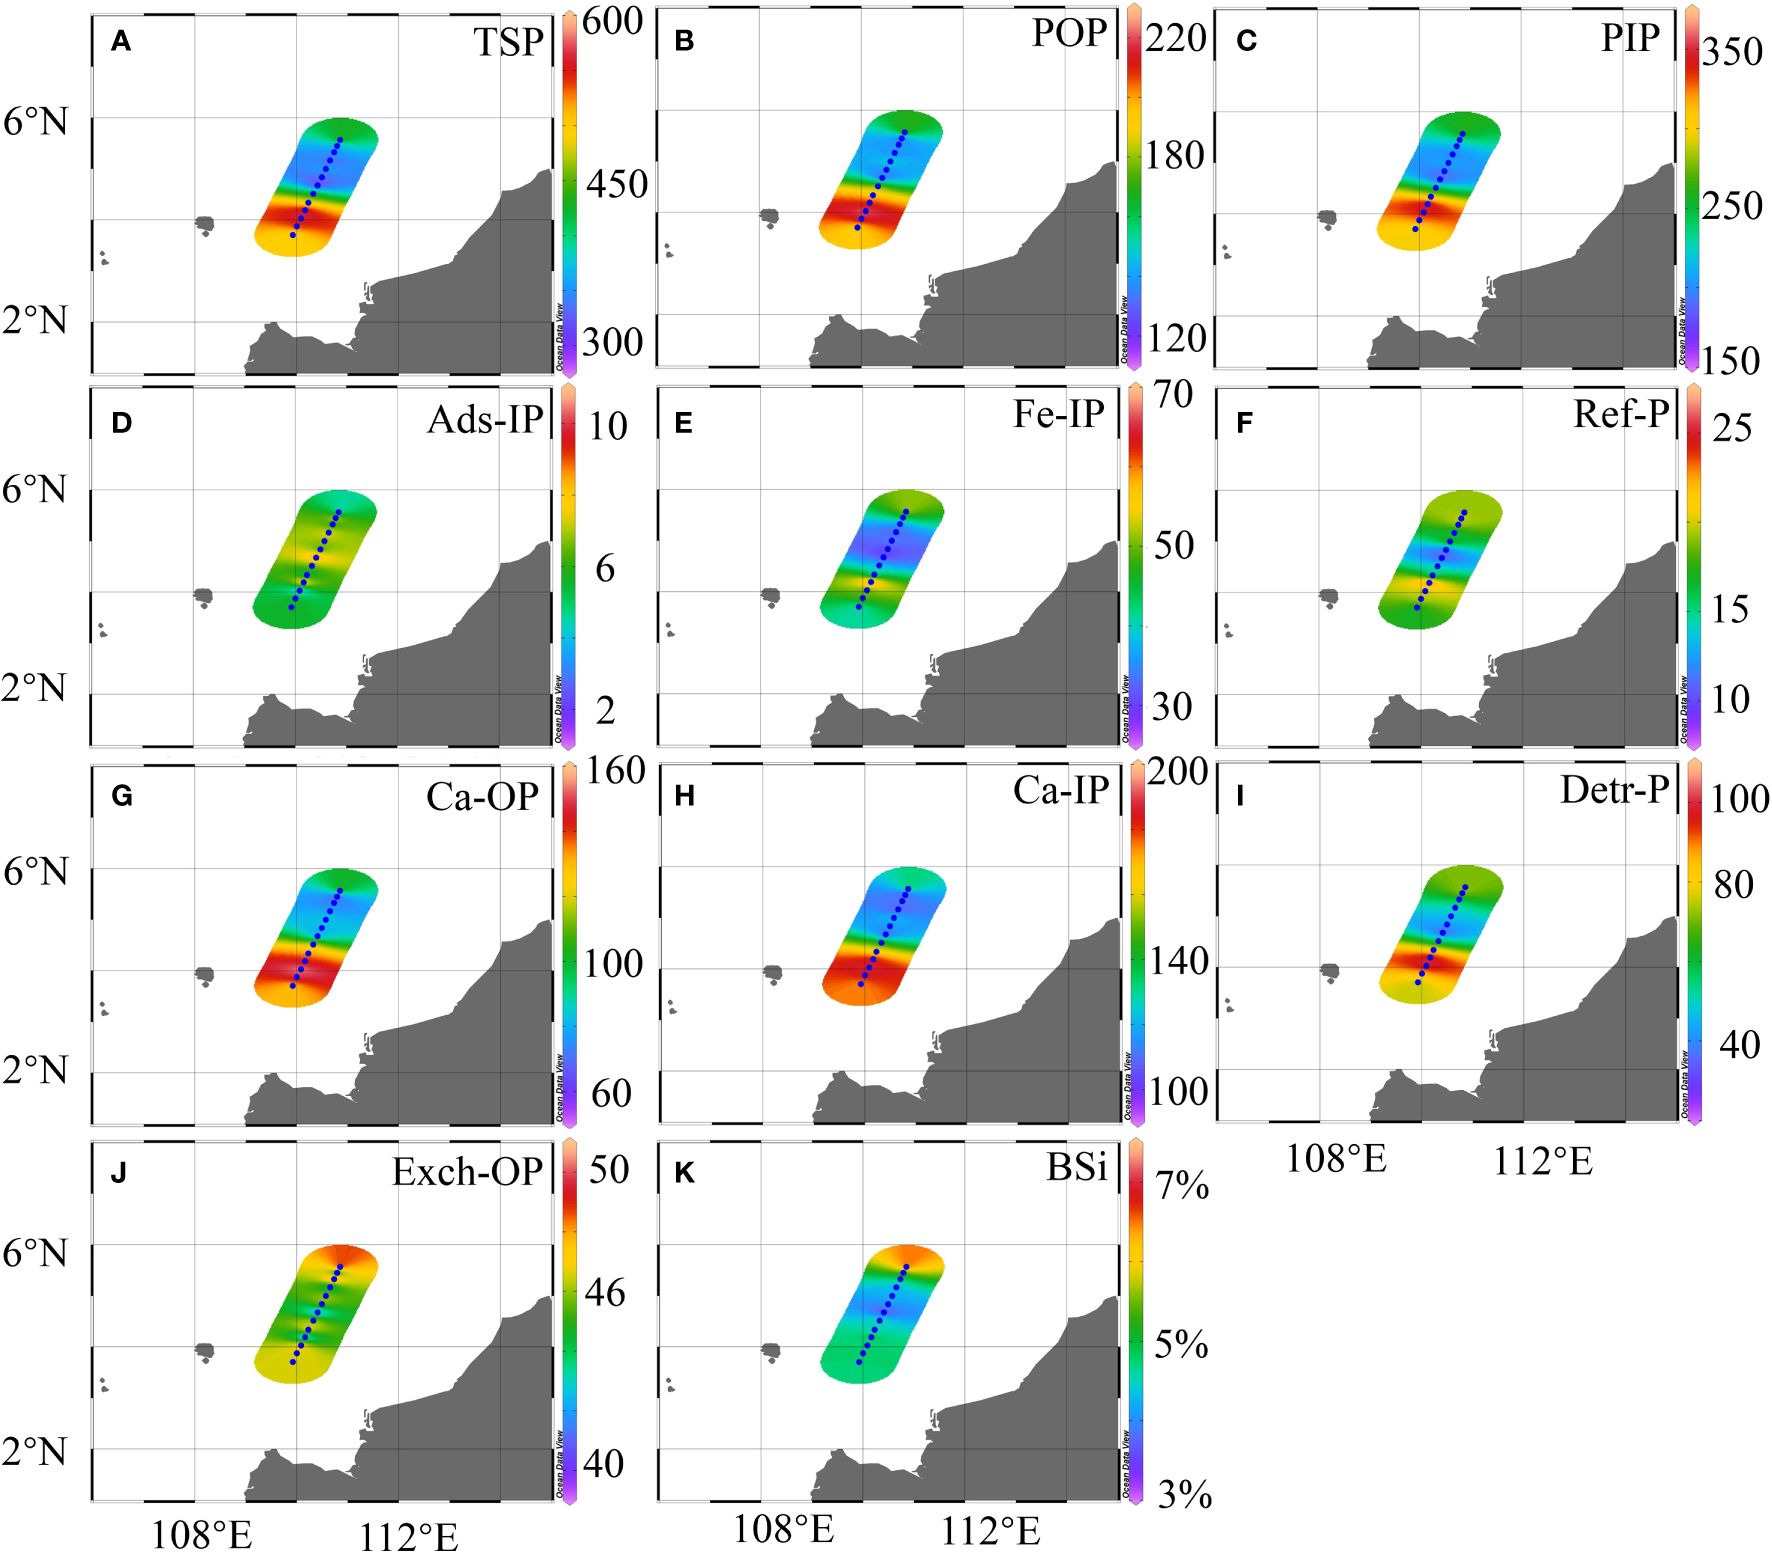
Figure 4 Spatial variations of sedimentary P speciation (μg/g) and BSi (%) along transection (A–F).
3.4 Spatial variations of satellite observations
Satellite-based monthly climatological Chla in the Sunda Shelf showed high values (>1.0 mg m-3) in the coastal region and low values (≤0.1 mg m-3) in the offshore region (Figure 5A). For example, Chla was 0.1 mg m-3 at station E12, and was 0.29 mg m-3 at station C10. The climatology of PP was high (>800 mgC m-2 day-1) near the coast, and gradually decreased offshore to 355 mgC m-2 day-1 at E12 (Figure 5B). The PP along the section in the Sunda Shelf ranged from 355 to 397 mgC m-2 day-1, with the highest value of 397 mgC m-2 day-1 at station C10. Similar to PP, POC was high (>300 mg m-3) in the coastal region, and were low (<100 mg m-3) in the offshore region. The southern end of our station C10 was exactly in the transition zone with 200 mg m-3, while the northernmost station E12 was in low POC regions at less than 100 mg m-3. The SPM did not show significant variation along the transect, ranging from 0.32 g m-3 at station C10 to 0.35 g m-3 at station E12.
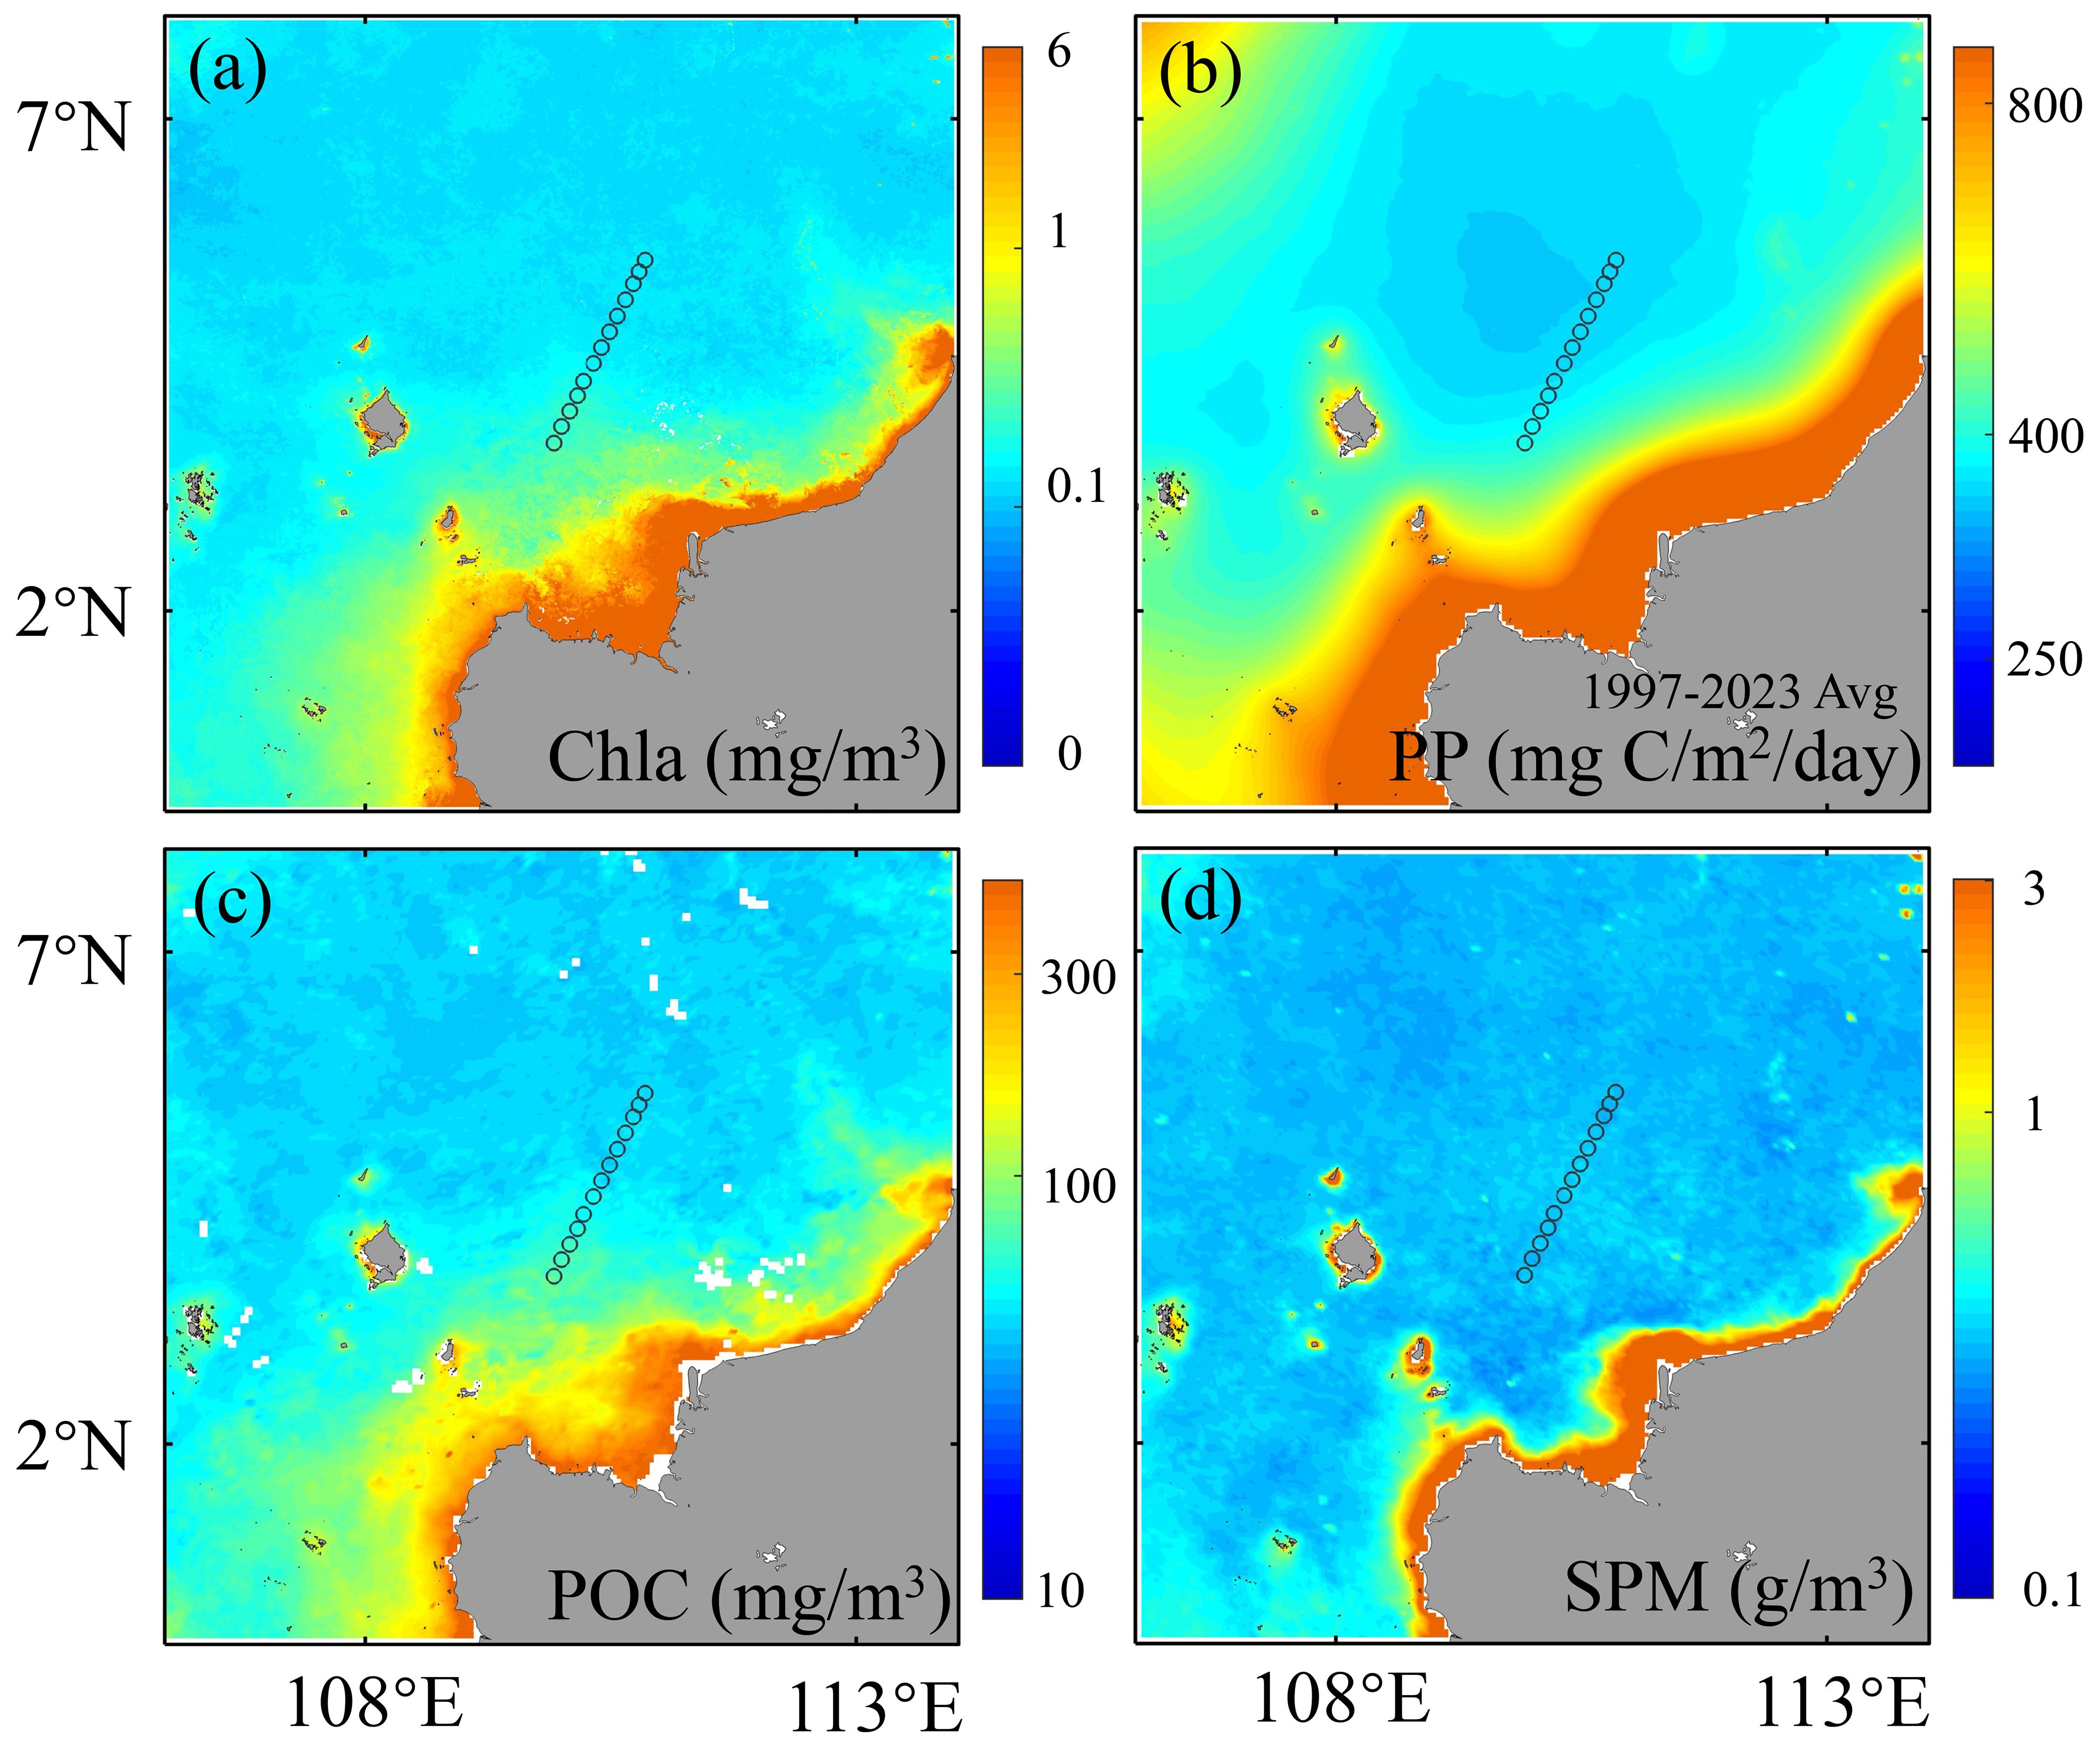
Figure 5 Spatial patterns of (A) monthly climatology Chla, (B) climatology PP, (C) monthly climatology POC and (D) monthly climatology SPM derived from satellite data.
3.5 Correlation between satellite products and sediments
Figure 6 showed the correlations between satellite products and sedimentary P speciation and BSi. It was observed that for coarsely classified sedimentary P such as TSP, PIP and POP, certain satellite products such as SPM, PP, pico-PP and diatoms showed higher correlations (Figures 6A-F). TSP showed high correlations with climatological SPM, monthly climatological diatoms, PP and pico PP with R2 of 0.73, 0.69, 0.65 and 0.70 respectively. For the rough classification of P, some satellite products such as monthly climatological pico-PP and climatological SPM also showed high correlations with POP and PIP, with R2 values of 0.66 and 0.73 respectively. For more refined separations of sedimentary P, such as Ca-IP, Detr-P and Ca-OP, there were also significant correlations with satellite products such as monthly climatological pico PP, micro Chla and monthly climatological PP, with R2 values of 0.78, 0.58 and 0.65, respectively.
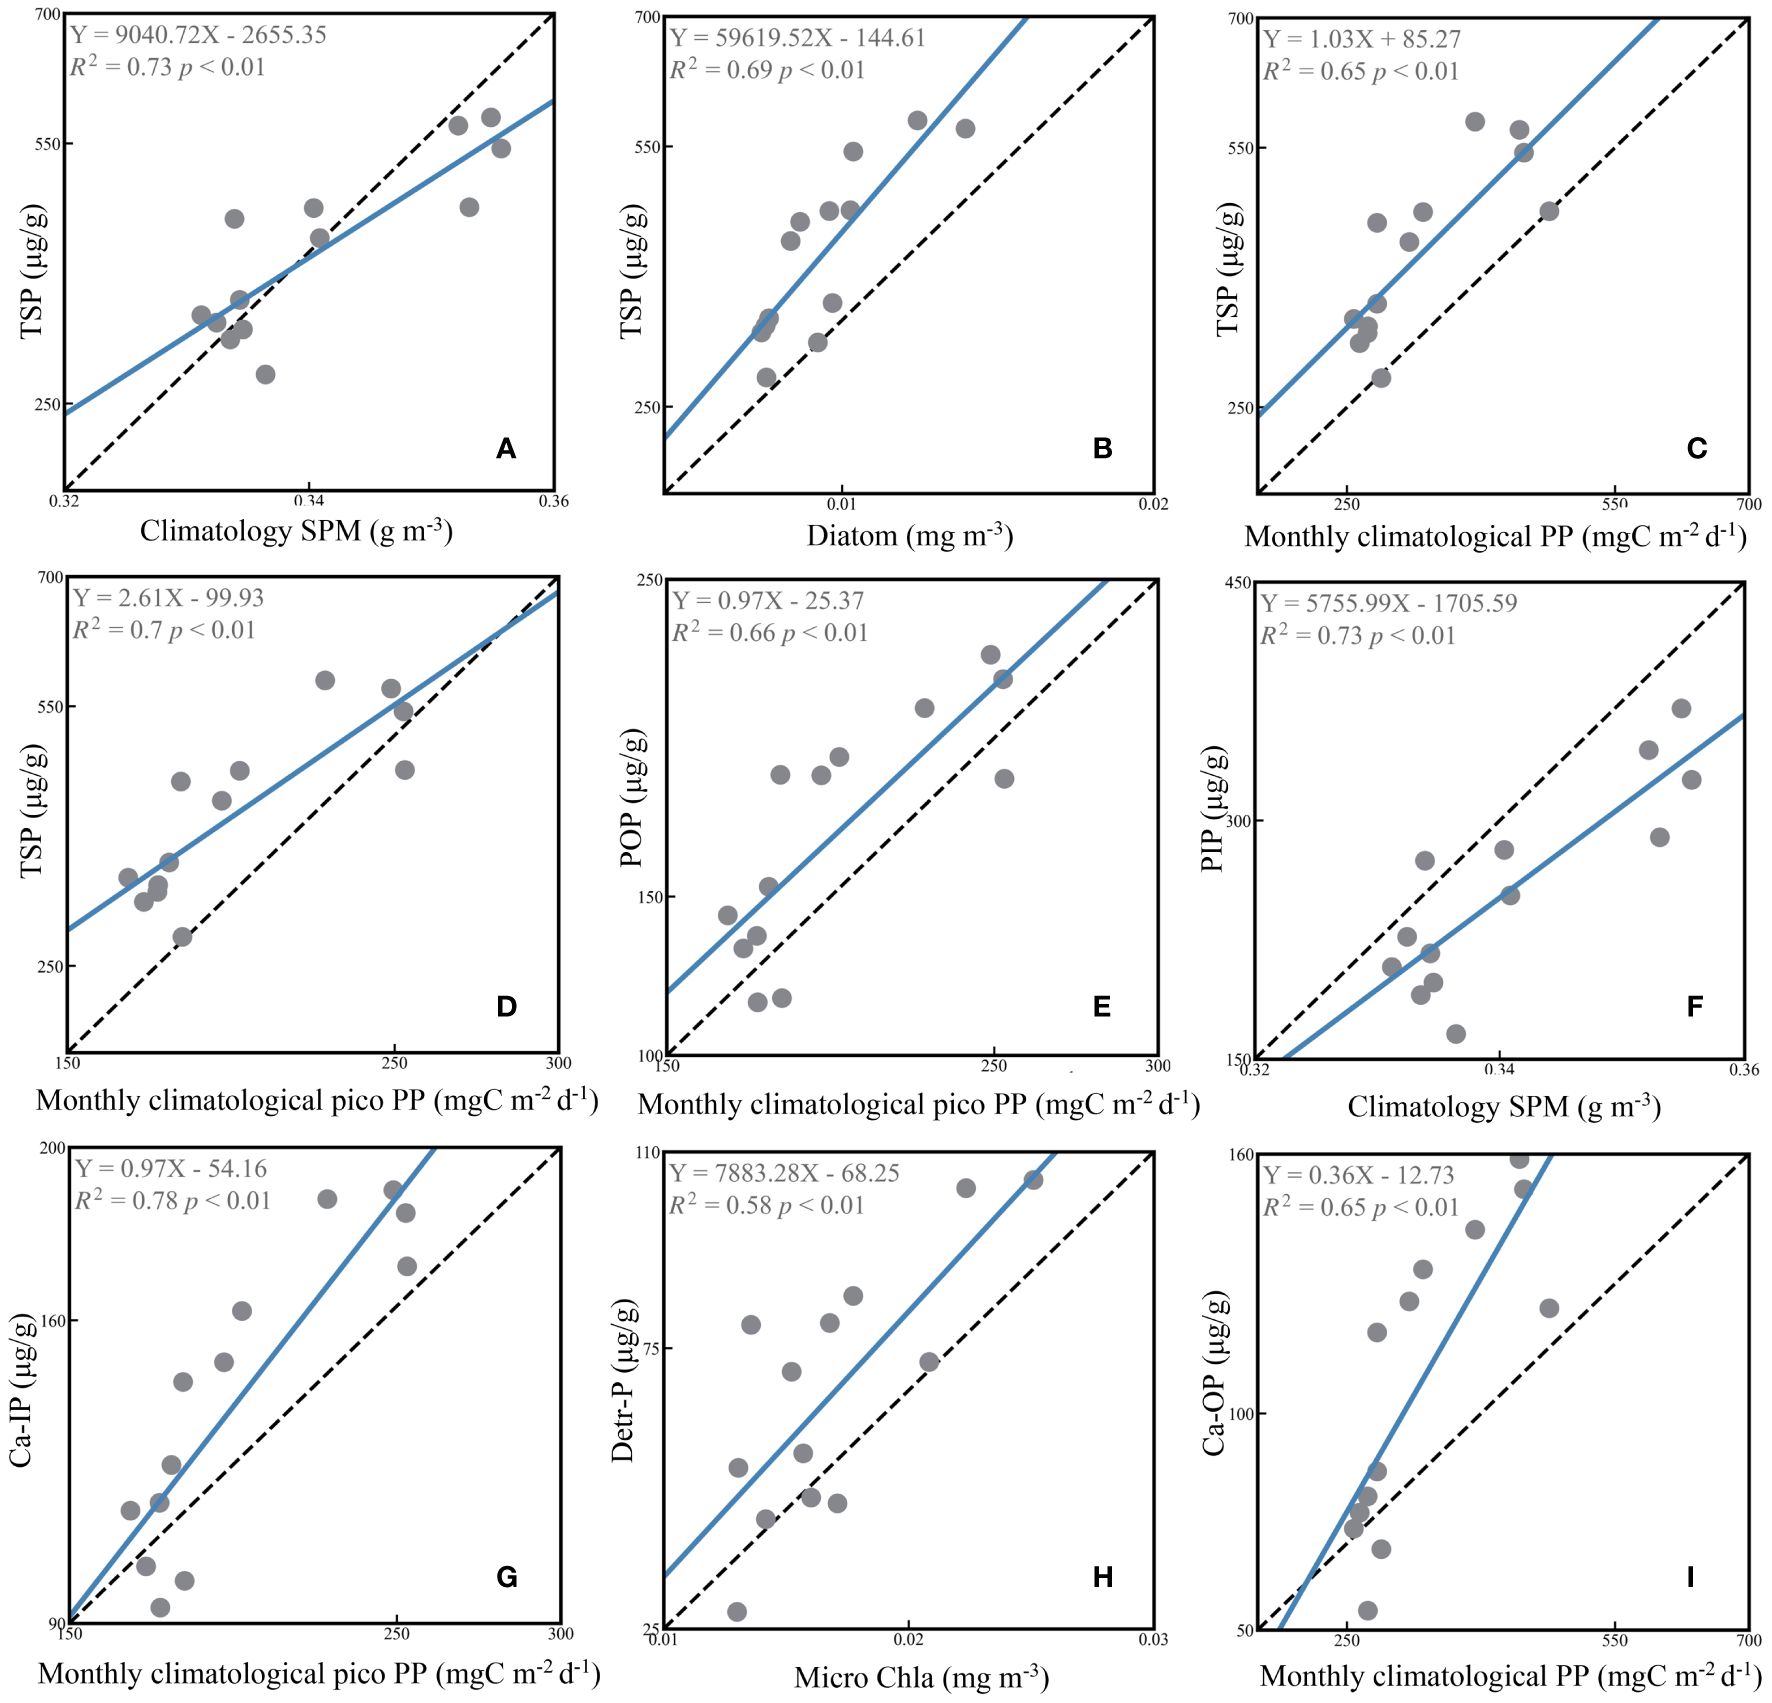
Figure 6 Scatter plots of satellite products and sedimentary P speciation (A–I). The grey circle is the data points and the blue line is the regression line. The legends show the R2, p-value and also the linear regression function.
We also examined all satellite products and sedimentary P speciation and BSi to calculate their linear regression R2 values and p-values (Table 1). Satellite products showed significant correlations with TSP, POP, and PIP, except for monthly climatological SPM and certain algal categories such as dinophytes, green algae and haptophytes, which did not demonstrate significant correlations (p<0.05). The three most correlated satellite products were climatological SPM (0.73), monthly climatological pico PP (0.70) and monthly climatological diatoms (0.69). In addition, it was observed that the R2 values for the correlations with TSP and PIP were higher than those with POP. The top three satellite products correlated with POP were climatological SPM (0.66), monthly climatological pico PP (0.66) and diatoms (0.62). The top three satellite products correlated with PIP were climatological SPM (0.72), diatoms (0.69) and micro Chla (0.68).
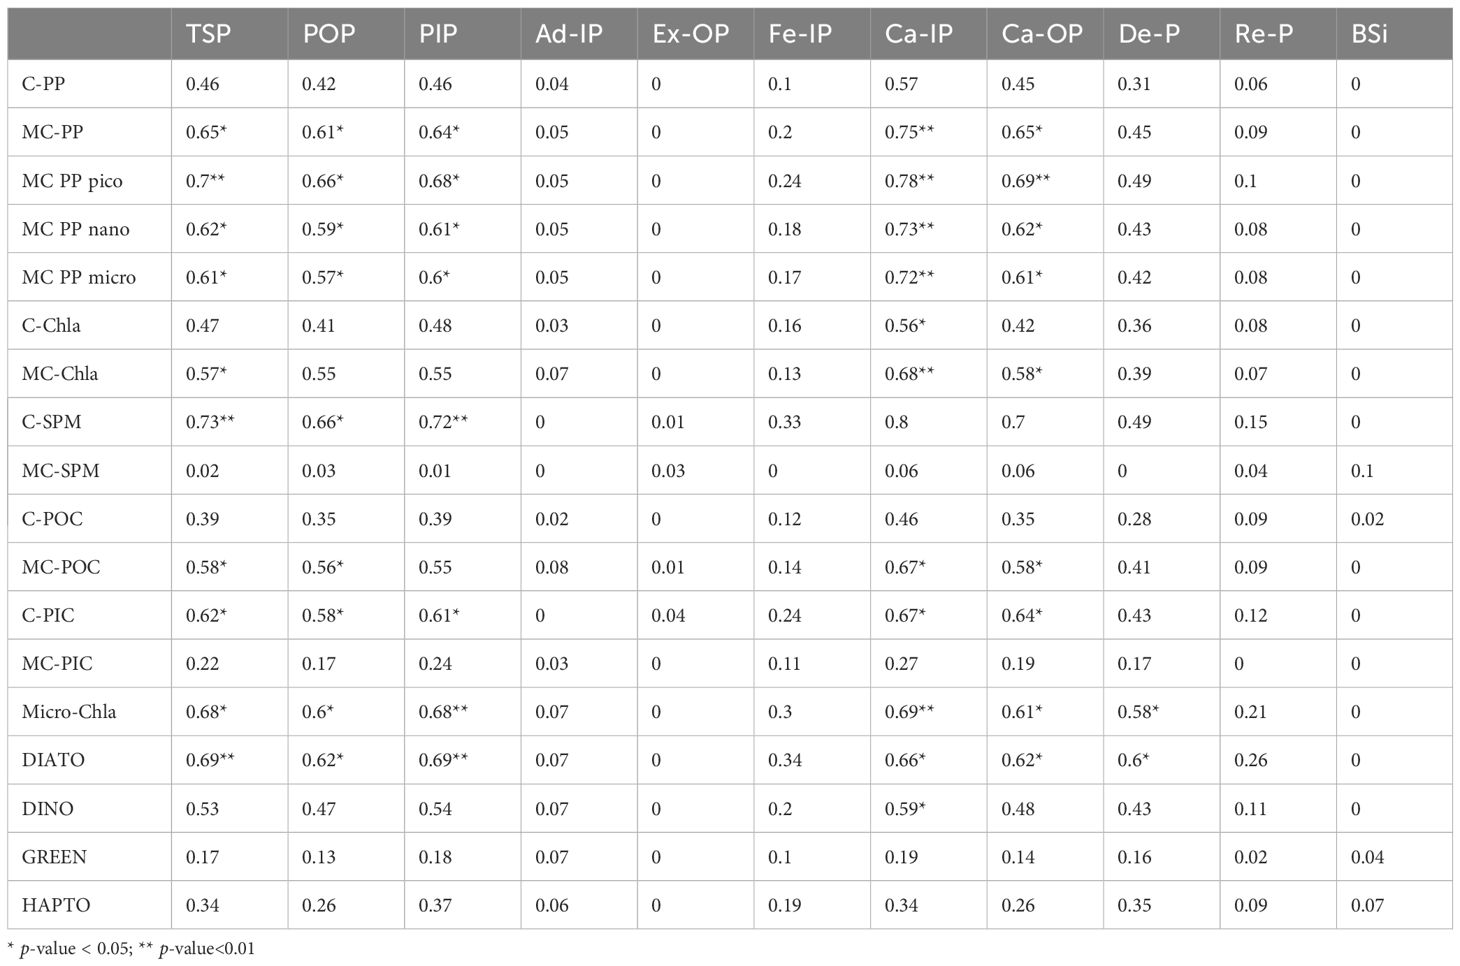
Table 1 R2 values of linear regression between satellite products and sedimentary P speciation and BSi.
For the seven types of sedimentary P speciation, the most promising for satellite retrieval were Ca-IP, Detr-P and Ca-OP, followed by Fe-IP, while Ads-IP, Exch-OP, and Ref-P showed no significant correlations with any satellite product. The top three satellite products correlating with Ca-IP were climatological SPM (0.8), monthly climatological pico PP (0.78) and monthly climatological PP (0.75). The top three satellite products correlating with Ca-OP were climatological SPM (0.70), monthly climatological pico PP (0.69) and monthly climatological PP (0.65). The top three satellite products correlated with Detr-P were diatoms (0.60), micro Chla (0.58) and monthly climatological PP (0.49). The satellite products most correlated with Fe-IP, Ads-IP, Exch-OP and Ref-P were monthly climatological diatoms (0.34), monthly climatological POC (0.08), climatological PIC (0.04) and climatological SPM (0.15). Furthermore, R2 values between satellite products and BSi were extremely low, with only green algae and haptophytes showing weak correlations with BSi, with R2 values of 0.04 and 0.07 respectively.
Certain satellite products showed a high sensitivity to sediments, such as climatological SPM and monthly climatological pico PP. Other products such as Chla, nano-PP and micro-PP also showed significant relationships with sediments, although with lower R2 values. It was found that climatological SPM performed better than monthly climatological PP, PP performed better than Chla, and size-fractionated PP and Chla were more effective than total PP and Chla, suggesting a relationship between sediments and phytoplankton size.
4 Discussion
4.1 Physical background
The water column was well mixed in the upper 20 m, consistent with previous researches showing that the mixed layer depth in this area is about 25 m, mainly due to tidal mixing processes near the coastal area of Sarawak (Daryabor et al., 2016). Strong stratification was observed in the 20-40 m layer and in the 90-180 m layer (Figure 2), consistent with previous observations of a double thermocline structure in the SCS during spring (Liu et al., 2001a). The lower thermocline was an old one formed in winter and maintained by an anticyclonic eddy corresponding to negative geostrophic vorticity, as indicated by the currents around 110 m (see Figure 7C). The profiles of temperature, salinity and DO shown in Figure 2 were in agreement with Lu et al. (2021) and Ning et al. (2004). We attempted to examine the correlation between these physical parameters (temperature and salinity) and sedimentary P speciation or BSi, but unfortunately the correlations between them were not significant (p > 0.05). This may be due to the fact that sedimentation is a long-term process while the CTD (Conductivity, Temperature, Depth) measurements were instantaneous and cannot match the changes in the sediments (Yang et al., 2016). To examine this hypothesis, we compared the 30-year mean SST with sedimentary P and BSi and found that the R2 values were significantly higher than those obtained from CTD-measured SST (Supplementary Figure 1A). Another reason may be that the limited number of sampling locations (with only 7 data matches) limits the ability to robustly conclude from these observations.
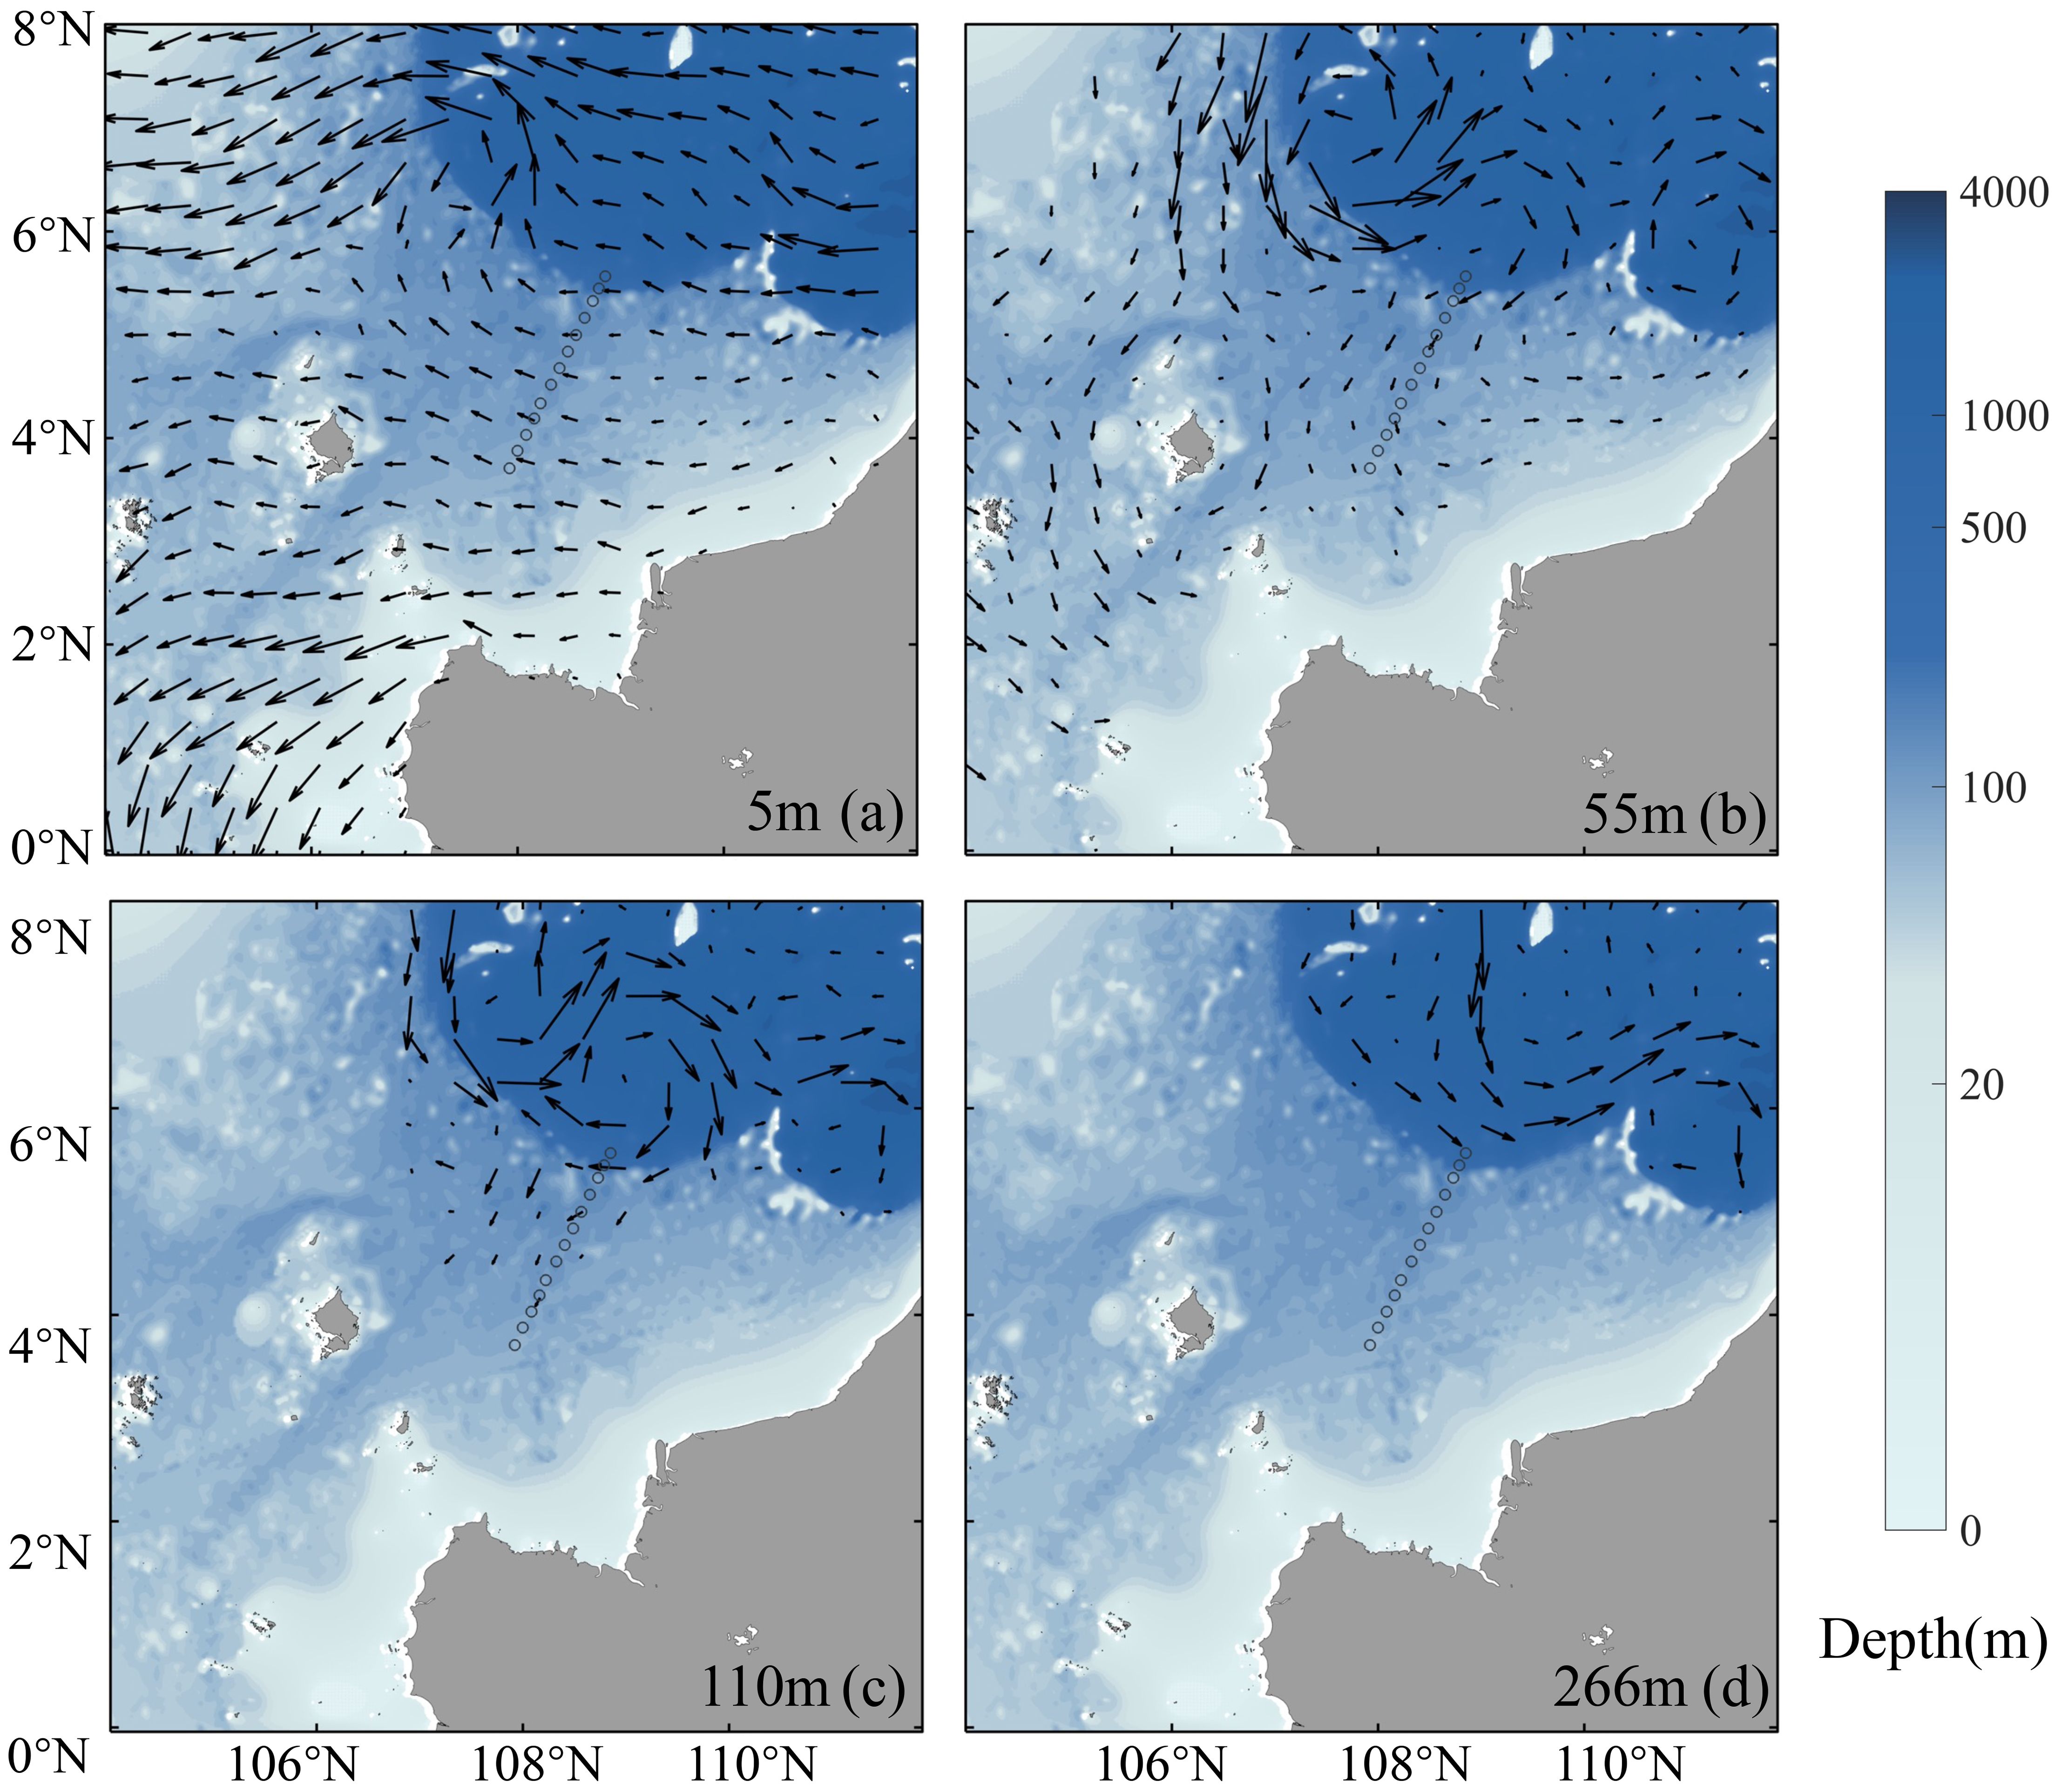
Figure 7 The simulated circulations from Copernicus Marine global reanalysis product at (A) 5 m; (B) 55 m; (C) 110 and (D) 266 m.
Driven by currents and bioturbation, the deposition, resuspension and redistribution of sediments are crucial to the distributions of sedimentary P speciation and BSi [J. Hu et al., 2006). The SCS is dominated by the East Asian Monsoon, which is southwesterly winds in summer, and then transit to northeasterly winds in winter (Shaw and Chao, 1994). Correspondingly, the upper level circulation of the SCS was cyclonic in winter and anticyclonic in summer (Qu, 2000). Our sampling measurements were carried out in March with southwestward currents near the coast, which is confirmed by the 5 m velocity shown in Figure 7A. A cyclonic circulation existed in the northwest of the observed section, which may be related to the cyclonic circulation along the Borneo slope in the southern region of the South China Sea (Xue et al., 2004). The velocity at 55 m showed that the northern stations (E12-E14) of the section were influenced by an anticyclonic eddy and had southwestward currents. For the southernmost station C10, 55 m is close to the bottom and was controlled by southeastward currents (Figure 7B). In deeper waters, at 110 m, which corresponds approximately to the bottom of the mid-section stations (C01-C07), there were very weak southwestward currents, while the northern stations (E12-E14) were under the influence of an anticyclonic eddy, which was stronger than that at 55 m. At a depth of 266 m, only the northernmost station (E12) was affected, which was dominated by southeastward currents. The complex circulations of the deeper waters may be related to the cyclonic and anticyclonic eddies intersecting in the upper 300 m (Yang et al., 2002).
Anticyclonic eddies promote the convergence and downward movement of near-surface seawater, facilitating the delivery of particulate matter to the seafloor (Zhang et al., 2014). This may be the reason why some parameters (TSP, Fe-IP, Ref-P, and Detr-P) showed higher values at the northernmost stations (E12), although the concentration of these parameters had already decreased significantly in the middle of the section (Figure 4). The southeastern part of our section was close to the northwestern estuary of Borneo, fed by the Lupar and Saribas rivers, which discharge up to 5 g L-1 of SPM into the ocean, with POC values ranging from 51 to 4114 μmol L-1 (Müller et al., 2016). The substantial load of organic and inorganic particulate matter from the rivers was then transported into the ocean by westward currents (Figure 7A), resulting in high concentrations of SPM, POC and Chla in the adjacent waters of the estuary (Figure 5). Over time, the deposition resulted in higher values of sediments at the southern stations of the section (Figure 4).
4.2 Phosphorus species and biological silica in surface sediments
The distribution and speciation of sedimentary P can vary significantly between different marine environments, reflecting the complex interplay of biological, chemical, and physical processes. A detailed analysis of the patterns of sedimentary P speciation and BSi that we measured in the SSCS was attempted.
Depending on sedimentation conditions and PP in specific regions, average TSP concentrations in sediments from different oceanic environments generally varied between 200 and 1300 μg/g (Fang et al., 2007b; Ni et al., 2015; Ruttenberg and Goñi, 1997; Zhang et al., 2004; Zhang et al., 2010). The TSP contents observed in this study of SSCS, ranging between 283.94 and 579.94 (average of 427.76) μg/g dry sediment, appeared to be within the ranges reported in some previous studies (Figure 3). Based on our observations, the proportion of PIP ranged from 57.33% to 66.05%, consistently exceeding the proportion of POP, indicating a generally higher proportion of inorganic matter in this area (Table 2), following observations in the Chukchi Sea and central Pacific Ocean, where inorganic phosphorus dominates all phosphorus pools with an average of 87% and 90% of total phosphorus in sediments, respectively (Ni et al., 2015; Zhang et al., 2010). TSP, POP and PIP showed patterns of higher concentrations near the coast and decreasing concentrations offshore, with an increasing concentration of P at the northernmost station (Figure 4), which is consistent with results from studies in the Yellow Sea and East China Sea, highlighting the influence of both terrestrials and marine contributions on these distributions (Meng et al., 2014; Song and Liu, 2015). This high TSP condition near the coastal area also corresponds to the case at the mouth of the Mississippi River, which showed a decrease in TSP from the estuary to the open sea (Kang et al., 2017). In our case, the ratio of PIP was consistently elevated at coastal stations compared to offshore stations, indicating a predominant influence of terrestrial inorganic matter originating from the Lupar and Saribas Rivers. Conversely, the sedimentation of biomass from the SCS basin at offshore stations could lead to a higher proportion of POPs in the sediments.
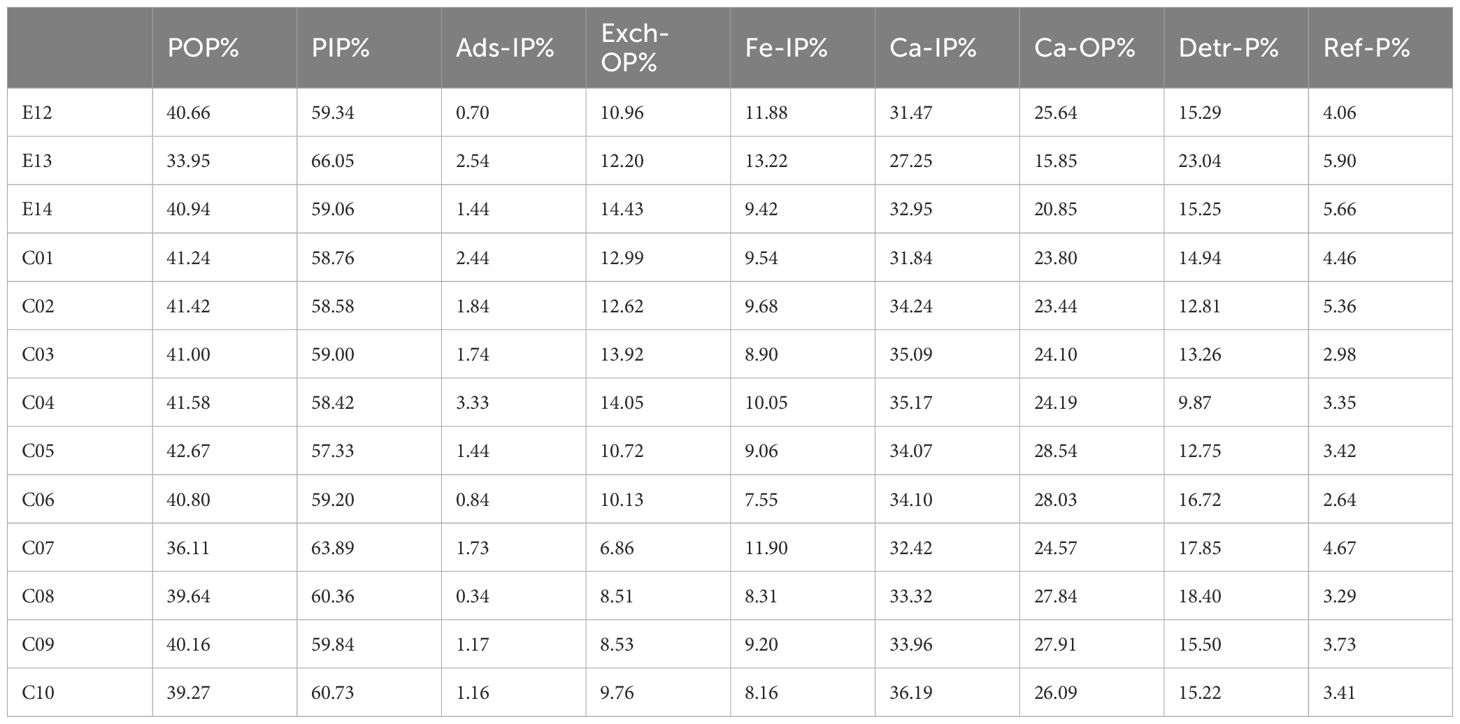
Table 2 Percentages of the various forms of P in the surface sediment at each station.
In general, in the SSCS, we observed the following relative proportions of different P forms Ca-IP > Ca-OP > Detr-P > Exch-OP > Fe-IP > Ref-P > Ads-IP (Table 2). Our investigations showed that Ca-IP and Ca-OP are the most important types of sedimentary P in the study area, together accounting for about 58% of the total P in the sediments (Figure 3). These results are consistent with observations in the equatorial Pacific, where organic matter degradation and Fe reduction rates were relatively high and occurred deep within the sediment, creating the conditions necessary for the accumulation of P concentrations and the formation of authigenic P (authigenic carbonate fluorapatite and biogenic apatite, also known as CaCO3-associated P), which accounts for 61% to over 86% of total phosphorus (Filippelli and Delaney, 1996). However, our observations are quite different from those in the more northerly coastal areas, which showed a much lower proportion of Ca-P, such as the mouth of the Yangtze river (5.5%) (Meng et al., 2014), the delta-front estuaries of the Yangtze River (6.3%) (Hou et al., 2009), and the middle shelf of the East China Sea (Fang et al., 2007a). A possible explanation for this discrepancy is that the biomass of siliceous organisms exceeds that of calcareous organisms in the East China Sea, resulting in a lack of calcium carbonate sediments (Meng et al., 2014).
The Detr-P pool is the second largest fraction, accounting for approximately 15% of TSP. This proportion is lower than observations in the eastern coastal region of Hainan Island in the SCS, where Detr-P was identified as the primary fraction of sedimentary P, accounting for over 30% and mainly derived from terrigenous inputs. It is also significantly lower than that observed in the Mackenzie River Delta, the Chukchi Sea and the Bering Sea (Zhang et al., 2010), where the fraction is 43%, and even lower compared to 55% in the East China Sea (Song and Liu, 2015). Detr-P originates primarily from magmatic, igneous or metamorphic rocks, combined with marine sediments influenced by significant riverine deposition of land-derived material (Berner and Rao, 1994). The low proportion of Detr-P may be due to its lower content in the river near our study area compared to other types of phosphorus in river/estuarine sediments, including the Yangtze, Yellow, Yalujiang, Luanhe and Liaohe rivers (Müller et al., 2016). The proportions of Exch-OP and Fe-IP are comparable at 11% and 10%, respectively. The exchangeable fraction of TSP is generally considered to be bioavailable, mainly through the desorption process. Consequently, phytoplankton PP plays an important role in the accumulation of exchangeable organic phosphorus in surface sediments (Zhang et al., 2010). However, our observations indicate that the proportion of Exch-OP is higher at offshore stations than at coastal stations (Table 2), but PP is higher at coastal stations than at offshore stations. This is mainly because Exch-OP reflects the water column integrated PP, and the offshore region has a deeper euphotic zone depth compared to coastal stations, which provides more area available for phytoplankton to perform photosynthesis (Figure 8A), resulting in a higher accumulation of PP in offshore stations than in coastal stations. The proportion of Fe-IP is higher at offshore stations, probably due to hydrothermal activity enriching iron in the pelagic region (Linsy et al., 2018). In our observations, the fraction of Ref-P and Ads-IP is rather low, not exceeding 6% of the total, similar to the situation observed in the central Pacific (Ni et al., 2015).
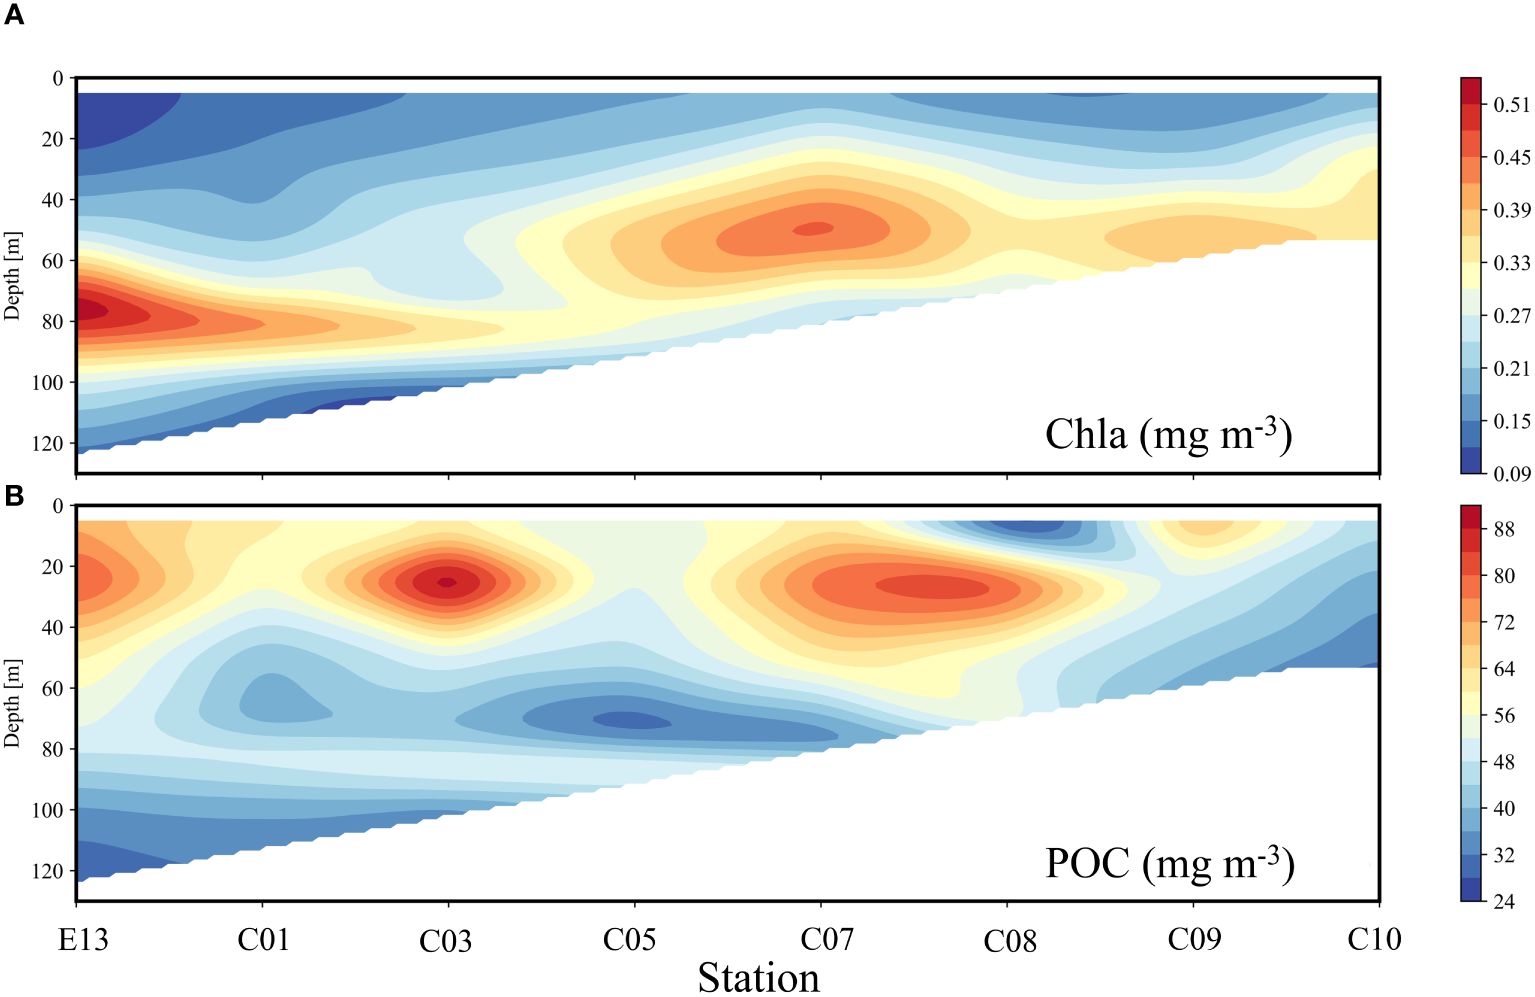
Figure 8 Vertical profile of (A) Chla and (B) POC along with the transect.
The distribution of the fraction of BSi in the total sediments showed the highest fraction at the most offshore stations, with a decreasing trend towards the coastal region, with ranges between 4% and 7%. This is similar to the case in the subtropical western Pacific, where the content of biological silica is less than 5% (Shibamoto and Harada, 2010). Existing studies have shown that phytoplankton PP was the main source of biogenic particles in sediments and is associated with the magnitude of particulate fluxes in the water (Zabel et al., 1998). However, our study was not consistent with sediment trap experiments, but in situ POC measurements indirectly indicated a higher surface POC content at offshore stations compared to coastal stations (Figure 8B), which may contribute to the higher proportion of BSi at offshore stations. This is consistent with observations from the Southern Ocean indicating a covariant relationship between POC and BSi flux (Buesseler et al., 2001).
4.3 The possibility of satellite-based retrieval of sediments P and BSi
The P species and BSi in sediments in the Sunda shelf were significantly correlated with satellite-based SPM, PP, POC and Chla as shown in Table 1 and Figure 6. The in-situ measurements and the monthly climatological satellite products of Chla and POC were compared and did not show good correlations, with R2 values of 0.16 and 0.17 and MAPE values of 39.16% and 70.34%, respectively. Obviously, the satellite retrievals overestimated the in-situ measurements of Chla and POC, with regression line slopes higher than 1 and MBD values of 25.62% and 46.38%, respectively (Figure 9). Although the correlation between the satellite products and the in-situ measurements was poor (not significant, p>0.05), this was to be expected as the satellite products are monthly climatological means while the in-situ measurements are instantaneous and their time scales are not strictly matched. In addition, the surface sediments are in principle a manifestation of long-term deposition of suspended particles in water, but some monthly climatological products, such as PP and SPM, correlate better with sediments than their climatological means (Table 1). In addition, it is important to choose the appropriate resolution for the retrieval of surface sediments from satellite data, as we have found that the use of different resolutions (4 km and 12 km for Chla and SPM) in the same analysis does indeed lead to variations in the results (Supplementary Table 1A).
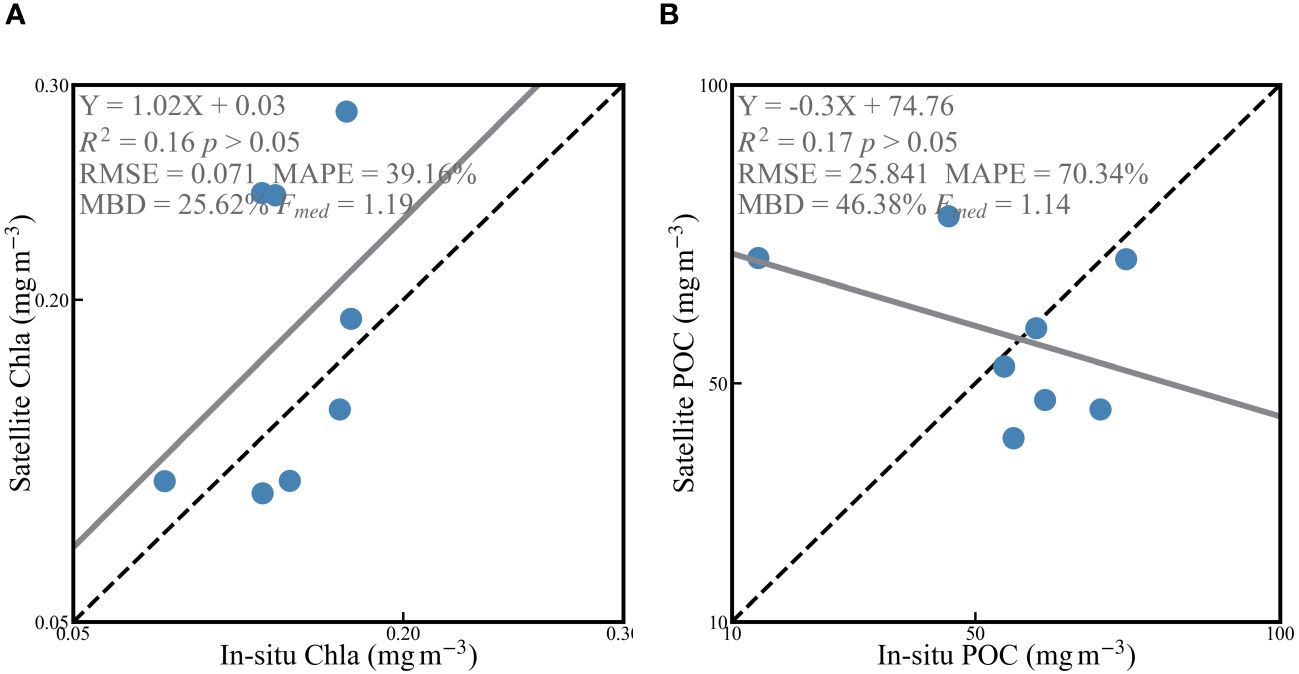
Figure 9 Comparison between in situ measured and satellite estimated monthly climatological (A) Chla and (B) POC.
Furthermore, satellites can only provide surface data such as Chla, POC and SPM used in this study. However, a depth-resolved PP algorithm was used to obtain PP and size-fractionated PP from satellites, so that PP in this study was integrated over 1.5 times the depth of the euphotic zone. However, the real ocean is a three-dimensional space, as demonstrated by our in-situ measurements of Chla, which show the presence of a deep chlorophyll maximum (DCM) layer (Figure 10A) and POC varying in-depth (Figure 10B). We further compared the profile-integrated in-situ Chla and POC with sediments (Table 3) and found that the depth-integrated in-situ measurements showed better correlation with sediments than the monthly climatological products, e.g. the Ex-OP showed no correlation with the monthly climatological satellite Chla and POC, but had an R2 of 0.37 with the euphotic zone integrated Chla. In addition, BSi showed no correlation with any satellite product, but had an R2 of 0.27 with euphotic zone integrated Chla. With the launch of the next generation of hyperspectral (NASA’s Plankton, Aerosol, Cloud, Ocean Ecosystem Mission, PACE) and geostationary satellites (Geostationary Ocean Color Imager, GOCI), more accurate algorithms and higher temporal resolution of remotely sensed data may increase the potential utility of satellite products in sediment research.
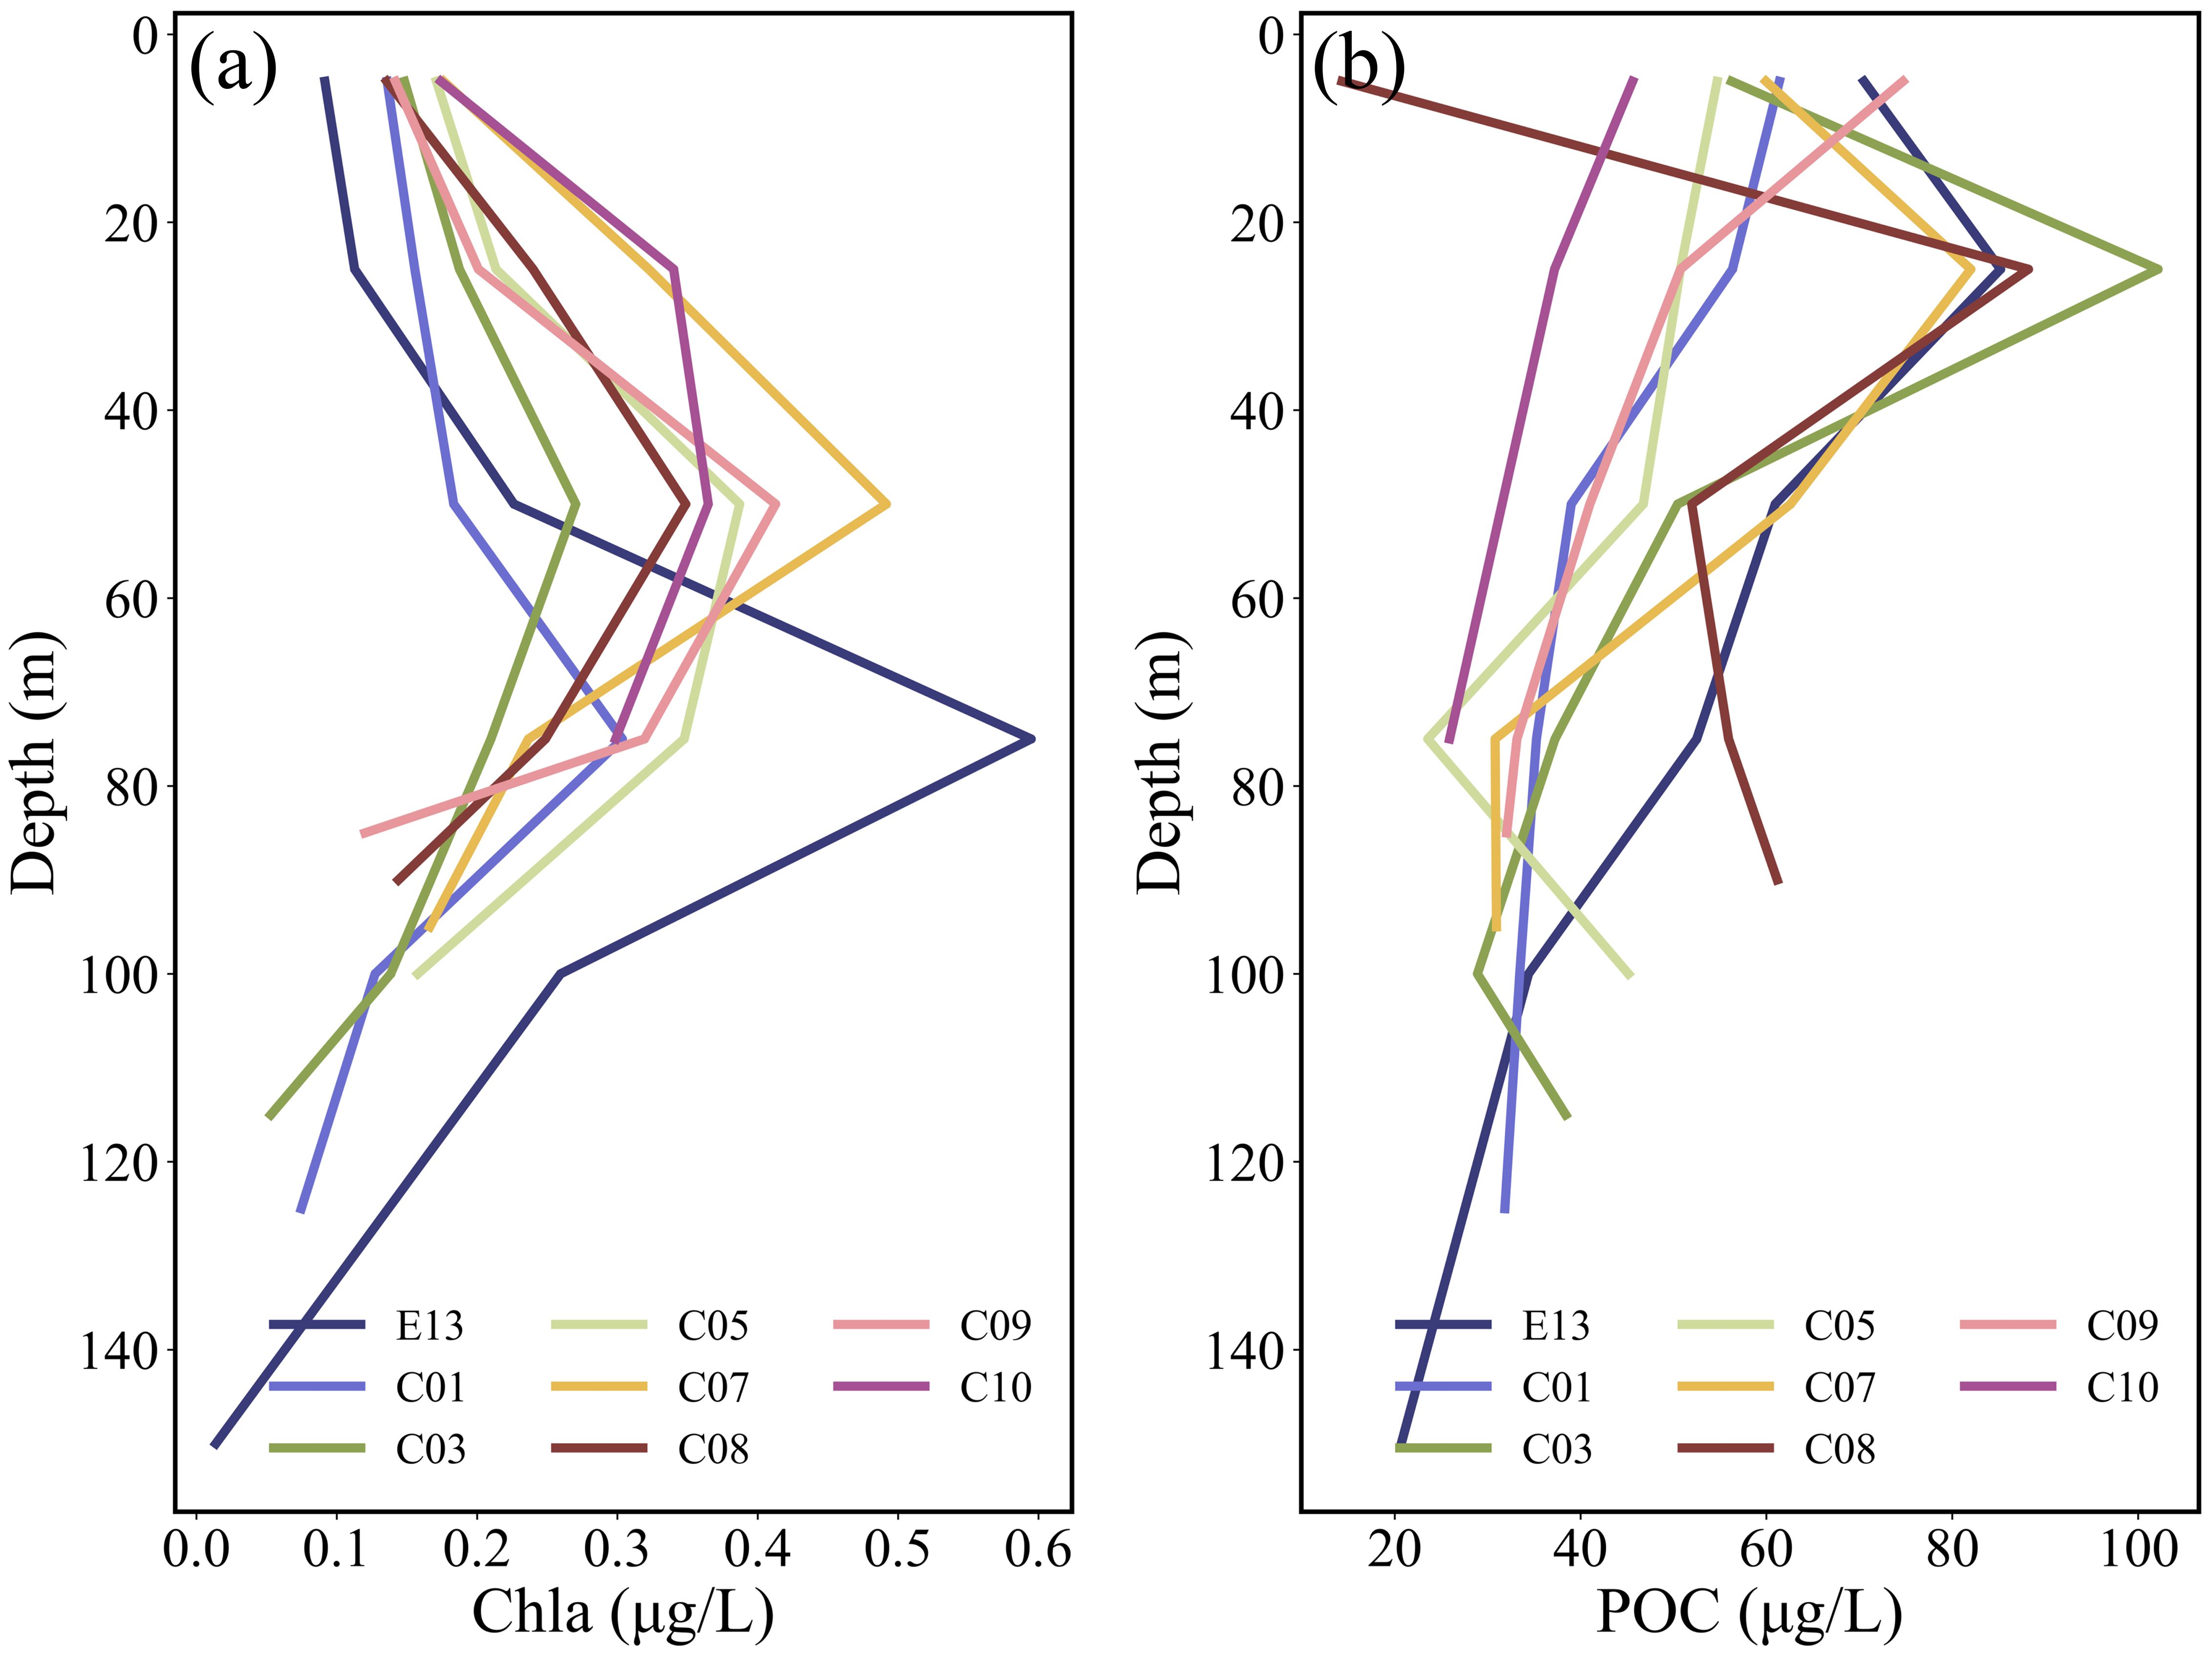
Figure 10 Vertical distribution of in-situ (A) Chla and (B) POC.
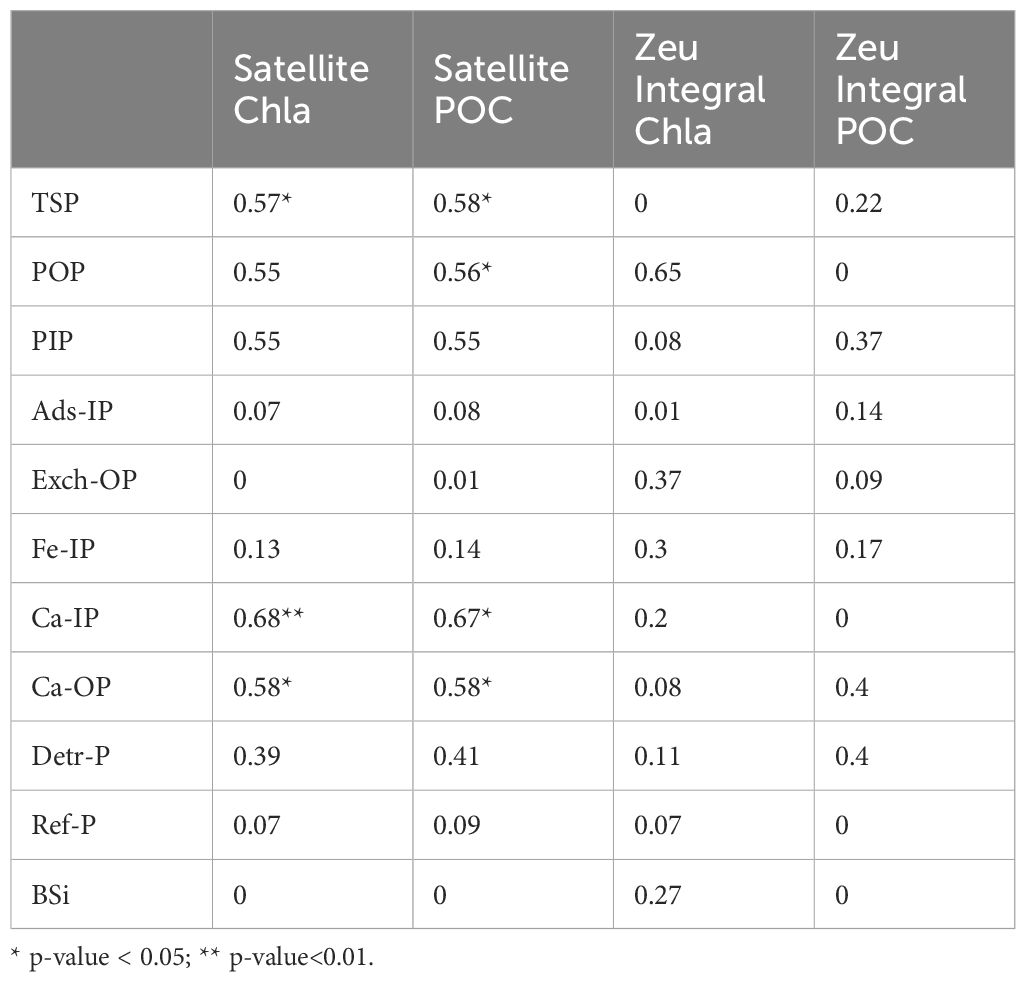
Table 3 R2 values of linear regression between in-situ Chla and POC and sedimentary P speciation and BSi.
Previous studies of BSi in Southern Ocean sediments have shown that BSi flux peaks are closely associated with diatom blooms (Buesseler et al., 2001). The BSi content of surface sediments in the SSCS includes sponge spicules, radiolarians, and diatoms (Chou et al., 2012). Therefore, phytoplankton types could play an important role in the distribution of sediment P species and BSi. Our correlation analysis supports this perspective, showing that diatoms had a significant correlation with P species (Table 1). Unfortunately, there was no evidence of a significant correlation with BSi. Considerable efforts have been made to obtain phytoplankton functional types from space (Alvain et al., 2005, Alvain et al., 2008; Pan et al., 2013; Shang et al., 2014). However, as shown by the proportions of relative contributions for phytoplankton functional groups along the transect in Figure 11, it’s clear that the variability in algal composition is less pronounced than that of sediment components. The next-generation PACE and GOCI satellites, which will provide high spectral and temporal resolution data, will significantly improve the ability of remote sensing algorithms to capture the spectral variations caused by changes in phytoplankton composition, as well as the temporal dynamics of phytoplankton.
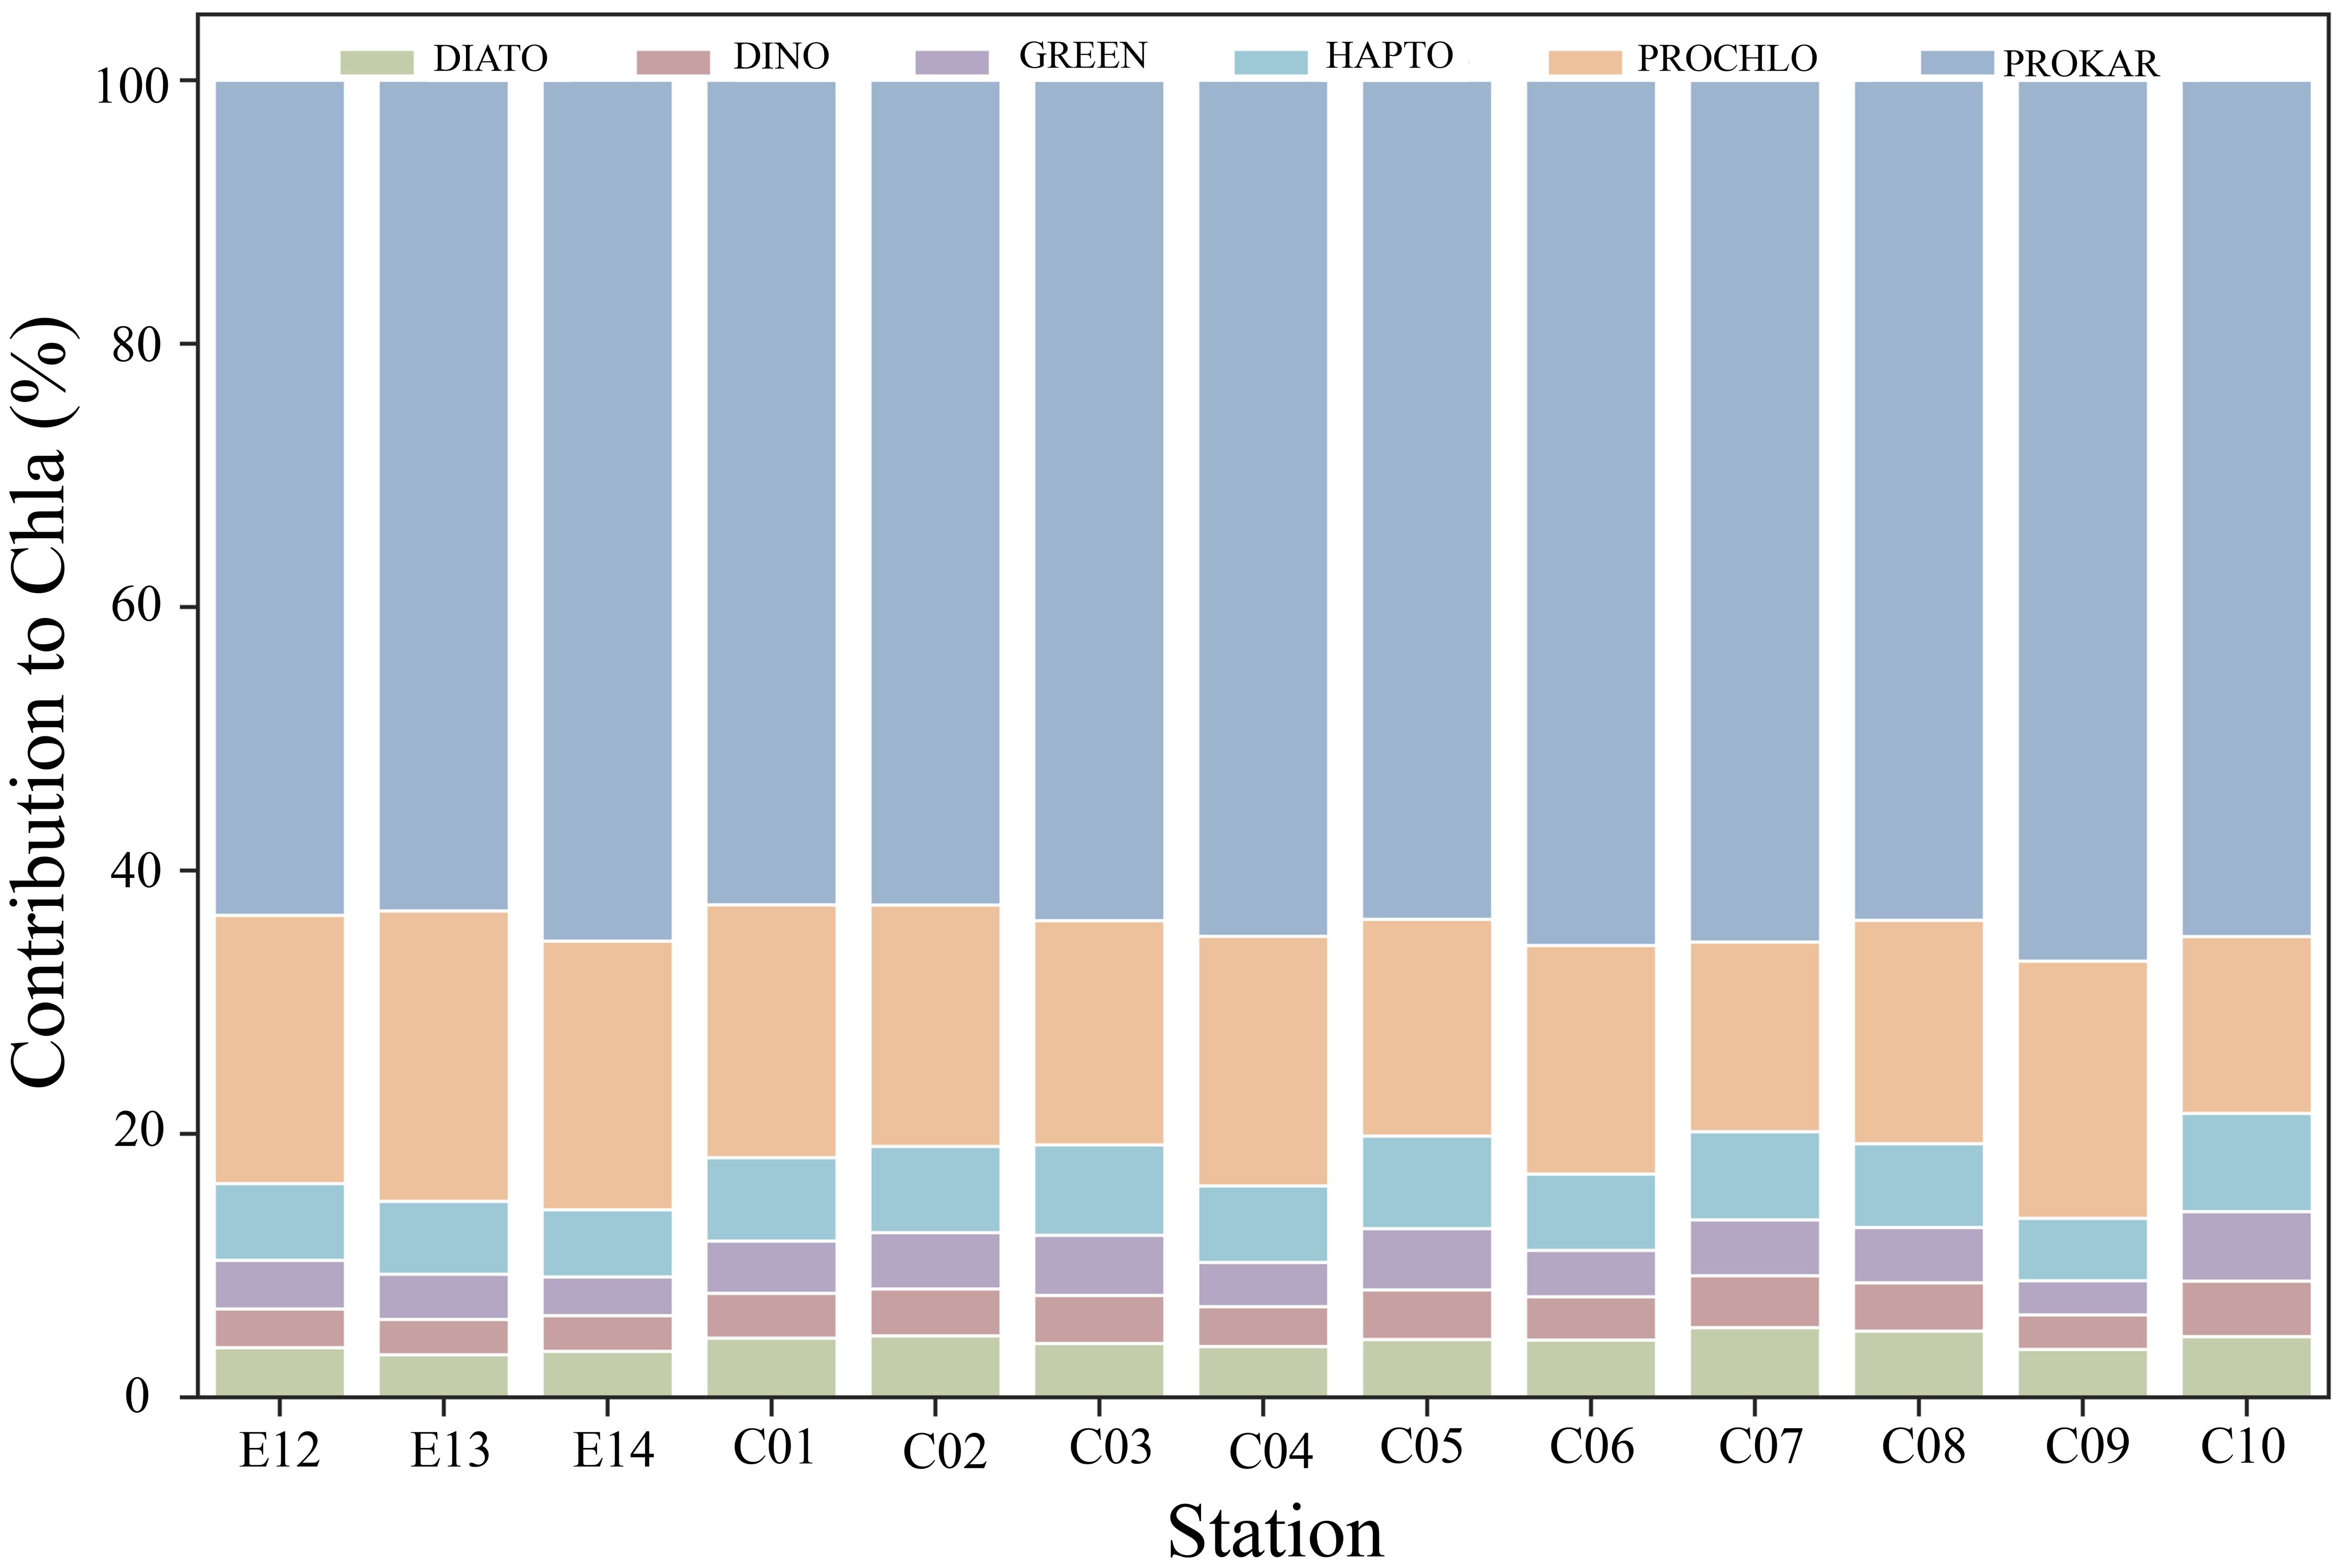
Figure 11 Relative contributions to phytoplankton function groups along the transect.
5 Conclusions
Concentrations and spatial distributions of P fractions in surface sediments of the southern region of the SCS reflected differences in sources and preservation status of different forms of P. Ca-P (Ca-IP and Ca-OP, 58%) was the major P form forms in surface sediments, followed by Detr-P (15%) and Exch-OP (11%) and Fe-IP (10%), and these four P forms accounted for 94% of the TSP. TSP ranged from 283.94 to 579.94 (mean 427.76) μg/g dry sediment and PIP is the major component of TSP ranging from 57.33% to 66.05%. TSP, POP and PIP showed a trend of higher concentrations near the coast and decreasing concentrations offshore. Most forms of P follow this trend, except Exch-OP and Ref-P which showed no significant change along the transect. However, BSi showed an opposite trend, being highest at the offshore station. For the seven types of sedimentary P speciation, the sediments most correlated with the satellite product were Ca-IP, Detr-P and Ca-OP, followed by Fe-IP, while Ads-IP, Exch-OP and Ref-P, and also BSi showed no significant correlations with any satellite product. The top three satellite products correlated with sediments were climatological SPM, diatom and monthly climatological pico PP. In the future, improving the modelling of vertical information from space and the accuracy of the algorithms, as well as using hyperspectral and geostationary satellites, would provide a potential solution for sediment retrieval from space.
Data availability statement
The data analyzed in this study is subject to the following licenses/restrictions: Data underlying the results presented in this paper are not publicly available at this time but may be obtained from the authors upon reasonable request. Requests to access these datasets should be directed to Qian P. Li, cWlhbmxpQHNjc2lvLmFjLmNu.
Author contributions
YZ: Conceptualization, Methodology, Writing – original draft. LD: Funding acquisition, Supervision, Writing – review & editing. ZG: Data curation, Writing – review & editing. LG: Supervision, Writing – review & editing. QL: Data curation, Funding acquisition, Supervision, Writing – review & editing.
Funding
The author(s) declare financial support was received for the research, authorship, and/or publication of this article. This research was supported in part by the National Natural Science Foundation of China (NSFC) under Grant 42276162; the GuangDong Basic and Applied Basic Research Foundation under Grant 2023A1515110837.
Acknowledgments
Sincere thanks to Shaojie Sun and Wen Zhou for their help. We would also like to acknowledge reviewers for their helpful comments on the manuscript.
Conflict of interest
The authors declare that the research was conducted in the absence of any commercial or financial relationships that could be construed as a potential conflict of interest.
Publisher’s note
All claims expressed in this article are solely those of the authors and do not necessarily represent those of their affiliated organizations, or those of the publisher, the editors and the reviewers. Any product that may be evaluated in this article, or claim that may be made by its manufacturer, is not guaranteed or endorsed by the publisher.
Supplementary material
The Supplementary Material for this article can be found online at: https://www.frontiersin.org/articles/10.3389/fmars.2024.1414546/full#supplementary-material
References
Alvain S., Moulin C., Dandonneau Y., Bréon F. M. (2005). Remote sensing of phytoplankton groups in case 1 waters from global SeaWiFS imagery. Deep Sea Res. Part I: Oceanographic Res. Papers 52, 1989–2004. doi: 10.1016/j.dsr.2005.06.015
Alvain S., Moulin C., Dandonneau Y., Loisel H. (2008). Seasonal distribution and succession of dominant phytoplankton groups in the global ocean: A satellite view. Global Biogeochemical Cycles 22, GB3001. doi: 10.1029/2007GB003154
Andrieux F., Aminot A. (1997). A two-year survey of phosphorus speciation in the sediments of the Bay of Seine (France). Continental Shelf Res. 17, 1229–1245. doi: 10.1016/S0278-4343(97)00008-3
Ann Brewster N. (1980). Cenozoic biogenic silica sedimentation in the Antarctic Ocean. Geological Soc. America Bull. 91, 337–347. doi: 10.1130/0016-7606(1980)91<337:CBSSIT>2.0.CO;2
Balch W. M., Gordon H. R., Bowler B. C., Drapeau D. T., Booth E. S. (2005). Calcium carbonate measurements in the surface global ocean based on Moderate-Resolution Imaging Spectroradiometer data. J. Geophysical Research: Oceans 110, C07001. doi: 10.1029/2004JC002560
Baturin G. N. (2003). Phosphorus cycle in the ocean. Lithology Mineral Resour. 38, 101–119. doi: 10.1023/A:1023499908601
Behrenfeld M. J., Falkowsk P. (1997). Photosynthetic rates derived from satellite-based chlorophyll concentration. Limnology Oceanography 42, 1–20. doi: 10.4319/lo.1997.42.1.0001
Berner R. A., Rao J.-L. (1994). Phosphorus in sediments of the Amazon River and estuary: Implications for the global flux of phosphorus to the sea. Geochimica Cosmochimica Acta 58, 2333–2339. doi: 10.1016/0016-7037(94)90014-0
Brewin R. J. W., Tilstone G. H., Jackson T., Cain T., Miller P. I., Lange P. K., et al. (2017). Modelling size-fractionated primary production in the Atlantic Ocean from remote sensing. Prog. Oceanography 158, 130–149. doi: 10.1016/j.pocean.2017.02.002
Buesseler K. O., Ball L., Andrews J., Cochran J. K., Hirschberg D. J., Bacon M. P., et al. (2001). Upper ocean export of particulate organic carbon and biogenic silica in the Southern Ocean along 170°W. Deep Sea Res. Part II: Topical Stud. Oceanography 48, 4275–4297. doi: 10.1016/S0967-0645(01)00089-3
Chou Y., Lou J. Y., Chen C.-T. A., Liu L.-L. (2012). Spatial distribution of sponge spicules in sediments around Taiwan and the Sunda Shelf. J. Oceanography 68, 905–912. doi: 10.1007/s10872-012-0143-7
Conley D. J. (1997). Riverine contribution of biogenic silica to the oceanic silica budget. Limnology Oceanography 42, 774–777. doi: 10.4319/lo.1997.42.4.0774
Dan S. F., Lan W., Yang B., Han L., Xu C., Lu D., et al. (2020). Bulk sedimentary phosphorus in relation to organic carbon, sediment textural properties and hydrodynamics in the northern Beibu Gulf, South China Sea. Mar. pollut. Bull. 155, 111176. doi: 10.1016/j.marpolbul.2020.111176
Daryabor F., Ooi S. H., Abu Samah A., Akbari A. (2016). Tides and their dynamics over the sunda shelf of the southern south China sea. PloS One 11, e0162170. doi: 10.1371/journal.pone.0162170
Deng L., Zhao J., Sun S., Ai B., Zhou W., Cao W. (2024). Two-decade satellite observations reveal variability in size-fractionated phytoplankton primary production in the South China Sea. Deep Sea Res. Part I: Oceanographic Res. Papers 206, doi:10.1016/j.dsr.2024.104258. doi: 10.1016/j.dsr.2024.104258
Deng L., Zhao J., Zeng X., Cao W. (2023). Evaluation of satellite-derived size-fractionated phytoplankton primary production in the south China sea. IEEE Trans. Geosci. Remote Sens. 61, 1–17. doi: 10.1109/tgrs.2023.3281589
Dong Y., Li Q. P., Wu Z., Zhang J.-Z. (2016). Variability in sinking fluxes and composition of particle-bound phosphorus in the Xisha area of the northern South China Sea. Deep Sea Res. Part I: Oceanographic Res. Papers 118, 1–9. doi: 10.1016/j.dsr.2016.10.007
Fang T.-H., Chen J.-L., Huh C.-A. (2007a). Sedimentary phosphorus species and sedimentation flux in the East China Sea. Continental Shelf Res. 27, 1465–1476. doi: 10.1016/j.csr.2007.01.011
Fang T.-H., Chen J.-L., Huh C.-A. (2007b). Sedimentary phosphorus species and sedimentation flux in the East China Sea. Continental Shelf Res. 27, 1465–1476. doi: 10.1016/j.csr.2007.01.011
Filippelli G. M. (1997). Controls on phosphorus concentration and accumulation in oceanic sediments. Mar. Geology 139, 231–240. doi: 10.1016/S0025-3227(96)00113-2
Filippelli G. M., Delaney M. L. (1996). Phosphorus geochemistry of equatorial Pacific sediments. Geochimica Cosmochimica Acta 60, 1479–1495. doi: 10.1016/0016-7037(96)00042-7
Gan J., Li H., Curchitser E. N., Haidvogel D. B. (2006). Modeling South China Sea circulation: Response to seasonal forcing regimes. J. Geophysical Research: Oceans 111, C06034. doi: 10.1029/2005JC003298
Goldhammer T., Brüchert V., Ferdelman T. G., Zabel M. (2010). Microbial sequestration of phosphorus in anoxic upwelling sediments. Nat. Geosci. 3, 557–561. doi: 10.1038/ngeo913
Gordon H. R., Boynton G. C., Balch W. M., Groom S. B., Harbour D. S., Smyth T. J. (2001). Retrieval of coccolithophore calcite concentration from SeaWiFS Imagery. Geophysical Res. Lett. 28, 1587–1590. doi: 10.1029/2000GL012025
Hecky R., Kilham P. (1988). Nutrient limitation of phytoplankton in freshwater and marine environments: a review of recent evidence on the effects of enrichment 1. Limnology oceanography 33, 796–822. doi: 10.4319/lo.1988.33.4_part_2.0796
Hou L. J., Liu M., Yang Y., Ou D. N., Lin X., Chen H., et al. (2009). Phosphorus speciation and availability in intertidal sediments of the Yangtze Estuary, China. Appl. Geochemistry 24, 120–128. doi: 10.1016/j.apgeochem.2008.11.008
Hu C., Feng L., Lee Z., Franz B. A., Bailey S. W., Werdell P. J., et al. (2019). Improving satellite global chlorophyll a data products through algorithm refinement and data recovery. J. Geophysical Research: Oceans 124, 1524–1543. doi: 10.1029/2019JC014941
Hu C., Lee Z., Franz B. (2012). Chlorophyll a algorithms for oligotrophic oceans: A novel approach based on three-band reflectance difference. J. Geophysical Research: Oceans 117, C01011. doi: 10.1029/2011jc007395
Hu J., Peng P., Jia G., Mai B., Zhang G. (2006). Distribution and sources of organic carbon, nitrogen and their isotopes in sediments of the subtropical Pearl River estuary and adjacent shelf, Southern China. Mar. Chem. 98, 274–285. doi: 10.1016/j.marchem.2005.03.008
Hu J., Wang X. H. (2016). Progress on upwelling studies in the China seas. Rev. Geophysics 54, 653–673. doi: 10.1002/2015RG000505
Huang X.-L., Zhang J.-Z. (2009). Neutral persulfate digestion at sub-boiling temperature in an oven for total dissolved phosphorus determination in natural waters. Talanta 78, 1129–1135. doi: 10.1016/j.talanta.2009.01.029
IOCCG, Sathyendranath S. (2014). Phytoplankton Functional Types from Space. (ed. Sathyendranath S.). Dartmouth, NS, Canada, International Ocean-Colour Coordinating Group (IOCCG), 154pp. doi: doi: 10.25607/OBP-106.
Kang X., Song J., Yuan H., Shi X., Yang W., Li X., et al. (2017). Phosphorus speciation and its bioavailability in sediments of the Jiaozhou Bay. Estuarine Coast. Shelf Sci. 188, 127–136. doi: 10.1016/j.ecss.2017.02.029
Linsy P., Nagender Nath B., Mascarenhas-Pereira M. B. L., Teena C., Tyson S., Babu C. P., et al. (2018). Distribution and diagenesis of phosphorus in the deep-sea sediments of the central Indian basin. J. Geophysical Research: Oceans 123, 7963–7982. doi: 10.1029/2018JC014386
Liu K.-K., Tseng C.-M., Wu C.-R., Lin I.-I. (2010). “The south China sea,” in Carbon and nutrient fluxes in continental margins: A global synthesis. Eds. Liu K.-K., Atkinson L., Quiñones R., Talaue-McManus L. (Springer, Berlin), 464–482.
Liu Q. Y., Jia Y. L., Liu P. H., Wang Q., Chu P. C. (2001a). Seasonal and intraseasonal thermocline variability in the Central South China Sea. Geophysical Res. Lett. 28, 4467–4470. doi: 10.1029/2001gl013185
Liu Z., Yang H., Liu Q. (2001b). Regional dynamics of seasonal variability in the South China Sea. J. Phys. oceanography 31, 272–284. doi: 10.1175/1520-0485(2001)031<0272:RDOSVI>2.0.CO;2
Loucaides S., Van Cappellen P., Roubeix V., Moriceau B., Ragueneau O. (2012). Controls on the recycling and preservation of biogenic silica from biomineralization to burial. SILICON-NETH 4, 7–22. doi: 10.1007/s12633-011-9092-9
Lu Y.-Z., Cen X.-R., Guo S.-X., Qu L., Huang P.-Q., Shang X.-D., et al. (2021). Spatial variability of diapycnal mixing in the south China sea inferred from density overturn analysis. J. Phys. Oceanography 51, 3417–3434. doi: 10.1175/JPO-D-20-0241.1
Meng J., Yao P., Yu Z., Bianchi T. S., Zhao B., Pan H., et al. (2014). Speciation, bioavailability and preservation of phosphorus in surface sediments of the Changjiang Estuary and adjacent East China Sea inner shelf. Estuarine Coast. Shelf Sci. 144, 27–38. doi: 10.1016/j.ecss.2014.04.015
Mouw C. B., Ciochetto A. B., Yoder J. A. (2019). A satellite assessment of environmental controls of phytoplankton community size structure. Global Biogeochemical Cycles 33, 540–558. doi: 10.1029/2018gb006118
Müller D., Warneke T., Rixen T., Müller M., Mujahid A., Bange H. W., et al. (2016). Fate of terrestrial organic carbon and associated CO<sub<2</sub< and CO emissions from two Southeast Asian estuaries. Biogeosciences 13, 691–705. doi: 10.5194/bg-13-691-2016
Ni J., Lin P., Zhen Y., Yao X., Guo L. (2015). Distribution, source and chemical speciation of phosphorus in surface sediments of the central Pacific Ocean. Deep Sea Res. Part I: Oceanographic Res. Papers 105, 74–82. doi: 10.1016/j.dsr.2015.08.008
Ning X., Chai F., Xue H., Cai Y., Liu C., Shi J. (2004). Physical-biological oceanographic coupling influencing phytoplankton and primary production in the South China Sea. J. Geophysical Research: Oceans 109, C10005. doi: 10.1029/2004JC002365
O'Reilly J. E., Werdell P. J. (2019). Chlorophyll algorithms for ocean color sensors - OC4, OC5 & OC6. Remote Sens. Environ. 229, 32–47. doi: 10.1016/j.rse.2019.04.021
Pan X., Wong G. T. F., Ho T.-Y., Shiah F.-K., Liu H. (2013). Remote sensing of picophytoplankton distribution in the northern South China Sea. Remote Sens. Environ. 128, 162–175. doi: 10.1016/j.rse.2012.10.014
Paytan A., McLaughlin K. (2007). The oceanic phosphorus cycle. Chem. Rev. (Washington DC U. S.) 107, 563–576. doi: 10.1021/cr0503613
Qu T. (2000). Upper-layer circulation in the south China sea. J. Phys. Oceanography 30, 1450–1460. doi: 10.1175/1520-0485(2000)030<1450:ULCITS>2.0.CO;2
Rabouille C., Gaillard J.-F., Tréguer P., Vincendeau M.-A. (1997). Biogenic silica recycling in surficial sediments across the Polar Front of the Southern Ocean (Indian Sector). Deep Sea Res. Part II: Topical Stud. Oceanography 44, 1151–1176. doi: 10.1016/S0967-0645(96)00108-7
Ragueneau O., Conley D. J., Leynaert A., Longphuirt S. N., Slomp C. P. (2006). Role of diatoms in silicon cycling and coastal marine food webs. silicon cycle: Hum. perturbations impacts Aquat. Syst. 66, 163–195.
Ruttenberg K. C. (1992). Development of a sequential extraction method for different forms of phosphorus in marine sediments. Limnology Oceanography 37, 1460–1482. doi: 10.4319/lo.1992.37.7.1460
Ruttenberg K. C., Berner R. A. (1993). Authigenic apatite formation and burial in sediments from non-upwelling, continental margin environments. Geochimica cosmochimica Acta 57, 991–1007. doi: 10.1016/0016-7037(93)90035-U
Ruttenberg K. C., Goñi M. A. (1997). Phosphorus distribution, C:N:P ratios, and δ13Coc in arctic, temperate, and tropical coastal sediments: tools for characterizing bulk sedimentary organic matter. Mar. Geology 139, 123–145. doi: 10.1016/S0025-3227(96)00107-7
Shang S., Wu J., Huang B., Lin G., Lee Z., Liu J., et al. (2014). A new approach to discriminate dinoflagellate from diatom blooms from space in the East China Sea. J. Geophysical Research: Oceans 119, 4653–4668. doi: 10.1002/2014JC009876
Shaw P.-T., Chao S.-Y. (1994). Surface circulation in the south China sea. Deep Sea Res. Part I: Oceanographic Res. Papers 41, 1663–1683. doi: 10.1016/0967-0637(94)90067-1
Shibamoto Y., Harada K. (2010). Silicon flux and distribution of biogenic silica in deep-sea sediments in the western North Pacific Ocean. Deep Sea Res. Part I: Oceanographic Res. Papers 57, 163–174. doi: 10.1016/j.dsr.2009.10.009
Song G., Liu S. (2015). Phosphorus speciation and distribution in surface sediments of the Yellow Sea and East China Sea and potential impacts on ecosystem. Acta Oceanologica Sin. 34, 84–91. doi: 10.1007/s13131-015-0653-4
Stramski D., Reynolds R. A., Babin M., Kaczmarek S., Lewis M. R., Röttgers R., et al. (2008). Relationships between the surface concentration of particulate organic carbon and optical properties in the eastern South Pacific and eastern Atlantic Oceans. Biogeosciences. doi: 10.5194/bg-5-171-2008
Tréguer P. J., de la Rocha C. L. (2013). The world ocean silica cycle. Annu. Rev. Mar. Sci. 5, 477–501. doi: 10.1146/annurev-marine-121211-172346
Uitz J., Claustre H., Gentili B., Stramski D. (2010). Phytoplankton class-specific primary production in the world's oceans: Seasonal and interannual variability from satellite observations. Global Biogeochemical Cycles 24, GB3016. doi: 10.1029/2009gb003680
Uitz J., Claustre H., Morel A., Hooker S. B. (2006). Vertical distribution of phytoplankton communities in open ocean: An assessment based on surface chlorophyll. J. Geophys Res. 111, C08005. doi: 10.1029/2005jc003207
Wang J., Guo C., Liu B., Hou Z., Han G. (2016). Distribution of geoacoustic properties and related influencing factors of surface sediments in the southern South China Sea. Mar. Geophys. Res. 37, 337–348. doi: 10.1007/s11001-016-9294-z
Xi H., Losa S. N., Mangin A., Soppa M. A., Garnesson P., Demaria J., et al. (2020). Global retrieval of phytoplankton functional types based on empirical orthogonal functions using CMEMS GlobColour merged products and further extension to OLCI data. Remote Sens. Environ. 240, 111704. doi: 10.1016/j.rse.2020.111704
Xue H., Chai F., Pettigrew N., Xu D., Shi M., Xu J. (2004). ), Kuroshio intrusion and the circulation in the South China Sea. J. Geophysical Research: Oceans 109.
Yang H., Liu Q., Liu Z., Wang D., Liu X. (2002). ), A general circulation model study of the dynamics of the upper ocean circulation of the South China Sea. J. Geophysical Research: Oceans 107, 22–21-22-14. doi: 10.1029/2001JC001084
Yang B., Liu S.-M., Wu Y., Zhang J. (2016). Phosphorus speciation and availability in sediments off the eastern coast of Hainan Island, South China Sea. Continental Shelf Res. 118, 111–127. doi: 10.1016/j.csr.2016.03.003
Zabel M., Dahmke A., Schulz H. D. (1998). Regional distribution of diffusive phosphate and silicate fluxes through the sediment–water interface: the eastern South Atlantic. Deep Sea Res. Part I: Oceanographic Res. Papers 45, 277–300. doi: 10.1016/S0967-0637(97)00073-3
Zhang J.-Z., Fischer C. J., Ortner P. B. (2004). Potential availability of sedimentary phosphorus to sediment resuspension in Florida Bay. Global Biogeochemical Cycles 18, GB4008. doi: 10.1029/2004GB002255
Zhang J.-Z., Guo L., Fischer C. J. (2010). Abundance and chemical speciation of phosphorus in sediments of the mackenzie river delta, the chukchi sea and the bering sea: importance of detrital apatite. Aquat. Geochemistry 16, 353–371. doi: 10.1007/s10498-009-9081-4
Keywords: sediments, phosphorus, biogenic silica, South China Sea, ocean color
Citation: Zhang Y, Deng L, Ge Z, Guo L and Li QP (2024) Sedimentary biogeochemical gradients across the Sunda Shelf in the South China Sea and correlations with satellite observations. Front. Mar. Sci. 11:1414546. doi: 10.3389/fmars.2024.1414546
Received: 09 April 2024; Accepted: 02 July 2024;
Published: 18 July 2024.
Edited by:
David Alberto Salas Salas De León, National Autonomous University of Mexico, MexicoReviewed by:
Antonio Márquez, Autonomous Metropolitan University, MexicoTeng Li, Ministry of Natural Resources, China
Copyright © 2024 Zhang, Deng, Ge, Guo and Li. This is an open-access article distributed under the terms of the Creative Commons Attribution License (CC BY). The use, distribution or reproduction in other forums is permitted, provided the original author(s) and the copyright owner(s) are credited and that the original publication in this journal is cited, in accordance with accepted academic practice. No use, distribution or reproduction is permitted which does not comply with these terms.
*Correspondence: Lin Deng, ZGVuZ2xpbjIzQG1haWwuc3lzdS5lZHUuY24=; Qian P. Li, cWlhbmxpQHNjc2lvLmFjLmNu