
95% of researchers rate our articles as excellent or good
Learn more about the work of our research integrity team to safeguard the quality of each article we publish.
Find out more
ORIGINAL RESEARCH article
Front. Mar. Sci. , 25 June 2024
Sec. Marine Pollution
Volume 11 - 2024 | https://doi.org/10.3389/fmars.2024.1413847
 Mingzhu Li1,2†
 Zhixu Chen1,2†
 Ming Li3
 Jiugang Zhang4Bingqing Xu5,6Yanyan Yang5,6Xiangfei Li1,2Linlin Fan1,2Baojun Liu1,2Tao Zheng1,2
 Yan Fang1,2*
 Fan Li5,6*
The goal of this study was to evaluate the trace element pollution in a marine ranching area in China based on molecular responses (expression of metallothionein and antioxidant enzyme genes), and biochemical biomarkers (metallothionein content, antioxidant enzyme activities, and malonaldehyde level) in four indicator species. We collected samples of two fish (Lateolabrax maculatus and Sebastes schlegelii), one crustacean (Charybdis japonica), and one gastropod (Rapana venosa) from the western Furong Island marine ranching area and from an adjacent area in March 2022 and measured the trace element content in these indicator species as well as in the seawater and sediment. We found that the bioaccumulation characteristics of trace elements and the response patterns of biomarkers were species specific. Moreover, not every biomarker was significantly correlated with environmental trace element content. We then established two biomarker combinations indicative of trace element pollution in seawater and sediment, respectively, based on the correlation between biomarkers and trace element contents. The selected biomarkers were integrated using integrated biomarker response version 2 (IBRv2). IBRv2 values in the studied marine ranching area were lower than those in the adjacent area. Additionally, these values were consistent with the bioaccumulation of trace elements in the indicator species, the integrated trace element pollution index for seawater, and the potential risk index for sediment. These results show that this multi-biomarker and multi-species IBRv2 approach provided a comprehensive diagnosis of trace element pollution in the marine ranching area. Therefore, its application may be beneficial for marine environmental monitoring and management in view of the ecotoxicological impact of pollutants on organisms.
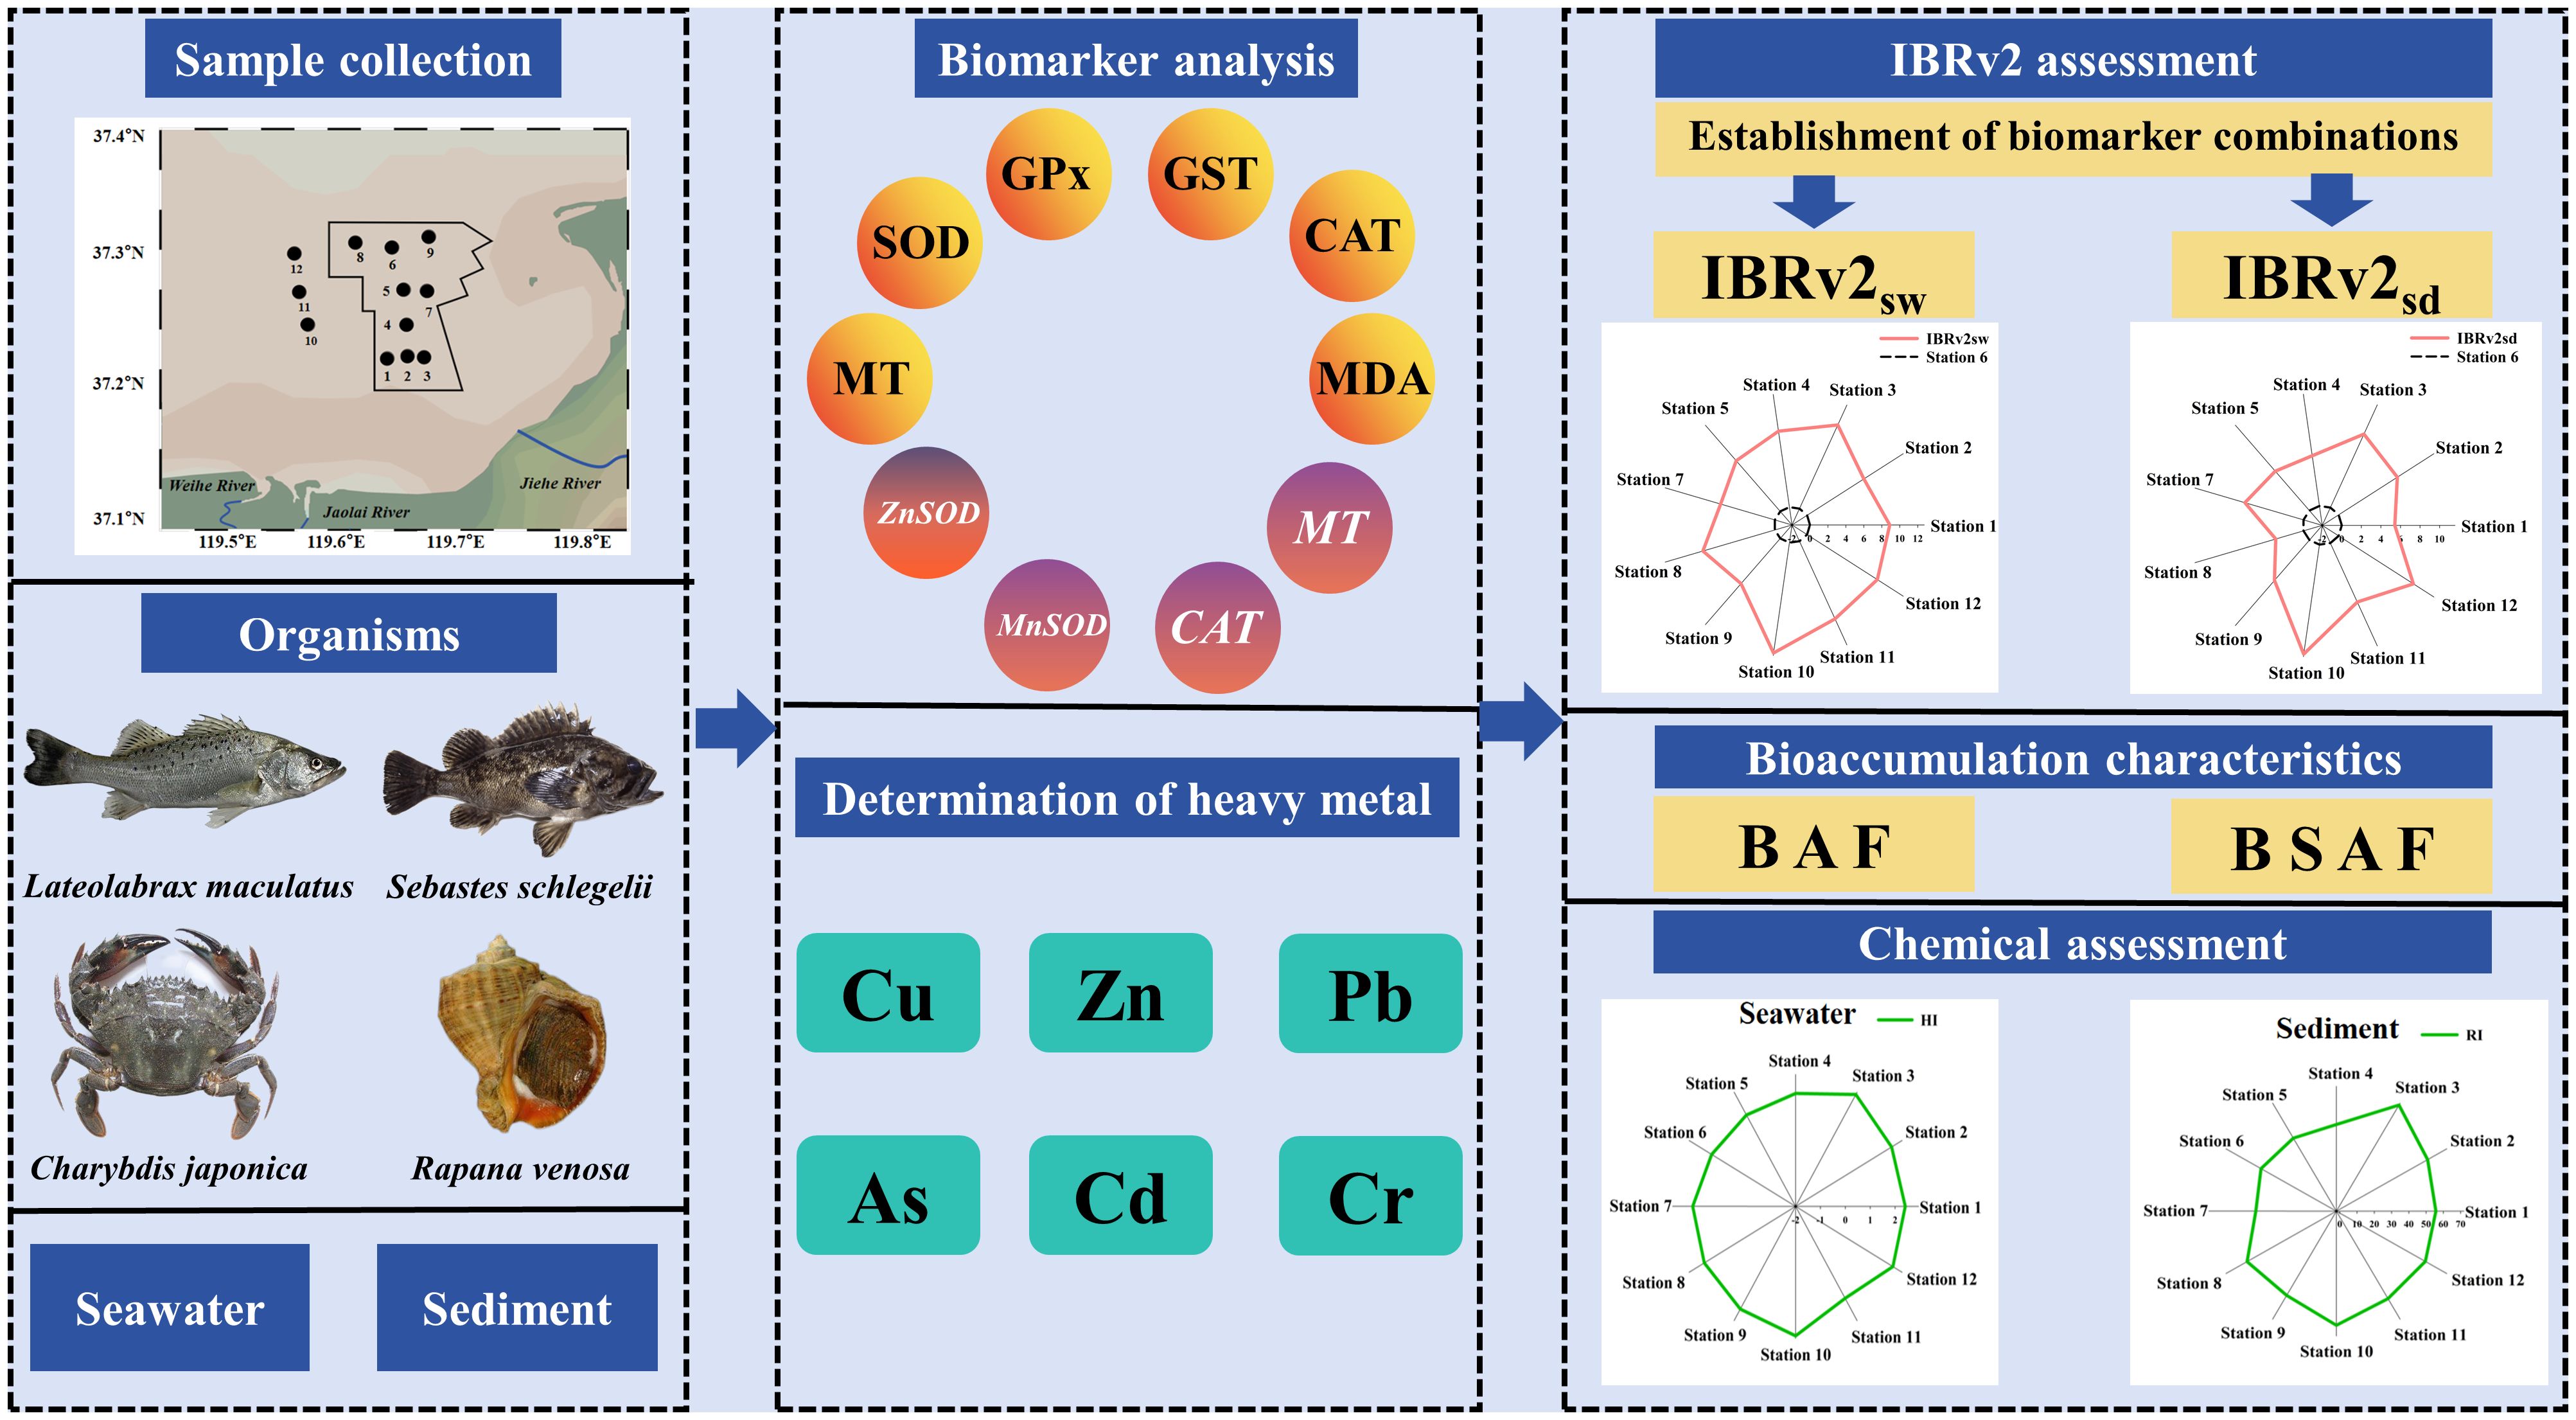
Graphical Abstract
• Biological responses to trace elements in four indicator species were analyzed in a marine ranching area in China.
• The bioaccumulation characteristic of trace elements and biomarker responses exhibited species specificity.
• Two biomarker combinations indicative of trace element pollution in seawater and sediment were established.
• The multi-biomarker and multi-species IBRv2 approach successfully assessed trace element pollution in the study area.
The growing human population, increasing industrial development, and domestic activities have resulted in the discharge of huge quantities of chemicals into the marine environment. Trace elements are among these ubiquitous contaminants, and they are characterized by persistence, non-degradability in the environment, and accumulation in organisms (Lebrun and Gismondi, 2020). Even when trace element levels are generally low, long-term exposure can result in irreversible damage to aquatic organisms (Yang et al., 2023). Hence, national and local authorities oversee environmental trace element monitoring.
Although the degree of trace element pollution in the oceans has become a global concern and numerous studies have focused on measuring pollution levels (Zhao et al., 2021; Lazǎr et al., 2024), chemical monitoring of trace element content does not reflect the toxic effects of these pollutants on aquatic organisms. To improve the reliability of monitoring schemes, the biomarker approach based on biological changes has evolved considerably in recent decades (Catteau et al., 2022; Yamamoto et al., 2023; Bouzahouane et al., 2024). This approach is designed to identify the effect of pollutants on organisms, explain how organisms respond to pollutants, and supplement biological and ecological dimensions of chemical monitoring.
The integrated approach of measuring multiple biomarkers to assess the quality of aquatic environments has become popular because it does not depend on a single biomarker, for which values can vary greatly (Duarte et al., 2017; Lin et al., 2018; Yang et al., 2023). This approach also means that molecular and biochemical biomarkers can be monitored and act as early warning signs of exposure to and effects of pollutants before the environment is damaged. Metallothionein (MT) is a family of ubiquitous low molecular weight proteins that are rich in cysteine and metal content, and they play a vital role in the homeostasis of essential trace metals, detoxification of toxic metals, and quenching of oxidative stress (Beg et al., 2015; Mijošek et al., 2019). One of the main mechanisms of trace element toxicity in aquatic organisms is induction of oxidative stress via increased amounts of reactive oxygen species (ROS). Antioxidant enzymes such as superoxide dismutase (SOD), catalase (CAT), glutathione peroxidase (GPx), and glutathione S-transferase (GST) interact as a sophisticated network to neutralize ROS and protect organism from oxidative damage, which can be measured as malonaldehyde (MDA) content. MT and antioxidant enzyme levels in aquatic organisms have been widely used as early warning signs of metal exposure in the evaluation of environmental metal contamination (Lin et al., 2018; Astani et al., 2023; Strogyloudi et al., 2023).
The responses of these biomarkers in organisms result from systemic exposure to multiple contaminants in the aquatic environment. The selection of appropriate biomarkers for certain contaminants is critically important for a precise assessment of their effects on organisms and the environment. Therefore, it is crucial to understand the ability of each biomarker to discriminate the status of trace element pollution and the relationship between biomarkers and trace element levels.
The biomarker response is also influenced by species sensitivity, living habits, feeding behaviors, and exposure pathways (Catteau et al., 2022), yet the vast majority of previous monitoring studies have measured biomarker levels in only one indicator species (Lin et al., 2018; Ji et al., 2019; Chalghmi et al., 2020; Astani et al., 2023; Benito et al., 2023). Therefore, assessment of multiple species is needed for holistic assessment of the effects of environmental pollution. To date, this approach has been applied in only a few monitoring studies (Duarte et al., 2017; Desforges et al., 2021; Yamamoto et al., 2023), and more multi-species studies are urgently needed to improve assessment strategies and to provide information for regional marine environmental management.
The Chinese government attaches great importance to the development of marine ranching, which is characterized by the restoration of marine environments, the maintenance of marine biodiversity, and the benefits of ecological importance (Qin and Sun, 2021). Shandong Province has constructed numerous national-level marine ranching demonstration areas in places with superior coastline and geographical location to provide scientific experience for the development and management of marine ranching worldwide. The marine ranching environment in offshore areas is highly vulnerable to the effects of human activities, riverine inputs, and aquaculture practices. The western Furong Island marine ranching initiatives in Laizhou Bay along the Shandong coast were initiated in 2011, and in 2015, it was designated as national-level marine ranching demonstration area. The bay is flanked by Longkou Port and numerous gold mining enterprises, leading to substantial pollution carried into the bay by rivers (Xu et al., 2015; Li et al., 2019; Liu et al., 2023). The primary activities within this marine ranching area include the construction of artificial reefs (ARs) to mitigate the degradation of marine habitats and living resources, the cultivation of aquaculture species to produce regular yields, and the development of offshore wind farms (OWFs) to synergize marine ranching with OWFs. ARs have been shown to influence the ecological environment not only in their immediate vicinity but also in adjacent non-ARs areas, altering trace element contents in seawater and surface sediments (Yang et al., 2019; Chen and Chen, 2020; Wilking et al., 2023). Additionally, galvanic anodes, used as a corrosion protection system for OWFs, result in the continuous release of trace elements into the marine environment (Kirchgeorg et al., 2018). Consequently, the western Furong Island marine ranching area functions both as a receptor for pollutants from human activities and riverine inputs and as a source of pollutants discharged by OWFs.
Understanding the impact of marine ranching construction on the marine environment is essential for the sustainable development of marine ranching. Environmental monitoring, especially in view of the effect of pollution on organisms, is crucial for the management of marine ranching areas. However, the biomarker approach had not yet been applied to environmental assessment of marine ranching prior to our study.
In this context, we developed a multi-level and multi-species biomarker approach to evaluate trace element pollution in the western Furong Island marine ranching area. We selected two fish, one crustacean, and one gastropod species from different niches as indicator species due to their common use for the assessment of trace element pollution (Duarte et al., 2017; Astani et al., 2023; Yamamoto et al., 2023). Spotted sea bass (Lateolabrax maculatus) is a middle-upper water dweller that is broadly distributed from the Bohai Sea to the Indo-China Peninsula, and black rockfish (Sebastes schlegelii) is a demersal reef-associated species that is distributed along the coasts of northern China, Korea, and Japan. The benthic-dwelling Asian paddle crab (Charybdis japonica) is widely distributed in China, Korea, Japan, and Malaysia, and the rapa whelk (Rapana venosa) originated in Asia and invaded the Black Sea. These four species are of high economic and ecological importance and are potent indicators of marine trace element pollution (Mao et al., 2012; Kim and Kang, 2017; Huang et al., 2022; Ryabushko et al., 2022).
We measured the accumulation of trace elements and the responses of MT and antioxidant enzymes at molecular and biochemical levels in these four indicator species collected from the marine ranch and an adjacent area. Based on the ability of the various biomarkers to distinguish trace element pollution and on their correlation with environmental trace element levels, we used combinations of six biomarkers in the four indicator species to assess trace element pollution in seawater, and then we repeated this process for the sediment. We used integrated biomarker response version 2 (IBRv2) to comprehensively evaluate trace element pollution in view of the impact of contaminants on organisms (Sanchez et al., 2013; Marques et al., 2016; Lin et al., 2018; Catteau et al., 2022). This monitoring strategy based on multi-level and multi-species biomarkers can be used to facilitate marine environmental management.
The western Furong Island marine ranching covers an area of 11333 ha, including an OWF area of 4800 ha and an AR area of 3666 ha. Positioned 12 km to the coastline and south of the ARs, the OWF features fish farming cages tethered to the wind turbine foundations. This innovative integration of underwater aquaculture with overwater power generation optimizes space and resources. Within this marine ranching, stock enhancement has been implemented, resulting in the release of 1.23 billion fish, shellfish, crustaceans, and sea cucumbers into the marine ecosystem. These organisms are cultivated within the ranching area and subject to annual scientific harvesting.
To assess the environmental impact of these activities, the marine ranching has been segmented into three distinct areas: the OWF area with stations 1, 2, and 3; the AR area with stations 4, 5, and 6; and the AR surrounding area with stations 7, 8, and 9 (Figure 1). Additionally, three reference stations (10, 11, and 12) have been established in the adjacent area of the marine ranching. By analyzing the trace elements content and biomarkers across these areas, we can discern the effects of various ranching activities on the marine environment.
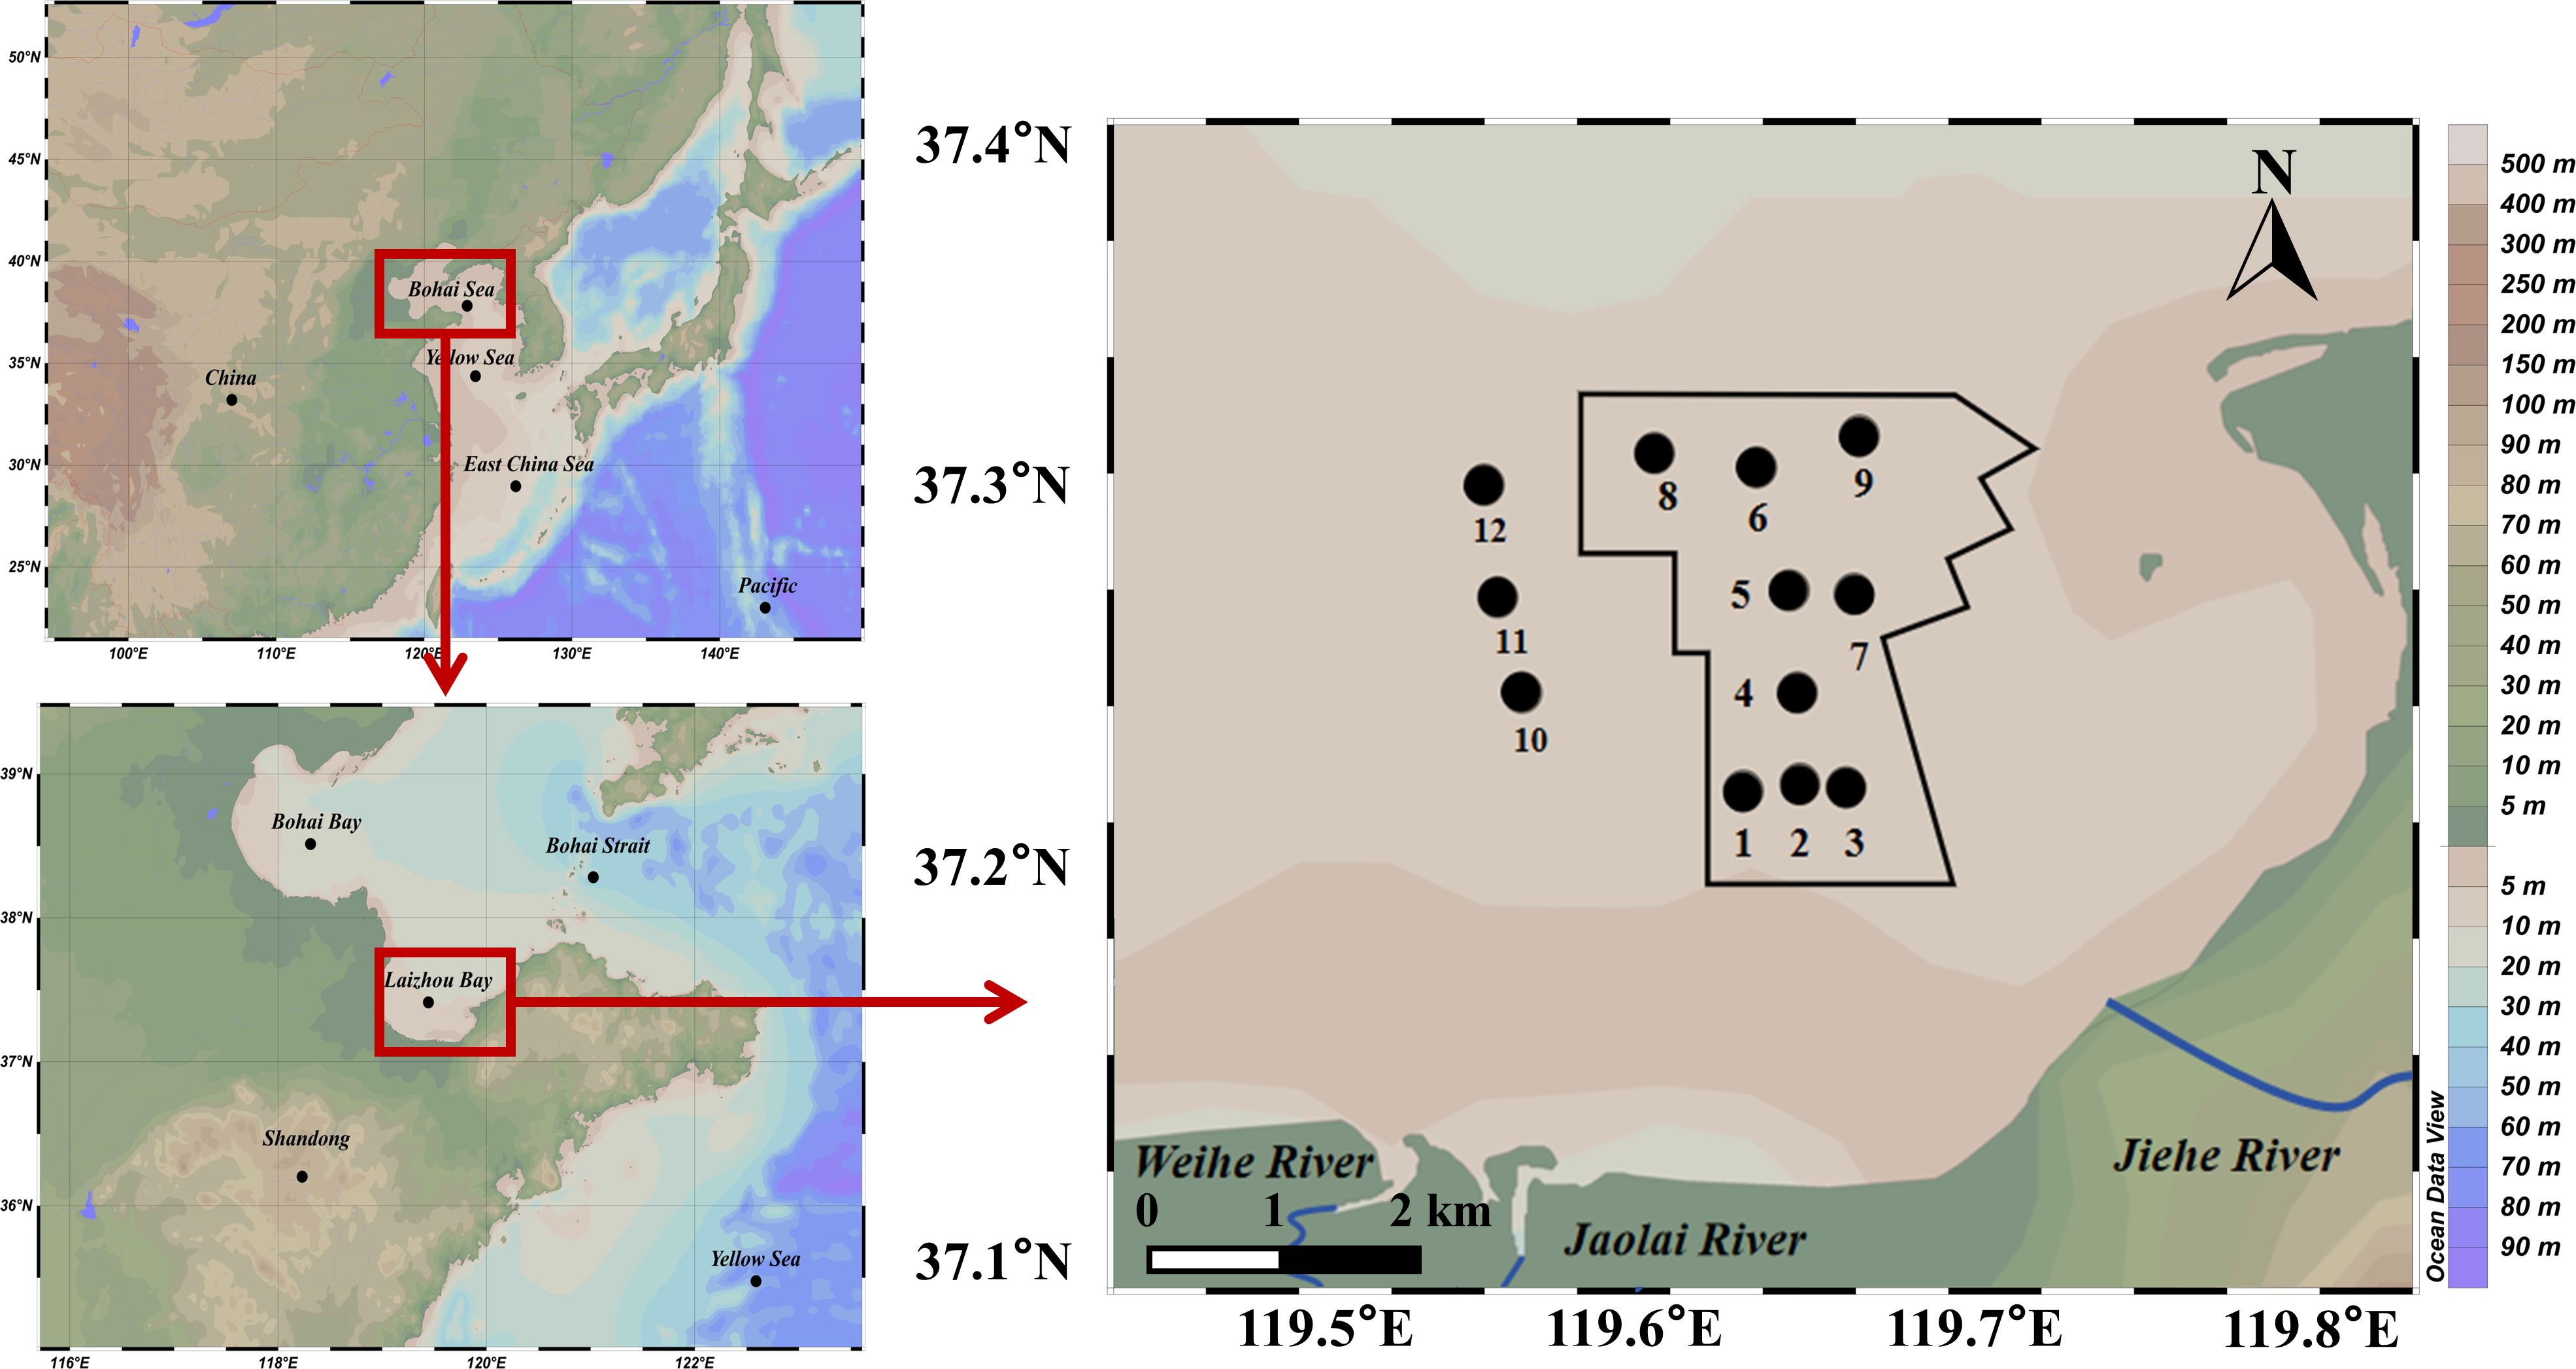
Figure 1 Survey stations in the western Furong Island marine ranching area, which is located within the black solid line. Stations 1, 2, and 3 were in the offshore wind farm area; stations 4, 5, and 6 were in the artificial reef area; stations 7, 8, and 9 were in the area surrounding the artificial reefs; and stations 10, 11, and 12 were in the area adjacent to the marine ranching.
We conducted the field survey in March 2022 according to the Specification for Marine Investigation (General Administration of Quality Supervision, Inspection and Quarantine of the People’s Republic of China, China National Standardization Administration, 2007a). Bottom seawater, surface sediment, and L. maculatus, S. schlegelii, C. japonica, and R. venosa were sampled at all 12 stations.
Three bottom water samples were collected at each station using a water sampler (Slimline436 976, HYDRO-BIOS, Altenholz, Germany). The bottom water temperature, dissolved oxygen content, depth, conductivity, salinity, and turbidity were measured in situ using a multi parameter water quality detector (556MPS, YSI, Yellow Springs, OH, USA). Three surface sediment samples were collected at each station using a grab sampler (van Veen 437332, HYDRO-BIOS). The seawater and sediment samples were transported to the lab for measurement of copper (Cu), zinc (Zn), lead (Pb), arsenic (As), cadmium (Cd), and chromium (Cr) contents.
The indicator species L. maculatus, S. schlegelii, and C. japonica were collected using gillnets, and R. venosa was collected by divers. The collected organisms were placed on ice and transported immediately to the lab. The livers of L. maculatus and S. schlegelii and the digestive glands of C. japonica and R. venosa were removed and stored at –80°C until used for trace element and biomarker analyses. The body weight and body length of each specimen are listed in Supplementary Table S1.
Trace element contents in the samples were measured following the Specification for Marine Monitoring (General Administration of Quality Supervision, Inspection and Quarantine of the People’s Republic of China, China National Standardization Administration, 2007b). Cu, Pb, Cd, and Cr levels were measured using flameless atomic absorption spectrometry, and Zn level was measured by flame atomic absorption spectrometry in an atomic absorption spectrophotometer (AA-7000, Shimadzu, Kyoto, Japan). As content was measured using an atomic fluorescence spectrophotometer (PF72, Persee, Beijing, China).
The detection limits for trace elements in seawater samples were established at 0.2 µg/L for Cu, 0.03 µg/L for Pb, 3.1 µg/L for Zn, 0.01 µg/L for Cd, 0.4 µg/L for Cr, and 0.5 µg/L for As. In sediment samples, the detection limits were quantified at 0.5 mg/kg for Cu, 1.0 mg/kg for Pb, 6.0 mg/kg for Zn, 0.04 mg/kg for Cd, 2.0 mg/kg for Cr, and 0.06 mg/kg for As. For biological specimens, the detection limits for these elements were determined to be 0.4 mg/kg for Cu, 0.04 mg/kg for Pb, 0.4 mg/kg for Zn, 0.005 mg/kg for Cd, 0.04 mg/kg for Cr, and 0.2 mg/kg for As.
Quality assurance and quality control protocols encompassed a reagent blank sample, 10% proportion of parallel samples, a matrix-spiked sample, and a certified standard sample from either the National Standard Seawaters (Cu, Pb, Zn, Cd, and Cr from GBW(E)080040) or As from GBW(E)080230), the National Standard Sediments GBW07333, or the National Standard Croaker Material GBW08573, for each batch of samples. The relative deviation in trace elements content among the parallel samples was maintained below 8%. The recovery rate for matrix-spiked samples with standard solutions ranged from 94% to 106%.
Trace element pollution in seawater was assessed using the single-factor index method (Equations 1, 2).
where Pi is the trace element pollution index; Ci is the measured concentration of a certain trace element; and Si is the class I criterion of China Seawater Quality Standard (State Environmental Protection Administration of the People’s Republic of China, 1997). Class I criteria for Cu, Pb, Zn, Cd, Cr, and As are 5, 1, 20, 1, 50, and 20 µg/L, respectively. HI is the integrated trace element pollution index, and n is the number of measured trace elements. A larger HI value indicates a higher degree of trace element pollution.
The ecological risks of trace elements in the sediment were assessed using the ecological risk assessment method (Håkanson, 1980; Equations 3–5; Table 1):
where is the measured concentration of a given trace element; is the background concentration of a given trace element in the studied area; is the potential risk of a given trace element; is the toxic response factor for a given trace element; and values of Cu, Pb, Zn, Cd, Cr, and As are 5, 5, 1, 30, 2, and 10, respectively (Håkanson, 1980). RI is the potential risk index. Table 2 shows categorization of and RI.
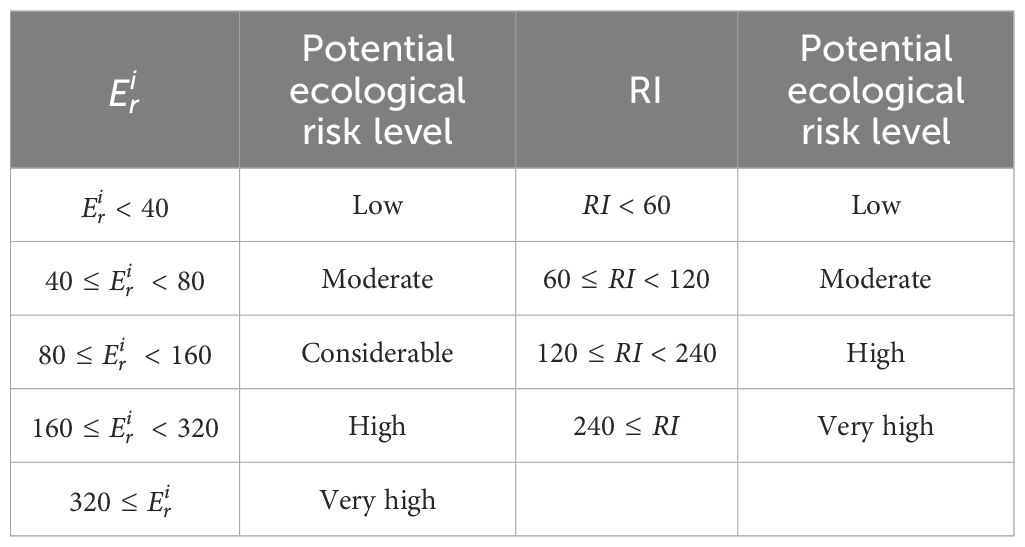
Table 1 Categorization of potential risk assessed using Håkanson ecological risk assessment.
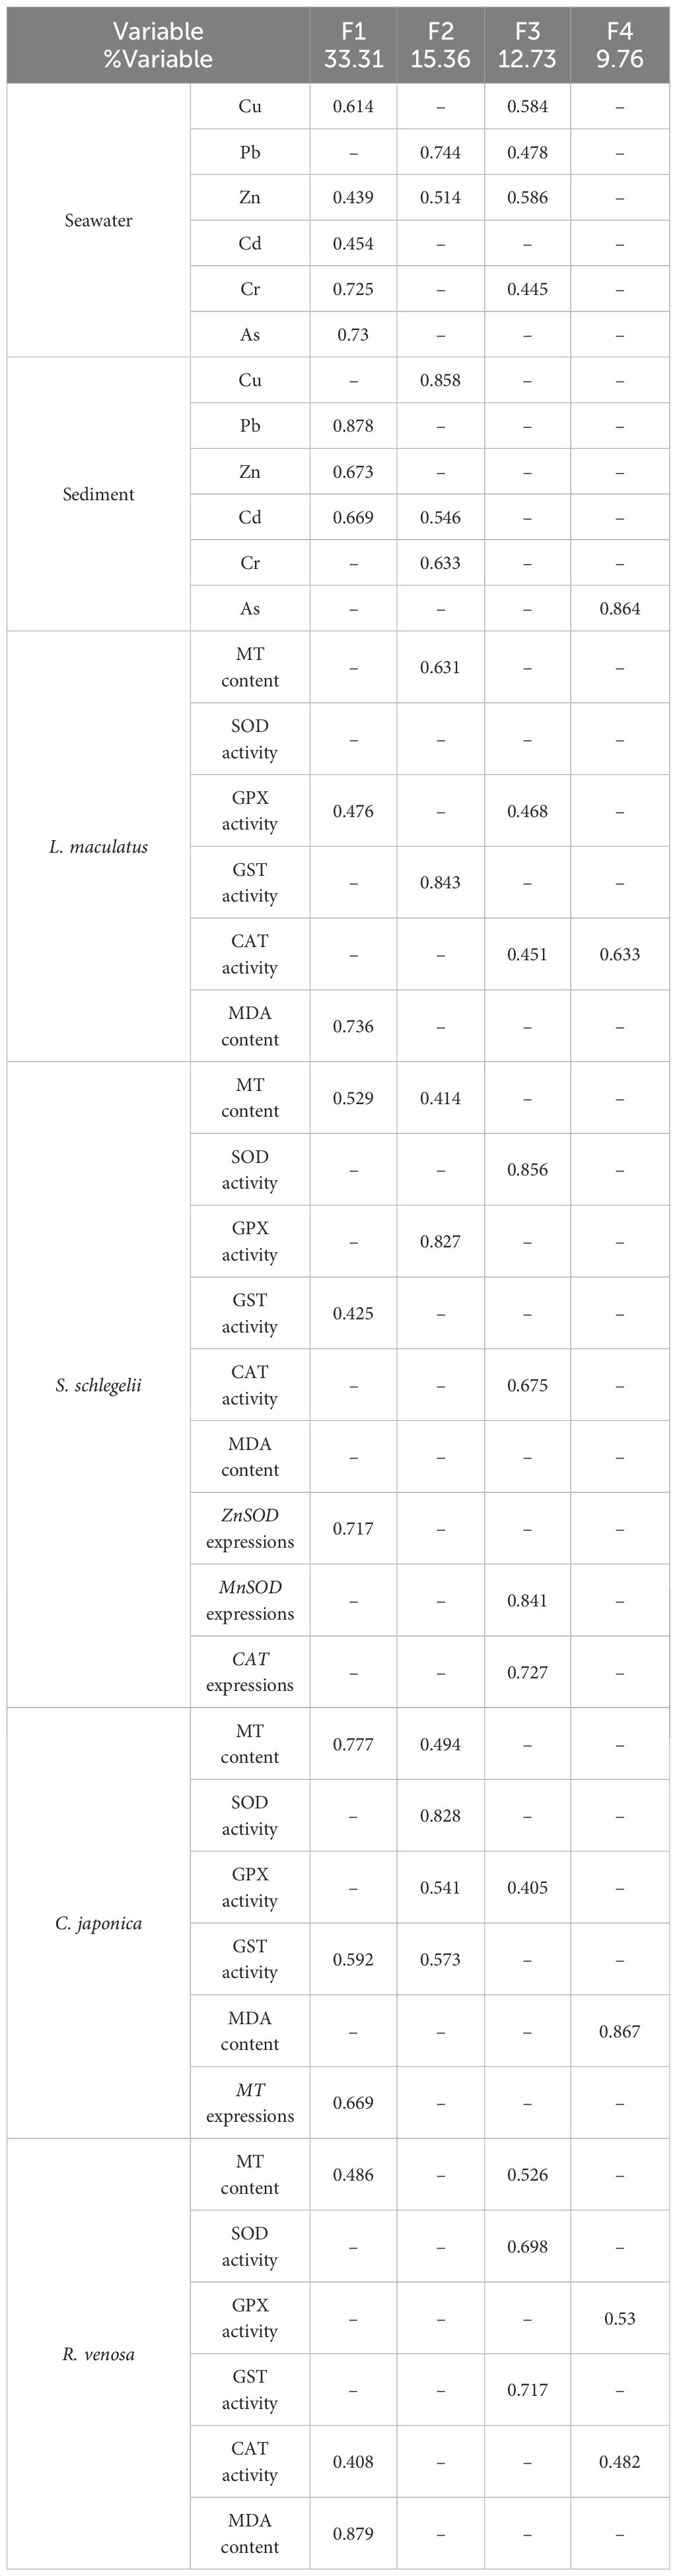
Table 2 Sorted rotated factor loadings of the original variables on principal factors of the studied marine ranching area.
The biota-seawater accumulation factor (BAF) and biota-sediment accumulation factor (BSAF) are indicators of the ability of organisms to accumulate trace elements in the seawater and sediment (Szefer et al., 1999; Usero et al., 2005). They were calculated as follows (Equations 6, 7):
where Mtissue is the trace element content in the tissue; Mseawater is the trace element concentration in the seawater; Msediment is the trace element concentration in the sediment.
The tissue samples used for MT content analysis were homogenized in 0.25 mol/L sucrose with a weight volume ratio of 1:9 at 4°C. After centrifugation (20,000 × g) at 4°C for 40 min, the supernatants were collected for MT content measurement using the Ag saturation method (Scheuhammer and Cherian, 1986). MT content was expressed as the amount of Ag+ bound by MT.
The samples used for measure antioxidant enzyme including SOD, CAT, GPx, and GST activities and MDA content were homogenized in 0.1 mol/L Tris-HCl buffer containing 1 mmol/L EDTA (pH 7.4, Sinopharm Chemical Reagent Co., Shanghai, China) at 4°C with a weight volume ratio of 1:9. After centrifugation (13,000 × g) for 30 min at 4°C, the supernatants were collected for biomarker analysis using spectrophotometry according to the instructions provided with the commercial kits (Nanjing Jiancheng Bioengineering Institute, Nanjing, China). SOD effectively suppresses the formation of the superoxide anion radical produced by the interaction of xanthine with the xanthine oxidase reaction system, thereby diminishing the concentration of colored compounds within the reaction medium. The activity of SOD was quantified spectrophotometrically at a wavelength of 505 nm, with one unit of the enzyme being characterized as the quantity required to inhibit 50% of the color development per milligram of tissue protein. Ammonium molybdate serves to inhibit CAT from decomposing H2O2 and instead reacts with H2O2 to form a yellow complex. This yellow complex can be spectrophotometrically detected at a wavelength of 405 nm. One unit is defined as the enzyme amount capable of decomposing 1 µmoL of H2O2 per second per milligram of tissue protein. GPx catalyzes the oxidation of reduced glutathione (GSH) through the utilization of H2O2. The reaction product resulting from the interaction of GSH with 5,5′-Dithiobis-(2-Nitrobenzoic Acid) exhibits an absorption peak at 412 nm. At this specific wavelength, the reduction in absorbance serves as an indicator of GPx activity. One unit of GPx activity is defined as the enzyme quantity necessary to oxidize 1 moL of GSH per minute per milligram of tissue protein. The reaction products formed by the catalysis of GST on the interaction between GSH and 1-chloro-2,4-dinitrobenzene can be spectrophotometrically detected at a wavelength of 412 nm. One unit of GST activity is defined as the enzyme amount necessary to reduce 1 μM of GSH per minute per milligram of tissue protein. MDA reacts with thiobarbituric acid to yield a red product, which can be spectrophotometrically detected at a wavelength of 532 nm. The MDA content is quantified by expressing the molar amount of MDA per milligram of protein present in the tissue.
Only gene sequences of ZnSOD, MnSOD, and CAT in S. schlegelii and MT in C. japonica were available from the National Center for Biotechnology Information. Database. Herein, we used the SYBR Green RT-PCR assay to measure the expression of these genes, and β-actin was used as the internal reference. The specific primers were designed using Primer Premier 5.0 (Premier Biosoft International, Palo Alto, CA, USA) and are listed in Supplementary Table S2. Total RNA was extracted using a Trizol kit (Invitrogen, Carlsbad, CA, USA), digested by DNase (Promega, Madison, WI, USA), and reverse transcribed into single strand cDNA with reverse transcriptase (Promega). The PCR amplification volume contained 1 µL of cDNA, 0.4 µL each of forward and reverse primers, 10 µL of SYBR Green Master Mix (Vazyme, Nanjing, China), and 8.2 μL of diethylpyrocarbonate-treated water (Vazyme). The SYBR Green RT-PCR was performed on a CFX Connect™ Real-Time PCR System (Bio-Rad, Hercules, CA, USA), and the profile was 95°C for 5 min followed by 40 cycles of 95°C for 15 s and 60°C for 30 s. See Fang et al. (2010) for details about this process.
For each investigated station, the relationships among variables were assessed by factor analysis (FA) and principal component analysis (PCA) as extraction procedure previously employed in studies by Choueri et al. (2009) and Choueri et al. (2010). These analyses were based on the trace elements content in seawater and sediment and the biomarkers in the four studies indicators. The variables were autoscaled to ensure equal importance in the analysis. Our focus was on the cause-effect relationships stemming from environmental trace elements and their biological impacts. Notably, the data used for multivariate analysis excluded bioaccumulations, as these are phenomena rather than effects, as per Chapman (1990). The analyses were conducted using SPSS software (version 13.0; IBM, Armonk, NY, USA).
We conducted Pearson correlation analysis to assess the relationship between biomarkers and trace element contents in seawater or sediment. We established two biomarker combinations indicative of trace element pollution in seawater and sediment, respectively, based on the correlation between biomarkers and trace element contents. The selected biomarkers were integrated using IBRv2 (Sanchez et al., 2013). We used the station with the lowest pollution as the reference station. To reduce variance, a log transformation of each biomarker was conducted as follows (Equation 8):
where Yi represents transformation of the biomarker; Xi represents the biomarker value at the polluted station; and X0 represents the biomarker value at the reference station.
The general mean (μ) and standard deviation (σ) of Yi were used to obtain the standardized biomarker response (Zi, Equation 9):
The biomarker deviation index (A) was calculated using Zi at the polluted station and Z0 at the reference station (Equation 10):
The IBR was obtained by calculating the sum of the absolute value of A for each biomarker at the polluted station (Equation 11):
The data were expressed as mean ± standard deviation (SD). Three repeated measurements were performed for every index for each station. The differences in the biomarker values among stations were analyzed using one-way analysis of variance followed by Duncan’s test using SPSS. P< 0.05 was considered to be statistically significant. Correlations among measured indexes were assessed using Pearson correlation analysis followed by Duncan’s test at a significance level of P< 0.05. Prior to conducting Pearson correlation analysis, the Shapiro-Wilk test was employed to ascertain the normality of the data distribution. The RNA expression levels were calculated using the 2−ΔΔCt method (Livak and Schmittgen, 2001). Graphics were depicted using ArcGIS (version 10.0; Environmental Systems Research Institute, Redlands, CA, USA) and SigmaPlot (version 13.5; Systat Software, San Jose, CA, USA).
Supplementary Table S3 shows the physicochemical parameters of the seawater samples. The contents of Cu, Pb, Zn, Cd, Cr, and As in seawater were within Class I criteria, except for the Zn content at stations 1 and 3 in the offshore wind farm and station 10 in the area adjacent to the marine ranch (Supplementary Table S4). Zn contents at these three stations were within Class II criteria (50 µg/L, Figure 2).
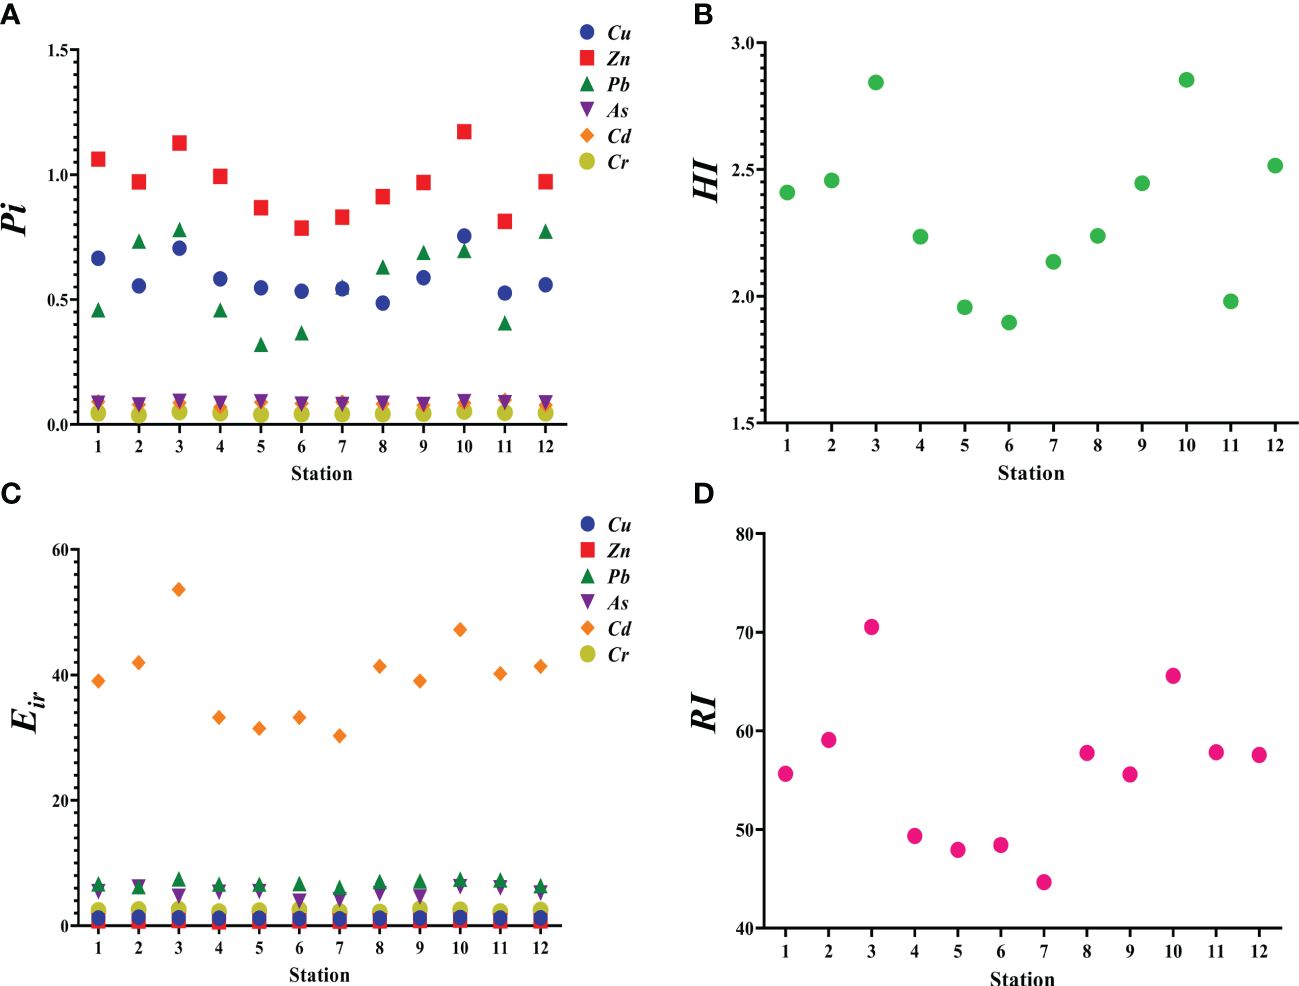
Figure 2 Assessment of trace element contents in seawater and sediment collected from the studied marine ranching area. (A) trace element pollution index (Pi) in seawater assessed using the single-factor index method. (B) integrated trace element pollution index (HI) in seawater. (C) potential risk of a given trace element () in sediment assessed using the Håkanson ecological risk assessment method. (D) sum of (RI).
The trace element contents in sediment at all stations were within Class I criteria of China Sediment Quality Standards (General Administration of Quality Supervision, Inspection and Quarantine of the People’s Republic of China, 2002). There values were as follows: Cu, 35 mg/kg; Pb, 60 mg/kg; Zn, 150 mg/kg; Cd, 0.50 mg/kg; Cr, 80 mg/kg; and As, 20 mg/kg (Supplementary Table S5).
Overall, the trace element contents in seawater and sediment in the AR area and the area surrounding AR were generally lower than those in the offshore wind farm area and the area adjacent to the marine ranch. According to the HI of seawater, the ranking of trace element pollution is as follows: station 6< station 5< station 11< station 7< station 4< station 8< station 1< station 9< station 2< station 12< station 3< station 10. The values were ranked as: Cd > Pb > As > Cr > Cu > Zn at all stations (Figure 2). Every trace element at each station was of low ecological risk, except for Cd at stations 2, 3, 8, 10, 11, and 12, where it posed moderate ecological risk. Moreover, the ecological risk of the sum of all studied trace elements at every station was low, with the exception of moderate risk at stations 3 and 10. According to the RI of sediment, the ranking of trace element pollution is as follows: station 7< station 5< station 6< station 4< station 9< station 1< station 12< station 8< station 11< station 2< station 10< station 3.
Cu, Zn, Pb, As, Cd, and Cr were detected in all four indicator species (Supplementary Table S6). The maximum content of these trace elements was 19.41 mg/kg Cu in C. japonica at station 11; 65.50 mg/kg Zn in R. venosa at station 1; 1.70 mg/kg Pb in R. venosa at station 12; 11.75 mg/kg As in C. japonica at station 11; 0.098 mg/g Cd in L. maculatus at station 12; and 1.98 mg/kg Cr in C. japonica at station 1. Trace element contents in C. japonica and R. venosa were relatively higher than those in L. maculatus and S. schlegelii.
The bioaccumulation characteristics of trace elements in the four indicators exhibited species specificity (Figure 3). The values of BAF and BASF for C. japonica and R. venosa were higher than those for L. maculatus and S. schlegelii. These values showed that L. maculatus could efficiently accumulate Cu and Zn from seawater and Cu from sediment and that S. schlegelii could efficiently accumulate Cu and As from seawater and Cu from sediment. C. japonica and R. venosa could efficiently accumulate Cu, Zn, Pb, and As from seawater and Cu, Zn, and As from sediment.
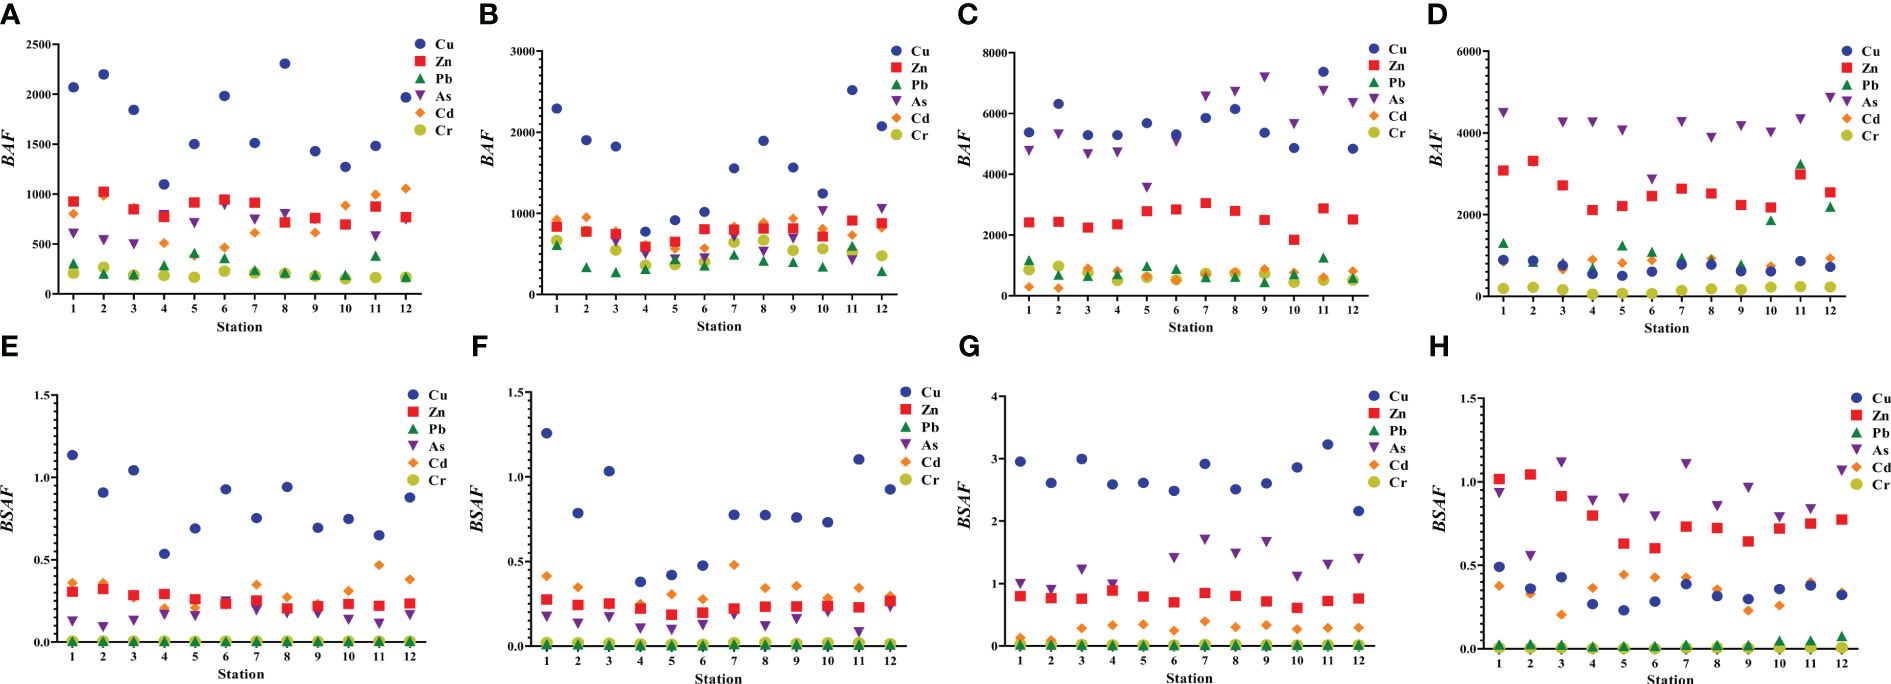
Figure 3 Biota-seawater accumulation factor (BAF) and biota-sediment accumulation factor (BSAF) in the four indicator species. (A) BAF in L. maculatus. (B) BAF in S. schlegelii. (C) BAF in C. japonica. (D) BAF in R. venosa. (E) BSAF in L. maculatus. (F) BSAF in S. schlegelii. (G) BSAF in C. japonica. (H) BSAF in R. venosa.
The studied biomarker response showed significant differences among stations, indicating spatial variation of biomarkers (Figures 4–7). The biomarker values in the AR area and the area surrounding AR were generally lower than those in the offshore wind farm area and the area adjacent to the marine ranch, which suggested good health status of the indicator species. Furthermore, differences in biomarker responses were observed among species, which suggests that they have distinct mechanisms for adjusting to trace element exposure.
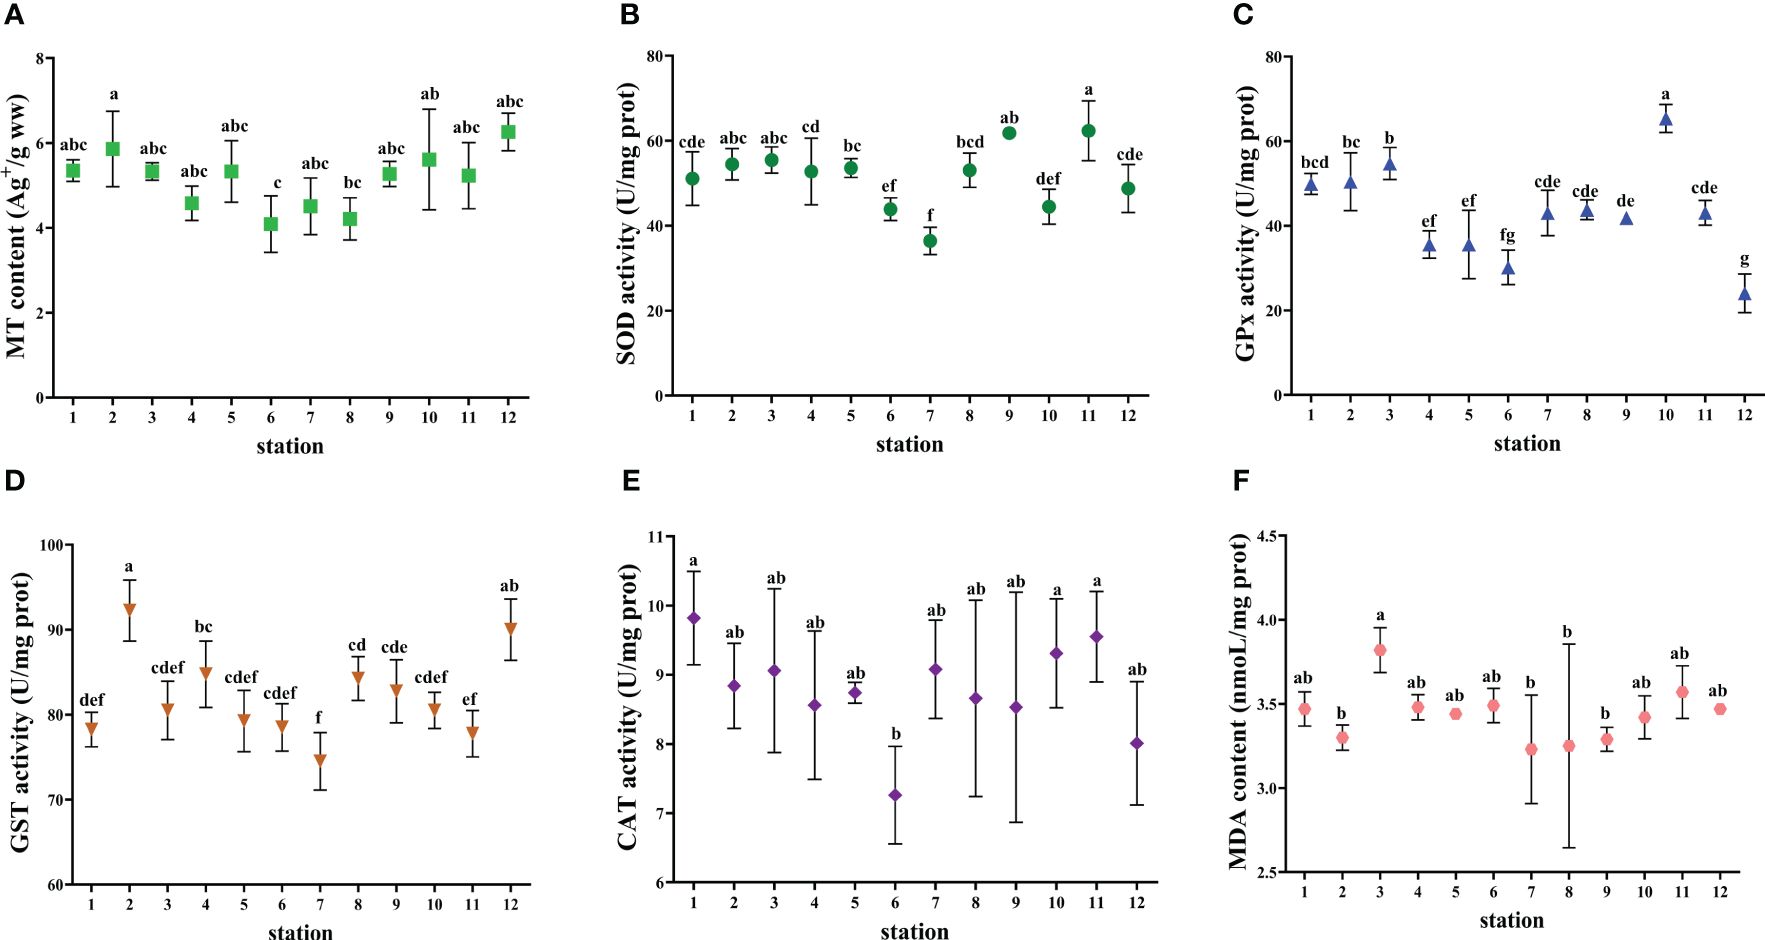
Figure 4 Biomarkers in the liver of L. maculatus collected from the studied marine ranching area. (A) MT content. (B) SOD activity. (C) GPx activity. (D) GST activity. (E) CAT activity. (F) MDA content. The values are presented as mean ± SD. Different lowercase letters indicate significant differences among stations (P< 0.05).
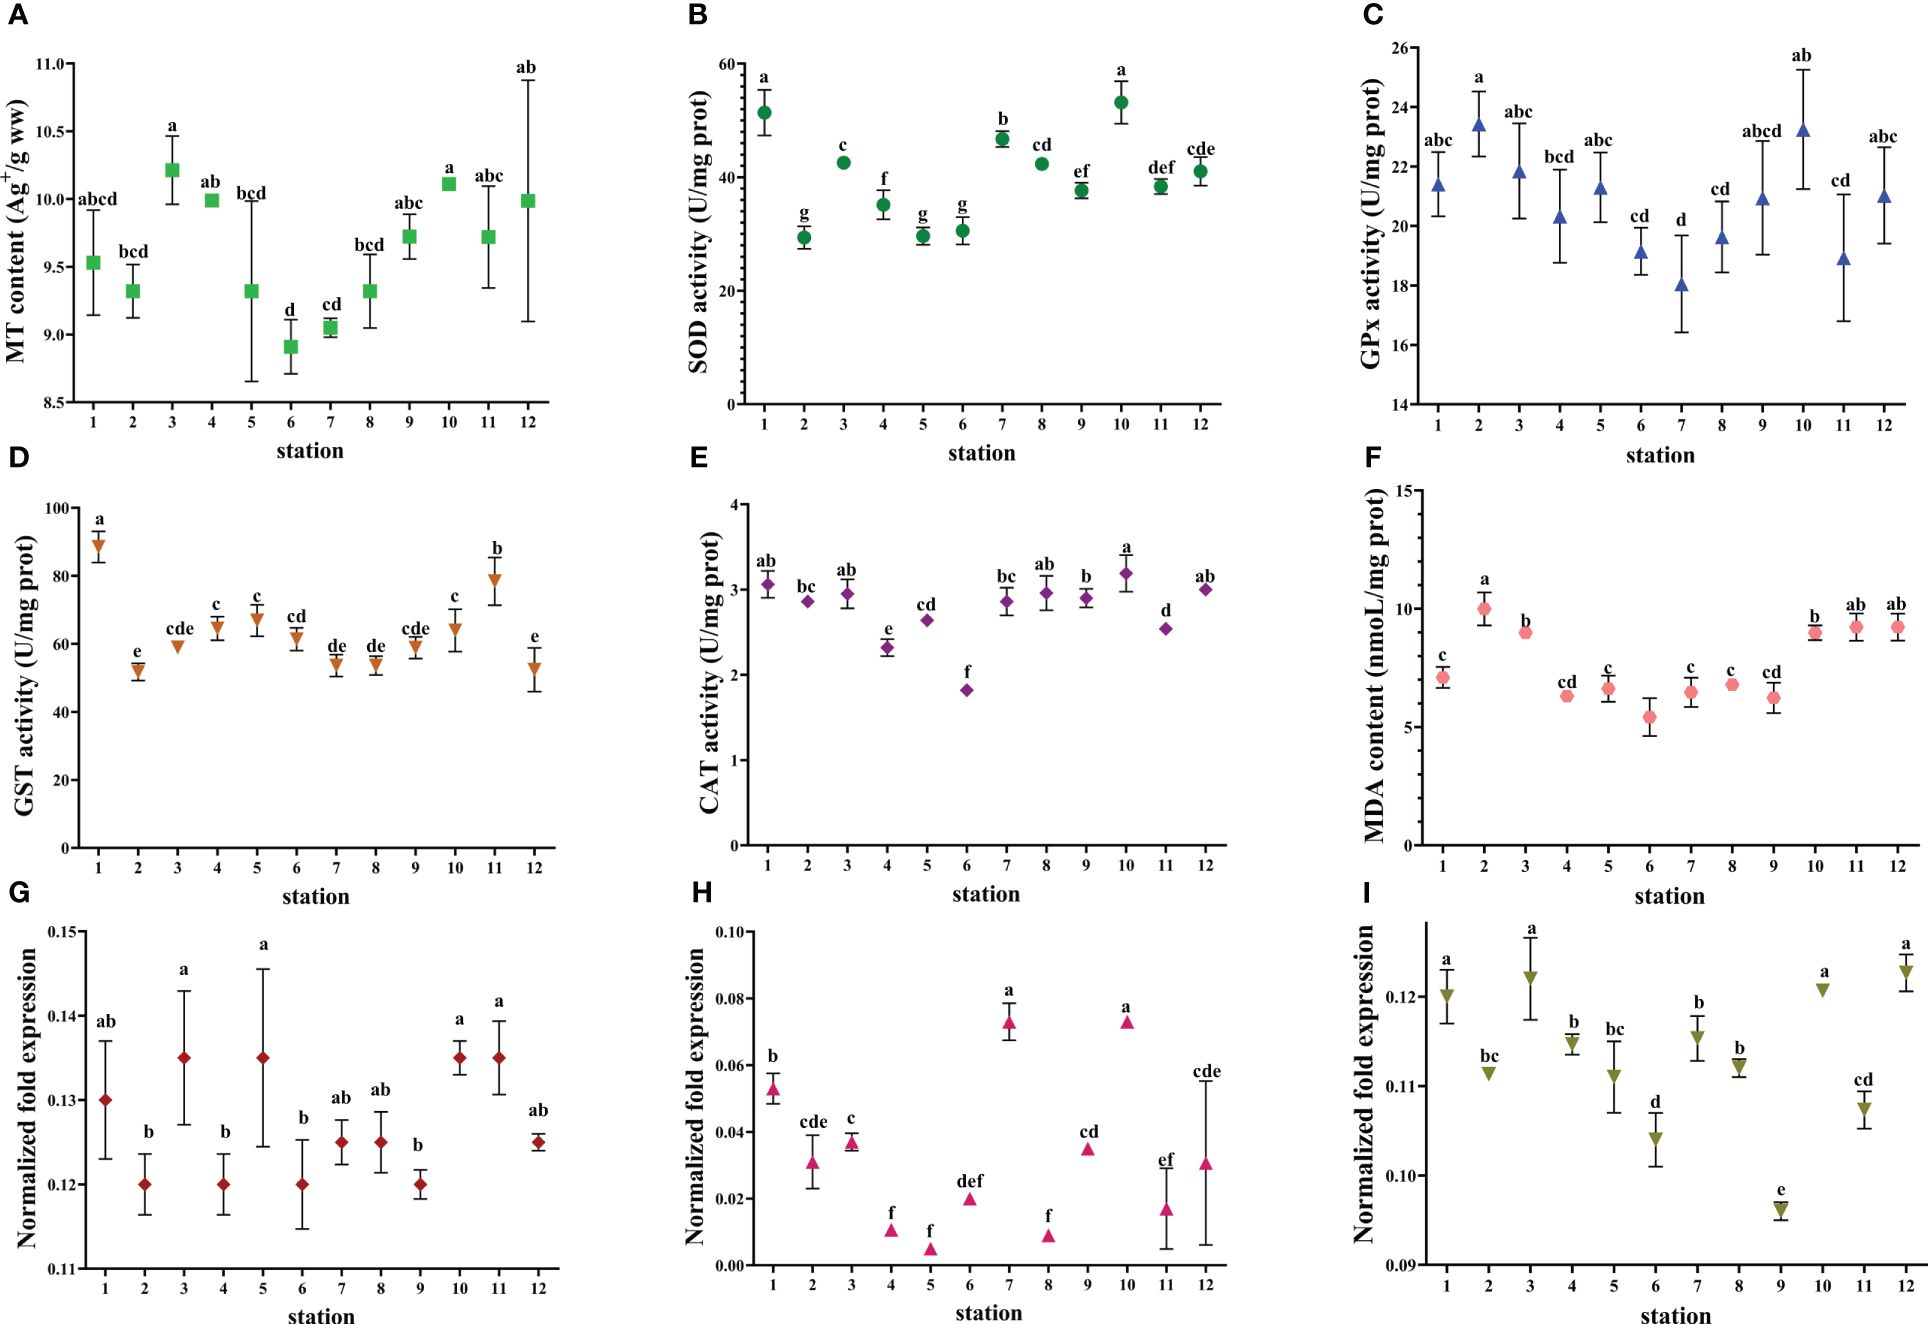
Figure 5 Biomarkers in the liver of S. schlegelii collected from the studied marine ranching area. (A) MT content. (B) SOD activity. (C) GPx activity. (D) GST activity. (E) CAT activity. (F) MDA content. (G) gene expression of ZnSOD. (H) gene expression of MnSOD; (I) gene expression of CAT. The values are presented as mean ± SD. Different lowercase letters indicate significant differences among stations (P< 0.05).
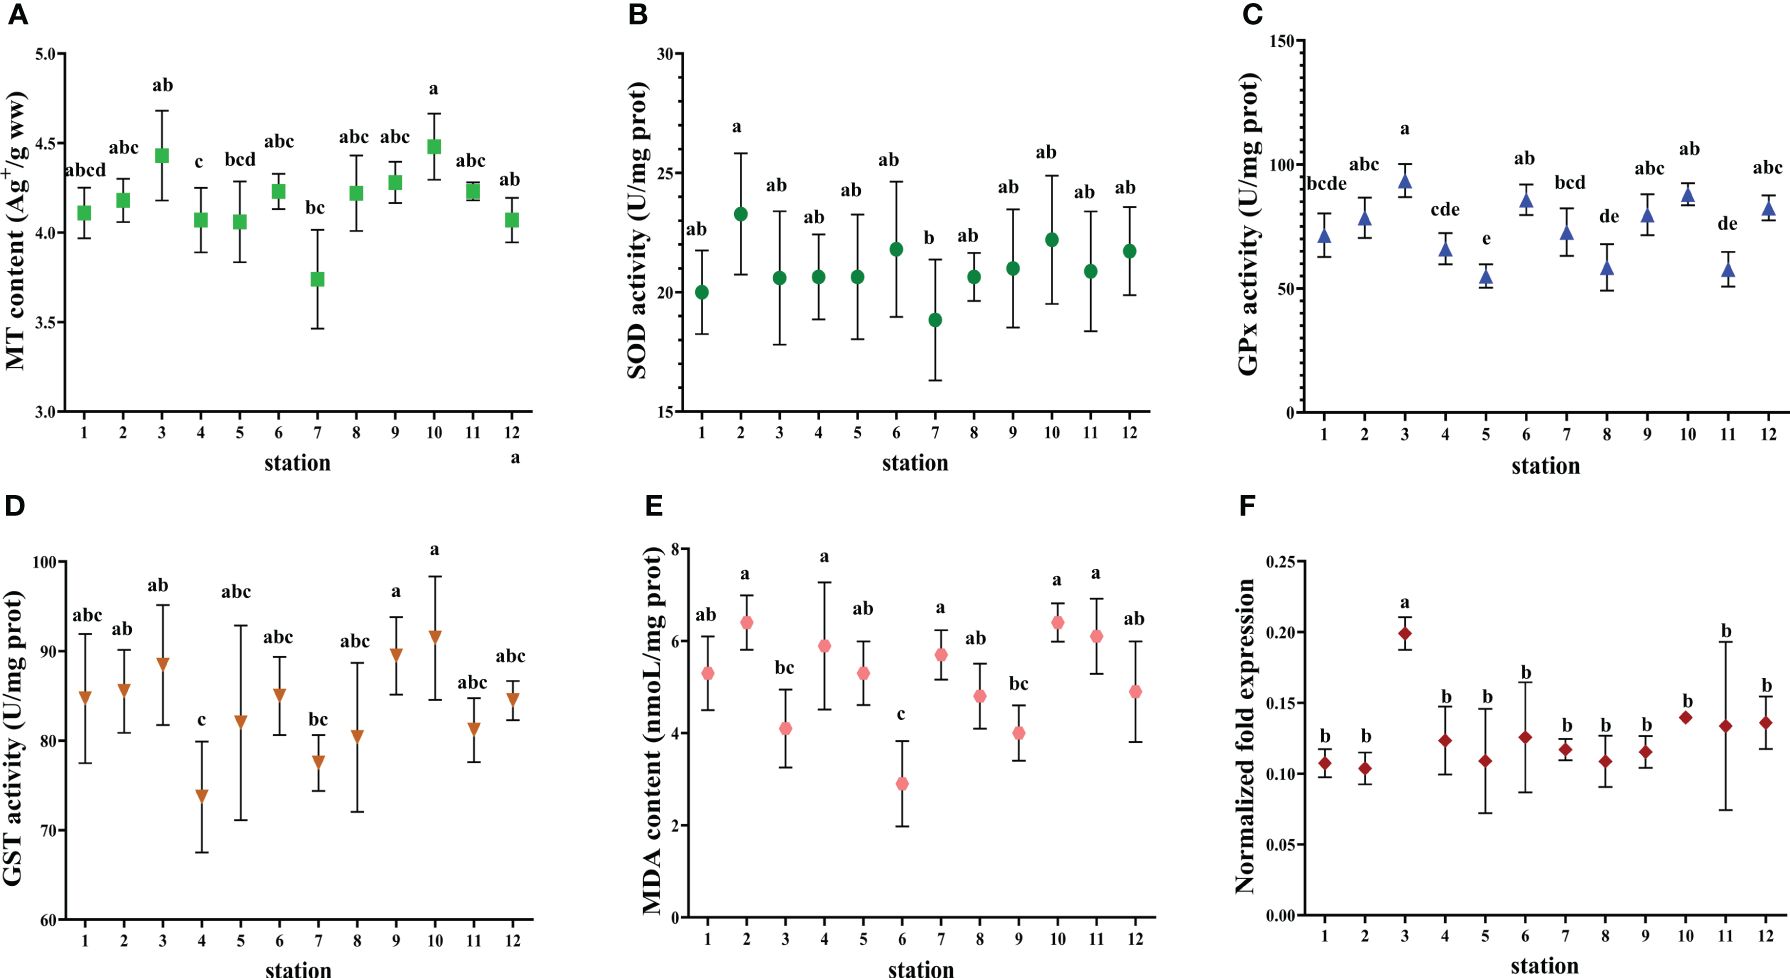
Figure 6 Biomarkers in the digestive gland of C. japonica collected from the studied marine ranching area. (A) MT content. (B) SOD activity. (C) GPx activity. (D) GST activity. (E) MDA content. (F) gene expression of MT. The values are presented as mean ± SD. Different lowercase letters indicate significant differences among stations (P< 0.05).
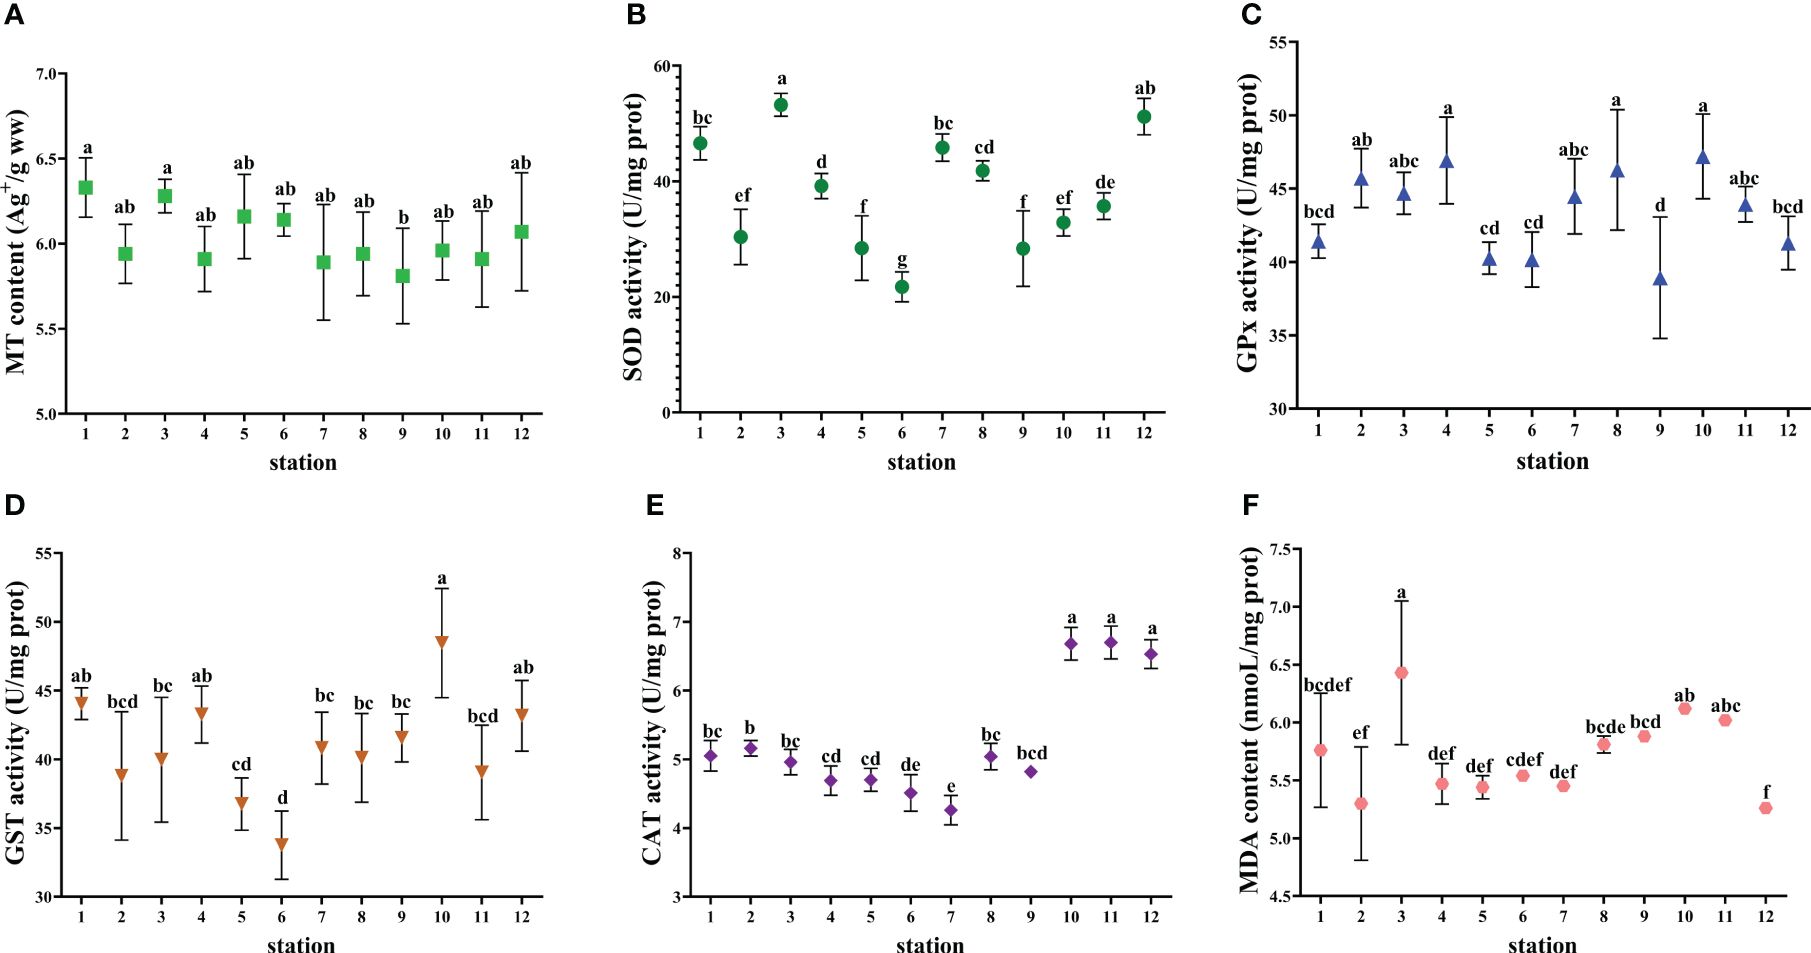
Figure 7 Biomarkers in the digestive gland of R. venosa collected from the studied marine ranching area. (A) MT content. (B) SOD activity. (C) GPx activity. (D) GST activity. (E) CAT activity. (F) MDA content. The values are presented as mean ± SD. Different lowercase letters indicate significant differences among stations (P< 0.05).
S. schlegelii and L. maculatus had higher SOD activity compared to C. japonica and R. venosa. The maximum MDA content (6.79 nmol/L) was found in S. schlegelii at station 8. C. japonica had the highest GPx activity and R. venosa had the lowest GST activity among the four indicator species. CAT activity was not detected in C. japonica and was highest in L. maculatus.
Biomarker values exhibited different response characteristics in the offshore wind farm area and the area adjacent to the marine ranch. The values of some biomarkers were higher in the offshore wind farm area compared to the adjacent area (e.g., MT content in R. venosa and GPx activity in S. schlegelii), whereas the opposite was true for other biomarkers (e.g., CAT activity in S. schlegelii and GST activity in R. venosa). As referred to the relationship between molecular and biochemical levels of a certain biomarker, only SOD activities were significantly correlated with MnSOD expressions in S. schlegeli.
The factor analysis streamlined the original dataset into four principal factors, collectively accounting for 71.16% of the total variance present in the original data (Table 2).
The predominant factor (F1) accounted for 33.31% of the variance and related contents of 5 specific trace elements (Cu, Zn, As, Cd, and Cr) in seawater and 3 specific trace elements (Pb, Zn, and Cd) in sediment and 2 biomarkers in L. maculatus (GPx activity and MDA content), 3 biomarkers in S. schlegelii (MT content, GST activity, and ZnSOD expressions), 3 biomarkers in C. japonica (MT content, GST activity, and MT expressions), and 3 biomarkers in R. venosa (MT content, CAT activity, and MDA content).
The predominant factor (F2) accounted for 15.36% of the variance and related contents of 2 specific trace elements (Pb and Zn) in seawater and 3 specific trace elements (Cu, Cd, and Cr) in sediment and 2 biomarkers in L. maculatus (MDA content and GST activity), 2 biomarkers in S. schlegelii (MT content, and GPx activity), and 4 biomarkers in C. japonica (MT content, SOD activity, GPx activity, and GST activity).
The predominant factor (F3) accounted for 12.73% of the variance and related contents 4 specific trace elements (Cu, Pb, Zn, and Cr) in sediment and 2 biomarkers in L. maculatus (GPx activity and CAT activity), 3 biomarkers in S. schlegelii (SOD activity, CAT activity, MnSOD expressions, and CAT expressions), GPx activity in C. japonica, and 3 biomarkers in R. venosa (MT content, SOD activity, and GST activity).
The predominant factor (F4) accounted for 9.76% of the variance and related contents of As content in sediment and CAT activity in L. maculatus, MDA content in C. japonica, and 2 biomarkers in R. venosa (GPx activity and CAT activity).
All stations exhibited positive scores across all four factors, with the exception of station 6, which registered a negative score for F4 (Table 3).
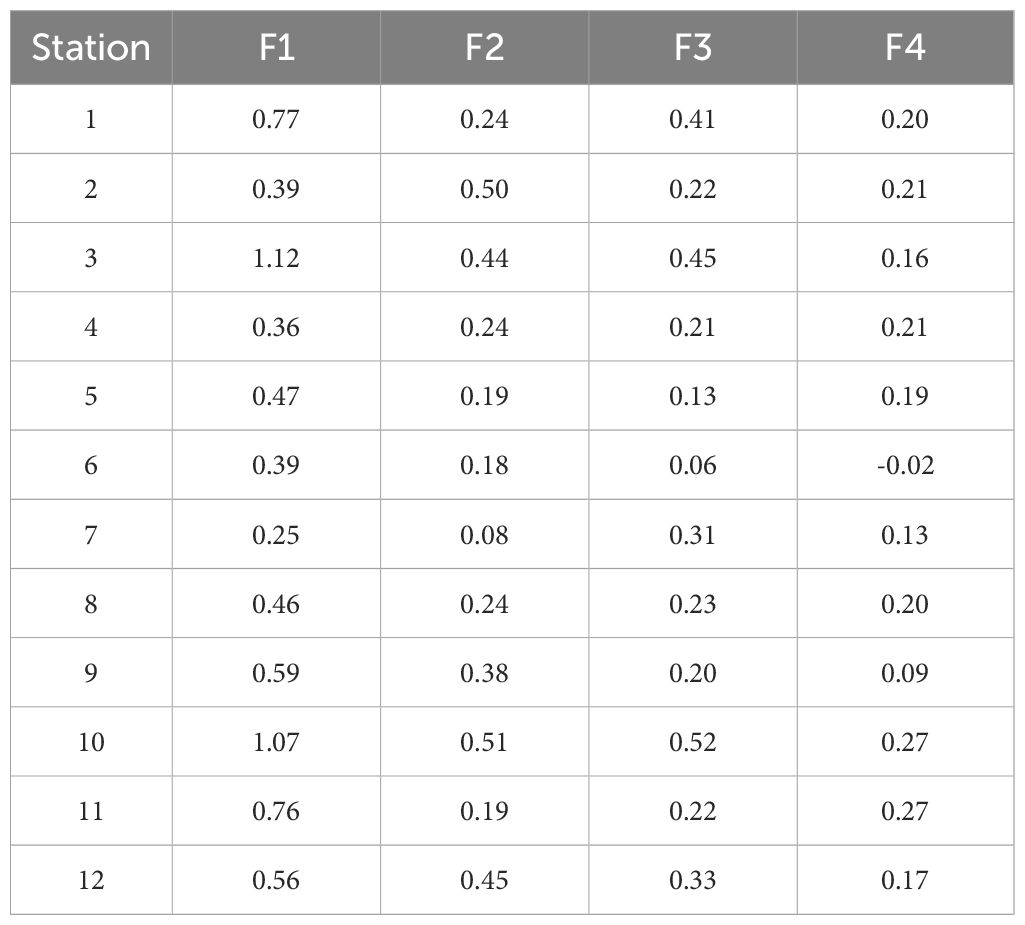
Table 3 Estimated factor scores for the sampling stations in the studied marine ranching area.
The data of trace element contents in environmental samples and biomarker levels conform to a normal distribution. According to Pearson correlation analysis, biomarkers significantly related to trace element contents in seawater or sediment were considered for IBRv2 calculation (Supplementary Figures S1, S2). The precise calculation of IBRv2 requires at least 5–6 biomarkers. Therefore, we used two sets of biomarkers from these four indicator species as an indicator of trace element pollution in seawater and sediment, respectively. ZnSOD expression and MT content in S. schlegelii (SsZnSOD, SsMT), GPx activity and GST activity in L. maculatus (LmGPx, LmGST), GST activity in R. venosa (RvGST), and GPx activity in C. japonica (CjGPx) were selected for the IBRv2 calculation for seawater. MDA content and CAT activity in R. venosa (RvMDA, RvCAT), GST activity and MT content in C. japonica (CjGST, CjMT), MT content in L. maculatus (LmMT), and GPx activity in S. schlegelii (SsGPx) were selected for the IBRv2 calculation for sediment. Based on the pollution status of trace elements and the health status of organisms, we selected station 6 as the reference station for IBRv2 analysis.
The calculated IBRv2 values can distinguish the low and high impact stations. Values were generally higher for the AR area and the area surrounding AR compared to the offshore wind farm area and the area adjacent to the marine ranch. The IBRv2 results indicated that trace elements in seawater and sediment at station 10 (IBRv2sw = 12.45, IBRv2sd = 11.32, Figures 8, 9) had the strongest biological impacts. According to the IBRv2sw, the ranking of trace element pollution is as follows: station 7< station 9< station 5< station 2< station 8< station 4< station 1< station 12< station 11< station 3< station 10. According to the IBRv2sd, the ranking of trace element pollution is as follows: station 8< station 4< station 5< station 1< station 9< station 7< station 11< station 2< station 3< station 12< station 10. The star plots of the studied stations show varied deviation of biomarkers from the baseline, which suggests different response patterns to the pollution profiles of the trace elements. The content of certain trace elements in seawater or sediment or the four indicator species was significantly correlated with IBRv2 values (Supplementary Figures S3-S5). Moreover, significant correlations between IBRv2sw values and HI and IBRv2sd values and RI were found. These results indicated that the contamination pressure in seawater and sediment caused by trace elements was in agreement with the biomarker responses in these indicator species.
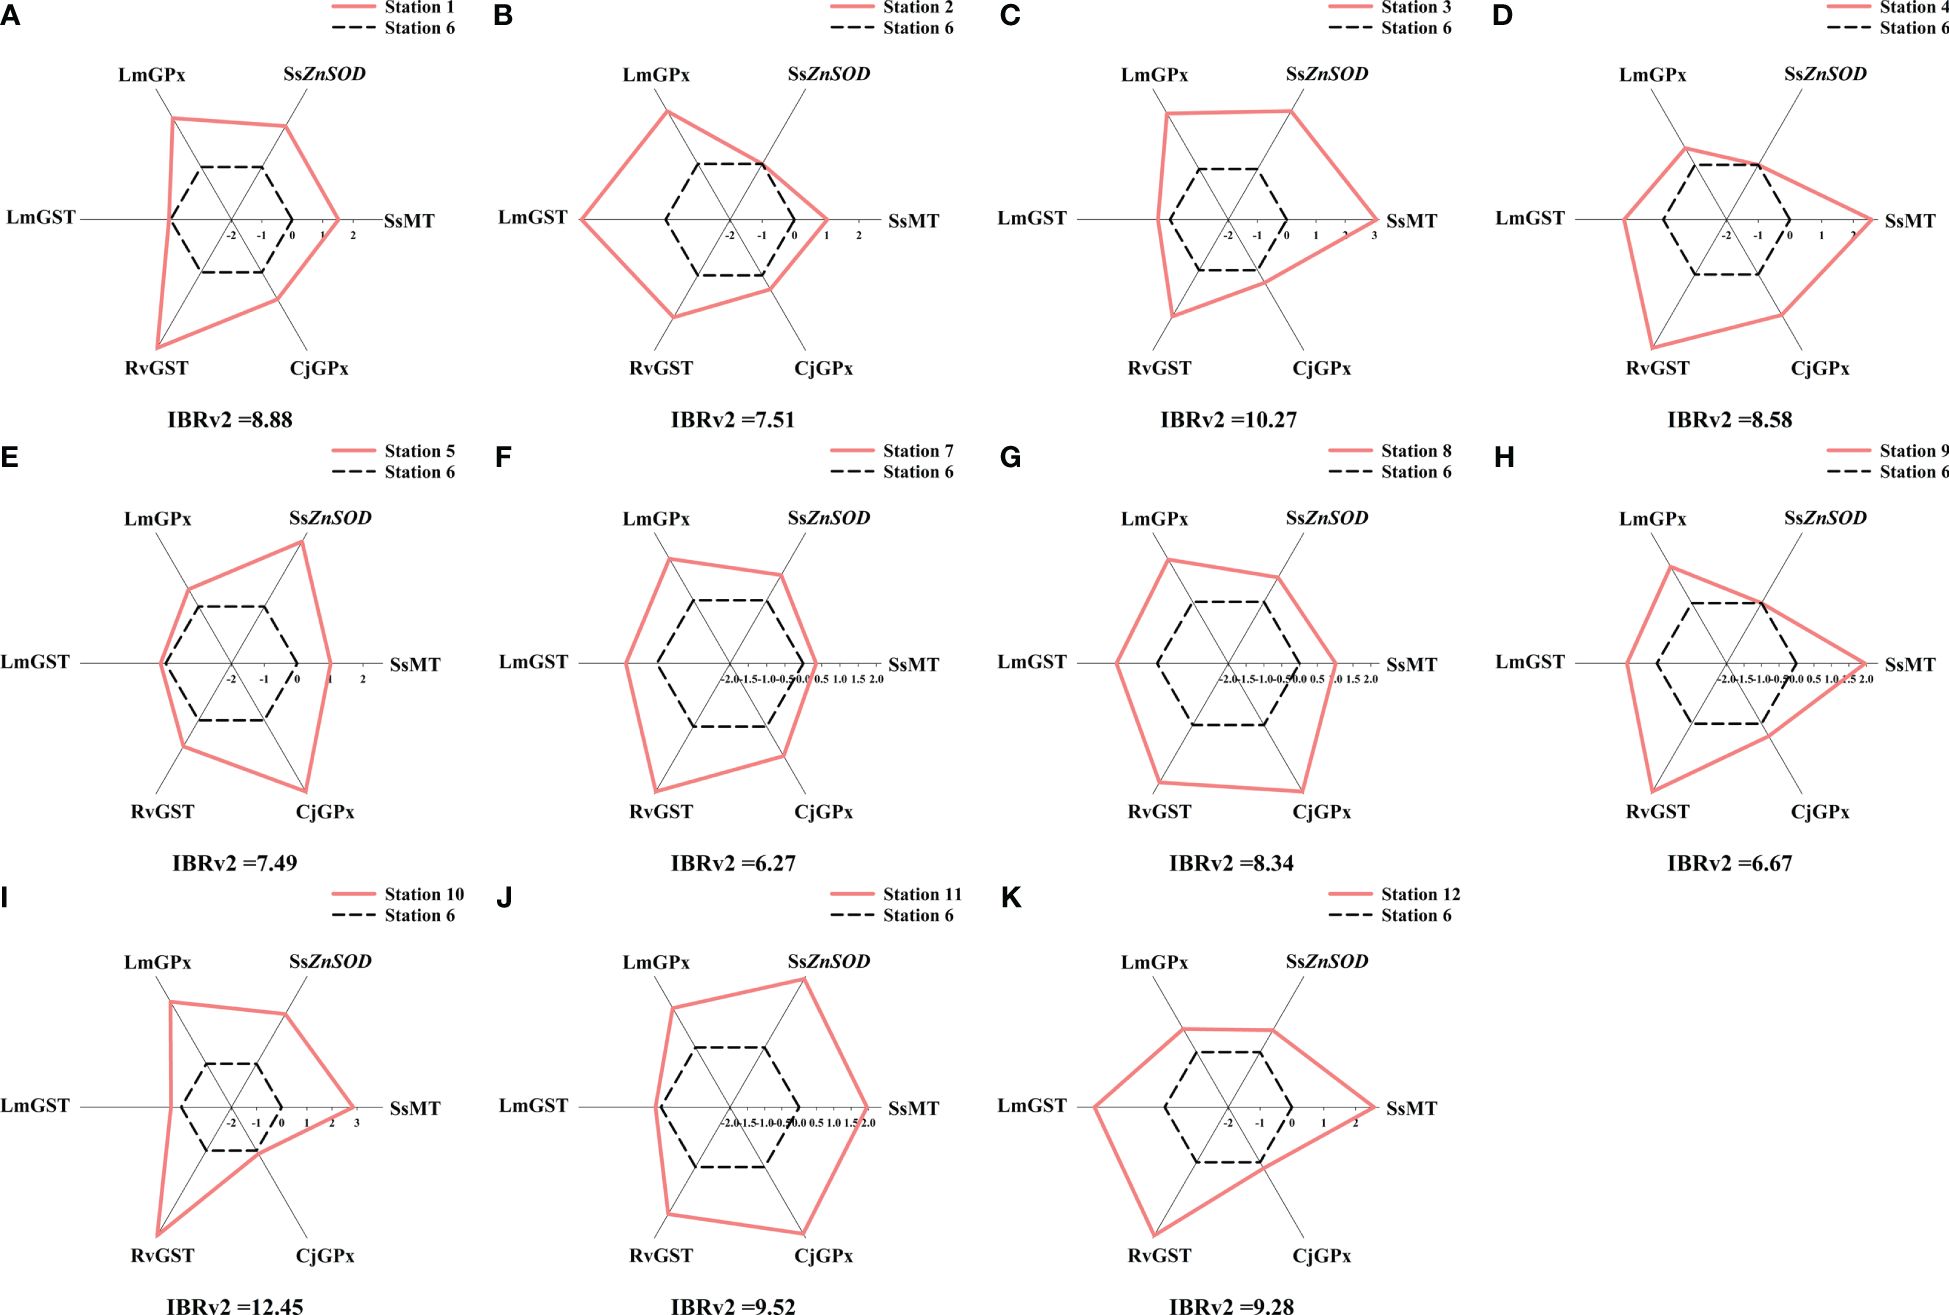
Figure 8 Star plot of the IBRv2 analysis of seawater at each station of the studied marine ranch. (A) station 1. (B) station 2. (C) station 3. (D) station 4. (E) station 5. (F) station 7. (G) station 8. (H) station 9. (I) station 10. (J) station 11. (K) station 12. The deviations of values of a certain biomarker at each station were used as the axis coordinates to describe the star plot. The six coordinates representing the six values of biomarker deviation at the reference station are connected with black dashed lines. The six coordinates representing the six values of biomarker deviation at the other stations are connected with pink solid lines.
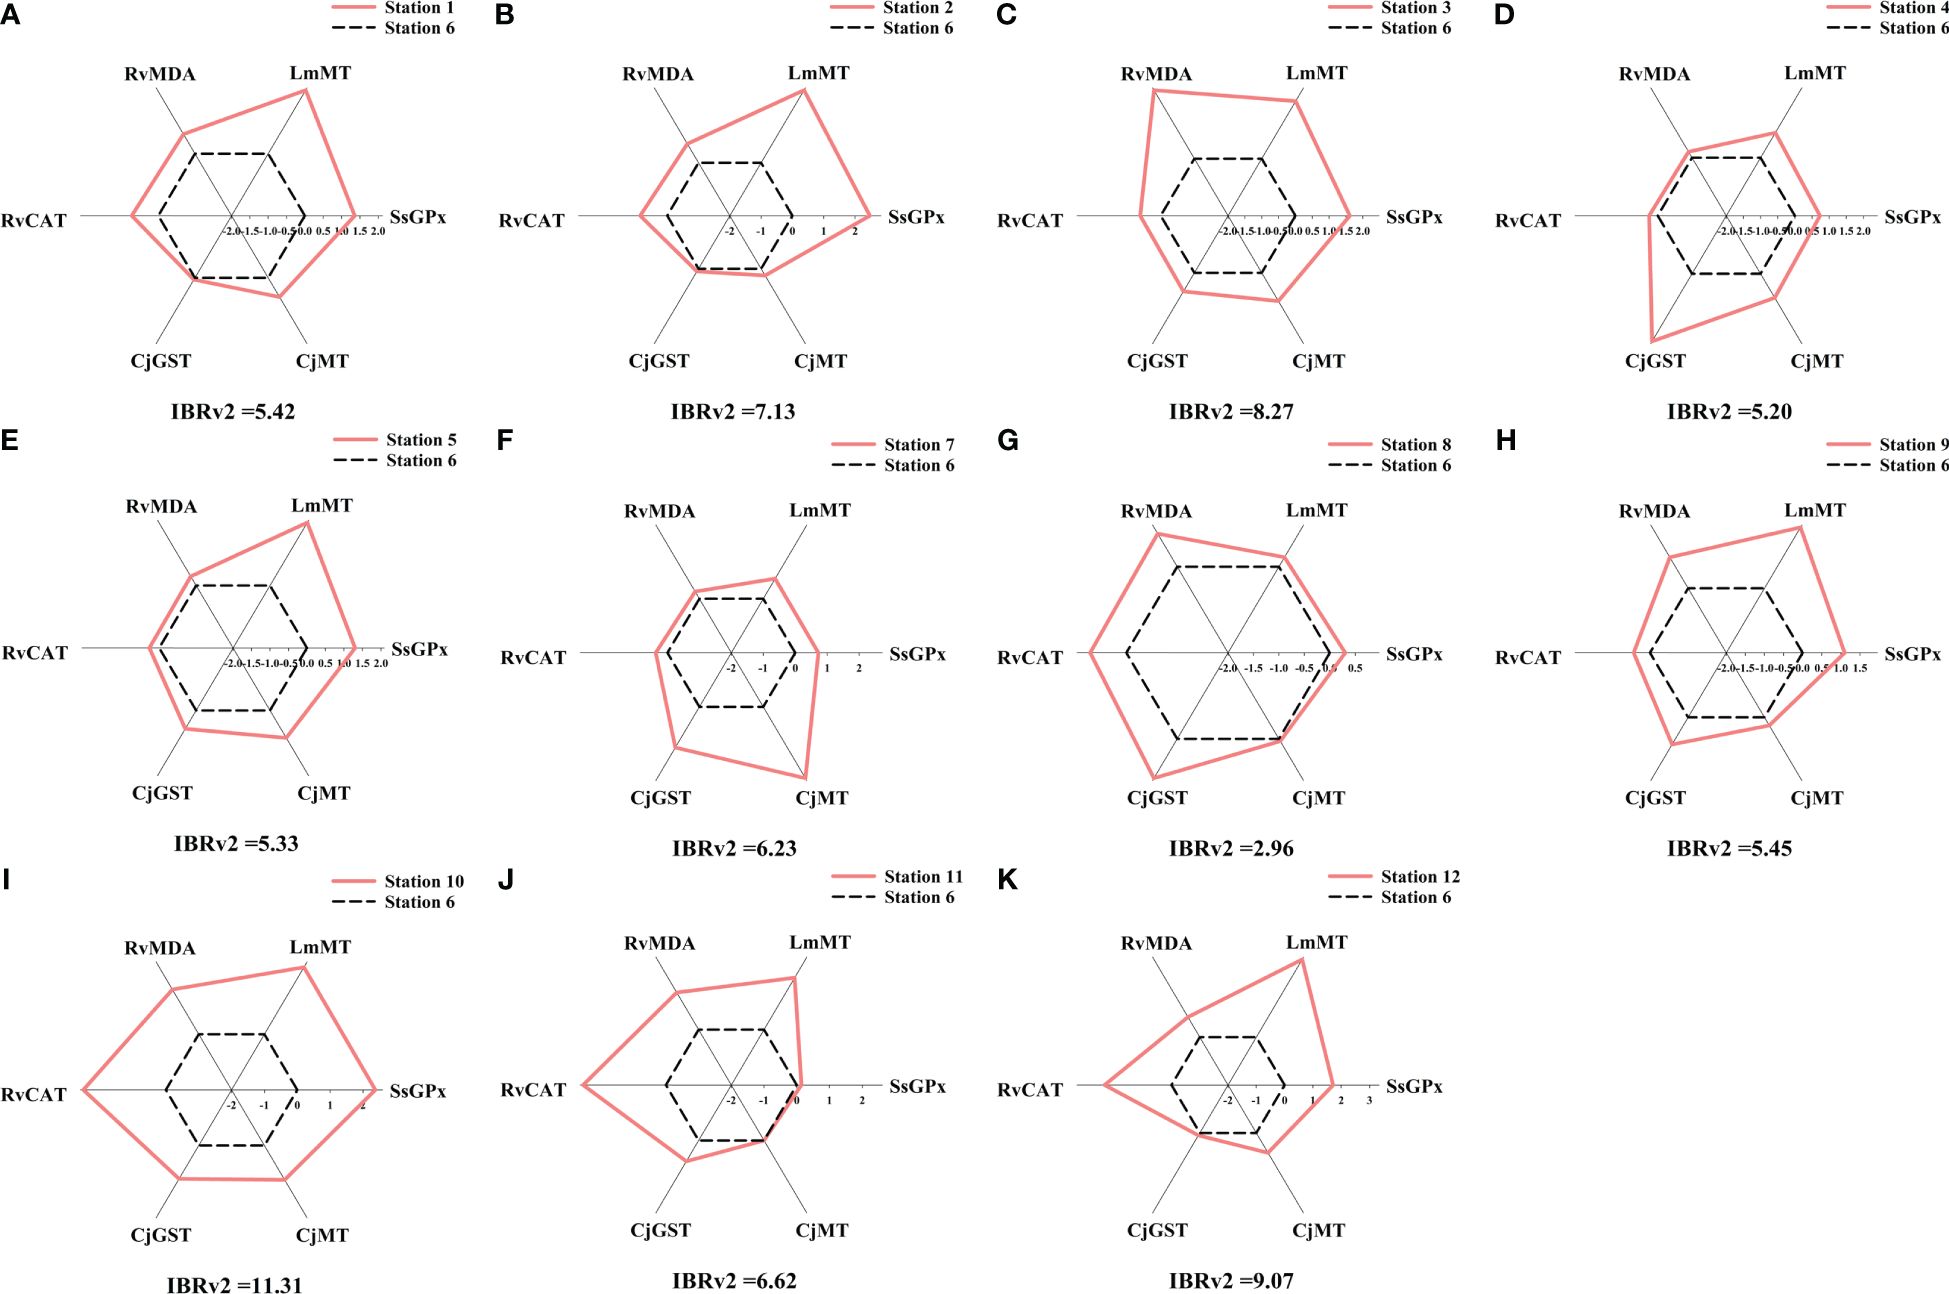
Figure 9 Star plot of the IBRv2 analysis of sediment at each station of the studied marine ranch. (A) station 1. (B) station 2. (C) station 3. (D) station 4. (E) station 5. (F) station 7. (G) station 8. (H) station 9. (I) station 10. (J) station 11. (K) station 12. The deviations of values of a certain biomarker at each station were used as the axis coordinates to describe the star plot. The six coordinates representing the six values of biomarker deviation at the reference station are connected with black dashed lines. The six coordinates representing the six values of biomarker deviation at the other stations are connected with pink solid lines.
Trace element contents in the surface seawater and sediment of the western Furong Island marine ranching area and adjacent areas were on the same order of magnitude as those along coasts around the world (Supplementary Tables S7, S8). The high accumulations of trace elements in Laizhou Bay contributed to the higher contents of some trace elements (e.g., Zn, Pb, and Cr) there compared to those reported for other coast (Lv et al., 2018). Trace element contents in the AR area and the area surrounding AR were lower than those in adjacent areas and in a 2018 investigation (Yuan et al., 2022), which indicated that AR construction improved the quality of the marine environment. A similar scenario was reported by Chen and Chen (2020).
The contents of Zn, Cu, As, Pb, and Cd in the sediment and Zn in the seawater in the offshore wind farm area were higher than those in the other areas tested in the western Furong Island marine ranch. The galvanic anodes used for corrosion protection in offshore wind farms can leak 26 metal elements, with mass fractions of Zn, Cd, and Pb, and they are considered to be one of the highest sources of metal elements emitted into the marine environment (Reese et al., 2020). Thus, we propose that the construction and operation of the offshore wind farm led to the trace element pollution of the seawater and sediment detected in our study, which is in agreement with Zaborska et al. (2017) and Kirchgeorg et al. (2018). Nevertheless, the impact of these trace element emissions is limited and weak (Wang et al., 2023). In addition, the offshore wind farm area is located relatively close to the south coast of Laizhou Bay, into which the Jiaolai, Jie, and Wei rivers flow. Coastal erosion and weathering products carried by the rivers also contributed to the high level of Cu and Zn in this area (Li et al., 2019). Xu et al. (2015) reported that high concentrations of As, Pb, and Cd were associated with human activities such as mining, smelting, and domestic sewage discharge.
Although the Cd level was relatively low in the sediment, the value of Cd was highest among the tested trace elements due to its high response factor. Therefore, prevention and control of Cd is crucial in the environment management of western the Furong Island marine ranching area.
The BAF and BASF values suggested that the indicator species could accumulate trace elements from seawater and sediment and that they had strong enrichment capacity for Cu, Zn, As, and Pb. The high BAF and BASF values of Cu, Zn, As, and Pb were predominately associated with high contents of these trace elements in seawater and sediment. Moreover, the active absorption of essential trace elements during metabolism by the organisms also contributed to the high accumulation capability of Cu and Zn, which is consistent with results of previous studies (Liu et al., 2019; Gao et al., 2021).
Living habits are thought to affect trace element enrichment in species. C. japonica and R. venosa showed stronger ability to accumulate trace elements compared to S. schlegelii and L. maculatus. C. japonica and R. venosa usually bury themselves in the sediments, where they are subjected to relatively high levels of trace elements. Similar results were found in previous studies (Zhao et al., 2012; Gao et al., 2021).
A discrepancy was observed between the environmental concentrations and tissue levels of trace elements. The situation at station 10, characterized by almost the highest environmental concentrations of trace elements yet relatively low BAF and BASF values, is particularly noteworthy. This discrepancy can be explained by considering several intrinsic and extrinsic factors that significantly influence BAF and BASF, including dietary habits, ecological needs, trace element concentrations in water and sediments, seasonal variations, physicochemical properties of water and sediments, and the tolerance and adaptability of organisms to pollutants (Dadar et al., 2016; Marques et al., 2016; Shakouri and Gheytasi, 2018; Abkenar et al., 2021).
While chemical concentrations in tissues typically correlate with environmental exposure levels (Monroy et al., 2014), organisms possess mechanisms to counteract the toxic effects through various biochemical and physiological adaptations (Hansen, 2003). Once trace elements begin to bioaccumulate in tissues, organisms often initiate multiple detoxification responses. These elements dissolve in the cytosol, predominantly forming complexes with metal-binding proteins such as MTs, or are incorporated into metal-rich granules and other insoluble forms. Notably, the MT content was also relatively high in the four indicator organisms at station 10 compared to other stations (Figures 4–7). Additionally, trace elements can be excreted from cells via adenosine triphosphate-binding cassette transporters (Hu et al., 2019). Consequently, the bioaccumulation in tissues does not always linearly correlate with environmental exposure levels, particularly at higher environmental concentrations (Cano-Rocabayera et al., 2022).
Therefore, in addition to trace element concentrations in water and sediments, the physicochemical properties of these mediums, trace element concentrations in prey, and the detoxification processes within organisms also impact bioaccumulation in tissues. This interplay results in the observed mismatch between environmental concentrations and tissue levels of trace elements in the present study. Similar scenarios were also reported in other studies (Hao et al., 2019; Cano-Rocabayera et al., 2022; Bettoso et al., 2023). A more detailed examination of the bioaccumulation process is warranted for further understanding.
MTs participate in the handling of intracellular metal levels and metal detoxification. They have been proposed as the biomarker of metal exposure, as they are the first detectable cellular sign of metal challenge (Filipović and Raspor, 2003). In our study, MT content and gene expression in the marine ranch area was generally lower than that in the adjacent area. MT content and gene expression in the four indicator species were positively correlated with levels of some trace elements in seawater and sediment. These results suggested a relationship between MT response and trace element level. MT in the four indicators could be induced by trace element exposure and confirmed its involvement in trace element homeostasis and detoxification. This finding supports previous reports of the MT response and trace element concentrations in aquatic environments conducted in fish, gammarids, and mesozooplankton as indicators (Abril et al., 2018; Mijošek et al., 2019; Strogyloudi et al., 2023).
MTs can also remove ROS via oxidation of the thiol group in cysteine and thereby protect organisms from oxidative damage induced by environmental stress. Trace elements commonly induce ROS generation and cause oxidative stress in organisms (Beg et al., 2015). Therefore, the observed MT response in the indicator species probably participated in quenching the effects of ROS resulting from trace element pollution.
MDA contents are generally considered to be the pivotal indicator of lipid peroxidation caused by oxidative stress. In our study, high MDA contents corresponded to high environmental levels of trace elements, further confirming the occurrence of oxidative stress caused by trace elements. Antioxidant enzymes also combat oxidant stress and maintain the cellular redox state. SOD dismutates superoxide radicals into hydrogen peroxide (H2O2). The neutralization of H2O2 is catalyzed by CAT, GPx, and GST. These enzymes act sequentially to resist oxidative stress. The responses of antioxidant enzymes have been reported in various aquatic organisms, such as fish, bivalves, and crustaceans (Weber et al., 2020; Yu et al., 2020; Telahigue et al., 2022) that inhabit trace element-contaminated aquatic areas. Similarly, we found that the activities and transcripts of antioxidant enzymes in the four indicator species varied among stations and were related to trace element contents. These results suggest collaboration among the enzymes to counter trace element-induced oxidative stress. Moreover, the species-specific responses of these antioxidant enzymes suggest that multiple taxa must be considered as indicators in environmental biomonitoring.
The discrepancy between contents and transcripts of MT in C. japonica, between SOD activities and MnSOD transcripts, and between activities and transcripts of CAT in S. schlegeli are noteworthy. This scenario can be explained as follows. On the one hand, there are many members of the MT family and many sub-types of SOD. We measured the gene expression of only one MT member or one SOD sub-type, whereas we measured total MT protein content and total SOD activity. On the other hand, there is a time delay between transcription and protein synthesis or induction of enzyme activity. Post-transcriptional modification, translation, and post-translational modification can all regulate protein content and enzyme activity (Desclaux-Marchand et al., 2007).
The findings from multivariate analysis revealed that the MDA content in L. maculatus and R. venosa, the ZnSOD expressions in S. schlegelii, and the MT expressions in C. japonica were influenced by the presence of Cd and As in seawater, as well as Pb, Zn, and Cd in sediment. The MT content and GST activity in L. maculatus, the GPx activity in S. schlegelii, and the SOD activity in C. japonica were impacted by Cu in seawater and Cr in sediment. The MDA content in C. japonica and the GPx activity in R. venosa were affected by As in sediment, with the exception of station 6, which exhibited a negative score for F4, indicating superior sediment conditions relative to other stations.
Contrastingly, the SOD activity in L. maculatus and the MDA content in S. schlegelii did not exhibit any correlation with the principal components, suggesting that these two biomarkers were not significantly influenced by environmental trace elements. Therefore, they were not included in the IBR selection process.
The stations generally showed positive scores across all four factors, indicating clear cause-effect relationships between environmental trace elements and biomarkers in the four indicators, with the exception of the SOD activity in L. maculatus and the MDA content in S. schlegelii.
Biomarkers reflect the pollutants’ bioavailability and also organisms’ responses to them and their ability to cope with pollutants. A single biomarker is not capable of comprehensively indicating the individual’s fitness, whereas a battery of biomarkers ranging from the molecular to the individual level can allow integrated evaluation of the toxic effects of pollutants (Catteau et al., 2022). Different biomarkers have distinct sensitivity to pollutants. Because oxidative stress occurs along with trace element accumulation in indicator species, researchers have used the combination of MTs as proteins that scavenge trace elements and antioxidant enzymes that quench oxidative stress to comprehensively assess the effects of trace elements in aquatic environments (Beg et al., 2015; Pan et al., 2022). In our study, we detected spatial differences in MT content and antioxidant enzyme activities in the four indicator species, which we attributed to variations in trace element pollution among the stations. Furthermore, as described above, biomarkers at the transcriptional level may not necessarily be more sensitive to pollutants than biomarkers at the protein level, even though transcription occurs earlier than protein synthesis. Accordingly, we recommend that researchers consider both the sensitivity and early warning functions when selecting biomarkers for evaluating the biological effects of pollutants.
The multi-species approach, which involves integrating responses and broadening the evaluation of aquatic pollutants, overcomes the shortcomings of the single-species approach, as it considers the influence of species’ habits, lifestyles, and feeding behaviors on biomarker responses. The multi-species approach has been applied in a few comprehensive assessments of water pollution or sediment pollution (Marques et al., 2016; Catteau et al., 2022; Yamamoto et al., 2023).
In our study, we chose two fish species, one crustacean species, and one gastropod species to cover various habitats, niches, feeding behaviors, and commercial importance. These four indicator species exhibited distinctive accumulation and response patterns resulting from their different foraging behaviors, pollution pathways, and detoxification abilities. Moreover, we also found that certain biomarkers in every indicator species were correlated with trace element contents in seawater and sediment. These results suggested that certain biomarkers in each indicator species were able to indicate trace element pollutions in seawater and sediment. All four of the indicator species directly contact seawater and sediment, and the seawater and sediment interact with each other. Trace elements can accumulate in sediments from seawater through various physicochemical and biological processes. On the other hand, sediment resuspension due to hydraulic disturbances may cause the release of trace elements from the sediments into the overlying seawater (Pourabadehei and Mulligan, 2016). Accordingly, trace elements in seawater and sediments affected the middle-upper water-dweller L. maculatus, the demersal fish S. schlegelii, and benthic organisms C. japonica and R. venosa. However, not every biomarker was associated with environmental trace element contents. Therefore, we used only associated biomarkers for our IBRv2 analysis to allow accurate interpretation of the results (Li et al., 2020).
The selection of biomarkers is crucial for IBRv2 assessment, and a minimum of 5–6 biomarkers should be used (Novais et al., 2014). Drawing inspiration from Broeg and Lehtonen (2006), we used only the biomarkers that were correlated with the different types of trace elements for our IBRv2 calculation to avoid overemphasizing the presence or absence of a specific trace element in the overall assessment of trace elements. In contrast to previous multi-species studies in which IBRv2 was calculated for every studied species separately (Catteau et al., 2022; Yamamoto et al., 2023), biomarkers from the four indicator species were integrated for IBRv2 calculations to achieve improved and comprehensive evaluations. We also used two sets of six biomarkers from the four indicators to assess water and sediment pollution, respectively.
We used station 6 in the AR area as the reference station because it had minor pollution levels and biomarker levels. The IBRv2 values clearly discriminated trace element pollution among stations. The different shapes of the star plots revealed the dissimilar pattern of trace element pollution. The highest IBRv2 value occurred in the area adjacent to the marine ranch, which suggested that the trace elements in that area had the strongest biological impacts. These results are consistent with the chemical assessment.
Undoubtedly, the integration of species with distinctive functional traits and biomarkers with different biological levels benefited the environmental pollution assessment. Together, our results illustrate that the multi-level and multi-species IBRv2 approach is a useful and reliable tool for assessing the trace element pollution status and biological responses in aquatic environments. Despite the different rankings of trace elements pollution at the survey stations using HI, RI, and IBR, a comprehensive analysis of these rankings revealed that the trace elements pollution in AR area and AR surrounding area was better than that in OWF area and marine ranching adjacent area. Therefore, we concluded that the construction of ARs was beneficial for improving marine trace elements pollution. The trace elements pollution in OWF area and marine ranching adjacent area were comparable, Therefore, further research and long-term environmental monitoring are necessary to properly assess the impact of OWF on the marine environment.
In this study, the four indicator species exhibited distinctive patterns of trace element accumulation and biological responses, which may be related to their habitats, niches, and feeding behaviors. The four species complemented each other in the assessment of the toxic impacts of trace elements on the whole ecosystem of the western Furong Island marine ranching area. Certain biomarkers from these indicator species were correlated with trace element levels in the seawater and sediment. The IBRv2 approach described herein integrated multi-level biomarkers from multiple species to provide a holistic description of the status of trace element pollution and the ecotoxicological effect of trace elements in the study area. In agreement with the chemical evaluation results, the IBRv2 results showed that trace elements had the strongest biological impacts in the area adjacent to the marine ranch. In contrast, trace elements in the AR area and the area surrounding the AR exhibited weak biological impacts of trace element pollution.
Our multi-biomarker and multi-species IBRv2 approach could become a common strategy for marine environmental assessment, as it is convenient for managers to use to make environmental decisions and for trace element control. The selection of target indicators and appropriate biomarkers is crucial for environmental monitoring in regional marine areas.
The original contributions presented in the study are included in the article/Supplementary Material. Further inquiries can be directed to the corresponding authors.
The animal study was approved by Science and Technology Ethics Review Committee of Ludong University. The study was conducted in accordance with the local legislation and institutional requirements.
MZL: Conceptualization, Investigation, Methodology, Writing – original draft. ZC: Formal analysis, Resources, Writing – original draft. ML: Investigation, Resources, Writing – original draft. JZ: Data curation, Methodology, Writing – original draft. BX: Data curation, Methodology, Writing – original draft. YY: Formal analysis, Visualization, Writing – original draft. XL: Investigation, Methodology, Writing – original draft. LF: Investigation, Methodology, Writing – original draft. BL: Conceptualization, Data curation, Writing – review & editing. TZ: Conceptualization, Data curation, Writing – review & editing. YF: Funding acquisition, Supervision, Writing – review & editing, Writing – original draft. FL: Investigation, Supervision, Writing – original draft, Writing – review & editing.
The author(s) declare financial support was received for the research, authorship, and/or publication of this article. This research was supported by the National Natural Science Foundation of China (grant no. 42076137) and the Natural Science Foundation of Shandong Province (grant no. ZR2020KE050).
The authors acknowledge the support of Carbon Neutrality Innovation Research Center in Ludong University. The authors would like to thank the reviewers for their valuable comments and suggestions that helped improve the quality of this manuscript.
The authors declare that the research was conducted in the absence of any commercial or financial relationships that could be construed as a potential conflict of interest.
All claims expressed in this article are solely those of the authors and do not necessarily represent those of their affiliated organizations, or those of the publisher, the editors and the reviewers. Any product that may be evaluated in this article, or claim that may be made by its manufacturer, is not guaranteed or endorsed by the publisher.
The Supplementary Material for this article can be found online at: https://www.frontiersin.org/articles/10.3389/fmars.2024.1413847/full#supplementary-material
Abkenar A. M., Yahyavi M., Esmaeili N., Rombenso A. (2021). High bioaccumulation factors and ecological risk index of Cd and Hg in Indian white shrimp, hooded oyster, brown algae, and sediment in northern coasts of the Gulf of Oman before and after a monsoon. Reg. Stud. Mar. Sci. 41, 101552. doi: 10.1016/j.rsma.2020.101552
Abril S. I. M., Costa P. G., Bianchini A. (2018). Metal accumulation and expression of genes encoding for metallothionein and copper transporters in a chronically exposed wild population of the fish Hyphessobrycon luetkenii. Comp. Biochem. Physiol. C Toxicol. Pharmacol. 211, 25–31. doi: 10.1016/j.cbpc.2018.05.008
Astani M., Moradi A. M., Mostafavi P. G. (2023). Using biomarkers to assess the toxicity of environmental concentrations of trace elements to the marine gastropod Thais mutabilis. Reg. Stud. Mar. Sci. 59, 102803. doi: 10.1016/j.rsma.2022.102803
Beg M. U., Al–Jandal N., Al-Subiai S., Karam Q., Husain S., Butt S. A., et al. (2015). Metallothionein, oxidative stress and trace metals in gills and liver of demersal and pelagic fish species from Kuwaits’ marine area. Mar. Pollut. Bull. 100, 662–672. doi: 10.1016/j.marpolbul.2015.07.058
Benito D., Guls H. D., Halldorsson H. P., Ciesielski T. M., Izagirre U., Lekube X., et al. (2023). Integrated assessment of biological responses to pollution in wild mussels (Mytilus edulis) from subarctic and arctic areas in the Norwegian sea. Environ. Pollut. 336, 122454. doi: 10.1016/j.envpol.2023.122454
Bettoso N., Pittaluga F., Predonzani S., Zanello A., Acquavita A. (2023). Mercury levels in sediment, water and selected organisms collected in a coastal contaminated environment: The Marano and Grado Lagoon (Northern Adriatic Sea, Italy). Appl. Sci. 13, 3064. doi: 10.3390/app13053064
Bouzahouane H., Kouki R., Amri S., Barour C., Sleimi N., Ouali K. (2024). Investigating seasonal metal impact on Stramonita haemastoma gastropod along the Algerian East Coast: Understanding through various pollution indicators. Mar. Pollut. Bull. 199, 116006. doi: 10.1016/j.marpolbul.2023.116006
Broeg K., Lehtonen K. K. (2006). Indices for the assessment of environmental pollution of the Baltic Sea coasts: integrated assessment of a multi-biomarker approach. Mar. Pollut. Bull. 53, 508–522. doi: 10.1016/j.marpolbul.2006.02.004
Cano-Rocabayera O., Monroy M., Moncaleano-Niño Á.M., Gómez-Cubillos M. C., Ahrens M. J. (2022). An integrated biomarker approach: Non-monotonic responses to cadmium exposure in the suckermouth catfish Hypostomus plecostomus. Aquat. Toxicol. 248, 106193. doi: 10.1016/j.aquatox.2022.106193
Catteau A., Porcher J. M., Bado-Nilles A., Bonnard I., Bonnard M., Chaumot A., et al. (2022). Interest of a multispecies approach in active biomonitoring: Application in the Meuse watershed. Sci. Total. Environ. 808, 152148. doi: 10.1016/j.scitotenv.2021.152148
Chalghmi H., Bourdineaud J. P., Chbani I., Haouas Z., Bouzid S., Er-Raioui H., et al. (2020). Occurrence, sources and effects of polycyclic aromatic hydrocarbons in the Tunis lagoon, Tunisia: an integrated approach using multi-level biological responses in Ruditapes decussatus. Environ. Sci. Pollut. Res. Int. 27, 3661–3674. doi: 10.1007/s11356-019-04220-3
Chapman P. M. (1990). The sediment quality triad approach to determining pollution-induced degradation. Sci. Total. Environ. 97/98, 815–825. doi: 10.1016/0048-9697(90)90277-2
Chen Q., Chen P. (2020). Changes in the trace elements and petroleum hydrocarbon contents in seawater and surface sediment in the year following artificial reef construction in the Pearl River Estuary, China. Environ. Sci. Pollut. Res. Int. 27, 6009–6021. doi: 10.1007/s11356-019-07406-x
Choueri R. B., Cesar A., Abessa D. M., Torres R. J., Riba I., Pereira C. D., et al. (2010). Harmonised framework for ecological risk assessment of sediments from ports and estuarine zones of North and South Atlantic. Ecotoxicology 19, 678–696. doi: 10.1007/s10646-009-0442-y
Choueri R. B., Cesar A., Torres R. J., Abessa D. M., Morais R. D., Pereira C. D., et al. (2009). Integrated sediment quality assessment in Paranaguá Estuarine System, Southern Brazil. Ecotoxicol. Environ. Saf. 72, 1824–1831. doi: 10.1016/j.ecoenv.2008.12.005
Dadar M., Adel M., Ferrante M., Saravi H. N., Copat C., Oliveri Conti G. (2016). Potential risk assessment of trace metals accumulation in food, water and edible tissue of rainbow trout (Oncorhynchus mykiss) farmed in Haraz River, northern Iran. Toxin. Rev. 35, 141–146. doi: 10.1080/15569543.2016.1217023
Desclaux-Marchand C., Paul-Pont I., Gonzalez P., Baudrimont M., de Montaudouin X. (2007). Metallothionein gene identification and expression in the cockle (Cerastoderma edule) under parasitism (trematodes) and cadmium contaminations. Aquat. Living. Resour. 20, 43–49. doi: 10.1051/alr:2007014
Desforges J. P., Mikkelsen B., Dam M., Riget F., Sveegaard S., Sonne C., et al. (2021). Mercury and neurochemical biomarkers in multiple brain regions of five Arctic marine mammals. Neurotoxicology 84, 136–145. doi: 10.1016/j.neuro.2021.03.006
Duarte I. A., Reis-Santos P., Franca S., Cabral H., Fonseca V. F. (2017). Biomarker responses to environmental contamination in estuaries: A comparative multi-taxa approach. Aquat. Toxicol. 189, 31–41. doi: 10.1016/j.aquatox.2017.05.010
Fang Y., Yang H., Wang T., Liu B., Zhao H., Chen M. (2010). Metallothionein and superoxide dismutase responses to sublethal cadmium exposure in the clam Mactra veneriformis. Comp. Biochem. Physiol. C Toxicol. Pharmacol. 151, 325–333. doi: 10.1016/j.cbpc.2009.12.005
Filipović V., Raspor B. (2003). Metallothionein and metal levels in cytosol of liver, kidney and brain in relation to growth parameters of Mullus surmuletus and Liza aurata from the Eastern Adriatic Sea. Water. Res. 37, 3253–3262. doi: 10.1016/S0043-1354(03)00162-3
Gao Y., Qiao Y., Xu Y., Zhu L., Feng J. (2021). Assessment of the transfer of trace elements in seawater, sediment, biota samples and determination the baseline tissue concentrations of metals in marine organisms. Environ. Sci. Pollut. Res. Int. 28, 28764–28776. doi: 10.1007/s11356-021-12650-1
General Administration of Quality Supervision, Inspection and Quarantine of the People’s Republic of China (2002). GB 18668–2002 Marine Sediment Quality (Beijing: Standards Press of China).
General Administration of Quality Supervision, Inspection and Quarantine of the People’s Republic of China, China National Standardization Administration (2007a). GB/T 12763–2007 Specifications for Oceanographic Survey (Beijing: Standards Press of China).
General Administration of Quality Supervision, Inspection and Quarantine of the People’s Republic of China, China National Standardization Administration (2007b). GB 17378–2007 The Specification for Marine Monitoring (Beijing: Standards Press of China).
Håkanson L. (1980). An ecological risk index for aquatic pollution control. A sedimentological approach. Water Res. (Amsterdam: Elsevier) 14, 975–1001. doi: 10.1016/0043–1354(80)90143–8
Hansen P. D. (2003). “Chapter 6 biomarkers,” in Trace metals and other contaminants in the environment, (Amsterdam, Netherlands: Elsevier) 203–220. doi: 10.1016/s0927–5215(03)80136–4
Hao Z., Chen L., Wang C., Zou X., Zheng F., Feng W., et al. (2019). Heavy metal distribution and bioaccumulation ability in marine organisms from coastal regions of Hainan and Zhoushan, China. Chemosphere 226, 340–350. doi: 10.1016/j.chemosphere.2019.03.132
Hu J., Tian J., Zhang F., Wang H., Yin J. (2019). Pxr- and Nrf2- mediated induction of ABC transporters by heavy metal ions in zebrafish embryos. Environ. Pollut. 255, 113329. doi: 10.1016/j.envpol.2019.113329
Huang H., Li Y., Zheng X., Wang Z., Wang Z., Cheng X. (2022). Nutritional value and bioaccumulation of trace elements in nine commercial fish species from Dachen Fishing Ground, East China Sea. Sci. Rep. 12, 6927. doi: 10.1038/s41598–022-10975–6
Ji R., Pan L., Guo R., Zheng L., Zhang M. (2019). Using multi-integrated biomarker indexes approach to assess marine quality and health status of marine organism: a case study of Ruditapes philippinarum in Laizhou Bay, China. Environ. Sci. Pollut. Res. Int. 26, 9916–9930. doi: 10.1007/s11356-018-04082-1
Kim J. H., Kang J. C. (2017). Effects of sub-chronic exposure to lead (Pb) and ascorbic acid in juvenile rockfish: Antioxidant responses, MT gene expression, and neurotransmitters. Chemosphere 171, 520–527. doi: 10.1016/j.chemosphere.2016.12.094
Kirchgeorg T., Weinberg I., Hornig M., Baier R., Schmid M. J., Brockmeyer B. (2018). Emissions from corrosion protection systems of offshore wind farms: Evaluation of the potential impact on the marine environment. Mar. Pollut. Bull. 136, 257–268. doi: 10.1016/j.marpolbul.2018.08.058
Lazǎr N. N., Simionov I. A., Petrea S. M., Iticescu C., Georgescu P. L., Dima F., et al. (2024). The influence of climate changes on trace elements accumulation in Alosa immaculata from the Danube River Basin. Mar. Pollut. Bull. 200, 116145. doi: 10.1016/j.marpolbul.2024.116145
Lebrun J. D., Gismondi E. (2020). Behavioural and biochemical alterations in gammarids as induced by chronic metallic exposures (Cd, Cu and Pb): Implications for freshwater biomonitoring. Chemosphere 257, 127253. doi: 10.1016/j.chemosphere.2020.127253
Li X., Chi W., Tian H., Zhang Y., Zhu Z. (2019). Probabilistic ecological risk assessment of trace elements in western Laizhou Bay, Shandong Province, China. PLoS. One 14, e0213011. doi: 10.1371/journal.pone.0213011
Li Z., Pan L., Guo R., Cao Y., Sun J. (2020). A verification of correlation between chemical monitoring and multi-biomarker approach using clam Ruditapes philippinarum and scallop Chlamys farreri to assess the impact of pollution in Shandong coastal area of China. Mar. Pollut. Bull. 155, 111155. doi: 10.1016/j.marpolbul.2020.111155
Lin Y., Liu Q., Meng F., Lin Y., Du Y. (2018). Integrated toxicity evaluation of metals in sediments of Jiaozhou Bay (China): Based on biomarkers responses in clam Ruditapes philippinarum exposed to sediment extracts. Mar. Pollut. Bull. 131, 180–190. doi: 10.1016/j.marpolbul.2018.04.024
Liu S. A., Liu P. P., Lv Y., Wang Z. Z., Dai J. G. (2019). Cu and Zn isotope fractionation during oceanic alteration: Implications for Oceanic Cu and Zn cycles. Geochim. Cosmochim. Ac 257, 191–205. doi: 10.1016/j.gca.2019.04.026
Liu M., Xu H., Zou Q., Fang F., Sun S., Zhao Y., et al. (2023). Assessment of trace element pollution in Laizhou Bay (China) using the ecological risk index and the integrated biomarker response of the goby Acanthogobius ommaturus. J. Oceanol. Limnol. 41, 1519–1536. doi: 10.1007/s00343-022-1387-8
Livak K. J., Schmittgen T. D. (2001). Analysis of relative gene expression data using real-time quantitative PCR and the 2 (-Delta C(T)) Method. Methods 25, 402–408. doi: 10.1006/meth.2001.1262
Lv J., Xia Q., Yan T., Zhang M., Wang Z., Zhu L. (2018). Identifying the sources, spatial distributions, and pollution status of trace elements in soils from the southern coast of Laizhou Bay, eastern China. Hum. Ecol. Risk. Assess. 25, 1953–1967. doi: 10.1080/10807039.2018.1478275
Mao H., Tan F. Q., Wang D. H., Zhu J. Q., Zhou H., Yang W. X. (2012). Expression and function analysis of metallothionein in the testis of stone crab Charybdis japonica exposed to cadmium. Aquat. Toxicol. 124–125, 11–21. doi: 10.1016/j.aquatox.2012.07.005
Marques A., Pilo D., Araujo O., Pereira F., Guilherme S., Carvalho S., et al. (2016). Propensity to metal accumulation and oxidative stress responses of two benthic species (Cerastoderma edule and Nephtys hombergii): are tolerance processes limiting their responsiveness? Ecotoxicology 25, 664–676. doi: 10.1007/s10646-016-1625-y
Mijošek T., Filipović Marijić V., Dragun Z., Ivanković D., Krasnići N., Erk M., et al. (2019). Comparison of electrochemically determined metallothionein concentrations in wild freshwater salmon fish and gammarids and their relation to total and cytosolic metal levels. Ecol. Indic. 105, 188–198. doi: 10.1016/j.ecolind.2019.05.069
Monroy M., Maceda-Veiga A., de Sostoa A. (2014). Metal concentration in water, sediment and four fish species from Lake Titicaca reveals a large-scale environmental concern. Sci. Total. Environ. 487, 233–244. doi: 10.1016/j.scitotenv.2014.03.134
Novais S. C., Gomes N. C., Soares A. M., Amorim M. J. (2014). Antioxidant and neurotoxicity markers in the model organism Enchytraeus albidus (Oligochaeta): mechanisms of response to atrazine, dimethoate and carbendazim. Ecotoxicology 23, 1220–1233. doi: 10.1007/s10646-014-1265-z
Pan Y., Tian L., Zhao Q., Tao Z., Yang J., Zhou Y., et al. (2022). Evaluation of the acute toxic effects of crude oil on intertidal mudskipper (Boleophthalmus pectinirostris) based on antioxidant enzyme activity and the integrated biomarker response. Environ. Pollut. 292, 118341. doi: 10.1016/j.envpol.2021.118341
Pourabadehei M., Mulligan C. N. (2016). Resuspension of sediment, a new approach for remediation of contaminated sediment. Environ. Pollut. 213, 63–75. doi: 10.1016/j.envpol.2016.01.082
Qin M., Sun M. (2021). Effects of marine ranching policies on the ecological efficiency of marine ranching—Based on 25 marine ranching in Shandong Province. Mar. Policy 134, 104788. doi: 10.1016/j.marpol.2021.104788
Reese A., Voigt N., Zimmermann T., Irrgeher J., Profrock D. (2020). Characterization of alloying components in galvanic anodes as potential environmental tracers for trace element emissions from offshore wind structures. Chemosphere 257, 127182. doi: 10.1016/j.chemosphere.2020.127182
Ryabushko V. I., Toichkin A. M., Kapranov S. V. (2022). Trace elements and arsenic in soft tissues of the gastropod Rapana venosa (Valenciennes 1846) collected on a mollusk farm off Sevastopol (Southwestern Crimea, Black Sea): Assessing human health risk and locating regional contamination areas. Bull. Environ. Contam. Toxicol. 108, 1039–1045. doi: 10.1007/s00128-021-03451-w
Sanchez W., Burgeot T., Porcher J. M. (2013). A novel “Integrated Biomarker Response” calculation based on reference deviation concept. Environ. Sci. Pollut. Res. Int. 20, 2721–2725. doi: 10.1007/s11356-012-1359-1
Scheuhammer A. M., Cherian M. G. (1986). Quantification of metallothioneins by a silver-saturation method. Toxicol. Appl. Pharmacol. 82, 417–425. doi: 10.1016/0041-008X(86)90277-2
Shakouri A., Gheytasi H. (2018). Bioaccumulation of heavy metals in oyster (Saccostrea cucullata) from Chabahar bay coast in Oman sea: Regional, seasonal and size-dependent variations. Mar. Pollut. Bull. 126, 323–329. doi: 10.1016/j.marpolbul.2017.11.012
State Environmental Protection Administration of the People’s Republic of China (1997). GB 3097–1997 Marine Water Quality Standard (Beijing: China Environmental Press).
Strogyloudi E., Campillo J. A., Zervoudaki S., Kontoyiannis H., Christou E. D., Psarra S. (2023). Metal and metallothionein concentrations in mesozooplankton from an oligotrophic offshore area in the eastern Mediterranean Sea (Cretan Passage/Levantine Sea). Mar. Pollut. Bull. 194, 115370. doi: 10.1016/j.marpolbul.2023.115370
Szefer P., Ali A., Ba-Haroon A., Rajeh A., Gełdon J., Nabrzyski M. (1999). Distribution and relationships of selected trace metals in molluscs and associated sediments from the Gulf of Aden, Yemen. Environ. Pollut. 106, 299–314. doi: 10.1016/S0269-7491(99)00108-6
Telahigue K., Rabeh I., Chouba L., Mdaini Z., El Cafsi M., Mhadhbi L., et al. (2022). Assessment of the trace element levels and biomarker responses in the smooth scallop Flexopecten glaber from a heavily urbanized Mediterranean lagoon (Bizerte lagoon). Environ. Monit. Assess. 194, 397. doi: 10.1007/s10661-022-10071-2
Usero J., Morillo J., Gracia I. (2005). Trace element concentrations in molluscs from the Atlantic coast of southern Spain. Chemosphere 59, 1175–1181. doi: 10.1016/j.chemosphere.2004.11.089
Wang T., Ru X., Deng B., Zhang C., Wang X., Yang B., et al. (2023). Evidence that offshore wind farms might affect marine sediment quality and microbial communities. Sci. Total. Environ. 856, 158782. doi: 10.1016/j.scitotenv.2022.158782
Weber A. A., Sales C. F., de Souza Faria F., Melo R. M. C., Bazzoli N., Rizzo E. (2020). Effects of metal contamination on liver in two fish species from a highly impacted neotropical river: A case study of the Fundão dam, Brazil. Ecotoxicol. Environ. Saf. 190, 110165. doi: 10.1016/j.ecoenv.2020.110165
Wilking L. E., Dillon K. S., Rakocinski C. F. (2023). Artificial reef biofouling community impacts on ecosystem metabolism and biogeochemical cycling in estuarine waters of the northern gulf of Mexico. Estuar. Coast. Shelf. S. 295, 108555. doi: 10.1016/j.ecss.2023.108555
Xu G., Liu J., Pei S., Gao M., Hu G., Kong X. (2015). Sediment properties and trace metal pollution assessment in surface sediments of the Laizhou Bay, China. Environ. Sci. Pollut. Res. Int. 22, 11634–11647. doi: 10.1007/s11356-015-4393-y
Yamamoto F. Y., Onishi K., Ralha T. R., Silva L. F. O., Deda B., Pessali T. Y. C., et al. (2023). Earlier biomarkers in fish evidencing stress responses to metal and organic pollution along the Doce River Basin. Environ. Pollut. 329, 121720. doi: 10.1016/j.envpol.2023.121720
Yang X., Lin C., Song X., Xu M., Yang H. (2019). Effects of artificial reefs on the meiofaunal community and benthic environment – A case study in Bohai Sea, China. Mar. Pollut. Bull. 140, 179–187. doi: 10.1016/j.marpolbul.2018.12.031
Yang Y., Wang M., Yu X., Wei J., Wu S., Wu C., et al. (2023). Assessment of toxic metal pollution in Yueqing Bay and the extent of metal-induced oxidative stress in Tegillarca granosa raised in this water. Mar. Pollut. Bull. 194, 115444. doi: 10.1016/j.marpolbul.2023.115444
Yu D., Peng X., Ji C., Li F., Wu H. (2020). Metal pollution and its biological effects in swimming crab Portunus trituberculatus by NMR-based metabolomics. Mar. Pollut. Bull. 157, 111307. doi: 10.1016/j.marpolbul.2020.111307
Yuan Y., Feng J., Xian W., Zhang H. (2022). Analysis of the ecosystem characteristics and ecological carrying capacity of the main commercial fish in the artificial reef ecosystem in Laizhou Bay using the ecopath model. Sustainability 14, 13933. doi: 10.3390/su142113933
Zaborska A., Kosakowska A., Bełdowski J., Bełdowska M., Szubska M., Walkusz-Miotk J., et al. (2017). The distribution of trace elements and 137 Cs in the central part of the Polish maritime zone (Baltic Sea) – the area selected for wind farm acquisition. Estuar. Coast. Shelf. S 198, 471–481. doi: 10.1016/j.ecss.2016.12.007
Zhao S., Feng C., Quan W., Chen X., Niu J., Shen Z. (2012). Role of living environments in the accumulation characteristics of trace elements in fishes and crabs in the Yangtze River Estuary, China. Mar. Pollut. Bull. 64, 1163–1171. doi: 10.1016/j.marpolbul.2012.03.023
Keywords: biomarker, trace element, fish, crustacean, gastropod, IBRv2
Citation: Li M, Chen Z, Li M, Zhang J, Xu B, Yang Y, Li X, Fan L, Liu B, Zheng T, Fang Y and Li F (2024) Integrated assessment of trace elements in a marine ranching area based on multi-species and multi-level biomarkers: a case study in China’s national-level marine ranching demonstration area. Front. Mar. Sci. 11:1413847. doi: 10.3389/fmars.2024.1413847
Received: 11 April 2024; Accepted: 05 June 2024;
Published: 25 June 2024.
Edited by:
Rachel Ann Hauser-Davis, Oswaldo Cruz Foundation (Fiocruz), BrazilReviewed by:
Rodrigo Choueri, Federal University of São Paulo, BrazilCopyright © 2024 Li, Chen, Li, Zhang, Xu, Yang, Li, Fan, Liu, Zheng, Fang and Li. This is an open-access article distributed under the terms of the Creative Commons Attribution License (CC BY). The use, distribution or reproduction in other forums is permitted, provided the original author(s) and the copyright owner(s) are credited and that the original publication in this journal is cited, in accordance with accepted academic practice. No use, distribution or reproduction is permitted which does not comply with these terms.
*Correspondence: Yan Fang, Zmx5MTI2ODlAMTYzLmNvbQ==; Fan Li, ZmlzaGVyeS5saWZhbkBob3RtYWlsLmNvbQ==
†These authors have contributed equally to this work and share first authorship
Disclaimer: All claims expressed in this article are solely those of the authors and do not necessarily represent those of their affiliated organizations, or those of the publisher, the editors and the reviewers. Any product that may be evaluated in this article or claim that may be made by its manufacturer is not guaranteed or endorsed by the publisher.
Research integrity at Frontiers
Learn more about the work of our research integrity team to safeguard the quality of each article we publish.