 Hao Wang1
 Kan Wang
94% of researchers rate our articles as excellent or good
Learn more about the work of our research integrity team to safeguard the quality of each article we publish.
Find out more
ORIGINAL RESEARCH article
Front. Mar. Sci., 04 July 2024
Sec. Ocean Solutions
Volume 11 - 2024 | https://doi.org/10.3389/fmars.2024.1413678
Green hydrogen is an important future energy source, which offers a vast potential to implement the decarbonization of the marine sector and advance broad shift to clean-energy alternatives globally. There are various advantages of offshore floating photovoltaics (FPVs) technology for hydrogen production; however, hydrogen storage in FPVs-based hydrogen production system faces several challenges. It is found that the major barrier concerning the system under investigation is related to safety. The current study aims to present an applicable offshore FPVs-based hydrogen production system, which involves both the FPV section and the hydrogen production section based on a project in China. A numerical 3D model is performed to investigate the characteristics of accidental damage through potential hydrogen storage device failure during system operation. The hydrogen release process of an FPVs-based hydrogen production system is presented with different offshore wind conditions, and the parameters for understanding the motion state and hydrogen release mode of hydrogen are also analyzed. The study further explores the dynamic development of hydrogen dispersion from a hydrogen production platform, including a momentum-dominated region, a horizontal spreading region, and a vertical buoyancy region. In addition, the influence of hydrogen explosive flame on thermal damage evaluation is illustrated, and thermal hazards under different offshore wind conditions are also discussed. The current study contributes to a better understanding of failure analysis of the FPVs–hydrogen production system and elaborates on damage evolution of hydrogen storage integrated with the system. The study also concentrates on marine environmental synergistic limits considering thermally damaged mechanical properties.
Green hydrogen, obtained sustainably from renewable energy sources, is becoming a vital pillar of the defossilization of global energy industry. Hydrogen offers a vast potential to advance the decarbonization of the marine sector and support the broad shift to clean-energy alternatives worldwide. Green hydrogen produced from pure water with renewable energy is the lowest-emission hydrogen. For countries like China, the large-scale production of green hydrogen already presents a challenge due to such factors as the competition for land use. For example, the hydrogen production at sea with an offshore floating photovoltaics (FPVs) system is an appropriate option. Offshore FPVs have a significant role in the energy industry, due to the provision of a proper environment to grow quality products even in renewable production (Anifantis et al., 2017). Developing urbanization further increases the demand for energy, and the green hydrogen becomes more popular in the energy industry. Currently, the electrolysis method produces hydrogen with zero carbon emissions since it depends on fresh water, which is more applicable at a small scale using renewable energy sources to produce hydrogen (Benghanem et al., 2024). The fresh water for the PEM electrolyzer is obtained from the desalinization of seawater using the waste heat generated by the electrolysis process. An FPVs-based hydrogen production platform, integrating solar PV with seawater splitting units for producing green hydrogen, is the preferred technology for the offshore environment. However, compressed hydrogen storage in the FPVs-based hydrogen production system faces several challenges, and it is found that the major barriers related to technologies under investigation are related to safety (Abdelkareem et al., 2023; Wang et al., 2024a).
Safety of the offshore FPV systems is crucial to ensuring the long-term lifetime of these systems. Meanwhile, the stability of FPV modules is adversely affected by the offshore environment. Many studies have been carried out to report the performance relating with design and structure. Ravichandran conducted a comparison between the performance of dams with and without adding FPVs in terms of evaporation rate and total produced energy (Ravichandran et al., 2021). This study indicated that the operational safety and maintenance of the existing system are divided into small capacities. Bugeja had investigated the effect of wave response motion on the insolation on offshore FPVs, which assessed the impact of wave response motion of floating structure on the incident of FPV modules (Bugeja et al., 2021). Xu presented a nonlinear fluid–structure interaction of free surface waves with large-scale polymer offshore FPVs (Xu and Wellens, 2022), in which the nonlinear solution provided the expressions of first-order waves and second-order waves and dispersion relation in closed forms. Golroodbari indicated the significant difference of wind behavior in the location, which showed that dynamic albedo should be used in performance evaluations of FPVs (Golroodbari and Sark, 2022). Offshore FPVs emergence is driven by a lack of available land and the immense decarburization targets. It was found that the marine environmental impacts can be expected from offshore FPVs (Vlaswinkel et al., 2023) and the interaction at future demonstrations of offshore FPVs with marine environment. Magkouris presented a boundary element method, which analyzed the floating structure carrying FPVs on deck (Magkouris et al., 2023). It indicated that safety in the offshore region necessitates the construction of resilient FPVs that can endure the wave and wind loads as well as degradation factors of the marine environment. Mannino evaluated the influence of marine environment on the degradation trend of FPV modules, which indicated that a greater degradation of FPVs occurred during the warmer months, in both offshore and onshore environments (Mannino et al., 2023). Song conducted a hydrodynamics-based structural response analysis of frames for multi-connected offshore FPVs and found the fluctuation of internal forces in the frame related to safety (Song et al., 2023). FPVs’ sector took advantage from offshore sectors to define the most appropriate solutions in terms of safety and savings in operations. Given the costs related to electrical system, two items should be considered (Ghigo et al., 2022). The balance of FPVs system (e.g., cabling, safety system, grid connection, and monitoring), and the marine cable connecting the power plant to coast (Li et al., 2023). Yan presented a hydrodynamic analysis of FPVs multi-body platforms with varying connector boundary conditions, which focused on coupling dynamic response analysis due to hinged connectors (Yan et al., 2023). The potential for failure at hinged joints under long-term load was found to be a critical point. Jiang carried out 1:60 scaled experiment subject to different conditions of waves (Jiang et al., 2023). The environmental factors including wave and wind effects have been considered for safety to structural design of FPVs system in terms of accidental state. Abubakar proposed an alternative tool, which can enhance the resolution of image classification for issues involving risk detection in the FPVs system (Abubakar et al., 2023). This tool was capable of detecting different types of faults in FPVs and inverters, leading to a solution for enhancing the performance and reliability of an offshore FPVs system. Peng presented a dynamic fusion model, which was used for analyzing the output characteristic of FPVs considering motion and environmental factors (Peng et al., 2023). This study showed that the accuracy of fusion model was over 98.7%, and the output efficiency of FPVs was approximately 94.2%. Bi conducted a numerical model to simulate the offshore FPVs system concerning modules connected in series. This study validated the feasibility of hybrid offshore FPVs system, which provided structure safety (Bi and Law, 2023). Rodríguez-Benítez revealed the equivalent effective energy density without electrolytic capacitors, and enhanced performance and durability in the FPVs system, which indicated that the stacked switched capacitors could be a power-decoupling tool for FPVs’ multi-stage connection application (Rodríguez-Benítez et al., 2023). Abdo carried out different parameter tests (Abdo et al., 2023), providing the effect of D-limonene in the detachment of ethylene vinyl acetate and the separation of back sheet layer of FPV modules. Liu presented a shading effect of an FPVs power station on the marine environment, which indicated that the FPVs could cause the effect of same order of magnitude as initial concentration (Liu et al., 2023). Some studies focused on the risk of fire accidents (Vaverková et al., 2022; Wang et al., 2024b; Wang et al., 2023) with the FPVs systems and found that the potential of fire risks went up in warm weather. The various types of FPV modules created different conditions, resulting in the different species compositions. The fire hazards of FPVs solar were high since FPV modules not only could cause a fire, but also contributed to fire development due to the combustibility of FPV modules when exposed to the external fire source (Aram et al., 2023). Moreover, the FPVs fire risks could increase by affecting or causing the flame propagation (Jens et al., 2020). In the fire accident of offshore PFVs, ignition time, heat release rate (HRR), combustion equivalent ratio, and total temperature distribution were measured parameters at different external heat flows and ventilation conditions. Liao carried out experimental tests to indicate that the ignition time was sensitive to the change of external heat flow (Liao et al., 2023); however, the strengthening of the ventilation condition had a great contribution to shortening FPVs’ ignition time. The similarity links the mass flow rate of helium release to HRR of actual FPVs fire. It found the dimensionless helium volumetric fraction with dimensionless temperature measured in the fire smoke test (Zhang et al., 2023). Obviously, the fire safety was of significant concern in applying FPVs as a novel energy system offshore (Wang et al., 2017; Yang et al., 2023). The relevant studies pointed out the future work and the directions that would help develop the offshore FPVs fire prevention strategies extensively.
This study presents an offshore solar FPVs-inspired electrical energy power for the green hydrogen production and capacity of a hydrogen storage system. The FLACS model of a hydrogen energy storage platform integrated into an offshore FPVs system has been built, and damage analyses have been conducted by FLACS in order to assess the safety of this system in providing the required energy. Numerical analysis has been used especially for identifying the parameters of damage performance that are related to hydrogen production system failure. The release of hydrogen during the FPVs–hydrogen production process is studied computationally, and the release mode and characteristics are applied to the FPVs–hydrogen production system to explore the relevance for investigating environmental influences and potential accidents. Offshore wind condition is then used to partially determine the hydrogen dispersion and accumulation that will evaluate the safety demand considering vapor cloud explosion probability and destructive aspects. In addition, the thermal hazard analysis of the FPVs–hydrogen production system is implemented using a hydrogen/air explosion scenario simulation to effectively investigate the flame propagation and temperature behavior of the system components. The comparative evaluation of damage performance shows that an accidental release of hydrogen during the FPVs–hydrogen production process will be strongly affected by the system layout and offshore wind. This study presents a damage evaluation and numerical solution of potential system failure, serving as a valuable reference for providing safety supports in the zero-export offshore FPVs system with green hydrogen storage.
The FPVs-based hydrogen production system involved in this study is built on an open seawater area offshore China, as shown in Figure 1. The system consists of two main parts, one for the FPV module and the another for the hydrogen production platform. The FPVs system is composed of PV modules and pontoons, of which the size of the PV module is 1.65 × 1.0 × 0.05 m (height × width × thickness). The pontoon is used to support the PV module to float stably on the seawater surface, and its size is 0.75 × 0.3 × 0.1 m. The FPVs system directly converts solar energy into electricity through FV modules, including independent PV power generation systems. The power generation system consists of a controller, an inverter, and a circuit, as well as electronic and mechanical components. The function of the inverter is to convert direct current energy into a constant frequency constant voltage or frequency modulation voltage converter, with a size of 0.5 × 0.3 × 0.7 m. It is composed of an inverter bridge, a control logic, and a filter circuit. Another important part of the system is the hydrogen production platform, which is composed of a seawater purification device, an electrolyzer, a compression device, and a hydrogen storage tank. PV modules can convert solar energy into electricity for storage. The reverse osmosis unit consists of a high-pressure pump that drives seawater through the reverse osmosis membrane. Since the specific concentration of solute is different, the pressure inside and outside the semi-permeable membrane displays a gap, so as to achieve seawater desalination and desalination. Meanwhile, the PV module supplies power to the electrolytic cell, which produces hydrogen through an electrolytic reaction. The hydrogen produced is stored in a hydrogen storage tank through a compressor.
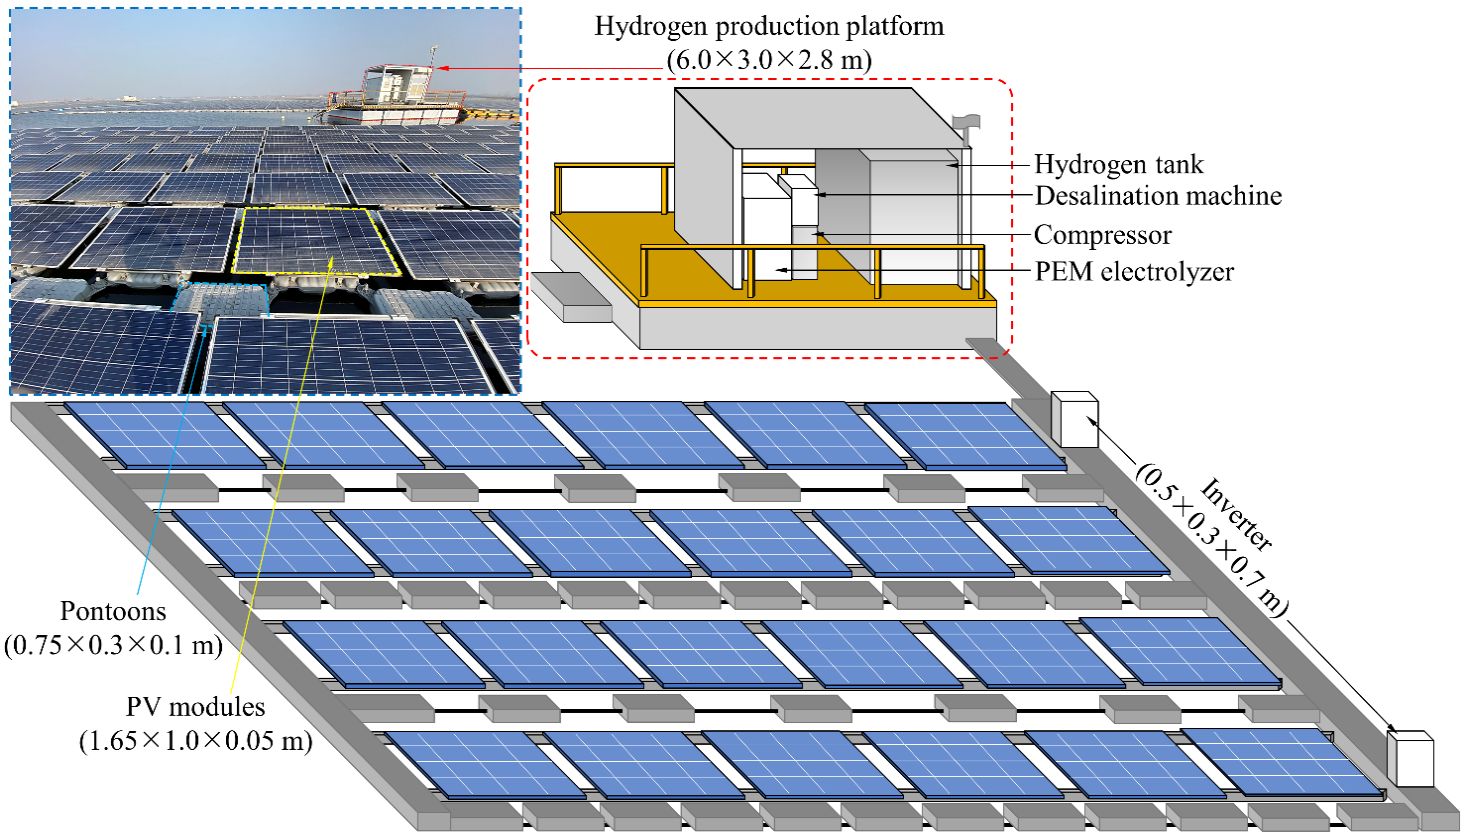
Figure 1 Offshore FPVs-based hydrogen production platform in this study.
According to a real offshore FPVs-based hydrogen production system, this study constructed an accident scenario model through FLACS, as shown in Figure 2. FLACS can realize the numerical simulation of gas release, dispersion, fire, explosion, and other consequences, providing effective data for the damage evaluation and safety design of offshore FPVs-based hydrogen production system. In the numerical model, the PV module, pontoon, inverter, seawater desalination device, electrolyzer, compressor, and hydrogen storage tank are constructed, and the dimensions of each component are consistent with the real situation. Based on the risk assessment of the system operation site, it is found that the hydrogen storage tank is most prone to failure, and the hydrogen release after failure will cause more serious accidents. Based on this, a certain hydrogen leakage position is set on the hydrogen storage tank, and the processes of hydrogen release and dispersion are simulated through the tank rupture. At the leakage location of the hydrogen storage tank, the grid encryption is adopted. The grid settings outside the accident area are gradually sparse, and the number of grids of the physical model in FLACS is 389,000. A total of 46 basic monitoring points (MG) are arranged in the physical model. MGs can output the data of gas concentration, pressure, impulse, temperature, and other related parameters in the corresponding area in the numerical simulations. The layout of basic MGs is arranged along the X axis, Y axis, and Z axis, and the angle with the X axis is 45°. The MGs in the area where the accident of the offshore FPVs-based hydrogen production system occurs are relatively dense.
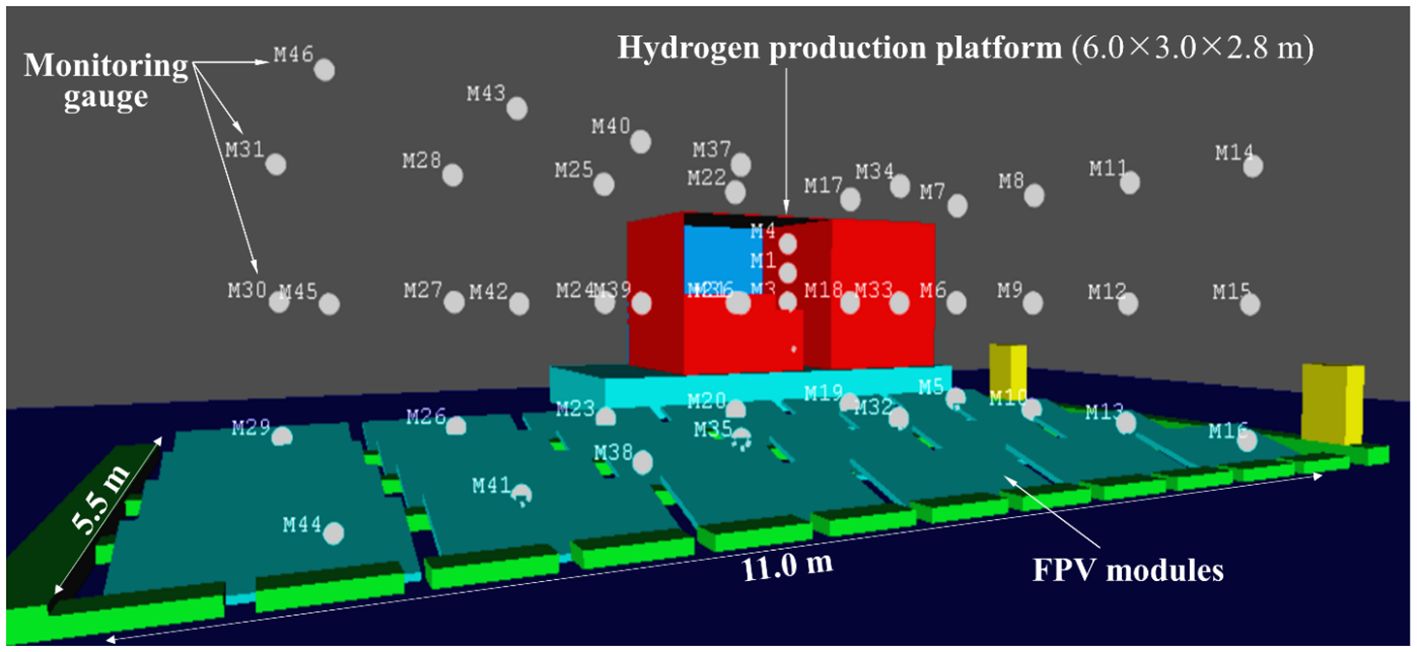
Figure 2 FLACS-based physical model of the FPVs-based hydrogen production platform.
In the offshore FPVs-based hydrogen production system, the hydrogen release and dispersion caused by the failure of high-pressure hydrogen storage tank belong to a buoyancy jet and dispersion process in essence. The hydrogen is ejected from the leakage source to the outer space at a certain velocity, and the release direction is perpendicular to the direction of the high-pressure hydrogen storage tank. The leaked hydrogen begins to disperse around the offshore FPVs-based hydrogen production system mainly under the action of buoyancy and initial momentum. The mass flux of the hydrogen buoyant jet satisfies the mass conservation equation (El-Amin and Kanayama, 2009), as shown in Equation 2.1.
where r is the radial distance, m; U is the axial velocity of hydrogen jet, m/s; α is the air entrainment coefficient, which is affected by buoyancy and initial momentum, dimensionless; b is the horizontal scale of hydrogen jet, m; ρc is the density on central axis of hydrogen jet, kg/m3; and ρ0 is the air density, kg/m3.
When the high-pressure hydrogen storage tank in the offshore FPVs-based hydrogen production system fails, the momentum conservation equation in the hydrogen buoyancy jet process can be defined as Equation 2.2:
where z is the axial distance, m; g is the gravitational acceleration, m/s2; and Uc is the velocity of hydrogen jet on center axis, m/s.
The buoyancy flux conservation equation in the hydrogen buoyancy jet process can be expressed by Equation 2.3:
In the above equation, the velocity at any point in the hydrogen buoyancy jet has the following relationship with the velocity on the central axis of the jet, as shown in Equation 2.4.
Meanwhile, the density and mass fraction of any point in the hydrogen buoyant jet can be formed with the density and mass fraction on the central axis of the jet, as defined as Equations 2.5 and 2.6:
where λ is the buoyancy dispersion coefficient, dimensionless; and Y is the mass fraction, dimensionless.
By associating the expressions for the velocity, density, and mass fraction of any point in the hydrogen buoyancy jet with the buoyancy flux conservation equation, it can obtain the following Equations 2.7, 2.8 and 2.9.
where F is the buoyancy flux, m4/s3; K is the buoyancy coefficient, dimensionless; and U0 is the velocity of hydrogen jet at initial condition, m/s.
Equations 2.10 and 2.11 are defined by rewriting the mass flow rate and momentum flow rate of the hydrogen buoyancy jet by using the nondimensionalization of the geometric scale.
where M is the mass of leaked hydrogen, kg/s; P is the momentum of hydrogen jet, kg·m/s; h is the height from leakage source, m; α is the air entrainment coefficient, dimensionless; and A is the area of hydrogen release, m2.
In the initial stage of high-pressure hydrogen storage tank failure, since hydrogen at the leakage source is in the initial state, its entrainment coefficient α will be jointly affected by buoyancy and initial momentum, as shown in Equation 2.12.
where Ep is the initial momentum of hydrogen dispersion, kg·m/s; and Eb is the buoyancy flux of hydrogen dispersion process, m4/s3.
The effect of initial momentum is much greater than that of the buoyancy force in the range close to the leakage source. The effect of buoyancy on the entrainment coefficient of hydrogen is almost negligible. It can be concluded that the effect of hydrogen enrolling the surrounding air near the leakage source is directly determined by the initial momentum of hydrogen at the leakage nozzle of the high-pressure hydrogen storage tank. With the increase of the distance of the hydrogen jet, the initial momentum of the hydrogen at the leakage nozzle does not change, but the buoyancy effect gradually increases. At this time, the effect of buoyancy on the entrainment coefficient of hydrogen jet also becomes more significant. Since the entrainment coefficient in a certain range will be affected by the initial momentum and buoyancy of hydrogen, the law of the hydrogen buoyancy jet in this distance is dominated by both. As the hydrogen jet moves farther away from the leakage nozzle, the influence of the initial momentum on the entrainment of hydrogen reduces. The expressions of the initial momentum and buoyancy action are shown in Equations 2.13 and 2.14.
where ρ1 is the density at leakage source, kg/m3; U1 is the axial velocity at leakage nozzle, m/s; Fr is the Froude number, dimensionless; and σ is the relationship depending on whether the Froude number is less than or equal to 268.
By substituting the above equations with the endocyric coefficient expression into Equations 2.10 and 2.11, the description of hydrogen in the initial release stage can be obtained, as shown in Equations 2.15 and 2.16. The expressions can be solved using the Runge–Kutta method to obtain the required dimensionless parameters (e.g., height, mass, and momentum).
where p0 is the initial pressure, Pa; λ is the buoyancy dispersion coefficient, dimensionless; and F0 is the initial buoyancy force on a unit volume of gas, N.
Furthermore, the parameters of dispersion range, velocity, and mixed gas density at different heights on the central axis of the hydrogen jet can be obtained, wherein the volume fraction and mass fraction of the mixed gas on the central axis of the hydrogen jet are shown in Equations 2.17 and 2.18. The axial velocity, density, and mass fraction in the range of the hydrogen jet can be derived by substituting the obtained parameters into the expressions of velocity, density, and mass fraction at any point in the hydrogen buoyant jet.
where φc is the volume fraction of gas mixture at central axis, dimensionless; and Yc is the mass fraction of gas mixture at central axis, dimensionless.
According to meteorological data of the sea area where the offshore FPVs-based hydrogen production system is installed, four initial wind conditions with different wind velocities are set in this study, which are 2 m/s, 5 m/s, 10 m/s, and 20 m/s, respectively. The offshore wind velocity covers the main conditions in the four seasons encountered by offshore FPVs-based hydrogen production system in the course of year-round operation. In contrast, the ambient temperature in the sea is set according to the average temperature of the four seasons. The purpose of this study is to analyze the process of hydrogen release and dispersion in the sea area, so the accident location is set on the hydrogen storage tank. The hydrogen in the storage tank is in a high-pressure state, and the pressure in the tank is maintained at no less than 20 MPa. Hydrogen leaks and mixes with air to form a combustible mixture gas with an explosion limit range of 4.1%–74.2% (in air by volume). The material of the hydrogen storage tank is set as carbon fiber composite material. The diameter of the tank is 1.5 m, and the height of the tank is 2.2 m. The size of the leakage nozzle of the tank body is set as 0.05 × 0.05 m, and the initial state of leakage medium is a liquid–gas phase state. The boundary condition of the gas release direction is WIND, and the rest direction is Plane-Wave. The initial turbulence intensity is set to 0.01, turbulence scale is set to 0.02, and atmospheric stability is set to D. The specific characteristic parameters of the hydrogen release are shown in Table 1.

Table 1 Properties of hydrogen in the storage tank of the FPVs-based hydrogen production platform.
The current study targets the release process of the high-pressure hydrogen storage tank, and the numerical model is used to carry out the relevant experimental verification to ensure the accuracy of simulation results. FLACS has high precision numerical modules for gas release and explosion, and its simulation accuracy has been verified and recognized by some previous studies. FLACS is used to analyze the concentration distribution of the hydrogen release process, and the simulation results are compared with experimental tests (Daubech et al., 2013; Kuznetsov et al., 2015), revealing that simulations are in quite good agreement with experimental data even for a small vent. A previous study (Wang et al., 2020, 2022) built a numerical model based on the real accident scenario and restored the gas release and explosion scenarios through the simulation results. After comparing the investigation results of the accident site, it is found that the data of gas concentration, combustion temperature, and shock wave obtained by FLACS are effective. The previous studies are worthy of validating the results for hydrogen release, mixture dispersion, and combustion consequences. In the present work, a comparison between the experiment (Tanaka et al., 2007) and the FLACS-based model is undertaken, aiming to investigate the dispersion characteristics with the hydrogen release process in unconfined space. The hydrogen release experiment is carried out in an open space, involving a high-pressure hydrogen storage vessel with an internal pressure of 10 MPa. In the experiment, the leakage source has several nozzle diameters ranging from 0.8 mm to 1.6 mm. FLACS is used to numerically model the leakage source with a nozzle diameter of 0.8 mm. Figure 3 shows the trend of hydrogen concentration over time, where the blue and black data points represent the experimental data and the data obtained by FLACS-based simulation, respectively. As can be seen from Figure 3, hydrogen release through the 8-mm diameter nozzle reaches a concentration of 27% within a short period of time, which indicates a potential explosion risk. The comparison with the experimental data shows that the maximum deviation between the concentration data obtained by using FLACS to construct the hydrogen release model and the experimental data appears in the peak point time, and the deviation value is 8.89%. The deviation between the numerical simulations and the experimental data reflects the uniformity of the model boundary conditions, such as the constant wind velocity, and may also be influenced by many factors in the experiment process. The above-mentioned problems have been improved in the current model. Based on this, the offshore FPVs-based hydrogen production platform constructed by FLACS and the hydrogen release and dispersion simulations prove to be effective.
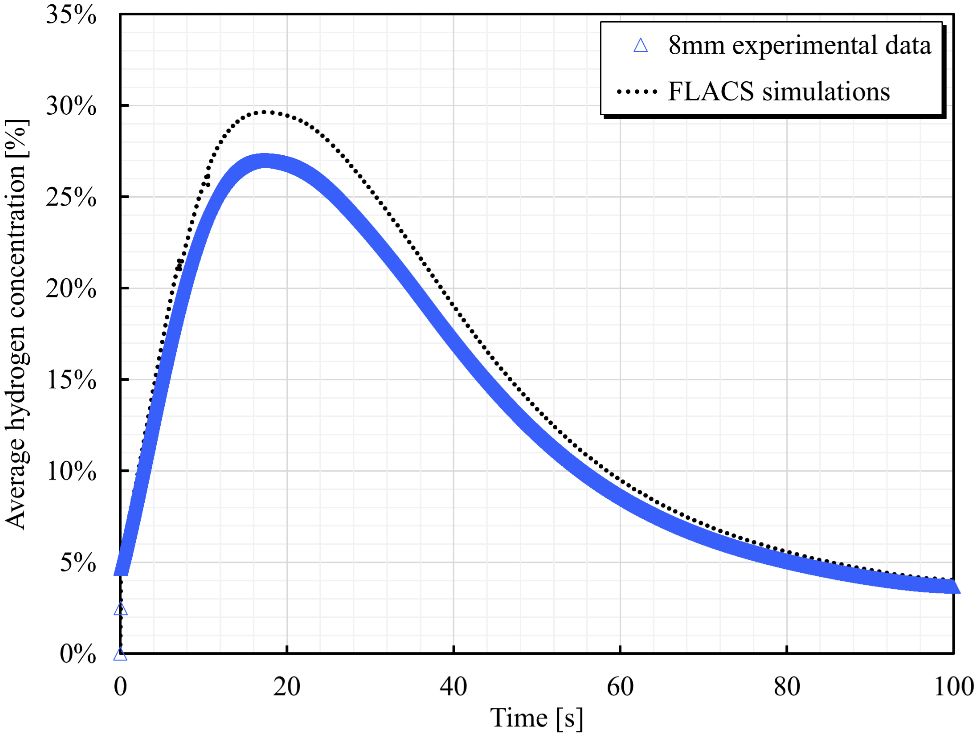
Figure 3 Comparison between experimental data (Tanaka et al., 2007) and numerical results with FLACS.
There are risks when the FPVs-based hydrogen production system runs in an offshore environment for a long time, especially in the area where there are high-pressure hydrogen storage devices, safety protection measures should be prioritized. Owing to the low volumetric energy density of hydrogen, it needs to be stored in the form of high-pressure during preparation. A high-pressure hydrogen storage tank is often prone to local failure, resulting in the formation of small leakage sources. When the compressed medium in the high-pressure hydrogen storage tank is communicated with the outside world through a small leakage nozzle, it will be released to the outside environment in the form of a jet. When the offshore wind velocity is 2 m/s, the hydrogen release process in the offshore FPVs-based hydrogen production system is shown in Figure 4. Because of the different pressure ratios between the leakage source and the offshore environment, the hydrogen release jet may be in different flow states at the failure position of the hydrogen storage tank. If the internal pressure of the hydrogen storage tank is close to the atmospheric pressure of the offshore environment, the pressure ratio of the two is lower than the critical pressure ratio of the leakage medium. In this accident scenario, hydrogen is in a state of full expansion at the leakage position, and the release form is subsonic jet. When the high-pressure hydrogen storage tank fails, it is obvious that the pressure ratio of the inner and outer interfaces of the failure location is higher than the critical pressure of hydrogen. At this time, the velocity of hydrogen at the leakage nozzle is close to the local sound velocity, and the hydrogen is in a state of underexpansion. Because the pressure is higher than the atmospheric pressure in the offshore environment, hydrogen expands further when it leaves the failure position of the hydrogen storage tank, forming a supersonic flow. Figure 4 indicates that when the failure of the high-pressure hydrogen storage tank occurs at 27.5 s, hydrogen concentration is significantly monitored to exceed 58%. When the hydrogen storage tank failure occurs at 50.1 s, high concentration of hydrogen has begun to spread to the FPV module area. Owing to the characteristics of hydrogen, floating behavior gradually occurs in the process of leaked hydrogen spreading to the offshore surrounding area.
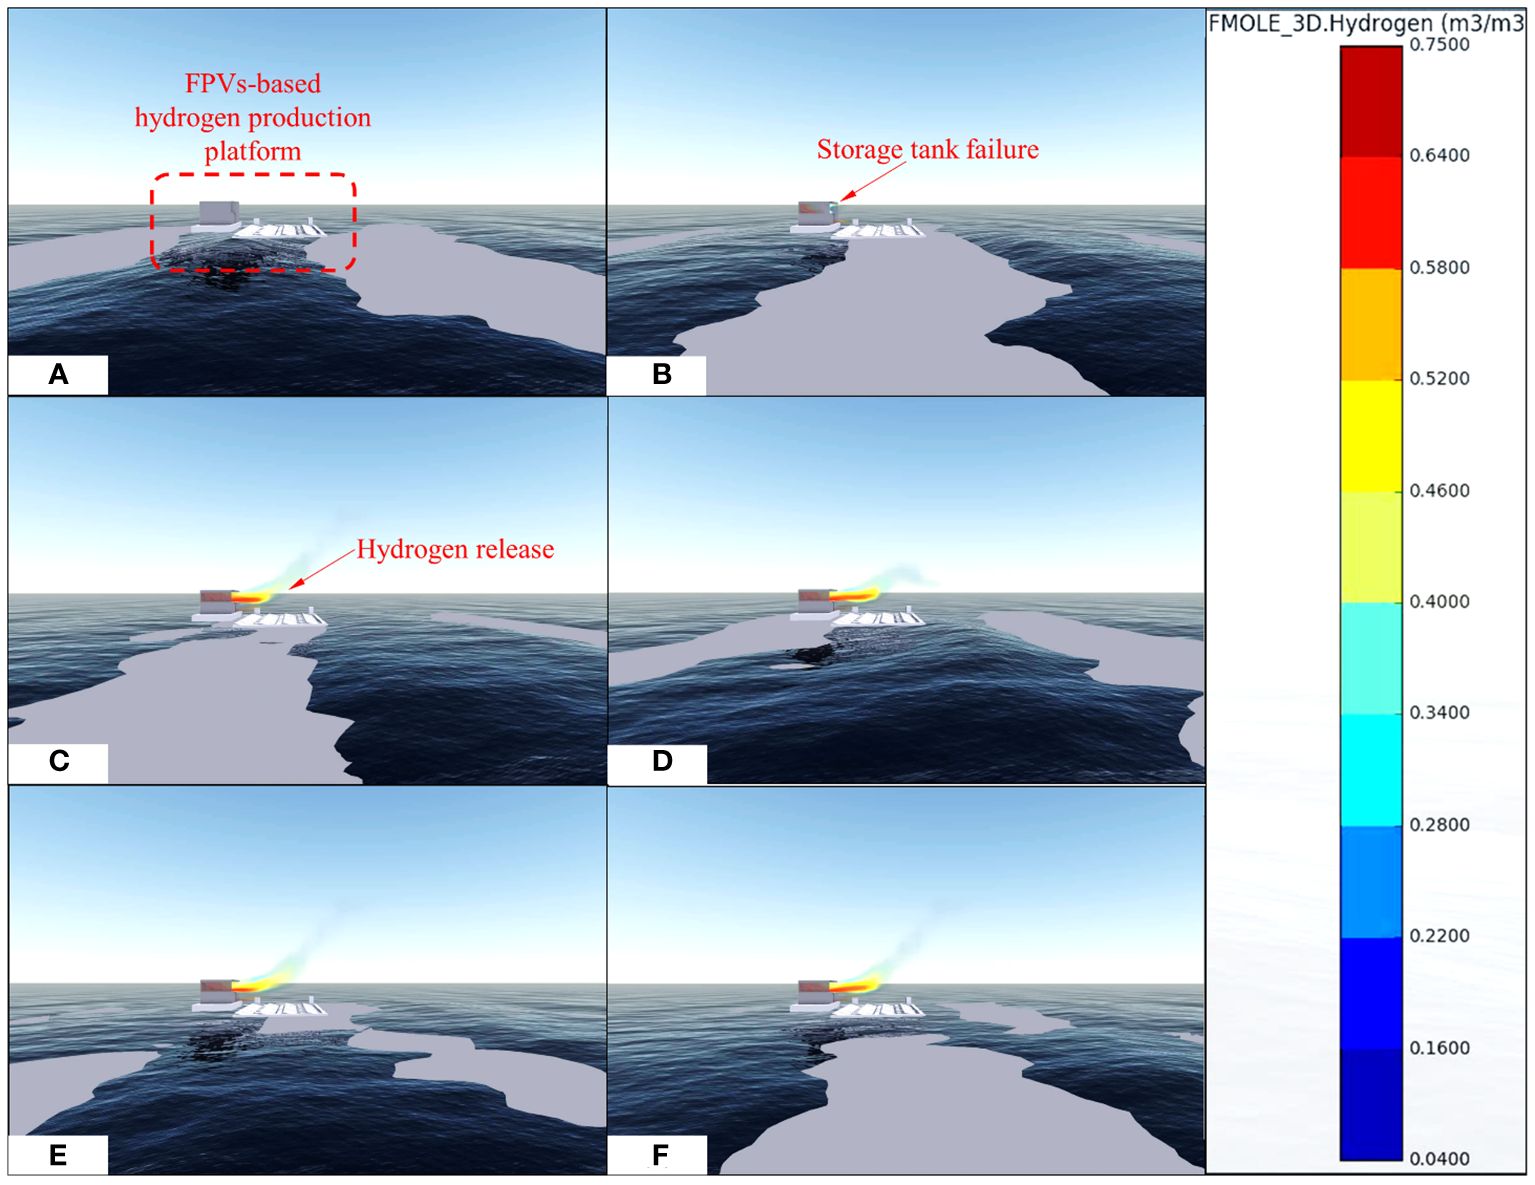
Figure 4 Hydrogen release of the FPVs-based platform with a crosswind velocity of 2 m/s. (A) Time = 0.0 s; (B) time = 27.5 s; (C) time = 50.1 s; (D) time = 102.5 s; (E) time = 155.7 s; (F) time = 207.9 s.
Under the effect of offshore wind conditions, the motion state and release mode of hydrogen will change. In this study, four kinds of transverse wind velocities are set based on offshore monitoring data, ranging from 2 m/s to 20 m/s. Only the hydrogen release behavior along the positive direction of the jet is observed, while the interference of variable air volume is ignored, and the offshore wind enters the computational domain parallel to numerical model. Figure 5 shows the horizontal release behavior of hydrogen under the influence of different offshore wind velocities at 202.5 s when the high-pressure hydrogen storage tank fails. Figure 5 reveals that the horizontal release distance of hydrogen increases at the initial period and then decreases with the increase of wind velocity. When the offshore wind velocity increases from 2 m/s to 5 m/s, it is found that the release concentration of hydrogen along the horizontal direction increases significantly. The hydrogen concentration at the same horizontal position under the action of high wind velocity is significantly higher than that under the monitoring data of low wind velocity. With the further enhancement of the offshore wind conditions, the leakage of hydrogen along the horizontal direction presents different results. The results indicate that the enhanced wind effect restricts the horizontal release distance of leaking hydrogen to a certain extent. When the offshore wind velocity increases from 5 m/s to 20 m/s, it can be obviously observed from the comparison of Figures 5B–D that the location where hydrogen produces high concentration is closer to the leakage source, which also indicates that the horizontal distance of hydrogen release is gradually decreasing. The analysis reveals that when the offshore wind velocity increases to 10 m/s, the wind condition is conducive to promoting the mixing degree of offshore air and leaking hydrogen, resulting in a decrease in hydrogen concentration. When the offshore wind velocity increases to 20 m/s, the horizontal distance of high-concentration hydrogen is further reduced, and the longitudinal upward release movement is greatly weakened.
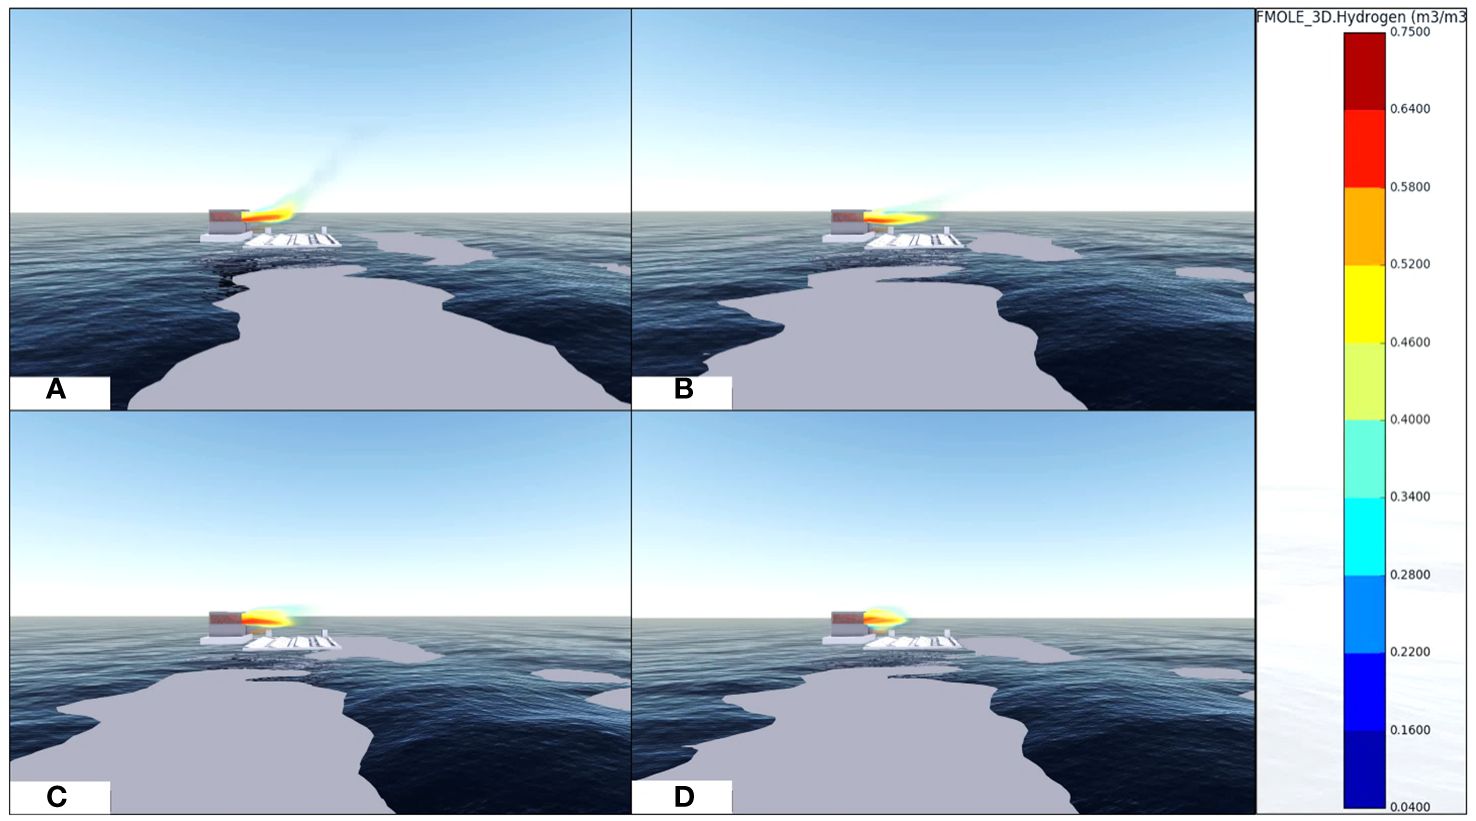
Figure 5 Hydrogen release of the FPVs-based platform with enhanced velocities. (A) Crosswind velocity = 2 m/s; (B) crosswind velocity = 5 m/s; (C) crosswind velocity = 10 m/s; (D) crosswind velocity = 20 m/s.
Figure 6 presents a comparison of hydrogen leakage changes of the high-pressure hydrogen storage tank in the process of increasing offshore wind velocity from an X-Y perspective. The time after failure of the high-pressure hydrogen storage tank captured is close to 102 s. The X-Y view can clearly show the range of hydrogen leakage after the failure of the hydrogen production platform. As can be seen in Figure 6, when the offshore wind velocity is 2 m/s, in less than 2 min, hydrogen is able to release to the farthest FPV module. Since the monitoring gas concentration set in the numerical model is the explosion limit range of hydrogen, it indicates that the farthest end is already in the dangerous area of ignition and explosion accident. Because there are many circuit equipment and pipelines in the offshore FPVs-based hydrogen production system, it is easy to generate current or static electricity on equipment surface, resulting in large-scale hydrogen/air vapor cloud explosion. When the offshore wind velocity increases to 5 m/s, the hydrogen concentration distribution in the middle of the FPV module region is observed to increase. Meanwhile, the concentration distribution of hydrogen in the explosion limit range expands to a further distance of the hydrogen production system. When the offshore wind velocity further increases to 10 m/s, the hydrogen concentration distribution area in the explosion limit range begins to decrease. Figure 6C shows that the hydrogen concentration in the region at the farthest end of the FPV module is lower than the lower explosive limit concentration. The results indicate that with the enhancement of offshore wind conditions, hydrogen concentration in the area near the release accident is within the explosion limit for a long time. Because of the enhanced wind in the offshore area for a long time in a year, it is extremely unfavorable to on-site emergency disposal work after the failure of hydrogen storage devices, and it is necessary to formulate a safety protection for the gas release and explosion accidents.
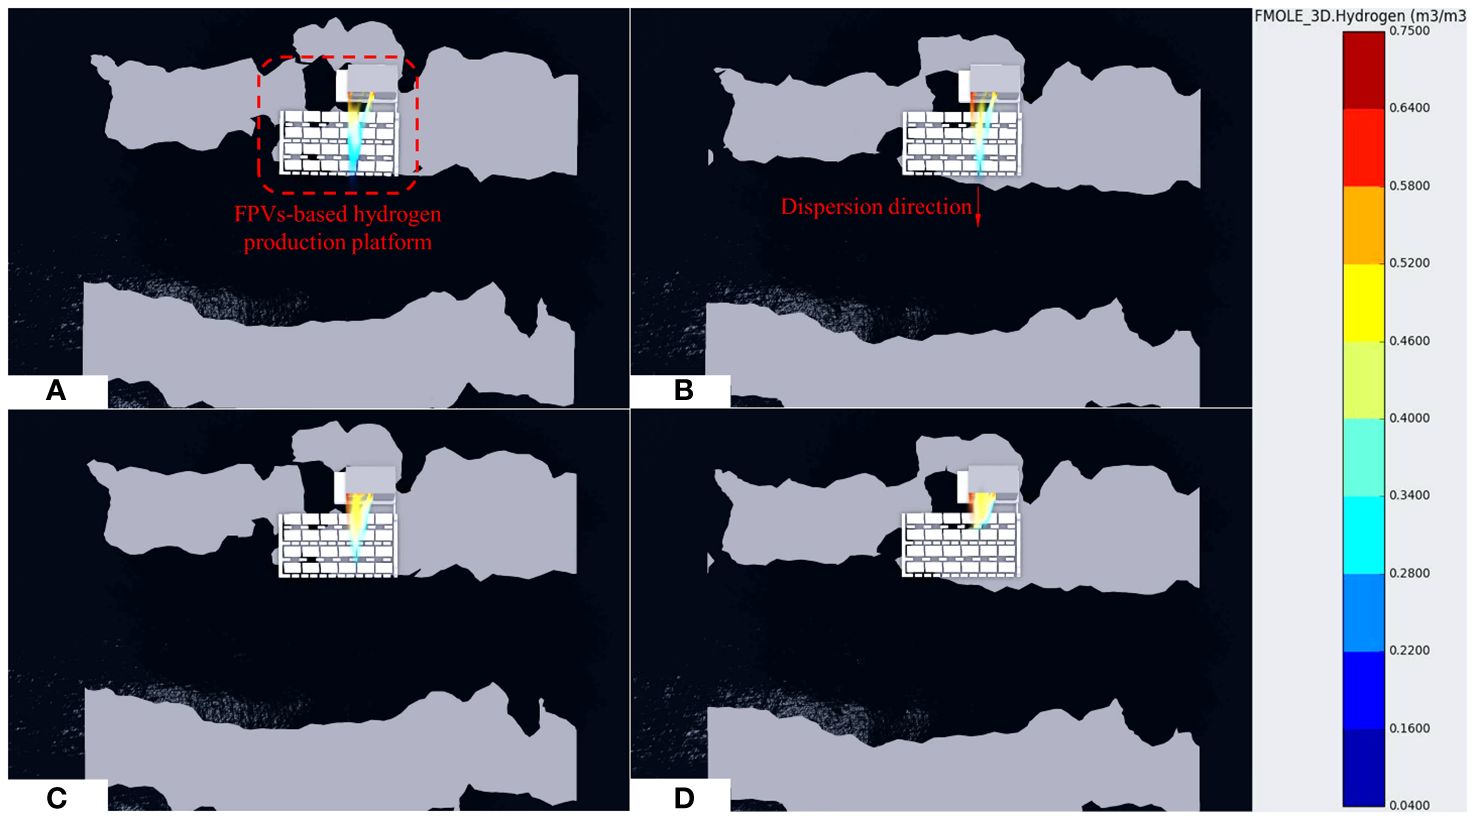
Figure 6 Panoramic view of hydrogen release from the FPVs-based platform. (A) Crosswind velocity = 2 m/s; (B) crosswind velocity = 5 m/s; (C) crosswind velocity = 10 m/s; (D) crosswind velocity = 20 m/s.
High-pressure hydrogen release caused by the failure of offshore FPVs-based hydrogen production system makes it easy to form supersonic flow. When the high-pressure hydrogen storage tank leaks, as the pressure of the leakage source is much higher than the atmospheric pressure, the release velocity reaches the local sound velocity. The gas flow pressure at the leakage nozzle is still higher than the ambient pressure, and hydrogen accelerates to supersonic flow after leakage. Figure 7 shows the comparison of hydrogen dispersion evolution processes under different offshore wind conditions at the time of 39.45 s. When the initial release occurs, the high-pressure underexpanded jet forms a complex shock wave structure near the leakage position. This is because the greater pressure difference after the high-pressure underexpanded jet at the nozzle causes a drastic change in hydrogen velocity, and the flow field in the leakage area is unstable. It is also the main difference between the behavior of high-pressure underexpanded jets when hydrogen releases and that of subsonic jets when conventional tank failure occurs. As can be seen from Figure 7, the dispersion concentration of hydrogen around the platform is lower in the middle region, while the dispersion concentration near the FPV module is higher. The analysis indicates that because the hydrogen in high-speed jet causes air entraining around the dispersion area, a large amount of air involved in the dispersion area mixes with hydrogen, diluting the hydrogen concentration to a certain extent. It is found that the change of offshore wind conditions has little effect on the hydrogen dispersion near the leakage nozzle. Owing to the change of wind conditions, the dispersion concentration distribution of hydrogen away from the leakage position presents different results. As shown in Figure 7, when the offshore wind velocity is 2 m/s, the dispersion distance of hydrogen in the horizontal direction is more than 9.27 m.
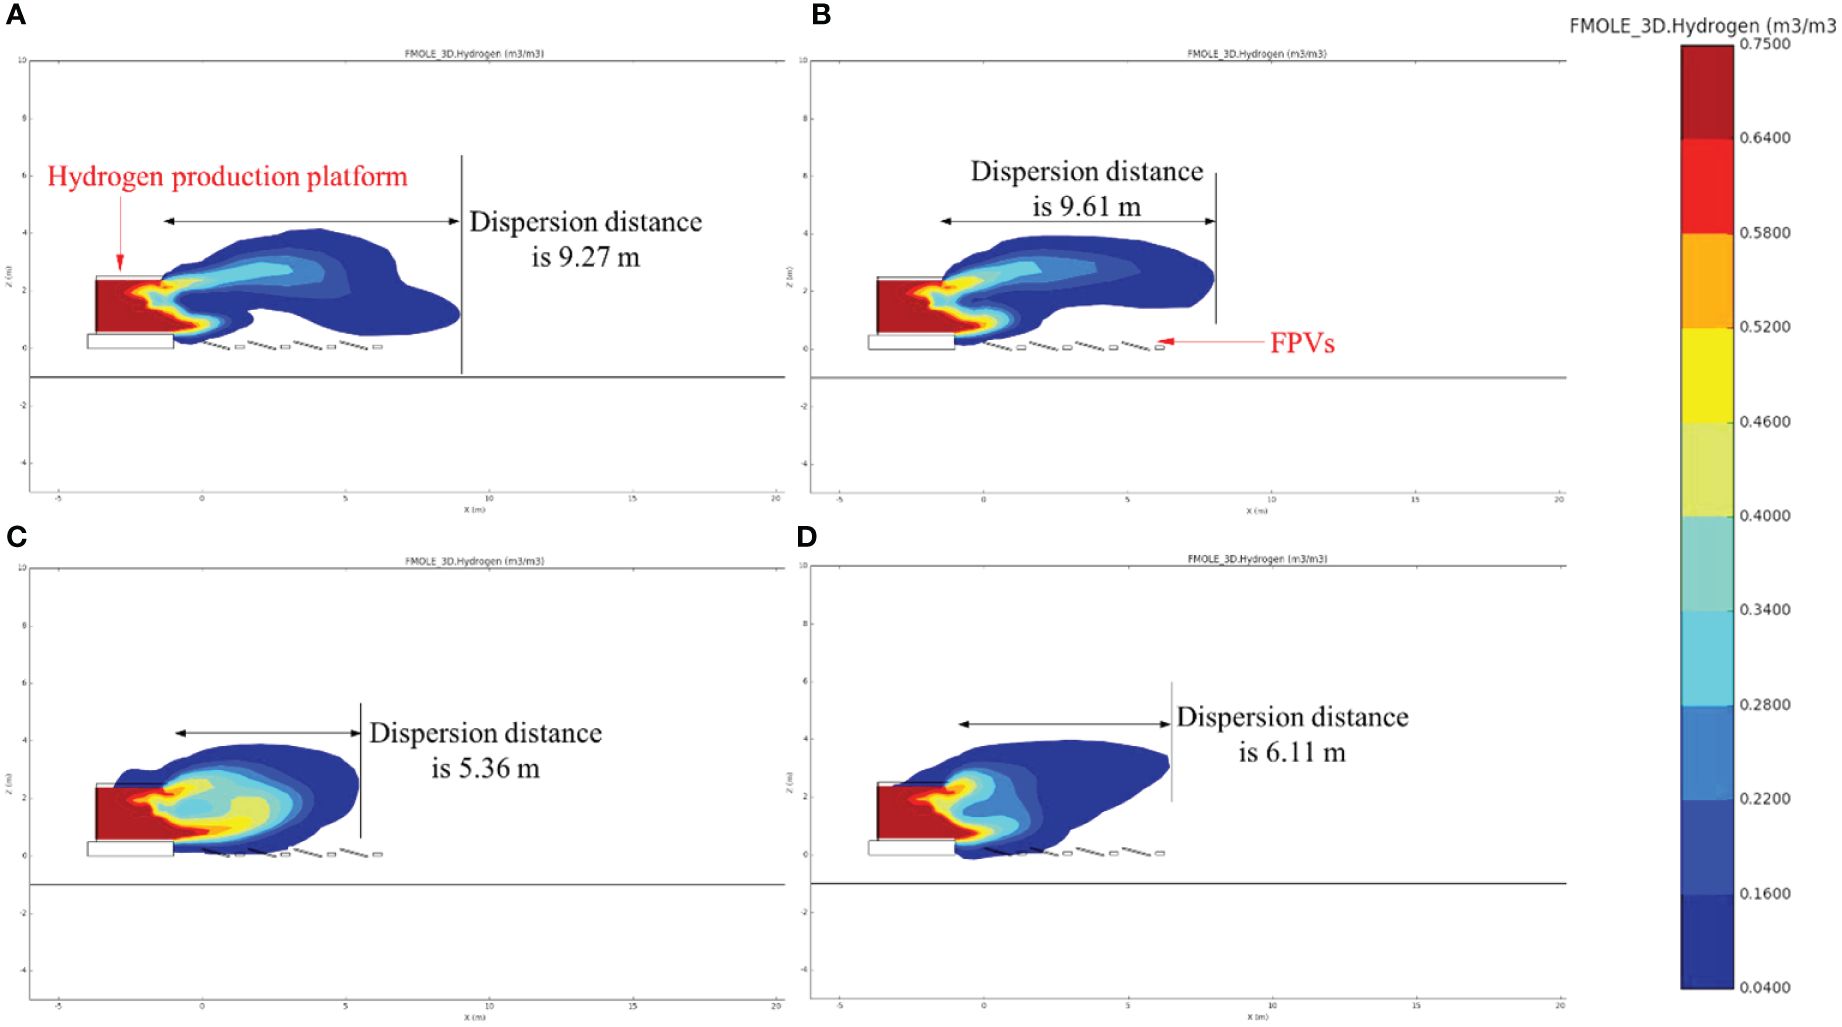
Figure 7 Hydrogen concentration contours at the ZY plane with a time of 40.0 s. (A) Crosswind velocity = 2 m/s; (B) crosswind velocity = 5 m/s; (C) crosswind velocity = 10 m/s; (D) crosswind velocity = 20 m/s.
This study also finds that in the middle region close to the FPV module, the hydrogen concentration required for an explosion is not reached. It reveals that under weak offshore wind conditions, hydrogen can disperse further in the horizontal direction, and cannot form explosive concentrations in the sea surface. The above situation can be further illustrated by the change of hydrogen dispersion concentration over time, as shown in Figure 8. At 22.35 s after the high-pressure hydrogen storage tank failure, hydrogen concentration reaches 47.19%. With the offshore wind velocity maintained at low value, hydrogen dispersion remains in the high concentration range, and its average concentration reaches 47.21%. With the increase of offshore wind velocity to 5 m/s, in the comparison of hydrogen dispersion distance increases with the weak wind condition, the hydrogen explosion concentration range rises to 9.61 m. Because of the enhancement of offshore wind velocity, the hydrogen dispersion concentration in the area near the FPV module remains low, not within the explosion limit concentration range. According to the data shown in Figure 8, it can be seen that after the initial hydrogen release, the dispersion concentration in the scenario of 5 m/s wind velocity reaches 53.36% in a short time. Under this wind condition, the hydrogen dispersion concentration subsequently produces a large fluctuation behavior. The hydrogen dispersion concentration is gradually stabilized in the later stage of the accident, and its average concentration remains at approximately 44.13%. Owing to the influence of enhanced offshore wind conditions, atmospheric turbulence is more conducive to mixing hydrogen vapor clouds with air. When the vapor cloud is heated and diluted, the light gas effect of the mixture cloud begins to weaken, causing it to spread rapidly downwards. When the offshore wind velocity increases to 10 m/s, the horizontal dispersion distance of hydrogen decreases significantly, and the horizontal dispersion distance decreases to 5.36 m. High-concentration hydrogen is mainly distributed in the hydrogen production platform and the adjacent two rows of FPV modules, and the hydrogen dispersion concentration with explosion conditions is still formed near the offshore. According to the data of hydrogen concentration, the increase of wind velocity to 10 m/s has a great effect on the time variability of hydrogen concentration. The fluctuation frequency of hydrogen dispersion concentration increases with time, and its fluctuation amplitude increases significantly. At a time of 117.35 s after the high-pressure hydrogen storage tank failure, the hydrogen dispersion concentration reaches 62.91%. Although the dispersion behavior fluctuates greatly under the severe influence of offshore wind conditions, the final hydrogen concentration still exceeds 65.46%. The research shows that the increase of offshore wind velocity can enhance the local hydrogen/air mixing degree in a certain range, so as to reduce the hydrogen concentration, especially in the shortening of horizontal dispersion distance, and the concentration of explosive gas on the offshore is increased accordingly.
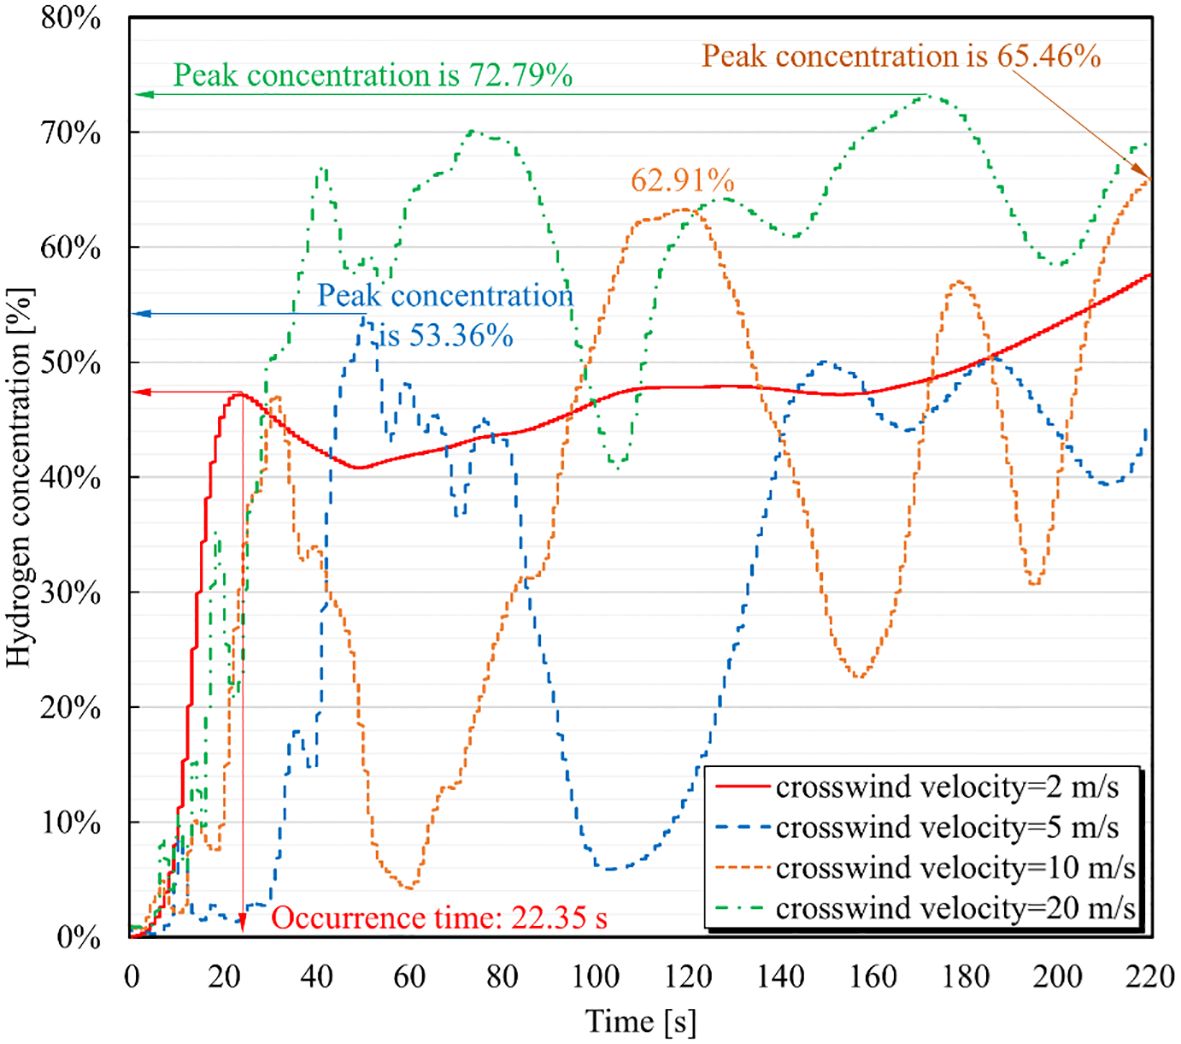
Figure 8 Hydrogen concentration changes with time under different crosswind velocities.
High-pressure gas leakage can determine the subsonic jet by the dominant physical mechanism according to the size of the Froude number (Fr). If the Fr value is higher, it indicates that the initial jet momentum of the leaking gas is larger, and the inertial force effect is stronger. The initial jet momentum of hydrogen generated after the failure of offshore FPVs-based hydrogen production system dominates the jet velocity and horizontal dispersion distance. Competitive relationship between the initial momentum and buoyancy of hydrogen jet determines the evolution model of hydrogen dispersion behavior and range. The characteristics of hydrogen jet are influenced by the interaction between the initial momentum and the buoyancy force, which is a result of the joint effect of the initial momentum and the buoyancy force. Figure 9 shows the comparison of hydrogen dispersion ranges under different offshore wind conditions at nearly 65 s. Through comparison, it reveals the hydrogen dispersion range changes in both horizontal and vertical space when the wind conditions continue to increase. When the offshore wind velocity is 2 m/s, the hydrogen dispersion range is concentrated in the upper space of the accident area, which accords with the characteristics of hydrogen. Far away from the leakage source, the air can still form a hydrogen dispersion concentration distribution of not less than 16%. The data from four MGs located approximately 3 m away from the FPV module are analyzed, as shown in Figure 10. MG 7, MG 8, MG 11, and MG 14 are set at a vertical height of 3 m, respectively, arranged at different intervals from the leakage position. The data analysis shows that the hydrogen dispersion concentration near the leakage source reaches the peak value in a short period, and the hydrogen concentration can reach 12.13% when it is approximately 55.1 s. Subsequently, because of the action of hydrogen jet, hydrogen dispersion is further transferred to the horizontal direction, so the concentration data at MG 7 drop sharply. At a distance of 2 m between MG 8 and MG 7, the peak concentration appears after MG 7, with a value of 100.1 s. The maximum hydrogen dispersion concentration that could be achieved at the MG 8 is more than 18%, close to the equivalent ratio required for an explosion after mixing hydrogen with air. With the increase of the distance between the MG and the leakage source, the peak occurrence time of hydrogen dispersion concentration is delayed continuously, and the peak occurrence time of hydrogen dispersion concentration at the distance of 9 m is 210.59 s. The results indicate that the distribution of hydrogen dispersion concentration in the region far from the leakage source is in the high concentration range for a long time. When the offshore wind velocity increases to 5 m/s, the dispersion degree of hydrogen in vertical space is inhibited. Figure 9B shows that the dispersion distance of hydrogen in vertical space is 8.75 m, and the dispersion height decreases by 12.5% compared with that in the weak wind condition. When the offshore wind velocity increases to 10 m/s, the hydrogen dispersion height drops to 5.56 m, and the decrease is significantly obvious. This reveals that the enhanced wind conditions have a strong inhibition effect on the hydrogen dispersion process to a certain extent. If the offshore wind velocity continues to increase and reaches 20 m/s, the hydrogen dispersion height further decreases to 4.17 m. In this scenario, hydrogen dispersion concentration is concentrated in the area near the hydrogen production platform, leading to higher requirements for on-site emergency treatment after the hydrogen production system failure.
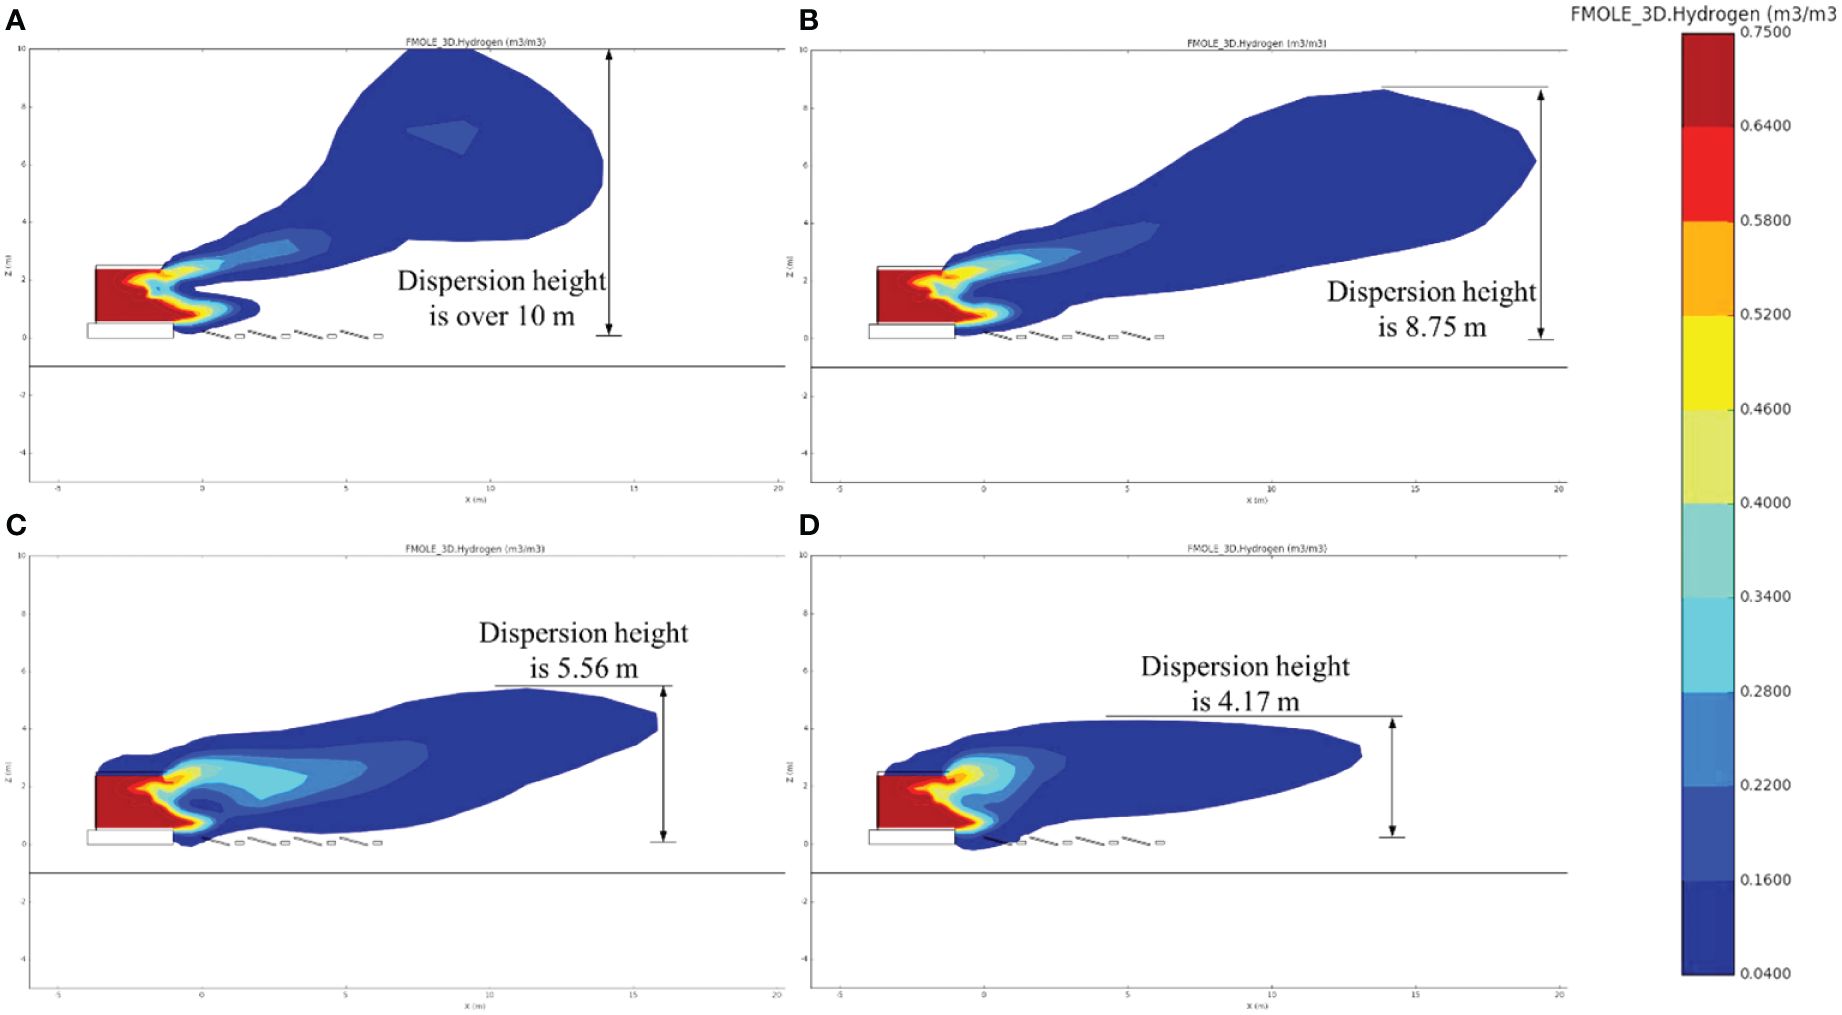
Figure 9 Hydrogen concentration contours at the ZY plane with a time of 65.0 s. (A) Crosswind velocity = 2 m/s; (B) crosswind velocity = 5 m/s; (C) crosswind velocity = 10 m/s; (D) crosswind velocity = 20 m/s.
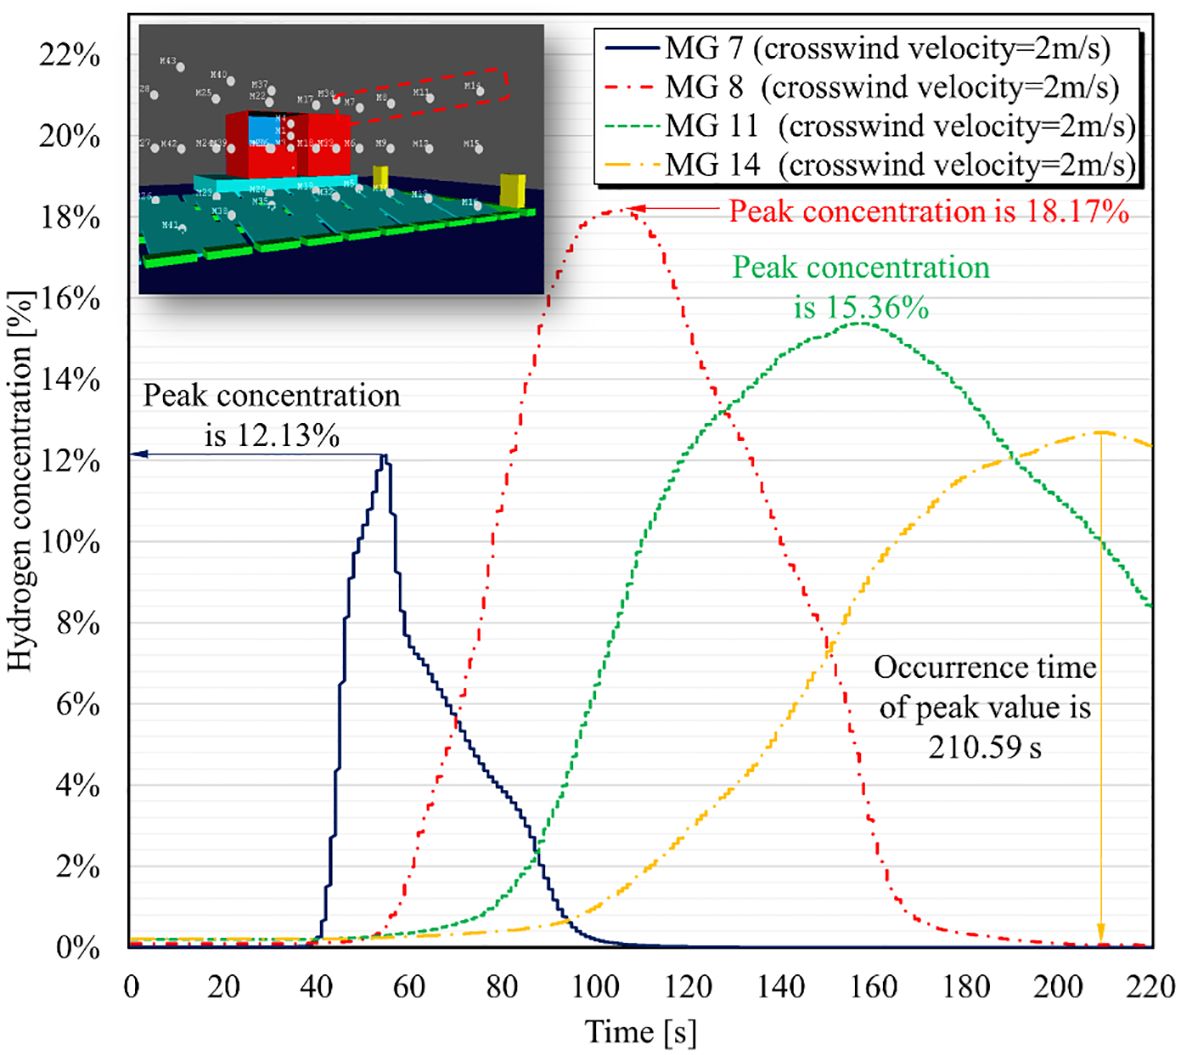
Figure 10 Hydrogen concentration changes with different horizontal positions (crosswind velocity is 2 m/s).
The greater the offshore wind velocity, the more favorable the atmospheric turbulence is for the mixture between the vapor clouds and the air. High-humidity air in the marine environment dilutes the hydrogen vapor cloud released from the high-pressure hydrogen storage tank, and the faster the non-heavy gas effect is weakened. It gradually shows a downward dispersion movement behavior, and thus, the downwind dispersion concentration decreases. Figure 11 shows the distribution of hydrogen dispersion concentration under the influence of wind velocity in different offshore environments at 122.5 s. Hydrogen rapidly expands outward from the leakage source, forming a positive shock wave (Mach disk). In the core area of hydrogen jet, the pressure of air flow gradually increases until it reaches the ambient pressure. Meanwhile, the velocity of hydrogen jet decreases to subsonic velocity. In the boundary layer around the core region of hydrogen jet, a complex compression wave is formed. In the boundary layer region, hydrogen keeps supersonic flow for a long distance downstream of the Mach disk. When the offshore wind velocity is 2 m/s, hydrogen dispersion conforms to the law that momentum dominates near the leakage source, while the distant region is dominated by buoyancy. In the area where the vertical height of the FPV module exceeds 10 m, the hydrogen dispersion concentration is between 16% and 22%, which has a great potential to trigger vapor cloud explosion. When the offshore wind velocity increases to 5 m/s, the concentration profile of hydrogen dispersion changes, mainly in the direction of hydrogen dispersion height, while the distance between the location of explosive concentration and the leakage source increases. As the offshore wind velocity increases to 10 m/s, it is found that the combination of initial momentum and wind force greatly weakens the buoyancy effect. In the scenario of strong wind condition, hydrogen dispersion height is reduced to less than 5 m. The dispersion range of high-concentration hydrogen is reduced to the FPV module area. As the offshore wind conditions continue to increase, the hydrogen dispersion range is greatly affected accordingly. The hydrogen dispersion height is reduced to approximately 4 m, and the horizontal dispersion distance is greatly reduced to less than 15 m.
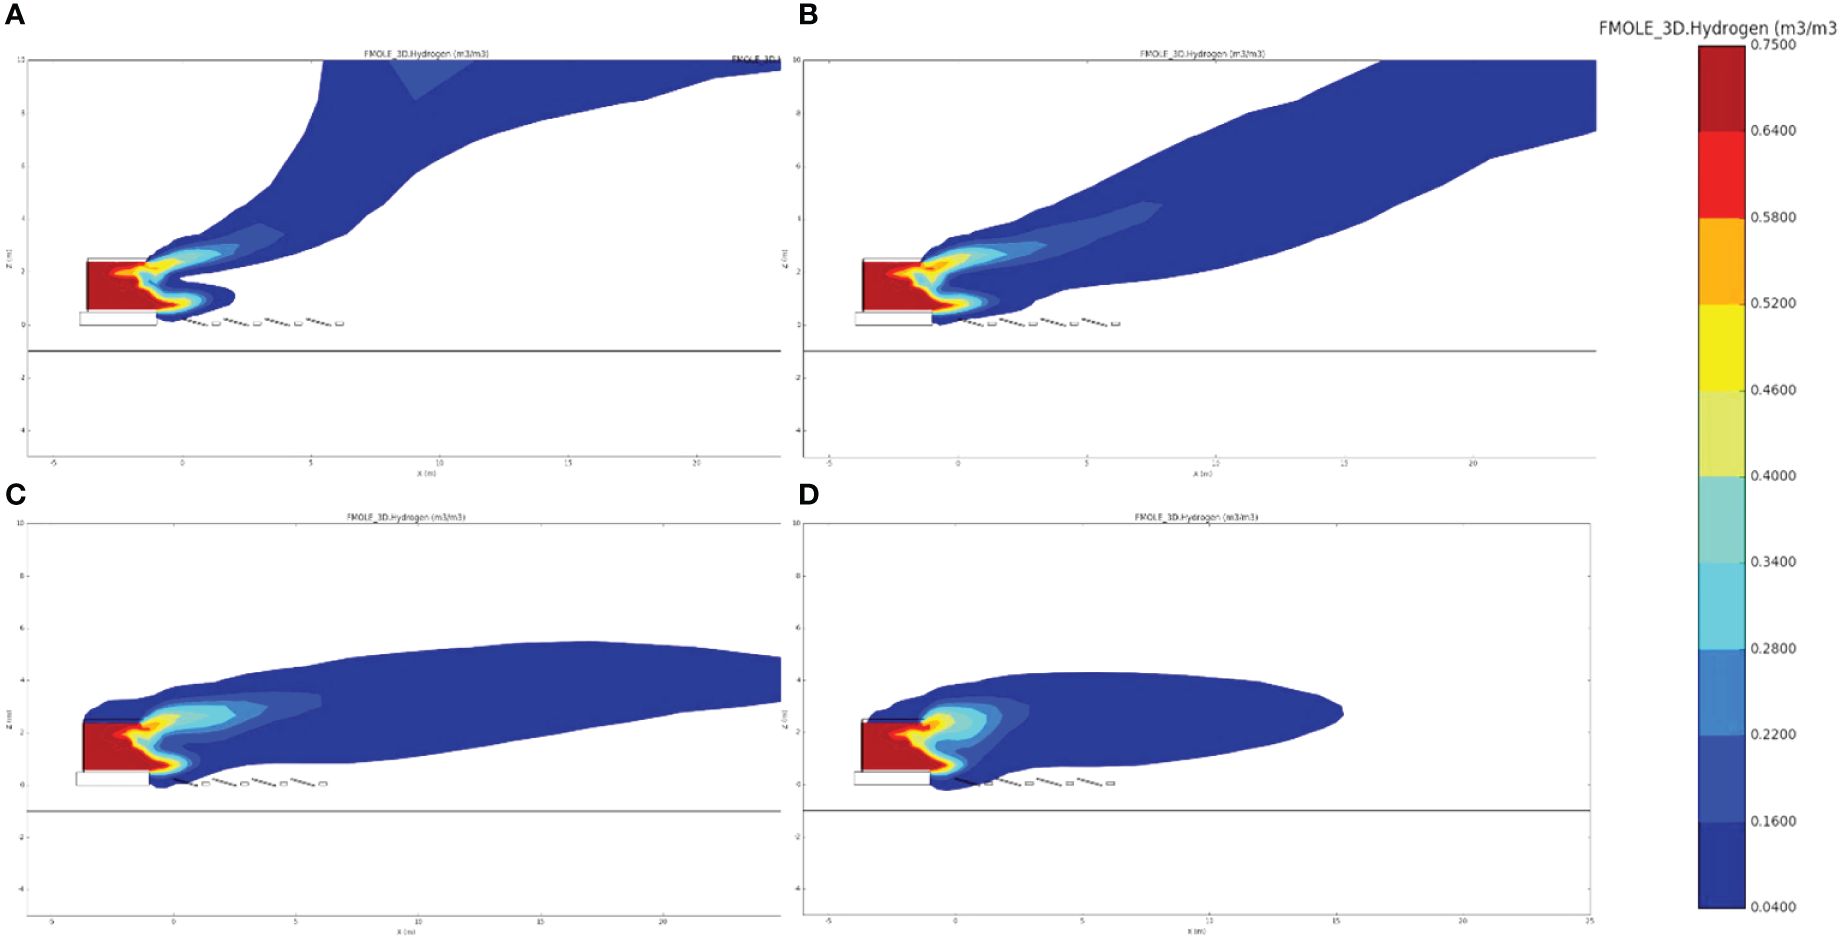
Figure 11 Hydrogen concentration contours at the ZY plane with a time of 122.5 s. (A) Crosswind velocity = 2 m/s; (B) crosswind velocity = 5 m/s; (C) crosswind velocity = 10 m/s; (D) crosswind velocity = 20 m/s.
Figure 12 shows the evolution law of hydrogen dispersion concentration over time in a region with a vertical height of 3 m under strong wind conditions. In Figure 12, two accident scenarios with an offshore wind velocity of 10 m/s and 20 m/s are compared. It is found that greatly enhanced offshore wind conditions will not promote the increase of hydrogen dispersion concentration, but inhibit it within a certain range. Figure 12A reveals that the horizontal distance ranges between MG 7 and MG 8, with a distance from the hydrogen production platform of 3 m and 5 m, respectively. When the offshore wind velocity is 10 m/s, the hydrogen dispersion concentration near the leakage source is lower than the concentration farther away, which indicates that the peak concentration of hydrogen dispersion is likely to appear 5 m away from the leakage source. As can be seen from Figure 12B, under the same offshore wind condition, hydrogen dispersion concentration at MG 11 (horizontal distance is 7 m) is higher than that of data farther away. The data provided by the above MGs show that when the offshore wind velocity is 10 m/s, in the space of 3 m from the offshore area, the hydrogen dispersion concentration increases first and then decreases, and the peak concentration appears in the area with a horizontal distance of 5 m from the leakage source. When the offshore wind velocity reaches 20 m/s, the peak concentration of hydrogen dispersion reaches the area near the leakage source, and the occurrence time is approximately 37.1 s. With the increase of horizontal distance, it is found that the hydrogen dispersion concentration continues to decrease, and the peak concentration at a distance of 9 m from the leakage source is 7.58%. The result indicates that when the offshore wind velocity increases to 20 m/s or even stronger, it has an inhibition effect on hydrogen dispersion distance, and the high concentration distribution area of hydrogen dispersion appears near the leakage source.
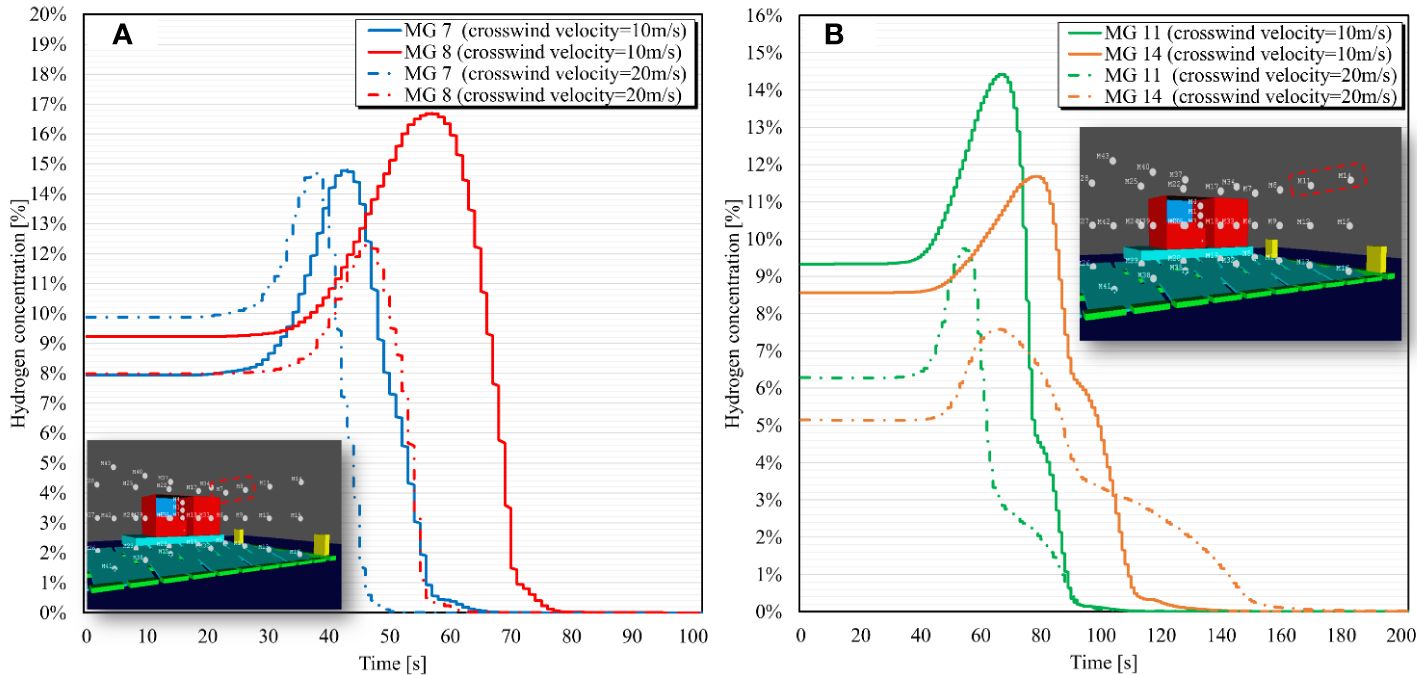
Figure 12 Hydrogen concentration changes with time under different crosswind velocities. (A) Horizontal position is 3 m and 5 m; (B) horizontal position is 7 m and 9 m.
According to the previous section, hydrogen release caused by the failure of hydrogen storage tank in the offshore FPVs-based hydrogen production system forms the distribution of combustible mixture gas vapor clouds within a certain range. Once the ignition is induced in the system operation site, it causes explosion accidents of different scales, which produce flames accompanied by different degrees of thermal damage. In view of the possible thermal damage caused by accident site, this study conducts simulation around the vapor cloud explosion induced by hydrogen dispersion on the hydrogen production platform, with a focus on discussing the flame propagation under the influence of different offshore wind conditions. Furthermore, this study analyzes the scope of thermal damage under hydrogen explosion. It is more practicable to determine a range of damage thresholds for the thermal hazards based on the criteria set forth by the CCPS (CCPS, 1994; Wang et al., 2019). The areas with the most severe thermal damage are classified as fatal zone, while the area without any thermal damage are classified as safe zone. In cases of vapor cloud explosions, where the thermal hazards act in a shorter time than the target, thermal equilibrium is reached so that the heat received by the target is not dissipated in time. Table 2 presents the degree of thermal damage and its corresponding temperature threshold. By comparing the values in the standard and combining the temperature data output from FLACS-based results, the thermal damage degree in different areas of the FPVs-based hydrogen production system is determined.
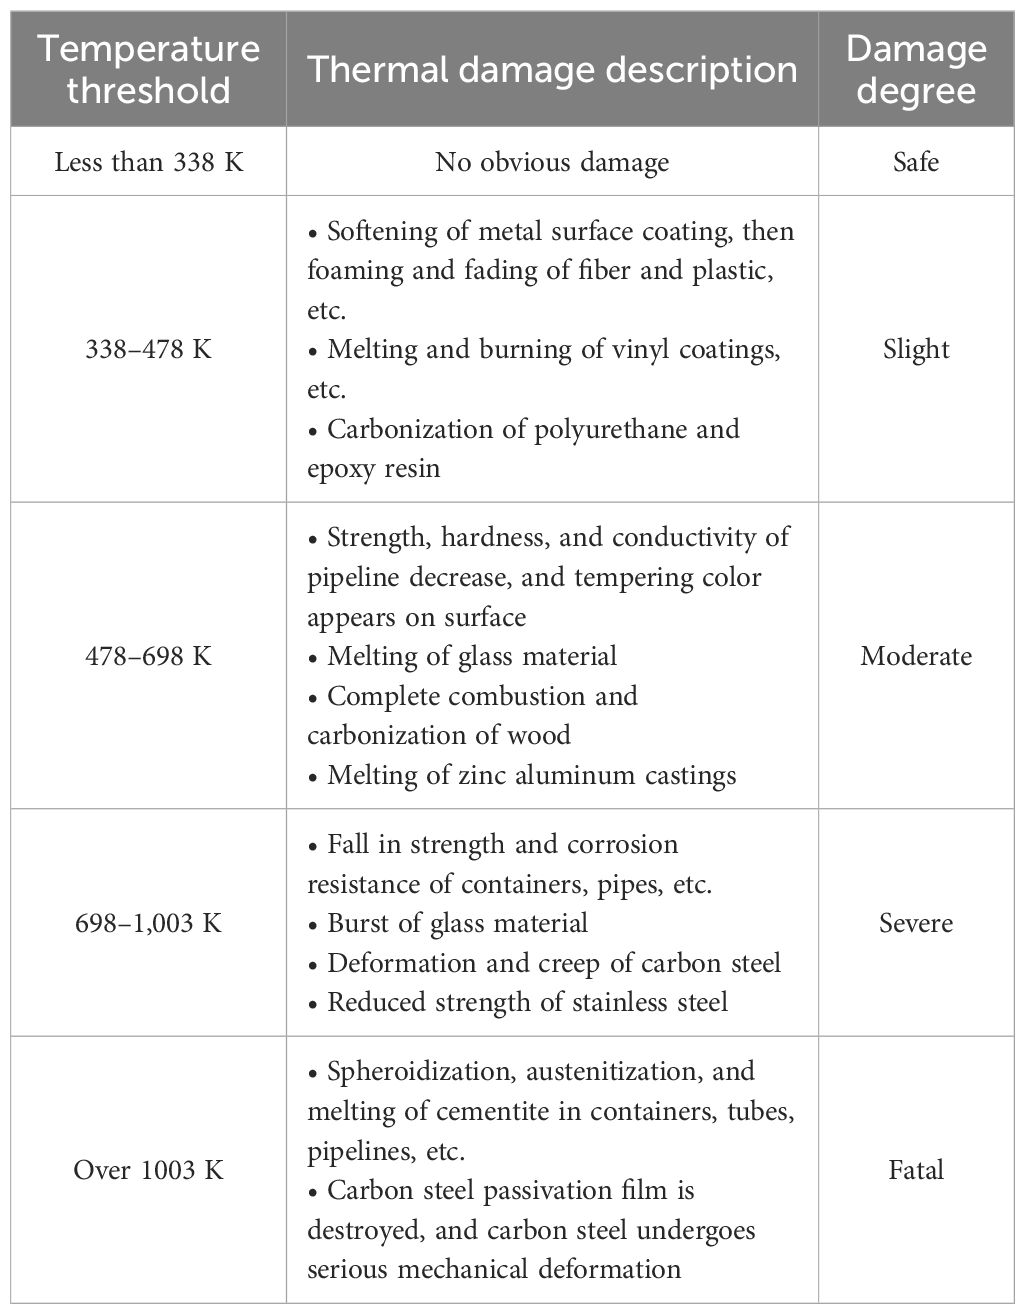
Table 2 Thermal damage criteria due to flame propagation in hydrogen explosion (Yarmolenko et al., 2011; Jacklitsch et al., 2016; ASTM C856/C856M-20, 2020).
Figure 13 shows the temperature distribution over time after hydrogen explosion on the hydrogen production platform. The perspective provided is the X-Y horizontal plane. In the accident scenario, the offshore wind velocity is 10 m/s, and the ignition source is set to electric spark. When the hydrogen explosion occurred (time = 40.29 s), the flame generated by explosion is propagated from the high-pressure hydrogen storage area, and the offshore temperature field distribution is accompanied by changes. In the initial stage of hydrogen explosion in the FPVs-based hydrogen production system, the temperature in the area with a radius of approximately 1.5 m around the hydrogen storage device rapidly rises to 1610 K. According to the temperature threshold standard corresponding to the thermal damage degree (see Table 2), the cable piping and steel framing device here completely cause irreversible and severe damage. Meanwhile, the temperature in the 3.5-m radius area from the explosion source is between 560 K and 680 K. Under this temperature range, the crystalline silicon material of PV module is deformed. At the same time, the pontoon of the FPV module is completely melted by thermal effect, and the connecting cable suffered serious high-temperature damage. With the hydrogen explosion occurring to 175.11 s, the high-temperature area has covered the first and second rows of FPV modules near the hydrogen production platform, and the temperature in this area exceeds 2,000 K. At 306.77 s after the hydrogen explosion, it is found that the row of FPV modules furthest away from hydrogen production platform is in a high-temperature region above 1,520 K. According to previous section, when the offshore wind velocity is 10 m/s, a large amount of hydrogen does not disperse with wind movement, but forms an explosive concentration in the FPV module area. Therefore, when a hydrogen mixture vapor cloud is ignited, high-temperature damage is concentrated in the area where the FPV module is laid. At 740.51 s, almost the entire FPV module area is affected by thermal damage to varying degrees, and the damage range of the high-temperature area expands to 14.89 m.
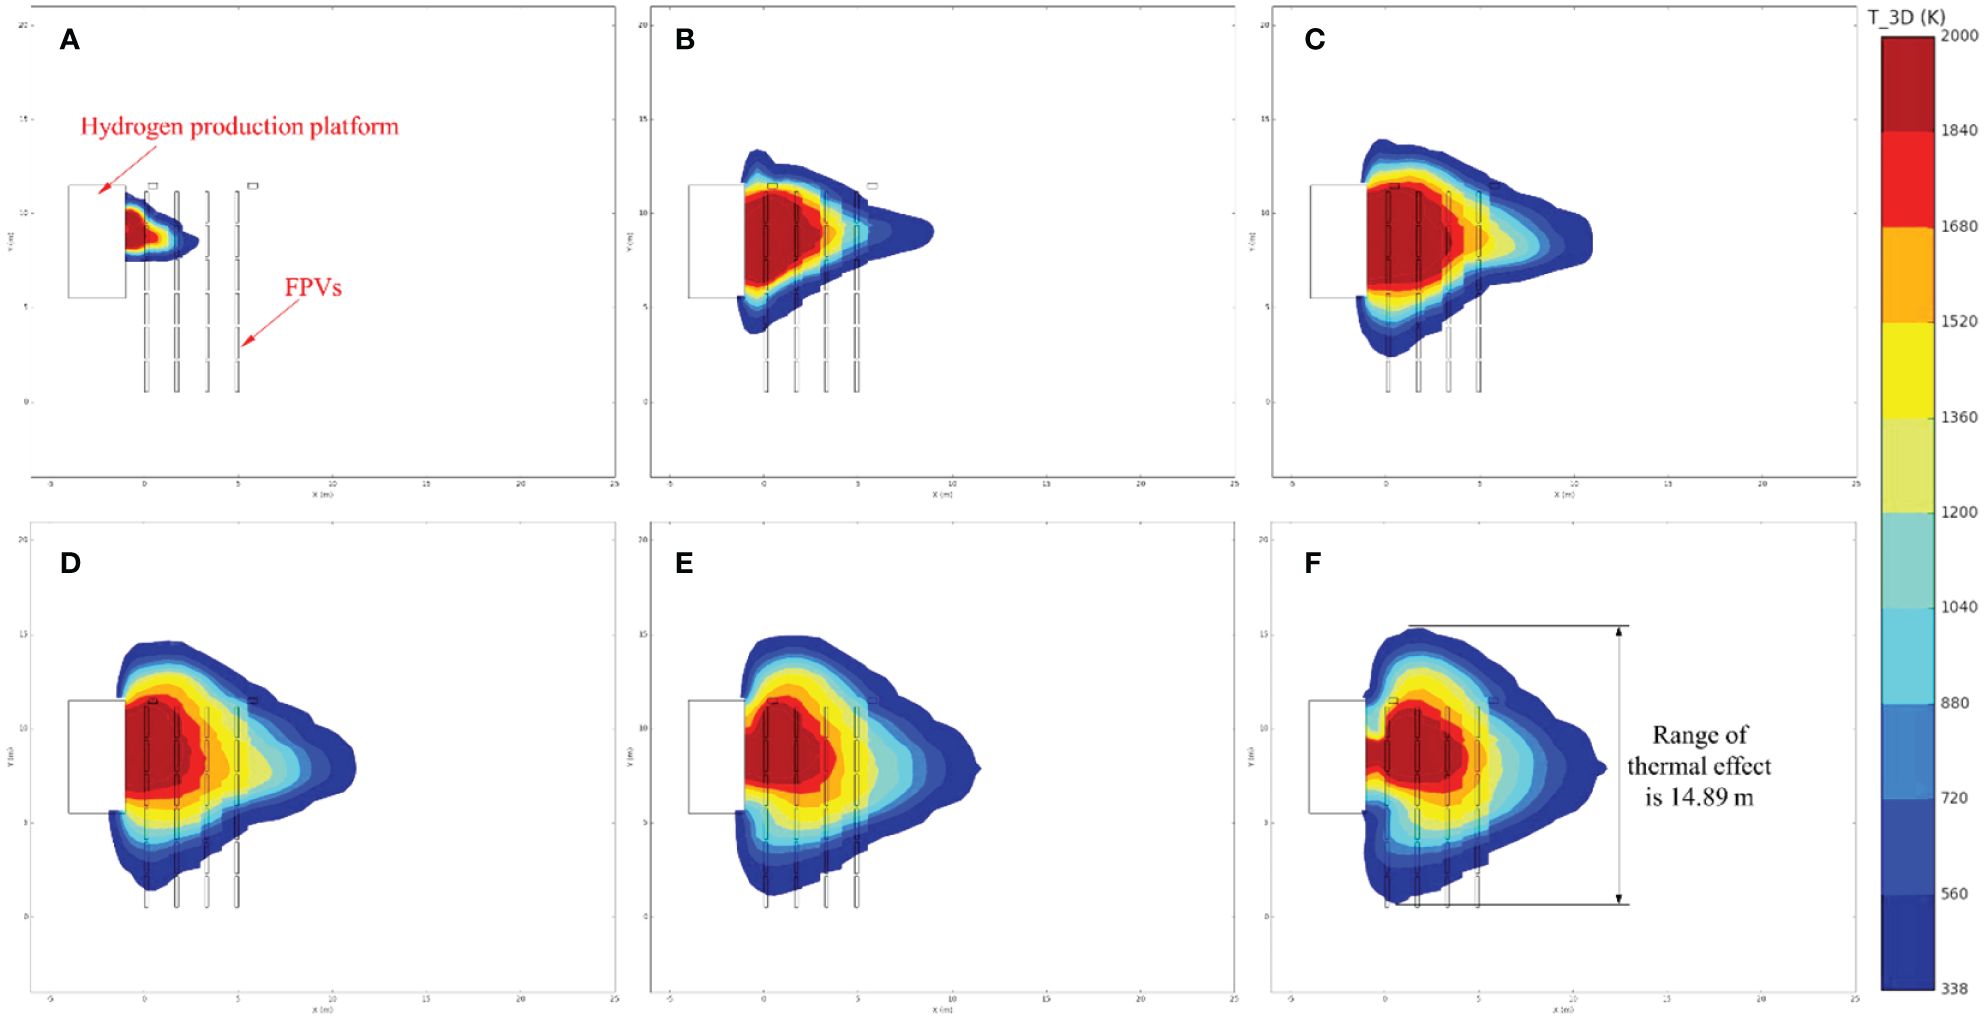
Figure 13 Panoramic view of flame propagation induced by hydrogen explosion. (A) Time = 40.29 s; (B) time = 175.11 s; (C) time = 306.77 s; (D) time = 449.53 s; (E) time = 598.33 s; (F) time = 740.51 s.
Since the relevant MG is set for the surface of each FPV module during the construction of the FLACS-based model, the degree of thermal damage can be more intuitively determined by temperature data, as shown in Figure 14. MG 5, MG 10, MG 13, and MG 16 in Figure 14A show the surface temperature data of the FPV module perpendicular to the direction of the hydrogen production platform, while MG 20, MG 23, MG 26, and MG 29 show a set of FPV module surface temperature data parallel to the hydrogen production platform. Both transverse and longitudinal heat transfer decrease with increasing distance from the explosion location. The surface temperature of the FPV module near the high-pressure hydrogen storage tank increases the fastest, and the surface temperature rises to 1,802.9 K within 90 s, and the temperature rising rate exceeds 43.3 K/s. The FPV module consists of high-efficiency crystalline silicon solar cells, an ultra-white cloth tempered glass, EVA, a transparent TPT backplane, and an aluminum alloy frame (Pandeya et al., 2022; Xiao et al., 2022a; Xiao et al., 2022b; Xiao et al., 2022c), of which only aluminum alloy material can withstand the high temperature (less than 900 K). It indicates that the FPV module in the immediate vicinity of hydrogen explosion area is completely destroyed by flame-driven thermal damage. The maximum surface temperature of the FPV module parallel to hydrogen production platform reaches 493.8 K. In Table 2, under the temperature strength and hardness create FPVs modules attribute. Moreover, for the material of pontoon, it causes the occurrence of combustion behavior. Under the thermal influence of such temperature, the consequence induced by thermal damage degree is classified with moderate grade. Heating at this temperature for a long time causes the overall deformation and partial melting of the FPV module. Figure 14B shows the FPV module arranged along the hydrogen production platform at an angle of 45°, and its surface temperature is time-varying under the action of hydrogen explosive flame. Near MG 19 of the hydrogen production platform, the surface temperature rises to near the highest temperature at an extremely rising rate of 187.8 K/s. The highest temperature that finally reaches MG 19 is 2251.6 K, at which the FPV module is almost completely burned out. At the same time, the temperature near MG 19 is stable, maintaining an average temperature of approximately 2,200 K for the duration of hydrogen explosion. The surface temperatures at MG 35 and MG 38 show the same trend, and the highest temperature reaches 1,429.9 K and 1,151.8 K, respectively. According to the thermal damage criteria, when the temperature is higher than 1,100.0 K, it leads the spheroidization, austenitization, and melting of cementite in the hydrogen storage tank and pipeline. Furthermore, the carbon steel passivation film of FPV modules is destroyed, and the carbon steel undergoes serious mechanical deformation. The surface temperature of the FPV module located in the middle shows a trend of late increase, which is especially reflected in the data changes obtained at MG 41. The surface temperature of the FPV module begins to gradually increase at 134.6 s after hydrogen explosion, and the temperature rising rate is small. After the hydrogen explosion occurs at 264.9 s, the surface temperature of the FPV module at MG 41 reaches the peak temperature, approximately 2,284.5 K. The surface temperature of the FPV module within a relatively long distance changes more steadily; for instance, temperature data at MG 44 are maintained below 500 K within 229.3 s. Since the FPV attachment material is HDPE material, its temperature resistance range is between 233 K and 358 K. In this temperature range, the pontoon has completely melted down. Affected by the hydrogen explosion flame propagation, the surface temperature of the farthest FPV module further increases after 270 s, with a final highest temperature of 997.3 K. The thermal damage caused by the flame formed by hydrogen explosion is close to the fatal level.
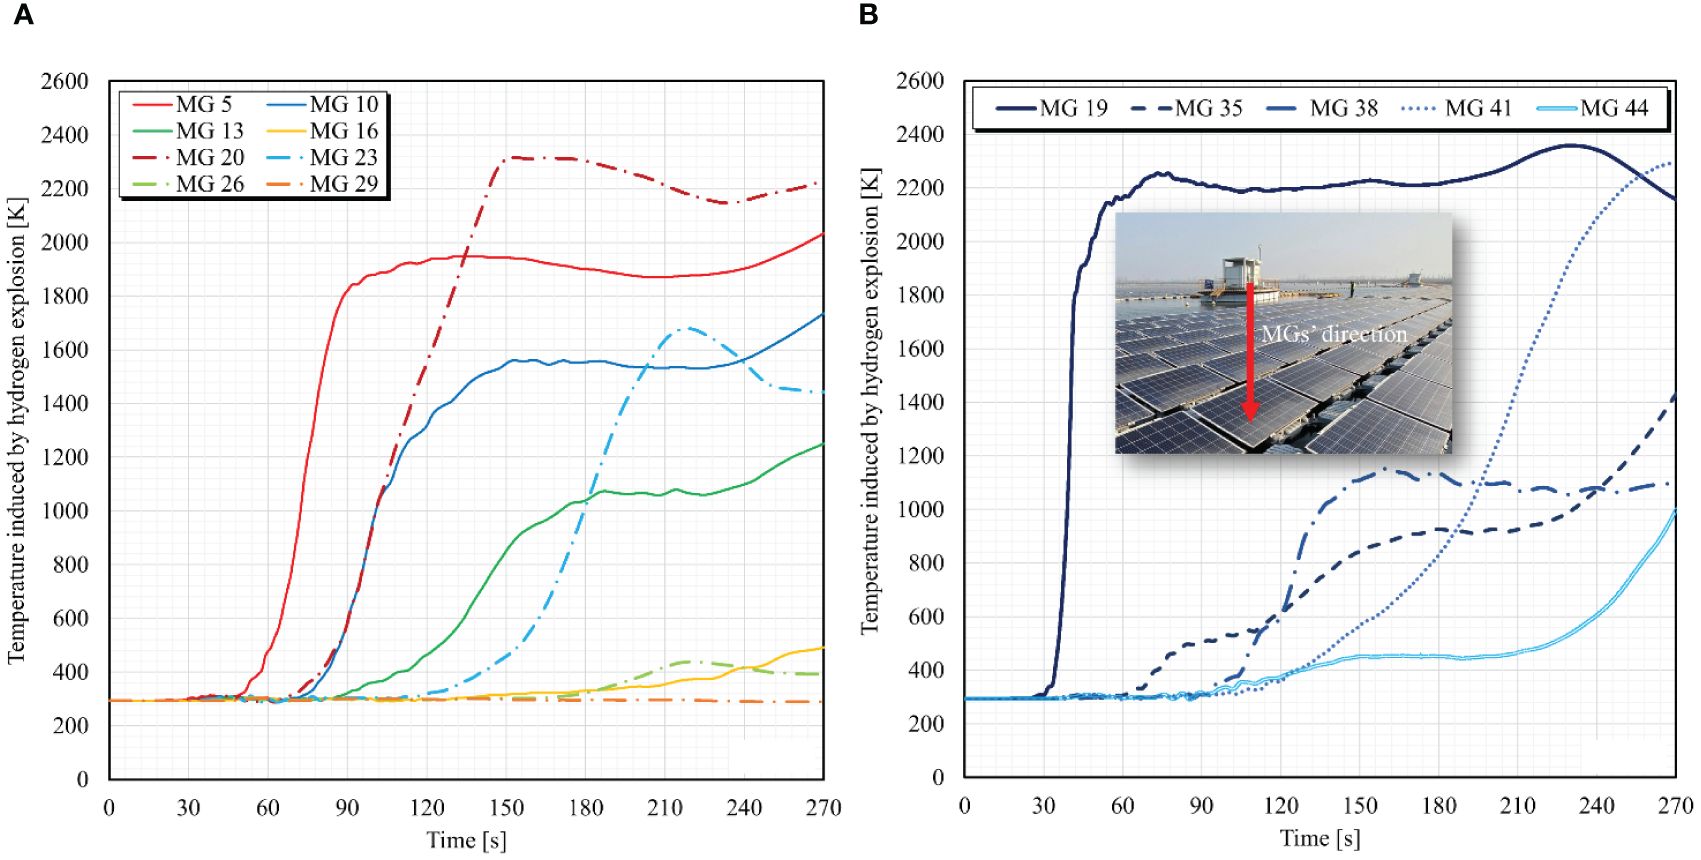
Figure 14 Temperature trend in different directions away from the FPVs-based hydrogen production platform. (A) Parallel and perpendicular directions; (B) diagonal direction.
Under the influence of wind conditions in the marine environment, hydrogen explosion in the offshore FPVs-based hydrogen production system has a different evolution process. Figure 15 presents the comparison of temperature distribution in space of flame generated by hydrogen explosion when offshore wind velocity changes. The hydrogen explosion shown in Figure 15 occurs at the same time of 175 s. When the offshore wind velocity is 2 m/s, the temperature field is subject to the thermal action of hydrogen explosive flame. The distribution of the temperature field at the side shows a relatively regular vertical and horizontal direction. The mixed vapor cloud of hydrogen and air spreads upward along the centerline of the jet after leaving the leakage source for distance in a weak wind condition. Therefore, once the hydrogen/air mixture vapor cloud is ignited, the air temperature in the area where the accident occurred changes dramatically. According to the temperature distribution shown in Figure 15A, the temperature data located on the surface of the FPV module in the fourth row are less than 720 K. Combined with the thermal damage level and the corresponding temperature threshold presented in Table 2, it shows that the metal materials of FPV modules in this area are significantly deformed by high temperature, while the pontoon and cable are still unbroken. When the offshore wind velocity increases to 5 m/s, the enhanced wind condition promotes the hydrogen dispersion to a further distance and also restricts the buoyancy behavior in vertical space. When the hydrogen/air mixture vapor cloud is ignited, the temperature distribution begins to gradually extend in a horizontal direction. Because of the increased offshore wind velocity across the sea surface, the FPV modules located nearly 11.5 m away from the explosion source are damaged by thermal damage. A maximum temperature of 710 K on the surfaces of the FPV modules is monitored in this distance range, which triggers the structural failure of the metal support material of the FPV module.
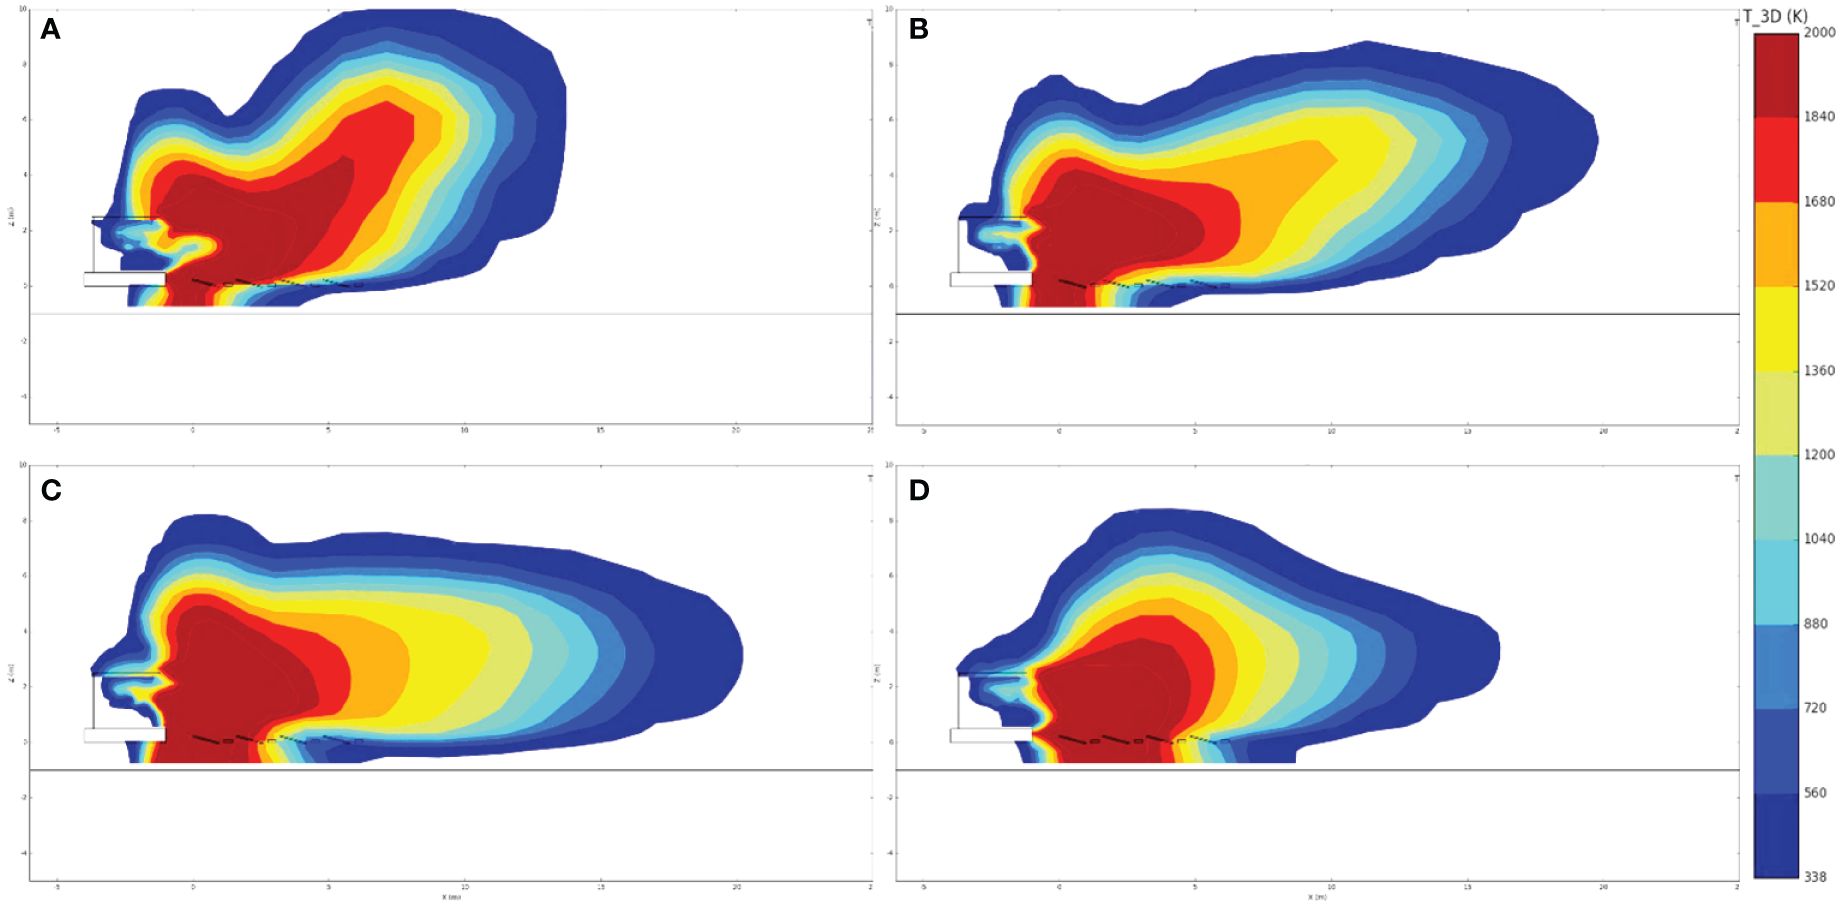
Figure 15 Lateral view of flame propagation from the FPVs-based hydrogen production platform at a time of 175 s. (A) Crosswind velocity = 2 m/s; (B) crosswind velocity = 5 m/s; (C) crosswind velocity = 10 m/s; (D) crosswind velocity = 20 m/s.
With the offshore wind velocity further increasing to 10 m/s, the hydrogen explosive flame is dominated by horizontal direction. Owing to the existence of a relatively high concentration of explosive vapor clouds farther away in horizontal direction, flame propagates immediately from the burned area to the unburned area. The horizontal distance affected by high temperature is more than 17 m, and the high temperature distribution is close to the offshore and FPV module. With the further enhancement of the offshore wind velocity to 10 m/s, the flame generated by the hydrogen explosion reaches the maximum propagation distance in the horizontal direction, and the resulting thermal damage distance to the FPV module also reaches the farthest. More than 15 m from the explosion source, the FPV module surface temperature is between 870 K and 910 K, resulting in falling in the strength and corrosion resistance of materials. Meanwhile, the deformation and creep of carbon steel reduced the strength of stainless steel at a severe level. If offshore wind velocity continues to rise to 20 m/s, the high-temperature effect in the horizontal direction does not extend all the way, but begins to weaken. The result can reveal that hydrogen dispersion behavior is limited under the action of strengthened offshore wind, and the explosive vapor cloud accumulates in the area near the leakage source. When the ignition source appears, the high temperature distribution generated by flame propagation is concentrated within a horizontal distance of 10 m. Because of the strong offshore wind velocity on the contrary, the flame propagation distance formed a certain inhibition effect, so the surface temperature of the FPV module outside the range of 10 m from the explosion source is 330 K. For the FPV modules, pontoons, inverters, and other equipment are in a relatively safe range. However, in the area within 7 m from the explosion source, the surface temperature of the FPV module is always higher than 880 K, which causes serious thermal damage consequences for both components and connected devices in the offshore FPV system. This study shows that the enhancement of offshore wind conditions restricts the upward hydrogen dispersion, resulting in temperature distribution concentrated in the horizontal direction. When offshore wind velocity continues to increase, it does not promote flame propagation, but forms a significant high temperature distribution zone in the area near the leakage source.
Figure 16 presents the temperature changes at different horizontal intervals under weak and strong offshore wind conditions. In Figure 16, the solid point indicates a wind velocity of 2 m/s, the hollow point means a wind velocity of 10 m/s, and the dotted point indicates a wind velocity of 20 m/s. Meanwhile, the red dot indicates that the position from the leakage source is 3 m away, the blue dot indicates that the position from the leakage source is 5 m away, the green dot means that the position from the leakage source is 7 m away, and the brown dot indicates that the position from the leakage source is 9 m away. Under the same offshore wind velocity, temperature increases with time. With the increase of distance between the horizontal position and leakage source, the change of temperature value is variable. When the offshore wind velocity is weak, temperature data show a decreasing trend with the increase of horizontal distance, and the temperature difference at different positions goes up gradually. In the marine environment characterized by strong wind, the data at 5 m and 7 m are close to temperature difference near the leakage source. It indicates that in this scenario, the high-temperature area is concentrated in the middle of the FPV module system. For the same accident time point, the change of temperature value produces different changes. If the time before the hydrogen explosion is 40.1 s, the difference of temperatures at changed horizontal positions under the influence of elevated wind velocities is small. With the development of time to 60 s, the temperature of different horizontal positions under strong wind conditions has a significant difference. After hydrogen explosion at a time of 106 s, the temperatures of different horizontal positions under strong and weak wind conditions show significant variation. It is found that the temperature with a long horizontal distance rises the most with the strengthening of wind conditions, while the temperature data are always lower than 569.9 K under weak wind conditions. According to the thermal damage criteria, the temperature decreases to moderate level at such temperature value. It leads the strength and hardness of cable decrease, and tempering color appears on the surface. Moreover, the melting and combustion of the pontoon may occur. The comparison of temperatures under strong and weak wind conditions reveals that the strengthening of offshore wind velocity causes the temperature difference at elevated horizontal positions to gradually rise with time. The high-temperature area in the weak wind environment is mainly in the range of 0–3 m horizontal spacing, while the high-temperature area in the strong wind environment is in the range of 5–7 m horizontal spacing.
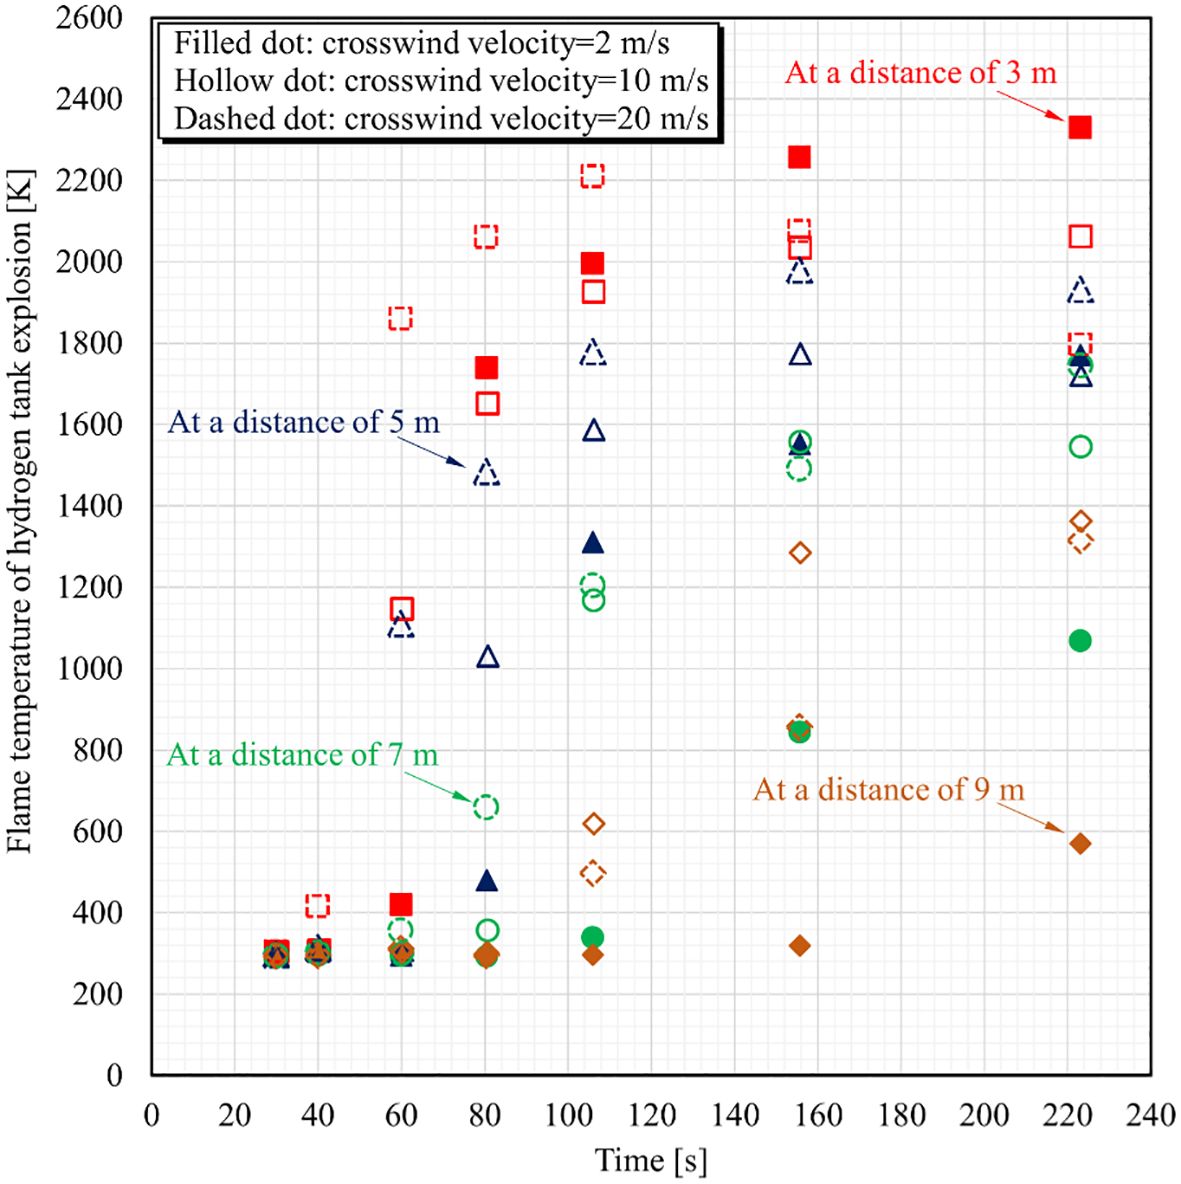
Figure 16 Thermal profiles of flame temperature growth sub-processes with the changed distances for varying offshore wind conditions.
This study investigates an engineering–numerical evaluation of damage performance in the offshore FPVs-based hydrogen production system due to potential hydrogen storage failure. It targets hydrogen leakage that is influenced by elevated offshore wind velocities in the system region. Throughout this study, the release mode, dynamic dispersion, and thermal hazard of each condition in the process are analyzed and determined to investigate their impact on the hydrogen production system. The main findings are presented as follows:
1) Enhanced wind effect restricts horizontal hydrogen release distance to a certain extent. Offshore wind condition is conducive to promoting the mixing degree of offshore air and hydrogen leakage, resulting in a decrease in hydrogen concentration. When wind velocity rises to 20 m/s, the horizontal distance of high concentration is reduced, and the longitudinal upward release movement is greatly weakened.
2) Under weak wind conditions, hydrogen disperses further in the horizontal direction, which cannot form explosive concentrations in the sea surface. The increase of wind velocity to 10 m/s has a great effect on time variability of hydrogen concentration, the fluctuation frequency of hydrogen dispersion concentration increases with time, and its fluctuation amplitude enhances significantly.
3) Offshore wind velocity increases to 20 m/s or even stronger, which has an inhibition effect on hydrogen dispersion distance. Hydrogen dispersion height reduces to nearly 4 m, and horizontal dispersion distance greatly decreases to less than 15 m.
4) Both transverse and longitudinal heat transfer decrease with the increase of distance from the explosion location. The FPV module in the immediate vicinity of explosion area is completely destroyed by flame-driven thermal damage. If offshore wind velocity rises over 20 m/s, thermal effect in the horizontal direction does not extend all the way, but begins to weaken.
The original contributions presented in the study are included in the article/supplementary material. Further inquiries can be directed to the corresponding author.
HW: Writing – original draft, Validation, Formal analysis, Conceptualization. KW: Writing – original draft, Project administration, Methodology, Funding acquisition, Data curation. XL: Writing – original draft, Visualization, Resources, Investigation. YL: Writing – original draft, Visualization, Software. ZQ: Writing – original draft, Validation, Supervision. SD: Writing – original draft, Supervision, Funding acquisition.
The author(s) declare financial support was received for the research, authorship, and/or publication of this article. This work is funded by the National Natural Science Foundation of China, grant number: 52001196.
The authors would like to express their sincere thanks to editors and reviewers for valuable comments.
Authors XL and SD were employed by the company Central-Tech Renewable Energy Technology Co.
The remaining authors declare that the research was conducted in the absence of any commercial or financial relationships that could be construed as a potential conflict of interest.
All claims expressed in this article are solely those of the authors and do not necessarily represent those of their affiliated organizations, or those of the publisher, the editors and the reviewers. Any product that may be evaluated in this article, or claim that may be made by its manufacturer, is not guaranteed or endorsed by the publisher.
Abdelkareem M. A., Abdelghafar A. A., Mahmoud M., Sayed E. T., Mahmoud M. S., Alami A. H., et al. (2023). Optimized solar photovoltaic-powered green hydrogen: current status, recent advancements, and barriers. Sol. Energy. 265, 112072. doi: 10.1016/j.solener.2023.112072
Abdo D. M., Mangialardi T., Medici F., Piga L. (2023). D-limonene as a promising green solvent for the detachment of end-of-life photovoltaic solar panels under sonication. Processes 11, 1848. doi: 10.3390/pr11061848
Abubakar A., Jibril M. M., Almeida C. F. M., Gemignani M., Yahya M. N., Abba S. I. (2023). A novel hybrid optimization approach for fault detection in photovoltaic arrays and inverters using AI and statistical learning techniques: a focus on sustainable environment. Processes 11, 2549. doi: 10.3390/pr11092549
Anifantis A. S., Colantoni A., Pascuzzi S. (2017). Thermal energy assessment of a small scale photovoltaic, hydrogen and geothermal stand-alone system for greenhouse heating. Renew. Energ. 103, 115–127. doi: 10.1016/j.renene.2016.11.031
Aram M., Zhang X., Reda I., Dghim M., Qi D., Ko Y. (2023). Similarity assessment of using helium to predict smoke movement through buildings with double skin façades during building integrated photovoltaics fires. J. Clean. Prod. 405, 136996. doi: 10.1016/j.jclepro.2023.136996
ASTM C856/C856M-20 (2020). Standard practice for petrographic examination of hardened concrete (West Conshohocken, PA, USA: American Society for Testing and Materials). doi: 10.1520/C0856_C0856M-20
Benghanem M., Almohamadi H., Haddad S., Mellit A., Chettibi N. (2024). The effect of voltage and electrode types on hydrogen production powered by photovoltaic system using alkaline and PEM electrolyzers. Int. J. Hydrogen. Energ. 57, 625–636. doi: 10.1016/j.ijhydene.2023.12.232
Bi C., Law A. W. (2023). Co-locating offshore wind and floating solar farms - effect of high wind and wave conditions on solar power performance. Energy 266, 126437. doi: 10.1016/j.energy.2022.126437
Bugeja R., Mule S. L., Branche N. (2021). The effect of wave response motion on the insolation on offshore photovoltaic installations. Sol. Energy. Adv. 1, 100008. doi: 10.1016/j.seja.2021.100008
Center for Chemical Process Safety (CCPS) (1994). Guidelines for evaluating the characteristics of vapor cloud explosions, flash fires, and BLEVEs (New York: Center for Chemical Process Safety of the American Institute of Chemical Engineers). doi: 10.1002/9780470938157
Daubech J., Proust C., Gentilhomme O., Jamois C., Mathieu L. (2013). Hydrogen-air vented explosion: new experimental data In. Proc. of 5th International Conference on Hydrogen Safety, Brussels, Belgium.
El-Amin M. F., Kanayama H. (2009). Similarity consideration of the buoyant jet resulting from hydrogen leakage. Int. J. Hydrogen. Energ. 34, 5803–5809. doi: 10.1016/j.ijhydene.2009.05.059
Ghigo A., Faraggiana E., Sirigu M., Mattiazzo G., Bracco G. (2022). Design and analysis of a floating photovoltaic system for off-shore installation: the case study of Lampedusa. Energies 15, 8804. doi: 10.3390/en15238804
Golroodbari S., Sark W. V. (2022). On the effect of dynamic albedo on performance modelling of offshore floating photovoltaic systems. Sol. Energy. Adv. 2, 100016. doi: 10.1016/j.seja.2022.100016
Jacklitsch B., Williams J., Musolin K., Coca A., Kim J. H., Turner N. (2016). Criteria for a recommended standard: occupational exposure to heat and hot environments (Washington, DC., USA: National Inst. for Occupational Safety and Health). Report number: 2016–106.
Jens S. K., Farah B., Grunde J. (2020). Experimental study of flame spread underneath photovoltaic (PV) modules. Fire. Safety. J. 120, 103027. doi: 10.1016/j.firesaf.2020.103027
Jiang Z., Dai J., Saettone S., Tørå G., He Z., Bashir M., et al. (2023). Design and model test of a soft-connected lattice-structured floating solar photovoltaic concept for harsh offshore conditions. Mar. Struct. 90, 103426. doi: 10.1016/j.marstruc.2023.103426
Kuznetsov M., Friedrich A., Stern G., Kotchourko N., Jallais S., L’Hostis B. (2015). Medium-scale experiments on vented hydrogen deflagration. J. Loss. Prevent. Proc. 36, 416–428. doi: 10.1016/j.jlp.2015.04.013
Li H., Jiang Z., Li Z., Peng Y., Zhang Q., Xiao X. (2023). The interface strengthening of multi-walled carbon nanotubes/polylactic acid composites via the in-loop hybrid manufacturing method. Polymers 15, 4426. doi: 10.3390/polym15224426
Liao B., Ju X., Lai D., Yang L. (2023). Experimental study of combustion characteristics of PET laminated photovoltaic panels by fire calorimetry. Sol. Energ. Mat. Sol. C. 253, 112242. doi: 10.1016/j.solmat.2023.112242
Liu Z., Ma C., Li X., Deng Z., Tian Z. (2023). Aquatic environment impacts of floating photovoltaic and implications for climate change challenges. J. Environ. Manage. 346, 118851. doi: 10.1016/j.jenvman.2023.118851
Magkouris A., Rusu E., Rusu L., Belibassakis K. (2023). Floating solar systems with application to nearshore sites in the Greek Sea Region. J. Mar. Sci. Eng. 11, 722. doi: 10.3390/jmse11040722
Mannino G., Tina G. M., Cacciato M., Merlo L., Cucuzza A. V., Bizzarri F., et al. (2023). Photovoltaic module degradation fore-cast models for onshore and offshore floating systems. Energies 16, 2117. doi: 10.3390/en16052117
Pandeya S. P., Zou S., Roh B. M., Xiao X. (2022). Programmable thermo-responsive self-morphing structures design and performance. Materials 15, 8775. doi: 10.3390/ma15248775
Peng L., Liu B., Zheng S., Chen X., Zhong Q., Chai X. (2023). A new dynamic 2D fusion model and output characteristic analysis of floating photovoltaic modules considering motion and environmental factors. Energ. Convers. Manage. 294, 117588. doi: 10.1016/j.enconman.2023.117588
Ravichandran N., Fayek H. H., Rusu E. (2021). Emerging floating photovoltaic system-case studies high dam and Aswan reservoir in Egypt. Processes 9, 1005. doi: 10.3390/pr9061005
Rodríguez-Benítez O., Ponce S. M., Aqui T. J. A., Rodríguez B. Ó. M., Lozoya P. R. E., Adamas P. H. (2023). Active power-decoupling methods for photovoltaic-connected applications: an overview. Processes 11, 1808. doi: 10.3390/pr11061808
Song J., Kim J., Chung W. C., Jung D., Kang Y. J., Kim S. (2023). Wave-induced structural response analysis of the supporting frames for multiconnected offshore floating photovoltaic units installed in the inner harbor. Ocean. Eng. 271, 113812. doi: 10.1016/j.oceaneng.2023.113812
Tanaka T., Azuma T., Evans J. A., Cronin P. M., Johnson D. M., Cleaver R. P. (2007). Experimental study on hydrogen explosions in a full-scale hydrogen filling station model. Int. J. Hydrogen. Energ. 32, 2162–2170. doi: 10.1016/j.ijhydene.2007.04.019
Vaverková M. D., Winkler J., Uldrijan D., Ogrodnik P., Vespalcová T., Aleksiejuk G. J., et al. (2022). Fire hazard associated with different types of photovoltaic power plants: effect of vegetation management. Renew. Sust. Energ. Rev. 162, 112491. doi: 10.1016/j.rser.2022.112491
Vlaswinkel B., Roos P., Nelissen M. (2023). Environmental observations at the first offshore solar farm in the North Sea. Sustainability 15, 6533. doi: 10.3390/su15086533
Wang Y., Dai H., Chen Z., He S., Wang W., Gao M. (2024b). Simulation study on a novel solid–gas coupling hydrogen storage method for photovoltaic hydrogen production systems. Energ. Convers. Manage. 299, 117866. doi: 10.1016/j.enconman.2023.117866
Wang K., He Y., Liu Z., Qian X. (2019). Experimental study on optimization models for evaluation of fireball characteristics and thermal hazards induced by LNG vapor cloud explosions based on colorimetric thermometry. J. Hazard. Mater. 366, 282–292. doi: 10.1016/j.jhazmat.2018.10.087
Wang K., Liu Z., Qian X., Huang P. (2017). Long-term consequence and vulnerability assessment of thermal radiation hazard from LNG explosive fireball in open space based on full-scale experiment and PHAST. J. Loss. Prevent. Proc. 46, 13–22. doi: 10.1016/j.jlp.2017.01.001
Wang K., Ming Y., Liu X., Wang H., He Y. (2024a). Effect of lateral airflow on initial HSI and flame behavior of marine fuel in a ship engine room: experiment and analysis. J. Mar. Sci. Eng. 12, 5. doi: 10.3390/jmse12010005
Wang K., Ming Y., Wang H., Liu X., Qian X., Shi T. (2023). Failure analysis and correction models for upward flame characteristics subjected to shipping container fire. Eng. Fail. Anal. 152, 107519. doi: 10.1016/j.engfailanal.2023.107519
Wang K., Ming Y., Zhao H., Jiao Y., Shi T., Zhang Q. (2022). Effect of shock-flame interactions on initial damage characteristics in highway tunnel under hazmat tanker truck accident. Tunn. Undergr. Sp. Tech. 130, 104763. doi: 10.1016/j.tust.2022.104763
Wang K., Qian X., He Y., Shi T., Zhang X. (2020). Failure analysis integrated with prediction model for LNG transport trailer and thermal hazards induced by an accidental VCE: A case study. Eng. Fail. Anal. 108, 104350. doi: 10.1016/j.engfailanal.2019.104350
Xiao X., Chu B., Zhang Z. (2022a). Quality quantification and control via novel self-growing process-quality model of parts fabricated by LPBF process. Materials 15, 8520. doi: 10.3390/ma15238520
Xiao X., Roh B. M., Hamilton C. (2022b). Porosity management and control in powder bed fusion process through process-quality interactions. CIRP. J. Manuf. Sci. Tec. 38, 120–128. doi: 10.1016/j.cirpj.2022.04.005
Xiao X., Waddell C., Hamilton C., Xiao H. (2022c). Quality prediction and control in wire arc additive manufacturing via novel machine learning framework. Micromachines 13, 137. doi: 10.3390/mi13010137
Xu P., Wellens P. R. (2022). Theoretical analysis of nonlinear fluid–structure interaction between large-scale polymer offshore floating photovoltaics and waves. Ocean. Eng. 249, 110829. doi: 10.1016/j.oceaneng.2022.110829
Yan C., Shi W., Han X., Li X., Verma A. S. (2023). Assessing the dynamic behavior of multi-connected offshore floating photovoltaic systems under combined wave-wind loads: A comprehensive numerical analysis. Sustain. Horizons 8, 100072. doi: 10.1016/j.horiz.2023.100072
Yang R., Zang Y., Yang J., Wakefield R., Nguyen K., Shi L., et al. (2023). Fire safety requirements for building integrated photovoltaics (BIPV): A cross-country comparison. Renew. Sust. Energ. Rev. 173, 113112. doi: 10.1016/j.rser.2022.113112
Yarmolenko P. S., Moon E. J., Landon C., Manzoor A., Hochman D. W., Viglianti B. L., et al. (2011). Thresholds for thermal damage to normal tissues: an update. Int. J. Hyperther. 27, 320–343. doi: 10.3109/02656736.2010.534527
Keywords: floating photovoltaic, hydrogen production, hydrogen release, thermal damage, offshore wind
Citation: Wang H, Wang K, Liu X, Liu Y, Qian Z and Ding S (2024) Evaluation of damage performance in offshore floating photovoltaics-based hydrogen production system due to potential hydrogen release. Front. Mar. Sci. 11:1413678. doi: 10.3389/fmars.2024.1413678
Received: 07 April 2024; Accepted: 10 June 2024;
Published: 04 July 2024.
Edited by:
Changqing Jiang, University of Duisburg-Essen, GermanyReviewed by:
Bo Lei, Southwest Jiaotong University, ChinaCopyright © 2024 Wang, Wang, Liu, Liu, Qian and Ding. This is an open-access article distributed under the terms of the Creative Commons Attribution License (CC BY). The use, distribution or reproduction in other forums is permitted, provided the original author(s) and the copyright owner(s) are credited and that the original publication in this journal is cited, in accordance with accepted academic practice. No use, distribution or reproduction is permitted which does not comply with these terms.
*Correspondence: Kan Wang, d2FuZ2tAc2htdHUuZWR1LmNu
Disclaimer: All claims expressed in this article are solely those of the authors and do not necessarily represent those of their affiliated organizations, or those of the publisher, the editors and the reviewers. Any product that may be evaluated in this article or claim that may be made by its manufacturer is not guaranteed or endorsed by the publisher.
Research integrity at Frontiers
Learn more about the work of our research integrity team to safeguard the quality of each article we publish.