 Yubin Chen1,2
 Yu Zhang
94% of researchers rate our articles as excellent or good
Learn more about the work of our research integrity team to safeguard the quality of each article we publish.
Find out more
ORIGINAL RESEARCH article
Front. Mar. Sci., 16 May 2024
Sec. Coastal Ocean Processes
Volume 11 - 2024 | https://doi.org/10.3389/fmars.2024.1413548
This article is part of the Research TopicImpact of Ocean Forcing on the Coastal Hydrology, Environment and Freshwater ResourcesView all 12 articles
Seawater intrusion poses a significant threat to the water supply of coastal cities both presently and in the future. It is crucial to identify the controllable factors influencing seawater intrusion, both natural and anthropogenic, in order to ensure water supply security. This study examined seawater intrusion characteristics using monitoring data from 1994 to 2019. Factors such as daily flow rate, duration of intrusion, water quality, and tidal level were analyzed to establish correlations and identify the primary influencing factors in the Yangtze River Estuary. The findings reveal that seawater intrusion in this area is most prevalent from November to April, peaking in February and March. The key controllable factors affecting chloride levels at the intake are the daily flow rate at Datong Station and the tidal range at Xuliujing Station. Additionally, the study proposes control methods to safeguard water supply, including providing daily flow rate values for flushing seawater intrusion at Datong Station under different tidal ranges and intrusion durations. These research results provide valuable guidance for the emergency operation of the Three Gorges-centered reservoir group against seawater intrusion.
Seawater intrusion usually occurs at the confluence of rivers and oceans. When the sea level at the river mouth is higher than the river level, seawater will flow into the river, and seawater intrusion will spread upstream along the river from the river mouth. The intrusion at the river mouth is mainly due to natural factors, but there are also human factors (Casillas-Trasvina et al., 2019; Xiao et al., 2021; Hu et al., 2024). The problem of seawater intrusion at river mouths is a major issue affecting the construction of water sources for coastal cities at present and in the future (Liu et al., 2014; El-Jaat et al., 2018; Chen et al., 2019).
Tides and currents are the power source of the mixing of seawater and freshwater, caused by the gravitational forces of celestial bodies, and they have a crucial impact on seawater intrusion (Paiva and Schettini, 2021). The effects of tides and currents on seawater intrusion include: the convective transport of currents, turbulent mixing caused by tides, and the combined effect of tides and topography leading to tidal trapping and tidal transport (Li et al., 2022). Wind also has a significant impact on seawater intrusion (Tao et al., 2020). Different wind speeds and directions result in varying strengths of the rising and falling tides in the estuarine area, thus affecting seawater intrusion differently. Under the influence of different wind speeds and directions, the estuarine area can generate different horizontal circulations, which may have a certain impact on seawater intrusion in the estuarine area (Li et al., 2020). The decrease in upstream runoff during the dry season is also a major cause of seawater intrusion (He et al., 2018). Seawater backflow often occurs in the dry season of years with low upstream water flow. In addition, as a result of natural changes in river channels and human activities such as sand excavation and dredging of waterways, widespread riverbed incision in estuarine areas and deepening of major tidal channels occur, particularly during the dry season of large tides with low runoff (Li et al., 2023). The decrease in river flow and the relative increase in the action of tidal currents lead to increased seawater backflow. The rising sea level also promotes seawater backflow (Roy and Datta, 2018). Over the past 100 years, the global average sea level has been rising at a rate of 0.18 cm per year. With further global warming, the sea level is expected to rise more rapidly in the 21st century. It is predicted that the sea level will rise by 0.65 to 1 m in the 21st century (Boumis et al., 2023). By the year 2000, the sea level along the Chinese coast was rising at a rate of 0.25 cm per year. By 2030, the relative sea level rise range at the mouth of the Yangtze River will be 0.23 to 0.42 m, and it will rise by nearly 1 m in the 21st century, which will exacerbate seawater intrusion during the dry season (Zhou et al., 2022; Mu et al., 2024).
The Yangtze River Estuary is a densely populated and economically developed area in China, serving as the center for the country’s economy, transportation, science and technology, industry, finance, trade, exhibitions, and shipping. With the development of the national economy and the rapid increase in population, the water supply in Shanghai is becoming increasingly strained. The seawater intrusion in the dry season every year seriously threatens the water intake of the Yangtze River source in Shanghai, leading to various water safety issues in production and daily life caused by seawater. This situation severely restricts the development and utilization of water resources in the Yangtze River Estuary and its economic development. The degree of seawater intrusion in the Yangtze River Estuary is closely related to factors such as the flow of the main stream of the Yangtze River, tides, wind stress, estuary morphology, and underwater topography, generally occurring from November to April during the dry season of winter and spring. During the dry season, the water supply reservoirs in the Yangtze River Estuary of Shanghai City are all threatened and affected by seawater intrusion for a certain period, with each intrusion generally lasting 5 to 7 days.
One of the more common and effective methods for preventing and resisting seawater intrusion is to adopt water diversion measures to “use freshwater to counter seawater” (Zhang et al., 2021). According to the overall layout of the comprehensive planning of the Yangtze River basin, a large number of key water control projects for the main and tributary rivers of the Yangtze River are being gradually implemented (Wang et al., 2022). As of 2019, more than 300 large reservoirs (with a total capacity of over 100 million cubic meters) have been built in the Yangtze River basin, with a total regulated capacity of over 180 billion cubic meters (Xu et al., 2023). Among them, there are 111 large reservoirs (above Yichang) in the upper reaches of the Yangtze River, with a total regulated capacity of over 80 billion cubic meters, continuously enhancing the regulation capacity of water resources in the Yangtze River basin (Wang et al., 2023). The development and regulation of water resources in the Yangtze River basin have already and will further impact the water resources situation and ecological environment in the Yangtze River Estuary (Chen et al., 2023). The impact of water resource regulation on the situation of seawater intrusion in the Yangtze River Estuary has become a widely concerned issue. Seawater intrusion is a major issue affecting the water supply of coastal cities at present and in the future. Identifying controllable key factors has important implications for ensuring water supply security. Therefore, based on monitoring data from 1994 to 2019, this study analyzed the characteristics of seawater intrusion. Factors such as daily average flow, duration of seawater intrusion, water quality, and tide level were selected to establish relevant relationships and identify the main controllable influencing factors of seawater intrusion in the Yangtze River Estuary. The results offer valuable guidance for emergency scheduling during seawater backflow in the reservoir group centered around the Three Gorges.
The Yangtze River Estuary is located in the Yangtze River Delta region, as shown in Figure 1. The tidal boundary of the Yangtze River Estuary is at Datong Station, which is 624 km away from the mouth of the river. Before the formation of the Xuliujing section during the 1950s to 1970s, the upper boundary of the estuarine section of the Yangtze River was generally considered to be at Jiangyin station. After the formation of the Xuliujing section, it is generally believed that the Xuliujing station is more reasonable as the upper boundary of the estuary section of the Yangtze River. The plan form of the estuary section of the Yangtze River is in the shape of a trumpet, with three levels of branching and four mouths entering the sea. The width of the river at the inlet of Xuliujing is 4.7 km. Below Xuliujing, Chongming Island divides the Yangtze River into its southern and northern branches. The mouth of the Yangtze River is a moderately tidal estuary, which is influenced by both the runoff of the Yangtze River and the ocean tides. There are numerous river channels on both sides of the river, making it a typical tidal plain river network area.
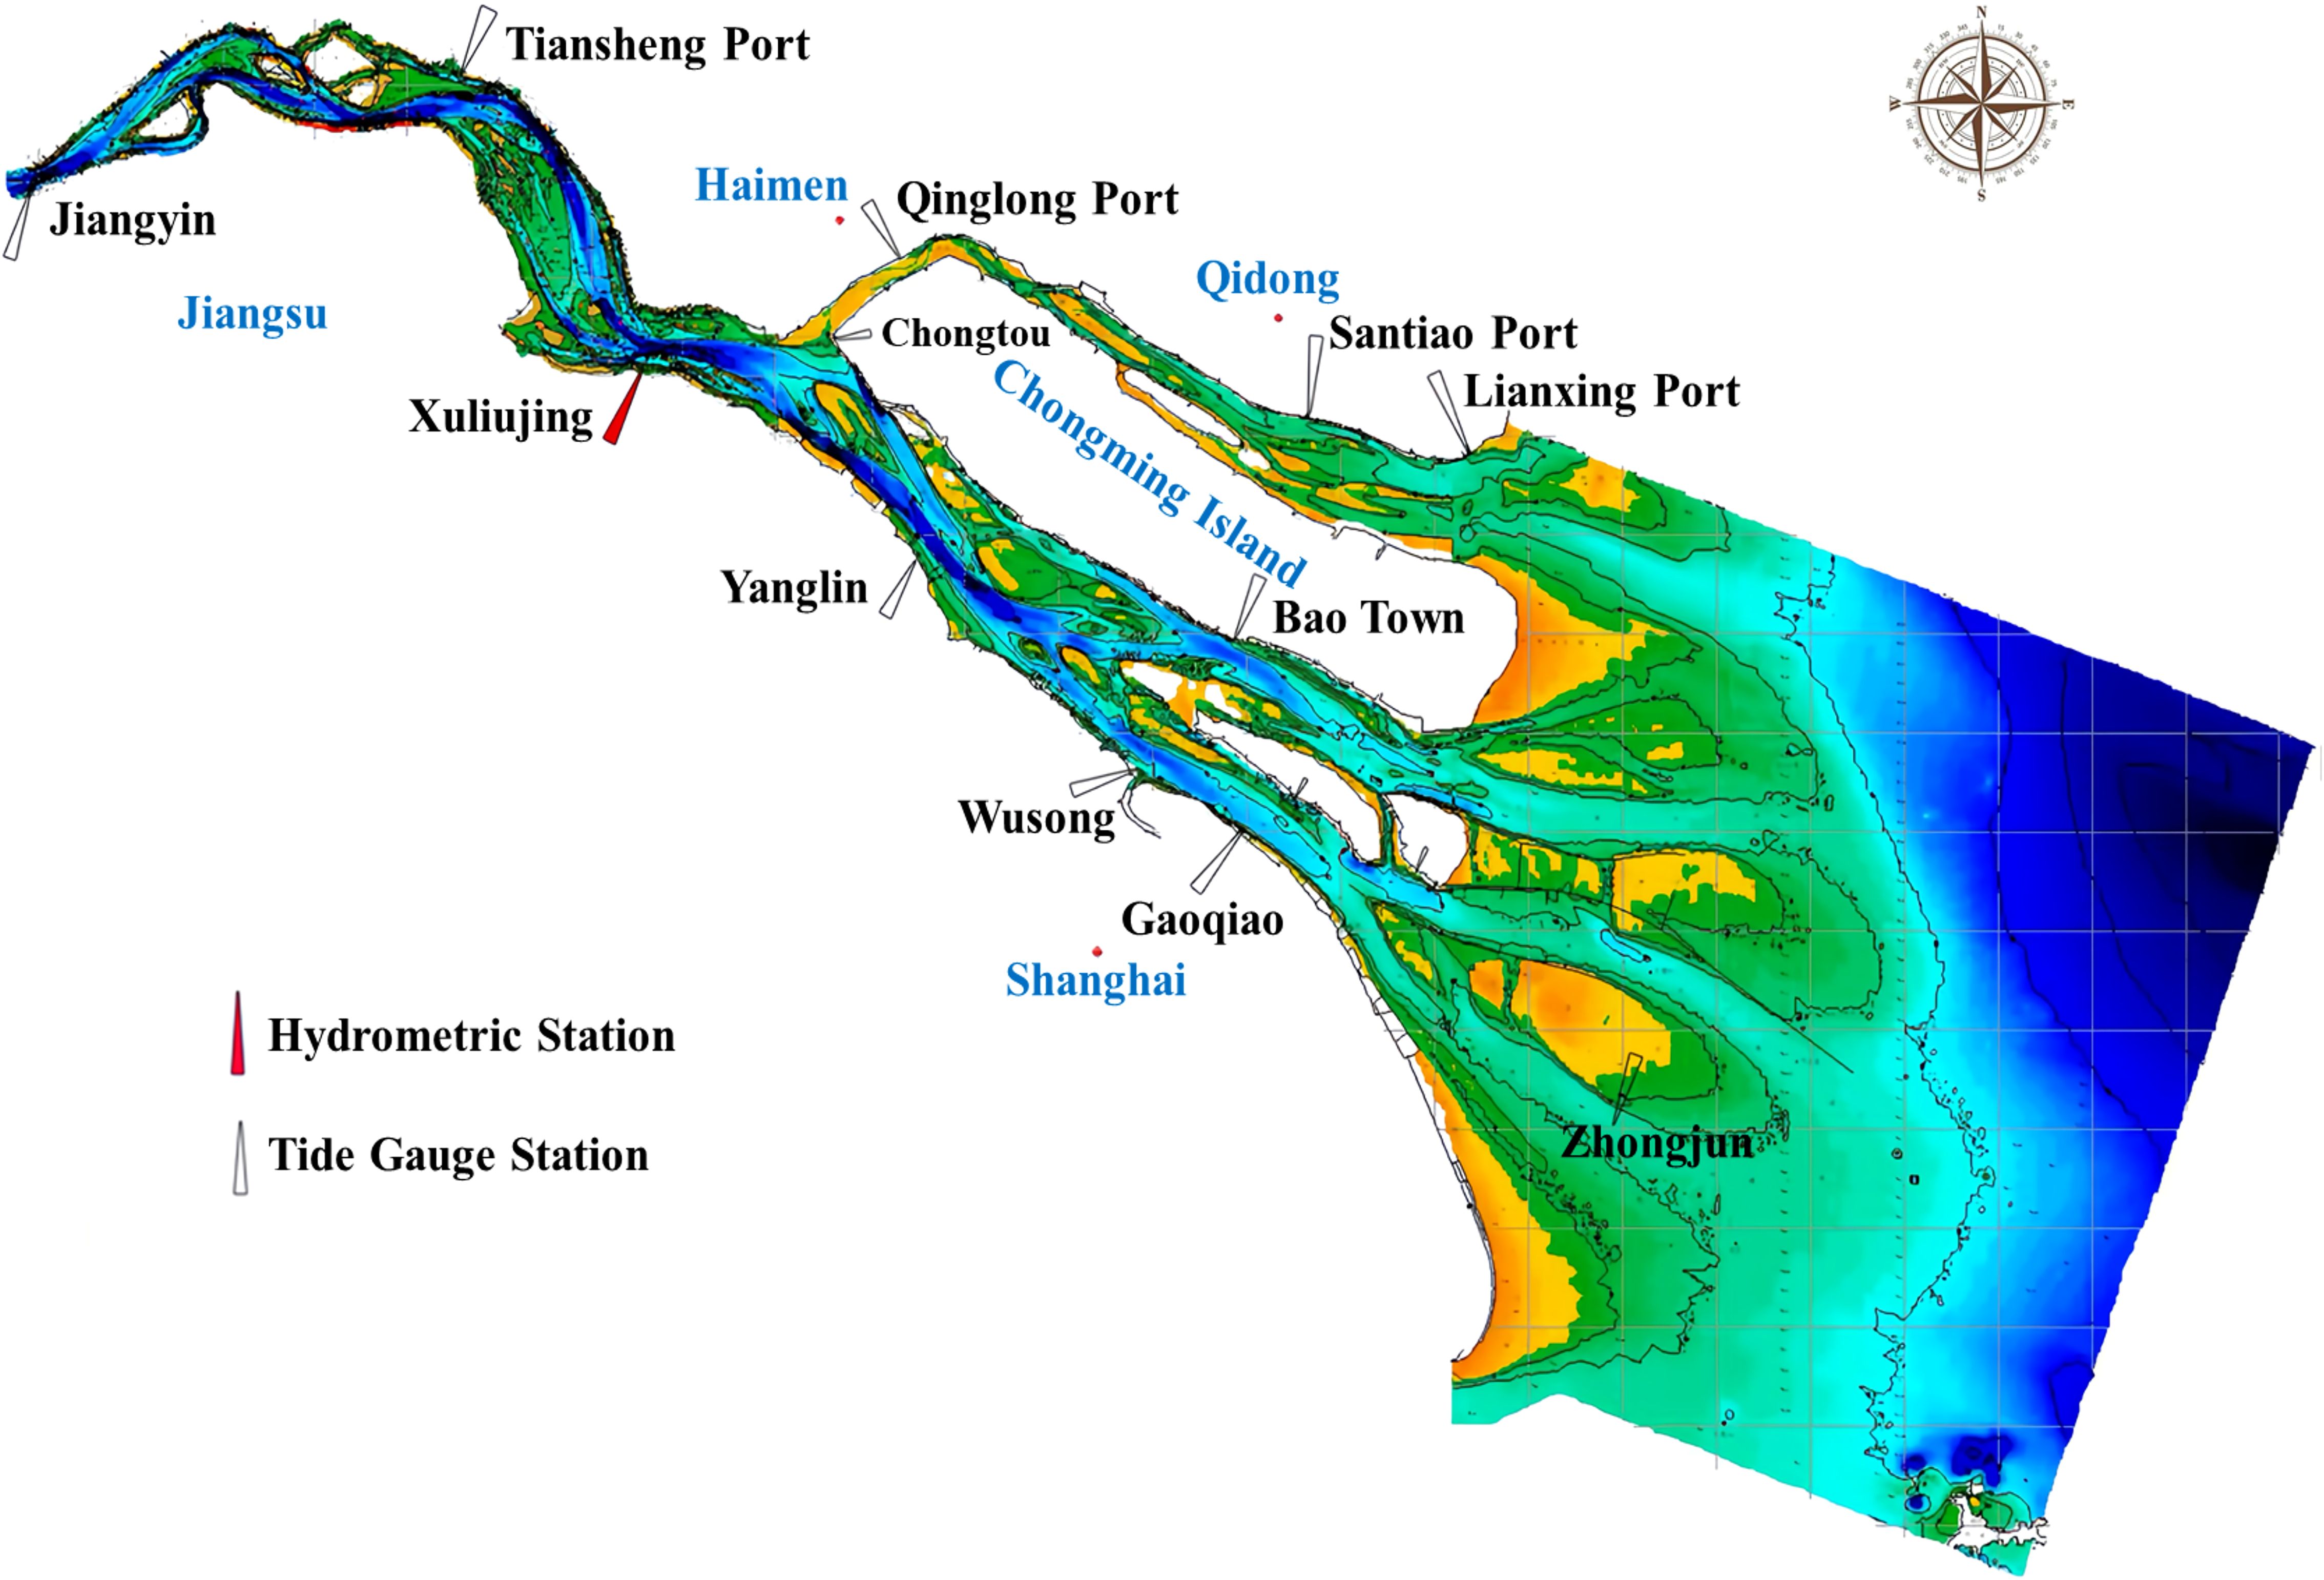
Figure 1 Map of study area.
In the usual sense, the Yangtze River Estuary refers to the estuary below Xuliujing, where the flow of Xuliujing represents the actual seaward flow. However, due to the back-and-forth flow at the Xuliujing station, its flow characteristics are difficult to describe. On the other hand, the Xuliujing station only started to have flow compilation data since 2005, with a short data sequence that does not match the long-term salinity measured data, making it difficult to establish a relevant relationship. Previous studies focused on the Datong station, establishing the relationship between the flow of Datong station and the salinity intrusion intensity of the estuary water source area. Some scholars also established the relationship between the flow of Datong station and the flow of Xuliujing station through investigations of the water diversion and drainage along the river. However, these works were carried out before 2005, without verified flow data of Xuliujing station (Chen et al., 2018; Mei et al., 2019). This study establishes the relationship between the flow of Datong station and the flow of Xuliujing station by collecting flow compilation data of Datong station and Xuliujing station in recent years, and simultaneously studies the response time of estuarine salinity to changes in upstream flow.
Analysis of the daily net flux of Xuliujing station and the daily flow of Datong Xuliujing station from January to December 2013 was conducted. The relationship between the daily net flux of Xuliujing and the flow of Datong in 2013 is shown in Figure 2. It can be observed from the figure that the daily flow of Datong changes relatively steadily, mainly influenced by tides, while the net flux shows larger daily fluctuations. However, overall, the difference in flow between Datong and Xuliujing station mostly falls within the range of ±5000 m3/s.
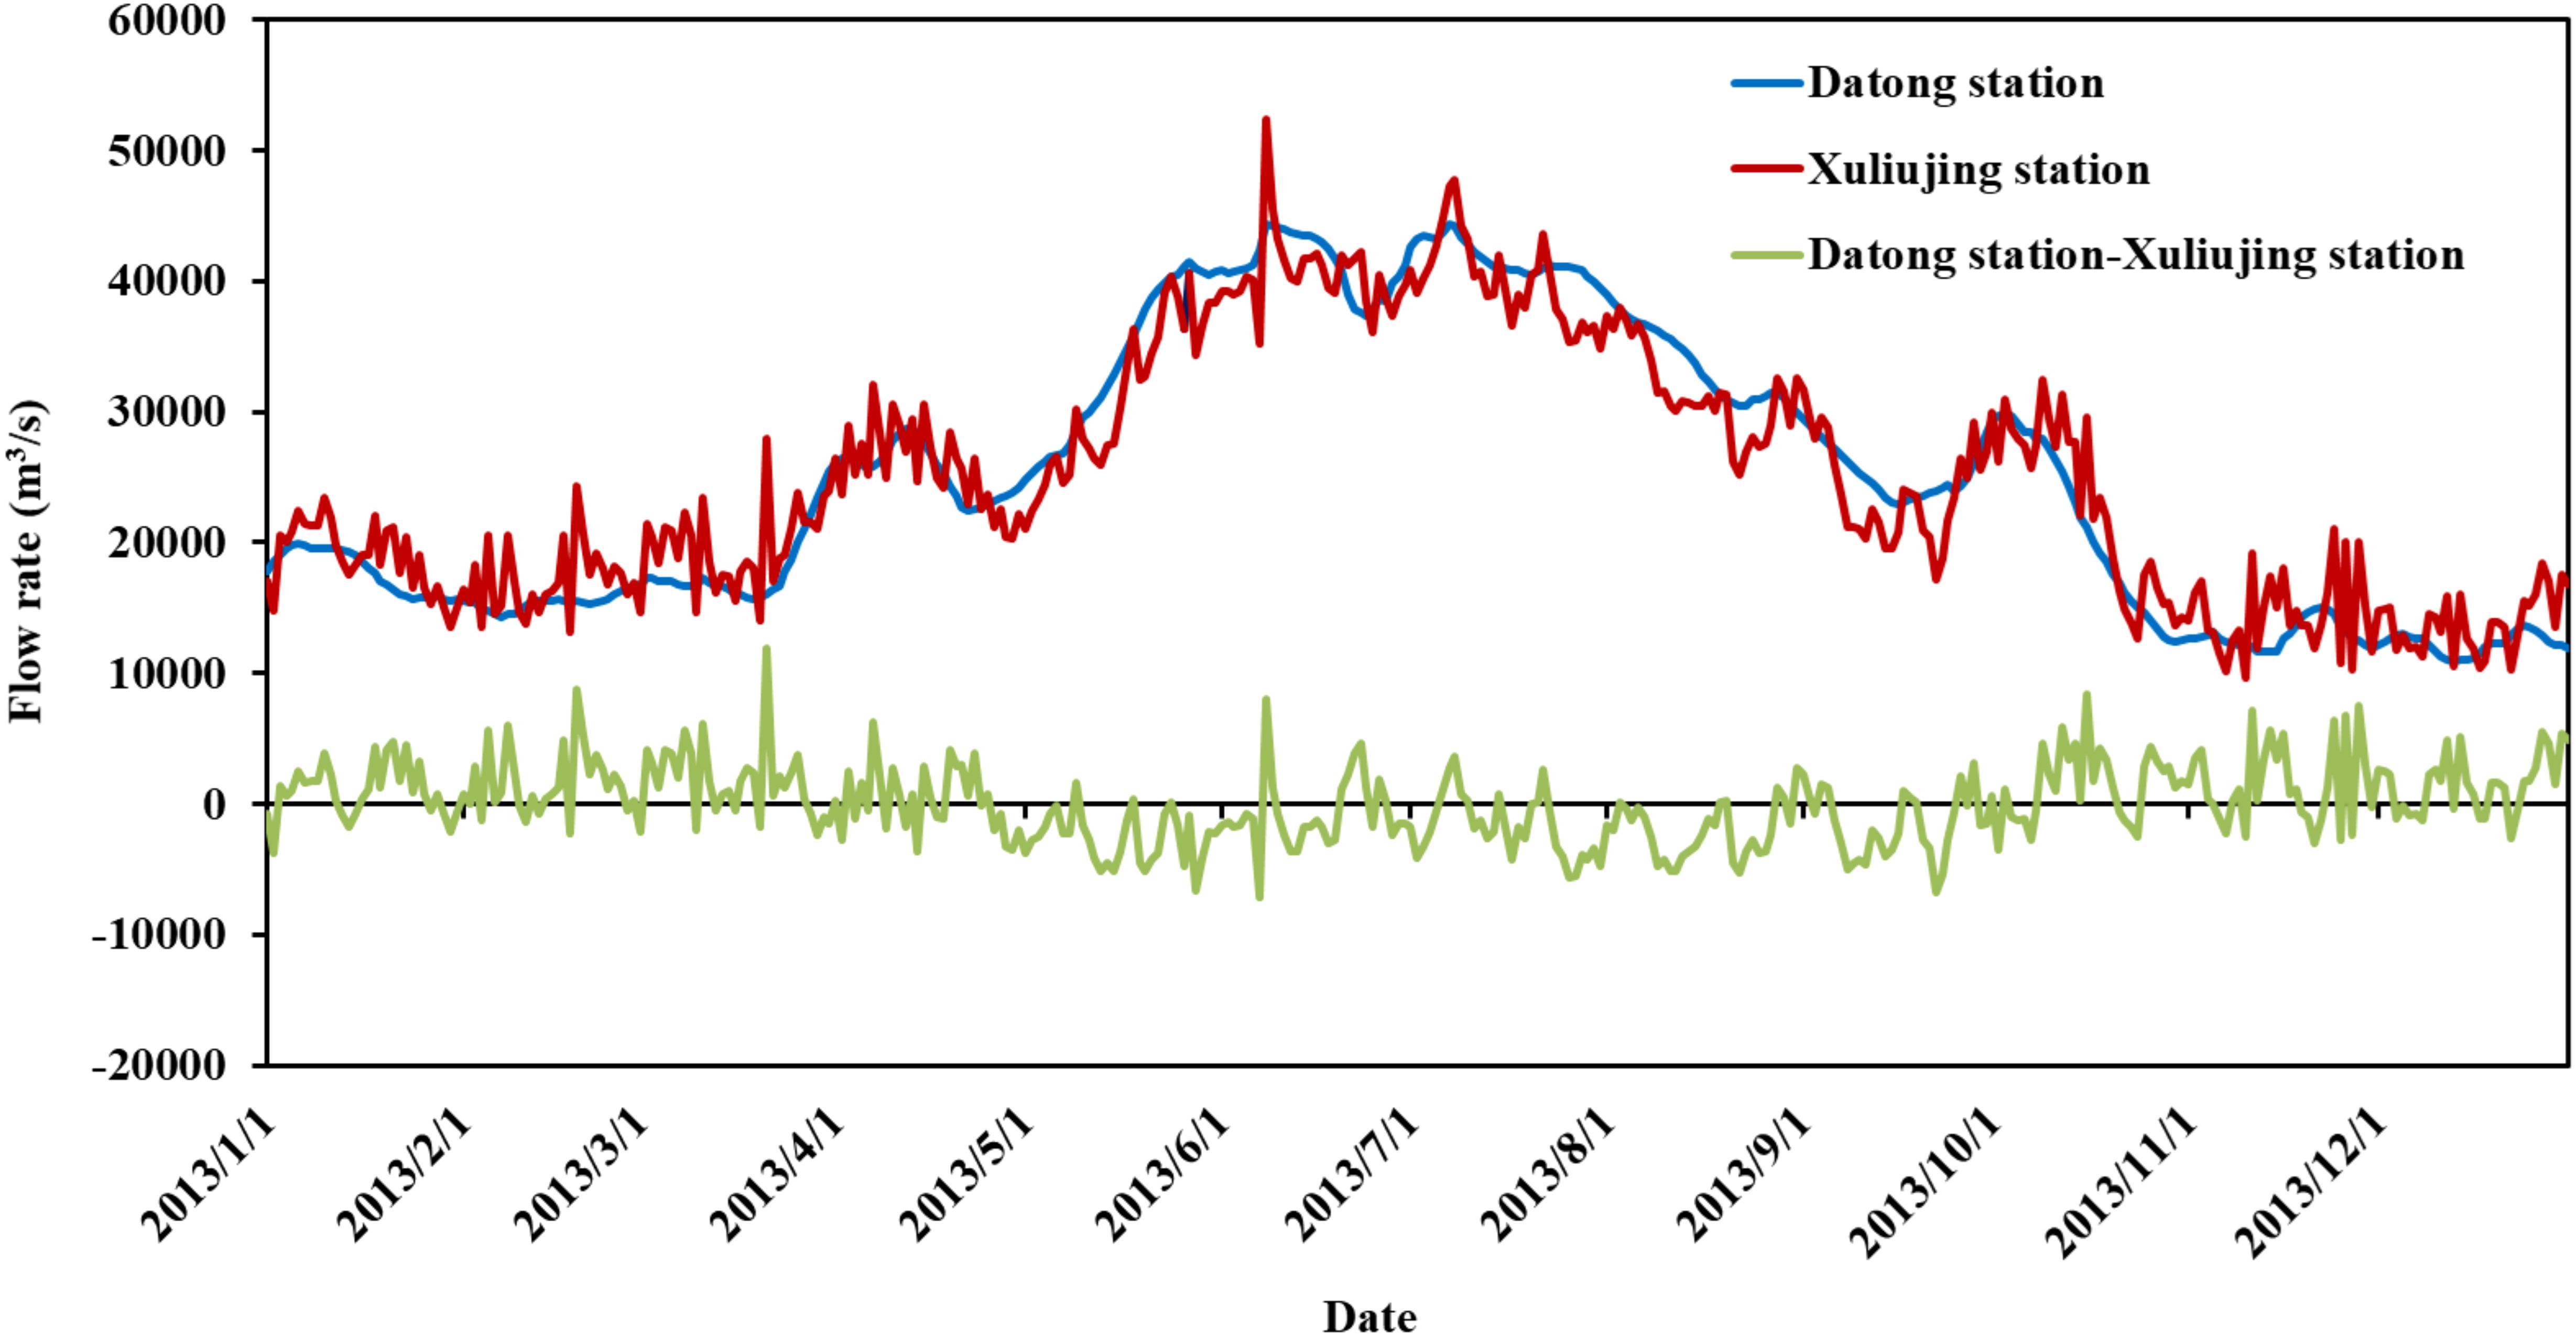
Figure 2 Relationship between the flow at Datong station and the net flux at Xuliujing station in 2013.
The relationship between the monthly average flow of Datong station and Xuliujing station in 2013 is illustrated in Figure 3. It can be seen that during the dry season, the monthly net flux of Xuliujing is similar to the monthly flow of Datong. In most dry season months, the net flux of Xuliujing is slightly greater than the monthly flow of Datong. In months where the monthly net flux of Xuliujing is less than the monthly flow of Datong, the difference generally does not exceed 600 m3/s.
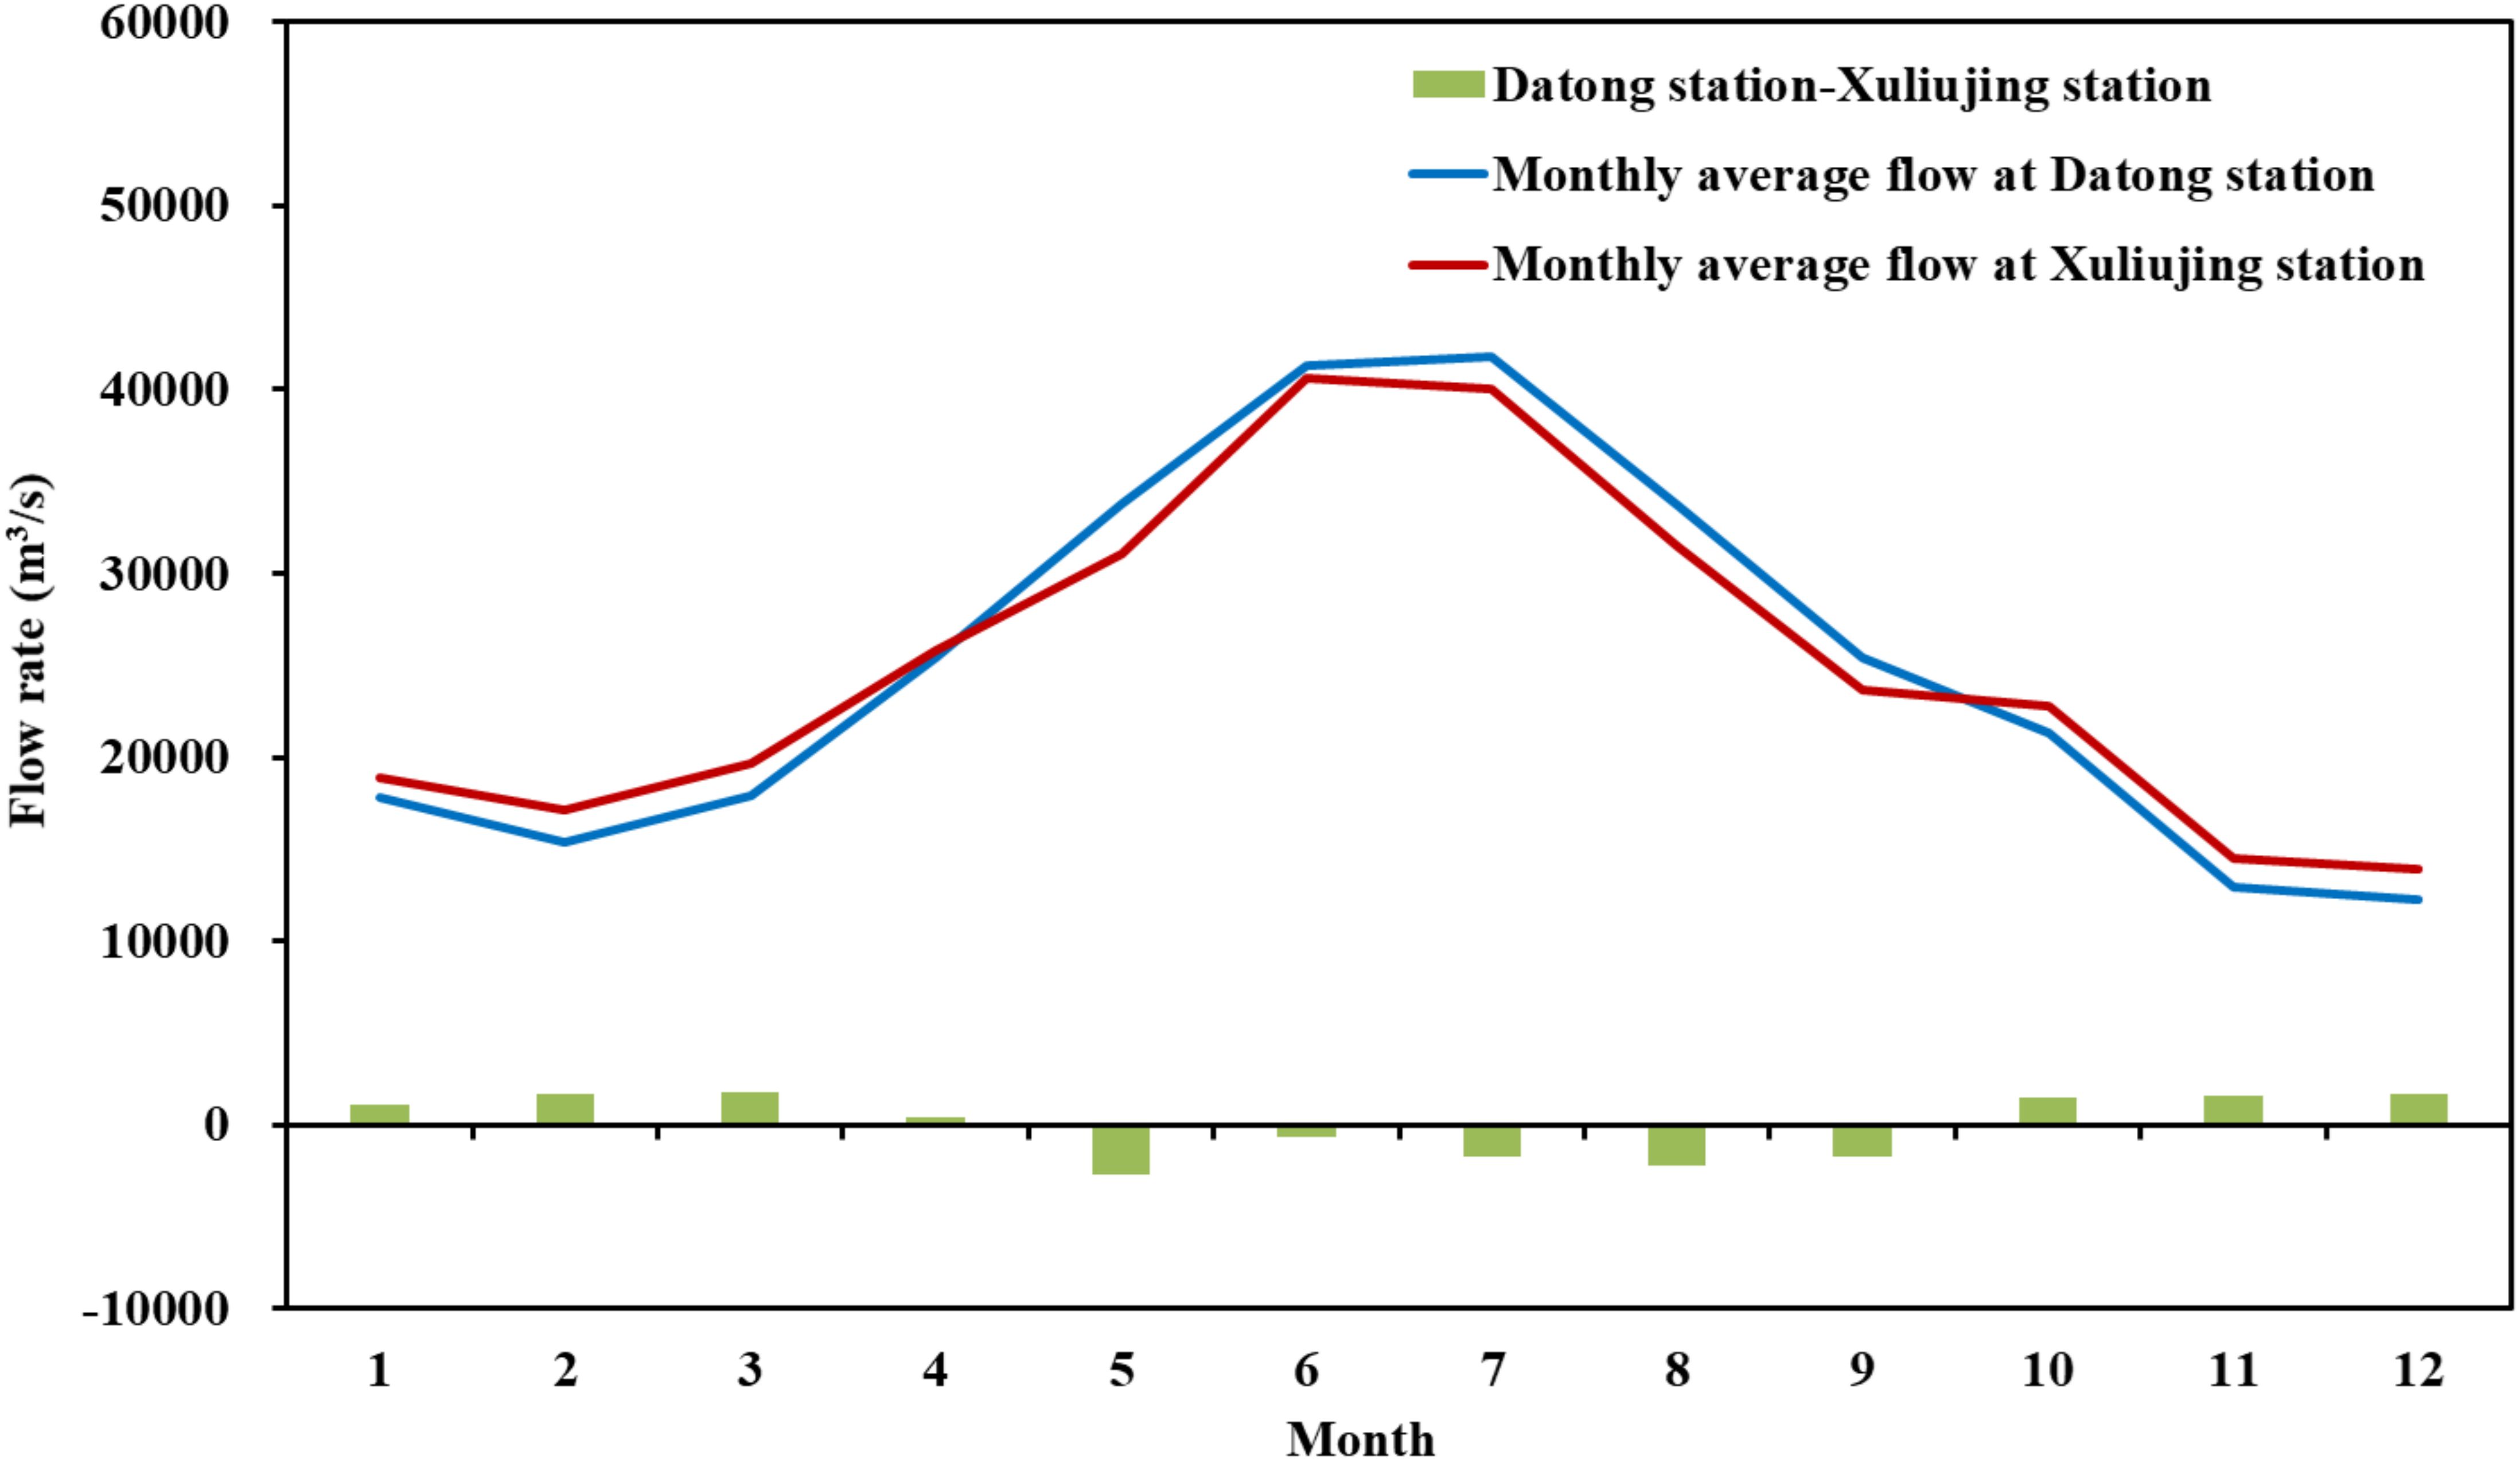
Figure 3 Comparison of the monthly average flow at Datong station and Xuliujing station in 2013.
The relationship between the monthly average net flux of Xuliujing and the monthly average flow of Datong from January to December 2013 is shown in Figure 4. It can be observed from the figure that the difference between the two is relatively small. Based on the above analysis, there is a good correlation between the flow at Datong station and the net flux at Xuliujing station at both daily and monthly levels. Therefore, using the flow at Datong station to replace the net flux at Xuliujing station is reasonable and feasible.
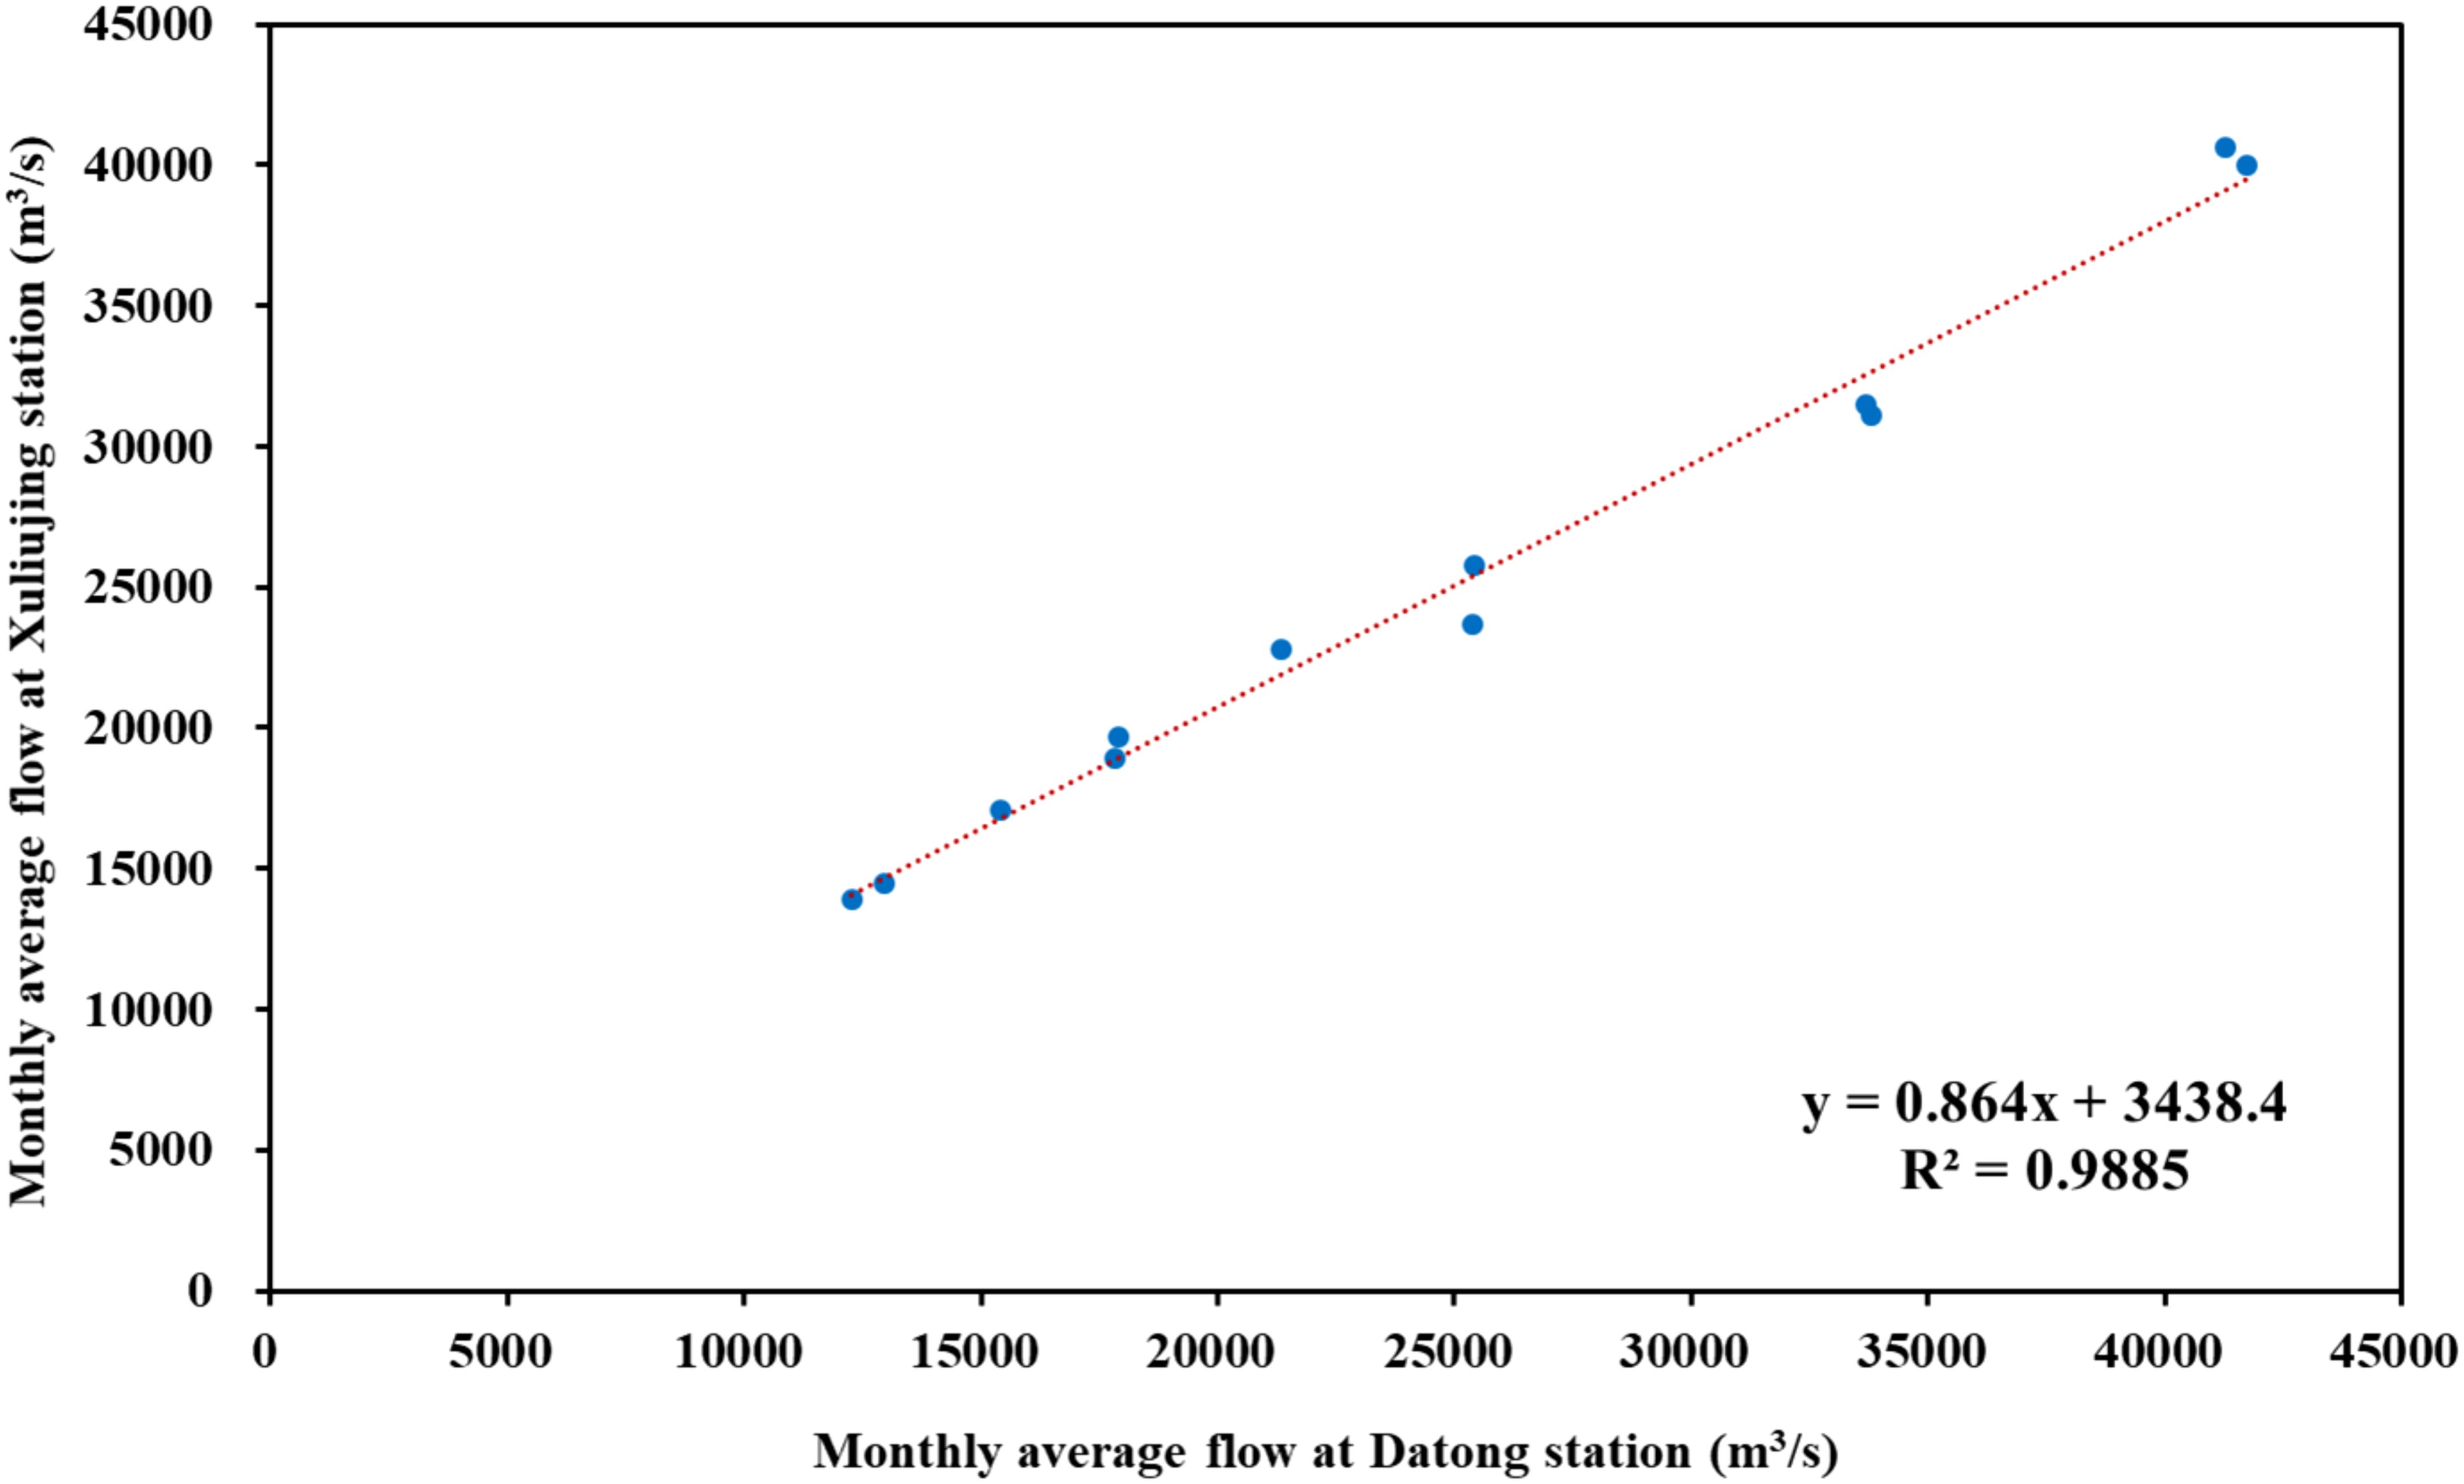
Figure 4 Relationship between the monthly average flow at Datong and the monthly average net flux at Xuliujing in 2013.
Potential factors affecting seawater intrusion at the Yangtze River Estuary include tides and tidal currents, wind, reduced upstream flow during the dry season, changes in the estuary and river channel topography, increasing water supply from the upstream areas within the basin, changes in the river channel bifurcation ratio, and rising sea levels.
Tides have a medium to small-scale periodic impact on the intrusion of seawater into the Yangtze River Estuary. The tidal regime in the Yangtze River Estuary is significantly influenced by astronomical tides, exhibiting irregular semi-diurnal tidal characteristics as well as long-period characteristics such as spring and neap tides. The volume of inflowing tides in the estuary is enormous, reaching up to 266,000 m3/s when the upstream flow is close to the annual average flow and the average tidal range is observed at the mouth. The intrusion of seawater into the Yangtze River Estuary corresponds to tidal patterns and also exhibits a pattern of spring and neap changes, with large and small tides occurring once each in a half-month period, leading to variations in daily average chloride concentrations (Biemond et al., 2023). Additionally, as the semi-diurnal tidal ebb and flow change over the course of a day, chloride concentrations in the Yangtze River Estuary also exhibit closely related concentration peaks and troughs.
Wind has a significant impact on the intrusion of seawater, with different wind speeds and directions affecting the strength of the tidal currents in the estuarine area, thereby influencing the intrusion of seawater into the estuary.
Previous studies have indicated a clear negative correlation between the chloride levels in the Yangtze River Estuary and the fluctuation of flow at the Datong station on the Yangtze River. During years with average or low flow in the dry season, seawater intrusion from the sea can reach as far as Wusong or even further upstream (Yin et al., 2018).
The northern branch of the Yangtze River Estuary is dominated by the rising tide, and an important factor leading to the intrusion of seawater from the northern branch into the southern branch is the trumpet-shaped topography in the middle and lower reaches of the northern branch, which easily leads to the formation of tidal currents and large tidal ranges. As the rising tide in the northern branch strengthens and the high tide level in the northern branch exceeds that of the southern branch, the rising tide begins to intrude into the southern branch. This situation is more likely to occur during the large tides of the dry season with relatively low flow.
With the growth of the economy and population, the water consumption in the entire basin has been continuously increasing. The total water consumption in the Yangtze River Basin has risen from 31.4 billion m3 in 1949 to 132.5 billion m3 in 1980, reaching 170.26 billion m3 in 2003, and is projected to reach 221.9 billion m3 by 2030. Considering the diversion of 41.3 billion m3 of water from the South-to-North Water Diversion Project, the total water consumption will reach 263.2 billion m3 (Cao et al., 2023). The increasing water consumption in the upstream areas of the basin has led to a reduction in water supply to the delta region, exacerbating the upstream intrusion of seawater in the delta region.
The bifurcation ratio of the river channels in the delta region has changed as a result of natural channel evolution and human activities such as sand mining and channel regulation. The bifurcation ratio of the northern branch of the Yangtze River Estuary has been decreasing year by year, with the northern branch’s share of the total flow decreasing from 25% in 1915 to 7.6% in 1998. Since 1959, there has been a phenomenon of southward intrusion of water and sediment, with the bifurcation ratio remaining below 5% for a long period, and dropping to 1.3% after 1998. Due to the decrease in flow, the impact of tidal currents has relatively strengthened. In recent years, there has been a noticeable increase in the intrusion of seawater and tidal currents in the northern branch.
By the year 2000, the sea level along the coast of China had been rising at a rate of 0.25 cm per year. By 2030, the relative sea level rise in the Yangtze River Estuary is projected to be between 0.23 and 0.42 meters, and is expected to increase by nearly 1 meter during the 21st century, exacerbating the intrusion of seawater during the dry season (Zhou et al., 2022; Boumis et al., 2023; Mu et al., 2024).
The estuary is affected by tides, oblique pressure effects, and mixing, resulting in the intrusion of seawaters from the sea into the inland areas, which is a common phenomenon in estuaries. However, in addition to the seawater intrusion from the downstream sea, the southern branch of the Yangtze River Estuary is also affected by the backflow of seawater from the northern branch, which is the most significant characteristic of seawater intrusion in the Yangtze River Estuary. The intrusion mode and the distribution of water sources and reservoirs in the Yangtze River Estuary are shown in Figure 5. The backflow of seawater from the northern branch into the southern branch is caused by the special terrain of the northern branch. The trumpet-shaped middle and lower reaches lead to a significant rise in water level during the flood tide, and even tidal bores occur in the upper Qinglong port channel, submerging large areas of tidal flats. The seawater enters the southern branch with the rising tide. During the ebb tide, as the water level drops, large areas of tidal flats in the upper reaches of the northern branch are exposed, making it difficult for the seawater that has entered the southern branch to return to the northern branch with the receding tide. The majority of it flows downstream in the southern branch, affecting the water sources downstream. The upper reaches of the northern branch are shallow, and they almost form a right angle with the southern branch, allowing very little runoff to enter the northern branch, accounting for only 2–3% of the total runoff during the dry season. The low runoff is a significant factor contributing to the severe intrusion and backflow of seawater in the northern branch.
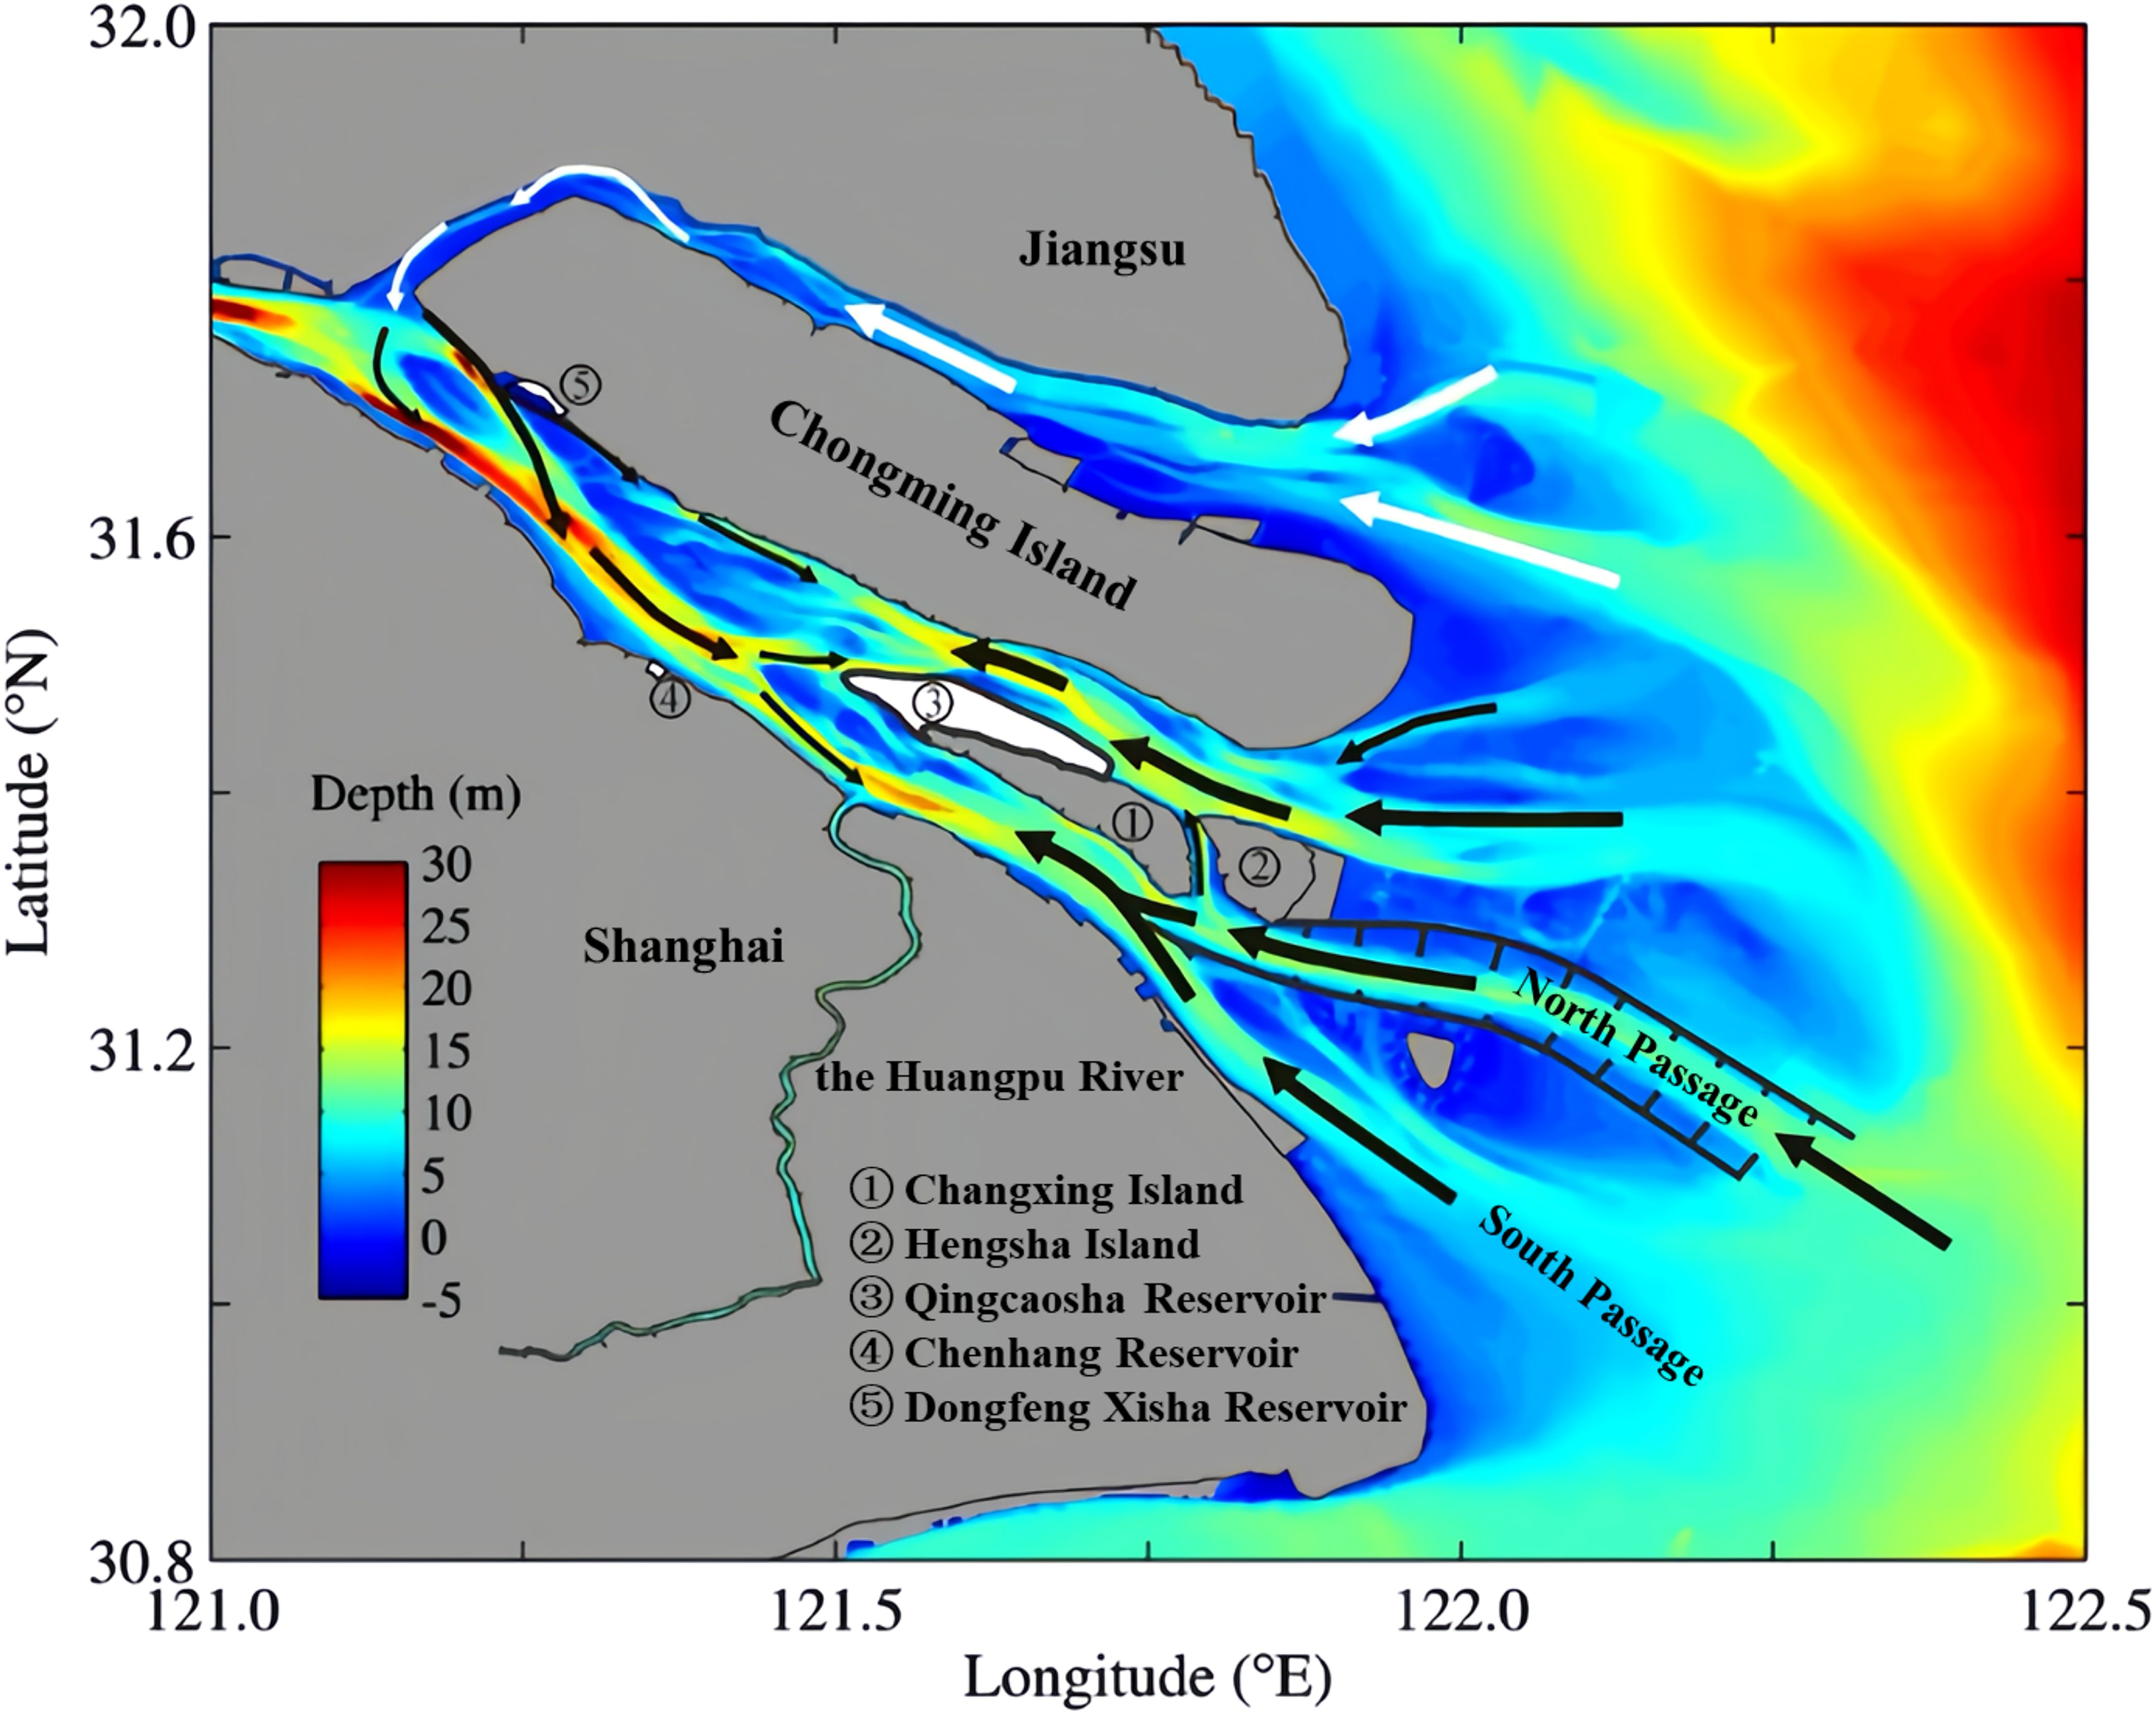
Figure 5 Schematic diagram of seawater intrusion and distribution of water sources and reservoirs in the Yangtze River Estuary.
Data from the Chenhang Reservoir intake from 1994 to 2019 were used to analyze the frequency, timing, and duration of seawater intrusion as indicators of the situation of seawater intrusion in the Yangtze River Estuary. According to the previous analysis, the flow rate at the Datong station represents the flow rate into the sea for analysis. The response time of the estuarine salinity to changes in the flow rate at the Datong station is approximately 3–5 days. Therefore, the average flow rate at the Datong station for the previous 4 days is taken as the flow rate into the sea at the time of seawater occurrence for analysis.
Based on the preliminary analysis of influencing factors, the relationship between the daily average flow rate at the Datong station from 1994 to 2014 and the duration of seawater intrusion was analyzed first. Then, the relationship between the highest chloride concentration during seawater intrusion and the duration of seawater intrusion was analyzed. The relationship between the average tidal range (the difference in water level between adjacent high and low tides within one tidal cycle, calculated as the arithmetic mean of the tidal range during each seawater period in this study, hereinafter referred to as tidal range) corresponding to the duration of seawater intrusion for each intrusion event was analyzed to explore the relationship between the tidal range and the duration of seawater intrusion. Finally, the interrelationship between the highest chloride concentration and the tidal range within different flow rate ranges, as well as the relationship between the chloride concentration and the flow rate within different tidal range ranges, were compared to identify the main influencing factors of seawater intrusion in the Yangtze River Estuary.
Most years in the water sources of the Yangtze River Estuary experience seawater intrusion. When short-term seawater intrusion occurs, it does not affect normal water supply due to water storage in the reservoir. Only when seawater intrusion is severe and exceeds the maximum water supply capacity of the reservoir does it pose a flood safety issue. Therefore, the water supply capacity of each water source in the Yangtze River Estuary needs to be considered, and the standard for critical flow rate needs to be determined.
Among the water sources in the Yangtze River Estuary in Shanghai, the design assurance rate of the Dongfengxisha Reservoir and Qingcaosha Reservoir is 97%-98%, with the typical design year being 1978–1979, and their assurance rate is higher than that of the Chenhang Reservoir at 92%, with the typical design year being 1986–1987, which is relatively dry compared to the typical design year of the Chenhang Reservoir. When seawater intrusion is severe, the Chenhang Reservoir reaches its water supply limit first.
The effective storage capacity of the Chenhang Reservoir is 9.5 million m3, and the water supply scale during the seawater period is 1.4 million m3/d. During periods of severe seawater intrusion, approximately 100,000 m3 of water is transferred from the Baogang Reservoir to the Chenhang Reservoir daily. The water supply capacity of the Chenhang Reservoir is determined as . Therefore, the average flow rate at the Datong station for 7 consecutive days, during which water intake at the Chenhang Reservoir should not be carried out, is defined as the critical flow rate for ensuring water supply security in Shanghai.
The number of occurrences and duration of seawater intrusion at Chenhang Reservoir from 1994 to 2019 are shown in Figure 6 and Table 1. It can be observed that the number and duration of seawater intrusion during 2004–2014 were significantly higher and longer than those during 1994–2003. There were only 2 occurrences from 2015 to 2019, with one lasting for 6 days in 2015 and the other for 4 days in 2019. The average annual duration from 2004 to 2019 was less than that from 1994 to 2003.
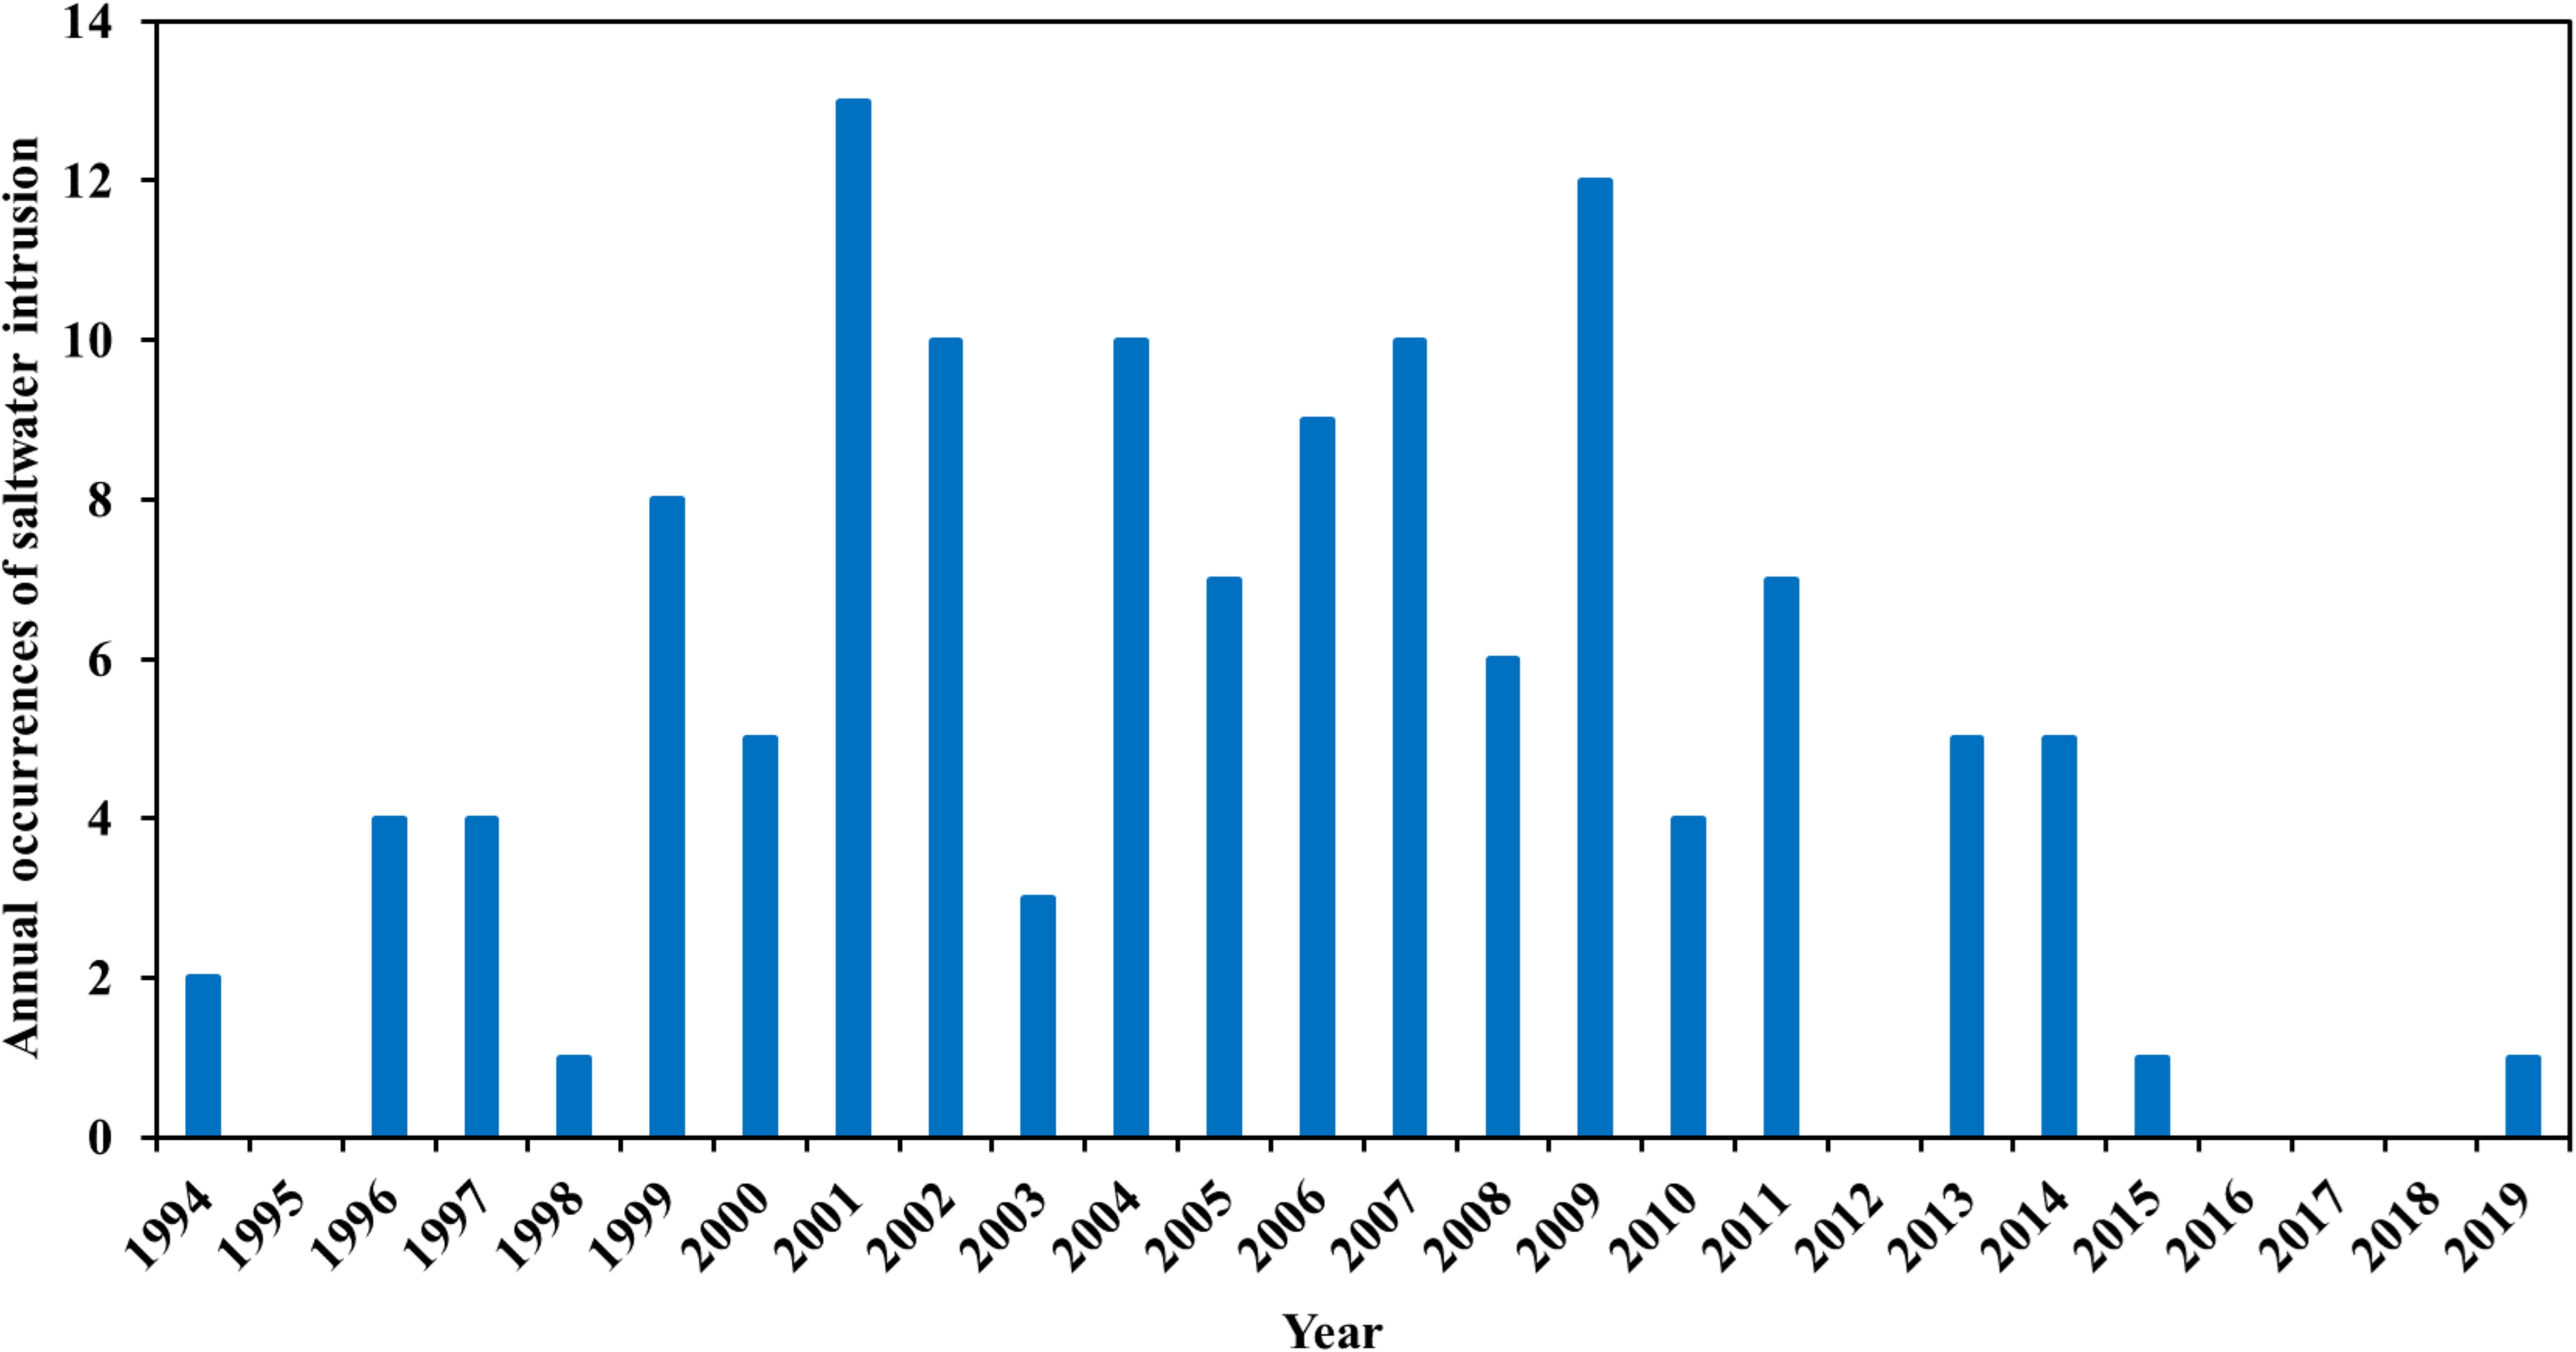
Figure 6 Annual occurrences of seawater intrusion from 1994 to 2019.
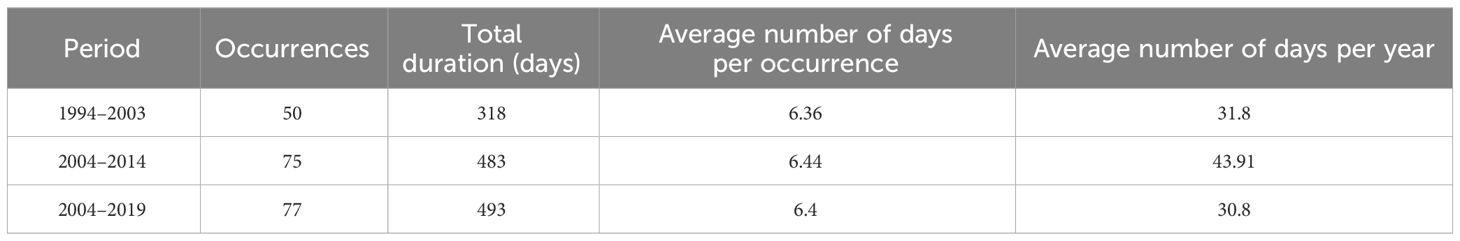
Table 1 Occurrences and duration of seawater intrusion at Chenhang Reservoir.
Figure 7 shows the occurrences of seawater intrusion for each month from 1994 to 2019. The statistics indicate that seawater intrusion mainly occurred from November to April of the following year, with the most occurrences in January to April, particularly in February and March. A few occurrences happened in October and May, and very few occurred in August and September.
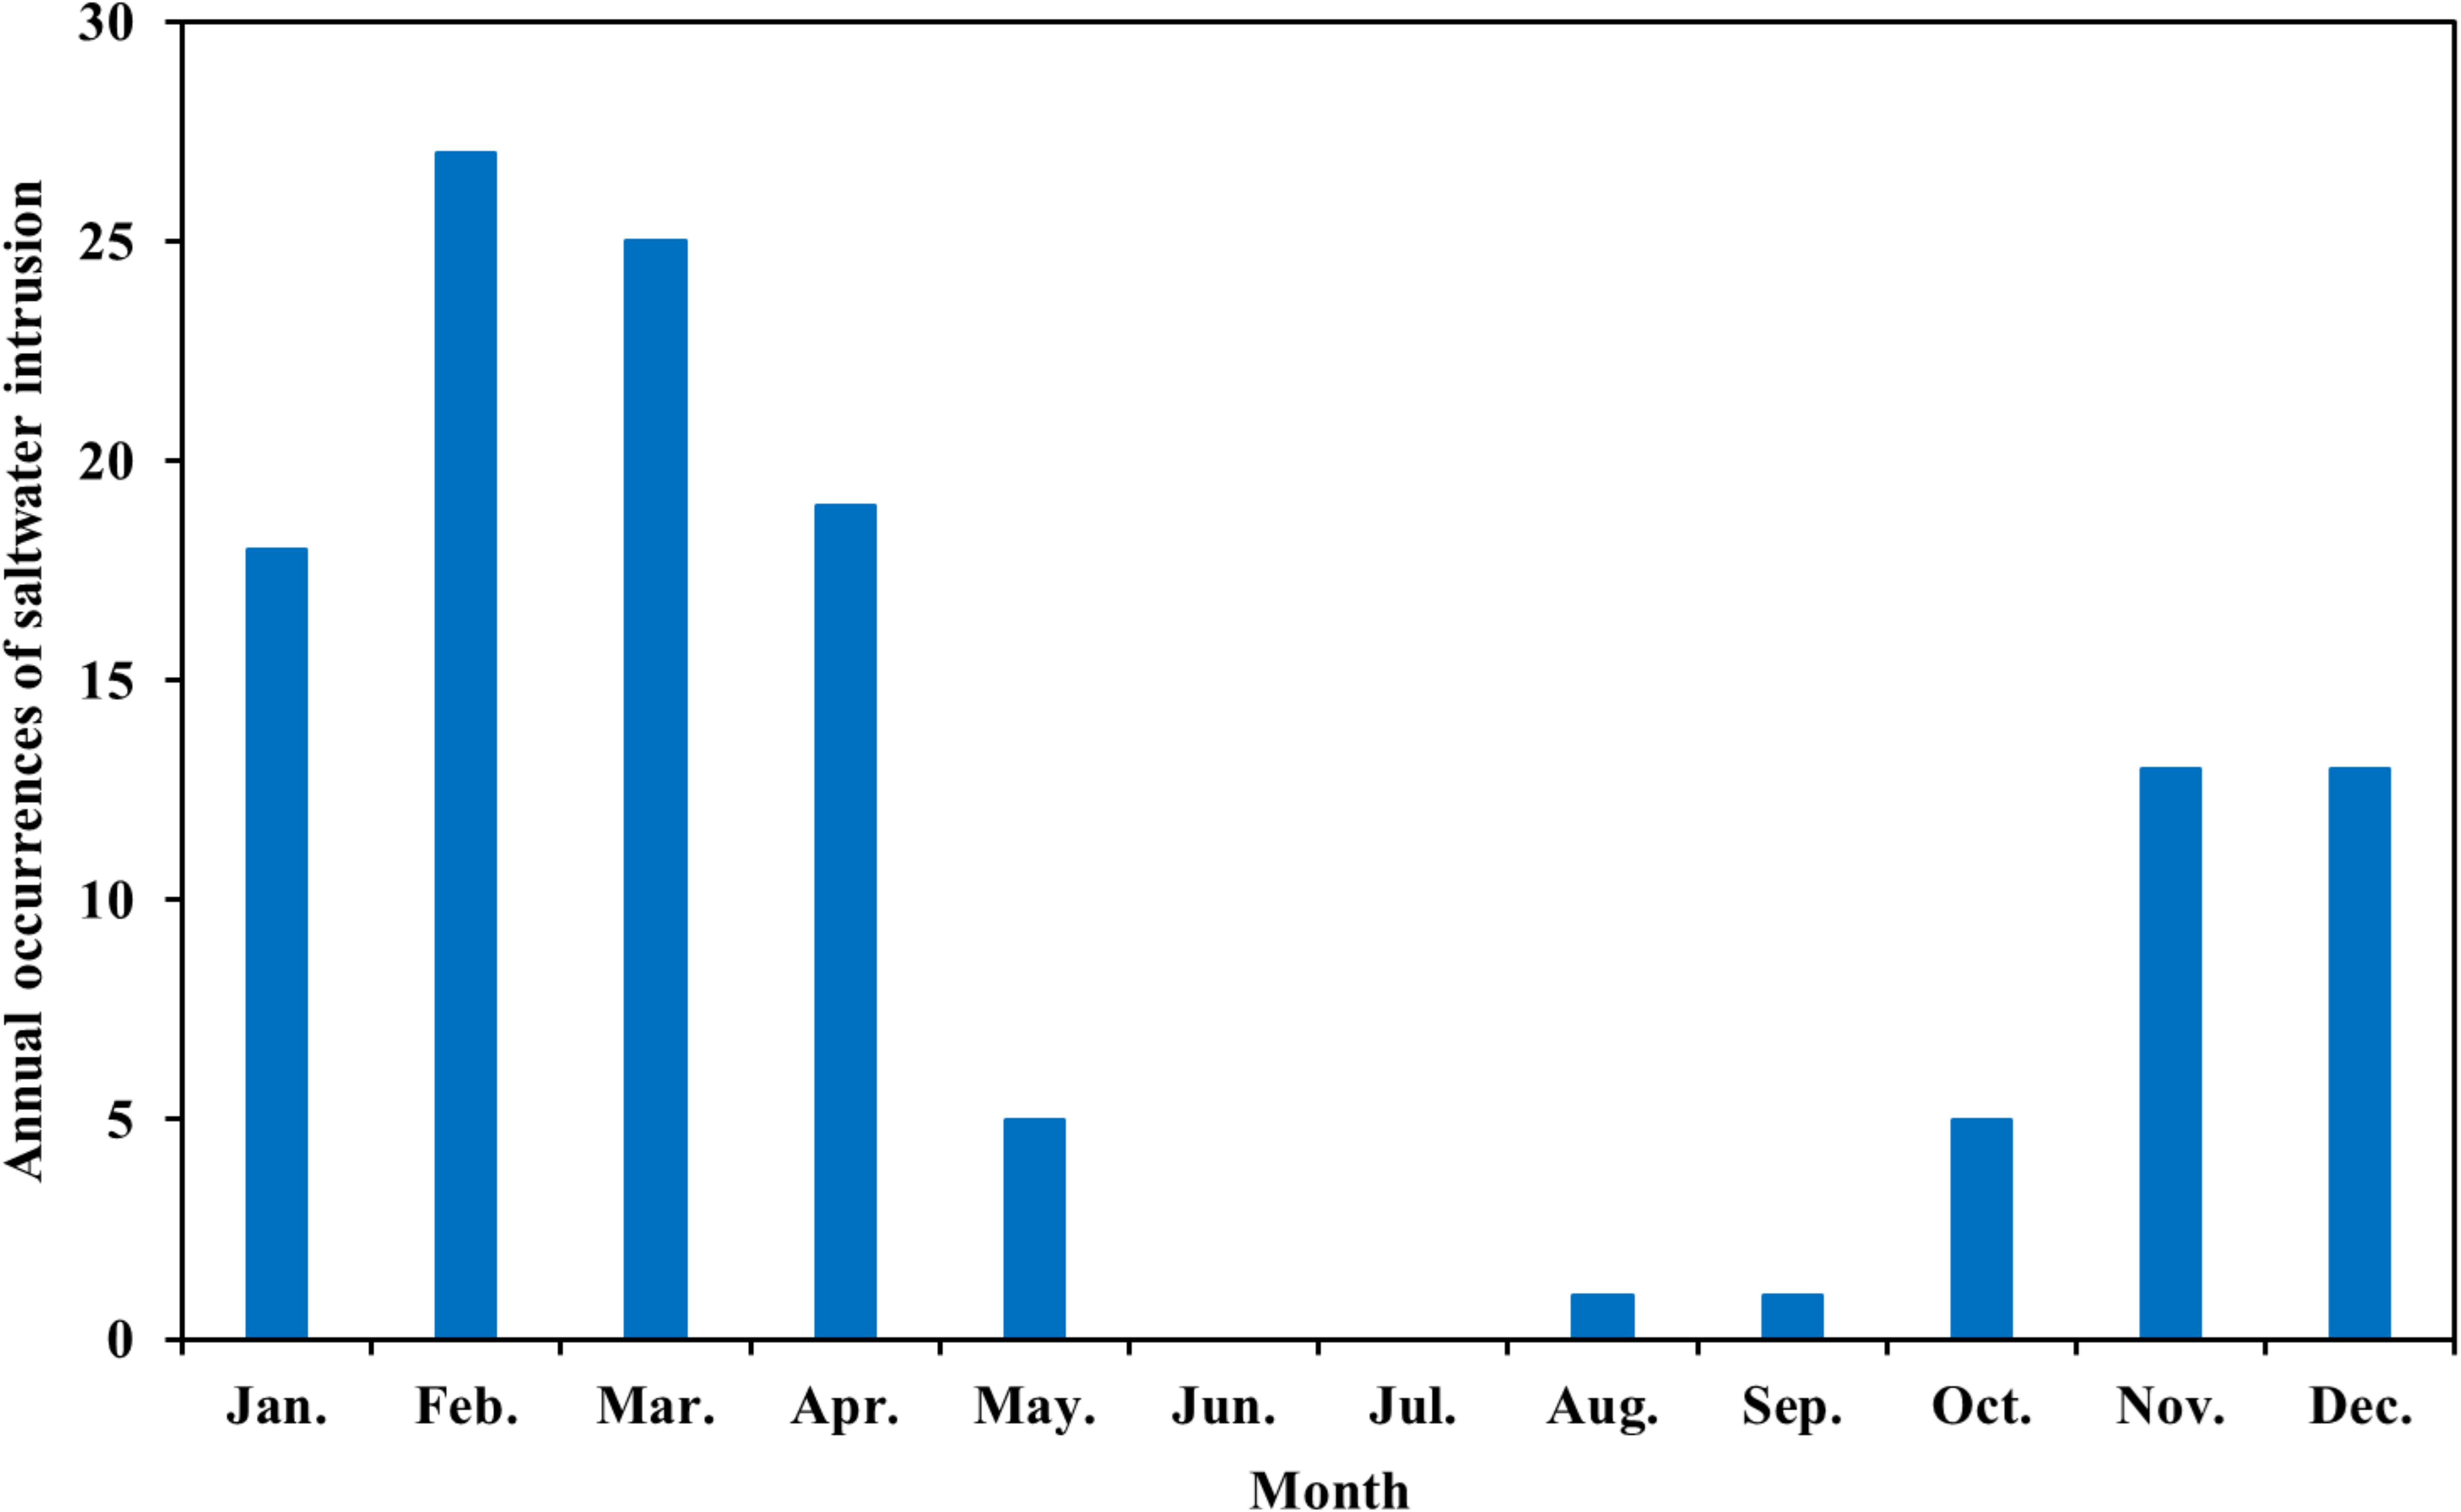
Figure 7 Occurrences of seawater intrusion for each month from 1994 to 2019.
Figures 8 and 9 show the occurrences and average duration of seawater intrusion for each month from 1994 to 2003 and from 2004 to 2019, respectively. From Figure 8, it can be observed that, except for August, the occurrences of seawater intrusion from 2004 to 2019 were equal to or higher than those from 1994 to 2003. Similarly, Figure 9 indicates that, except for August, the duration of seawater intrusion from 2004 to 2019 was higher than that from 1994 to 2003. Based on the above statistical analysis, it is evident that the phenomenon of seawater intrusion has undergone certain changes after 2003.
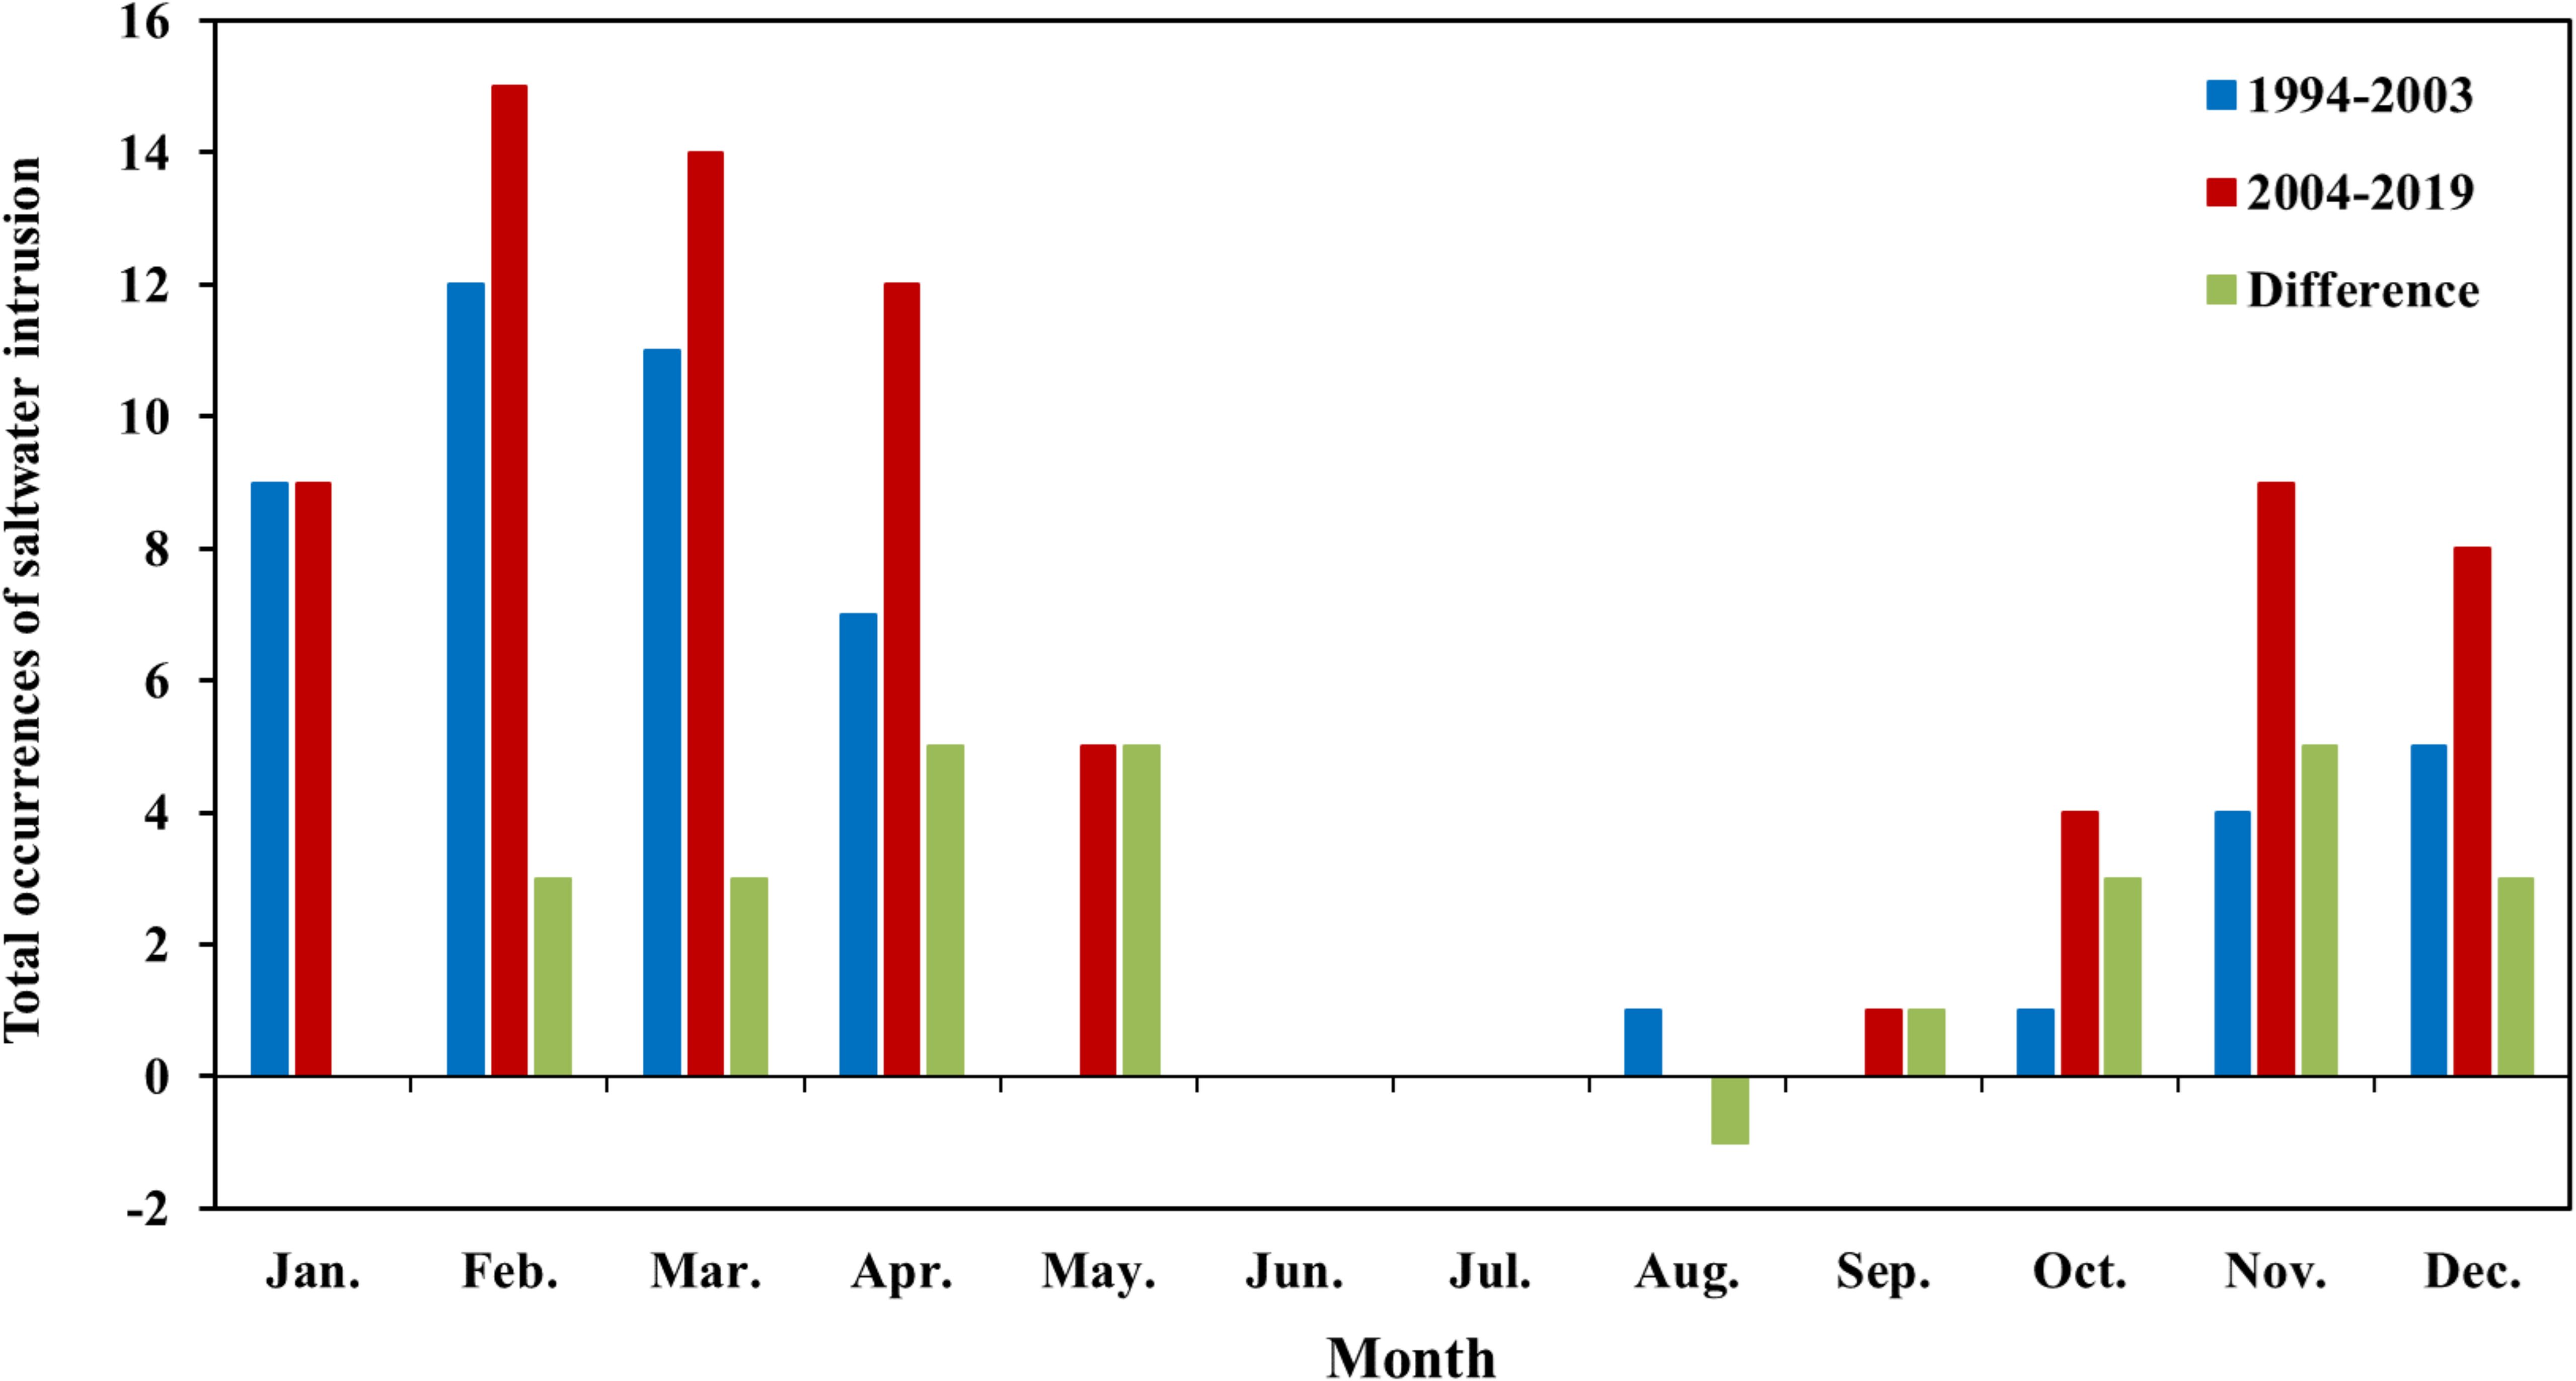
Figure 8 Total occurrences of seawater intrusion for each month from 1994 to 2003 and from 2004 to 2019.
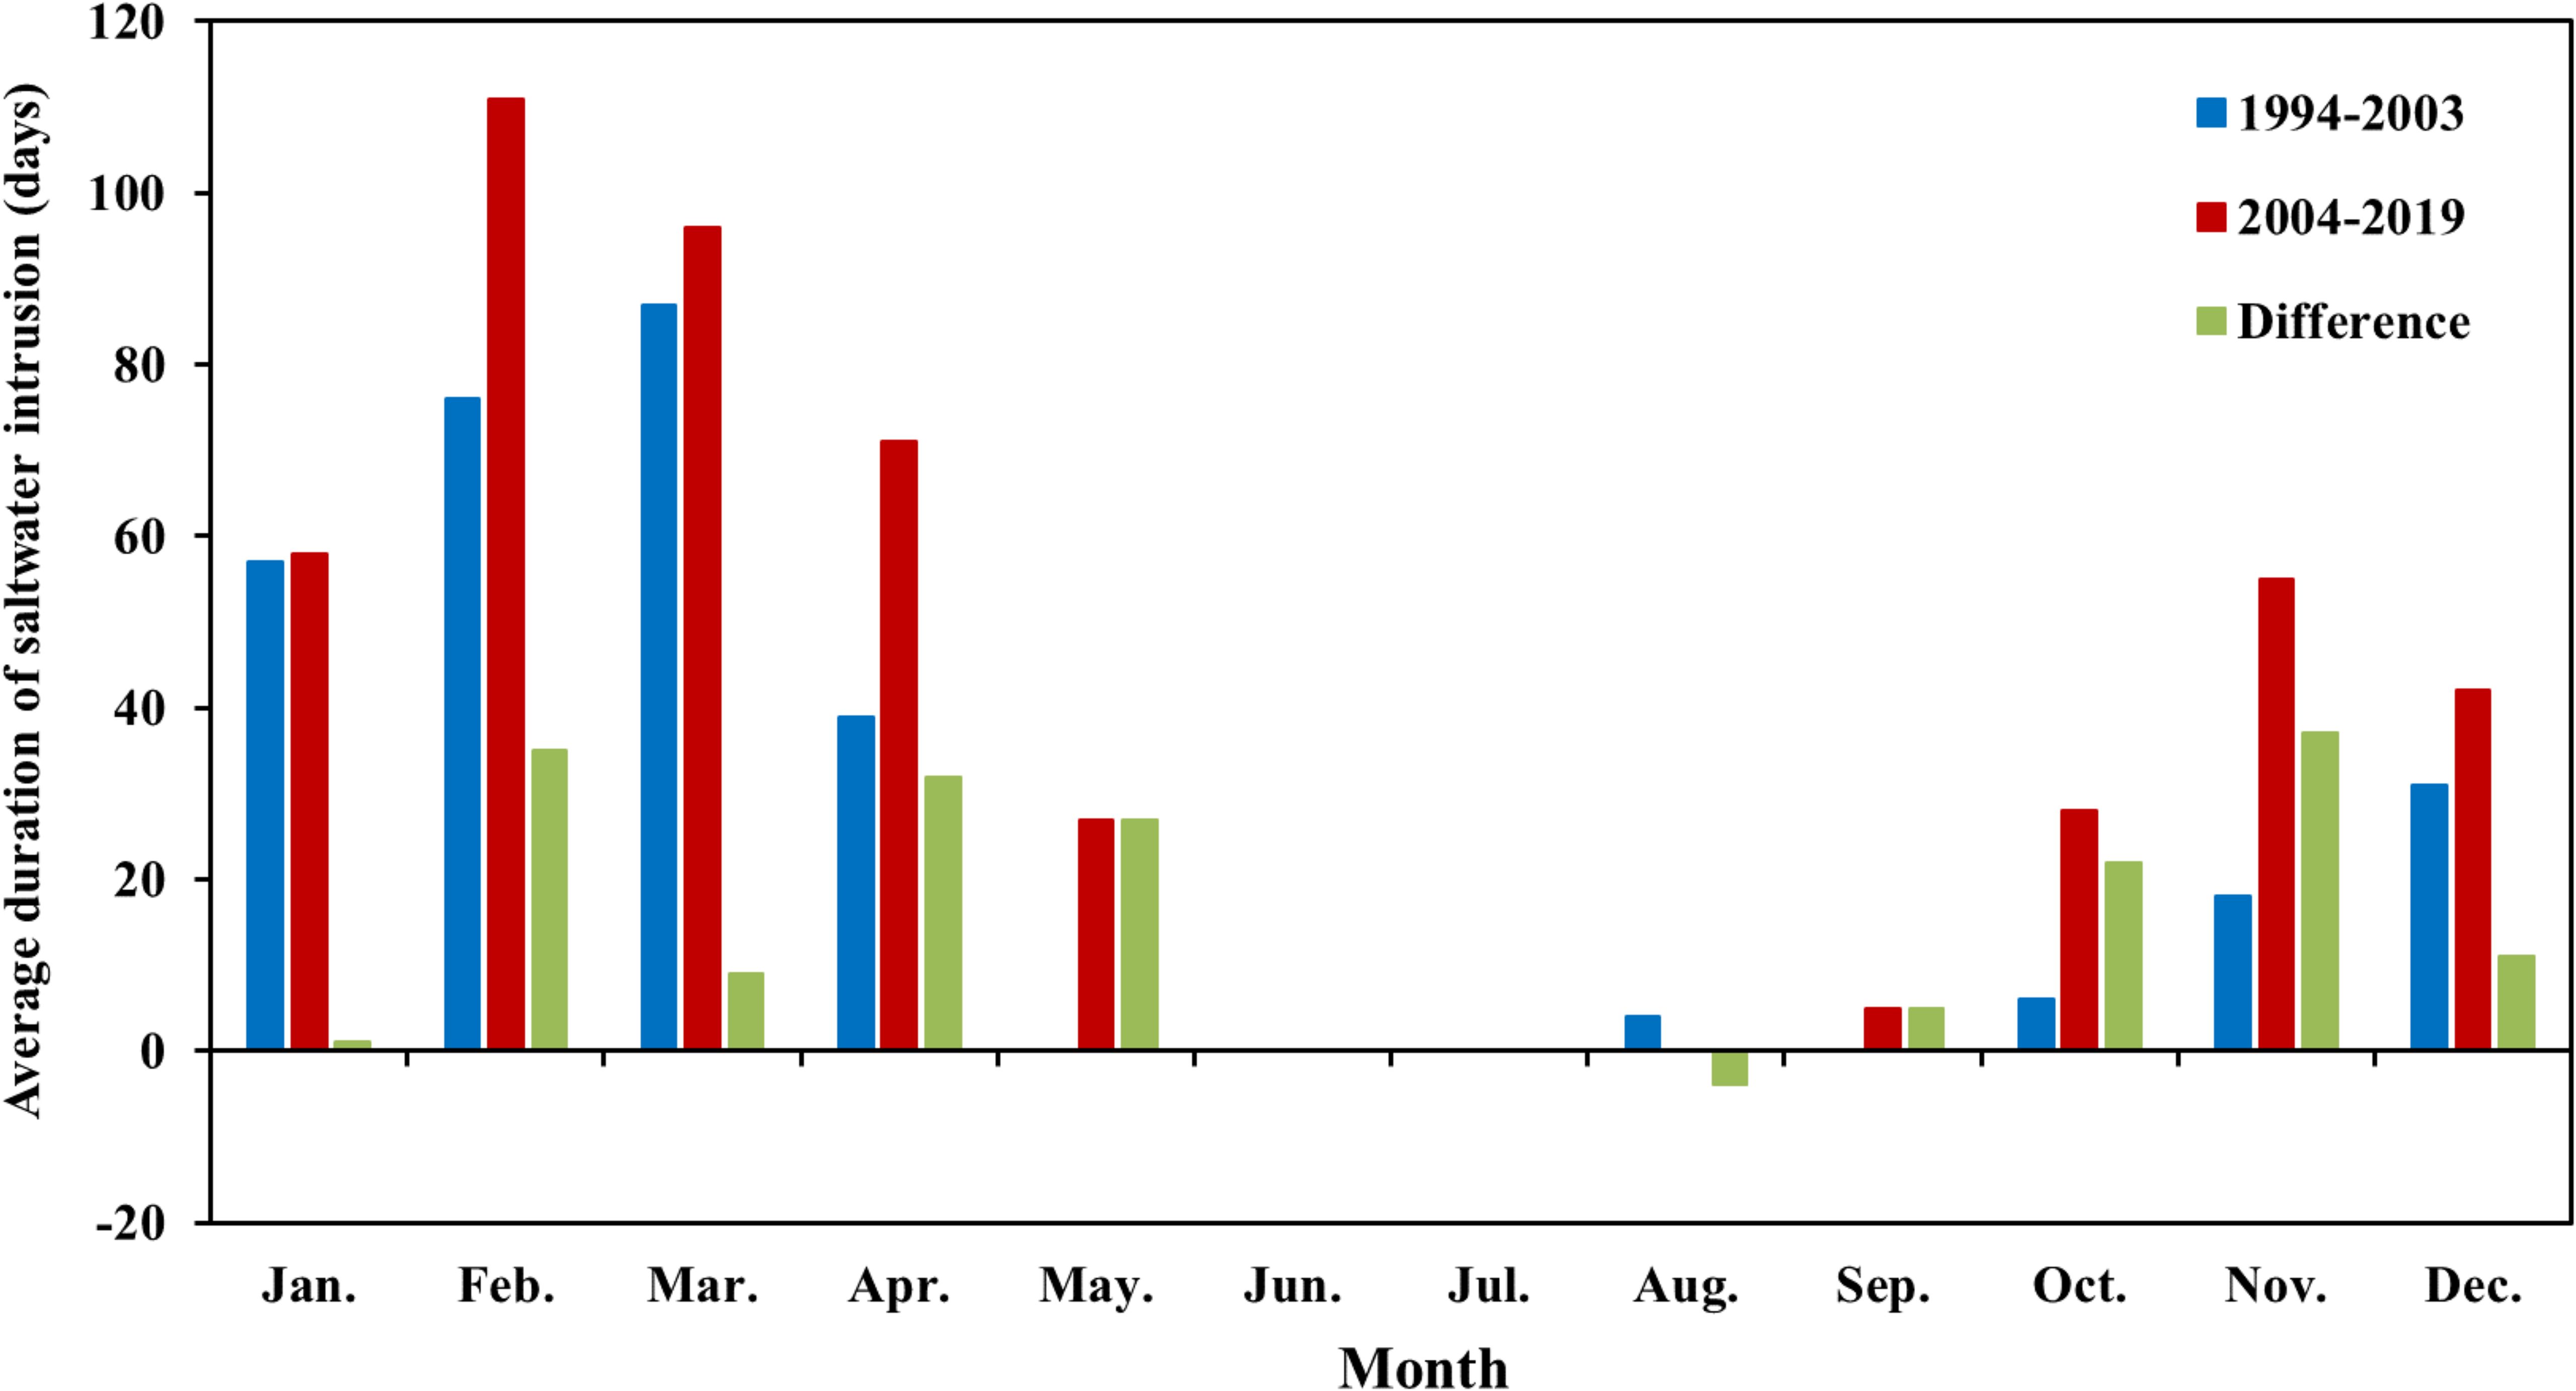
Figure 9 Average duration of seawater intrusion for each month from 1994 to 2003 and from 2004 to 2019.
Based on the previous analysis, the flow at Datong station represents the inflow into the sea. The response time of estuarine salinity to changes in Datong flow is 3–5 days. In this study, the average flow of the previous 4 days at Datong station was taken as the inflow flow corresponding to the occurrence of seawater intrusion for analysis.
The impact of the flow of the Yangtze River on seawater intrusion is very complex. The strength of the seawater intrusion is not only related to the flow of the Yangtze River, but also closely related to the tidal intensity in the outer sea. From the relationship between chloride content and Datong flow, it is not a simple negative correlation between the two. Through the analysis of the daily average flow at Datong station and the highest chloride concentration, a trend is found that when the flow at Datong is greater than 25,000 m3/s, there is rarely an exceedance of 250 mg/L in chloride concentration (as shown in Figure 10). This indicates that when the flow at Datong is less than 25,000 m3/s, there may be a significant seawater intrusion.
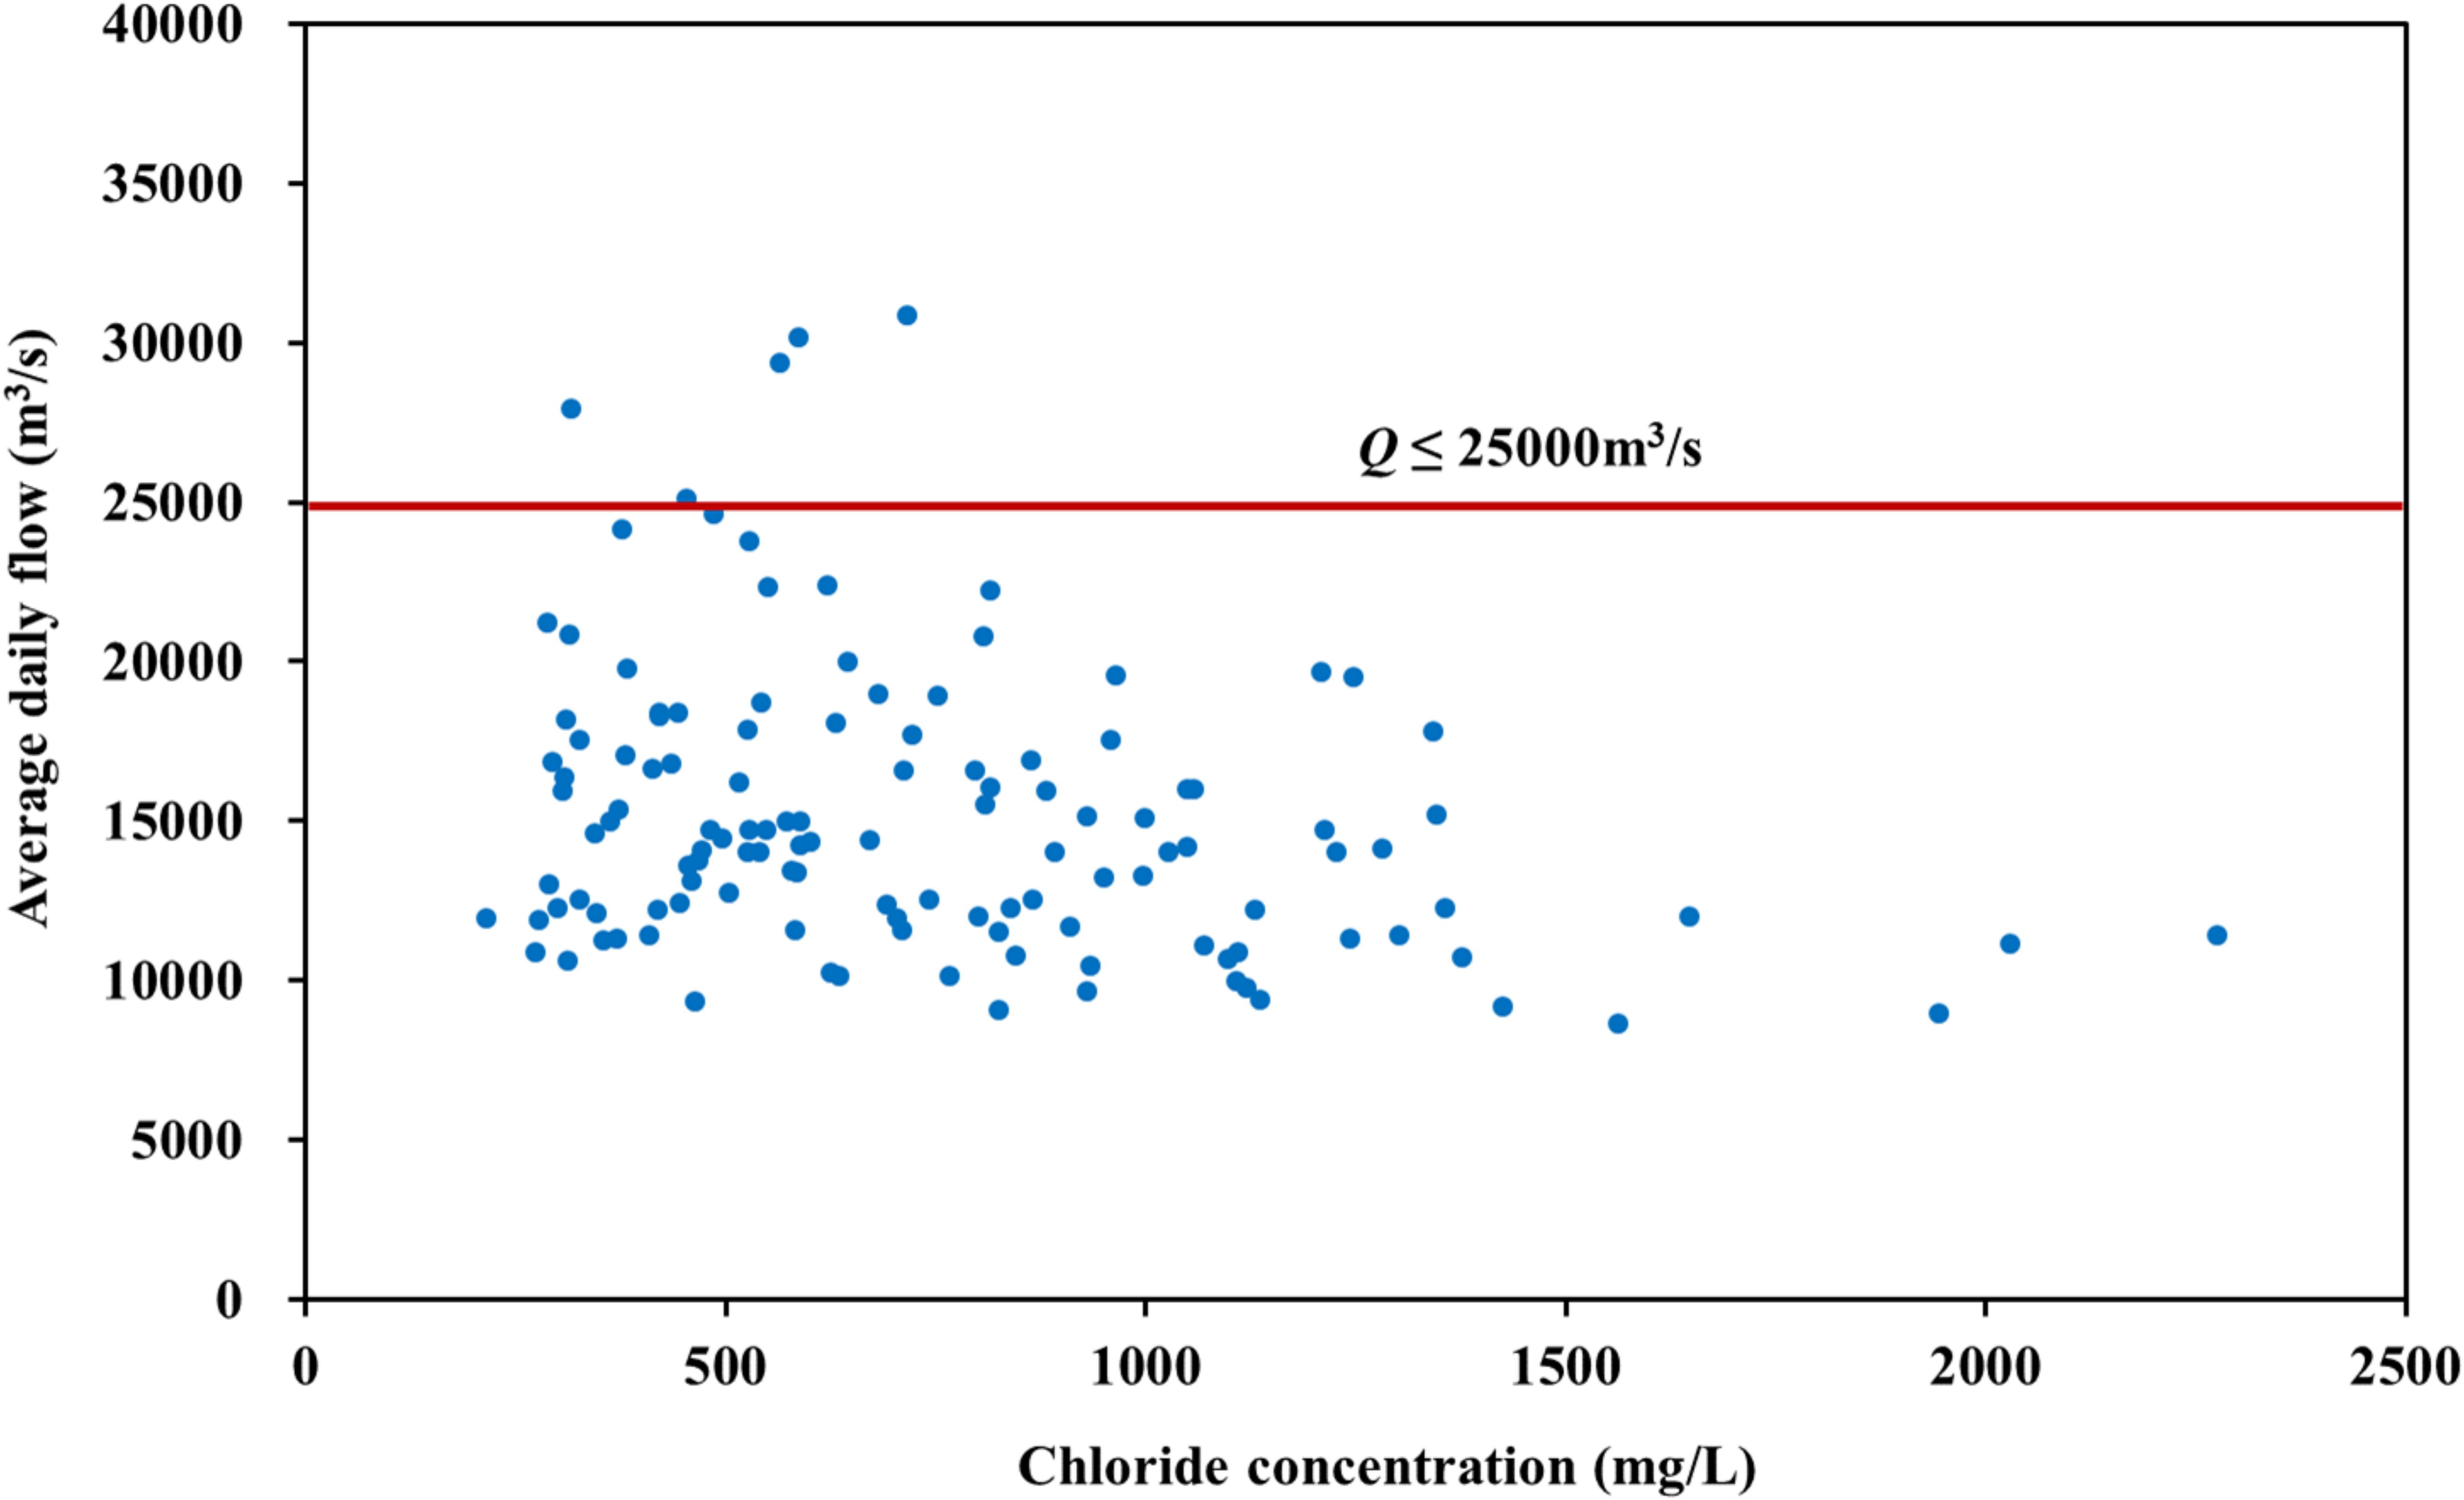
Figure 10 Relationship between maximum chloride concentration and average daily flow at Datong station during seawater intrusion.
We first analyzed the correlation between the average daily flow at the Datong station and the duration of seawater intrusion. The statistics of 1994–2014 seawater intrusion duration corresponding to the first 4 days of Datong average daily flow are shown in Figure 11. It generally shows the trend that the smaller the average daily flow at Datong station corresponds to the longer duration of saltwater intrusion.
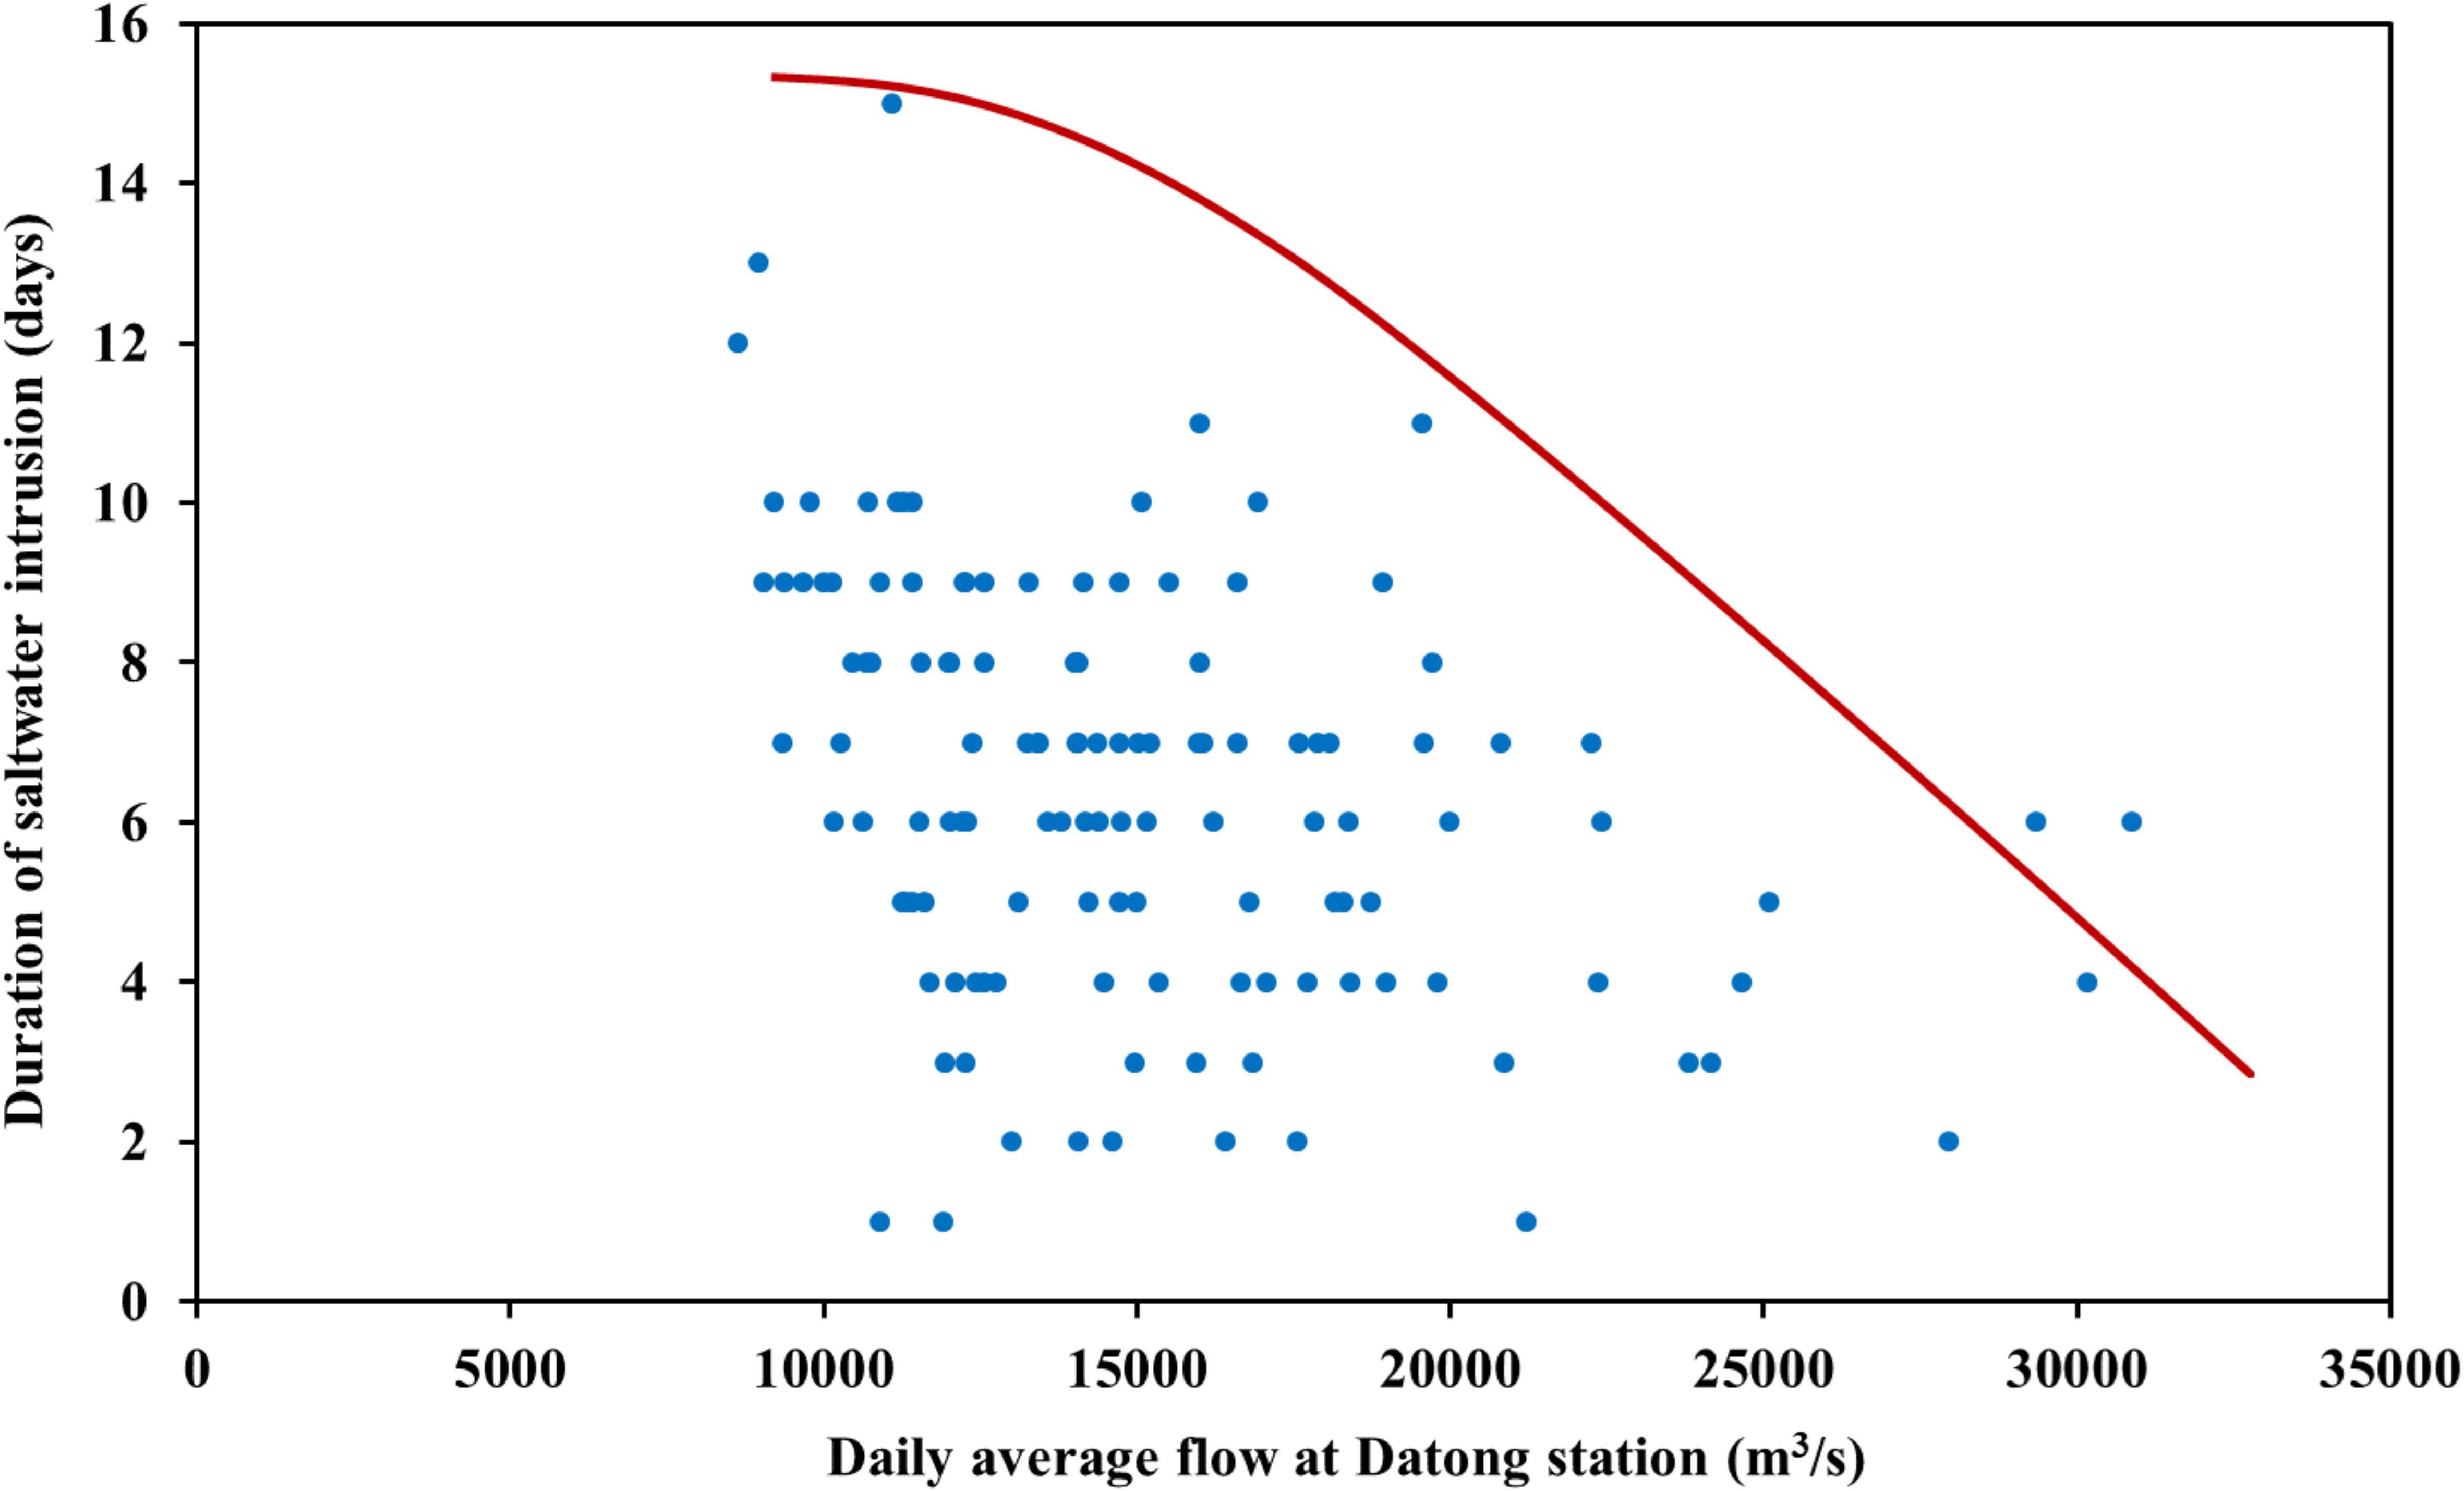
Figure 11 Correlation between duration of seawater intrusion and daily average flow at Datong station.
We further analyzed the correlation between the maximum chloride concentration during seawater intrusion and the duration of seawater intrusion. The duration of each seawater intrusion that occurred from 1994 to 2014 and the corresponding maximum chloride concentration during that seawater intrusion were visualized, as shown in Figure 12. The correlation generally shows a trend that the duration of seawater intrusion is longer as the maximum chloride concentration increases.
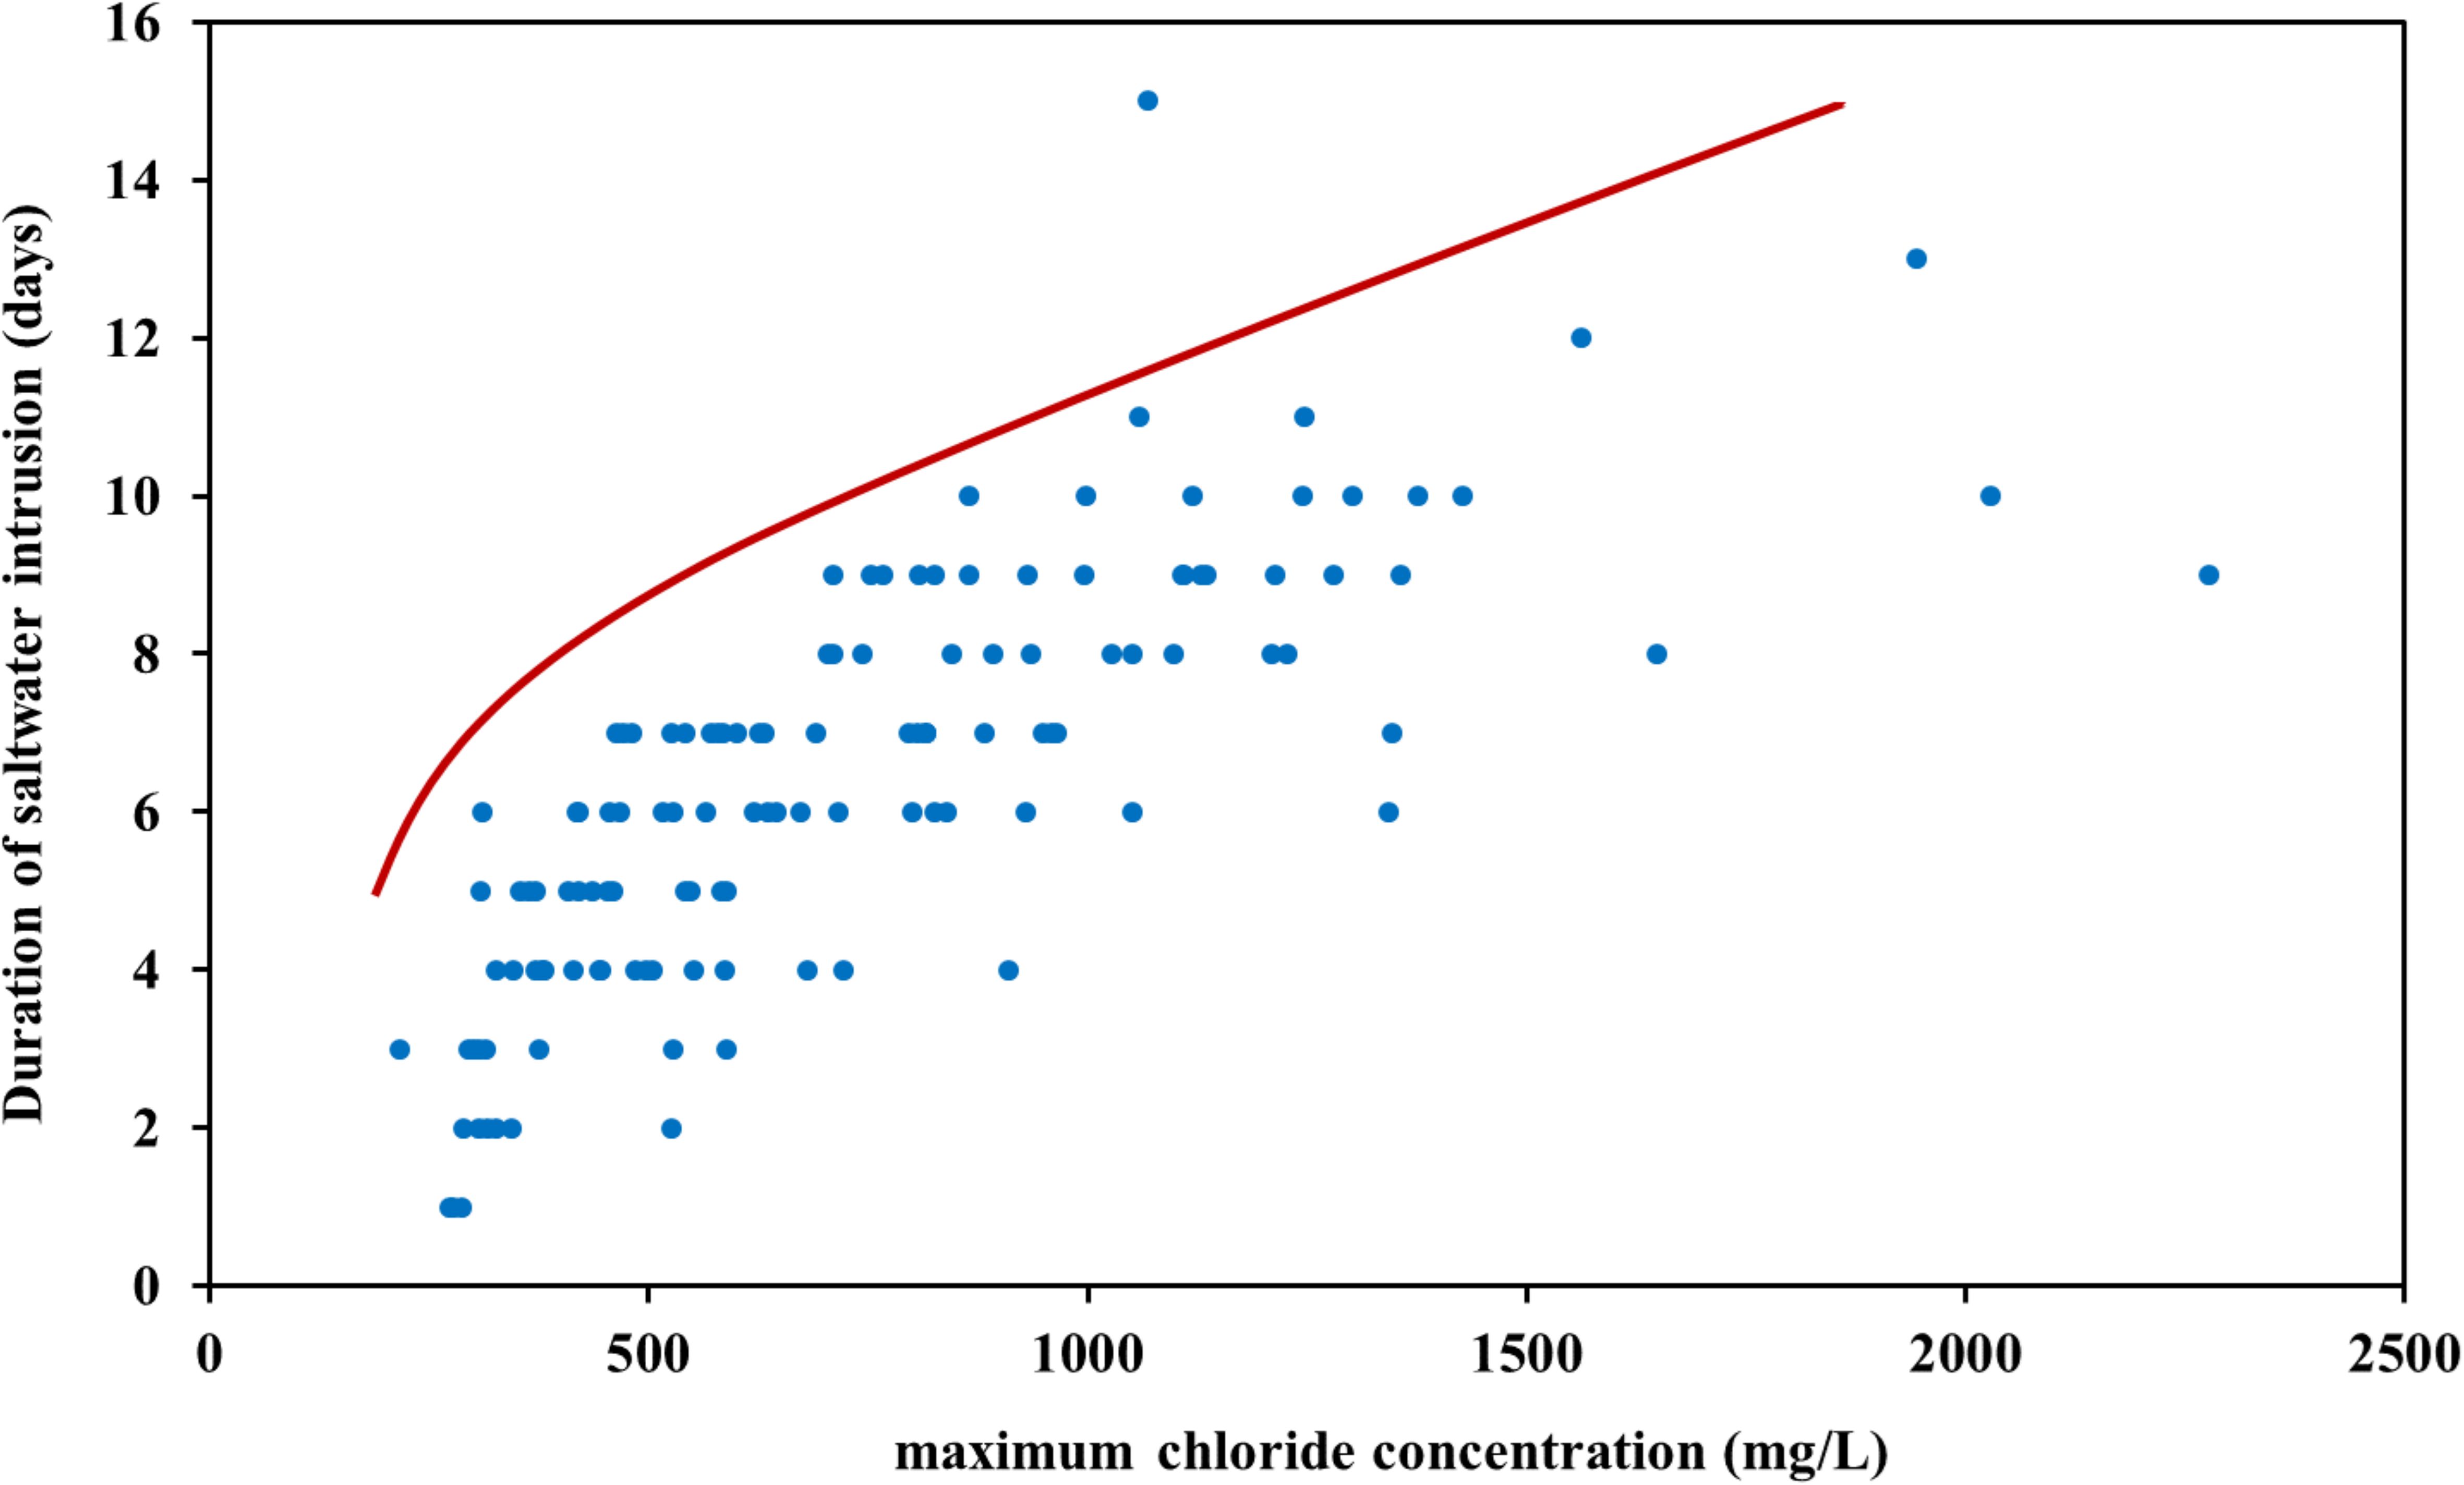
Figure 12 Correlation between duration of seawater intrusion and maximum chloride concentration.
To further understand the influencing factors of seawater intrusion, the mean tidal range corresponding to the duration within each seawater intrusion period from January 2004 to December 2019 was statistically analyzed (the tidal range is the difference in water level between adjacent high and low tide levels within a cycle, and this time the arithmetic mean was taken for each tidal range calculated during the seawater intrusion period). From the relationship between tidal range and duration of seawater intrusion (Figure 13), it can be seen that the single-factor correlation between the duration of seawater intrusion and tidal range is not obvious. This is mainly because the duration of seawater intrusion is a result of the combined effect of flow and tidal range at the Datong station.
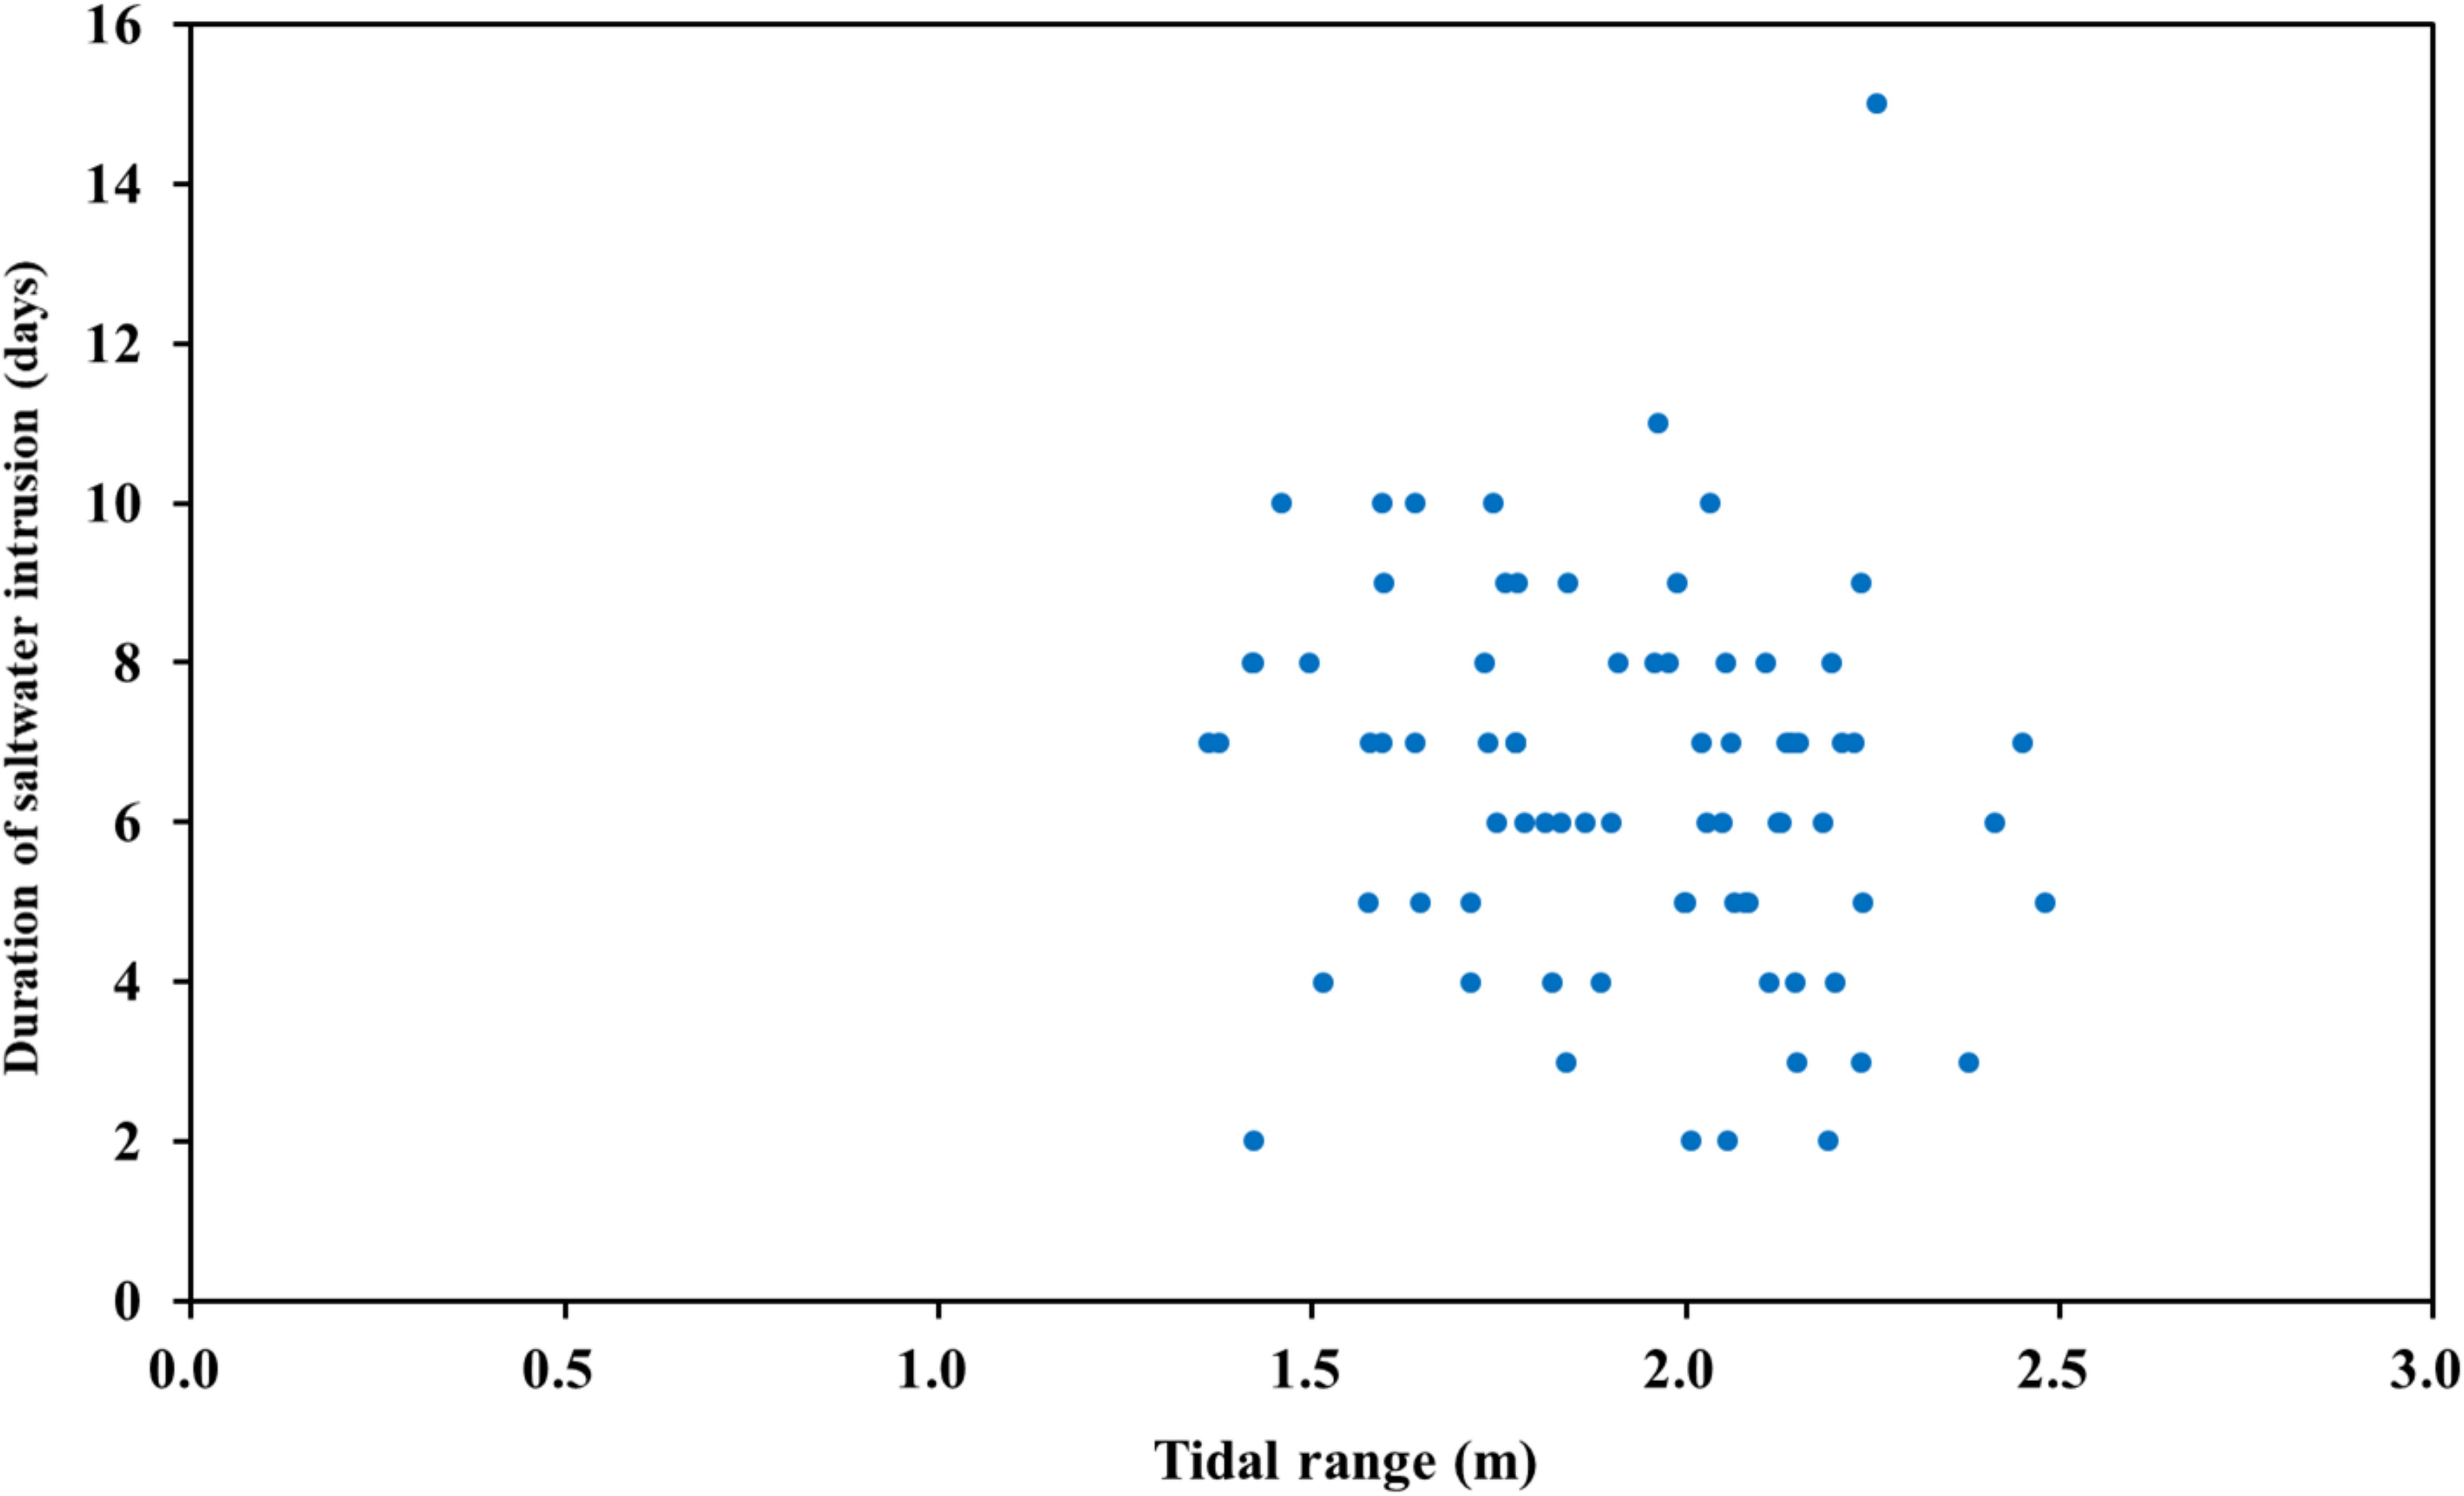
Figure 13 Correlation between tidal range and duration of seawater intrusion.
The correlation between the maximum chloride concentration in different flows at Datong station and the tidal ranges at Xuliujing station is shown in Figure 14. It can be seen that when the flow rate of Datong is less than 15000 m3/s, as long as the tidal range of Xuliujing is greater than 1.3 m, the exceeding of the chloride standard may occur. In the flow range of 15000~20000 m3/s, when the tidal range at Xuliujing exceeds 1.5 m, chloride exceeding may occur. When the flow exceeds 20000 m3/s and the tidal range at Xuliujing exceeds 2.0 m, chloride exceeding may occur. The effect of the Xuliujing tidal range on chlorinity is various for different ranges of flow at the Datong station, the lower the flow, the smaller the tidal range required for chlorinity exceedances to occur.
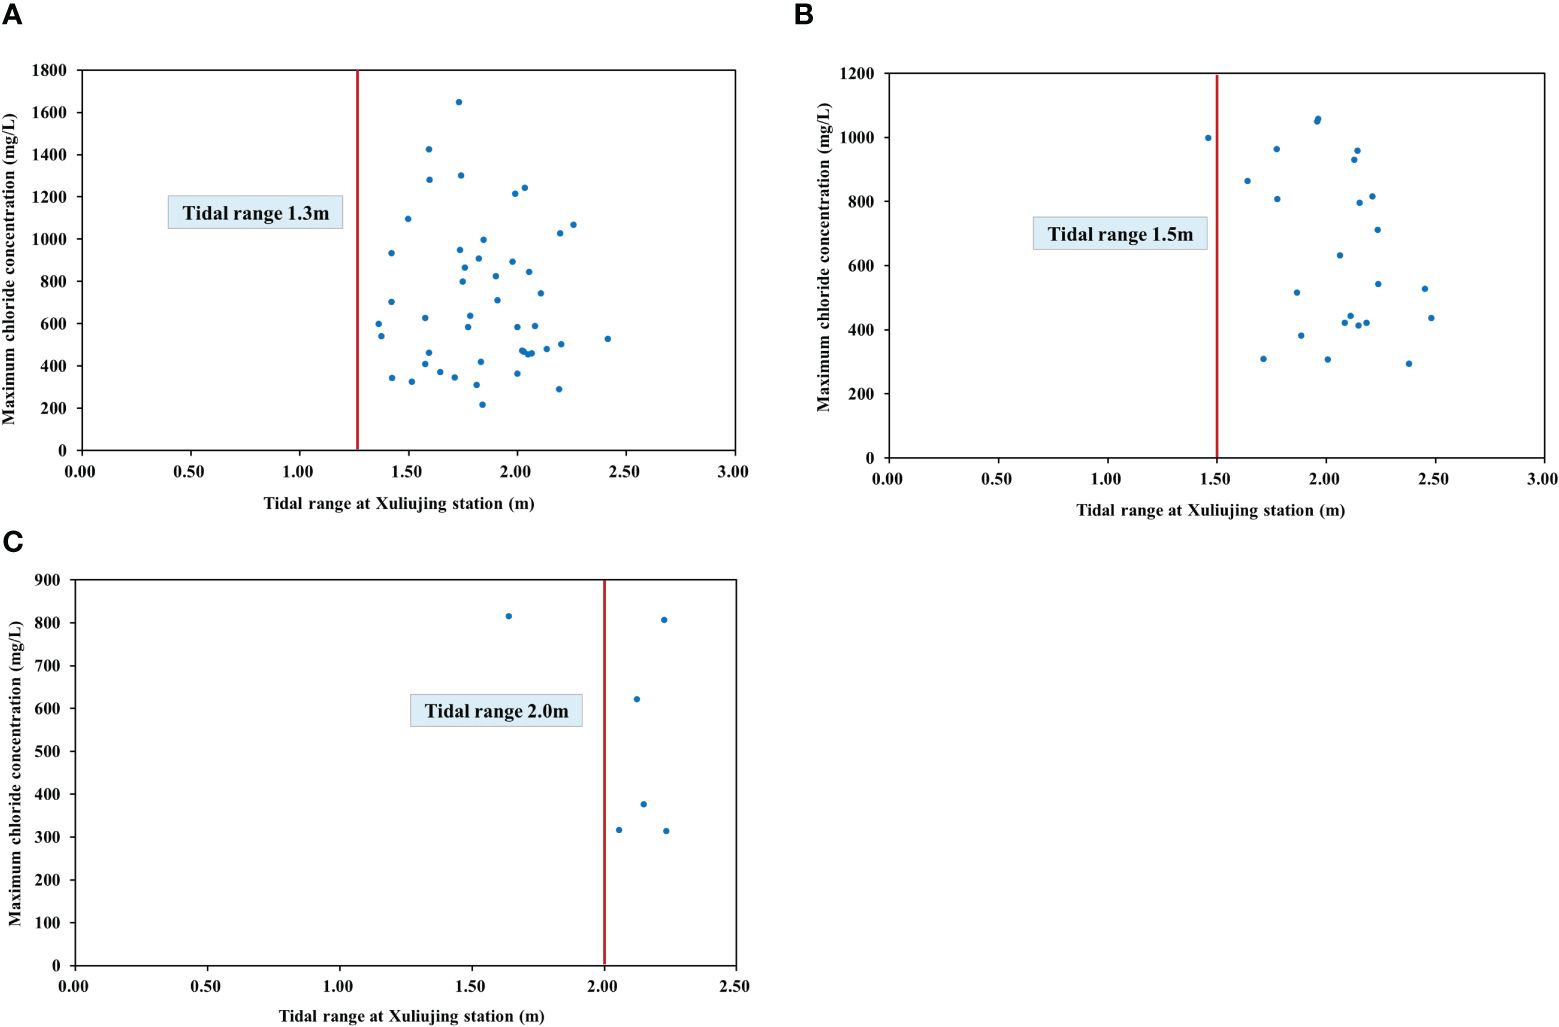
Figure 14 Correlation between chloride concentration in different flows at Datong and tidal ranges at Xuliujing: (A) Daily average flow at Datong less than 15000 m3/s; (B) Daily average flow at Datong between 15000~20000 m3/s; (C) Daily average flow at Datong larger than 20000 m3/s.
The correlation between the maximum chloride concentration in different tidal ranges at Xuliujing station and the daily average flow at Datong is shown in Figure 15. It can be seen that when the tidal range at Xuliujing is less than 1.5 m, as long as the daily average flow at Datong is less than 15000 m3/s, chloride exceeding may occur. When the tidal range at Xuliujing is between 1.5~2.0 m and the daily average flow at Datong is less than 20000 m3/s, chloride exceeding may occur. When the tidal range at Xuliujing exceeds 2.0 m, as long as the daily average flow at Datong is less than 25000 m3/s, chloride exceeding may occur. The influence of flow on chloride concentration is also various in different tidal range ranges, the larger the tidal range at Xuliujing, the larger the critical flow required for the occurrence of the maximum chloride concentration.
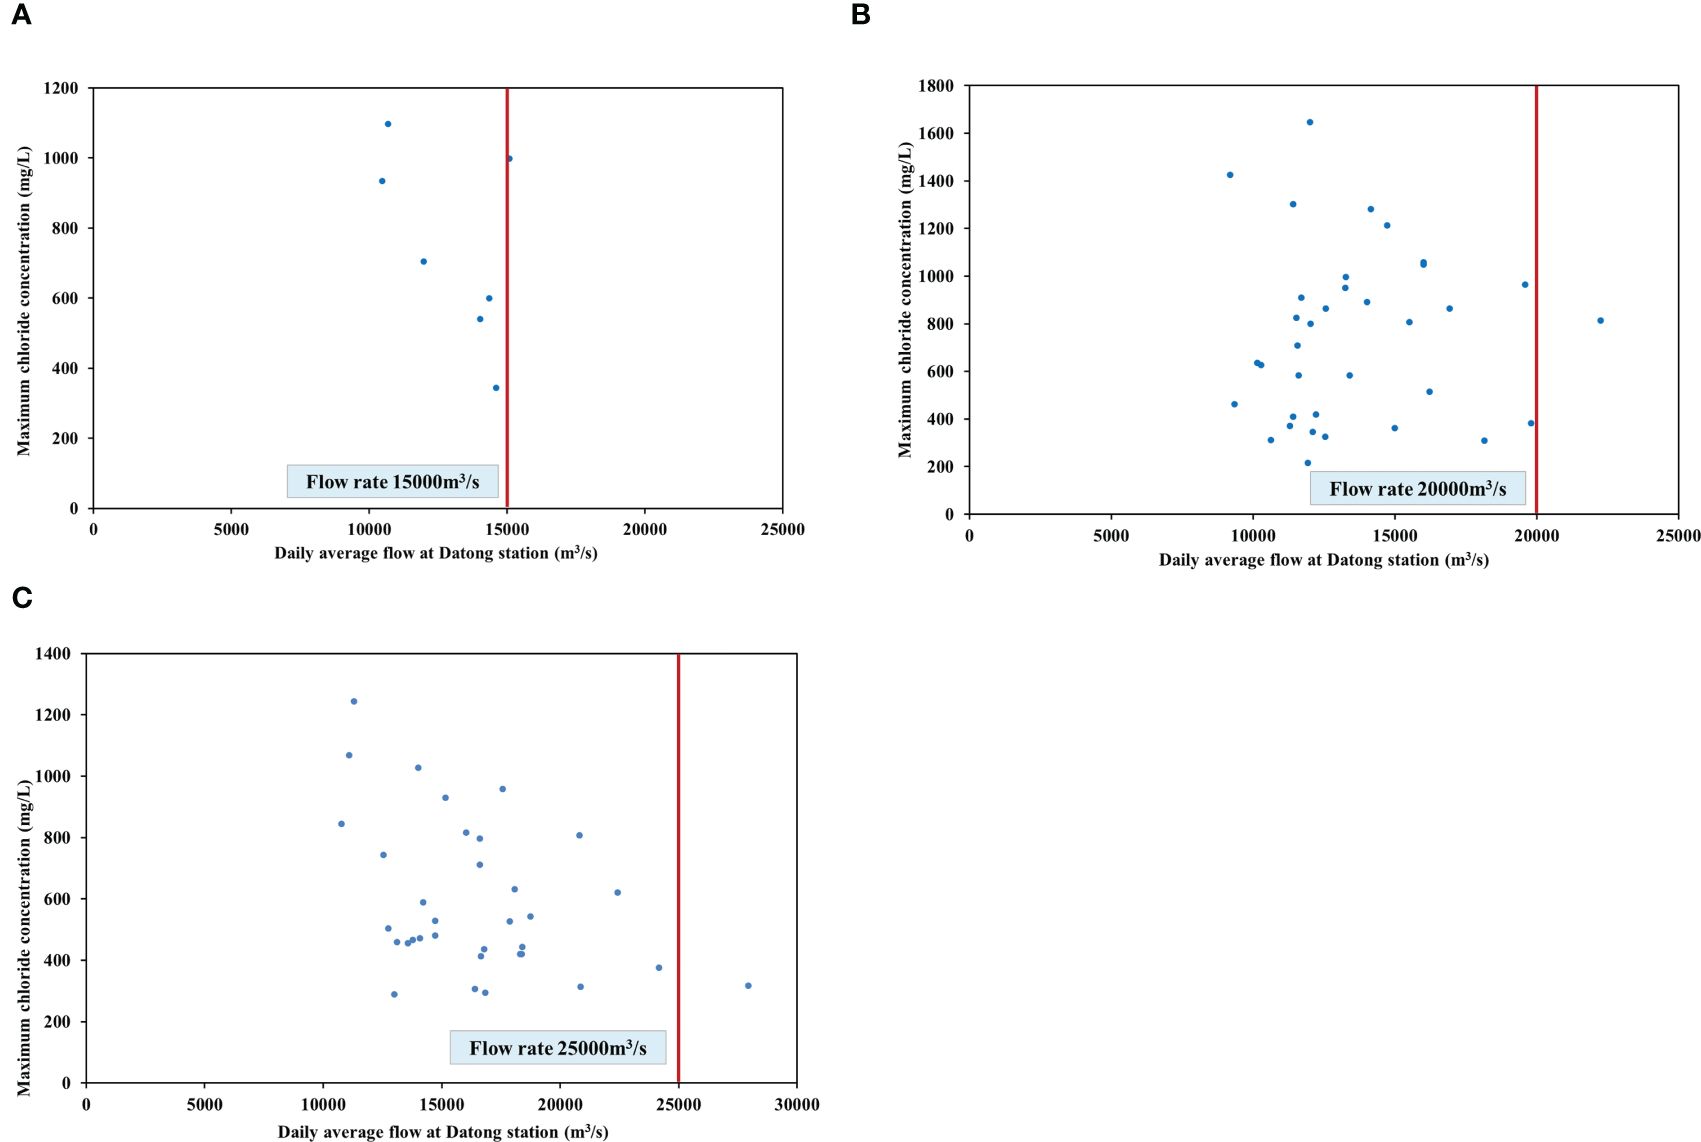
Figure 15 Correlation between chloride concentration in different tidal ranges at Xuliujing and daily average flows at Datong: (A) Tidal range less than 1.5 m; (B) Tidal range between 1.5~2.0 m; (C) Tidal range larger than 2.0 m.
Based on the analysis from previous studies, it is known that the main influencing factors affecting the chlorine level at the water intake (causing seawater intrusion) are the daily flow at Datong station and the tidal range at Xuliujing station. We analyzed the data of seawater intrusion at the water intake of Chenhang Reservoir from 2004 to 2014, and examined the relationship between the duration of seawater intrusion, the corresponding average tidal range, and the daily average flow at Datong station in the 4 days prior to the occurrence of seawater intrusion, in order to determine the critical flow threshold under different durations and tidal ranges.
For safety considerations, this study takes the upper envelope of the daily average flow at Datong station for each point agency (as shown in Figure 16) as the critical flow, which is a dynamic critical threshold. It can be observed from Figure 16 that, under the same duration, the greater the tidal range, the larger the daily flow.
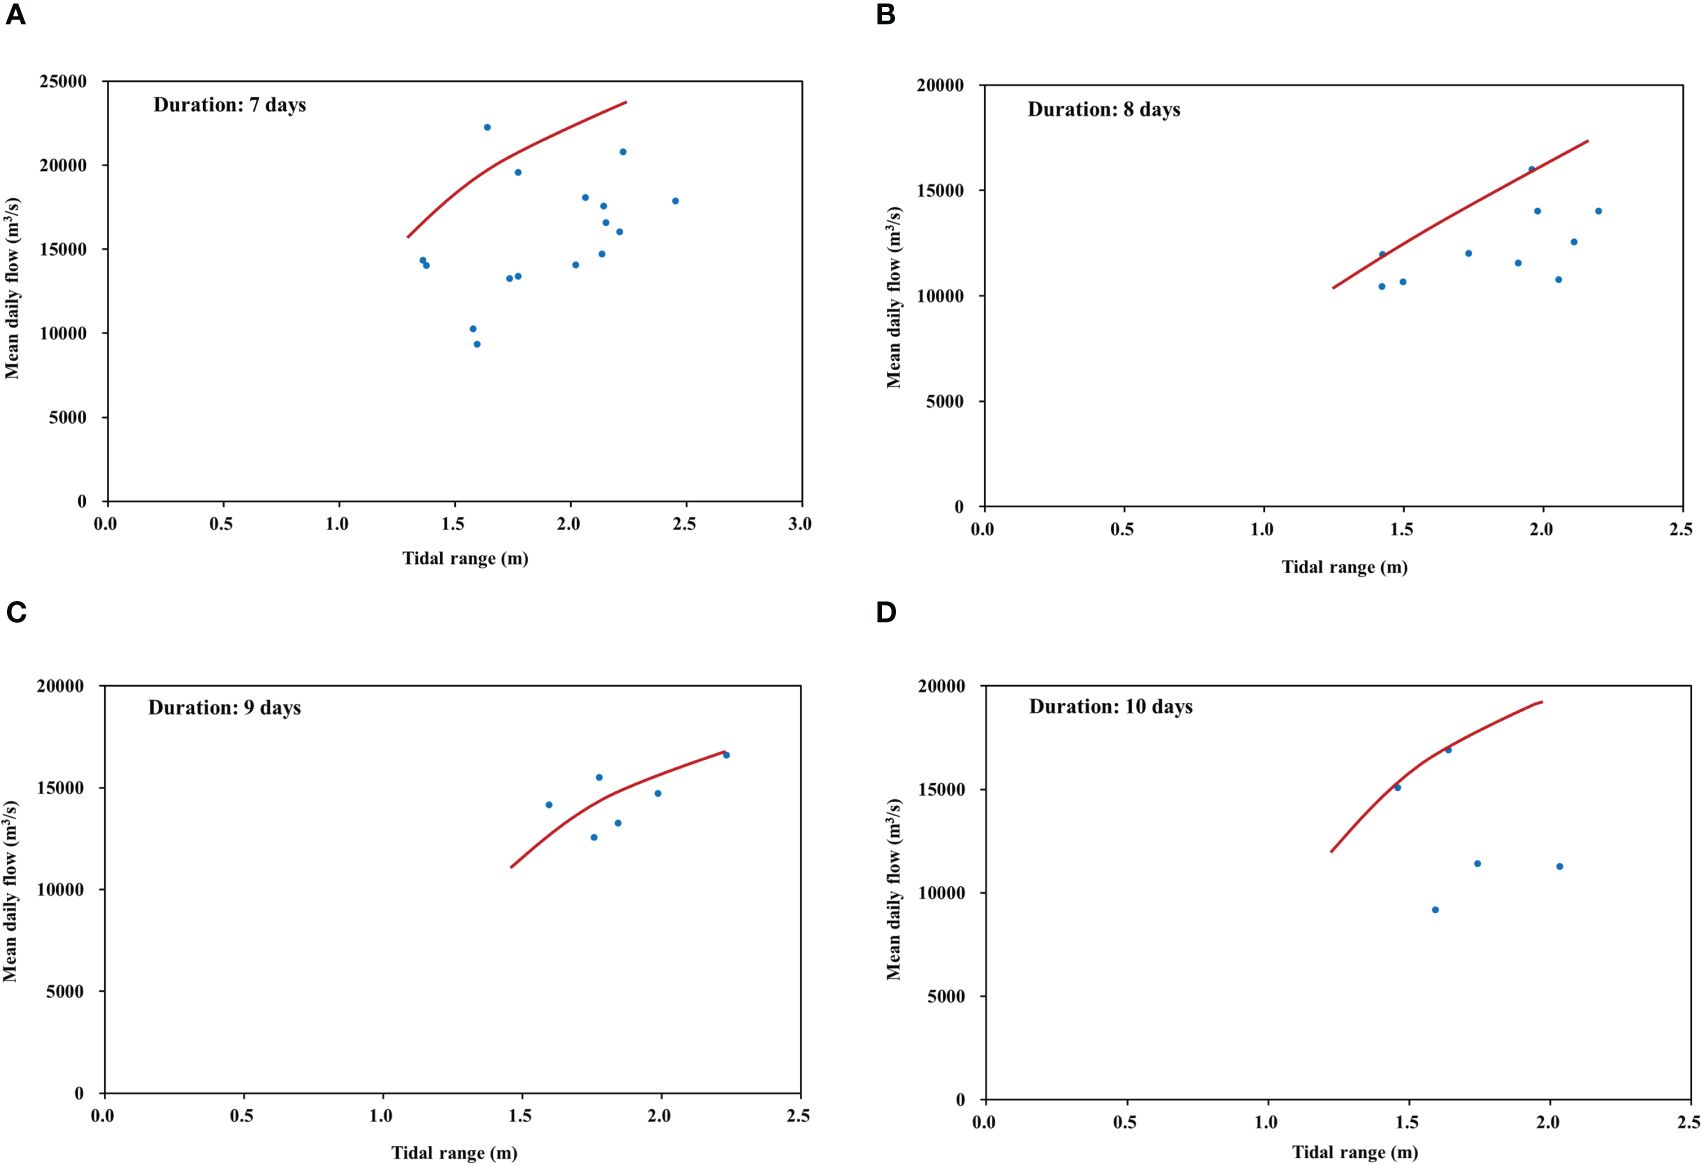
Figure 16 Correlation between tidal range and mean daily flow under different durations of seawater intrusion: (A) Duration 7 days; (B) Duration 8 days; (C) Duration 9 days; (D) Duration 10 days.
Based on the upper envelope under the durations, the correlation between tidal range and daily flow at Datong station is fitted (as shown in Table 2). It is evident from the correlation that the fitting of each function is relatively good. Based on these correlations, the critical flow at Datong station under a certain standard of non-water intake days at Chenhang Reservoir (7 days) and a certain tidal range can be determined. It should be noted that the correlation obtained under a large number of samples for the duration of seawater intrusion is more reliable, while the correlation obtained under a small number of samples for the duration of seawater intrusion still needs to be confirmed.
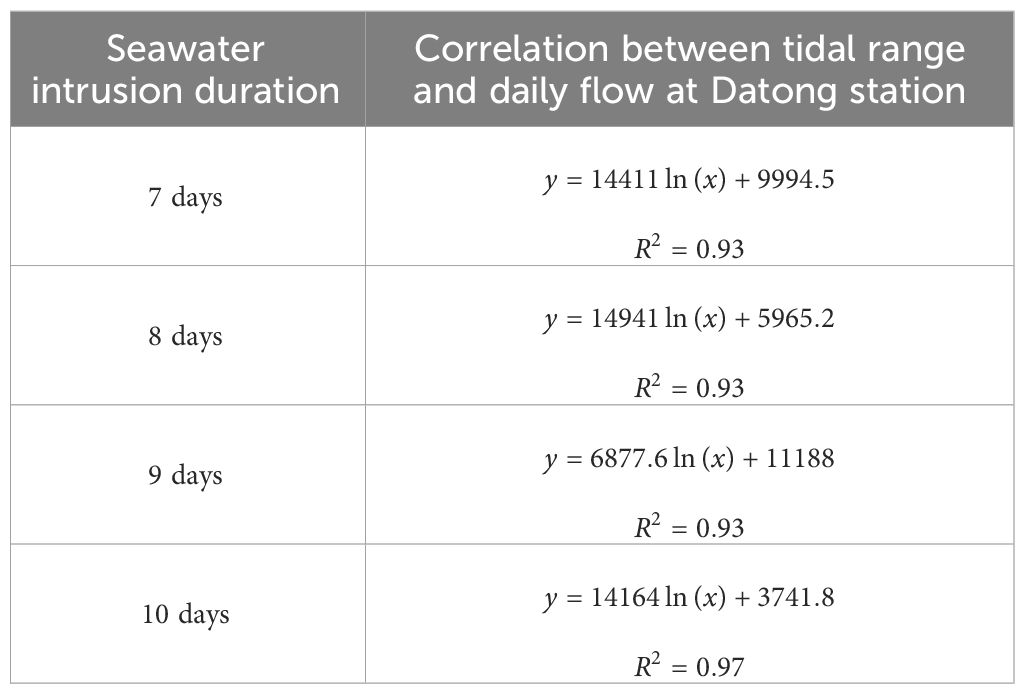
Table 2 Correlation between tidal range and daily flow at Datong station under different seawater intrusion durations.
Based on the statistical data from 2004 to 2014, the phenomenon of seawater intrusion with a duration of 11 days occurred only 2 times, with a duration of 12 days occurred only 1 time, with a duration of 13 days occurred only 1 time, with a duration of 14 days occurred 0 times, and with a duration of 15 days occurred only 1 time. There were no occurrences of seawater intrusion with a duration of more than 15 days. In summary, due to the small proportion of occurrences of seawater intrusion with a duration of 10 days or more (excluding 10 days) in the samples, no statistical analysis is conducted on the correlation between the tidal range and the daily flow at Datong station for seawater intrusion with a duration of 10 days or more.
It can be observed from the Table 3 that under different durations of seawater intrusion, the critical flow at Datong station corresponding to different tidal ranges at Xuliujing varies, further indicating the correlation between the critical flow at Datong station and the duration of seawater intrusion and the tidal range at Xuliujing.
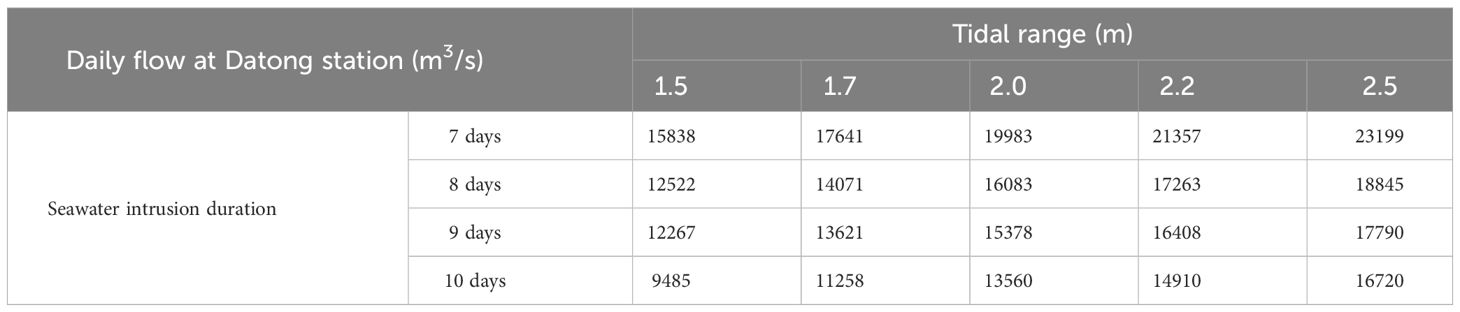
Table 3 Calculation table for tidal range and daily flow at Datong station under different seawater intrusion durations.
The impact of natural and man-made factors on coastal cities due to seawater intrusion is significant. Identifying controllable key factors is essential for ensuring water supply security. This study selected factors such as daily flow, duration of seawater intrusion, water quality, and tidal level to establish correlations and identify the main influencing factors of seawater intrusion in the Yangtze River Estuary. Furthermore, control methods for safeguarding water supply security were proposed. The main conclusions are as follows:
(1) Seawater intrusion mainly occurs from November to April of the following year, with the highest frequency in the months of January to April, particularly in February and March. A few instances of seawater intrusion occur in October and May of the following year, and very few occur in August and September.
(2) By analyzing the important factors affecting the chlorine concentration at the intake (during seawater intrusion), such as the daily flow at Datong station and the tidal range at Xuliujing, the correlation between daily flow and tidal range under different durations of seawater intrusion was determined. The analysis revealed that under specific durations of seawater intrusion, the critical flow required to suppress the seawater increases with the tidal range. The research results provide guidance for emergency scheduling during seawater backflow in the reservoir group centered around the Three Gorges.
The original contributions presented in the study are included in the article/supplementary material. Further inquiries can be directed to the corresponding authors.
YC: Writing – original draft, Writing – review & editing. YX: Writing – original draft, Writing – review & editing. GC: Writing – original draft, Writing – review & editing. MZ: Writing – original draft, Writing – review & editing. TZ: Writing – original draft, Writing – review & editing. XZ: Writing – original draft, Writing – review & editing. YZ: Writing – original draft, Writing – review & editing.
The author(s) declare financial support was received for the research, authorship, and/or publication of this article. This work is supported by the National Key Research and Development Program 35 of China (Grant No. 2023YFC3206005, 2023YFC3206004); the National Natural Science Foundation of China (Grant No. 52209032). Technological Innovation and Application Development Key Project of Chongqing (Grant No. CSTB2022TIAD-KPX0132).
The authors declare that the research was conducted in the absence of any commercial or financial relationships that could be construed as a potential conflict of interest.
All claims expressed in this article are solely those of the authors and do not necessarily represent those of their affiliated organizations, or those of the publisher, the editors and the reviewers. Any product that may be evaluated in this article, or claim that may be made by its manufacturer, is not guaranteed or endorsed by the publisher.
Biemond B., de Swart H. E., Dijkstra H. A. (2023). Mechanisms of salt overspill at estuarine network junctions explained with an idealized model. J. OF GEOPHYS. RESEARCH-OCEANS 128, e2023JC019630. doi: 10.1029/2023JC019630
Boumis G., Moftakhari H. R., Moradkhani H. (2023). Coevolution of extreme sea levels and sea-level rise under global warming. EARTHS Future 11, e2023EF003649. doi: 10.1029/2023EF003649
Cao M. L., Liu W. F., Xu B., Wang L. C., Zhang Y., Zhang Y. (2023). Multi-scenario optimization model for operation of inter-basin water transfer-supply systems considering cost-benefit relationships. J. OF Water AND Climate Change 14, 2872–2884. doi: 10.2166/wcc.2023.259
Casillas-Trasvina A., Zhou Y. X., Stigter T. Y., Mussáa F. E. F., Juízo D. (2019). Application of numerical models to assess multi-source seawater intrusion under natural and pumping conditions in the Great Maputo aquifer, Mozambique. HYDROGEOL. J. 27, 2973–2992. doi: 10.1007/s10040-019-02053-5
Chen Q., Zhu J. R., Lyu H. H., Chen S. L. (2019). Determining critical river discharge as a means to provide water supply security to the Changjiang river estuary, China. J. OF Coast. Res. 35, 1087–1094. doi: 10.2112/JCOASTRES-D-18-00165.1
Chen Y. B., Wang M. L., Zhang Y., Lu Y., Xu B., Yu L. (2023). Cascade hydropower system operation considering ecological flow based on different multi-objective genetic algorithms. Water Resour. Manag. 37, 3093–3110. doi: 10.1007/s11269-023-03491-3
Chen Z. G., Wang Z. X., Liu Y. Y., Wang S. P. (2018). Estimating net discharge of the Yangtze River into the East China Sea. Water SUPP. 18, 1072–1080. doi: 10.2166/ws.2017.181
El-Jaat M., Hulley M., Tétreault M. (2018). Evaluation of the fast orthogonal search method for forecasting chloride levels in the Deltona groundwater supply (Florida, USA). HYDROGEOL. J. 26, 1809–1820. doi: 10.1007/s10040-017-1719-5
He W., Zhang J., Yu X. D., Chen S., Luo J. (2018). Effect of runoff variability and sea level on seawater intrusion: A case study of Nandu river estuary, China. Water Resour. Res. 54, 9919–9934. doi: 10.1029/2018WR023285
Hu S. K., Deng Z. H., Liu B. J., Hu M. C., Xu B. Y., Yu X. (2024). Impact of tidal dynamics and typhoon-induced inundation on seawater intrusion in coastal farms. Sci. OF THE TOTAL Environ. 915, 170109. doi: 10.1016/j.scitotenv.2024.170109
Li D., Liu B. J., Lu Y., Fu J. Y. (2023). Assessment of changes in severity of compound drought and seawater intrusion events based on a multi-index approach in Pearl River estuary. HYDROL. PROCESSES 37, e14986. doi: 10.1002/hyp.14986
Li H. W., Yang Q. S., Mo S. H., Huang J., Wang S. M., Xie R. Y., et al. (2022). Formation of turbidity maximum in the Modaomen estuary of the Pearl river, China: the roles of mouth bar. J. OF GEOPHYS. RESEARCH-OCEANS 127, e2022JC018766. doi: 10.1029/2022JC018766
Li L. J., Zhu J. R., Chant R. J., Wang C. N., Pareja-Roman L. F. (2020). Effect of dikes on seawater intrusion under various wind conditions in the Changjiang estuary. J. OF GEOPHYS. RESEARCH-OCEANS 125, e2019JC015685. doi: 10.1029/2019JC015685
Liu B. J., Yan S. L., Chen X. H., Lian Y. Q., Xin Y. B. (2014). Wavelet analysis of the dynamic characteristics of seawater intrusion - A case study in the Pearl River Estuary of China. OCEAN Coast. Manage. 95, 81–92. doi: 10.1016/j.ocecoaman.2014.03.027
Mei X. F., Zhang M., Dai Z. J., Wei W., Li W. H. (2019). Large addition of freshwater to the tidal reaches of the Yangtze (Changjiang) river. ESTUARIES AND COASTS 42, 629–640. doi: 10.1007/s12237-019-00518-0
Mu D. P., Xu T. H., Yan H. M. (2024). Sea level rise along China coast from 1950 to 2020. Sci. CHINA-EARTH Sci. 67 (3), 802–810 doi: 10.1007/s11430–023-1240-x
Paiva B. P., Schettini C. A. F. (2021). Circulation and transport processes in a tidally forced salt-wedge estuary: The Sao Francisco river estuary, Northeast Brazil. REGION. Stud. IN Mar. Sci. 41, 101602. doi: 10.1016/j.rsma.2020.101602
Roy D. K., Datta B. (2018). Influence of sea level rise on multiobjective management of seawater intrusion in coastal aquifers. J. OF HYDROL. Eng. 23, 04018035. doi: 10.1061/(ASCE)HE.1943-5584.0001680
Tao Z. J., Chu A., Chen Y. P., Lu S. Q., Wang B. (2020). Wind effect on the seawater intrusion in the Yangtze estuary. J. OF Coast. Res. 105, 42–46. doi: 10.2112/JCR-SI105-009.1
Wang M. L., Zhang Y., Lu Y., Gao L., Wang L. Z. (2023). Attribution analysis of streamflow changes based on large-scale hydrological modeling with uncertainties. Water Resour. Manag. 37, 713–730. doi: 10.1007/s11269-022-03396-7
Wang M. L., Zhang Y., Lu Y., Wan X. Y., Xu B., Yu Y. (2022). Comparison of multi-objective genetic algorithms for optimization of cascade reservoir systems. J. Water Clim. Change 13, 4069–4086. doi: 10.2166/wcc.2022.290
Xiao H., Tang Y., Li H. M., Zhang L., Ngo-Duc T., Chen D. L., et al. (2021). Seawater intrusion into groundwater systems in the Mekong Delta and links to global change. Adv. IN Climate Change Res. 12, 342–352. doi: 10.1016/j.accre.2021.04.005
Xu Y. S., Chen Y. B., Ren Y. F., Tang Z. Y., Yang X., Zhang Y. (2023). Attribution of streamflow changes considering spatial contributions and driver interactions based on hydrological modeling. Water Resour. Manag. 37, 1859–1877. doi: 10.1007/s11269-023-03459-3
Yin K., Xu S. D., Huang W. R. (2018). Estimating extreme sea levels in Yangtze Estuary by quadrature Joint Probability Optimal Sampling Method. Coast. Eng. 140, 331–341. doi: 10.1016/j.coastaleng.2018.08.007
Zhang Y., Yu L., Wu S. Q., Wu X. F., Dai J. Y., Xue W. Y., et al. (2021). A framework for adaptive control of multi-reservoir systems under changing environment. J. Clean Prod. 316, 128304. doi: 10.1016/j.jclepro.2021.128304
Keywords: seawater intrusion, influencing factors, controllable factors, Yangtze River Estuary, water supply security
Citation: Chen Y, Xu Y, Chen G, Zeng M, Zhang T, Zhang X and Zhang Y (2024) Analysis of influencing factors of seawater intrusion in the Yangtze River Estuary and control for water supply security. Front. Mar. Sci. 11:1413548. doi: 10.3389/fmars.2024.1413548
Received: 07 April 2024; Accepted: 29 April 2024;
Published: 16 May 2024.
Edited by:
Chengji Shen, Hohai University, ChinaReviewed by:
Xiuqin Yang, Nanjing University of Information Science and Technology, ChinaCopyright © 2024 Chen, Xu, Chen, Zeng, Zhang, Zhang and Zhang. This is an open-access article distributed under the terms of the Creative Commons Attribution License (CC BY). The use, distribution or reproduction in other forums is permitted, provided the original author(s) and the copyright owner(s) are credited and that the original publication in this journal is cited, in accordance with accepted academic practice. No use, distribution or reproduction is permitted which does not comply with these terms.
*Correspondence: Yu Zhang, eXV6aGFuZ0BuaHJpLmNu; Xiao Zhang, enhoaHUxOTkxQDE2My5jb20=
Disclaimer: All claims expressed in this article are solely those of the authors and do not necessarily represent those of their affiliated organizations, or those of the publisher, the editors and the reviewers. Any product that may be evaluated in this article or claim that may be made by its manufacturer is not guaranteed or endorsed by the publisher.
Research integrity at Frontiers
Learn more about the work of our research integrity team to safeguard the quality of each article we publish.