 Eun-Bi Kim
 Se-Jong Ju
 Yeon Jee Suh
94% of researchers rate our articles as excellent or good
Learn more about the work of our research integrity team to safeguard the quality of each article we publish.
Find out more
ORIGINAL RESEARCH article
Front. Mar. Sci., 25 June 2024
Sec. Marine Molecular Biology and Ecology
Volume 11 - 2024 | https://doi.org/10.3389/fmars.2024.1412678
Seamounts within deep-sea ecosystems are recognized as biodiversity hotspots, yet they are increasingly threatened by anthropogenic activities such as overfishing, resource exploitation, and climate change. To establish environmental baseline data and assess the impacts of current or future anthropogenic activities, we conducted environmental DNA (eDNA) metabarcoding analyses to comprehensively characterize prokaryotic and eukaryotic diversity across various water depths of the Magellan seamounts and the adjacent abyssal plains. Metabarcoding analysis revealed higher richness and diversity in both prokaryotic and eukaryotic communities within the seamounts compared to the abyssal plains. Overall, the analysis identified 9,068 prokaryotic amplicon sequence variants (ASVs), representing 39 phyla and 47 classes. Similarly, 4,569 eukaryotic ASVs were identified, spanning 34 phyla and 93 classes. Furthermore, our results revealed distinct community structures between the seamounts and abyssal plains, with turnover across different water depths. These findings are crucial as they indicate the unique ecological roles and potential vulnerability of seamount communities, emphasizing the need for targeted conservation strategies. Our study underscores the importance of conducting comprehensive long-term environmental assessments of the impacts of anthropogenic activities on seamount ecosystems and highlights the potential of eDNA metabarcoding as a powerful tool for guiding conservation and management efforts in remote and challenging marine environments.
Seamounts are vital for deep-sea ecosystems as they provide habitats for numerous marine organisms and perform a range of crucial functions (Pitcher et al., 2007). Despite being considered biodiversity hotspots, many seamounts still remain poorly understood, primarily due to their remoteness and the associated technical limitations (Ramı́rez-Llodra et al., 2010). Additionally, seamount ecosystems face increasing threatens from anthropogenic activities such as overfishing, exploitation of mineral resources, and climate change. The communities within these ecosystems are highly vulnerable to anthropogenic impacts because of the slow growth rates and high longevity of seamount species, especially sessile fauna (Clark et al., 2010; Ramı́rez-Llodra et al., 2011). Thus, it is crucial to characterize seamount community structures to assess and monitor their biodiversity for effective management and conservation of seamount ecosystems.
Numerous anthropogenic activities occur on seamounts worldwide. Currently, seamount ecosystems are predominantly affected by fishery activities (Watson et al., 2007; Clark, 2009). These activities range from longline fishing to bottom trawling, which deplete fishery resources and likely damage benthic communities (Pitcher et al., 2007). Fish communities on seamounts often aggregate in localized areas for spawning or feeding, making them highly vulnerable to fishing (Morato et al., 2006). Notably, seamounts also harbor valuable marine mineral resources such as manganese nodules and cobalt-rich ferromanganese crusts (Hein et al., 2010). With the growing interest in mineral resources due to their economic potential as a future resource, the exploration of seamounts for these valuable deposits has gradually intensified (Hein et al., 2017; Weaver and Billett, 2019), subsequently leading to direct physical disturbance and the formation of sediment plumes (Levin et al., 2016). These anthropogenic activities raise serious concerns regarding their impacts on seamount ecosystems, highlighting the importance of seamount conservation. However, there is a lack of current experimental data comparing community structures before and after anthropogenic activities, which impedes the comprehensive assessment of their impact on seamount ecosystems. Numerous baseline studies have explored the biodiversity and community structure of seamounts, contributing crucial data for devising robust conservation strategies (McClain et al., 2009; Schlacher et al., 2014; Morgan et al., 2015; Du Preez et al., 2016; Delavenne et al., 2019). However, environmental baseline studies on the Magellan seamounts in the western Pacific are scarce (Xu, 2021). These areas, where the International Seabed Authority (ISA) has granted five deep-sea mineral exploration licenses—four for cobalt-rich ferromanganese crusts and one for polymetallic manganese nodules—are less studied than their counterparts in the central and eastern Pacific, despite the potential for mining activities to occur. Therefore, the implementation of efficient biodiversity assessment and monitoring methods is necessary to conduct long-term and large-scale surveys in this area.
Deep-sea biodiversity surveys face numerous obstacles due to extreme environmental conditions, taxonomic challenges of identifying small and unknown organisms, inaccessibility, and limited sampling techniques (Ramírez-Llodra and Billett, 2006; Danovaro et al., 2014). Traditional survey methods, such as morphological identification and trawling, are labor-intensive, time-consuming, invasive, and taxa-specific, thus hindering large-scale surveys of deep-sea ecosystems (Beng and Corlett, 2020). Meanwhile, environmental DNA (eDNA) metabarcoding approaches are increasingly used to characterize deep-sea biodiversity across various seafloor habitats (Cowart et al., 2020; Klunder et al., 2020; Laroche et al., 2020b; Bergo et al., 2022; Ferreira et al., 2022; Diao et al., 2023). This method offers several advantages, including cost-effectiveness, environmental nondestructiveness, the ability to detect a wide range of taxa, and efficiency in surveying large and hard-to-access ecosystems with high sensitivity and statistically meaningful sample sizes (Brandt et al., 2020; Le et al., 2022). Recently, several eDNA metabarcoding studies have utilized sediment samples to reveal prokaryotic, foraminiferal, and fungal communities in the Magellan seamounts, demonstrating their effectiveness and reliability (Luo et al., 2020; Yang et al., 2020; Shi et al., 2021; Sun et al., 2023). Therefore, eDNA metabarcoding holds promise for advancing our understanding of deep-sea ecosystems and guiding conservation efforts in remote and challenging environments by overcoming the limitations of traditional methods.
In this study, we conducted eDNA metabarcoding analysis in the Magellan seamounts and adjacent abyssal plains to advance our understanding of these ecosystems and gain insights crucial for assessing the potential impacts of current or future anthropogenic activities. Our objectives were twofold: 1) to assess the diversity of prokaryotes and eukaryotes on the Magellan seamount at various water depths, and 2) to compare the community structures of the organisms on the Magellan seamount with those observed in adjacent abyssal plains.
Seawater samples were collected from two seamounts, KC-2 (Hemler Guyot) and KC-8 (Gordin Guyot), and the adjacent abyssal plains located between the two seamounts in November 2022 to analyze and compare the prokaryotic and eukaryotic communities within these habitats using eDNA metabarcoding analysis (Figure 1). A total of 12 sampling sites (S1–S12) were selected, with 11 sites (S1–S11) located at KC-2 and one site (S12) at KC-8. The intensive sampling at KC-2 was conducted to enable spatial comparisons of biodiversity within the seamount. Seawater samples were collected from four distinct water depths: the summit of the seamount (T; 1,350 m for KC-2 and 1,550 m for KC-8), 2,000 m (2 K), 3,000 m (3 K), and the bottom (BT; ranging from 3,085–4,600 m) (Supplementary Table 1). However, at site S9 of KC-2, seawater was obtained only at a depth of 1,302 m (T). Additionally, three seawater samples (AP1–AP3) were collected from the abyssal plain at the bottom depth (BT; ranging from 5,272–5,405 m) (Supplementary Table 1). Seawater temperature and salinity were measured at each sample collection site using an SBE 911plus CTD (Sea-Bird Scientific, Washington, United States). Duplicate seawater samples, totaling four liters, and sterile distilled water for the negative control were each filtered through a mixed cellulose ester (MCE) membrane filter with a pore size of 0.45 μm (Pall Corporation, New York, United States). The filtered membranes were promptly stored at −70°C until genomic DNA extraction was performed.
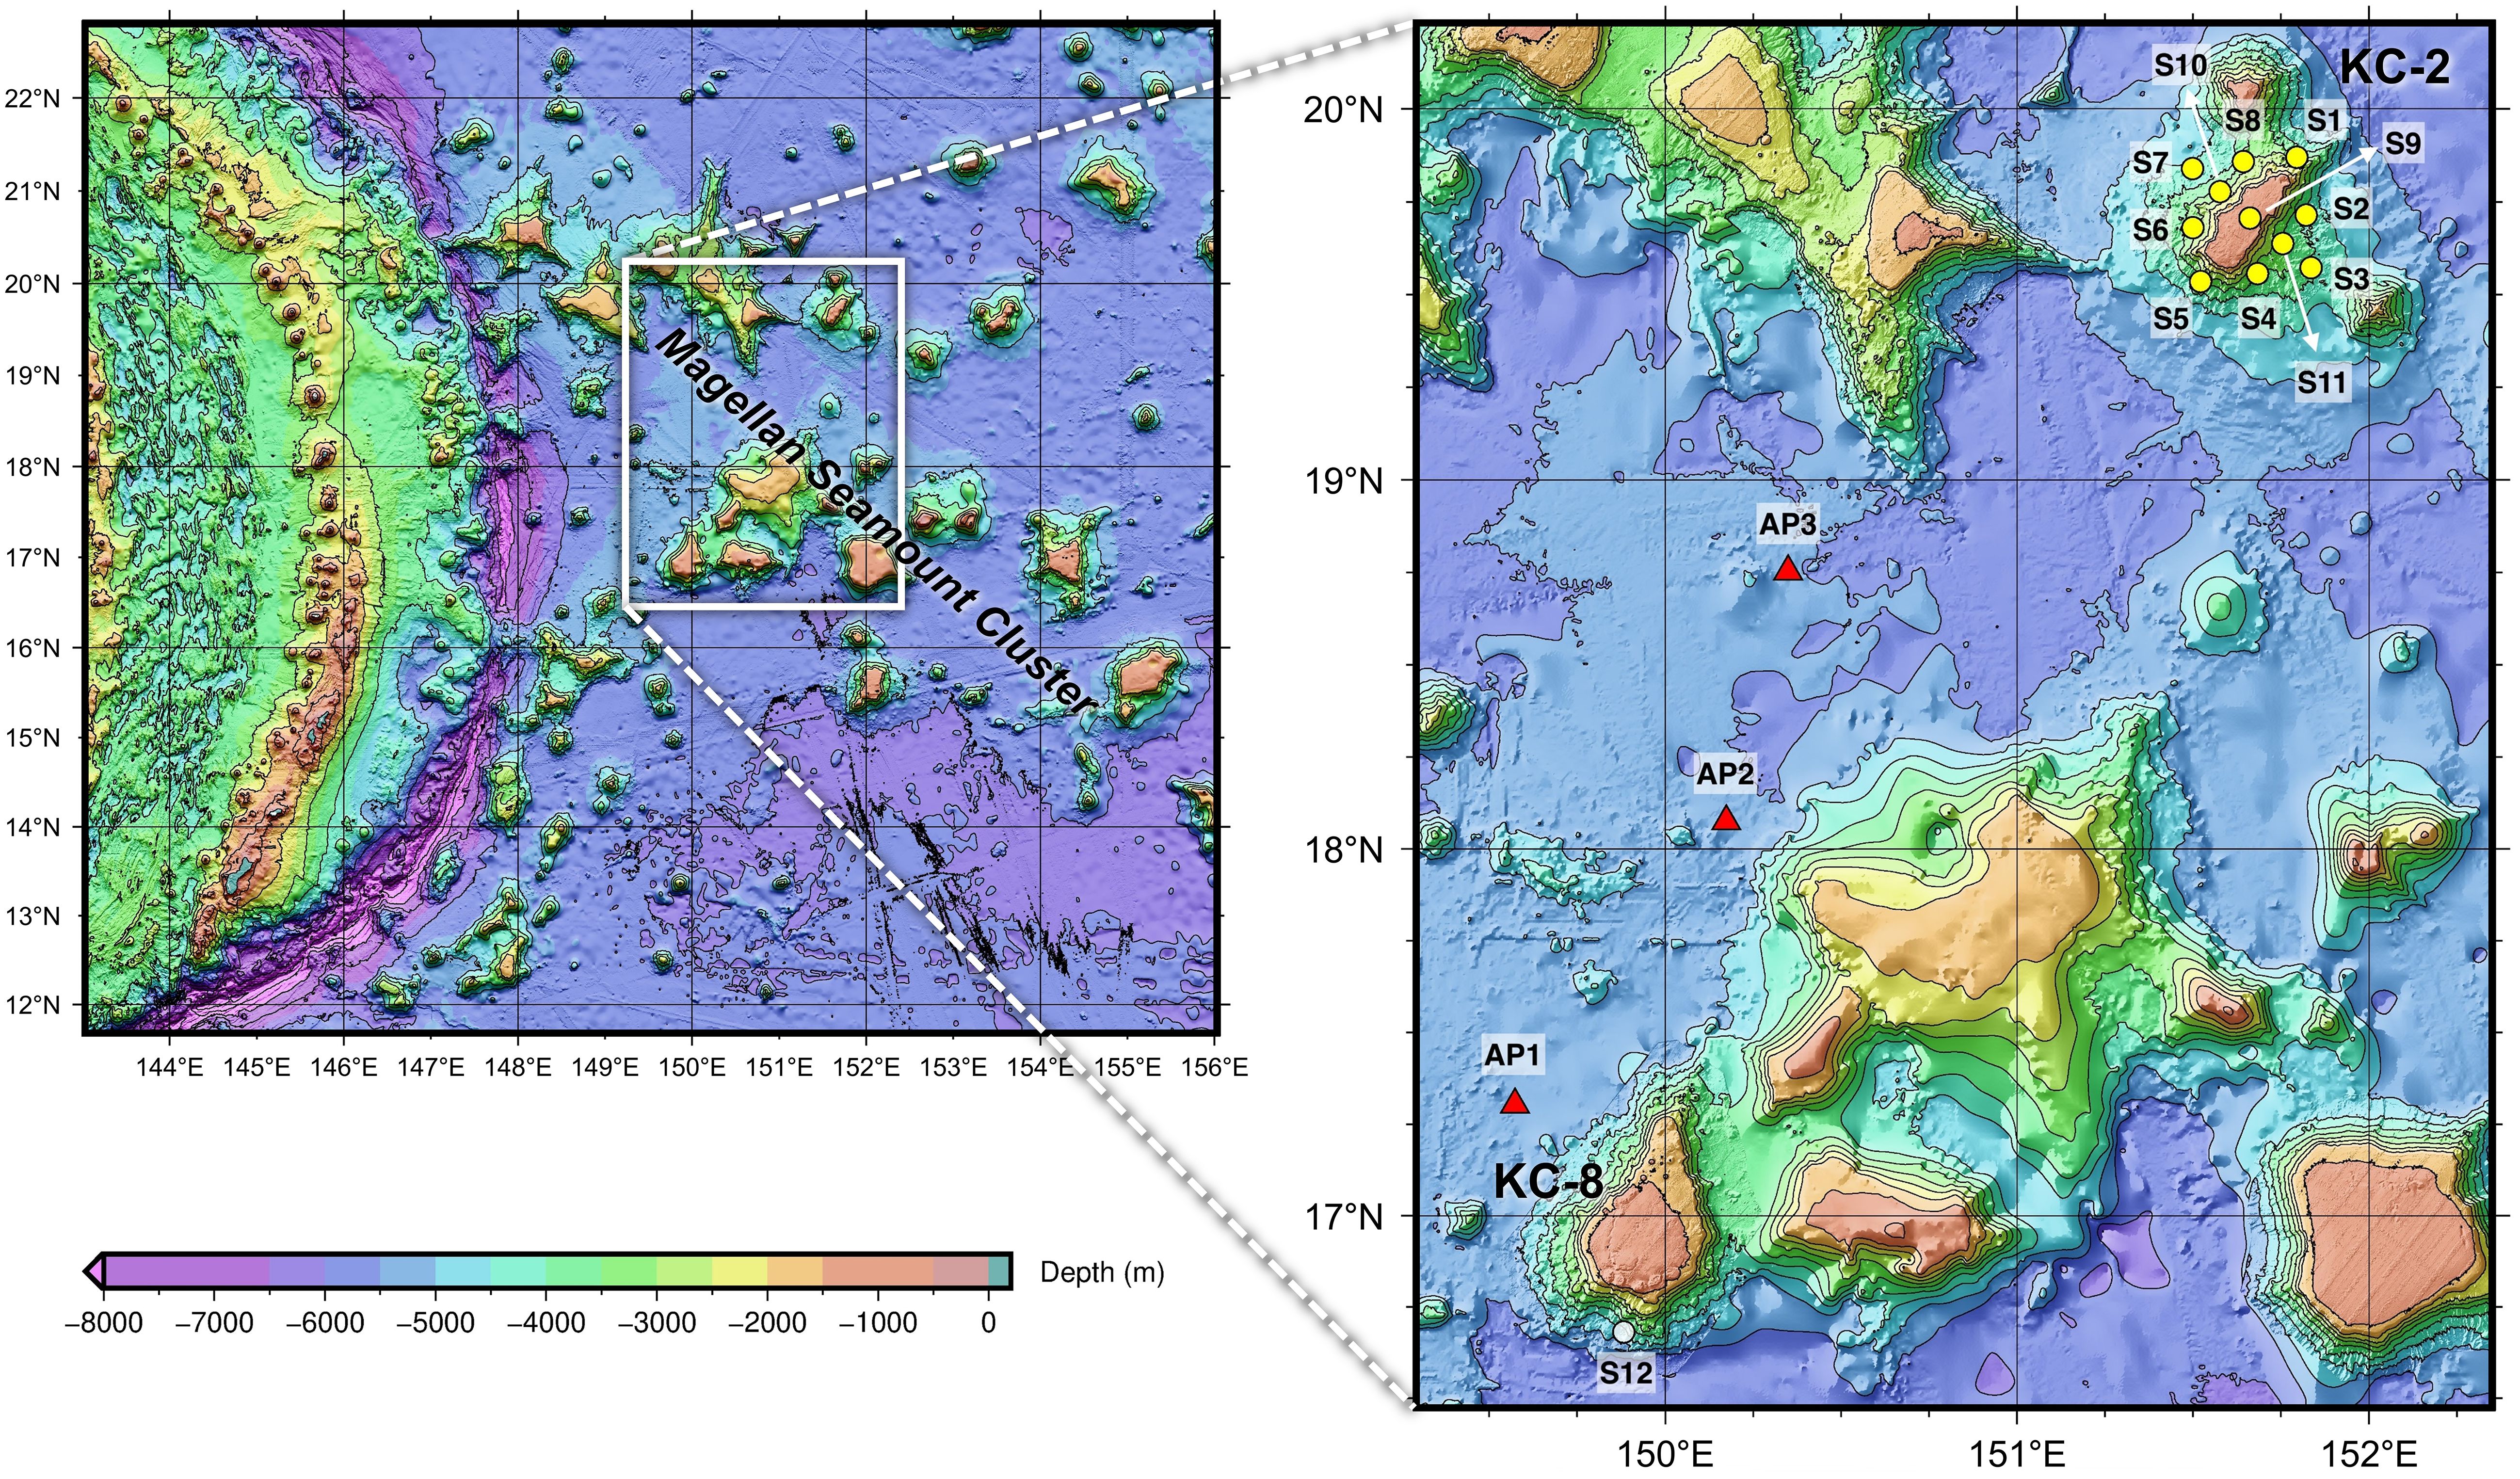
Figure 1 Seawater sample collection sites for the metabarcoding analysis of prokaryotic and eukaryotic communities from the Magellan seamounts and adjacent abyssal plains in the western Pacific Ocean (yellow and white circles represent sample collection sites from the seamount, and red triangles represent those from the abyssal plain).
Genomic DNA containing eDNA was extracted from the filtered membrane using a DNeasy Blood & Tissue Kit (QIAGEN, Hilden, Germany) according to the manufacturer’s protocol. The membrane was initially homogenized with lysis buffer and ceramic spheres using Bioprep-24R (Allsheng, Hangzhou, China). The amount of eDNA was quantified using a NanoDrop One Microvolume UV-Vis Spectrophotometer (Thermo Fisher Scientific, Waltham, MA, USA). To prevent cross-contamination, all instruments employed for sample preparation were treated with 10% bleach (sodium hypochlorite) prior to use.
Amplicon libraries for metabarcoding analysis of the prokaryotic and eukaryotic communities were constructed, incorporating negative controls for eDNA extraction and a mixture of polymerage chain reaction (PCR) to assess potential contamination. Primers targeting the V3–V4 region of the 16S rRNA gene and the V9 region of the 18S rRNA gene were used to analyze prokaryotic and eukaryotic taxa from seawater samples, respectively (Herlemann et al., 2011; Piredda et al., 2017). Primary PCR was performed using the Illumina Nextera adapter-linked primer set (Illumina, San Diego, CA, USA). PCR conditions used for library preparation were in accordance with those used in previous studies (Piredda et al., 2017; Kang et al., 2018). The quantity and quality of constructed libraries were assessed using the Qubit™ 4 Fluorometer (Thermo Fisher Scientific, Waltham, United States) and the 2100 Bioanalyzer (Agilent Technologies, Santa Clara, United States). The final pooled libraries, standardized to equimolar concentrations, were sequenced on the Illumina MiSeq platform.
Raw reads were trimmed and filtered to remove the adapter/index sequences and low-quality reads (QV < 20) using the CLC Genomics Workbench v. 8.0 (QIAGEN, Hilden, Germany). The primer sequences were removed using Cutadapt v.2.10 (Martin, 2011). To eliminate erroneous sequences, the ASVs were inferred from these trimmed reads using the DADA2 package (v.1.22.0) in R (v.4.2.1) (Callahan et al., 2016). The reads were filtered using MaxN=0, maxEE (maximum expected errors)=2, and truncQ (truncation based on quality scores)=2 for both prokaryotic and eukaryotic reads. Denoised ASVs were obtained by merging filtered reads and removing chimeric sequences using default commands. The generated ASVs were further curated to identify erroneous clusters using a post-clustering algorithm by the LULU (v.0.1.0) (Frøslev et al., 2017). The minimum match parameter was adjusted to 95, and the other values were maintained at their default settings. Taxonomic assignment of the curated ASVs was performed using BLAST+ 2.13.0, based on the GenBank nucleotide database. For the prokaryotic and eukaryotic ASVs, a 99% cut-off identity to the database was applied to assign species names. ASVs exhibiting less than 90% identity or below 70% query coverage to the database were classified as “Unknown”. Further analyses of the prokaryotic and eukaryotic community structures were conducted using ASVs with assigned phylum-level descriptions.
Rarefaction and alpha diversity analyses were conducted on ASVs obtained from each seawater sample. The Shannon–Wiener index (H’) and Pielou’s evenness (J’) were calculated using square root transformed count data of relative ASV read abundance. Additionally, rarefaction and extrapolation curves for ASVs based on sample size were generated using the iNEXT package (v.3.0.0) in R, along with 95% confidence intervals.
UpSet plots were constructed to visualize the shared and unique ASVs among different water depth groups of prokaryotic and eukaryotic communities using ComplexUpset (v.1.3.3) package in R. Similarity analyses of these communities were carried out using non-metric multidimensional scaling (nMDS) analysis based on Bray–Curtis similarity and square root-transformed count data in PRIMER 7 (v.7.0.23). Analysis of similarities (ANOSIM) and similarity percentages (SIMPER) were used to assess significant differences between community structures and to identify key ASVs contributing to their dissimilarity. Heatmap plots were constructed to visualize the similarity or dissimilarity patterns among communities using XLSTAT software (v.2023.1.5).
At the summit depth of two seamounts, the water temperature ranged from 2.86°C–3.02°C, with an average of 2.94°C (Figure 2; Supplementary Table 1). The mean water temperature at a depth of 2,000 m in the seamounts was 2.08°C, ranging from 2.04°C–2.12°C, which was 0.86°C lower than that at the summit depth. The water temperature at a depth of 3,000 m ranged from 1.58°C–1.64°C, while the values at the bottom depth of the seamounts ranged from 1.47°C–1.59°C, with an average of 1.52°C, which was 0.09°C lower than that at a depth of 3,000 m (1.61°C). No significant differences in water temperature were identified between the two seamounts, KC-2 and KC-8, at any of the four different water depths. The mean water temperature at the bottom depth of the abyssal plain area was 1.50°C, with a range from 1.49°C–1.50°C. These values did not significantly differ from those at the bottom depths of the seamounts, despite the mean bottom depth of the abyssal plain area being approximately 1,655 m deeper than that of the seamounts. The salinity range at the summit depth of the seamounts was between 34.55–34.58 psu, while it ranged from 34.61–34.63 psu at a depth of 2,000 m, with an average of 34.62 psu, representing a 0.06 psu increase compared to that at the summit depth. The mean salinity at the depth of 3,000 m was 34.67 psu, ranging from 34.66–34.67 psu, which was 0.02 psu lower than that at the bottom depth of seamounts, which ranged from 34.67–34.70 psu. The mean salinity at the bottom of the abyssal plain is 34.70 psu. Similar to the water temperature, no significant differences in salinity were observed between the two seamounts at any of the four water depths, nor between the bottom depths of the seamounts and the abyssal plain area.
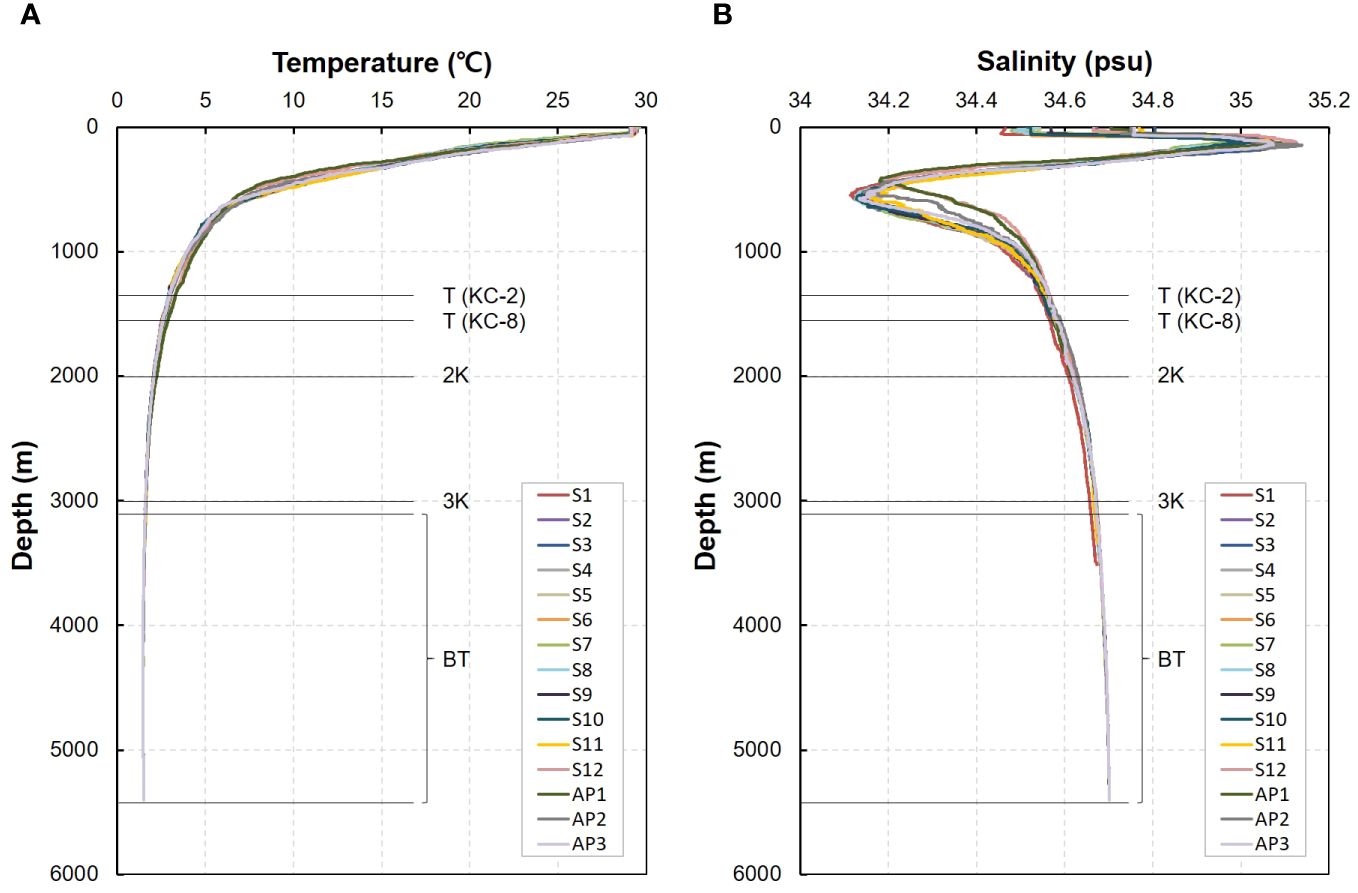
Figure 2 Depth profiles of physical parameters (A, temperature; B, salinity) at the seawater collection sites in the western Pacific Ocean (S, seamount; AP, abyssal plain; T, summit depth; 2K, 2,000 m; 3K, 3,000 m; BT, bottom depth).
eDNA metabarcoding was conducted to determine the prokaryotic and eukaryotic communities of the Magellan seamounts and adjacent abyssal plains using seawater samples collected at different water depths. A total of 6,958,118 and 8,290,577 raw reads generated by MiSeq sequencing yielded 3,036,621 and 4,077,089 non-chimeric merged reads for prokaryotes and eukaryotes, respectively, from 48 seawater samples (Table 1). Rarefaction analysis of these 16S and 18S merged reads resulted in curves that reached a plateau, indicating sufficient sequencing depth to reflect the diversity of these communities in each sample (Supplementary Figures 1, 2). Overall, 9,068 prokaryotic ASVs were generated from 3,036,621 reads through careful curation, and subsequently assigned to 39 phyla and 47 classes (Table 1). Meanwhile, 4,569 eukaryotic ASVs were obtained from 4,077,089 reads and assigned to 34 phyla and 93 classes.
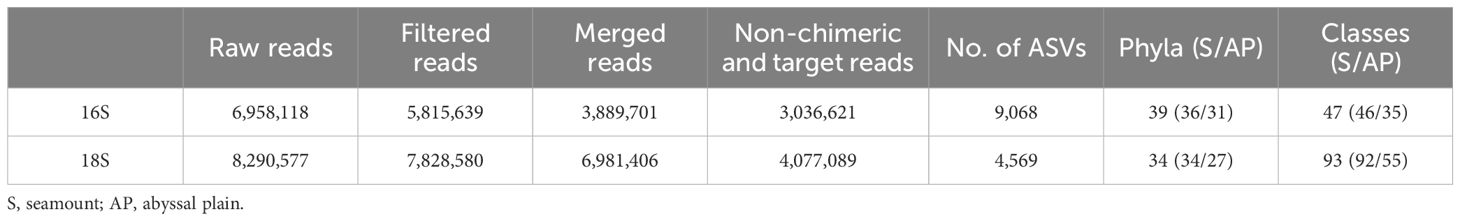
Table 1 Summary of 16S and 18S rRNA gene metabarcoding results for 48 seawater samples from the western Pacific Ocean.
ASV richness and alpha diversity indices, including Shannon–Wiener index (H’) and Pielou’s evenness (J’), were compared between the four water depth groups of the seamount and the abyssal plain (Figure 3; Supplementary Table 2). In prokaryotic communities, the highest mean ASV richness was identified at a depth of 2,000 m in the seamount (835.46), followed by those at the bottom (828.27), at 3,000 m (763.36), at the summit (750.67) of the seamount, and the abyssal plain (723.67) (Figure 3A). The mean Shannon–Wiener index was highest at the bottom depth of the seamount (6.36), followed by depths of 2,000 m (6.35), 3,000 m (6.28), the summit (6.20) of the seamount, and the abyssal plain (6.16) (Figure 3B). The mean Pielou’s evenness showed minimal variation, ranging from 0.938 in the abyssal plain to 0.951 at a depth of 3,000 m of the seamount (Figure 3C). In the eukaryotic communities, the number of ASVs and the mean Shannon–Wiener index were highest at a depth of 2,000 m of the seamount (458.09 and 5.75), followed by depths at 3,000 m (423.18 and 5.63), the bottom (384.82 and 5.49), the summit (347.58 and 5.41), and the abyssal plain (325.00 and 5.18), respectively (Figures 3D, E). Similarly, the depth of the 2,000 m group of the seamount (0.944) showed the highest mean Pielou’s evenness, followed by those at 3,000 m (0.938), the summit (0.934), the bottom (0.929), and the abyssal plain (0.895) (Figure 3F). The mean richness and alpha diversity indices of eukaryotic ASVs exhibited consistent patterns across all depth groups, increasing from the summit depth to 2,000 m, reaching their highest values, and then decreasing with increasing water depth, ultimately reaching their lowest values on the abyssal plain.
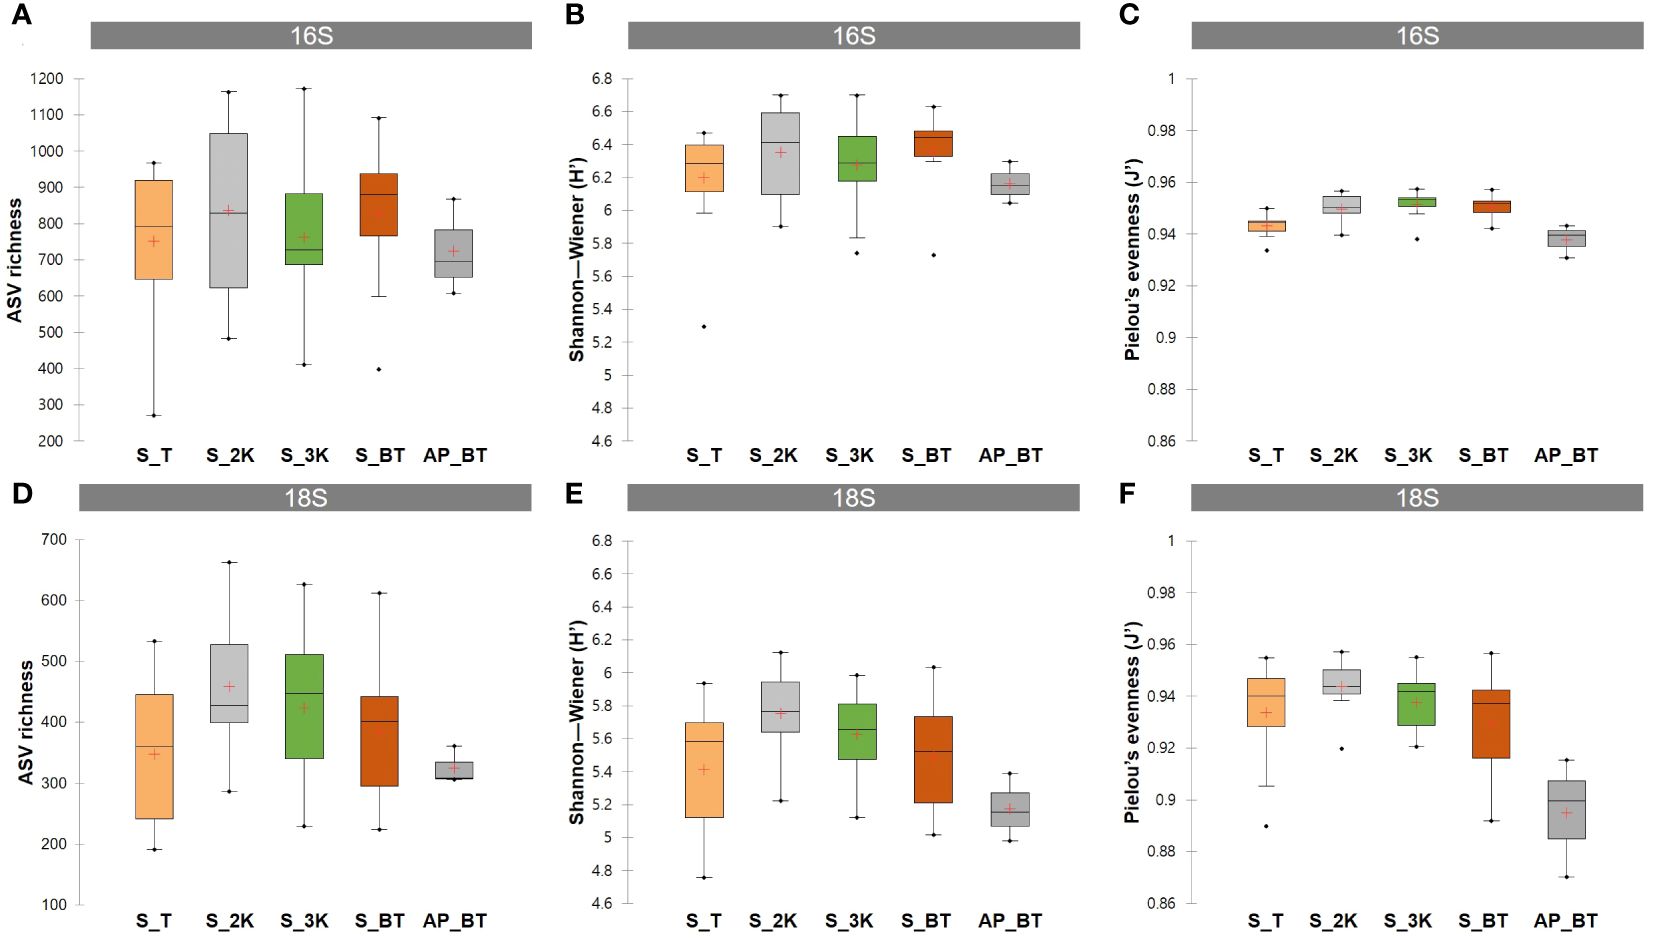
Figure 3 Amplicon sequence variants (ASVs) richness and alpha diversity indices including the Shannon–Wiener index and Pielou’s evenness for prokaryotic (A–C) and eukaryotic (D–F) ASVs detected in different water depth groups (S, seamount; AP, abyssal plain; T, summit depth; 2K, 2,000 m; 3K, 3,000 m; BT, bottom depth).
The relative read abundances of the prokaryotic and eukaryotic communities were analyzed at the phylum level (Figure 4). Among the 39 phyla, the prokaryotic communities were dominated by Pseudomonadota, ranging from 50.58–62.68% across all the samples, followed by Chloroflexota (11.83–25.75%), Methanobacteriota (2.70–11.01%), Actinomycetota (1.73–10.99%), and Unclassified Bacteria (2.04–5.25%) (Figure 4A; Supplementary Table 3). There were no identifiable differences in the prokaryotic community composition across all samples at the phylum level. In the eukaryotic communities, on the other hand, Euglenozoa was the most abundant among the 34 phyla, ranging from 7.15–69.21%, followed by Myzozoa (2.67–44.42%), Radiozoa (0.84–63.18%), Cnidaria (0.32–62.95%), and Unidentified eukaryote (1.12–19.55%) (Figure 4B; Supplementary Table 4). The phylum Cnidaria was most abundantly found in the bottom depth of sites S4 (62.95%), site AP2 (54.77%), and site S2 (45.96%), whereas the phylum Arthropoda was identified in particularly high proportions at the bottom depth of site S5 (73.14%) and at a depth of 2,000 m at site S1 (60.75%). The relative abundance of “Unknown” ranged from 0.40–80.31%, with the highest proportion observed at the summit depth of site S4, followed by depths at the summit of site S11 (46.02%), 3,000 m of site S3 (20.46%), the bottom of site S2 (20.11%), and the summit of site S5 (17.21%).
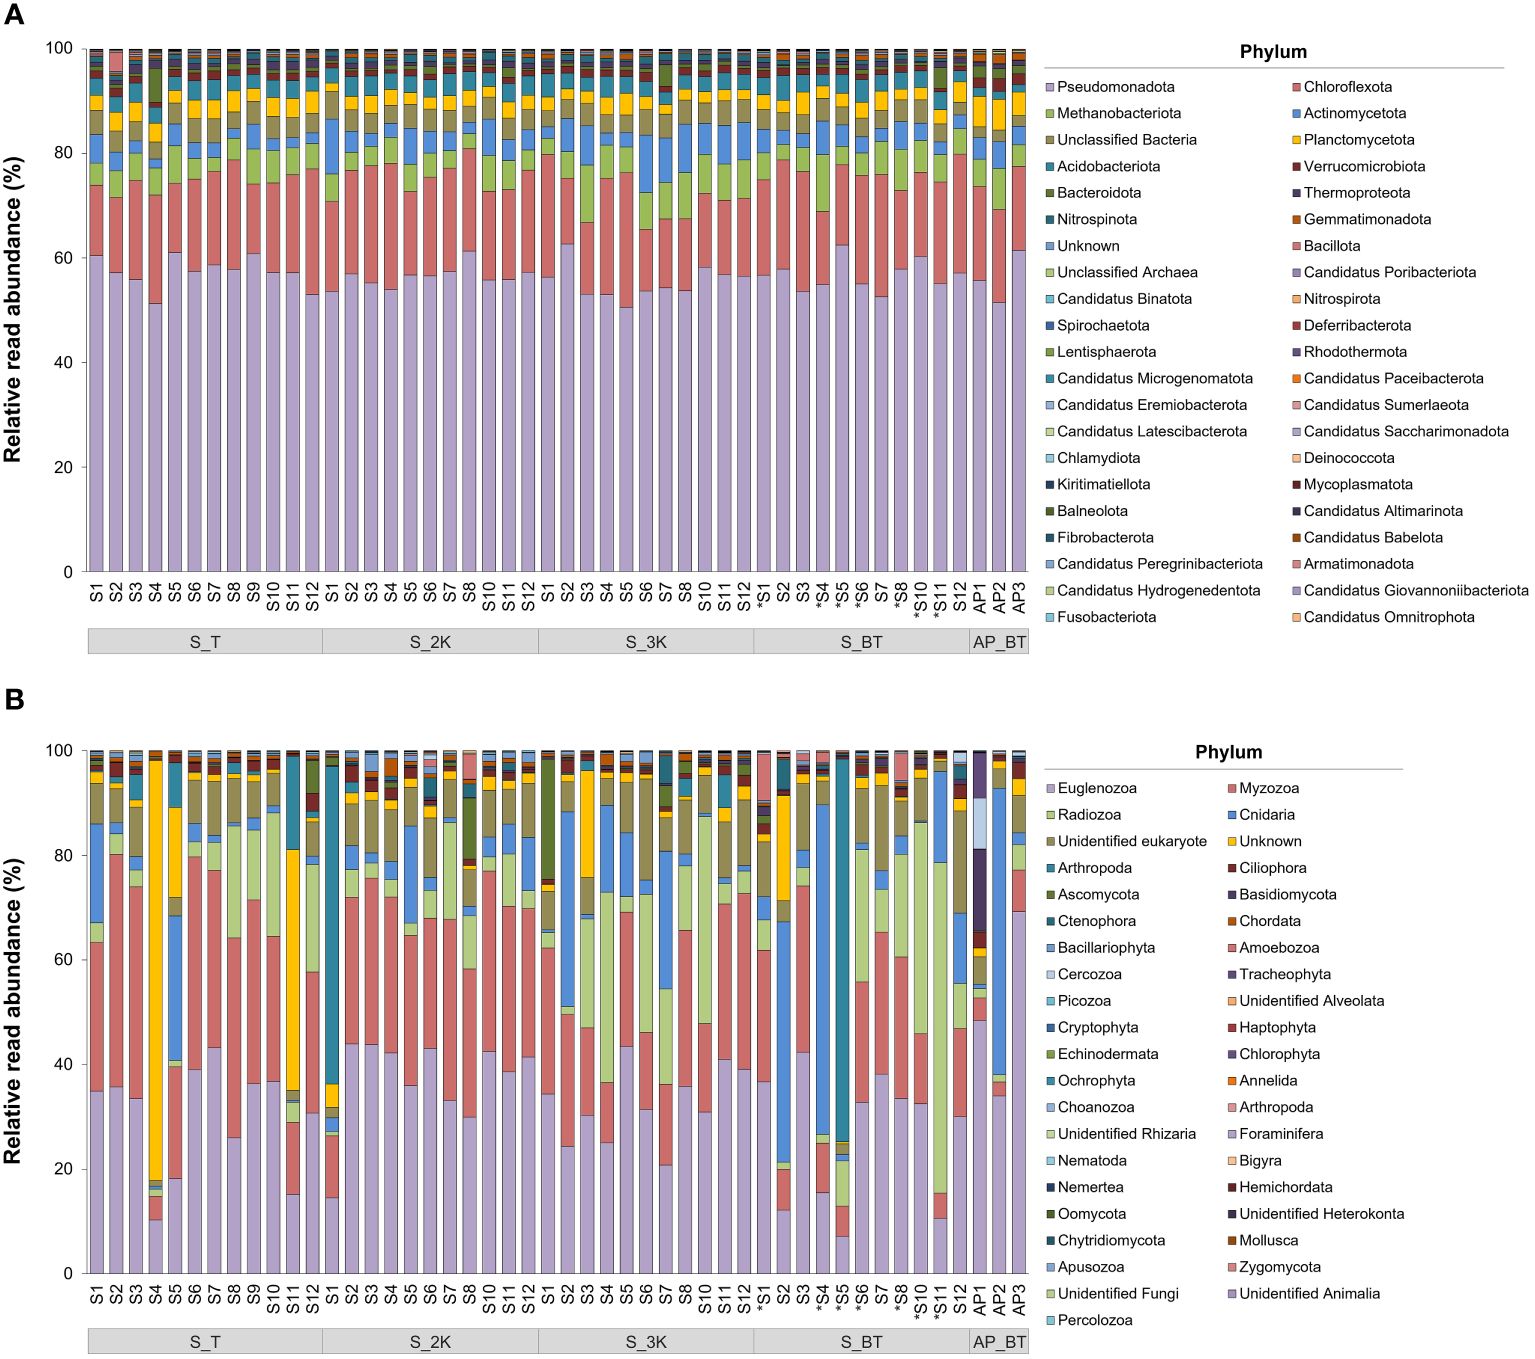
Figure 4 Relative read abundance of prokaryotic (A) and eukaryotic (B) community structures at the phylum level in each sample collection site (S, seamount; AP, abyssal plain; T, summit depth; 2K, 2,000 m; 3K, 3,000 m; BT, bottom depth). An asterisk (*) indicates sites with bottom depths below 3,500 m.
Shared and unique ASVs were examined to compare the prokaryotic community structures between different water depth groups of the seamount and abyssal plain (Figure 5A). Twelve samples were collected from the summit depth group, while each depth group at 2,000 m and 3,000 m and the bottom of the seamount comprised 11 samples. Three samples were collected from the bottom of the abyssal plain. The prokaryotic communities exhibited a substantial number of unique ASVs in each of the five community groups, with the highest count observed at the summit depth of the seamount (1,669), followed by depths of 2,000 m (1,461), the bottom (1,333), 3,000 m (1,227), and the abyssal plain (590). The proportion of these unique ASVs identified in the seamount ranged from 13.53–18.41%, whereas those identified in the abyssal plains accounted for 6.51% of the total number of ASVs. The number of shared ASVs between the two seamount groups was 583, accounting for 6.43%, and all five community groups shared 212 ASVs, accounting for 2.34%. The bottom depth group of the abyssal plain had the highest number of ASVs shared with those of the seamount (211).
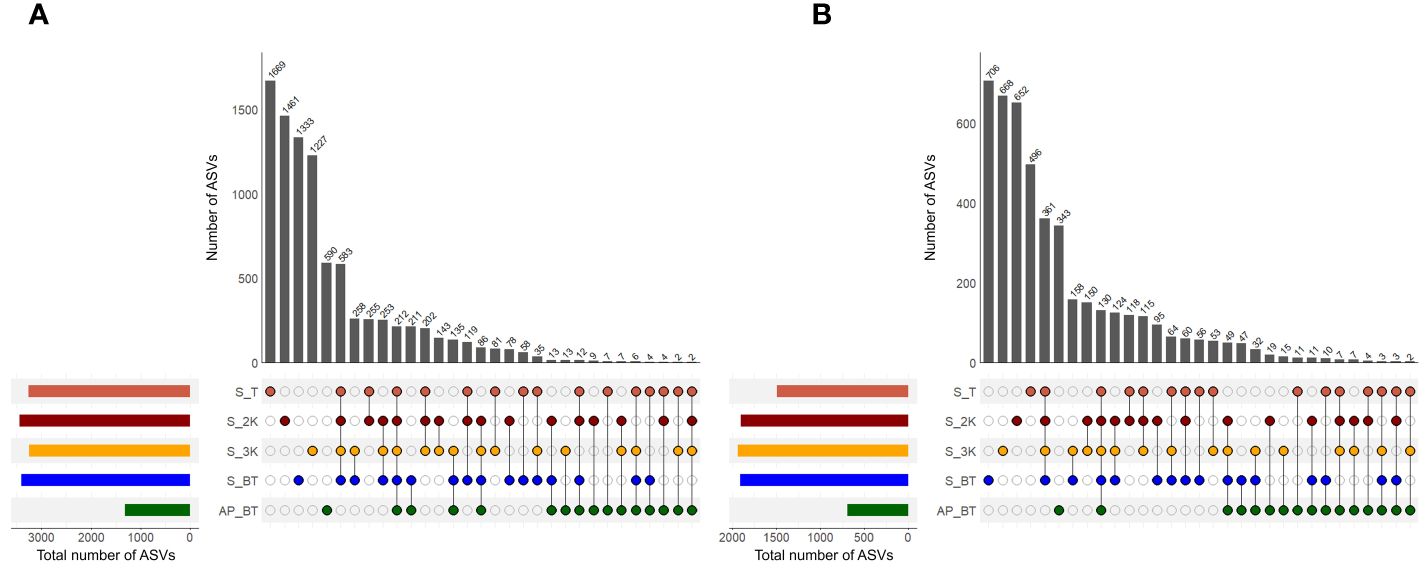
Figure 5 The number of shared and unique amplicon sequence variants (ASVs) in prokaryotic (A) and eukaryotic (B) communities across different water depth groups (S, seamount; AP, abyssal plain; T, summit depth; 2K, 2,000 m; 3K, 3,000 m; BT, bottom depth).
The prokaryotic communities of the 48 samples were compared using nMDS analysis, which clustered into three major groups, designated as group A, group B, and group C, at a 40% similarity cut-off (Figure 6A). These groups were primarily delineated by water depth and habitat type (seamount or abyssal plains). Furthermore, the prokaryotic communities of the seamounts were divided into two groups with 62.14% dissimilarity (ANOSIM, R = 0.799, p = .001) (Figure 6A, Table 2). Specifically, group A comprised all 12 samples from the summit and 11 samples from a depth of 2,000 m, whereas group B comprised seven samples from a depth of 3,000 m and 10 samples from the bottom. As a result of SIMPER analysis, ASV3 belonging to the phylum Methanobacteriota and ASV8 belonging to the phylum Actinomycetota contributed 0.67% and 0.63% to discriminating the prokaryotic community structure between groups A and B (Table 2). The prokaryotic communities at sites S2, S5, S6, and S8 at a depth of 3,000 m, along with site S8 at the bottom, were highly similar to those of group A (Figure 6A). However, all three sites located within the abyssal plain formed a separate cluster, group C, which showed 78.95% and 60.87% dissimilarity in prokaryotic community with groups A (ANOSIM, R = 1.000, p = .001) and B (ANOSIM, R = 0.841, p = .002), respectively (Figure 6A, Table 2). The ASVs predominantly contributing to the dissimilarity between groups A and C were ASV1, belonging to the phylum Pseudomonadota, and ASV7, belonging to the phylum Chloroflexota, with contributions of 0.85% and 0.81%, respectively (Table 2). Additionally, ASV1 and ASV23, belonging to the phylum Pseudomonadota, were identified as primary contributors to the dissimilarity between groups B and C, with contributions of 0.82% and 0.72%, respectively. There was no significant difference in the prokaryotic community structures between the two seamounts, with site S12 from KC-8 and the other 11 sites from KC-2 clustered primarily by water depth rather than by locality.
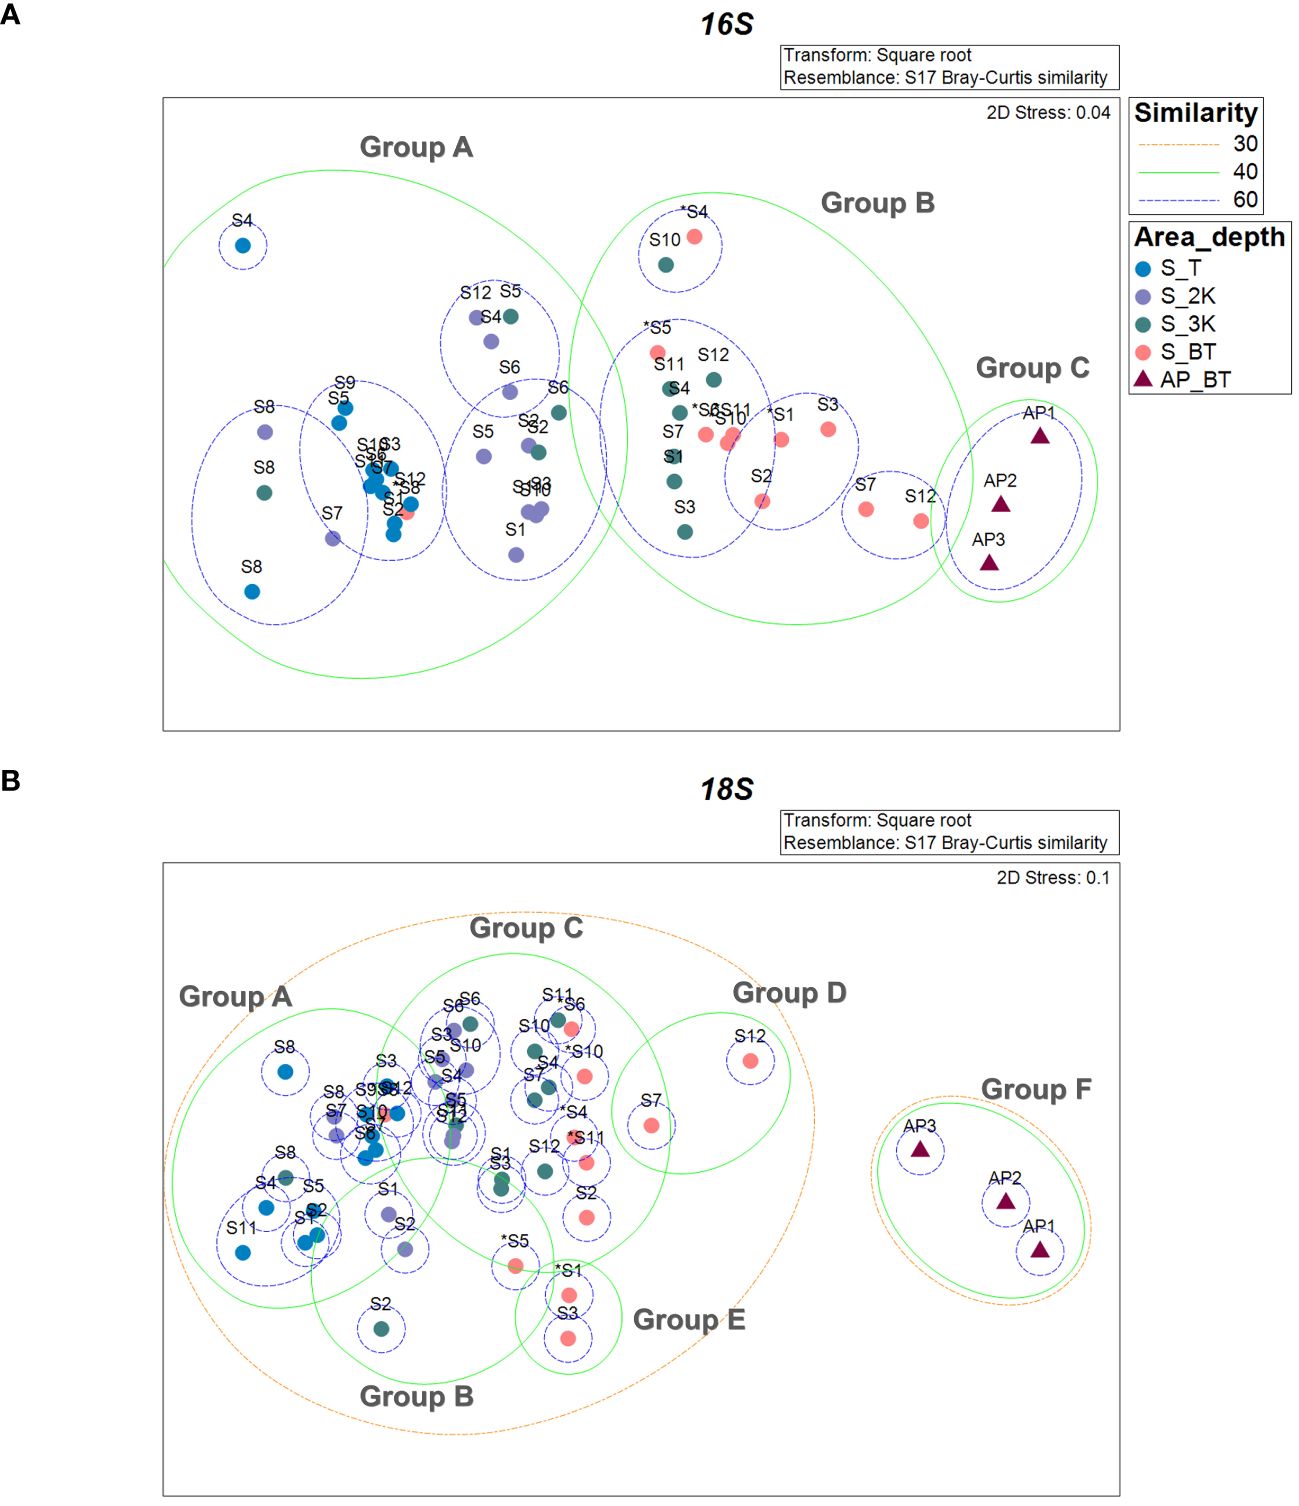
Figure 6 Similarity analysis of prokaryotic (A) and eukaryotic (B) communities between sample collection sites based on the Bray–Curtis similarity (S, seamount; AP, abyssal plain; T, summit depth; 2K, 2,000 m; 3K, 3,000 m; BT, bottom depth). An asterisk (*) indicates sites with bottom depths below 3,500 m.
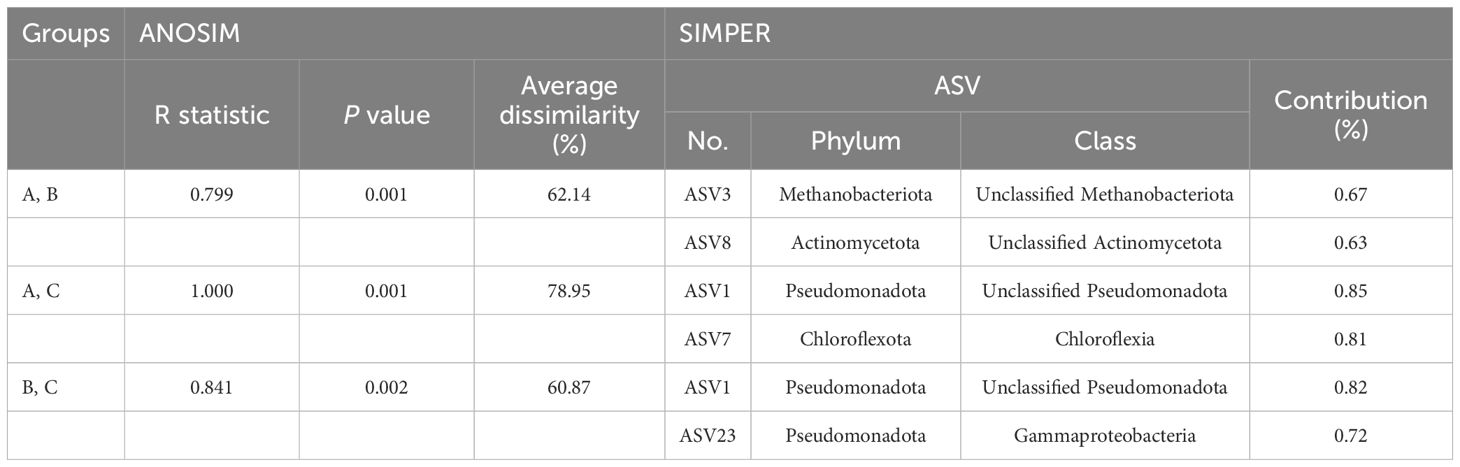
Table 2 Results of the analysis of similarities (ANOSIM) and similarity percentage (SIMPER) analysis based on the Bray–Curtis similarity between prokaryotic community groups within the Magellan seamount the adjacent abyssal plains.
Heatmap analysis showed the most abundant ASVs in the prokaryotic communities of each sample, revealing clear changes according to water depth (Figure 7A). The 48 samples were clustered into two major clades. One clade included samples from depths of 3,000 m, the bottom of the seamount, and those from the abyssal plain, in which mainly 46 ASVs belonging to eight phyla (Pseudomonadota, Chloroflexota, Planctomycetota, Acidobacteriota, Methanobacteriota, Thermoproteota, Actinomycetota, Verrucomicrobiota), six classes (Alphaproteobacteria, Gammaproteobacteria, Chloroflexia, Planctomycetia, Dehalococcoidia, Acidimicrobiia), and unclassified bacteria were identified as the most abundant ASVs compared to other samples. The other clade contained samples from the depths of the summit and 2,000 m below the seamount. 44 ASVs belonging to eight phyla (Pseudomonadota, Chloroflexota, Methanobacteriota, Acidobacteria, Planctomycetota, Actinomycetota, Candidatus Poribacteriota, and Nitrospinota), eight classes (Alphaproteobacteria, Chloroflexia, Deltaproteobacteria, Terriglobia, Gammaproteobacteria, Acidimicrobiia, Vicinamibacteria, Nitrospinia), and unclassified bacteria were most abundant in the relatively shallow depths of the seamount. Sites S2, S5, S6, and S8 at a depth of 3,000 m and site S8 at the bottom of the seamount were also clustered with depth groups of the summit and 2,000 m, which is consistent with the results of the nMDS analysis.
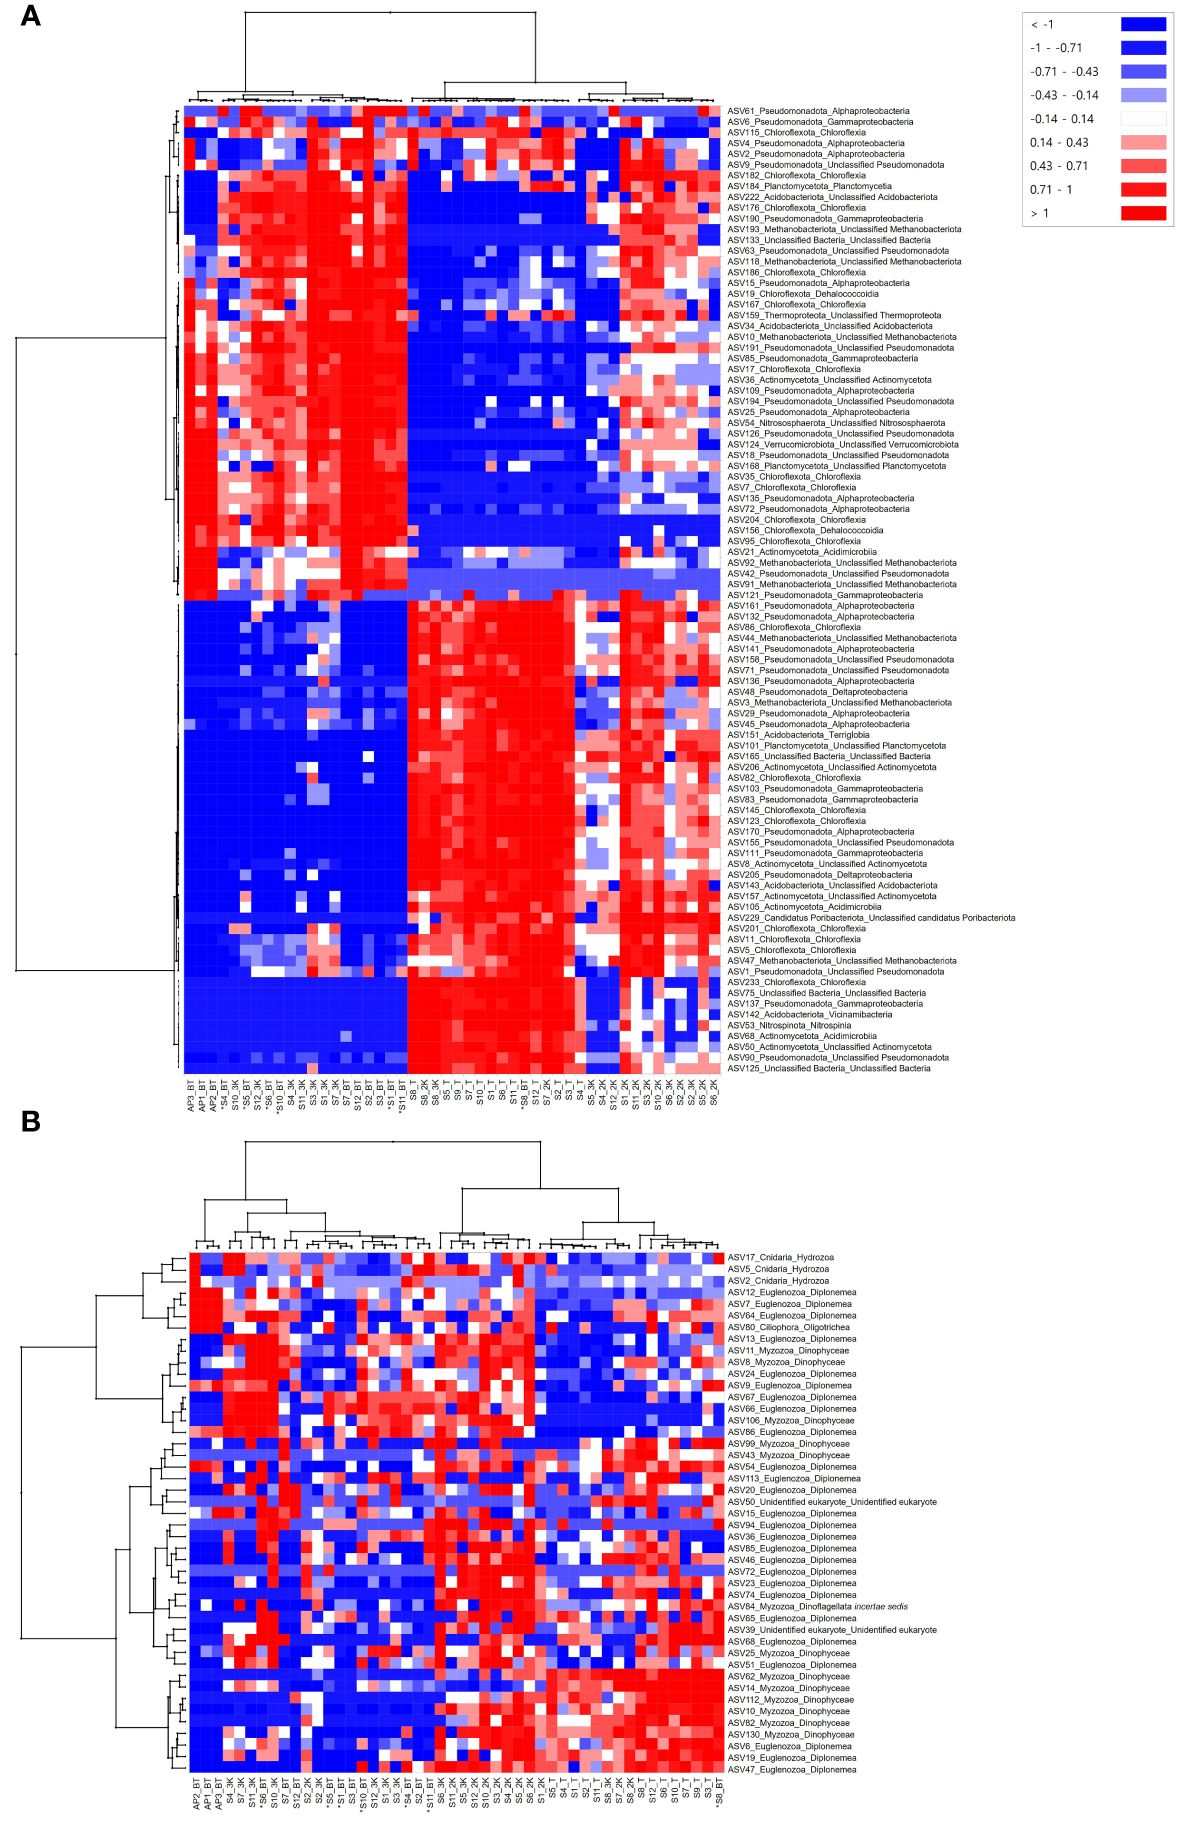
Figure 7 Heatmap analysis of amplicon sequence variants (ASVs) distinguishing prokaryotic (A) and eukaryotic (B) community structures at each sample collection site. An asterisk (*) indicates sites with bottom depths below 3,500 m.
As with the prokaryotic communities, each of the five eukaryotic communities had a substantial number of unique ASVs, with the highest number identified at the bottom depth of the seamount (706), followed by depths of 3,000 m (668), 2,000 m (652), the summit (496) of the seamount, and the abyssal plain (343) (Figure 5B). The number of these unique ASVs in the seamount increased with increasing water depth, accounting to 10.86% to 15.45% of the total number of ASVs. Additionally, the number of shared ASVs within the four depth groups of the seamount and across all five community groups was 361 and 130, respectively, accounting for 7.90% and 2.85% of the total number of ASVs. Most eukaryotic ASVs obtained from the seamount shared their ASVs by depth (from 53 to 361), whereas a minor overlap was observed with ASVs obtained from the abyssal plain (from 2 to 49 and 130), indicating a distinct community structure between the seamount and the adjacent abyssal plain.
The eukaryotic community structures, characterized by ASVs, were compared between samples using nMDS analysis (Figure 6B). At a 40% similarity cutoff, the eukaryotic communities of the 48 samples formed two distinct clusters, one representing the seamount and the other representing the abyssal plain, with 78.80% dissimilarity (ANOSIM, R = 0.978, p = .001). The eukaryotic communities of the seamount were further clustered into five groups (A to E) at a 40% similarity cutoff. Group A included all 12 samples from the summit, two samples from a depth of 2,000 m, and one sample each from depths of 3,000 m and the bottom, which exhibited significant dissimilarities to the other five groups (groups B to F). Among them, the highest dissimilarity was observed in group F (81.06%), comprising three samples from the abyssal plain (ANOSIM, R = 1.000, p = .001), followed by group D (71.93%), comprising two samples from the bottom depth of the seamount (ANOSIM, R = 0.999, p = .007) (Figure 6B, Table 3). A subsequent SIMPER analysis revealed that ASV2, belonging to the phylum Cnidaria, and ASV7, belonging to the phylum Euglenozoa, were primarily responsible for the differences between groups A and F, with contributions of 1.98% and 1.55%, respectively (Table 3). In addition, ASV10 belonging to the phylum Myzozoa and ASV4 (classified as “Unknown”) contributed 0.95% and 0.93% towards discriminating the eukaryotic community structure between group A and D. Group B, consisting of two samples from a depth of 2,000 m and one sample each from depths of 3,000 m and the bottom, showed 61.74% and 80.69% dissimilarities with group C (ANOSIM, R = 0.659, p = .001) and F (ANOSIM, R = 1.000, p = .029) (Figure 6B, Table 3). The key ASV contributing to these dissimilarities was ASV3, belonging to the phylum Arthropoda, with 3.29% and 3.02% contribution, respectively (Table 3). Group C, comprising seven samples from a depth of 2,000 m, nine samples from a depth of 3,000 m, and five samples from the bottom, exhibited significant dissimilarities with groups D, E, and F, with the highest dissimilarity identified in group F (77.75%) (ANOSIM, R = 1.000, p = .003) (Figure 6B, Table 3). ASV2 and ASV7 were primary contributors to these dissimilarities, with contributions of 1.84% and 1.29%, respectively (Table 3). No significant differences were identified in the eukaryotic community structures between the two seamounts.
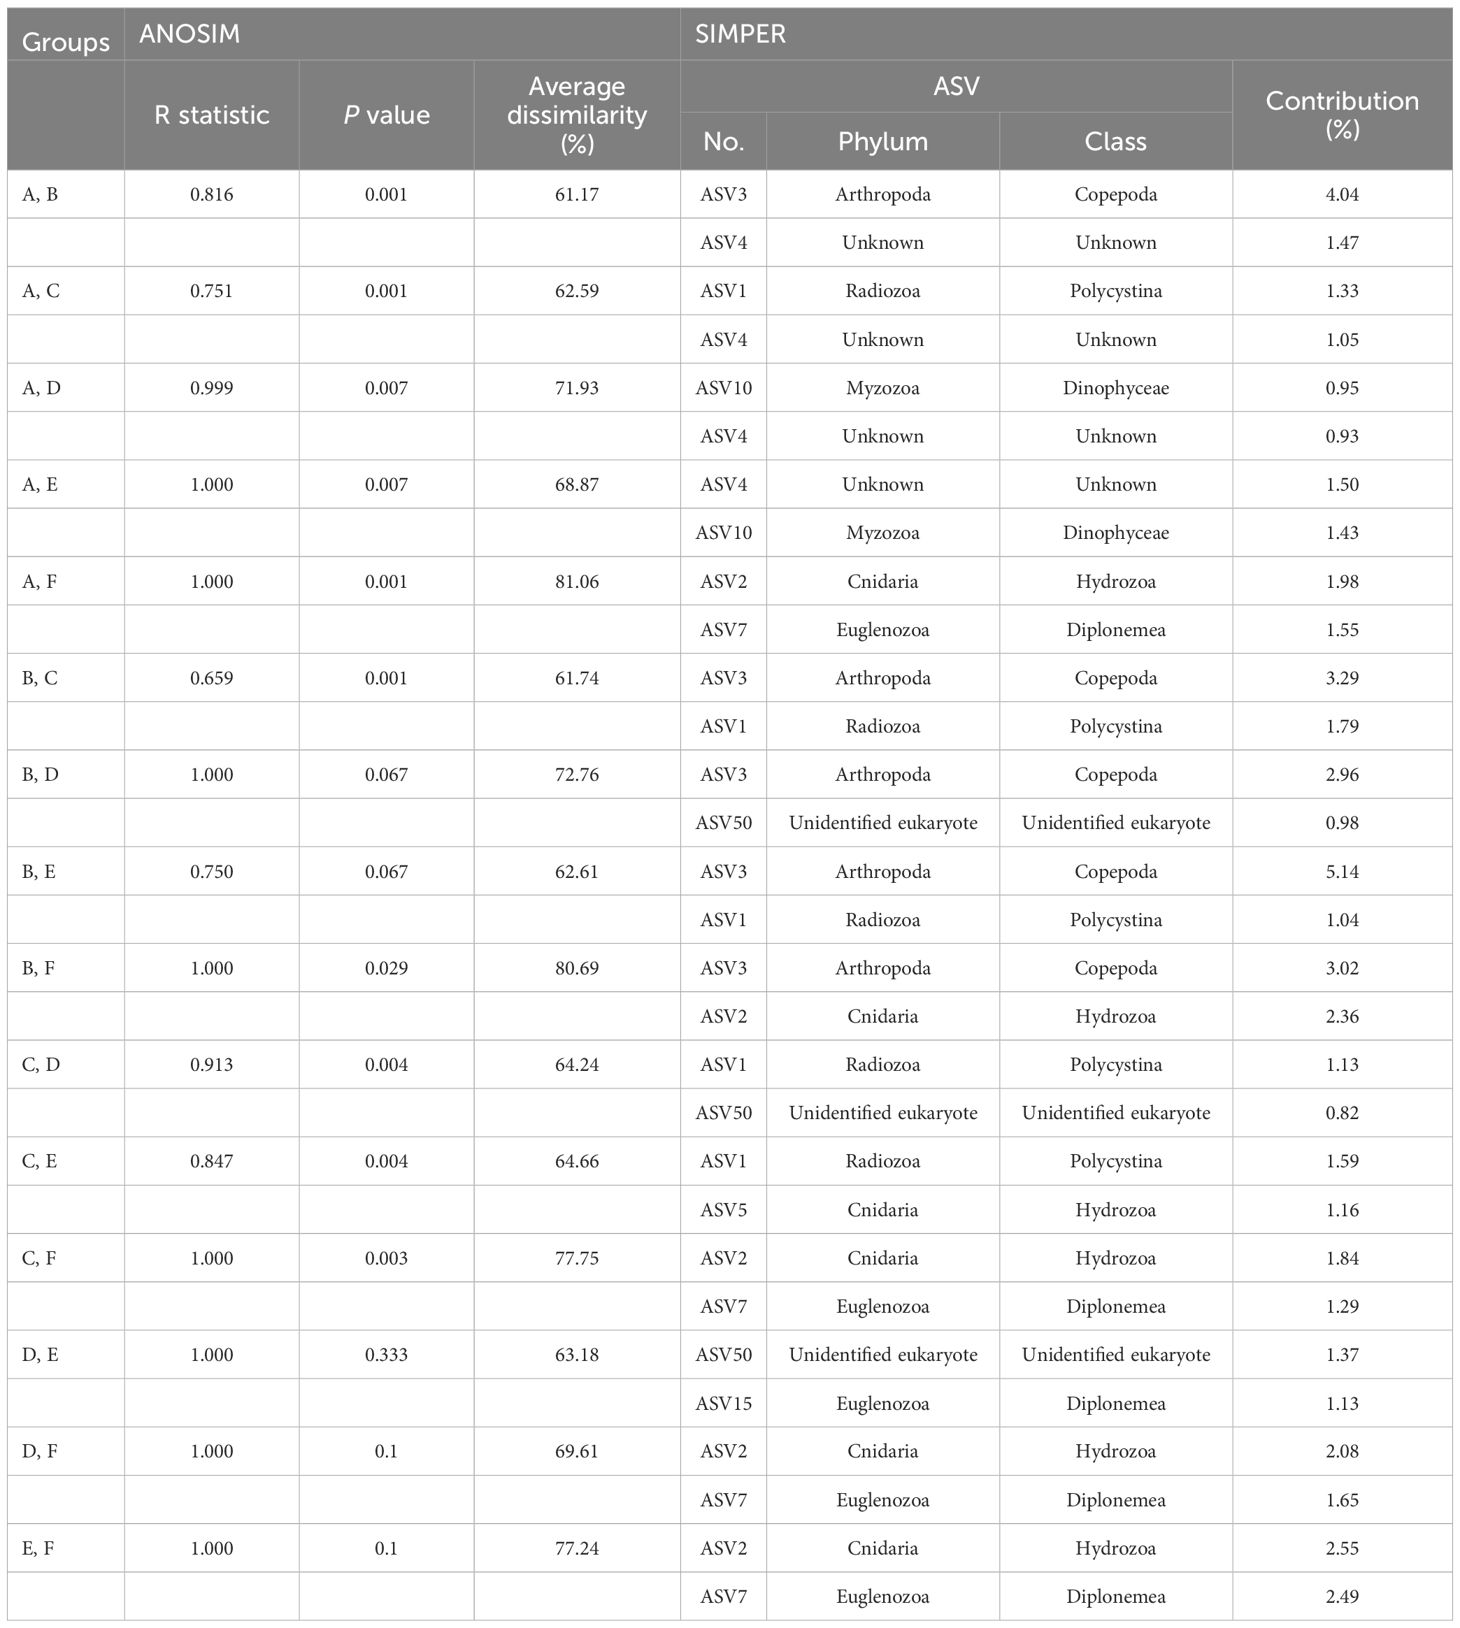
Table 3 Results of the analysis of similarities (ANOSIM) and similarity percentage (SIMPER) analysis based on the Bray–Curtis similarity between eukaryotic community groups within the Magellan seamount the adjacent abyssal plains.
The most abundant ASVs that discriminated the eukaryotic community structure between samples were identified through heatmap analysis and found to predominantly belong to the phyla Euglenozoa and Myzozoa, across all samples (Figure 7B). Among the four major clades, the first contained three samples from the abyssal plain. Seven ASVs belonging to the phyla Euglenozoa and Ciliophora were the most abundant in those from the abyssal plain, and three ASVs belonging to the phylum Cnidaria were the most abundant at site AP2. The remaining three clades comprised samples collected from the seamount. The second clade included 10 samples from the bottom, eight samples from a depth of 3,000 m, and one sample from a depth of 2,000 m. Meanwhile, seven and two samples from depths of 2,000 m and 3,000 m, respectively, clustered into the third clade. The samples from the summit, three from a depth of 2,000 m, one each from a depth of 3,000 m, and the bottom were included in the last clade based on the most abundant ASVs. Notably, the eukaryotic communities of the seamount exhibited gradient changes in community composition according to water depth, unlike the clear turnover observed in prokaryotes (Figure 7).
Seamounts, especially those harboring vulnerable species such as corals, require survey methods that minimize habitat disturbance to preserve these delicate ecosystems (Williams et al., 2010). In this study, a diverse array of prokaryotes (36 phyla and 46 classes) and eukaryotes (34 phyla and 92 classes) within these fragile seamount ecosystems were identified through eDNA metabarcoding from a single survey that included 15 CTD casts, effectively avoiding habitat disturbance (Table 1). Recently, in situ image-based surveys have gained traction for assessing environmental baselines and monitoring anthropogenic impacts in deep-sea environments (Durden et al., 2016). For instance, visual imaging identified benthic megafaunal communities comprising five phyla in 15 and 16 transects of two seamounts within the Magellan Seamount Cluster (Shen et al., 2021; Fan et al., 2022). Similarly, in the Northeast Pacific seamounts, benthic communities consisting of 12 and 11 phyla were observed during 27 and 16 submersible dives, respectively (Lundsten et al., 2009; Du Preez et al., 2016). In comparison with results obtained by visual imaging, eDNA metabarcoding enables the simultaneous detection of a wide range of organisms, including those that are small, cryptic, and present at low densities (Baletaud et al., 2023). This approach provides a useful tool for conducting a more comprehensive assessment of seamount biodiversity than targeted surveys that focus on specific taxa, all while being rapid and noninvasive.
Our results underscore the remarkable sensitivity of eDNA metabarcoding in detecting distinct prokaryotic and eukaryotic community structures, even within close geographical proximity and across different water depths. Despite the distances between sites (S1 to S11) within the KC-2 seamount ranging from 10.72 km to 46.99 km, we observed minimum dissimilarity of 30.09% among prokaryotic communities and 42.72% among eukaryotic communities, within the same depth group. This high sensitivity was further highlighted by a previous study in the western Clarion Clipperton Zone (CCZ), which revealed distinct differences in eukaryotic communities between seamounts and adjacent abyssal plains, even at a minimum distance of 15 km between habitats (Laroche et al., 2020a). Additionally, recent studies have demonstrated the efficacy of eDNA metabarcoding in detecting differences in seamount communities across various water depths (Shi et al., 2020; Laroche et al., 2020b; Baletaud et al., 2023), emphasizing its high resolution in characterizing vertical variations in these ecosystems. This high sensitivity is particularly advantageous in vast and remote marine environments, highlighting its effectiveness in discerning subtle variations in deep-sea communities, even across relatively small spatial scales. Consequently, it facilitates a more reliable assessment and monitoring of anthropogenic activities with an increase in sample size.
However, the primary challenge in utilizing eDNA metabarcoding for deep-sea research is the lack of reference sequence databases, which limits its ability to accurately assign taxonomy and assess deep-sea biodiversity (Glover et al., 2015; Sinniger et al., 2016). In our study, 8.80% and 25.76% of the total number of prokaryotic and eukaryotic ASVs remained classified as “Unknown”, indicating sequence identities below 90% to the currently deposited 16S and 18S databases, respectively. However, a promising aspect of metabarcoding is its potential for taxonomic refinement as databases expand (Porter and Hajibabaei, 2018; Atienza et al., 2020). Specifically, supplementing the reference database for the mitochondrial COI gene, which has high sequence variation rates, could enhance the characterization of seamount communities at lower taxonomic levels (Günther et al., 2018), enabling better management and monitoring of species vulnerable to the impacts of anthropogenic activities.
Although several studies have contradicted the notion that seamounts are biodiversity hotspots (Hall-Spencer et al., 2007; O’Hara, 2007; Howell et al., 2010), our research revealed higher mean values of ASV richness and diversity indices in the Magellan seamounts than in the adjacent abyssal plains for both prokaryotic and eukaryotic communities (Figure 3). These findings offer insights into the potential role of seamounts as biodiversity hotspots by comprehensively examining seamount communities across a broad depth range, from the summit to the bottom, using metabarcoding techniques that enhance taxonomic coverage. Several factors may contribute to the heightened richness of seamounts, including habitat heterogeneity and heightened beta diversity resulting from faunal turnover across varying depths, increased biomass due to elevated organic input, and increased speciation due to geographical isolation (Samadi et al., 2006; McClain, 2007). Although direct comparisons of the topography or substrate type influencing habitat heterogeneity at each study site of the Magellan seamounts were not made, we identified distinct community structures between the two habitats for both prokaryotes and eukaryotes, along with a considerable number of unique ASVs at each depth of the seamount (Figures 5, 6). These results are consistent with those of previous studies reporting higher biodiversity on seamounts than on abyssal plains, showing strong zonation patterns across varying depths (Zeppilli et al., 2013; Shi et al., 2020). Further explicit and quantitative studies comparing the diversity of seamounts and adjacent non-seamount areas are required to confirm and provide additional support for the hypothesis that seamounts are biodiversity hotspots. In addition, McClain et al. (2010) investigated bathymetric faunal patterns in the Northeast Pacific seamounts, revealing a unimodal pattern of diversity with a peak at approximately 2,000 m, significant community changes with depth, and a decline in density and biomass with increasing depth. Our findings, including the observed unimodal patterns in alpha diversity with the highest values at 2,000 m and a decreasing trend with increasing depth, particularly in eukaryotic communities (Figure 3), as well as a substantial number of unique ASVs at each depth for both prokaryotic and eukaryotic communities (Figure 5), align with these previous observations. These bathymetric patterns likely reflect multiple linked processes related to habitat heterogeneity, ecosystem engineering, and bottom-up dynamics (McClain and Barry, 2010). Therefore, the development of appropriate and effective conservation strategies that consider various depth ranges is recommended.
Furthermore, we observed that the prokaryotic and eukaryotic communities exhibited high connectivity between the two seamounts, suggesting their strong dispersal ability in the western Pacific Ocean. Specifically, we found that 2,231 and 1,145 ASVs detected at site S12, located on the KC-8 seamount, shared 73.73% (74.21% at the summit depth, 77.34% at 2,000 m, 75.83% at 3,000 m, and 76.05% at the bottom depth) and 76.24% (75.65% at the summit depth, 82.94% at 2,000 m, 79.22% at 3,000 m, and 58.56% at the bottom depth) of their prokaryotic and eukaryotic ASVs, respectively, with those identified at the KC-2 seamount (S1 to S11), despite being approximately 362 km apart (Supplementary Tables 3, 4). However, the majority of the prokaryotic and eukaryotic ASVs identified in the seamounts (91.47% and 91.72%, respectively) were not observed in adjacent abyssal plains (Figure 5). These results support the notion that seamounts serve as both stepping stones for the dispersal of more widespread taxa and as isolated biogeographical islands for certain taxa with limited dispersal abilities (Miller and Gunasekera, 2017). To gain a more comprehensive understanding of these roles for effective conservation and management of seamount ecosystems, additional studies with sufficient sample sizes in both seamounts and adjacent areas are warranted.
Understanding the microbial communities in deep-sea environments is crucial for elucidating ecosystem dynamics and biogeochemical processes. In prokaryotic communities, the phylum Pseudomonadota (56.63%) was the most dominant in seawater samples collected from this study region (Figure 4A), consistent with findings from previous microbial diversity studies (Nitahara et al., 2017). Several studies on microbial diversity in crusts and sediments from the western and central Pacific have shown that the phyla Pseudomonadota and Thermoproteota (Candidatus Thaumarchaeota) dominate bacterial and archaeal communities, which may be involved in nitrogen, sulfur, and metal cycling in cobalt-rich ferromanganese crusts (Liao et al., 2011; Huo et al., 2015; Nitahara et al., 2017; Kato et al., 2019). However, Nitahara et al. (2011) reported that members related to the ammonia oxidizers of Thaumarchaeota identified in seawater differed phylogenetically from those identified in crusts, suggesting potential adaptations to different lifestyles, such as surface-attached or free-living. Although the phylum Thermoproteota (Candidatus Thaumarchaeota) was not relatively dominant in the prokaryotic communities in seawater samples (Figure 4A), it was predominantly abundant at deeper water depths, as indicated by heatmap analysis (Figure 7A). Conversely, the phylum Nitrospinota, associated with nitrite-oxidizing metabolism, was primarily abundant at shallower water depths (Figure 7A). A previous study on the reconstruction of metabolic pathways revealed that the nitrogen cycle is an important biogeochemical process in sediments from regions where cobalt-rich ferromanganese crusts are deposited (Huo et al., 2015). We found that archaea and bacteria that contribute to the nitrogen cycle in crust-deposited seamounts were also present in seawater as primary producers. Additionally, the phylum Methanobacteriota, which typically occurs alongside sulfate-reducing bacteria, was the most dominant archaeal group in seawater samples (Figure 4A), likely linked to specific biogeochemical processes, such as methanogenesis, which influences the cycling of carbon and other elements within deep-sea ecosystems (Knittel and Boetius, 2009; Gusmão et al., 2023). Further microbial diversity studies with metagenomic analyses of the Magellan seamounts are crucial for gaining deeper insights into the metabolic processes and genome dynamics of microbial communities in response to anthropogenic activities.
In addition to prokaryotic communities, eukaryotic communities were also examined and compared in this study. The phylum Euglenozoa, a group of heterotrophic flagellates widely distributed throughout the deep-sea, was identified as the most dominant, comprising 30.56% of the total of seawater samples (Figure 4B) (Lara et al., 2009; Kostygov et al., 2021). Among 267 ASVs identified within the phylum Euglenozoa, 230 belonged to the class Diplonemea (Supplementary Table 4). In the CCZ, Diplonemea was found to be scarce in the euphotic zone but became more abundant at depths ranging from 1,000–4,000 m, which was also reflected in our results (Shulse et al., 2017). Meanwhile, 19.94% of the total number of ASVs remained as morphologically undescribed “Unidentified eukaryote”, dominating fifth in relative read abundance at the phylum level (Supplementary Table 4, Figure 4B). It is estimated that the deep sea contains up to 10 million species (Scheffers et al., 2012), yet only approximately 243,000 have been described (Costello and Chaudhary, 2017), leaving a significant number of species awaiting discovery. Accurate taxonomic classification and morphological characterization of these “Unidentified eukaryotes” are essential for understanding their ecological roles and significance, highlighting the crucial role of morphological taxonomy alongside molecular techniques in fully uncovering the diversity of deep-sea ecosystems. We were unable to detect ASVs belonging to the phylum Porifera, commonly known as sponges, which are vulnerable to the impacts of anthropogenic activities in seawater samples collected from the western Pacific Ocean. Previous studies have also reported limited occurrences of Porifera in a small proportion of nodules and sediments (Kitahashi et al., 2020; Laroche et al., 2020a; Lejzerowicz et al., 2021; Mo et al., 2024), but they were noticeably absent in metazoan communities in seawater samples, even when using both 18S and COI markers (Laroche et al., 2020a). This discrepancy may be associated with various characteristics of eDNA released into seawater by different species such as shedding rate, particle size, and stability in the environment, all of which can influence degradation rates (Kwong et al., 2021; Zhao et al., 2021; Hinz et al., 2022). Additional studies that encompass various habitat samples, such as sediments and crusts, and employ quantitative analysis of eDNA from Porifera in the Magellan seamounts with efficient DNA extraction methods may help to further elucidate and redeem the results obtained in this study. Heatmap analysis revealed notable variations in the abundance of ASVs within eukaryotic communities by habitat type and water depth (Figure 7B). Specifically, ASVs belonging to the phyla Euglenozoa, Myzozoa, and “Unidentified eukaryotes” were predominantly abundant in seamounts, whereas ASVs associated with the phyla Ciliophora and Cnidaria were mostly abundant in the abyssal plains. This pattern is consistent with a previous study in the CCZ, which reported a significantly higher percentage of non-metazoan ASVs, including Myzozoa and Radiozoa, in seamounts compared to the abyssal plains (Laroche et al., 2020b). Although ciliates have been relatively well studied, their ecological and biogeochemical roles in the deep sea remain unknown (Pierce and Turner, 1992; Shulse et al., 2017). Abyssal ecosystems are strongly influenced by the influx of detrital organic materials originating from the ocean surface owing to limited food availability on the abyssal seafloor (Smith et al., 2008). Mo et al. (2024) demonstrated a positive correlation between total organic carbon (TOC) levels and Cnidaria abundance, which supports previous studies indicating taxa-specific effects of TOC on megafaunal diversity (Levin and Gage, 1998; Cunha et al., 2011; Nishijima et al., 2015). However, in our study area, we observed no statistically significant differences in the TOC levels between the seamounts and the adjacent abyssal plains, with relatively low TOC levels detected in the abyssal plains (unpublished data). These results were obtained from a single survey, and highlight the need for further long-term biodiversity studies in the Magellan seamounts, including investigations into seafloor habitat types and environmental factors influencing the distribution and abundance of benthic organisms. Such efforts are essential to comprehensively understand, assess, and monitor seamount communities in the face of anthropogenic activities.
The present study represents the first comprehensive assessment of biodiversity within the Magellan Seamount Cluster in the western Pacific Ocean, encompassing both microorganisms and macroorganisms, through eDNA metabarcoding analysis. By employing this innovative approach, we identified distinct prokaryotic and eukaryotic community structures between habitats (seamounts and adjacent abyssal plains) as well as different water depths within the seamount. Our findings contribute to a better understanding of the Magellan seamount ecosystems, providing crucial data for the development of effective conservation strategies and sustainable management practices. These measures are critical for protecting vulnerable marine habitats from human activities, especially deep-sea mining activities in the area. The eDNA metabarcoding analysis employed in this study proved to be a powerful survey and monitoring tool for evaluating deep-sea community structures and exhibited efficacy and high sensitivity. With the supplementation of a reference sequence database, further long-term studies utilizing the eDNA metabarcoding approach can provide a more comprehensive understanding of seamount ecosystems and their responses to anthropogenic activities.
The datasets presented in this study can be found in online repositories. The names of the repository/repositories and accession number(s) can be found here: https://www.ncbi.nlm.nih.gov/, accession number: PRJNA1091854.
E-BK: Conceptualization, Data curation, Formal analysis, Investigation, Methodology, Writing – original draft, Writing – review & editing. S-JJ: Conceptualization, Methodology, Supervision, Writing – review & editing. YS: Methodology, Validation, Conceptualization, Supervision, Writing – review & editing.
The author(s) declare financial support was received for the research, authorship, and/or publication of this article. This research was a part of the project titled ‘Selection of prospective mining area for Co-rich ferromanganese crust in western Pacific seamounts: 3-D resource estimation and environmental impact evaluation’, funded by the Korean Ministry of Oceans and Fisheries, Korea (No. 20220509, RS-2022-KS221644).
The authors declare that the research was conducted in the absence of any commercial or financial relationships that could be construed as a potential conflict of interest.
All claims expressed in this article are solely those of the authors and do not necessarily represent those of their affiliated organizations, or those of the publisher, the editors and the reviewers. Any product that may be evaluated in this article, or claim that may be made by its manufacturer, is not guaranteed or endorsed by the publisher.
The Supplementary Material for this article can be found online at: https://www.frontiersin.org/articles/10.3389/fmars.2024.1412678/full#supplementary-material
Supplementary Figure 1 | Rarefaction and extrapolation curves with 95% confidence intervals for prokaryotic reads at different water depths across sample collection sites (T, summit depth; 2K, 2,000 m; 3K, 3,000 m; BT, bottom depth).
Supplementary Figure 2 | Rarefaction and extrapolation curves with 95% confidence intervals for eukaryotic reads at different water depths across sample collection sites (T, summit depth; 2K, 2,000 m; 3K, 3,000 m; BT, bottom depth).
Atienza S., Guardiola M., Præbel K., Antich A., Turon X., Wangensteen O. S. (2020). DNA metabarcoding of deep-sea sediment communities using COI: community assessment, spatio-temporal patterns and comparison with 18S rDNA. Diversity 12, 123. doi: 10.3390/d12040123
Baletaud F., Lecellier G., Gilbert A., Mathon L., Côme J.-M., Dejean T., et al. (2023). Comparing seamounts and coral reefs with eDNA and BRUVS reveals oases and refuges on shallow seamounts. Biology 12, 1446. doi: 10.3390/biology12111446
Beng K. C., Corlett R. T. (2020). Applications of environmental DNA (eDNA) in ecology and conservation: opportunities, challenges and prospects. Biodivers. Conserv. 29, 2089–2121. doi: 10.1007/s10531-020-01980-0
Bergo N. M., Torres-Ballesteros A., Signori C. N., Benites M., Jovane L., Murton B. J., et al. (2022). Spatial patterns of microbial diversity in Fe-Mn deposits and associated sediments in the Atlantic and Pacific oceans. Sci. Total Environ. 837, 155792. doi: 10.1016/j.scitotenv.2022.155792
Brandt M. I., Trouche B., Henry N., Liautard-Haag C., Maignien L., De Vargas C., et al. (2020). An assessment of environmental metabarcoding protocols aiming at favoring contemporary biodiversity in inventories of deep-sea communities. Front. Mar. Sci. 7, 234. doi: 10.3389/fmars.2020.00234
Callahan B. J., Mcmurdie P. J., Rosen M. J., Han A. W., Johnson A. J. A., Holmes S. P. (2016). DADA2: High-resolution sample inference from Illumina amplicon data. Nat. Methods 13, 581–583. doi: 10.1038/nmeth.3869
Clark M. R. (2009). Deep-sea seamount fisheries: a review of global status and future prospects. Latin Am. J. Aquat. Res. 37, 501–512. doi: 10.3856/vol37-issue3-fulltext-17
Clark M. R., Rowden A. A., Schlacher T., Williams A., Consalvey M., Stocks K. I., et al. (2010). The ecology of seamounts: structure, function, and human impacts. Annu. Rev. Mar. Sci. 2, 253–278. doi: 10.1146/annurev-marine-120308-081109
Costello M. J., Chaudhary C. (2017). Marine biodiversity, biogeography, deep-sea gradients, and conservation. Curr. Biol. 27, R511–R527. doi: 10.1016/j.cub.2017.06.015
Cowart D. A., Matabos M., Brandt M. I., Marticorena J., Sarrazin J. (2020). Exploring environmental dna (edna) to assess biodiversity of hard substratum faunal communities on the lucky strike vent field (mid-atlantic ridge) and investigate recolonization dynamics after an induced disturbance. Front. Mar. Sci. 6, 783. doi: 10.3389/fmars.2019.00783
Cunha M. R., Paterson G. L., Amaro T., Blackbird S., De Stigter H. C., Ferreira C., et al. (2011). Biodiversity of macrofaunal assemblages from three Portuguese submarine canyons (NE Atlantic). Deep Sea Res. Part II: Topical Stud. Oceanogr. 58, 2433–2447. doi: 10.1016/j.dsr2.2011.04.007
Danovaro R., Snelgrove P. V., Tyler P. (2014). Challenging the paradigms of deep-sea ecology. Trends Ecol. Evol. 29, 465–475. doi: 10.1016/j.tree.2014.06.002
Delavenne J., Keszler L., Castelin M., Lozouet P., Maestrati P., Samadi S. (2019). Deep-sea benthic communities in the largest oceanic desert are structured by the presence of polymetallic crust. Sci. Rep. 9, 6977. doi: 10.1038/s41598-019-43325-0
Diao C., Wang M., Zhong Z., Li Y., Xian W., Zhang H. (2023). Biodiversity exploration of Formosa Ridge cold seep in the South China Sea using an eDNA metabarcoding approach. Mar. Environ. Res. 190, 106109. doi: 10.1016/j.marenvres.2023.106109
Du Preez C., Curtis J. M., Clarke M. E. (2016). The structure and distribution of benthic communities on a shallow seamount (Cobb Seamount, Northeast Pacific Ocean). PloS One 11, e0165513. doi: 10.1371/journal.pone.0165513
Durden J. M., Schoening T., Althaus F., Friedman A., Garcia R., Glover A. G., et al. (2016). Perspectives in visual imaging for marine biology and ecology: from acquisition to understanding. Oceanogr. Mar. Biol. Ann. Rev. 54, 1–72. doi: 10.1201/9781315368597-2
Fan M., Shi S., Ma Y., Wang H., Zhai J., Zhang X., et al. (2022). High resolution geomorphological classification of benthic structure on the Western Pacific Seamount. Front. Mar. Sci. 9, 1007032. doi: 10.3389/fmars.2022.1007032
Ferreira J. C. N., Bergo N. M., Tura P. M., Chuqui M. G., Brandini F. P., Jovane L., et al. (2022). Abundance and microbial diversity from surface to deep water layers over the Rio Grande Rise, South Atlantic. Prog. Oceanogr. 201, 102736. doi: 10.1016/j.pocean.2021.102736
Frøslev T. G., Kjøller R., Bruun H. H., Ejrnæs R., Brunbjerg A. K., Pietroni C., et al. (2017). Algorithm for post-clustering curation of DNA amplicon data yields reliable biodiversity estimates. Nat. Commun. 8, 1188. doi: 10.1038/s41467-017-01312-x
Glover A. G., Dahlgren T. G., Wiklund H., Mohrbeck I., Smith C. R. (2015). An end-to-end DNA taxonomy methodology for benthic biodiversity survey in the Clarion-Clipperton Zone, central Pacific abyss. J. Mar. Sci. Eng. 4, 2. doi: 10.3390/jmse4010002
Günther B., Knebelsberger T., Neumann H., Laakmann S., Martínez Arbizu P. (2018). Metabarcoding of marine environmental DNA based on mitochondrial and nuclear genes. Sci. Rep. 8, 14822. doi: 10.1038/s41598-018-32917-x
Gusmão A. C. B., Peres F. V., Paula F. S., Pellizari V. H., Kolm H. E., Signori C. N. (2023). Microbial communities in the deep-sea sediments of the South São Paulo Plateau, Southwestern Atlantic Ocean. Int. Microbiol. 26, 1041–1051. doi: 10.1007/s10123-023-00358-w
Hall-Spencer J., Rogers A., Davies J., Foggo A. (2007). Deep-sea coral distribution on seamounts, oceanic islands, and continental slopes in the Northeast Atlantic. Bull. Mar. Sci. 81, 135–146.
Hein J. R., Conrad T. A., Staudigel H. (2010). Seamount mineral deposits: a source of rare metals for high-technology industries. Oceanography 23, 184–189. doi: 10.5670/oceanog
Hein J. R., Koschinsk A., Bau M., Manheim F. T., Kang J.-K., Roberts L. (2017). “Cobalt-rich ferromanganese crusts in the Pacific,” in Handbook of marine mineral deposits (London: Routledge), 239–279.
Herlemann D. P., Labrenz M., Jürgens K., Bertilsson S., Waniek J. J., Andersson A. F. (2011). Transitions in bacterial communities along the 2000 km salinity gradient of the Baltic Sea. ISME J. 5, 1571–1579. doi: 10.1038/ismej.2011.41
Hinz S., Coston-Guarini J., Marnane M., Guarini J.-M. (2022). Evaluating eDNA for use within marine environmental impact assessments. J. Mar. Sci. Eng. 10, 375. doi: 10.3390/jmse10030375
Howell K. L., Mowles S. L., Foggo A. (2010). Mounting evidence: near-slope seamounts are faunally indistinct from an adjacent bank. Mar. Ecol. 31, 52–62. doi: 10.1111/j.1439-0485.2010.00368.x
Huo Y., Cheng H., Post A. F., Wang C., Jiang X., Pan J., et al. (2015). Ecological functions of uncultured microorganisms in the cobalt-rich ferromanganese crust of a seamount in the central Pacific are elucidated by fosmid sequencing. Acta Oceanol. Sin. 34, 92–113. doi: 10.1007/s13131-015-0650-7
Kang H.-E., Yoon T.-H., Yoon S., Kim H. J., Park H., Kang C.-K., et al. (2018). Genomic analysis of red-tide water bloomed with Heterosigma akashiwo in Geoje. PeerJ 6, e4854. doi: 10.7717/peerj.4854
Kato S., Hirai M., Ohkuma M., Suzuki K. (2019). Microbial metabolisms in an abyssal ferromanganese crust from the Takuyo-Daigo Seamount as revealed by metagenomics. PloS One 14, e0224888. doi: 10.1371/journal.pone.0224888
Kitahashi T., Sugime S., Inomata K., Nishijima M., Kato S., Yamamoto H. (2020). Meiofaunal diversity at a seamount in the pacific ocean: A comprehensive study using environmental DNA and RNA. Deep Sea Res. Part I: Oceanogr. Res. Pap. 160, 103253. doi: 10.1016/j.dsr.2020.103253
Klunder L., De Stigter H., Lavaleye M. S., Van Bleijswijk J. D., van der Veer H. W., Reichart G.-J., et al. (2020). A molecular approach to explore the background benthic fauna around a hydrothermal vent and their larvae: implications for future mining of deep-sea SMS deposits. Front. Mar. Sci. 7, 134. doi: 10.3389/fmars.2020.00134
Knittel K., Boetius A. (2009). Anaerobic oxidation of methane: progress with an unknown process. Annu. Rev. Microbiol. 63, 311–334. doi: 10.1146/annurev.micro.61.080706.093130
Kostygov A. Y., Karnkowska A., Votýpka J., Tashyreva D., Maciszewski K., Yurchenko V., et al. (2021). Euglenozoa: taxonomy, diversity and ecology, symbioses and viruses. Open Biol. 11, 200407. doi: 10.1098/rsob.200407
Kwong S. L., Villacorta-Rath C., Doyle J., Uthicke S. (2021). Quantifying shedding and degradation rates of environmental DNA (eDNA) from Pacific crown-of-thorns seastar (Acanthaster cf. solaris). Mar. Biol. 168, 85. doi: 10.1007/s00227-021-03896-x
Lara E., Moreira D., Vereshchaka A., López-García P. (2009). Pan-oceanic distribution of new highly diverse clades of deep-sea diplonemids. Environ. Microbiol. 11, 47–55. doi: 10.1111/j.1462-2920.2008.01737.x
Laroche O., Kersten O., Smith C. R., Goetze E. (2020a). Environmental DNA surveys detect distinct metazoan communities across abyssal plains and seamounts in the western Clarion Clipperton Zone. Mol. Ecol. 29, 4588–4604. doi: 10.1111/mec.15484
Laroche O., Kersten O., Smith C. R., Goetze E. (2020b). From sea surface to seafloor: A benthic allochthonous eDNA survey for the abyssal ocean. Front. Mar. Sci. 7, 682. doi: 10.3389/fmars.2020.00682
Le J. T., Levin L. A., Lejzerowicz F., Cordier T., Gooday A. J., Pawlowski J. (2022). Scientific and budgetary trade-offs between morphological and molecular methods for deep-sea biodiversity assessment. Integr. Environ. Assess. Manage. 18, 655–663. doi: 10.1002/ieam.4466
Lejzerowicz F., Gooday A. J., Barrenechea Angeles I., Cordier T., Morard R., Apothéloz-Perret-Gentil L., et al. (2021). Eukaryotic biodiversity and spatial patterns in the Clarion-Clipperton Zone and other abyssal regions: Insights from sediment DNA and RNA metabarcoding. Front. Mar. Sci. 8, 671033. doi: 10.3389/fmars.2021.671033
Levin L. A., Gage J. D. (1998). Relationships between oxygen, organic matter and the diversity of bathyal macrofauna. Deep Sea Res. Part II: Topical Stud. Oceanogr. 45, 129–163. doi: 10.1016/S0967-0645(97)00085-4
Levin L. A., Mengerink K., Gjerde K. M., Rowden A. A., Van Dover C. L., Clark M. R., et al. (2016). Defining “serious harm” to the marine environment in the context of deep-seabed mining. Mar. Policy 74, 245–259. doi: 10.1016/j.marpol.2016.09.032
Liao L., Xu X.-W., Jiang X.-W., Wang C.-S., Zhang D.-S., Ni J.-Y., et al. (2011). Microbial diversity in deep-sea sediment from the cobalt-rich crust deposit region in the Pacific Ocean. FEMS Microbiol. Ecol. 78, 565–585. doi: 10.1111/fem.2011.78.issue-3
Lundsten L., Barry J. P., Cailliet G. M., Clague D. A., Devogelaere A. P., Geller J. B. (2009). Benthic invertebrate communities on three seamounts off southern and central California, USA. Mar. Ecol. Prog. Ser. 374, 23–32. doi: 10.3354/meps07745
Luo Y., Wei X., Yang S., Gao Y.-H., Luo Z.-H. (2020). Fungal diversity in deep-sea sediments from the Magellan seamounts as revealed by a metabarcoding approach targeting the ITS2 regions. Mycology 11, 214–229. doi: 10.1080/21501203.2020.1799878
Martin M. (2011). Cutadapt removes adapter sequences from high-throughput sequencing reads. EMBnet. J. 17, 10–12. doi: 10.14806/ej.17.1
McClain C. R. (2007). Seamounts: identity crisis or split personality?. J. Biogeogr. 34, 2001–2008. doi: 10.1111/j.1365-2699.2007.01783.x
McClain C. R., Barry J. P. (2010). Habitat heterogeneity, disturbance, and productivity work in concert to regulate biodiversity in deep submarine canyons. Ecology 91, 964–976. doi: 10.1890/09-0087.1
McClain C., Lundsten L., Barry J., Devogelaere A. (2010). Bathymetric patterns in diversity, abundance and assemblage structure on a northeast Pacific seamount. Mar. Ecol. 31, 14–25. doi: 10.1111/j.1439-0485.2010.00367.x
McClain C. R., Lundsten L., Ream M., Barry J., Devogelaere A. (2009). Endemicity, biogeography, composition, and community structure on a Northeast Pacific seamount. PloS One 4, e4141. doi: 10.1371/journal.pone.0004141
Miller K. J., Gunasekera R. M. (2017). A comparison of genetic connectivity in two deep sea corals to examine whether seamounts are isolated islands or stepping stones for dispersal. Sci. Rep. 7, 46103. doi: 10.1038/srep46103
Mo J., Li X., Mou A., Gao P., Wang X., Zhang X., et al. (2024). Metazoan diversity and community assemblages in sediments across a Western Pacific Trench-Arc-Basin system: insights from eDNA metabarcoding. Front. Mar. Sci. 10, 1320540. doi: 10.3389/fmars.2023.1320540
Morato T., Cheung W., Pitcher T. (2006). Vulnerability of seamount fish to fishing: fuzzy analysis of life-history attributes. J. Fish Biol. 68, 209–221. doi: 10.1111/j.0022-1112.2006.00894.x
Morgan N. B., Cairns S., Reiswig H., Baco A. R. (2015). Benthic megafaunal community structure of cobalt-rich manganese crusts on Necker Ridge. Deep Sea Res. Part I: Oceanogr. Res. Pap. 104, 92–105. doi: 10.1016/j.dsr.2015.07.003
Nishijima W., Umehara A., Okuda T., Nakai S. (2015). Variations in macrobenthic community structures in relation to environmental variables in the Seto Inland Sea, Japan. Mar. pollut. Bull. 92, 90–98. doi: 10.1016/j.marpolbul.2014.12.051
Nitahara S., Kato S., Urabe T., Usui A., Yamagishi A. (2011). Molecular characterization of the microbial community in hydrogenetic ferromanganese crusts of the Takuyo-Daigo Seamount, northwest Pacific. FEMS Microbiol. Lett. 321, 121–129. doi: 10.1111/j.1574-6968.2011.02323.x
Nitahara S., Kato S., Usui A., Urabe T., Suzuki K., Yamagishi A. (2017). Archaeal and bacterial communities in deep-sea hydrogenetic ferromanganese crusts on old seamounts of the northwestern Pacific. PloS One 12, e0173071. doi: 10.1371/journal.pone.0173071
O’Hara T. D. (2007). Seamounts: centers of endemism or species richness for ophiuroids? Global Ecol. Biogeogr. 16, 720–732. doi: 10.1111/j.1466-8238.2007.00329.x
Pierce R. W., Turner J. T. (1992). Ecology of planktonic ciliates in marine food webs. Rev. Aquat. Sci. 6, 139–181.
Piredda R., Tomasino M. P., D’erchia A., Manzari C., Pesole G., Montresor M., et al. (2017). Diversity and temporal patterns of planktonic protist assemblages at a Mediterranean Long Term Ecological Research site. FEMS Microbiol. Ecol. 93, fiw200. doi: 10.1093/femsec/fiw200
Pitcher T. J., Morato T., Hart P. J., Clark M. R., Haggan N., Santos R. S. (2007). Seamounts: ecology, fisheries & conservation (Oxford: Wiley Online Library). doi: 10.1002/9780470691953
Porter T. M., Hajibabaei M. (2018). Over 2.5 million COI sequences in GenBank and growing. PloS One 13, e0200177. doi: 10.1371/journal.pone.0200177
Ramírez-Llodra E., Billett D. S. (2006). “Deep-Sea ecosystems: pristine biodiversity reservoir and technological challenge”, in The Exploration of Marine Biodiversity: Scientific and Technological Challenges, ed. Duarte C. M. (Bilbao: Fundación BBVA), 63–92.
Ramı́rez-Llodra E., Brandt A., Danovaro R., De Mol B., Escobar E., German C. R., et al. (2010). Deep, diverse and definitely different: unique attributes of the world’s largest ecosystem. Biogeosciences 7, 2851–2899. doi: 10.5194/bg-7-2851-2010
Ramı́rez-Llodra E., Tyler P. A., Baker M. C., Bergstad O. A., Clark M. R., Escobar E., et al. (2011). Man and the last great wilderness: human impact on the deep sea. PloS One 6, e22588. doi: 10.1371/journal.pone.0022588
Samadi S., Bottan L., Macpherson E., De Forges B. R., Boisselier M.-C. (2006). Seamount endemism questioned by the geographic distribution and population genetic structure of marine invertebrates. Mar. Biol. 149, 1463–1475. doi: 10.1007/s00227-006-0306-4
Scheffers B. R., Joppa L. N., Pimm S. L., Laurance W. F. (2012). What we know and don’t know about Earth’s missing biodiversity. Trends Ecol. Evol. 27, 501–510. doi: 10.1016/j.tree.2012.05.008
Schlacher T. A., Baco A. R., Rowden A. A., O’hara T. D., Clark M. R., Kelley C., et al. (2014). Seamount benthos in a cobalt-rich crust region of the central Pacific: conservation challenges for future seabed mining. Diversity distrib. 20, 491–502. doi: 10.1111/ddi.12142
Shen C., Lu B., Li Z., Zhang R., Chen W., Xu P., et al. (2021). Community structure of benthic megafauna on a seamount with cobalt-rich ferromanganese crusts in the northwestern Pacific Ocean. Deep Sea Res. Part I: Oceanogr. Res. Pap. 178, 103661. doi: 10.1016/j.dsr.2021.103661
Shi J., Lei Y., Li H., Li T. (2021). NGS-metabarcoding revealing novel foraminiferal diversity in the Western Pacific Magellan Seamount sediments. J. Oceanol. Limnol. 39, 1718–1729. doi: 10.1007/s00343-021-0427-0
Shi J., Lei Y., Li Q., Lyu M., Li T. (2020). Molecular diversity and spatial distribution of benthic foraminifera of the seamounts and adjacent abyssal plains in the tropical Western Pacific Ocean. Mar. Micropaleontol. 156, 101850. doi: 10.1016/j.marmicro.2020.101850
Shulse C. N., Maillot B., Smith C. R., Church M. J. (2017). Polymetallic nodules, sediments, and deep waters in the equatorial North Pacific exhibit highly diverse and distinct bacterial, archaeal, and microeukaryotic communities. MicrobiologyOpen 6, e00428. doi: 10.1002/mbo3.428
Sinniger F., Pawlowski J., Harii S., Gooday A. J., Yamamoto H., Chevaldonné P., et al. (2016). Worldwide analysis of sedimentary DNA reveals major gaps in taxonomic knowledge of deep-sea benthos. Front. Mar. Sci. 3, 92. doi: 10.3389/fmars.2016.00092
Smith C. R., De Leo F. C., Bernardino A. F., Sweetman A. K., Arbizu P. M. (2008). Abyssal food limitation, ecosystem structure and climate change. Trends Ecol. Evol. 23, 518–528. doi: 10.1016/j.tree.2008.05.002
Sun J., Zhou H., Cheng H., Chen Z., Yang J., Wang Y., et al. (2023). Depth-dependent distribution of prokaryotes in sediments of the manganese crust on Nazimov guyots of the Magellan seamounts. Microbial. Ecol. 86, 3027–3042. doi: 10.1007/s00248-023-02305-8
Watson R., Kitchingman A., Cheung W. W. (2007). “Catches from world seamount fisheries,” in Seamounts: Ecol. Fish. Conserv. ed. Pitcher T. J. (Oxford: Wiley Online Library), 400–412.
Weaver P. P., Billett D. (2019). “Environmental impacts of nodule, crust and sulphide mining: an overview,” in Environ. Issues deep-sea mining: Impacts, consequences Policy Perspect., ed. Sharma R. (London: Springer), 27–62.
Williams A., Schlacher T. A., Rowden A. A., Althaus F., Clark M. R., Bowden D. A., et al. (2010). Seamount megabenthic assemblages fail to recover from trawling impacts. Mar. Ecol. 31, 183–199. doi: 10.1111/j.1439-0485.2010.00385.x
Xu K. (2021). Exploring seamount ecosystems and biodiversity in the tropical Western Pacific Ocean. J. Oceanol. Limnol. 39, 1585–1590. doi: 10.1007/s00343-021-1585-9
Yang S., Xu W., Gao Y., Chen X., Luo Z.-H. (2020). Fungal diversity in deep-sea sediments from Magellan seamounts environment of the western Pacific revealed by high-throughput Illumina sequencing. J. Microbiol. 58, 841–852. doi: 10.1007/s12275-020-0198-x
Zeppilli D., Bongiorni L., Cattaneo A., Danovaro R., Santos R. S. (2013). Meiofauna assemblages of the Condor Seamount (North-East Atlantic Ocean) and adjacent deep-sea sediments. Deep Sea Res. Part II: Topical Stud. Oceanogr. 98, 87–100. doi: 10.1016/j.dsr2.2013.08.009
Keywords: Magellan seamount, the western Pacific Ocean, deep-sea ecosystems, biodiversity, environmental DNA metabarcoding, prokaryotic communities, eukaryotic communities
Citation: Kim E-B, Ju S-J and Suh YJ (2024) Biodiversity and community structures across the Magellan seamounts and abyssal plains in the western Pacific Ocean revealed by environmental DNA metabarcoding analysis. Front. Mar. Sci. 11:1412678. doi: 10.3389/fmars.2024.1412678
Received: 05 April 2024; Accepted: 10 June 2024;
Published: 25 June 2024.
Edited by:
Daniel Rittschof, Duke University, United StatesReviewed by:
Dongsheng Zhang, Ministry of Natural Resources, ChinaCopyright © 2024 Kim, Ju and Suh. This is an open-access article distributed under the terms of the Creative Commons Attribution License (CC BY). The use, distribution or reproduction in other forums is permitted, provided the original author(s) and the copyright owner(s) are credited and that the original publication in this journal is cited, in accordance with accepted academic practice. No use, distribution or reproduction is permitted which does not comply with these terms.
*Correspondence: Yeon Jee Suh, eWpzdWhAa2lvc3QuYWMua3I=
Disclaimer: All claims expressed in this article are solely those of the authors and do not necessarily represent those of their affiliated organizations, or those of the publisher, the editors and the reviewers. Any product that may be evaluated in this article or claim that may be made by its manufacturer is not guaranteed or endorsed by the publisher.
Research integrity at Frontiers
Learn more about the work of our research integrity team to safeguard the quality of each article we publish.