- 1Department of Marine Sciences, University of Connecticut, Groton, CT, United States
- 2Institute of Marine Science, University of Alaska Fairbanks, Fairbanks, AK, United States
- 3Biology Department, Woods Hole Oceanographic Institution, Woods Hole, MA, United States
- 4School of Aquatic and Fishery Sciences, University of Washington, Seattle, WA, United States
- 5Institute of Marine Science, University of Auckland, Auckland, New Zealand
- 6National Oceanic and Atmospheric Administration (NOAA) Fisheries, Northeast Fisheries Science Center, Woods Hole, MA, United States
DNA metabarcoding and morphological taxonomic (microscopic) analysis of the gut contents was used to examine diet diversity of seven species of fishes collected from mesopelagic depths (200-1000 m) in the NW Atlantic Ocean Slope Water during Summer 2018 and 2019. Metabarcoding used two gene regions: V9 hypervariable region of nuclear 18S rRNA and mitochondrial cytochrome oxidase I (COI). V9 sequences were classified into 14 invertebrate prey groups, excluding fish due to predator swamping. Ecological network analysis was used to evaluate relative strengths of predator-prey linkages. Multivariate statistical analysis revealed consistently distinct diets of four fish species in 2018 and/or 2019: Argyropelecus aculeatus, Chauliodus sloani, Hygophum hygomii, and Sigmops elongatus. Three other species analyzed (Malacosteus niger, Nemichthys scolopaceus, and Scopelogadus beanii) showed more variability between sampling years. COI sequences were classified into eight invertebrate prey groups, within which prey species were detected and identified. Considering all predator species together, a total of 77 prey species were detected with a minimum of 1,000 COI sequences, including 22 copepods, 18 euphausiids, and 7 amphipods. Morphological prey counts were classified into seven taxonomic groups, including a gelatinous group comprised of soft-bodied organisms. The ocean twilight zone or is home to exceptional diversity and biomass of marine fish, which are key players in deep sea food webs. This study used integrative morphological-molecular analysis to provide new insights into trophic relationships and sources of productivity for mesopelagic fishes, including identification of key prey species, recognition of the importance of gelatinous prey, and characterization of differences in diet among fish predators in the NW Atlantic Slope Water.
Introduction
Diversity and ecology of mesopelagic fishes
The mesopelagic zone remains one of the most under-explored regions of the ocean; information about these deep-sea communities typically drops off with depth, despite their global distribution (Webb et al., 2010; St. John et al., 2016). Recent discoveries in the mesopelagic (200 – 1,000 m depth) have provided new knowledge of pelagic invertebrate and fish communities (Kaartvedt et al., 2019) and resources for protein and nutraceuticals (St. John et al., 2016). Discovery of new taxa, ranging from vertebrates to viruses, continues (Robison, 2009; St. John et al., 2016; Govindarajan et al., 2021).
Mesopelagic fishes are found in all major oceans and are key players in food web dynamics of pelagic ecosystems (Williams et al., 2001; Kelly et al., 2019; Iglesias et al., 2023). Questions remain about biodiversity and biomass of mesopelagic fishes (Irigoien et al., 2014; Kaartvedt et al., 2019; Proud et al., 2019; Pauly et al., 2021) and their role in pelagic food webs and carbon cycling (Goetsch et al., 2018; McMonagle et al., 2023; Iglesias et al., 2023). Some species feed on particulate organic matter generated near the surface that sinks into the depths. Some epipelagic predators feed on migrating mesopelagic fishes at night by waiting for diel vertical migration (DVM) to bring their prey to them, while others dive to mesopelagic depths during the day to feed on these mesopelagic prey (Choy et al., 2017; Robison et al., 2020; Arostegui et al., 2022; Braun et al., 2022). Mesopelagic invertebrates and fishes mediate the relationship between primary production in surface waters, primary consumers in the epipelagic community, and deep-sea productivity and biomass; they are essential for the health and survival of deep-sea ecosystems (Choy et al., 2012, 2013; Irigoien et al., 2014; Käse et al., 2021). A more complete understanding of trophic dynamics of mesopelagic communities is critical considering anticipated growth in commercial harvesting of fish and other resources in the deep sea (St. John et al., 2016; Kelly et al., 2019), as well as possible impacts of climate change, plastic debris, deep-sea mining, and oil spills (Robison, 2009; Gamfeldt et al., 2015; Lusher et al., 2016; Levin et al., 2020; Kourantidou and Jin, 2022; Morzaria-Luna et al., 2022).
The diversity and abundance of mesopelagic fishes is exceptional, with species-specific variability in vertical distribution, DVM behavior, and trophic relationships (Caiger et al., 2021). This study examines seven species of fish collected in the Slope Water of the Northwest Atlantic Ocean (Figure 1). Argyropelecus aculeatus, silver hatchetfish, belongs to one of the most diverse, abundant, and widespread groups of mesopelagic fishes. The species has been reported to feed at dusk and to migrate into the epipelagic zone at night to feed (Hopkins and Baird, 1985). They are active predators and are known to feed on zooplankton, including copepods, ostracods, euphausiids, and gastropods, as well as gelatinous taxa and fish (Eduardo et al., 2020a; Receveur et al., 2020). The species has a typical life span of up to two years, with an average size of 58 mm; specimens up to 82 mm have been observed (Eduardo et al., 2019). Chauliodus sloani, Sloan’s viperfish, is a predator equipped with massive teeth to cage trapped prey (Bergman et al., 2023). This species occurs in oceans throughout the world and has been reported to exhibit DVM. Reported depth ranges are variable, perhaps due to differences in behaviors among life history stages, including daytime depths below 400 m (Eduardo et al., 2019, 2020b), with night-time migration to within 100 m of the surface (Sutton and Hopkins, 1996) to feed on smaller prey (Butler et al., 2001). The species has been found to prey mainly on fishes up to half of their body size, with larger prey captured by the unhinged jaw and digested by an elastic stomach (Battaglia et al., 2018). Hygophum hygomii, Bermuda lanternfish, also shows DVM behavior and is known to feed on zooplankton, including primarily copepods, amphipods, and euphausiids (Pusch et al., 2004). Typical size ranges are 29–63 mm, with maximum size of 70 mm (Pusch et al., 2004). Malacosteus niger, stoplight loosejaw, is highly adapted to the deep-sea environment, with a large gape and massive fangs. The species has been observed to be up to 270 mm in length and is found worldwide. The species has not been observed to exhibit DVM. Known prey include zooplankton, especially copepods, and larger micronekton, including decapods and other fishes (Sutton, 2005). Nemichthys scolopaceus, slender snipe eel, occurs throughout temperate to tropical regions of all major oceans. The species is distributed between 200-1000 m and exhibits vertical migration patterns, although the behavior may be caused by following prey (Smith and Tighe, 2002; Mundy, 2005). Prey are mostly large crustaceans, with occasional smaller zooplankton, pelagic mollusks, and fish. The species has been observed reaching lengths up to 1150 mm (Fraser-Brunner, 1936; Feagans-Bartow and Sutton, 2014). Scopelogadus beanii, Bean’s bigscale, does not exhibit DVM and feeds at depth; the diet is comprised of micronekton, including amphipods and gelatinous zooplankton, and fish (Gartner and Musick, 1989). Sigmops elongatus, elongated bristlemouth, is known to undergo DVM and prey on fishes and larger invertebrates; the species has been recorded up to 280 mm in length (Woodstock et al., 2020).
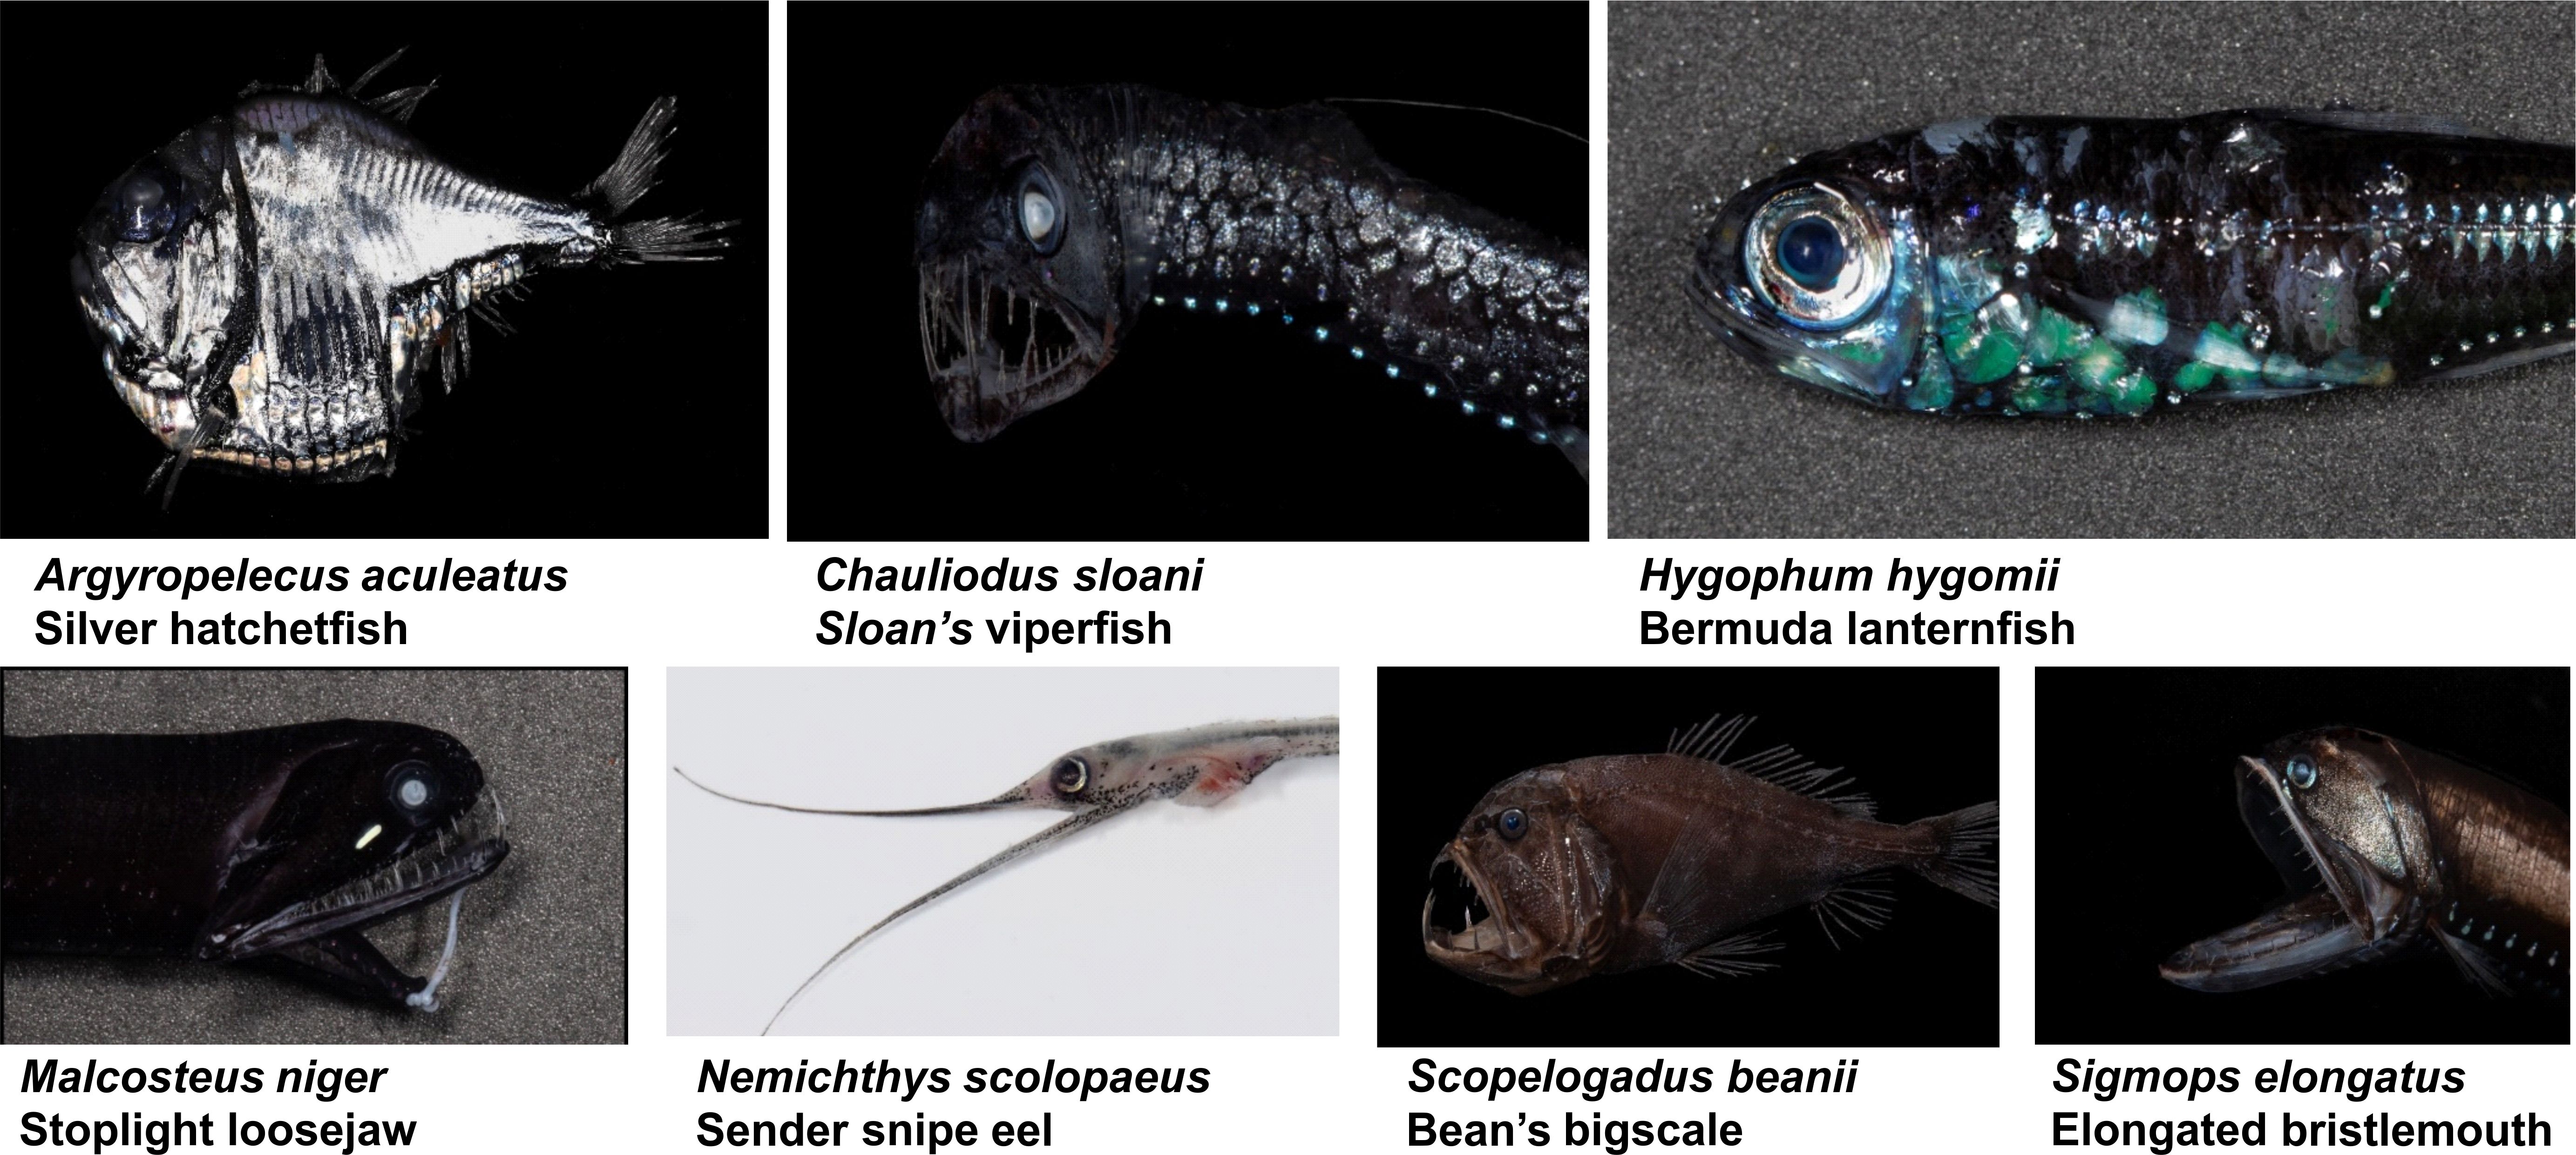
Figure 1. Mesopelagic fish species analyzed using metabarcoding of DNA extracted from dissected gut contents. Specimens were collected in 2018 and 2019; see Table 1 for collection information and Table 4 for sample sizes. Photos by Paul Caiger (University of Auckland).
Integrative analysis of fish diets
Integrative molecular (metabarcoding) and morphological (microscopic) analysis of fish diets has been identified as a best practice in several studies (Amundsen and Sánchez-Hernández, 2019; Clarke et al., 2020). Recommended approaches for quantitative morphological analysis of prey include comparisons of counts, frequencies of occurrence, or inferred biomass for selected prey groups (Matthews et al., 2021), using methods developed for integrative analysis of pelagic biodiversity (Ershova et al., 2021). Metabarcoding is defined as the identification of multiple taxonomic groups or species from a bulk sample containing genetic material from diverse sources (Taberlet et al., 2012). The emergence of metabarcoding was driven by the development and rapid advances in high-throughput DNA sequencing (HTS), which can yield billions of sequences and rapidly analyze unsorted samples from any environment or ecosystem (Taberlet et al., 2012). The marine metabarcoding revolution has been built upon several global initiatives, including characterization of biodiversity of pelagic ecosystems using ribosomal RNA (rRNA) genes (Quast et al., 2013) and species identification of marine metazoa using the mitochondrial cytochrome oxidase I (COI) barcode region (Bucklin et al., 2011, 2021b). A necessary foundation and key factor for applications of metabarcoding is the availability of reference databases to enable taxonomic identification of specimens by matching metabarcode sequences to reference sequences from specimens identified by morphological taxonomic experts (Coissac et al., 2012; Alberdi et al., 2017). Concerted efforts are continuing toward taxonomically-complete and geographically-comprehensive reference sequence databases for marine organisms, including zooplankton and fish (Sato et al., 2018; Blanco-Bercial, 2020; Bucklin et al., 2021b; Govindarajan et al., 2023).
Metabarcoding has been used to examine the diets of fishes from diverse ocean habitats, including Acanthopagrus latus, yellowfin seabream, in coastal waters of China (Su et al., 2018; Pan et al., 2021), Boreogadus saida, polar cod, in the Barents Sea (Maes et al., 2022), Syngnathus watermeyeri, and S. temminckii, estuarine pipefishes in South Africa (Serite et al., 2023), Lethenteron camtschaticum, Arctic lamprey, in the Bering Sea (Shink et al., 2019), Sardina pilchardus, European sardine, and Sprattus, European sprat, in the Bay of Biscay (Albaina et al., 2016), and numerous species of coral reef fishes (Casey et al., 2019). The diets of mesopelagic fishes have been analyzed using metabarcoding in Antarctic waters by Clarke et al. (2020). Recent efforts have explored broader use of metabarcoding of fish stomach contents for applications in fisheries and ecosystem management (Canals et al., 2024).
Detection and identification through morphological (microscopic) analysis of prey species in the gut contents of fish has been widely used to examine trophic relationships of marine and freshwater species (Baker et al., 2014; Young et al., 2015; Suca et al., 2018; da Silveira et al., 2020). Comprehensive reviews have considered the impacts and implications of diverse analytical approaches (Manko, 2016; Amundsen and Sánchez-Hernández, 2019). Recent review papers have recommended analytical or statistical approaches (Amundsen and Sánchez-Hernández, 2019) and standardization of methodologies (Buckland et al., 2017). Questions remain about best analytical approaches, including counts of numerical abundance, frequency of occurrence, and volume or biomass, as well as the most appropriate statistical tests of the resulting data, which include various indices of relative importance and selectivity (Manko, 2016).
This study characterizes and compares the diets of seven co-occurring mesopelagic fish species in the NW Atlantic Slope Water using integrative analysis. Our analyses explore the power of metabarcoding for detection and identification of invertebrate prey species. Morphological (microscopic) counts of prey in gut contents of fish collected in the same net samples allowed further consideration of the benefits and challenges of integrative analysis for understanding the trophic dynamics of the mesopelagic zone.
Materials and methods
Sample collection and specimen handling
Fish samples were obtained from the Slope Water of the Northwest Atlantic Ocean in August, 2018 and July-August, 2019 during cruises of the NOAA research vessel (R/V) Henry B. Bigelow (Figure 2A). Hydrographic data were collected during both cruises, with multiple conductivity, temperature, depth (CTD) profiles at each station (Figure 2B). Sampling for invertebrates and fish was done using a modified Marinovich midwater trawl (De Robertis et al., 2017; Jech and Lavery, 2018) and a 1-m2 MOCNESS (Wiebe et al., 1985), with deployments to differing depths and times of day or night (Table 1). Specimens planned for analysis of gut contents were identified to species, measured (standard length, mm), immediately flash-frozen in liquid nitrogen to stop digestive processes, and stored at -80°C. Up to 10 fish per species per trawl were flash frozen.
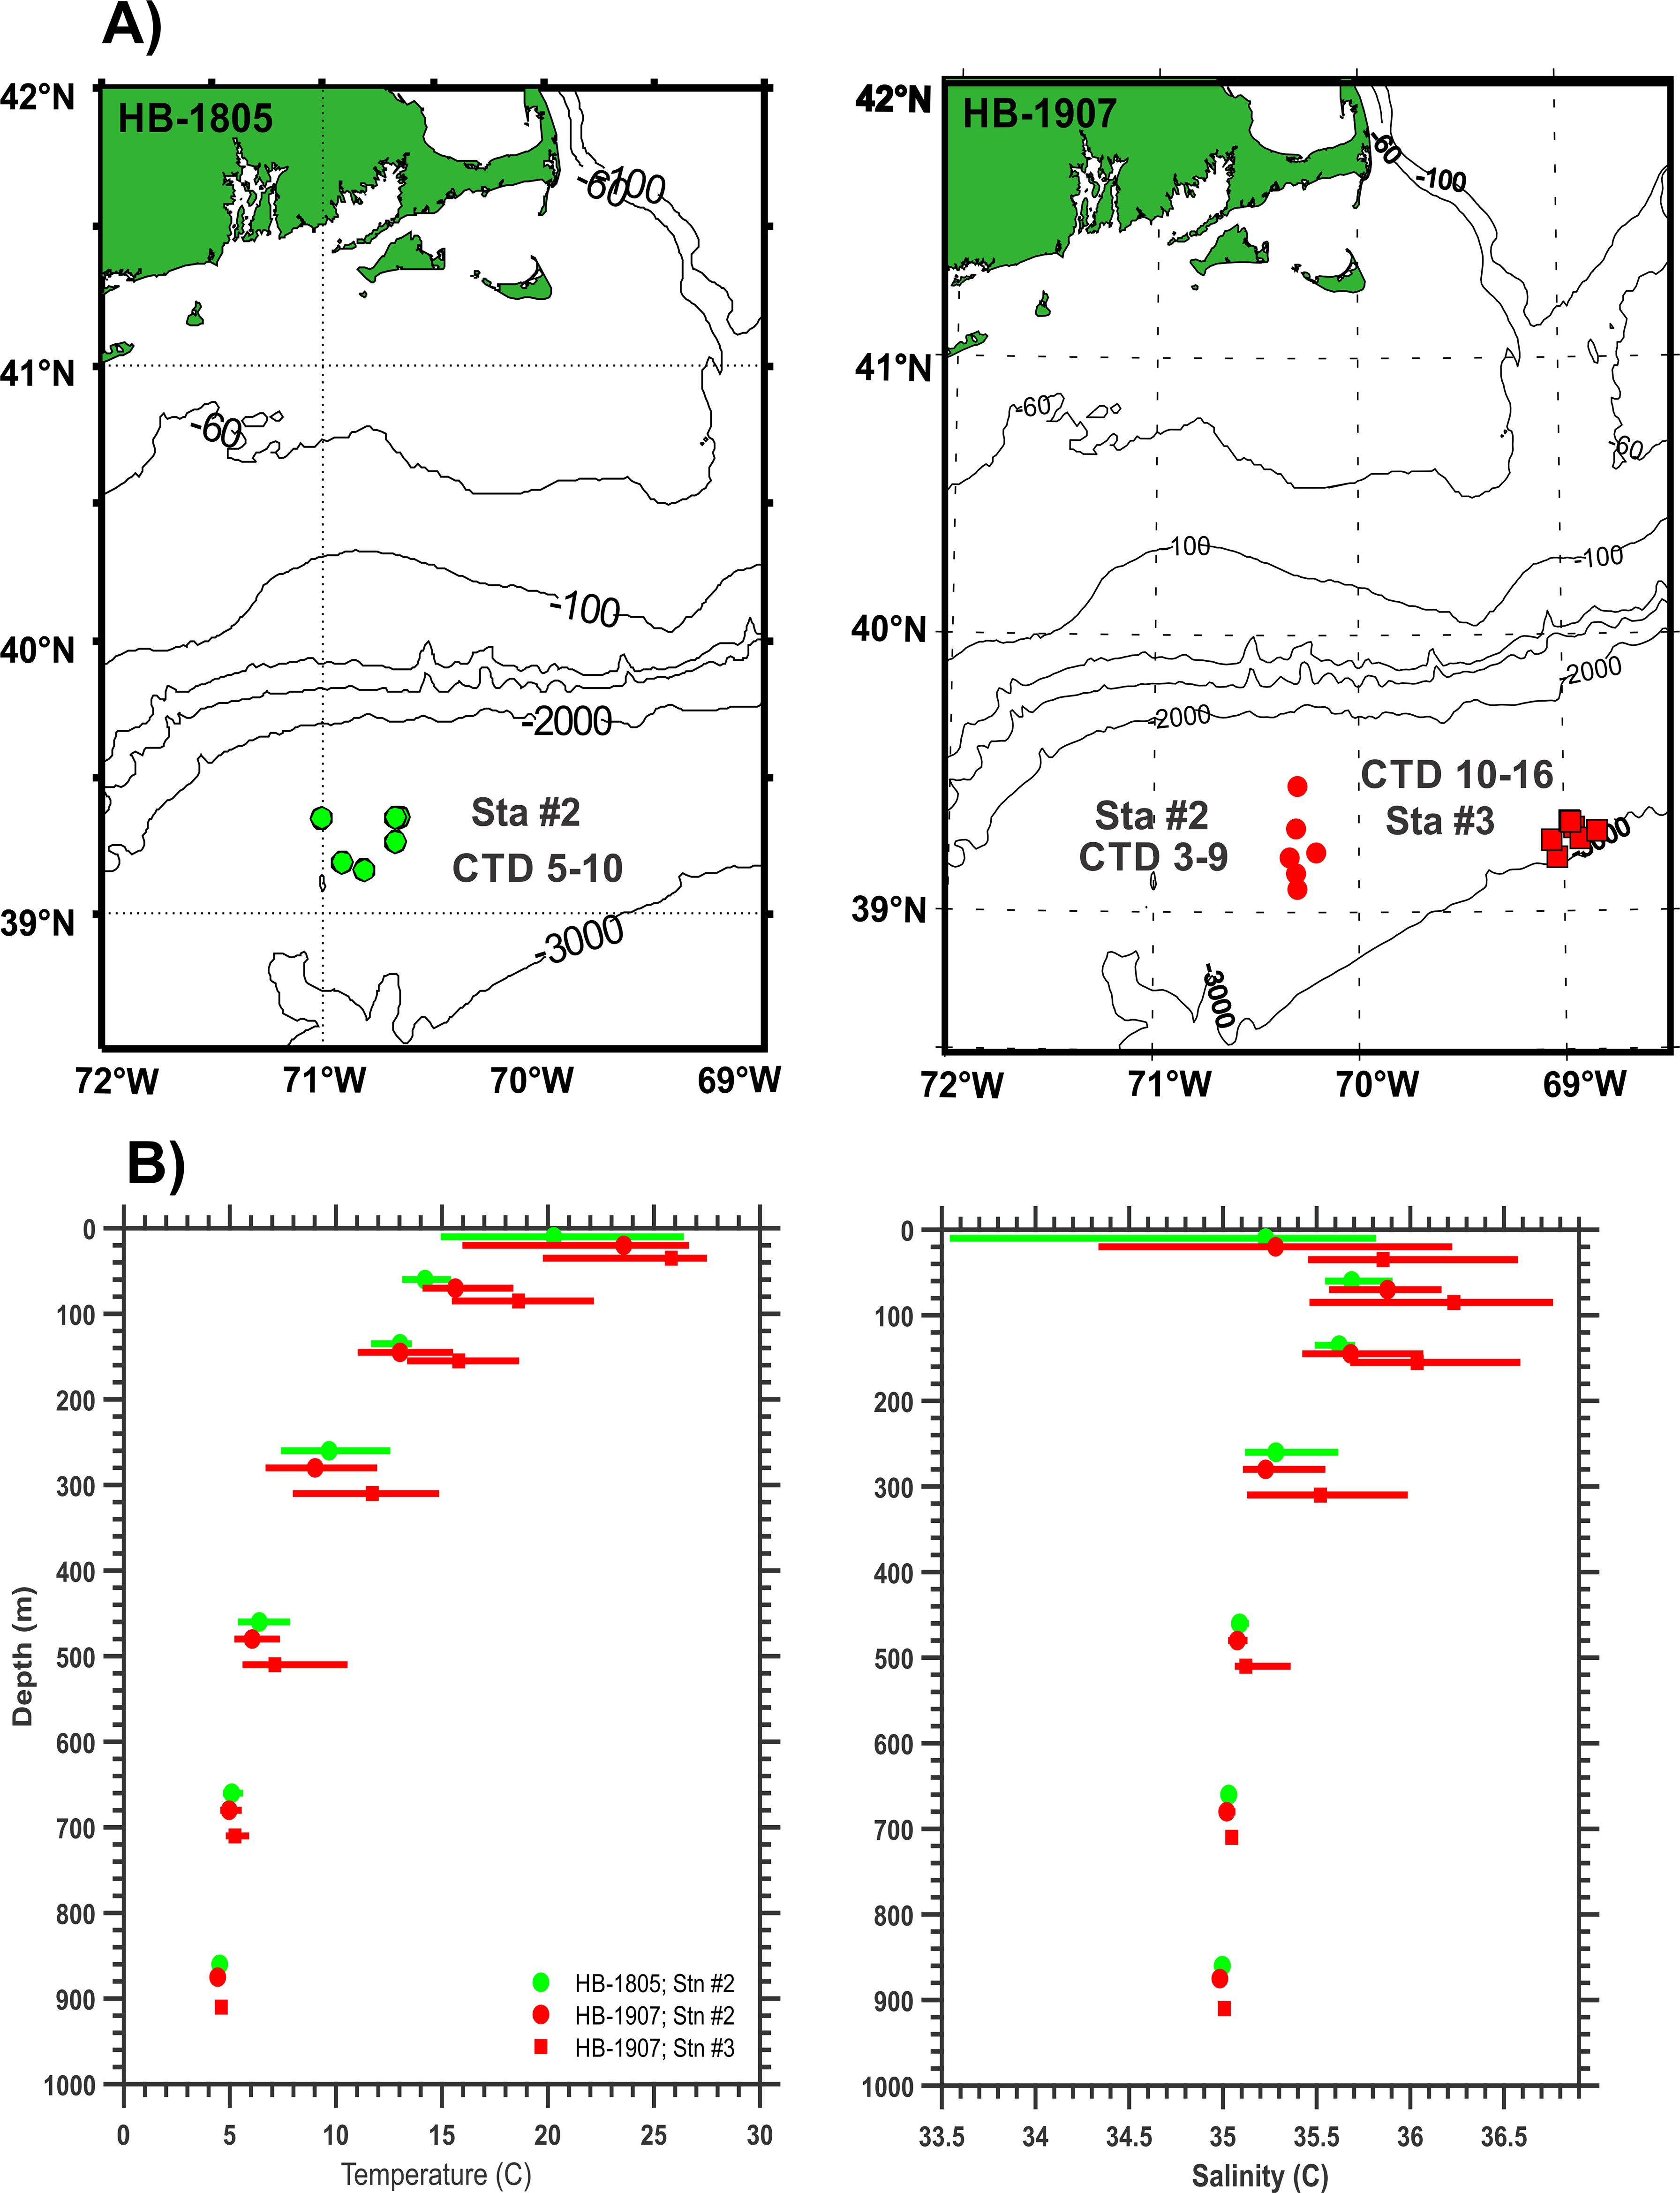
Figure 2. (A) Maps of locations of CTD casts at stations where mesopelagic fish were collected by net tows during cruises of the NOAA R/V Henry B. Bigelow in 2018 at Station #2 (green circles) and in 2019 at Stations #2 (red circles) and #3 (red squares). (B) Temperature and salinity profiles from CTD casts during HB-1805 (green lines) and HB-1907 (red lines). Depth ranges shown are: 0-50 m, 50-100 m, 100-200 m, 200-400 m, 400-600 m, 600-800 m, and 800-1,000 m. Color bars show maximum and minimum values; symbols show averages.
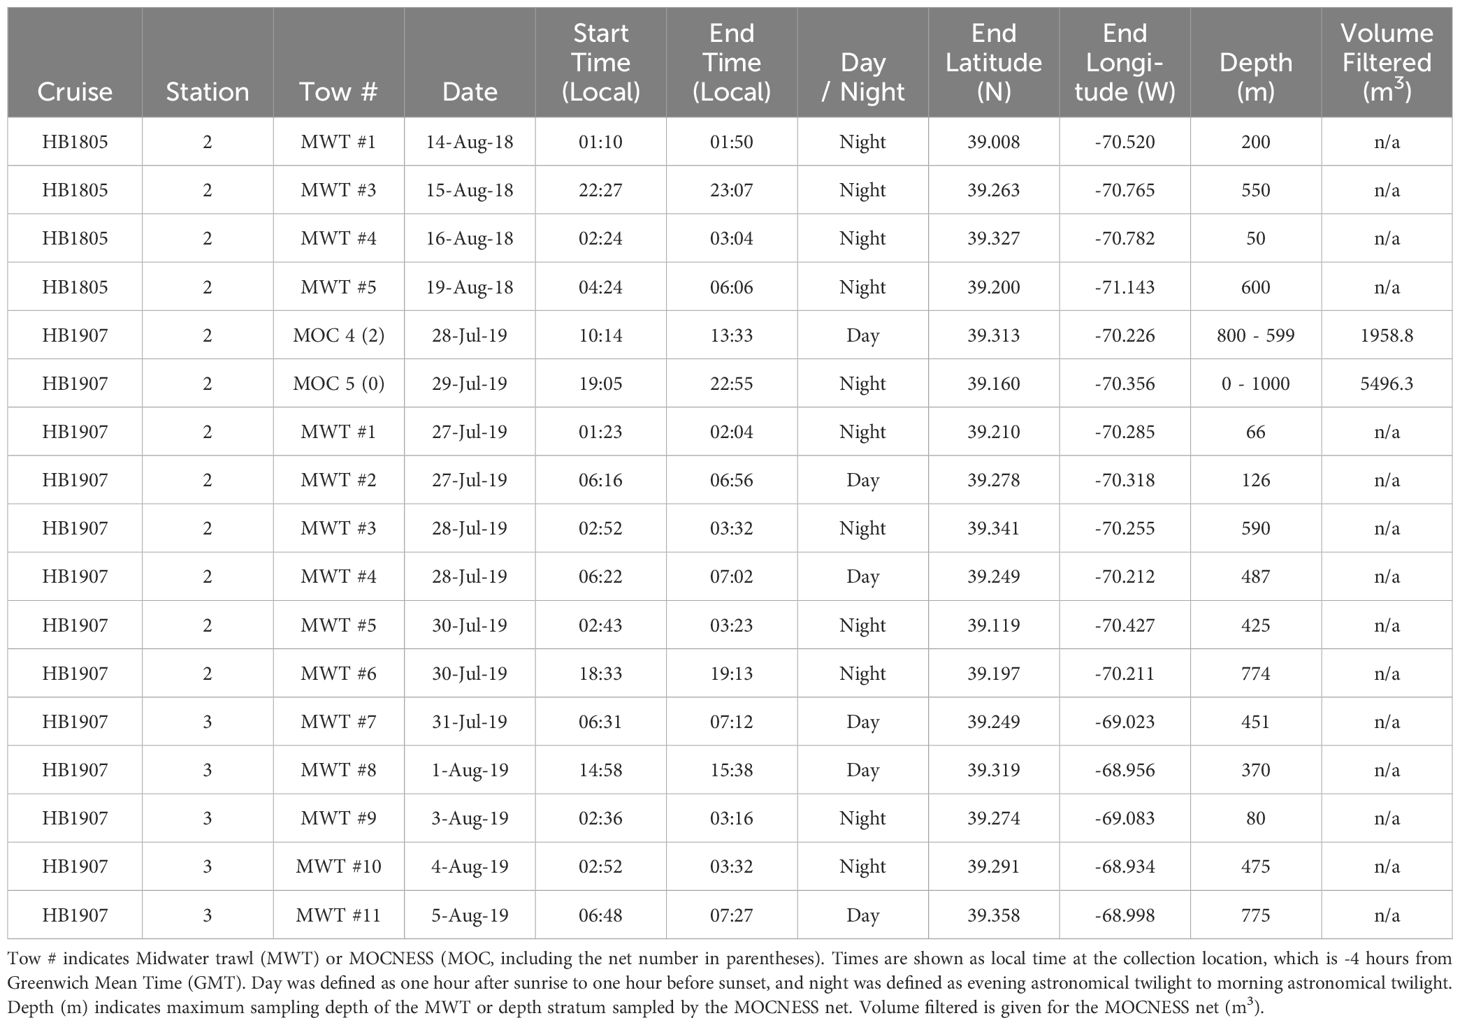
Table 1. Collection metadata for fish samples from 2018 and 2019 cruises of the NOAA R/V Henry B. Bigelow (HB1805 and HB1907) used for molecular (metabarcoding) and morphological (microscopic) analysis of mesopelagic fish diets.
Post-cruise processing of the frozen fish from each midwater trawl was carried out in a research laboratory at the Woods Hole Oceanographic Institution (WHOI, Woods Hole, MA). Fish were photographed, measured for standard length, fork length, and total length (in mm), weighed, and then dissected. Muscle tissue was excised from representative specimens to identify the species based on DNA sequencing of the COI barcode gene region for comparison to reference databases (Ward et al., 2009; Steinke and Hanner, 2011; Govindarajan et al., 2023; Quigley et al., 2023). Specimens were partially thawed to allow dissection of guts; gut contents were removed and weighed and transferred to individual vials. Gut contents were either preserved in 95% ethanol for morphological identification or frozen at -80°C for metabarcoding. During both HB-2018 and HB-2019 cruises, every attempt was made to allocate fish from each net tow equally for DNA metabarcoding and morphological microscopy based upon both numbers and sizes of specimens (Supplementary Tables 2, 3).
DNA extraction, PCR, and sequencing
Gut contents of each fish were thawed on ice in elution buffer made of Tris-HCl (10mM), EDTA (100 mM, pH 8), NaCl (200 mM), sodium dodecyl sulfate (SDS, 1%), and Milli-Q water. After homogenization for 15 sec, samples were incubated in a water bath at 55°C for 6-7 hours. DNA was extracted from digested samples using phenol:chloroform:isoamyl alcohol (25:24:1) and cleaned using a DNEasy PowerClean Pro Kit (Qiagen) according to manufacturer instructions.
Purified DNA from gut contents was used to amplify two gene regions: V9 hypervariable region of 18S rRNA (Amaral-Zetter et al., 2009) and a portion of COI (Leray et al., 2013). All forward and reverse primers were altered for multiplexed sequencing by adding 5’ adapters (Illumina, Inc., San Diego, CA). The V9 18S rRNA reaction used 4 µL of DNA template, with KAPA HiFi reagents (KAPA Biosystems, Massachusetts, USA): 5 µL buffer containing MgCl2, 1µL dNTPs, 0.5 µL HiFi Taq Polymerase, and 1 µL of each primer (10 µM). The primer pair 1380F and 1510R (Amaral-Zetter et al., 2009) was used to amplify V9 18S rRNA, with the following PCR protocol: one denaturation cycle at 98°C for 30 sec; 10 cycles of 98°C for 20 sec, 56°C for 30 sec, and 72°C for 15 sec; and 16 cycles of 9°C for 10 sec, 66°C for 30 sec, and 72°C for 15 sec; and 1 extension cycle of 72°C for 7 min. PCR amplification of a 313 base-pair (bp) region of COI used the primer pair mlCOIintF and jgHCO2198 (Geller et al., 2013; Leray et al., 2013). The PCR reaction used 20 ng of DNA, with Platinum Taq reagents, 4 µL buffer, 2.4 µL MgCl2, 0.8 µL dNTPs, 0.2 µL HiFi Taq Polymerase, and 0.8 µL of each primer (10 µM), with the following protocol: one denaturation cycle at 94°C for 60 sec; 38 cycles of 94°C for 30 sec, 46°C for 30 sec, 72°C for 90 sec; and 1 extension cycle of 72°C for 5 min. Both V9 18S rRNA and COI amplicons were checked for successful amplification by running in a 2% agarose gel with a 50 base-pair (bp) marker.
Library preparation entailed adding index primers in a second PCR amplification of the purified amplicons using a master mix composed of (per sample): 5.0 µL purified PCR product; 5 µL Nextera XT Index 1 Primer; 5 µL Nextera XT Index 2 Primer; 25 µL 2x KAPA HiFi HotStart ReadyMix; 10 µL PCR-grade water; for a total volume of 50 µL. The PCR protocol was: 95°C for 3 min; 8 cycles of: 95°C for 30 sec, 55°C for 30 sec, 72°C for 30 sec; and 1 cycle of 72°C for 5 min. The indexed PCR product was purified using AMPure XP beads, with a final elution volume of 25 µL. Successful library attachment was verified using an Agilent 2200 TapeStation automated electrophoresis system. Libraries were quantified using a Qubit 3.0 fluorometer, normalized according to amplicon size, pooled, and denatured with 0.2 N NaOH. Samples were spiked with a minimum of 5% PhiX (Illumina, Inc.). Bi-directional sequencing was carried out at the University of Connecticut Center for Genomic Innovation (CGI; https://cgi.uconn.edu/) on an Illumina MiSeq sequencer using the MiSeq Reagent Nano Kit Ver. 2 (500 cycles; 1 million clusters) spiked with a minimum of 5% PhiX.
Sequence quality assessment and bioinformatics
V9 18S rRNA
Demultiplexed reads for V9 were processed using a custom script (URL available upon publication) for the Mothur pipeline (Ver. 1.44.3; Schloss et al., 2009) and run on the Xanadu computing cluster of the UConn Computational Biology Core (CBC; https://bioinformatics.uconn.edu/). Contiguous sequences (contigs) were assembled from forward and reverse Illumina MiSeq reads and trimmed to the overlapping section. Sequences containing ambiguous bases, quality Phred scores < 30, and with lengths shorter than 120 bp were removed from analysis. Unique sequences were aligned against the reference database, SILVA Release 132 (Quast et al., 2013; https://www.arb-silva.de/documentation/release-132/). Sequences were trimmed to a uniform length by removing the beginning and terminal ends of sequences that extended beyond the V9 gene region. Any sequences that did not span the entire V9 region were removed, decreasing the likelihood of artefactual operational taxonomic units (OTUs) being created during clustering. Concerns that PCR error may contribute to errors in biodiversity assessment (Kelly et al., 2019) were addressed by using the UNOISE 37 method (Edgar, 2016) within Mothur (Ver. 1.44.3) to de-noise aligned sequences before clustering of OTUs, which was done using a limit of 2 bp difference between sequences. Sequences were screened for chimeras using the VSEARCH command (Rognes et al., 2016); sequences with chimeras were removed from analysis.
OTUs were assigned taxonomic identifications using a tailored 18S rRNA database by Blanco-Bercial (2020) that adds sequences for eukaryotic marine organisms acquired from the NCBI GenBank sequence repository to the SILVA 132 database (Quast et al., 2013). Taxonomic assignments were determined using a naïve Bayesian classifier algorithm (Wang et al., 2007), which uses the highest probability that a given sequence contains kmers (i.e., DNA segments of length k in nucleotides) specific to a sequence of a known taxonomic identity; default kmer size (ksize) = 8 was used. Taxonomic assignments were based on bootstrap values ≥ 80% after 100 iterations.
Mitochondrial COI
Bi-directional COI reads were processed using a custom script for Mothur (Ver. 1.44.3; Schloss et al., 2009) and run on the Xanadu computing cluster. The bioinformatics pipeline used to quality control and filter COI sequences closely followed the 18S rRNA Mothur script. Contigs greater than 150 bp in length were aligned to the Global MetaZooGene Database (MZGdb; https://metazoogene.org/MZGdb; accessed March 3, 2022), a custom COI database including publicly available sequences downloaded from GenBank and BOLD (Bucklin et al., 2021b). Sequences were further denoised of PCR and sequencing errors using the UNOISE3 method in Mothur (Edgar, 2016). Chimeras were identified using the VSEARCH command (Rognes et al., 2016) and removed from analysis.
Taxonomic identifications were based on sequences and OTUs for COI determined using a naïve Bayesian classifier algorithm in Mothur (Ver. 1.44.3) against the geographic-specific North Atlantic MZGdb (Bucklin et al., 2021b). Taxonomic assignments for species-level identifications used bootstrap values ≥ 97% after 100 iterations (Schroeder et al., 2020). Before performing zooplankton community analyses, sequences with abundances < 2 (i.e., global singletons) across the entire dataset were removed.
Statistical analysis of COI and V9 sequence numbers
Specimens of seven mesopelagic fish species were analyzed by metabarcoding of DNA purified from gut contents. Total samples sizes were: 36 specimens for V9 and 28 specimens for COI from 2018 samples; 30 specimens for V9 and 33 specimens for COI in 2019 (Supplementary Table 1). Multivariate statistical analysis to characterize diet diversity within and among the mesopelagic fish species was carried out for sequence numbers and OTUs of both COI and V9. Results described here focus on sequence numbers. Sequence numbers are reported as average percent occurrence (Log10 + 1 transformed) for fish samples of each species collected in each of 2018 and 2019. Results are reported and analyzed as average proportions of sequence numbers of each gene region (Log10 + 1 transformed) for prey groups (major taxonomic categories) selected based on metabarcoding results as reported in the taxonomy summary file (Wang et al., 2007) generated by Mothur (Ver. 1.44.3; Edgar, 2016) for each analysis. Results were analyzed for eight taxonomic groups (Copepoda, Eucarida, Amphipoda, Ostracoda, Chaetognatha, Hydrozoa, Cephalopoda, and Gastropoda) for which sequences of both gene regions detected prey (i.e., non-zero results in at least one fish species). Analysis was done for an additional six prey groups (Polychaeta, Salpida, Nematoda, Platyhelminthes, Scyphozoa, and Ctenophora), which were detected only by V9. COI sequence numbers showed a higher frequency of zero values. Fish specimens showing zero sequences for either V9 or COI for all (or in several cases, almost all) prey groups were removed from analysis, reducing sample sizes in some cases.
V9 and COI sequences classified as fish (Teleostei) in gut contents were reported for each sample (Supplementary Tables 2A, B), but not included in the analyses, even for known piscivores, since neither gene region can discriminate sequences resulting from DNA of predator gut tissue versus ingested prey. COI sequence numbers for identified species of fish from gut content DNA were reported for each predator species (Table 2).
Ecological network analysis based on V9 was used to evaluate predator – prey linkages between the seven fish species and 14 prey groups (Table 3) using BitMAT (Flores et al., 2016). The percentages of V9 sequences for the fish predator species were computed for fish from both 2018 and 2019; prey with ≥ 1% were included in the analysis. Sequences were summed for each of the 14 prey groups, divided by the number of fish analyzed for each predator species, and multiplied by 100 to give percentages.
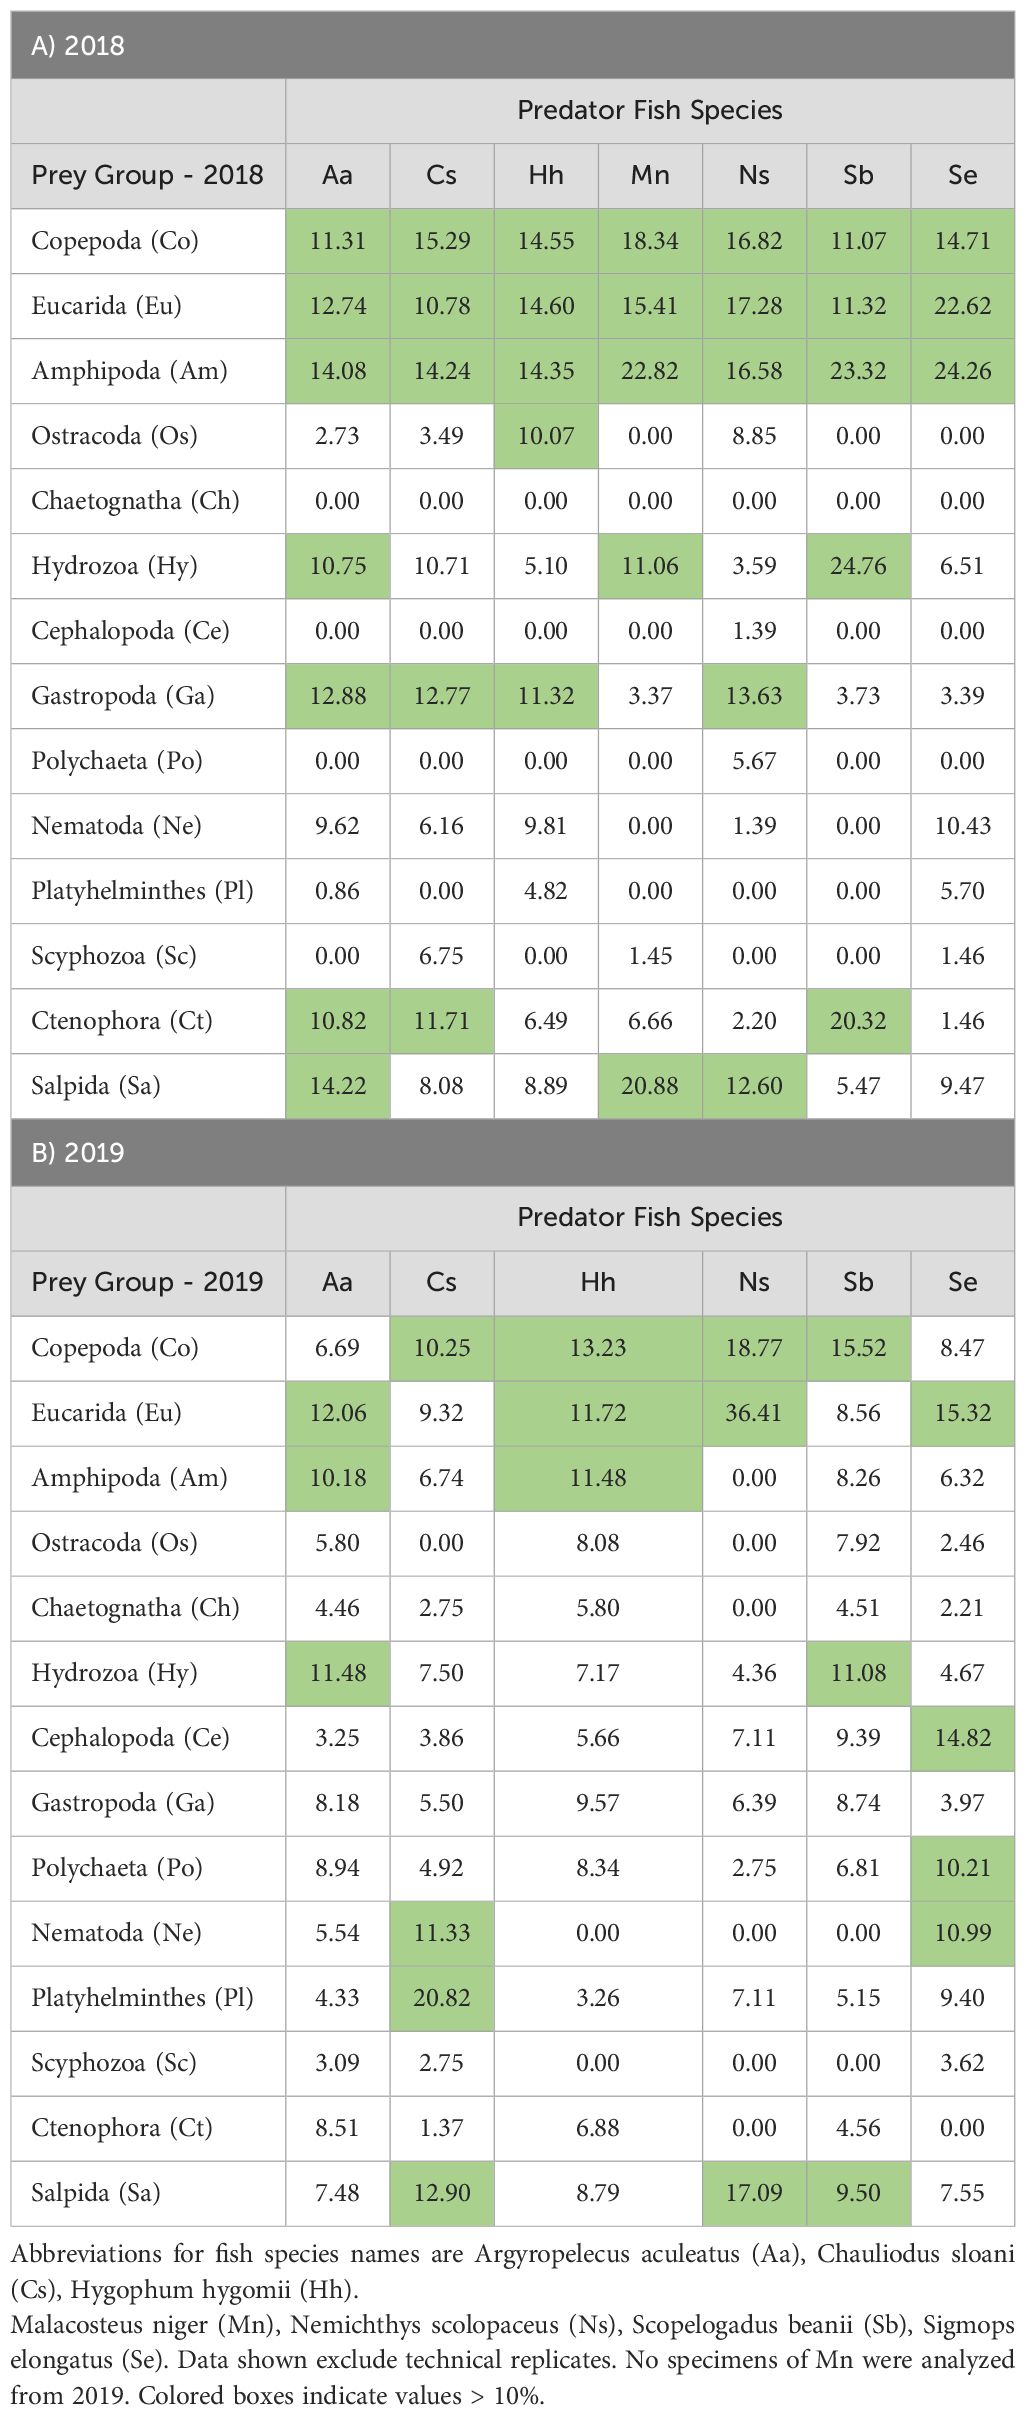
Table 3. Percent occurrence (Log10 + 1 averages) of V9 18S rRNA sequence numbers for 14 taxonomic groups of prey organisms for 7 mesopelagic fish species for 2018 (A) and 2019.
Patterns of variation in sequence numbers of COI and V9 for the selected prey groups were statistically evaluated among species and between years of collection in MatLab (Ver. 2020B). Two-way Analysis of Variance (ANOVA) was done to test for significant differences in sequence numbers (Log10 + 1 transformed) of both V9 and COI for selected prey groups between the predator fish species and the two years of collection (2018 and 2019). One distance measure used was Bray-Curtis dissimilarity coefficient (Bray and Curtis, 1957; McCune et al., 2002), with results displayed by cluster diagrams. Differentiation among the seven species was evaluated by Non-Metric Multidimensional Scaling (NMDS) using the FATHOM Toolbox for MatLab (Jones, 2017; https://www.usf.edu/marine-science/research/matlab-resources/index.aspx/). The Shannon Diversity Index (H; Pielou, 1977) was calculated using numbers of sequences for the prey groups detected for each gene.
Identified prey species with a minimum threshold of 1,000 COI sequences in total across all predators were reported for 7 of the 8 prey groups analyzed for COI (Table 2), excluding Chaetognatha, for which no species were identified, and fish (Teleostei). Normalization was done separately for each species based on overall means; statistical analysis included NMDS.
Morphological analysis of gut contents
Fish used for morphological (microscopic) analysis of gut contents were selected from the same collections and net tows during the 2018 and 2019 cruises of the R/V Henry B. Bigelow as the samples used for metabarcoding of gut contents (as described above). Gut contents for microscopy were thawed, placed in 95% ethanol for preservation, and identified to the lowest taxonomic unit practical, focusing on groups that could be accurately and reliably distinguished after partial digestion, using a Leica M60 dissecting microscope (Suca et al., 2018).
Morphological counts of prey in the gut contents of specimens of each fish species were classified into six of the taxonomic groups used for analysis of COI and V9 metabarcoding results: Copepoda, Eucarida, Amphipoda, Ostracoda, Chaetognatha, and Gastropoda. An additional group included prey fishes (Teleostei). A general category of soft-bodied organisms was used to record prey that could not be identified morphologically, including Chaetognatha, Hydrozoa, and Cephalopoda. Numbers of prey in each category were recorded for each individual gut content sample analyzed and averaged across all specimens examined for each predator species. Statistical analysis included calculation of the Bray-Curtis dissimilarity coefficient (Bray and Curtis, 1957; McCune et al., 2002); results were displayed by cluster diagrams. NMDS analysis used the FATHOM Toolbox for MatLab (Jones, 2017; https://www.usf.edu/marine-science/research/matlab-resources/index.aspx/). The Shannon Diversity Index (H; Pielou, 1977) was calculated using average counts for prey groups for each fish species.
Fish predator size and prey diversity
The relationships between size of fish (standard length, mm) and Shannon Indices of prey diversity, based on COI and V9 metabarcoding data and morphological counts, were examined to determine whether fish size was a significant predictor of the diversity of prey ingested. Regression analyses were carried out in MatLab (Jones, 2017). Two fish species (A. aculeatus and H. hygomii) had enough data for regression analysis of size versus V9 and COI sequences and counts; one species was analyzed only for V9 (C. sloani); one species (S. elongatus) was analyzed for V9 and prey counts.
Impacts of time and depth of collection
To examine relationships between prey diversity and time and depth of predator collection, CTD data were used to characterize temperature and salinity of the water column when and where the fish were collected in both sampling years. Temperature and salinity data from multiple CTD casts were pooled; maximum, minimum, and average values were determined for selected depth ranges and graphed on the same plot to allow comparisons between CTD casts and years. Variation of V9 and COI sequence numbers and morphological prey counts based on both average values for the seven fish species and individual fish specimens were examined in relation to depth of the net tow and hydrographic structure of the water column at the time of collection. Impacts of collection time on prey composition focused on comparison of samples from day and night tows during 2019 (Table 1).
Results
Hydrographic analysis of the study region
Hydrographic conditions at the sampling sites in the NW Atlantic Slope Water were described based on multiple CTD profiles in both 2018 and 2019 (Figure 2B). Temperatures and salinities at the sample collection locations in HB-1805 (Station #2) and HB-1907 (Stations #2 and #3) were similar below 600 m. At mid-depths (50-600 m), both temperatures and salinities were higher and more variable at Station 3 in 2019 than at Station 2 in either year. Near-surface temperatures (above 50 m) were much warmer at all three stations in both 2018 and 2019, but relatively cooler in 2018 at Station 2. Above 50 m, salinities showed wide variation at Station 2 in both years, but were lower in 2018, with higher and less variable values in 2019.
Prey group analysis based on V9
V9 metabarcoding detected the presence of 14 prey groups in the gut contents of the seven fish predators (Table 3; Supplementary Table 2A). V9 sequences for fish prey were excluded from analysis because V9 cannot identify species reliably and discriminate sequences from predator gut DNA versus consumed prey (Shortridge, 2016). Amphipods dominated the gut contents of Argyropelecus aculeatus based on V9 in both 2018 and 2019. Copepods and eucarids were abundant in most samples in both years. Gastropods and hydrozoans showed high V9 sequence numbers in two A. aculeatus collected in a night-time tow in 2018 and a day-time tow in 2019. Salps were abundant in two night-time tows in 2018. Chauliodus sloani showed a predominance of crustacean prey based on V9, including primarily copepods, eucarids, and amphipods in both 2018 and 2019; one specimen collected in a night-time tow in 2018 had predominantly gelatinous prey, including hydrozoans, gastropods, and ctenophores. Hygophum hygomii showed high sequence numbers for eucarids, copepods, and amphipods for V9 in both 2018 and 2019. Gastropods were abundant prey for two H. hygomii collected in night-time tows of varying depths during 2018 and 2019; two fish collected in one of the 2019 tows also showed high levels of polychaetes, ctenophores, and salps. All three Malacosteus niger collected during a night-time tow in 2018 were dominated by amphipods; one sample also included high numbers of copepods and eucarids, with some hydrozoans; no specimens of M. niger were analyzed for 2019. One of five Nemichthys scolopaceus analyzed for 2018 showed high V9 numbers for copepods, eucarids, and amphipods, plus smaller numbers for gastropods; eucarids predominated for one of two fish collected in 2019, with smaller numbers of copepods. All Scopelogadus beanii had V9 sequences for hydrozoa, with most fish also including copepods, eucarids, and amphipods; four fish from night-time tows in 2019 showed high numbers of cephalopods and salps; two fish from a 2018 night-time tow included ctenophores. Copepods were found in all Sigmops elongatus analyzed from both years; eucarids and amphipods predominated in fish from two 2018 night-time tows; three fish from 2019 night-time tows had different predominant prey, including platyhelminthes, cephalopods, and nematodes. One S. elongatus from a 2019 day-time tow included polychaetes and eucarids.
The relative importance of the prey groups for each predator species is shown in a bipartite graph (Dormann et al., 2009) indicating quantitative linkages between predators and prey (Figure 3). The network diagram clearly shows the importance of three prey groups, Eucarida, Amphipoda, and Copepoda, which have strong links, shown as thick bars, to five predators: A. aculeatus, H. hygomii, M. niger, and S. elongatus. Another prey group, Salpida, has links of varying width to all predators except H. hygomii (Figure 3).
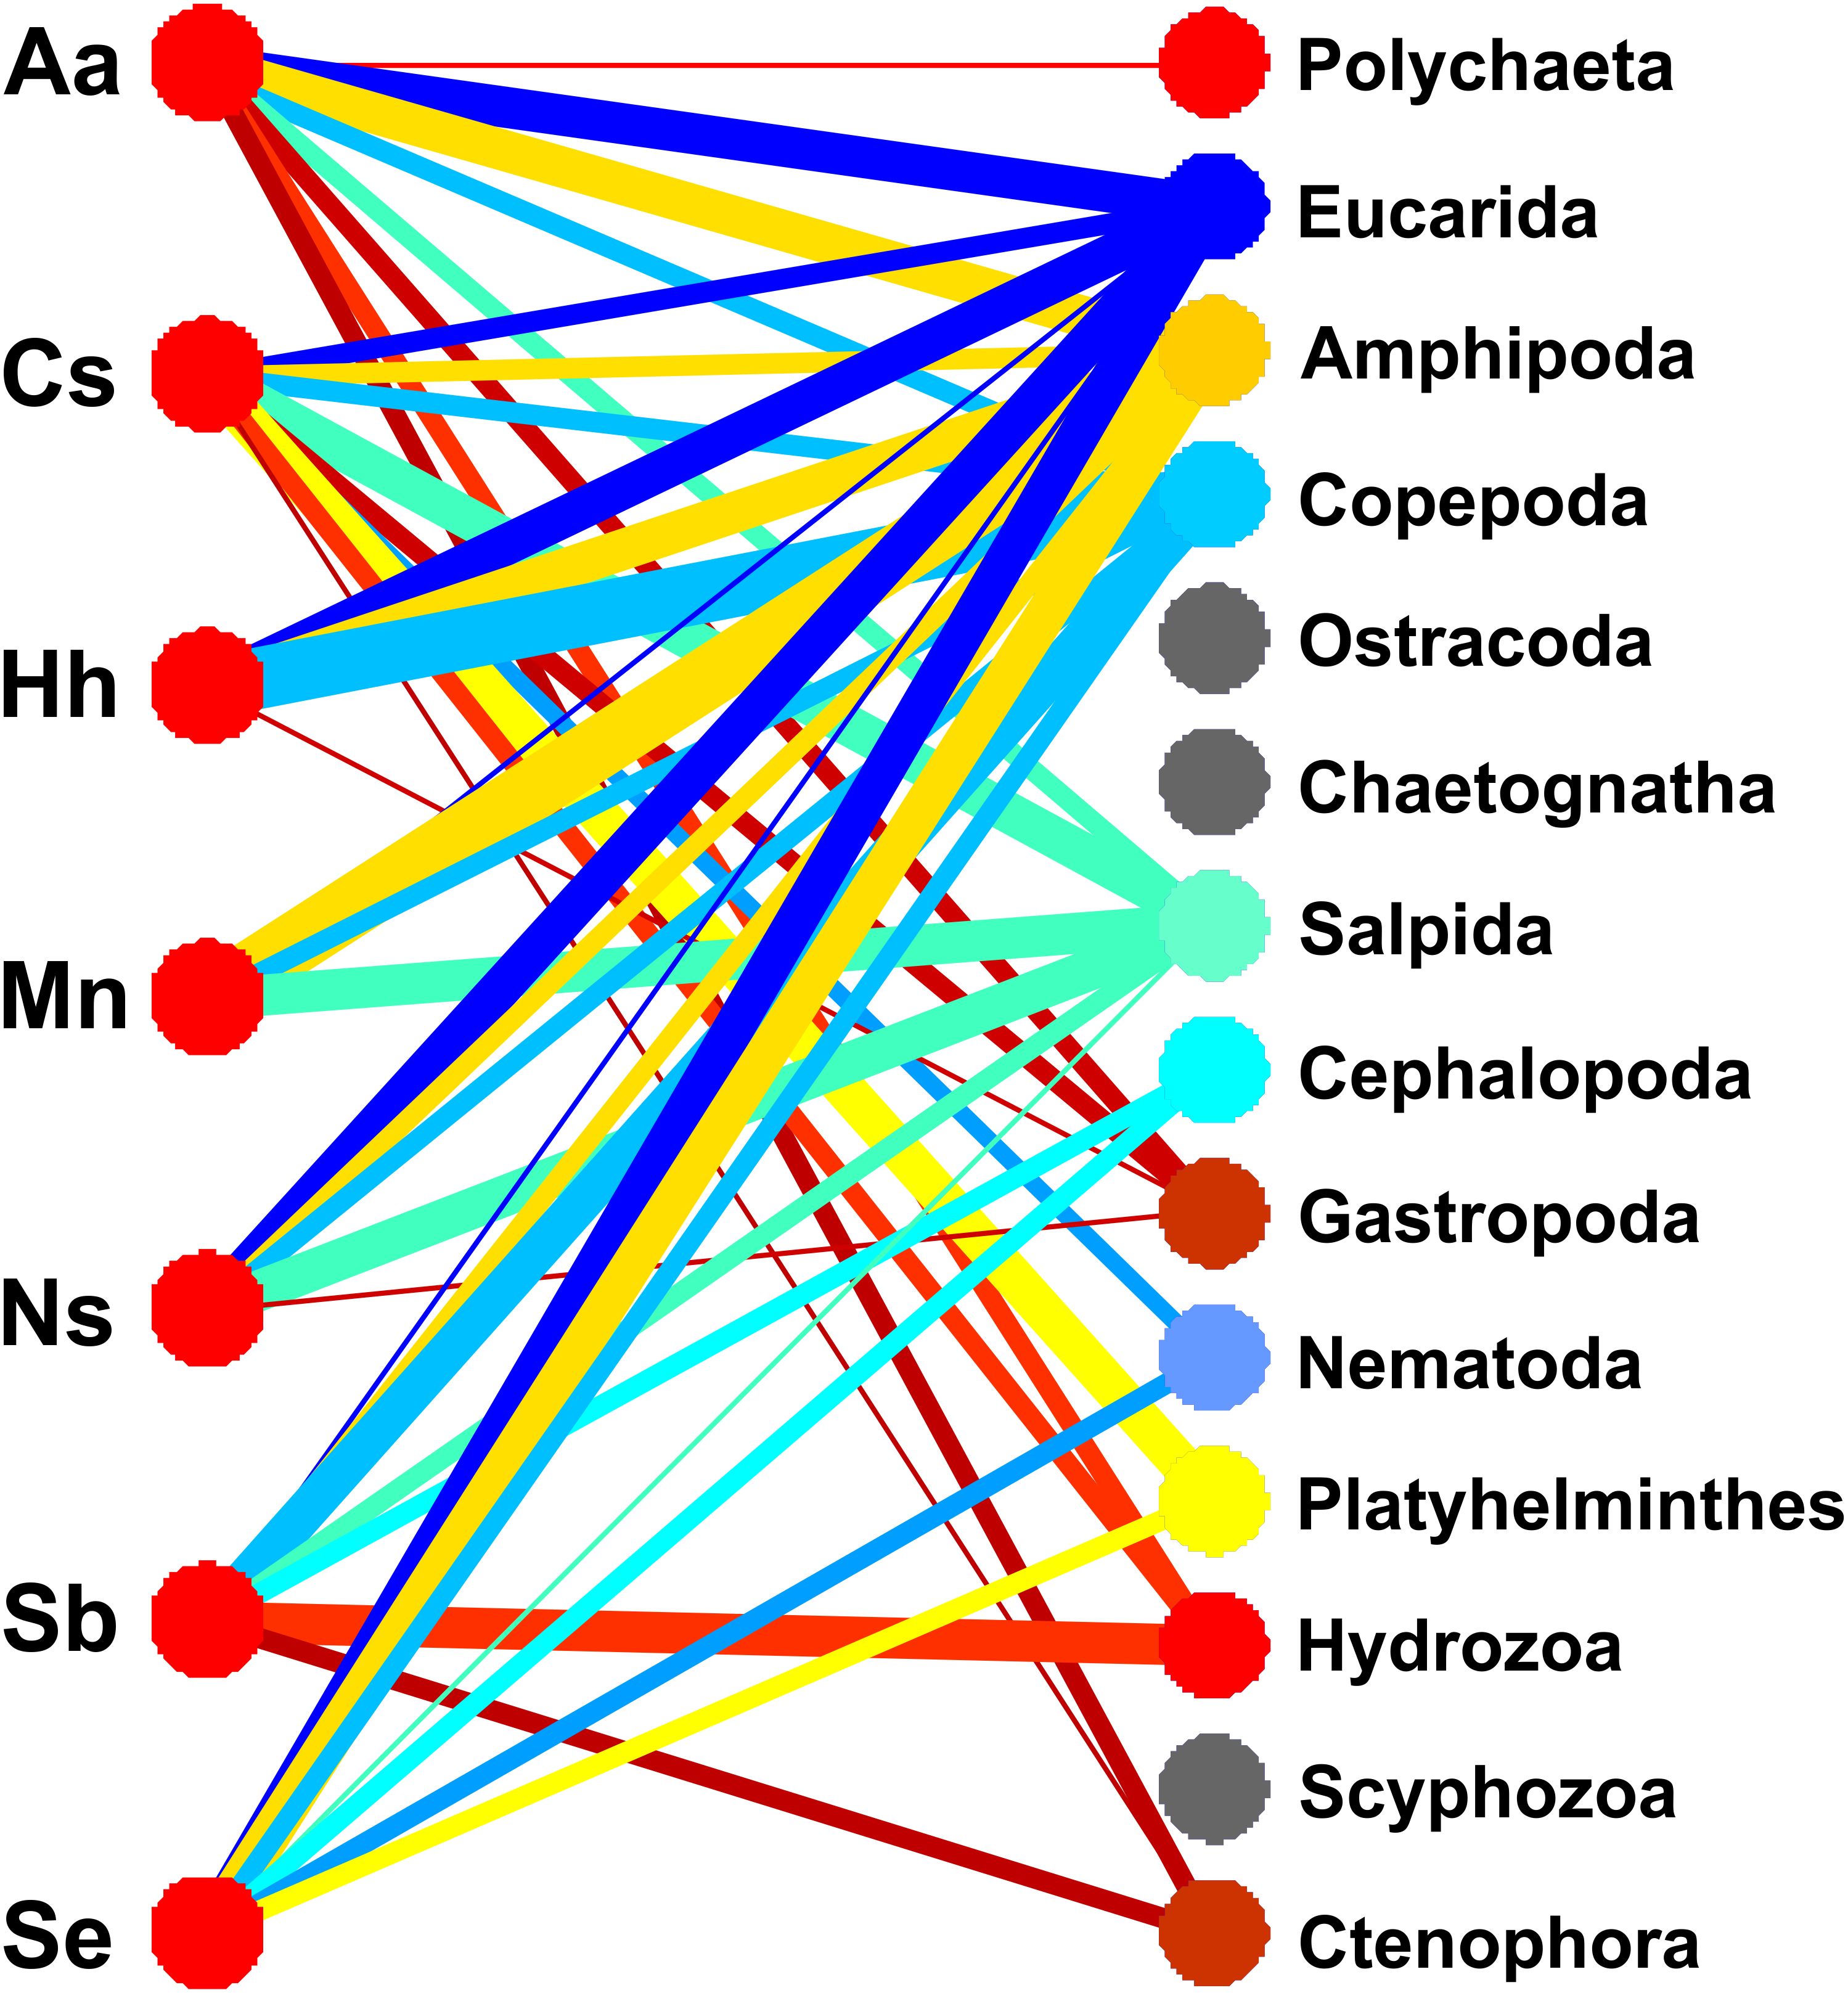
Figure 3. Network diagram of frequencies of 14 prey groups based on V9 18S rRNA sequences for 7 fish predator species. The width of each link is proportional to the frequency of prey group occurrences in each fish species, computed by adding sequences for individual fish samples, dividing by the number of fish analyzed from 2018 and 2019, and multiplying by 100. Links to prey with frequencies < 1% are not shown (i.e., Ostracoda, Chaetognatha, Scyphozoa). See Table 3 for explanation of abbreviations for predator species.
Statistical analysis of 868 individual observations by 2-way ANOVA revealed significant variation among the predator species (p < 0.001) and between years (p < 0.043), with significant interaction (p < 0.002). Bray-Curtis dissimilarity cluster plots based on V9 for prey groups (Figure 4A) showed differences among the fish species, with clustering of H. hygomii from 2018 and 2019, along with M. niger, and separate-but-overlapping clusters of A. aculeatus and C. sloani; S. elongatus clustered by year, while M. niger, N. scolopaceus, and S. beanii showed lack of separation. Non-metric multidimensional scaling (NMDS) based on V9 detection of prey groups for each year also revealed variation among the seven fish species, with distinct groupings of H. hygomii and S. beanii in 2018, with small and distinct clusters of A. aculeatus and H. hygomii, and a broad group for C. sloani in 2019 (Figure 5). The Shannon Diversity Index based on V9 showed variation in prey groups between predators for both 2018 and 2019, albeit with significant variation among fish in both 2018 and 2019 (Figure 6A).
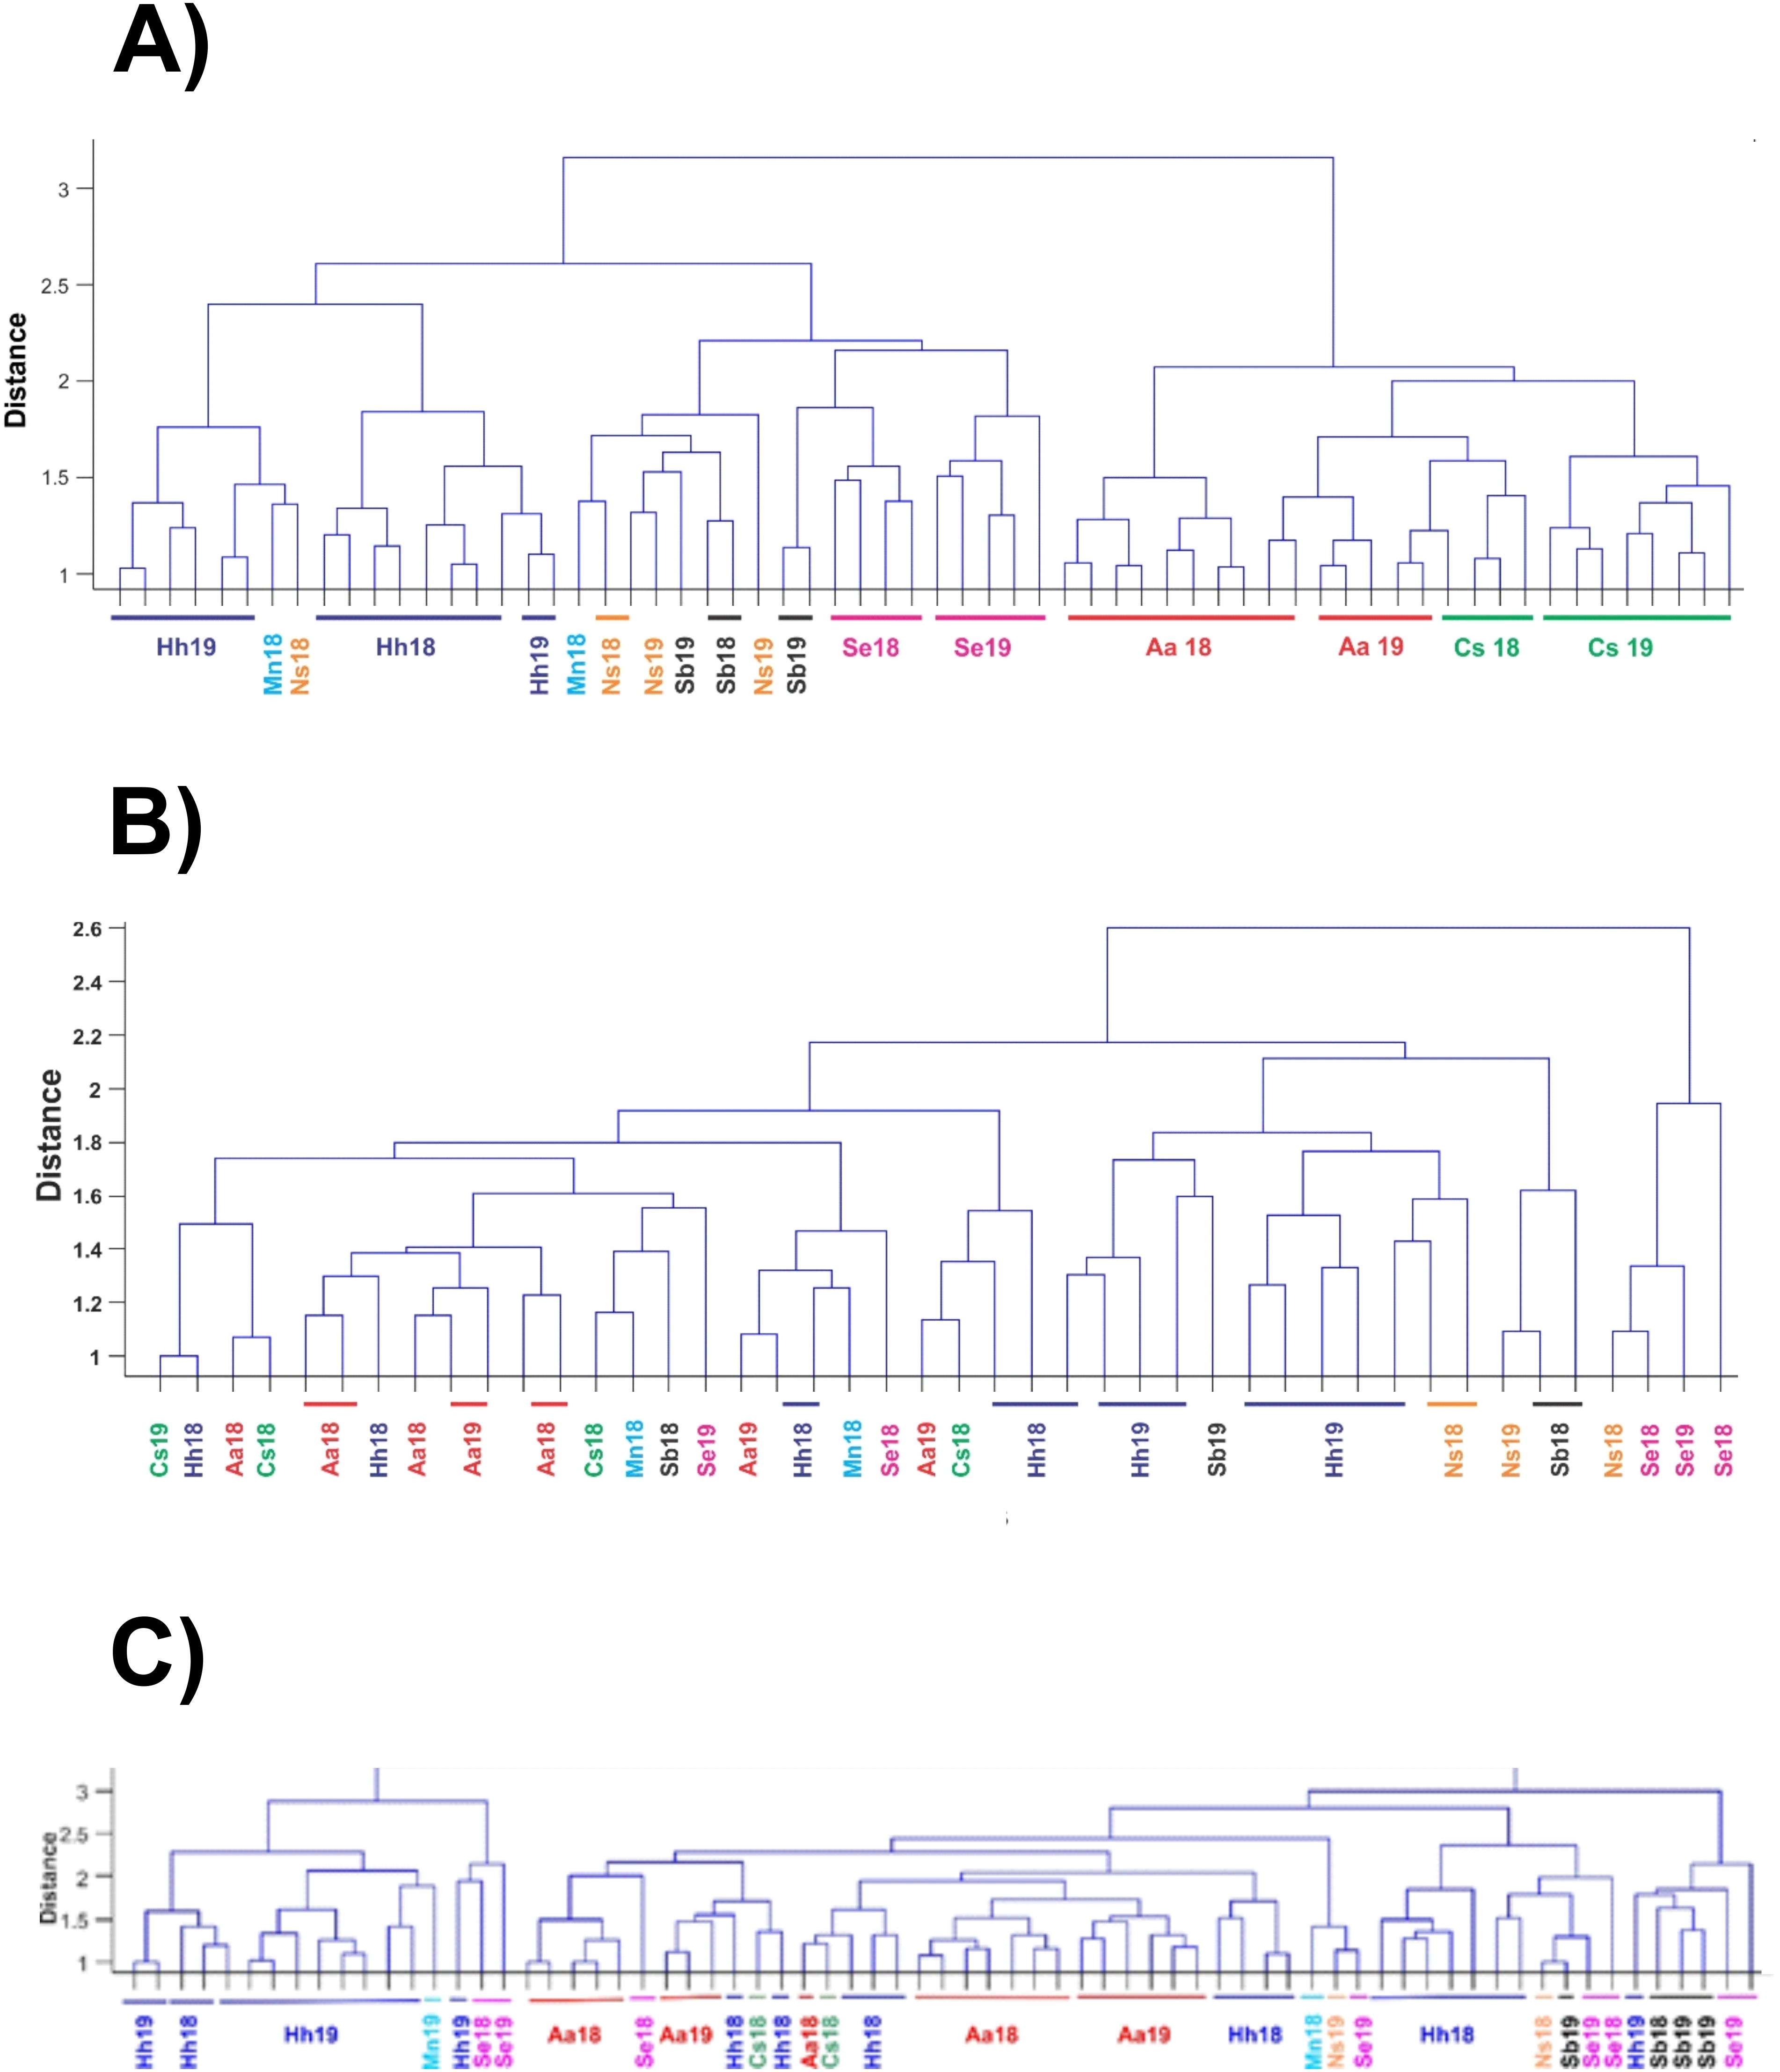
Figure 4. Bray-Curtis similarity cluster plots for fish gut contents of samples collected during 2018 and 2019 based on (A) V9 sequence numbers (Log10 + 1) for 14 prey groups, (B) COI sequence numbers (Log10 + 1) for 8 prey groups, (C) microscopic counts for prey groups, soft-bodied organisms and fish. Sample labels indicate species and year of collection, either 2018 (18) or 2019 (19).
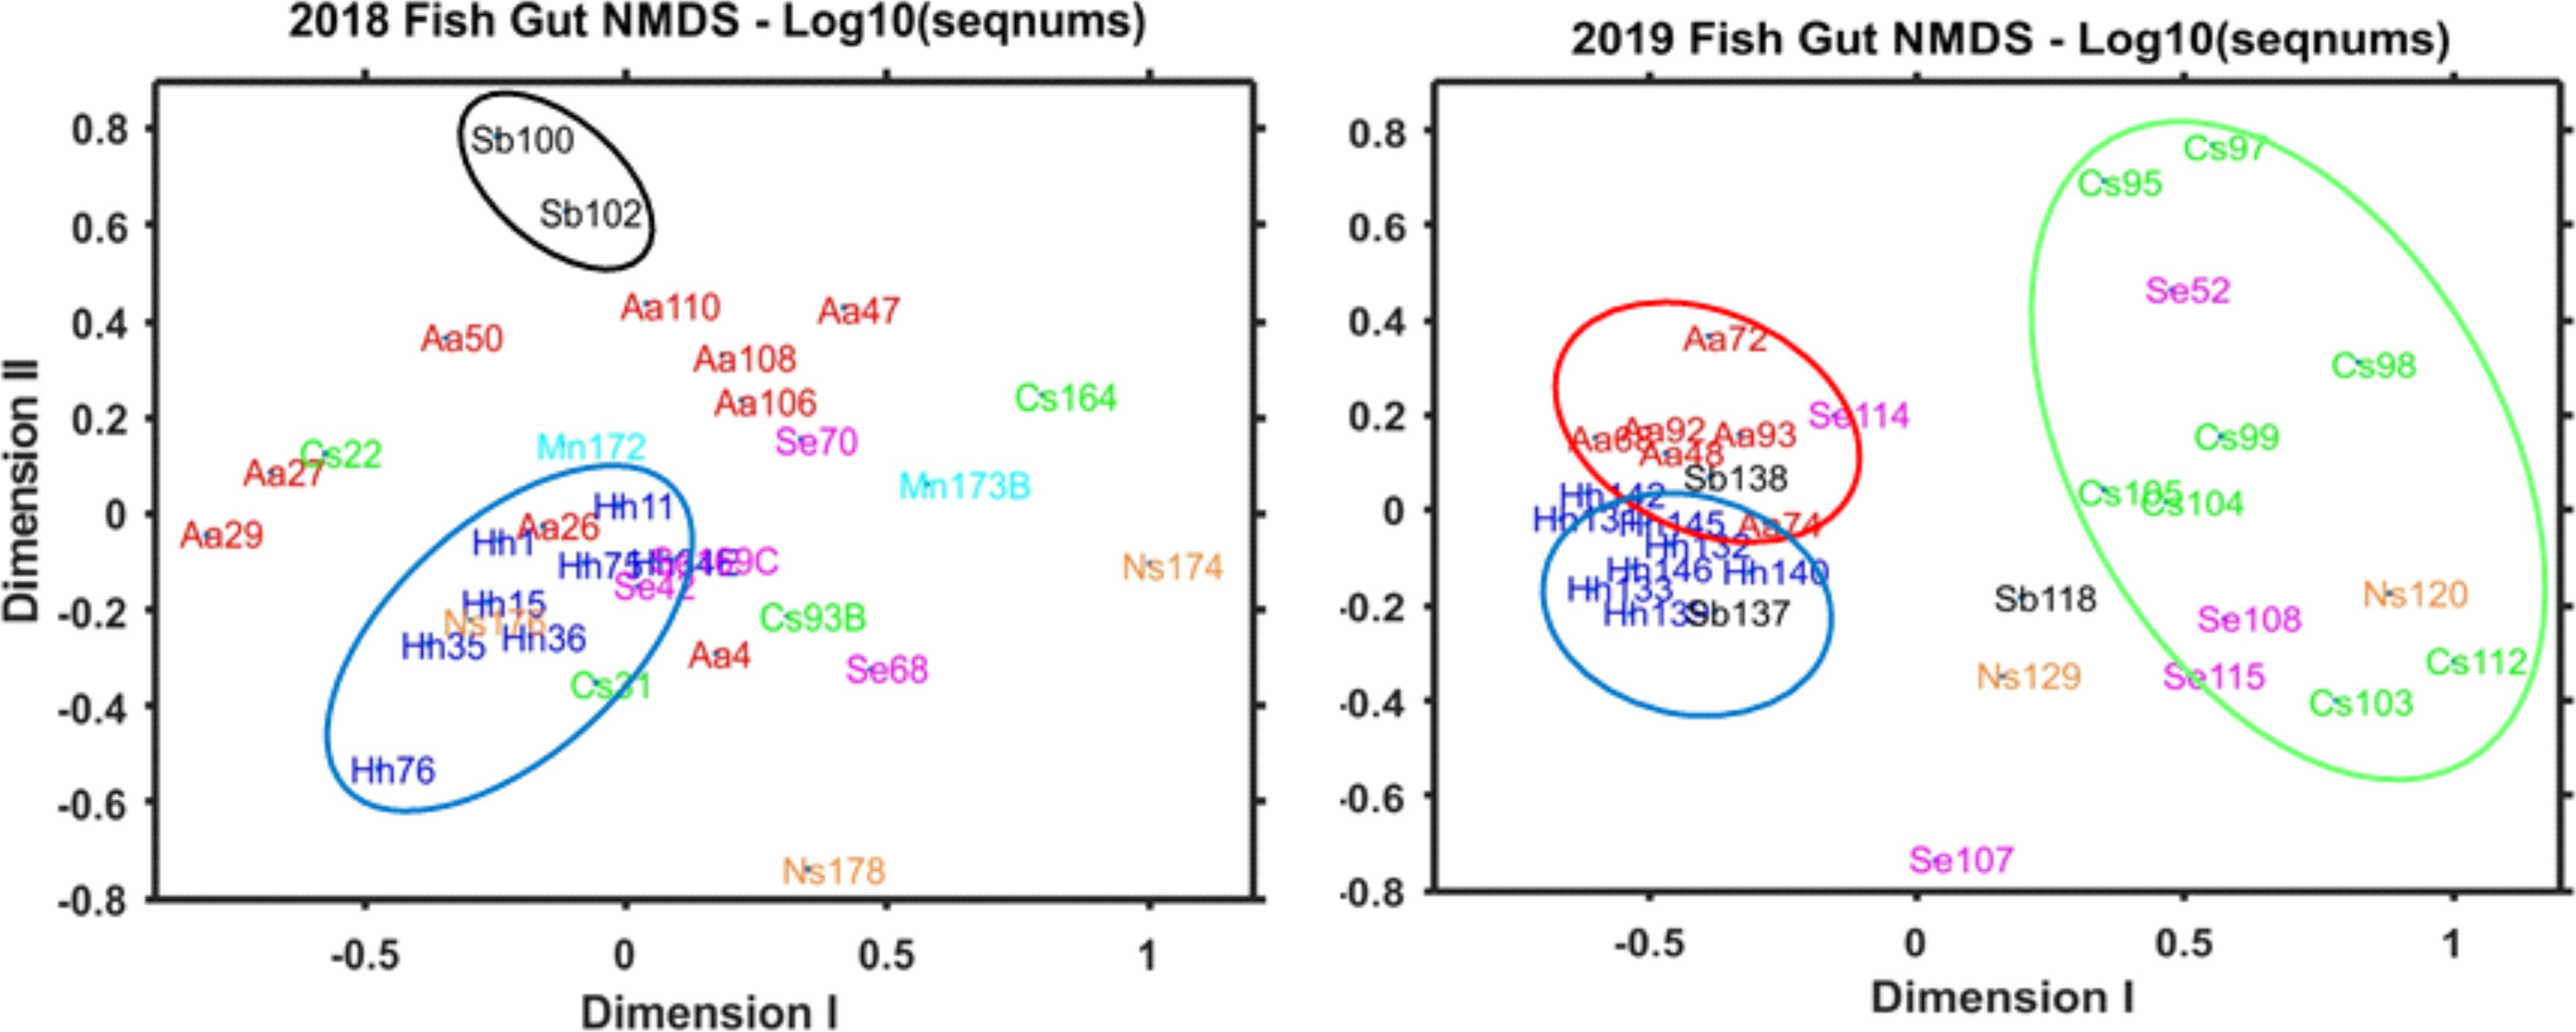
Figure 5. Non-Metric Multi-Dimensional Scaling (NMDS) analysis of V9 sequence numbers (Log10 + 1) for 14 prey groups in fish gut contents for samples collected in 2018 and 2019. See Table 4 for list of prey groups included in the analyses.
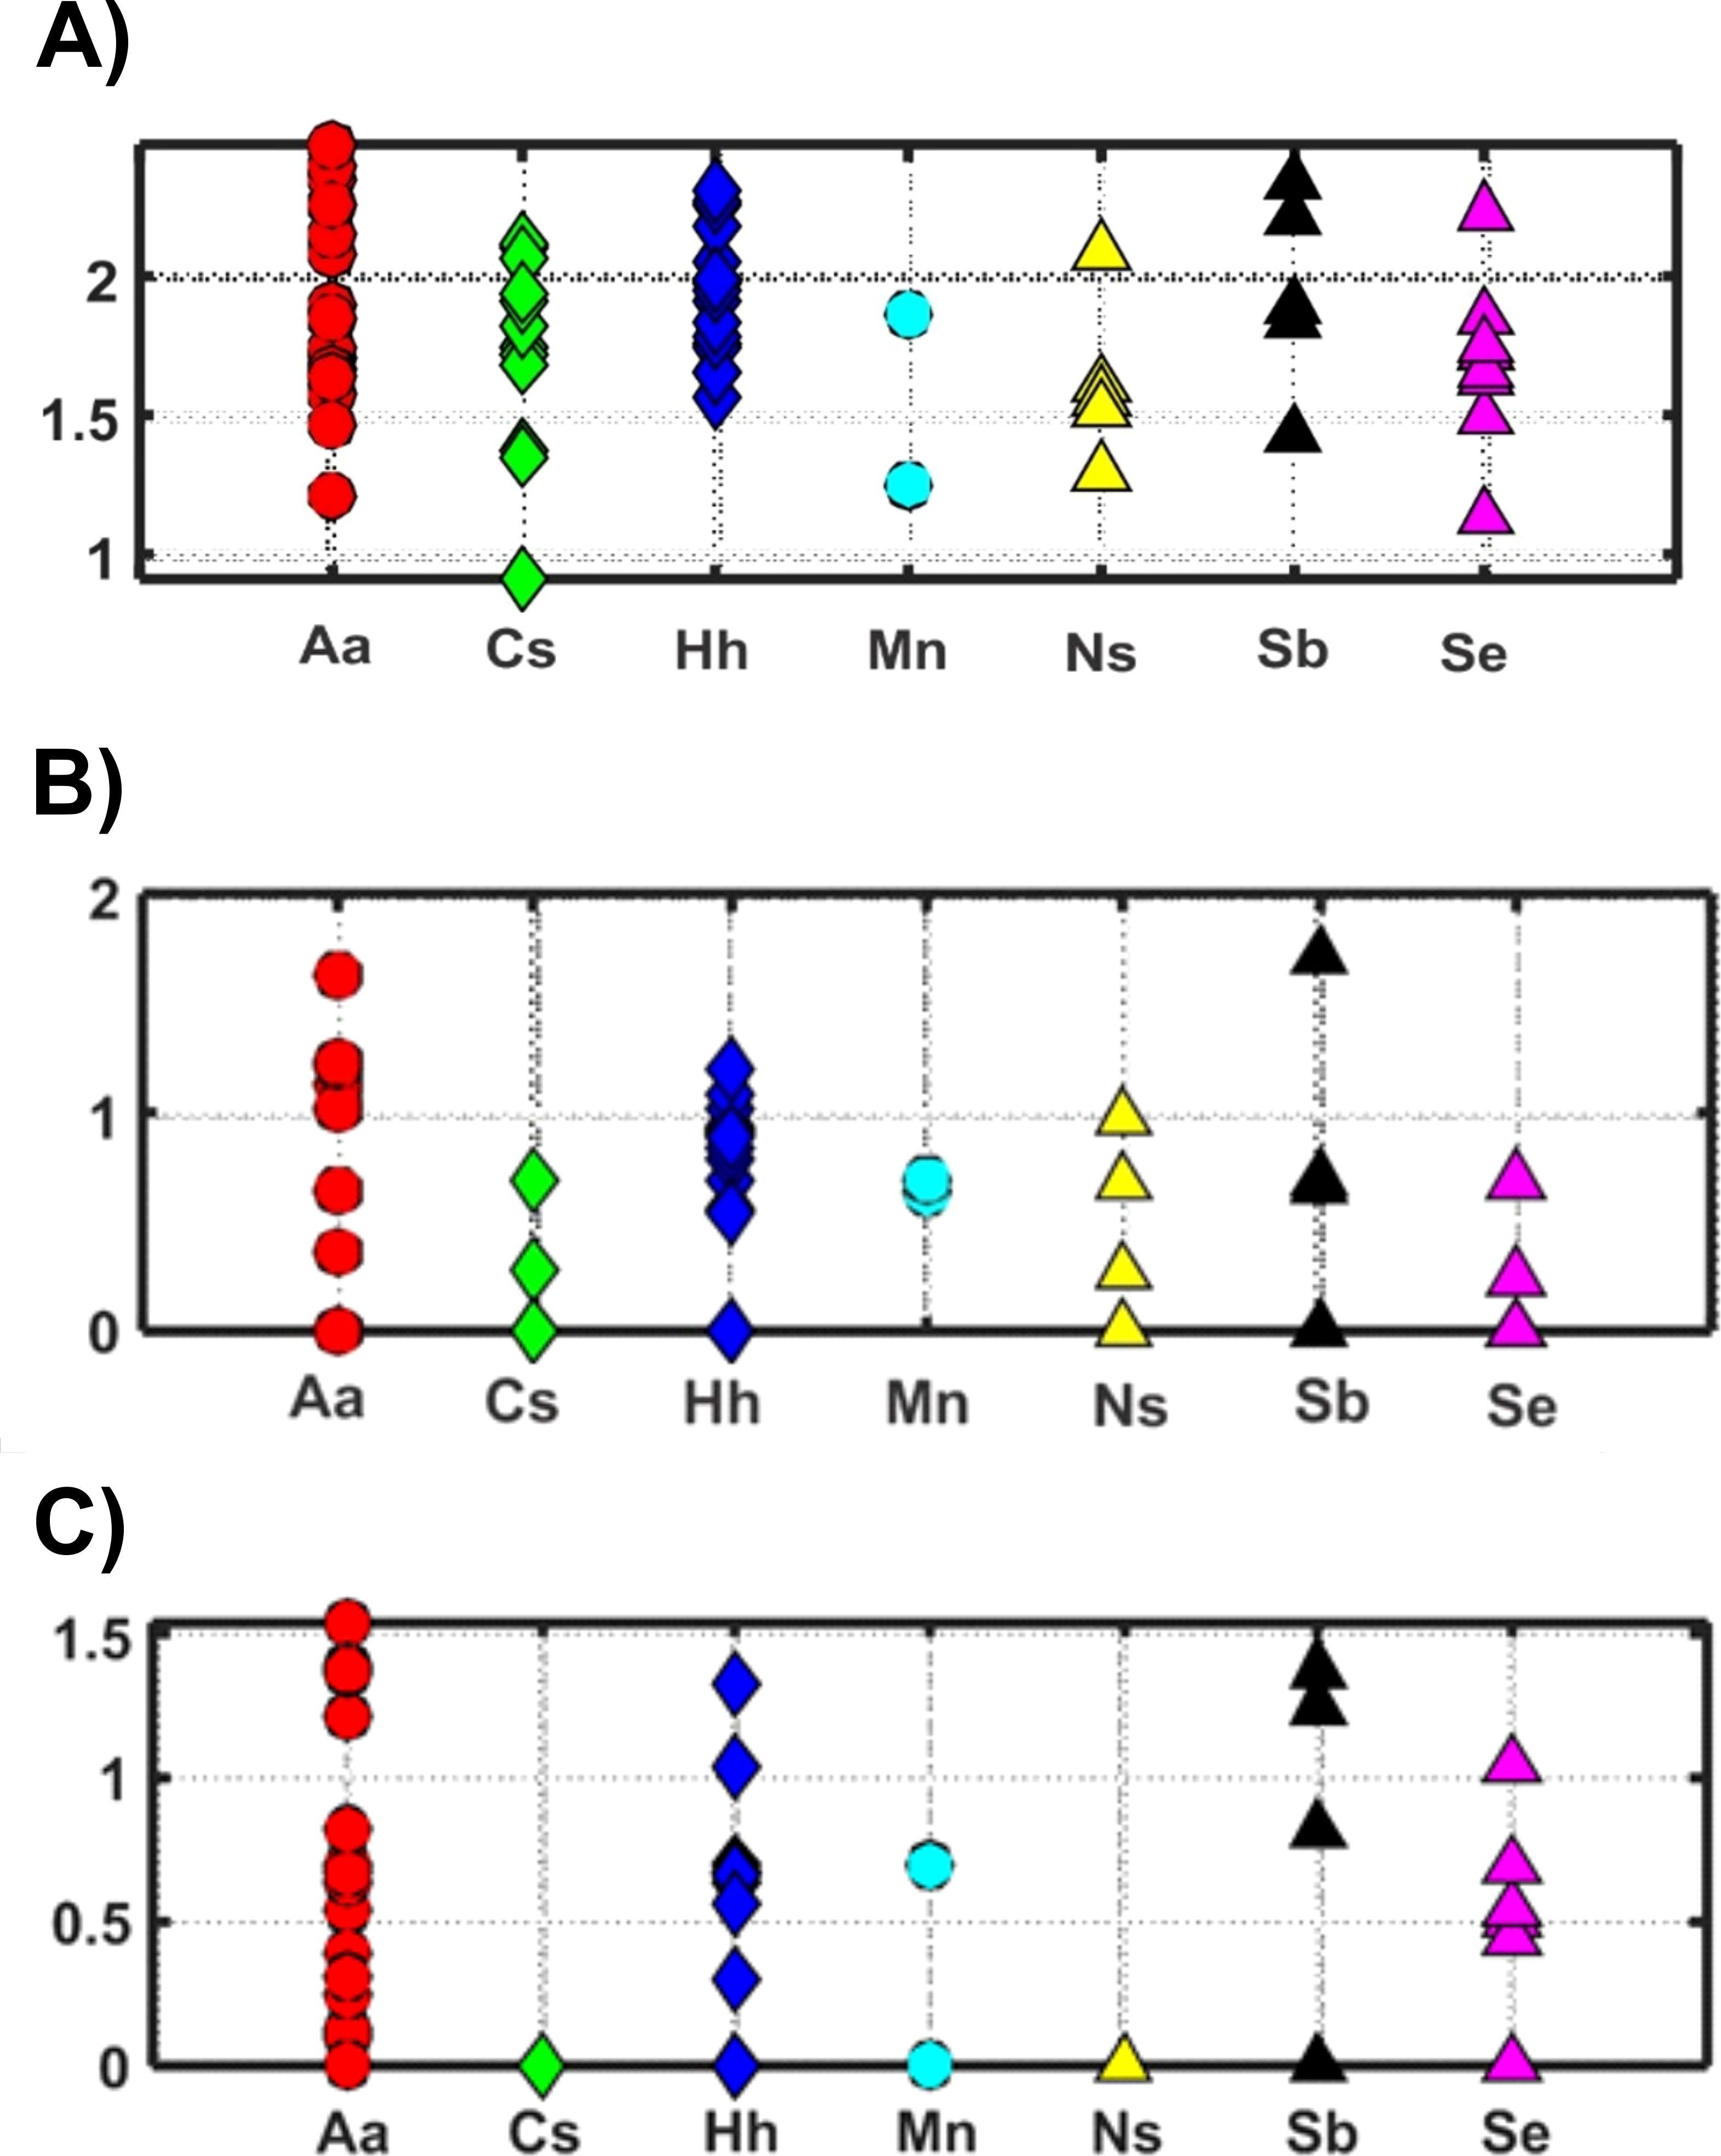
Figure 6. Shannon Diversity Index (H) values for prey detected in fish gut samples collected in 2018 and 2019 based on (A) V9 18S rRNA sequence numbers (proportional occurrences, Log10 + 1) for 14 prey groups; (B) COI sequence numbers (proportional occurrences, Log10 + 1) for 8 prey groups; (C) morphological counts for prey groups, including soft-bodied organisms and fish.
Prey group analysis based on COI
COI metabarcoding yielded sequences that were classified to eight prey groups (Table 4; Figure 7); other groups detected by V9 showed zero COI sequences for all fish analyzed. Fish were not included in analysis; COI sequence numbers for fish as a prey group were very large for all predators (Supplementary Table 2B). Gut contents of A. aculeatus showed COI sequences for 7 of the 8 prey groups detected in at least one sample over the two years, albeit mostly in low sequence numbers. The prey group showing highest COI sequences was eucarids, which were abundant in fish collected during night-time tows in 2018 and 2019. Of 17 C. sloani from both years, COI detected prey in only one specimen, with eucarid sequences from one sample collected during a 2018 night-time tow. Hygophum hygomii showed high COI sequence numbers for eucarids and copepods in most samples from both 2018 and 2019; amphipods were also abundant in three fish from 2018 night-time tows and one fish from a 2019 night-time tow. Small COI sequence numbers were found in three M. niger collected in a 2018 night-time tow, including eucarids, amphipods, hydrozoans, and cephalopods; no fish were analyzed for 2019. COI detected low levels of copepods and eucarids in gut contents of N. scolopaceus for both years, with high numbers for one fish collected in a 2019 day-time tow. Most of seven S. beanii had very low or zero COI sequence numbers for most prey groups, with the exception of one sample collected during a 2019 night-time tow, which included copepods, ostracods, and hydrozoans. Eucarids were detected in gut contents of four of 10 S. elongatus; copepods were found in one fish from a 2018 night-time tow and cephalopods in one fish from a 2019 night-time tow.
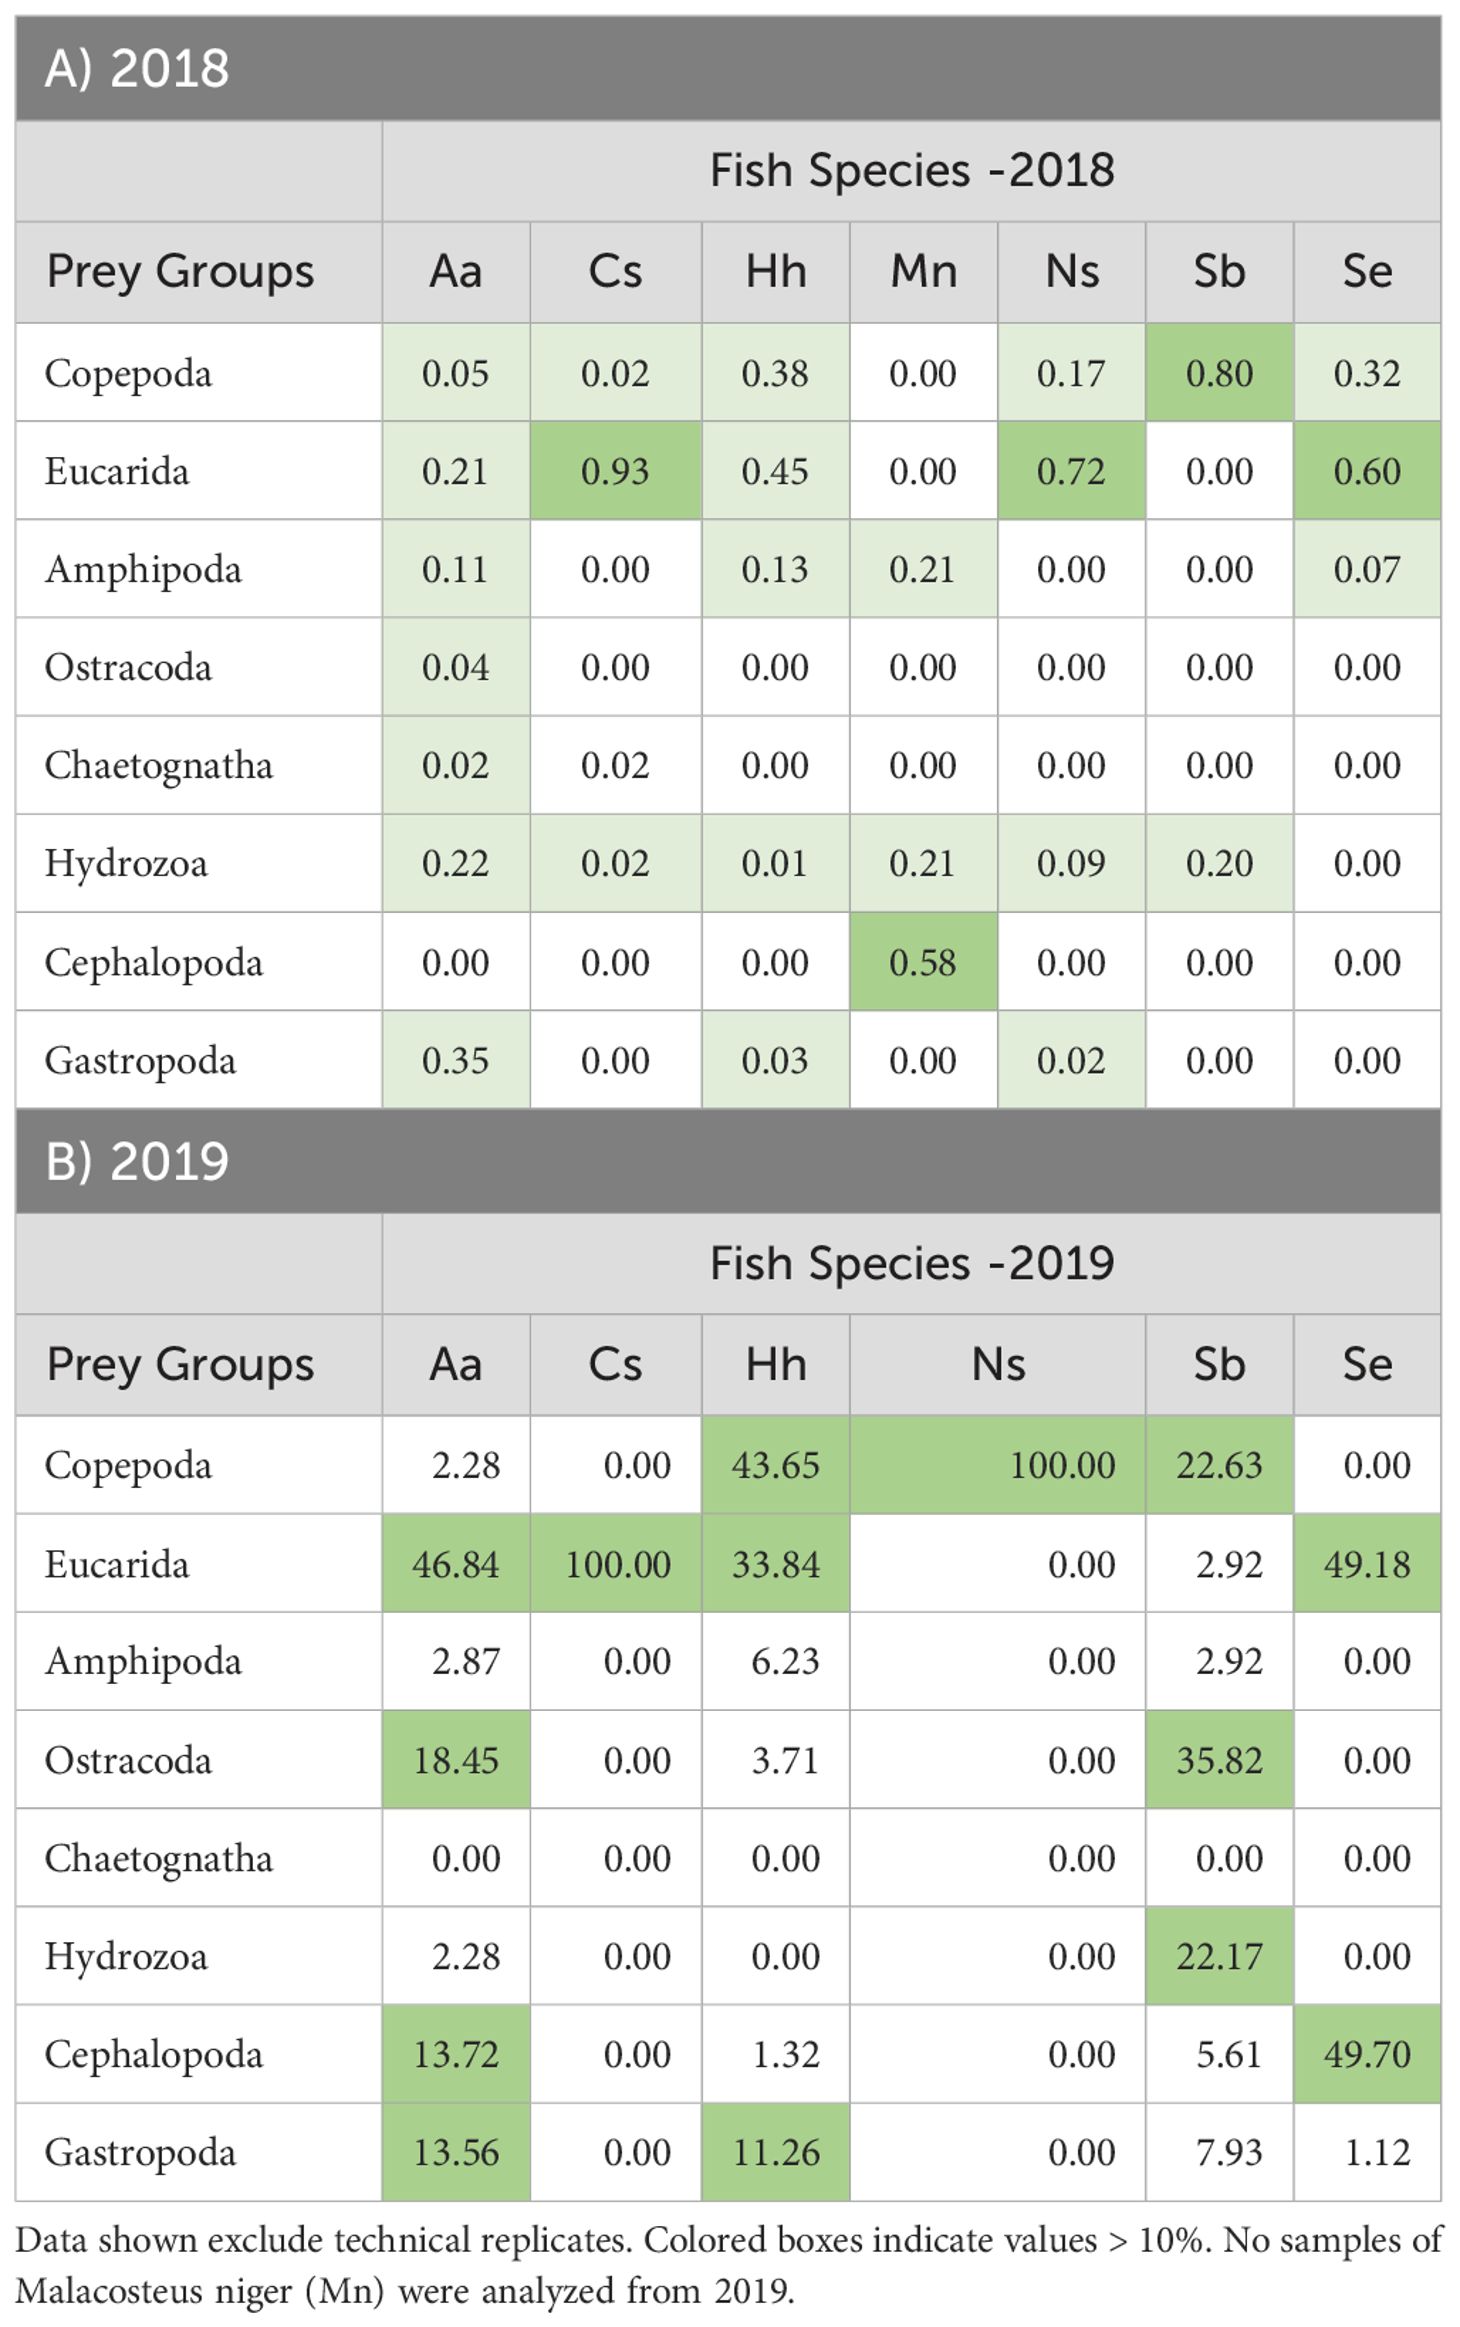
Table 4. Percent occurrence (Log10 + 1 averages) of COI sequence numbers for 8 taxonomic groups of prey organisms for samples of 7 mesopelagic fish species collected during from 2018 (A) and 2019 (B).
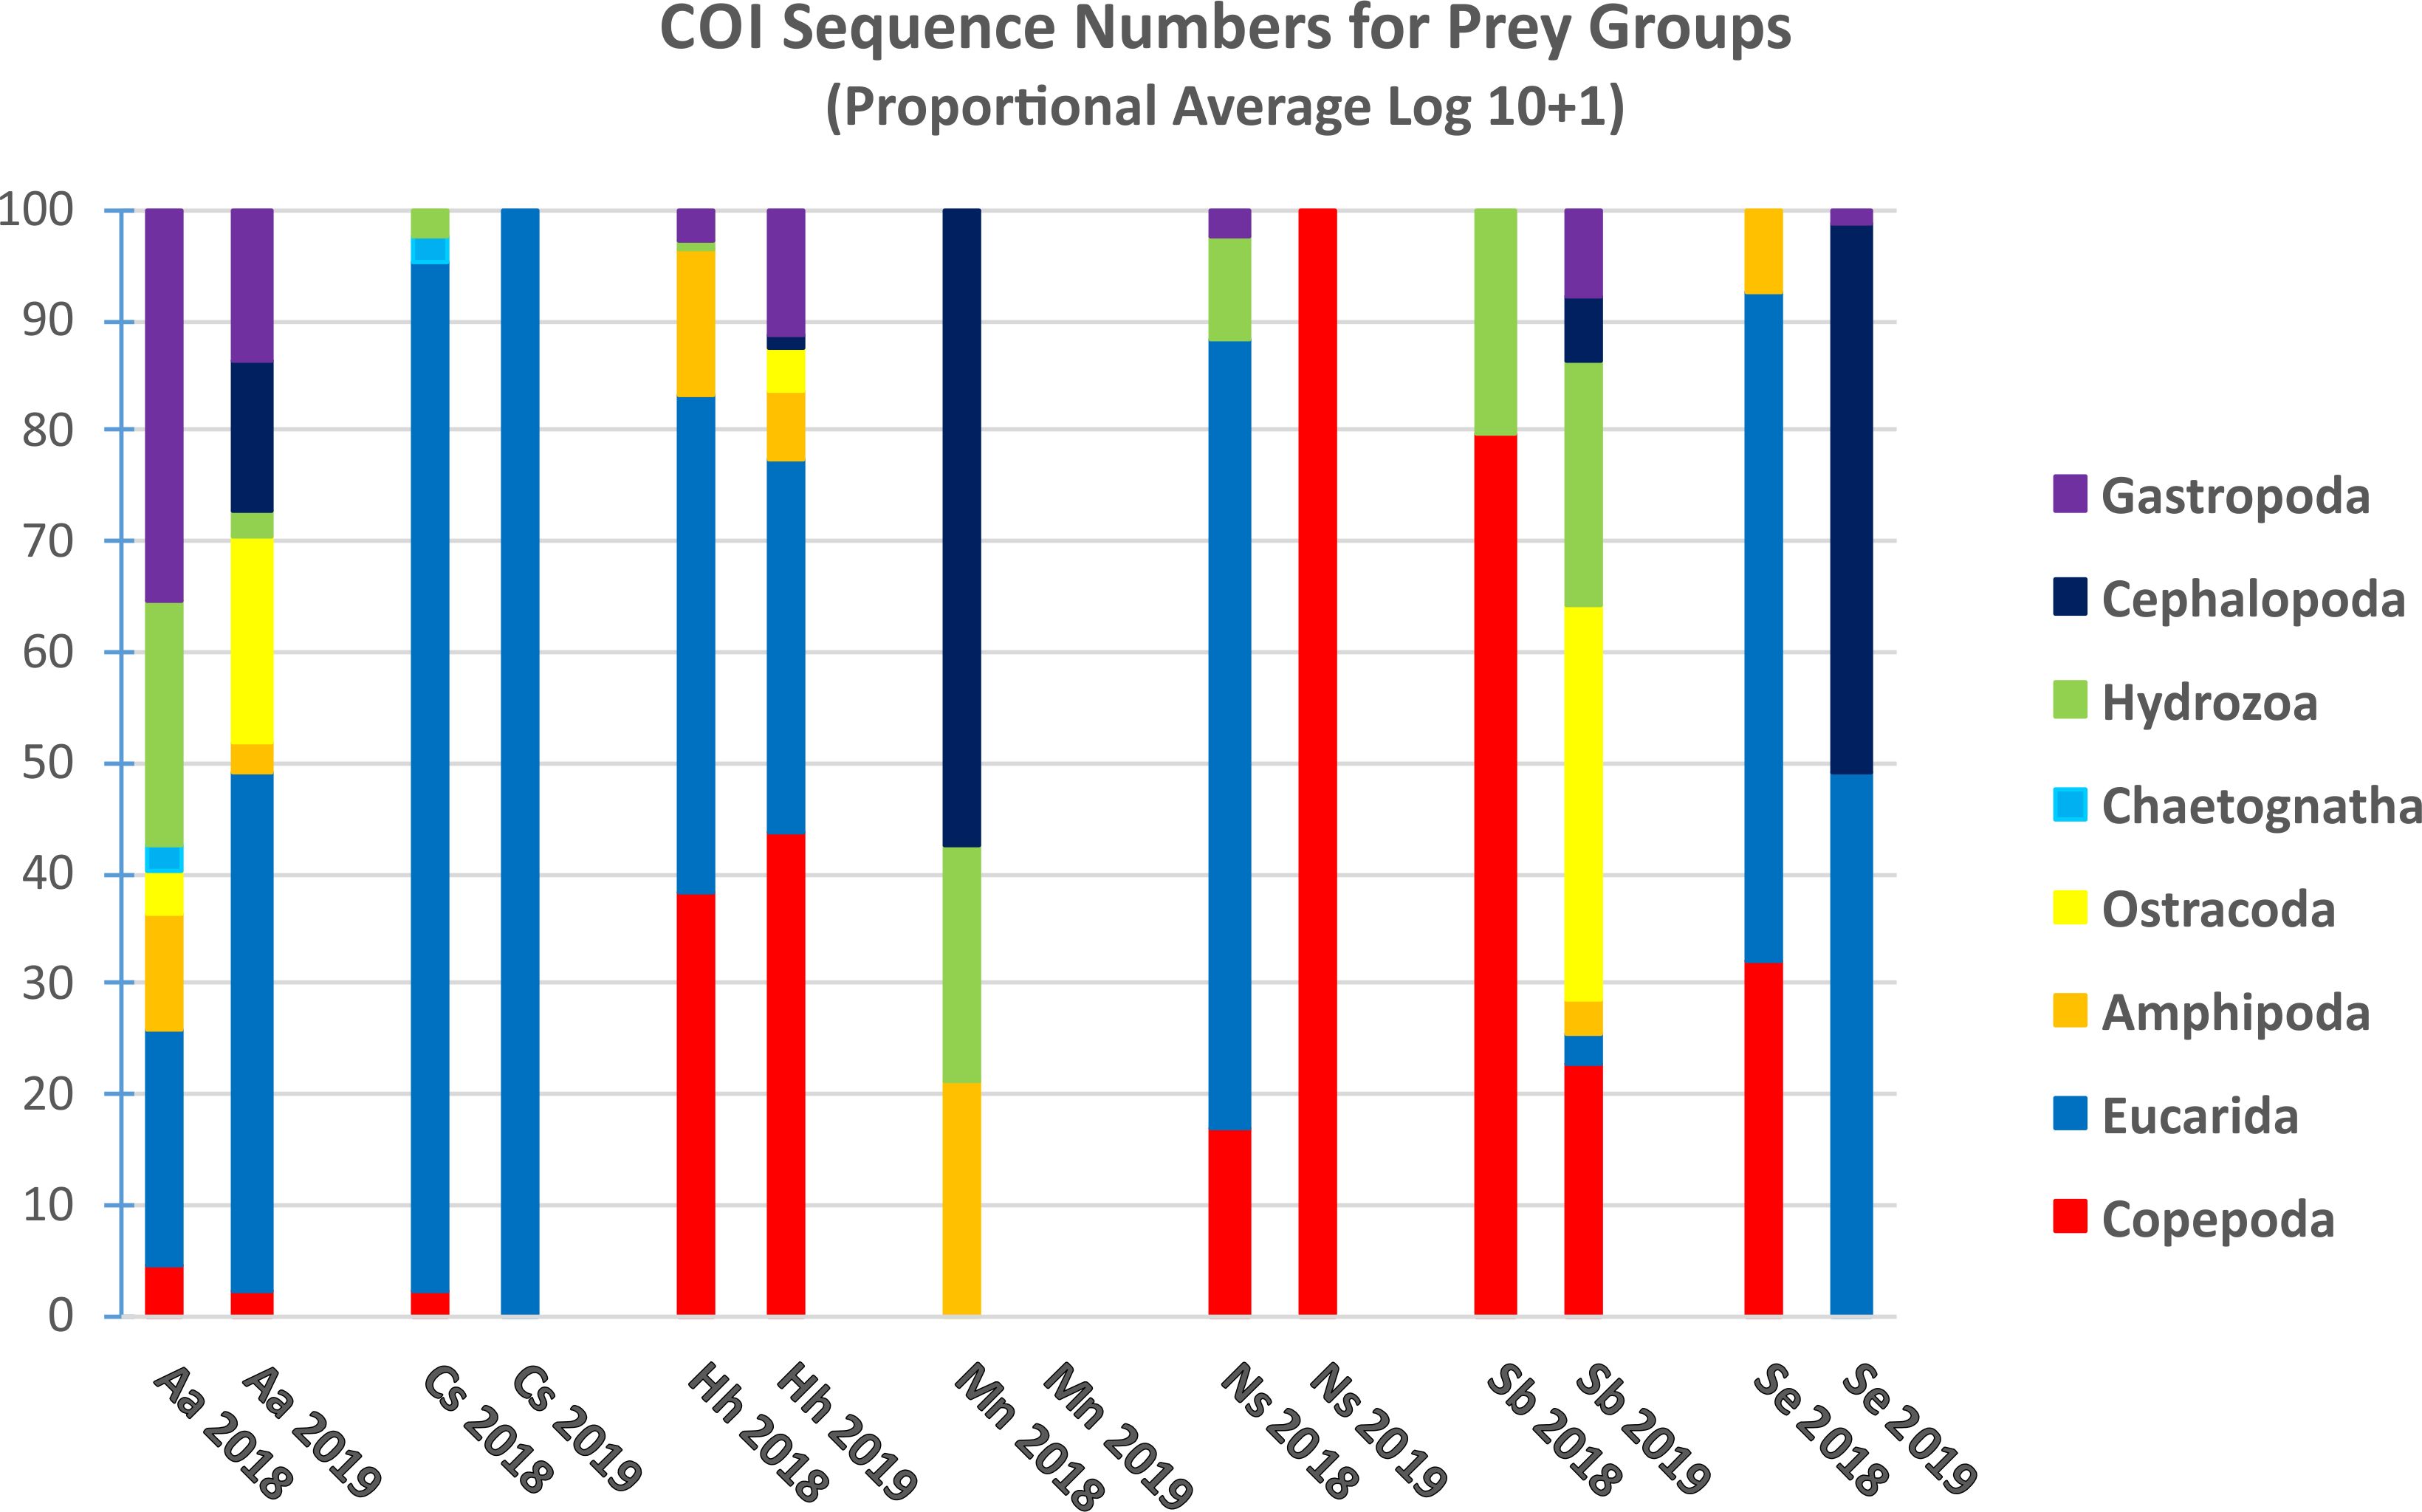
Figure 7. Proportional average numbers of COI sequence numbers (Log10 + 1) for selected taxonomic groups in the gut contents of the 7 predator species collected in 2018 and 2019. No samples of Malacosteus niger (Mn) were analyzed from 2019.
The two-way ANOVA based on 237 individual observations for COI sequences for four predators showed no significant variation among species (p < 0.710) or years of collection (p < 0.632). Three predator species were not included in this analysis: M. niger was not caught in 2019; only one fish for each of C. sloani and N. scolopaceus had non-zero COI sequence numbers for the eight prey groups.
Patterns of diet variation among the predators revealed by Bray-Curtis clustering based on COI sequence numbers showed differences among species and years, but with no clear clustering patterns (Figure 4B). Most notable was the similarity of four H. hygomii collected in 2019 and clustering of A. aculeatus from both 2018 and 2019. NMDS analysis showed no clear patterns within and among predator diets for 2018 and 2019 based on COI, with the exception that H. hygomii clustered together in 2019 (Figure 8). Shannon Diversity Index for fish diets ranged widely for most species, with the exceptions of M. niger, based on only two fish, and C. sloani and S. elongatus, which both showed low diversity (Figure 6B).
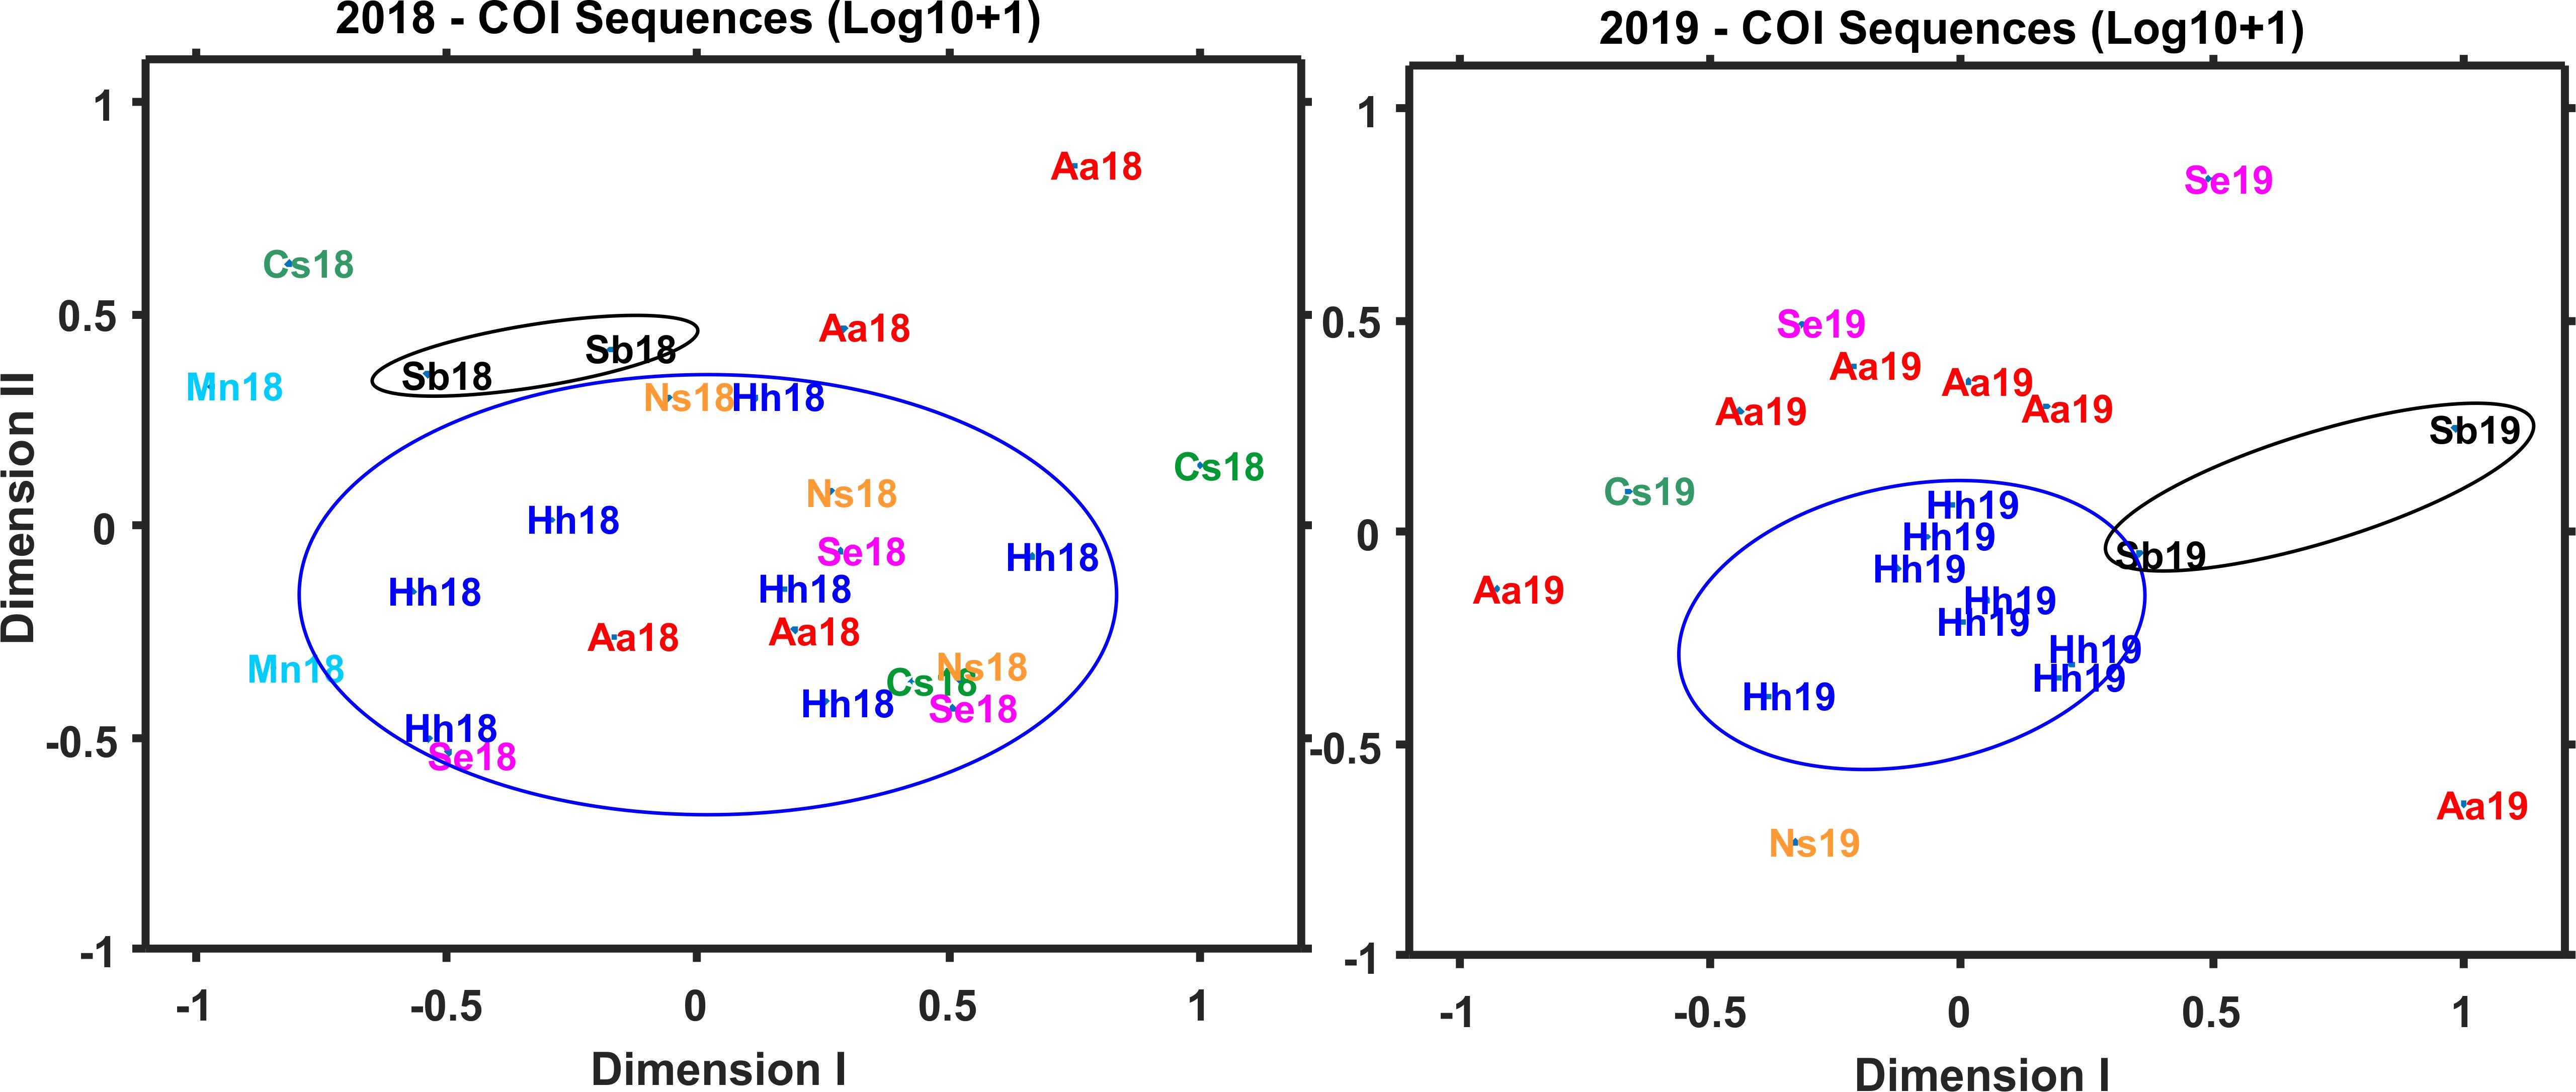
Figure 8. Non-Metric Multi-Dimensional Scaling (NMDS) for COI sequence numbers (Log10 + 1) for 8 prey groups in gut contents of fish collected during both 2018 and 2019. Averages across species include zero values; no samples of Malacosteus niger (Mn) were analyzed from 2019. Samples are identified by abbreviation for the fish species and year of collection.
Prey species identification based on COI
COI metabarcoding of predator gut contents identified a total of 77 prey species, including 49 species of crustaceans (Table 2A). Other prey groups for which species were identified by COI included hydrozoans, cephalopods, gastropods, and fish (11 species, not including predators; Table 2B). Three euphausiid species, Euphausia krohnii, Meganyctiphanes norvegica, and Nematoscelis megalops, were important prey for A. aculeatus, C. sloani, H. hygomii, and S. elongatus. The predator with the highest number of prey species detected was H. hygomii, with a total of 46 species, including 18 species of copepods, 12 species of eucarids; and seven species of amphipods. COI identified several fish species (excluding predators) as prey of M. niger, including Benthosema glaciale and Notoscopelus resplendens. No M. niger were analyzed for 2019. For gut contents of S. beanii, COI detected the copepod species, Calanus finmarchicus and Subeucalanus crassus in the highest frequencies; an ostracod, Conchoecissa ametra, occurred in one sample from 2019.
The highest total average sequence numbers for prey species across all predators were the euphausiids, Euphausia krohnii, Meganyctiphanes norvegica, and Nematoscelis megalops; and the squid, Sthenoteuthis pteropus (Table 5A). For all predator fish samples analyzed from 2018 and 2019 collections, the most usual finding was zero sequences for species of hydrozoans, cephalopods, and gastropods. The highest numbers of COI sequences for prey species in any one predator were the fish, Paralepis coregonoides and Scopelosaurus lepidus, found in A. aculeatus. The COI metabarcoding results included exceptional numbers of sequences for the predators: for six of the seven species, by far the largest number of COI sequences for any species (>10,000) matched the predator (Table 2B). COI cannot distinguish consumed prey from the fish gut tissue (i.e., predator swamping; Albaina et al., 2016; Pereira et al., 2017; Clarke et al., 2020). No correlation was found between COI sequence numbers for fish species and numbers in each sample, suggesting that neither “cod-end feeding” nor damage during collection were occurring, although prey of prey and eDNA sources cannot be excluded.
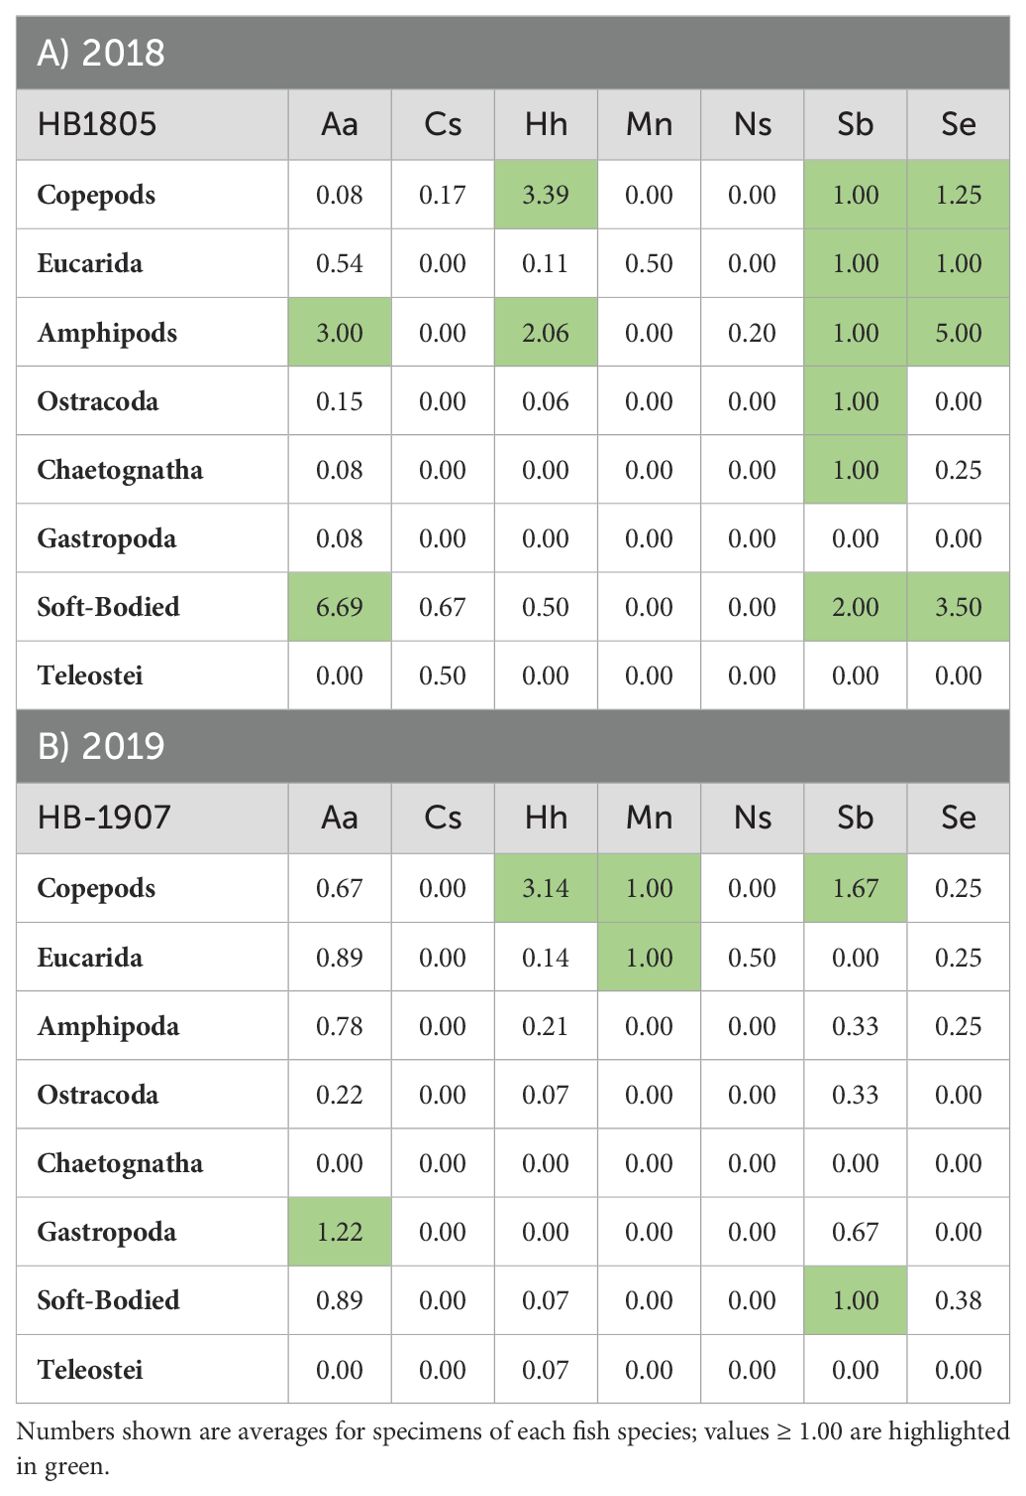
Table 5. Prey counts for selected taxonomic groups based on morphological (microscopic) analysis of gut contents for specimens of the target fish species collected during cruises in 2018 (A) and 2019 (B).
Prey group and species analysis based on morphological counts
Morphological counts of prey were summarized by taxonomic group and averaged across all specimens examined for gut contents of each predator (Table 5; Supplementary Table 3). Counts of A. aculeatus found euphausiids, amphipods, gastropods, and hydrozoans in many of the specimens examined, with highest frequencies of amphipods and soft-bodied prey in 2018 and gastropods in 2019. Counts of C. sloani detected a copepod and soft-bodied prey in two specimens collected in 2018. Most samples of C. sloani examined showed empty guts based on morphological counts. Counts for H. hygomii showed highest averages for copepods and amphipods in 2018 (Table 5A); in 2019, copepods were detected in all H. hygomii examined (Supplementary Table 3). Crustaceans predominated in M. niger, with eucarids detected in both years and copepods in 2019 (Table 5). Microscopic analysis of N. scolopaceus found almost no prey, except for one amphipod in one sample. Crustacean groups and soft-bodied prey were detected in S. beanii each year, with the exception of eucarids in 2019. Morphological counts for S. elongatus reported the same crustacean groups (excluding ostracods) and soft-bodied prey in both years.
Based on proportional numbers of prey groups discriminated by microscopy, there were some clear differences among the predators (Figure 9). In both 2018 and 2019, soft-bodied prey were found frequently in A. aculeatus, S. beanii, and S. elongatus, rarely in H. hygomii, and were absent from M. niger and N. scolopaceus (Table 5; Figure 9). Statistical analysis of counts by species and years was not possible by ANOVA due to many zero values. The Bray-Curtis coefficient (Bray and Curtis, 1957; McCune et al., 2002) and resulting cluster diagram showed intermixing of diet diversity for all 7 species (Figure 4C). The NMDS analysis showed similarity of prey composition for A. aculeatus and H. hygomii in both 2018 and 2019, albeit with some outliers (Figure 10). The Shannon Diversity Index (Pielou, 1977) showed broad ranges for species with the largest sample sizes, A. aculeatus and H. hygomii (Figure 6C).
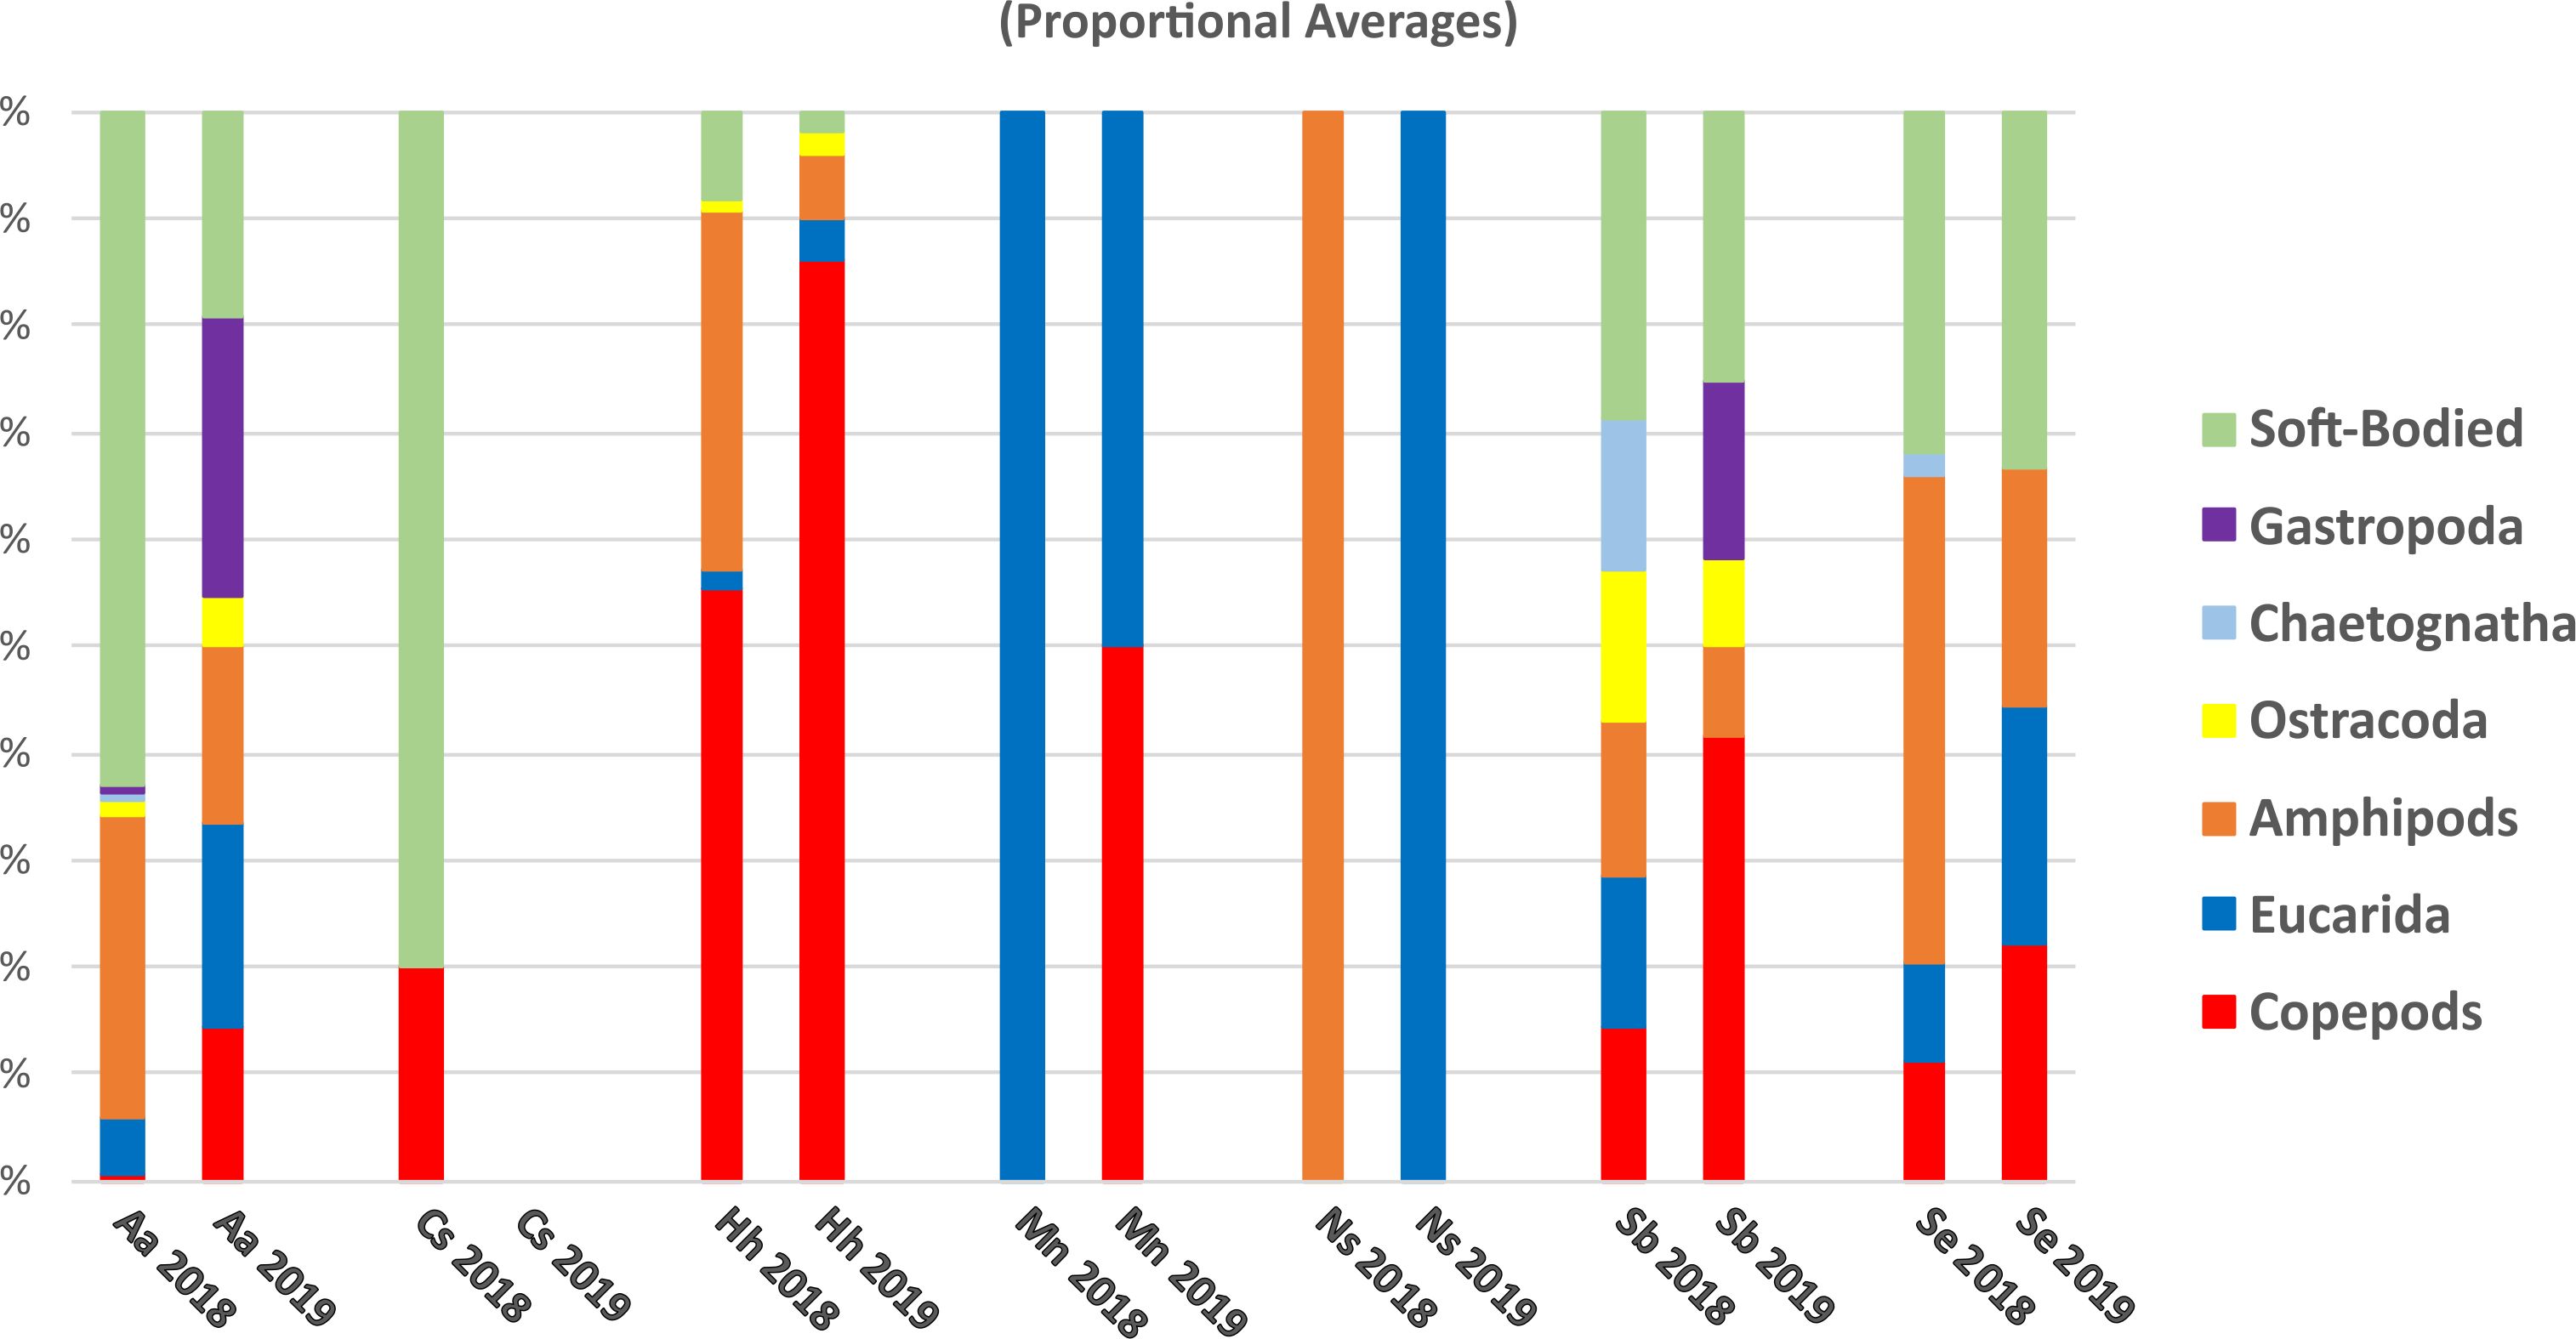
Figure 9. Proportional average counts of prey items by taxonomic group based on morphological (microscopic) analysis of gut contents for specimens of each predator species collected during 2018 and 2019.
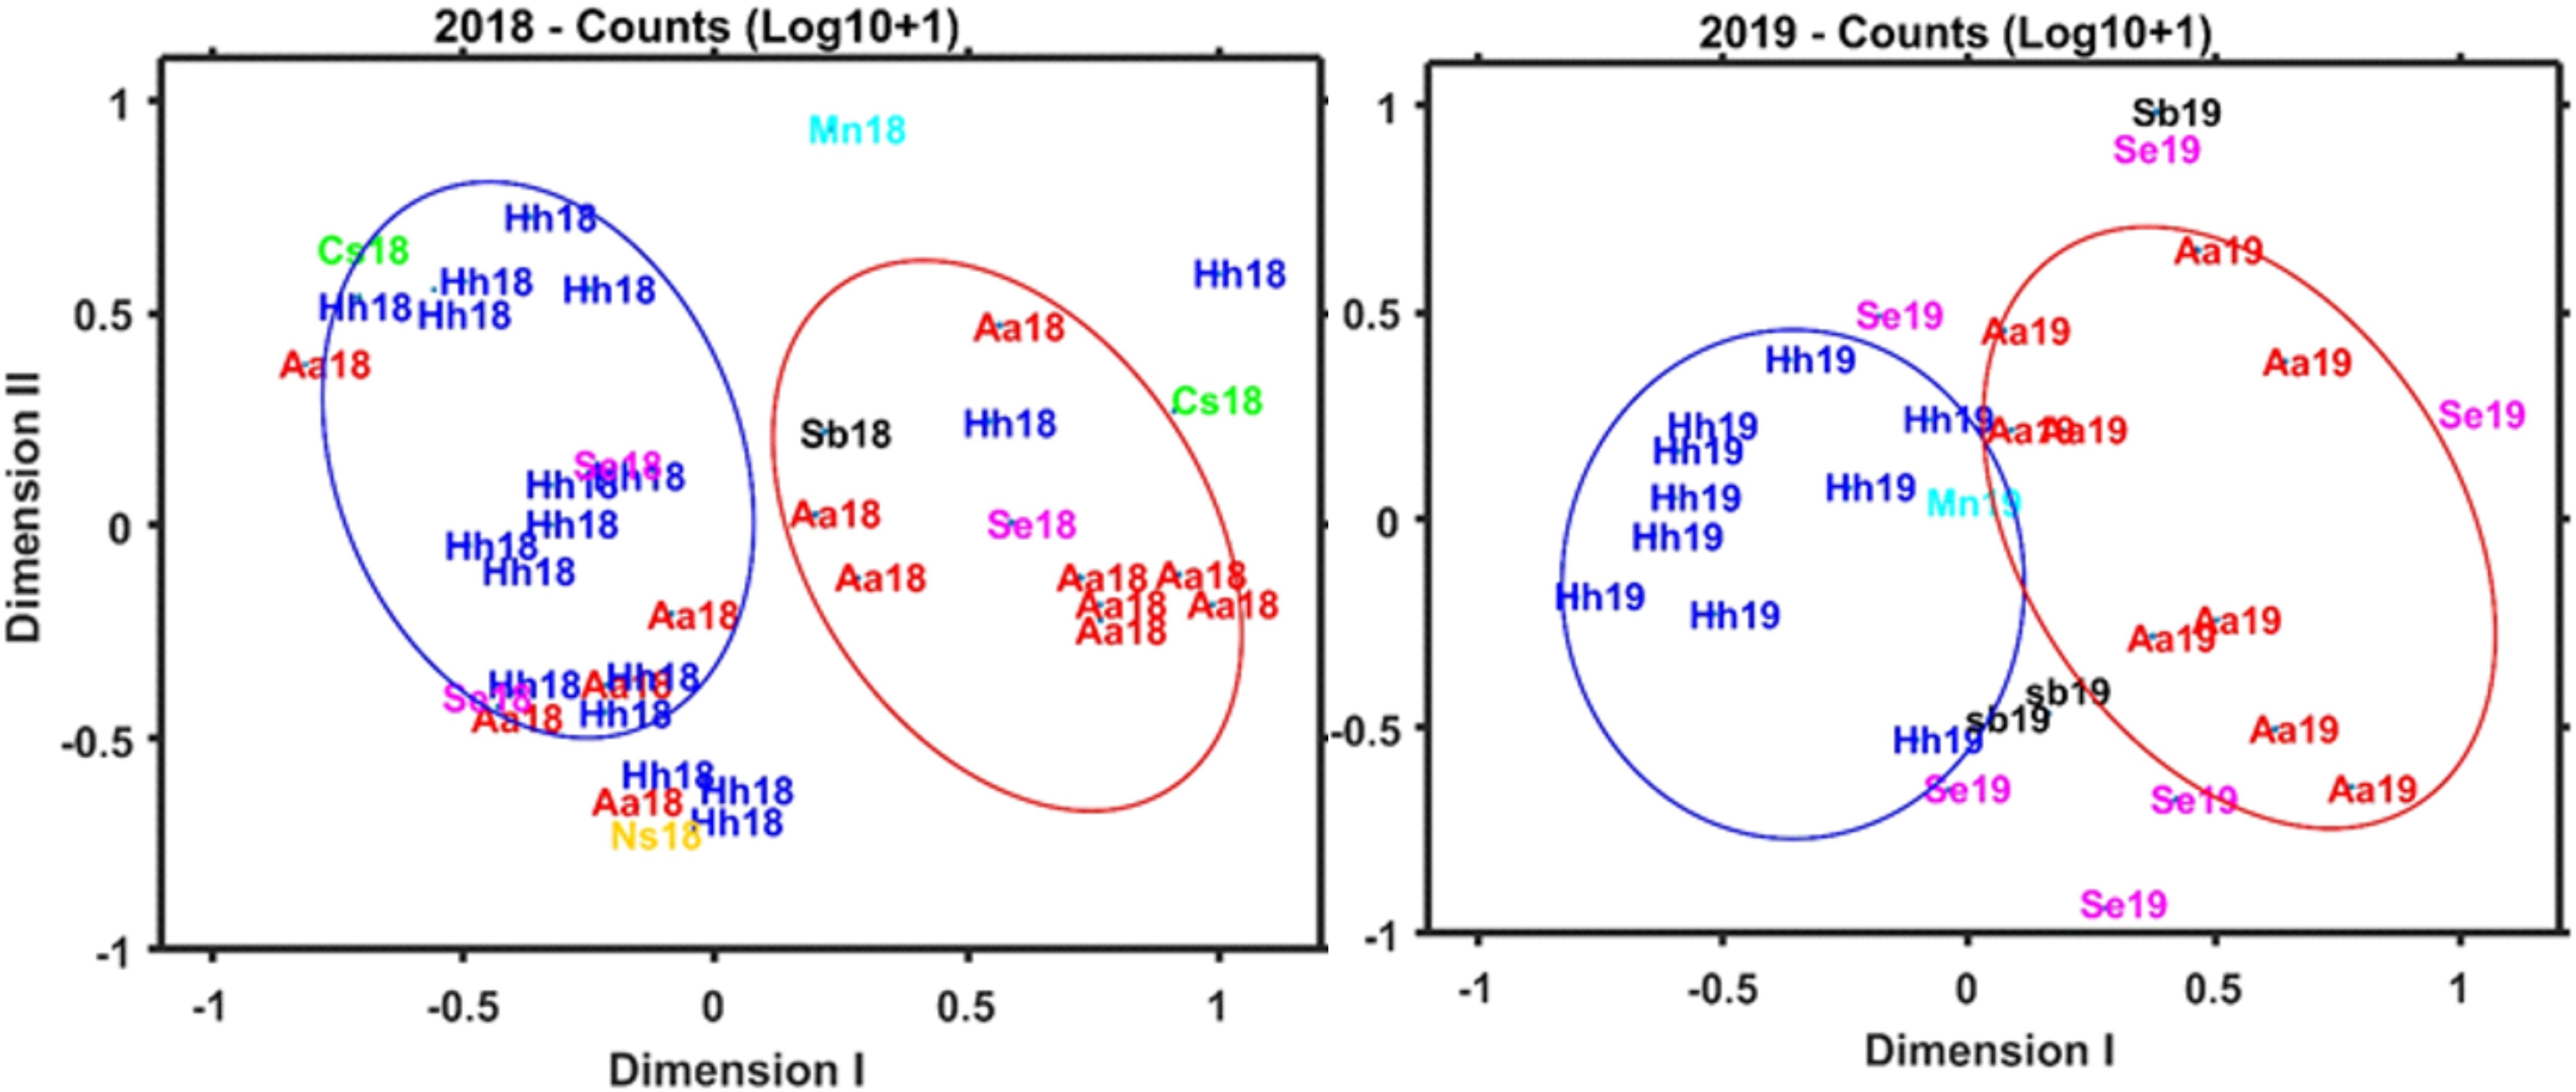
Figure 10. NMDS plots for morphological counts for prey groups, including soft-bodied organisms and fish, for samples collected during 2018 (A) and 2019 (B).
Additional analysis of diet variation
Statistical tests of the relationship between sizes of fish sampled (measured as standard length, SL) and the Shannon Index of prey diversity based on V9, COI, and morphological counts revealed no significant relationships based on multi-dimensional regression analysis. None of the regressions were significant, indicating no relationship between the diversity of prey and fish standard length for any predator collected over the two years.
The similarity of the hydrographic structure at the collection sites in 2018 and 2019 (Figure 2) allowed direct comparisons between years. Statistical analyses carried out to evaluate variation in prey group composition based on V9 and COI in relation to collection parameters, including time (day versus night) and depth of tow, did not reveal any significant relationships. Patterns of variation of prey species diversity based on COI also showed no consistent relationships with time of collection or depth of the tow for any predator.
Discussion
Integrative analysis of mesopelagic fish diets
Mesopelagic fishes are key players in deep sea food webs and have significant impacts on ecosystem function. They are known to be important prey for higher trophic levels (Iglesias et al., 2023) and transporters of organic material in the open ocean (Saba et al., 2021), although knowledge is incomplete of their trophic relationships and the composition of their diets (Goetsch et al., 2018; Clarke et al., 2020; Robison et al., 2020). Molecular approaches are widely recognized to have yielded new understanding of trophic interactions in ocean ecosystems (Symondson and Harwood, 2014), with promise for continued successful development (Roslin et al., 2019). An important contribution of metabarcoding for analysis of the diets of mesopelagic fishes is the confirmation of the importance of gelatinous zooplankton, which are difficult to detect – and certainly identify – in morphological analysis of fish gut contents (Choy et al., 2017). V9 can provide accurate and semi-quantitative (i.e., proportional frequencies) detection of prey across a broad phylogenetic spectrum, including microbes, protists, and metazoans (Bucklin et al., 2019; Blanco-Bercial, 2020; Govindarajan et al., 2021). Hydrozoans and salps were shown to be significant food sources for all predators, while ctenophores were abundant in several species (A. aculeatus, C. sloani, S. beanii). COI also revealed species of some – but not all – gelatinous groups, including three species of hydrozoans, Lensia achilles, Nanomia cara, and Rhopalonema velatum, in S. beanii; Sthenoteuthis pteropus (Cephalopoda) was identified as a primary prey of S. elongatus and also found in A. aculeatus. These findings confirmed the broad prey diversity of some mesopelagic fish species and provided detailed information supporting the importance of gelatinous zooplankton in mesopelagic food webs (Purcell and Sturdevant, 2001; Choy et al., 2017).
Metabarcoding analyses that identify prey species can also support the important goal of determining sources of primary productivity supporting mesopelagic biomass. For instance, the primary prey species found in gut contents of H. hygomii included the surface-dwelling, non-migrating copepod, Nannocalanus minor (Ambler and Miller, 1987) and the mid-depth, non-migrating euphausiid, Nematoscelis megalops (Endo and Wiebe, 2007). Although H. hygomii exhibits DVM and the net tows varied in both time and depth, there were no apparent trends in prey for day versus night. Our findings suggest that this species feeds predominantly in surface waters at night with little feeding at their daytime depth. Another predator, A. aculeatus, showed large numbers of COI sequences for two euphausiids: non-migrating N. megalops and migrating Meganyctiphanes norvegica (Tarling et al., 1999). Large numbers of COI sequences were found in N. scolopaceus for both migrating and non-migrating prey: the decapod shrimp, Acanephyra purpurea, which shows DVM (Roe, 1984) and a non-migrating deep-dwelling fish, Paralepis coregonoides (Harry, 1953). The gut contents of the non-migrating predator S. beani contained representatives of all prey groups analyzed, including both migrating and non-migrating species with extensive (>1,000 m) vertical ranges: the hydrozoan Rhopalonema velatum (Lučić et al., 2009); ostracod Conchoecissa ametra (Chavtur and Mazdygan, 2015); copepod Calanus finmarchicus (Fiksen and Carlotti, 1998); and fish Scopelosaurus lepidus (Gordon and Duncan, 1985). Taken together, our data revealed a food web that is apparently well-connected across depth zones in the open ocean (Sutton, 2013; Kelly et al., 2019).
COI metabarcoding can also reveal unexpected prey species in the diets of mesopelagic predators. For example, S. elongatus is known to consume fish and larger invertebrates: two euphausiids, Euphausia krohnii and M. norvegica, were found to be important prey, as well as the squid, Sthenoteuthis pteropus, which was not previously reported. The finding of the fish Benthosema glaciale in the gut contents of C. sloani is consistent with descriptions of the predator as a piscivore, but seven species of euphausiids were also detected by COI. Malacosteus niger has previously been recorded as consuming a variety of crustacean zooplankton, especially copepods (Sutton, 2005); COI sequences identified five fish prey species, excluding the predator species.
Food web dynamics based on molecular data have been examined using ecological networks, where trophic interactions are visualized by pairwise links between species of interest (Clare et al., 2019; Cuff et al., 2022; Dunne et al., 2022), including mesopelagic fish predators and prey (Deagle et al., 2019; Clarke et al., 2020). This study used ecological network analysis of V9 results for the seven predators and 14 prey groups to analyze the relative importance of the many trophic linkages between predators and prey. This view of the food web at the study site shows linkages and interactions that may also apply to other regions and pelagic zones of the Atlantic Ocean.
A fundamental question regarding mesopelagic food web dynamics is whether fish predators exhibit prey selectivity. One approach is to compare biodiversity of the pelagic assemblage with prey composition found in predator gut contents. The relative importance of prey groups in 2018 reported here showed good correspondence with relative abundances of the organisms in the water column, as reported by Govindarajan et al. (2021) based on V9 metabarcoding of MOCNESS samples and environmental DNA (eDNA) collected at the same stations during the HB-1805 cruise. Information on biodiversity of the pelagic assemblage and potential prey groups or species is not available for the 2019 collections during the HB-1907 cruise. In 2018, copepods and ctenophores dominated results of V9 metabarcoding of MOCNESS samples (Govindarajan et al., 2021); these groups also showed high V9 sequence numbers for gut contents of all fish species that we sampled. Hydromedusae and siphonophores were also highly abundant in V9 metabarcoding of eDNA samples (Govindarajan et al., 2021), but these groups were not detected in gut contents.
The selection of target gene regions is an important consideration for metabarcoding: V9 can reliably classify metazoan organisms by taxonomic group, with levels varying among different phyla (deVargas et al., 2015). A 313 bp region of mitochondrial COI (Geller et al., 2013; Leray et al., 2013) has been widely used for metabarcoding analyses of marine metazoan diversity (Hirai et al., 2015; Lindsay et al., 2015; Stefanni et al., 2018; Suter et al., 2021). The shorter COI sequences are somewhat less accurate and reliable for species identification than the COI barcode region of ~675 bp (Bucklin et al., 2011). The eight prey groups analyzed for COI metabarcoding in this study are a subset of the 14 prey groups detected by V9; the missing groups were not detected by COI (i.e., zero sequences for all fish analyzed). The lack of detection across all taxonomic groups of Metazoa was expected, based on previous studies of zooplankton diversity using this COI gene region (Djurhuus et al., 2018; Questel et al., 2021). The analysis of prey using COI metabarcoding must be interpreted cautiously for all metazoan groups, especially including non-crustaceans (Bucklin et al., 2016, 2021a).
Metabarcoding of any gene region relies on PCR amplification, which can introduce errors, including mismatches between the PCR primer and the target sequence (Taberlet et al., 2012). Also noteworthy is the possibility of DNA degradation, either in ocean waters or in stomach contents of predators. The accuracy and reliability of classification and identification of groups or species based on metabarcoding is also dependent upon the taxonomic completeness and geographic coverage of the reference sequence databases, which must include sequences for specimens identified by morphological taxonomic experts (Bucklin et al., 2011, 2021b). The recent release and regular updating of the MetaZooGene Database and Atlas (MZGdb) provides increasing confidence in the accurate detection and identification of species and groups across the phylogenetic assemblage of marine organisms (Bucklin et al., 2021b).
Future research
Metabarcoding provides a powerful means of tracing trophic pathways and discovering sources of productivity in the deep ocean. Combined use of metabarcoding and microscopy will continue to provide more rigorous and complete reconstruction of mesopelagic food webs than either approach can provide in isolation. The results reported here from integrative analysis using metabarcoding and microscopic counts of gut contents of mesopelagic fishes allowed analysis of primary prey groups and important prey species that sustain the fish species studied. Detailed molecular and morphological taxonomic analysis of net samples from the same depth zones can be used to address questions of prey selectivity.
Future field collections using depth-stratified sampling and carefully-timed deployments to capture both predators and prey with respect to DVM behaviors will be required to determine the extent of selective predation. Environmental differences at the collection sites in 2018 and 2019, including weather and other environmental conditions, may have impacted prey composition of the fish predators. This study was designed to minimize bias by sampling as close to the same time period each year, at the same location defined by geography and bathymetry, using the same methodological approaches, during similar oceanographic and hydrographic conditions. In light of possible ecological, environmental, and oceanographic differences between the 2018 and 2019 sampling events, the results of this study cannot be used to generalize to other seasons or ocean regions. Additional field sampling at regular intervals, with associated environmental and hydrographic data collection, will provide the oceanographic context for prey variability among fish predators, which may result from large-scale, inter-annual or seasonal variation, and/or small-scale, short-term patchiness in pelagic ecosystems of the NW Atlantic Ocean.
The taxonomic completeness and geographic coverage of reference sequence databases are primary limiting factors for detection and identification of taxonomic groups and species based on metabarcoding (Bucklin et al., 2016). Another essential resource is the availability of morphological taxonomic experts for the many metazoan groups comprising the pelagic assemblage (Bucklin et al., 2021a). Several initiatives are currently ongoing that are working toward this shared goal (Duarte et al., 2020; Leray et al., 2022; Bucklin et al., 2021b; Huggett et al., 2022; Govindarajan et al., 2023).
Conclusions
Integrative morphological (microscopic) and molecular (metabarcoding) analysis of gut contents of seven species of mesopelagic fishes was carried out for samples collected during Summer 2018 and 2019 in the NW Atlantic Slope Water. Results are summarized for each predator species, including prey groups detected by V9 and COI, prey species identified by COI, and prey counts based on morphological analysis of gut contents. Patterns of variation for both V9 and COI revealed similarities in diet among the predators, with crustaceans, including primarily copepods and/or eucarids, with smaller numbers of amphipods and ostracods, dominating in all species except M. niger. V9 allowed detection of gelatinous organisms, including hydrozoans, salps, and ctenophores found in the gut contents of A. aculeatus, C. sloani and S. beanii. The detection and identification of prey species based on COI provided a detailed view of trophic relationships and food web linkages for mesopelagic fish. Parallel analysis of morphological counts in gut contents of fish from the same samples provided additional insights into prey composition. Future research is needed to examine underlying causes of observed differences in prey composition of mesopelagic fish predators, including impacts of vertical migration behavior and whether differences reflect prey choice and availability.
Data availability statement
Metabarcoding sequence data with associated metadata were deposited in the NCBI GenBank Short Read Archive (SRA; see https://www.ncbi.nlm.nih.gov/sra/) and are identified as BioProject PRJNA932043. Accession Numbers (Acc. Nos.) for COI are SRR23362666 – SRR23362743; for V9 18S rRNA, Acc. Nos. are SRR23354213 – SRR23354291.
Author contributions
AB: Conceptualization, Data curation, Formal analysis, Funding acquisition, Investigation, Methodology, Project administration, Resources, Software, Supervision, Validation, Visualization, Writing – original draft, Writing – review & editing. PB: Conceptualization, Data curation, Formal analysis, Funding acquisition, Investigation, Methodology, Project administration, Resources, Software, Supervision, Validation, Visualization, Writing – original draft, Writing – review & editing. JQ: Conceptualization, Data curation, Formal analysis, Funding acquisition, Investigation, Methodology, Project administration, Resources, Software, Supervision, Validation, Visualization, Writing – original draft, Writing – review & editing. HM: Conceptualization, Data curation, Formal analysis, Funding acquisition, Investigation, Methodology, Project administration, Resources, Software, Supervision, Validation, Visualization, Writing – original draft, Writing – review & editing. MW: Formal analysis, Methodology, Writing – original draft, Writing – review & editing. JL: Conceptualization, Writing – original draft, Writing – review & editing. SG: Formal analysis, Writing – original draft, Writing – review & editing. PC: Conceptualization, Methodology, Writing – original draft, Writing – review & editing. RF: Methodology, Writing – original draft, Writing – review & editing. AG: Conceptualization, Formal analysis, Investigation, Project administration, Resources, Supervision, Writing – original draft, Writing – review & editing. ST: Writing – original draft, Writing – review & editing. MJ: Writing – original draft, Writing – review & editing. PW: Conceptualization, Data curation, Formal analysis, Funding acquisition, Investigation, Methodology, Project administration, Resources, Software, Supervision, Validation, Visualization, Writing – original draft, Writing – review & editing.
Funding
The author(s) declare financial support was received for the research, authorship, and/or publication of this article. Funding was provided by the Woods Hole Oceanographic Institution’s Ocean Twilight Zone Project, which is funded as part of The Audacious Project housed at TED. Additional support was provided by the Scientific Committee on Oceanic Research (SCOR) and the U.S. National Science Foundation (Grant OCE-1840868) and by national SCOR committees. Funding for the NOAA R/V Henry B. Bigelow was provided by NOAA’s Office of Marine and Aviation Operations (OMAO).
Acknowledgments
We acknowledge contributions of the Scientific Committee on Oceanic Research (SCOR) Working Group 157, MetaZooGene: Toward a new global view of marine zooplankton biodiversity based on DNA metabarcoding and reference DNA sequence databases (https://metazoogene.org/ and https://scor-int.org/group/157/). This study examined samples and data resulting from cruises of the NOAA R/V Henry Bigelow; we gratefully acknowledge the efforts of the shipboard scientists and crew from the NOAA Northeast Fisheries Science Center (Narragansett, RI, USA). Expert technical and bioinformatics advice and assistance was provided by professional staff at the Institute for Systems Genomics, University of Connecticut (Storrs, CT, USA), including Bo Reese and Lu Li at the UConn Center for Genome Innovation (CGI) and Vijender Singh and Jill L. Wegrzyn at the UConn Computational Biology Core (CBC).
Conflict of interest
The authors declare that the research was conducted in the absence of any commercial or financial relationships that could be construed as a potential conflict of interest.
Publisher’s note
All claims expressed in this article are solely those of the authors and do not necessarily represent those of their affiliated organizations, or those of the publisher, the editors and the reviewers. Any product that may be evaluated in this article, or claim that may be made by its manufacturer, is not guaranteed or endorsed by the publisher.
Supplementary material
The Supplementary Material for this article can be found online at: https://www.frontiersin.org/articles/10.3389/fmars.2024.1411996/full#supplementary-material
Supplementary Table 1 | Numbers of specimens of each mesopelagic fish species analyzed by metabarcoding of V9 18S rRNA and COI gene regions or microscopic counts of prey in dissected gut contents. Abbreviations are used for fish species names; numbers of technical replicates for metabarcoding analyses are shown in parentheses. The same fish were used for metabarcoding of both genes; morphological counts were done for different fish. Detailed information for individual specimens is provided in Supplementary Tables 2, 3.
Supplementary Table 2 | (A, B) Sequence numbers by fish specimens analyzed for V9 (A) and COI (B) metabarcoding with collection information, including cruise and tow numbers, time (day or night), and depth (m), and measurement of fish standard length (SL, mm). Highlighted cells (yellow) indicate counts > 1,000.
Supplementary Table 3 | (A, B) Microscopic prey counts by taxonomic group for fish specimens analyzed from cruises of the R/V Bigelow during Summer 2018 (A) HB-1805 and 2019 (B) HB-1907, with collection information (tow number, time, and depth) and fish standard length measurement (mm).
References
Albaina A., Aguirre M., Abad D., Santos M., Estonba A. (2016). 18S rRNA V9 metabarcoding for diet characterization: a critical evaluation with two sympatric zooplanktivorous fish species. Ecol. Evol. 6, 1809–1824. doi: 10.1002/ece3.2016.6.issue-6
Alberdi A., Aizpurua O., Gilbert M. T. P., Bohmann K. (2017). Scrutinizing key steps for reliable metabarcoding of environmental samples. Methods Ecol. Evol. 9, 134–147. doi: 10.1111/mee3.2018.9.issue-1
Amaral-Zetter L. A., McCliment E. A., Ducklow H. W., Huse S. M. (2009). A method for studying Protistan diversity using massively parallel sequencing of V9 hypervariable regions of small-subunit ribosomal RNA genes. PloS One 4, 1–9. doi: 10.1371/journal.pone.0006372
Ambler J. W., Miller C. B. (1987). Vertical habitat-partitioning by copepodites and adults of subtropical oceanic copepods. Mar. Biol. 94, 561–577. doi: 10.1007/BF00431403
Amundsen P.-A., Sánchez-Hernández J. (2019). Feeding studies take guts – critical review and recommendations of methods for stomach contents analysis in fish. J. Fish. Biol. 95, 1364–1373. doi: 10.1111/jfb.14151
Arostegui M. C., Gaube P., Woodworth-Jefcoats P. A., Kobayashi D. R., Braun C. D. (2022). Anticyclonic eddies aggregate pelagic predators in a subtropical gyre. Nature 609, 535–540. doi: 10.1038/s41586-022-05162-6
Baker R., Buckland A., Sheaves M. (2014). Fish gut content analysis: robust measures of diet composition. Fish. Fish. 15, 170–177. doi: 10.1111/faf.12026
Battaglia P., Ammendolia G., Esposito V., Romeo T., Andaloro F. (2018). Few but relatively large prey: trophic ecology of Chauliodus sloani (Pisces: Stomiidae) in deep waters of the central Mediterranean Sea. J. Ichthyol. 58, 8–16. doi: 10.1134/S0032945218010034
Bergman L., Sangekar M. N., Hidaka M., Lindsay D. J. (2023). Deep-sea fishes in a sauna: Viperfishes dominate a submarine caldera. Deep-Sea Res. 193, 103950. doi: 10.1016/j.dsr.2022.103950
Blanco-Bercial L. (2020). Metabarcoding analyses and seasonality of the zooplankton community at BATS. Front. Mar. Sci., 7–173. doi: 10.3389/fmars.2020.00173
Braun C. D., Arostegui M. C., Thorrold S. R., Papastamatiou Y. P., Gaube P., Fontes J., et al. (2022). The functional and ecological significance of deep diving by large marine predators. Ann. Rev. Mar. Sci. 14, 129–159. doi: 10.1146/annurev-marine-032521-103517
Bray J. R., Curtis J. T. (1957). An ordination of upland forest communities of southern Wisconsin. Ecol. Monogr. 27, 325–349. doi: 10.2307/1942268
Buckland A., Baker R., Loneragan N., Sheaves M. (2017). Standardising fish stomach content analysis: The importance of prey condition. Fish. Res. 196, 126–140. doi: 10.1016/j.fishres.2017.08.003
Bucklin A., Lindeque P. K., Rodriguez-Ezpeleta N., Albaina A., Lehtiniemi M. (2016). Metabarcoding of marine zooplankton: Progress, prospects and pitfalls. J. Plankton Res. 38, 393–400. doi: 10.1093/plankt/fbw023
Bucklin A., Peijnenburg K. T. C. A., Kosobokova K. N., Machida R. (2021a). New insights into biodiversity, biogeography, ecology, and evolution of marine zooplankton based on molecular approaches. ICES J. Mar. Sci. 78, 3281–3287. doi: 10.1093/ices,jms/fsab198
Bucklin A., Peijnenburg K. T. C. A., Kosobokova K. N., O’Brien T. D., Blanco-Bercial L., Cornils A., et al. (2021b). Toward a global reference database of COI barcodes for marine zooplankton. Mar. Biol. 168, 78. doi: 10.1007/s00227-021-03887-y
Bucklin A., Steinke D., Blanco-Bercial L. (2011). DNA barcoding of marine metazoa. Ann. Rev. Mar. Sci. 3, 471–508. doi: 10.1146/annurev-marine-120308-080950
Bucklin A., Yeh H. D., Questel J. M., Richardson D. E., Reese B., Copley N. J., et al. (2019). Time-series metabarcoding analysis of zooplankton diversity of the NW Atlantic continental shelf. ICES J. Mar. Sci. 76, 1162–1176. doi: 10.1093/icesjms/fsz021
Butler M., Bollens S. M., Burkhalter B., Madin L. P., Horgan E. (2001). Mesopelagic fishes of the Arabian Sea: Distribution, abundance and diet of Chauliodus pammelas, Chauliodus sloani, Stomias affinis, and Sòtomias nebulosus. Deep. Sea Res. II 48, 1369–1383. doi: 10.1016/S0967-0645(00)00143-0
Caiger P. E., Lefebve L. S., Llopiz J. K. (2021). Growth and reproduction in mesopelagic fishes: a literature synthesis. ICES J. Mar. Sci. 78, 765–781. doi: 10.1093/icesjms/fsaa247
Canals O., Lanzén A., Mendibil I., Bachiller E., Corrales X., Andonegi E., et al. (2024). Increasing marine trophic web knowledge through DNA analyses of fish stomach content: a step towards an ecosystem-based approach to fisheries research. J. Fish Biol. 105, 431–443. doi: 10.1111/jfb.15754
Casey J. M., Meyer C. P., Morat F., Brandl S. J., Planes S., Parravicini V. (2019). Reconstructing hyperdiverse food webs: Gut content metabarcoding as a tool to disentangle trophic interactions on coral reefs. Methods Ecol. Evol. 10, 1157–1170. doi: 10.1111/2041-210X.13206
Chavtur V. G., Mazdygan E. R. (2015). Vertical distribution of pelagic ostracods (Myodocopa) in the Subantarctic and Antarctic zones of the Australian–New Zealand sector in the Southern Ocean. Mar. Biol. 55, 231–240. doi: 10.1134/S0001437015020034
Choy C. A., Davison P. C., Drazen J. C., Flynn A., Gier E. J., Hoffman J. C., et al. (2012). Global trophic position comparison of two dominant mesopelagic fish families (Myctophidae, Stomiidae) using amino acid Nitrogen isotopic analyses. PloS One 7, e50133. doi: 10.1371/journal.pone.0050133
Choy C. A., Haddock S. H. D., Robison B. H. (2017). Deep pelagic food web structure as revealed by in situ feeding observations. Proc. R. Soc B 284, 20172116. doi: 10.1098/rspb.2017.2116
Choy C. A., Portner E., Iwane M., Drazen J. C. (2013). Diets of five important predatory mesopelagic fishes of the central North Pacific. Mar. Ecol. Prog. Ser. 492, 169–184. doi: 10.3354/meps10518
Clare E. L., Fazekas A., Ivanova N., Floyd R., Hebert P., Adams A. (2019). Approaches to integrating genetic data into ecological networks. Molec. Ecol. 28, 503–519. doi: 10.1111/mec.14941
Clarke L. J., Trebilco R., Walters A., Polanowski A. M., Deagle B. E. (2020). DNA-based diet analysis of mesopelagic fish from the southern Kerguelen Axis. Deep Sea Res. II 174, 104494. doi: 10.1016/j.dsr2.2018.09.001
Coissac E., Riaz T., Puillandre N. (2012). Bioinformatic challenges for DNA metabarcoding of plants and animals. Molec. Ecol. 21, 1834–1847. doi: 10.1111/j.1365-294X.2012.05550.x
Cuff J. P., Windsor F. M., Tercel M. P. T. G., Kitson J. J. N., Evans D. M. (2022). Overcoming the pitfalls of merging dietary metabarcoding into ecological networks. Meth. Ecol. Evol. 13, 545–559. doi: 10.1111/2041-210X.13796
da Silveira E. L., Semmar N., Cartes J. E., Tuset V. M., Lombarte A., Cupertino Ballester E. L., et al. (2020). Methods for trophic ecology assessment in fishes: a critical review of stomach analyses. Rev. Fish. Sci. Aquac. 28, 71–106. doi: 10.1080/23308249.2019.1678013
Deagle B. E., Thomas A. C., McInnes J. C., Clarke L. J., Vesterinen E. J., Clare E. L., et al. (2019). Counting with DNA in metabarcoding studies: How should we convert sequence reads to dietary data? Molec. Ecol. 28, 391–406. doi: 10.1111/mec.14734
De Robertis A., Taylor K., Williams K., Wilson C. D. (2017). Species and size selectivity of two midwater trawls used in an acoustic survey of the Alaska Arctic. Deep Sea Res. II 135, 40–50. doi: 10.1016/j.dsr2.2015.11.014
deVargas C., Audic S., Henry N., Decelle J., Mahé F., Logares R., et al. (2015). Eukaryotic plankton diversity in the sunlit ocean. Science 348, 1261605. doi: 10.1126/science.1261605
Djurhuus A., Pitz K., Sawaya N. A., Rojas-Marquez J., Michaud B., Montes E., et al. (2018). Evaluation of marine zooplankton community structure through environmental DNA metabarcoding. Limnol. Oceanogr. Meth. 16, 209–221. doi: 10.1002/lom3.10237
Dormann C. F., Fründ J., Blüthgen N., Gruber B. (2009). Indices, graphs and null models: analyzing bipartite ecological networks. Open Ecol. J. 2, 7–24. doi: 10.2174/1874213000902010007
Duarte S., Vieira P. E., Costa F. O. (2020). Assessment of species gaps in DNA barcode libraries of non-indigenous species (NIS) occurring in European coastal regions. Metabarcod. Metagen. 4, e55162. doi: 10.3897/mbmg.4.55162
Dunne J. A., Williams R. J., Martinez N. D. (2022). Food-web structure and network theory: The role of connectance and size. Proc. Natl. Acad. Sci. 99, 12917–12922. doi: 10.1073/pnas.192407699
Edgar R. C. (2016). UNOISE2: improved error-correction for Illumina 16S and ITS amplicon sequencing. BioRxiv, p.081257. doi: 10.1101/081257
Eduardo L. N., Bertrand A., Mincarone M. M., Santos L. V., Frédou T., Assunção R. V., et al. (2020a). Hatchetfishes (Stomiiformes: Sternoptychidae) biodiversity, trophic ecology, vertical niche partitioning and functional roles in the western Tropical Atlantic. Progr. Oceanogr. 187, 1–14. doi: 10.1016/j.pocean.2020.102389
Eduardo L. N., Lucena-Frédou F., Mincarone M. M., Soares A., Loc’h F. L., Frédou T., et al. (2020b). Trophic ecology, habitat, and migratory behaviour of the viperfish Chauliodus sloani reveal a key mesopelagic player. Sci. Rep. 10, 20996. doi: 10.1038/s41598-020-77222-8
Eduardo L. N., Mincarone M. M., Villarins B. T., Frédou T., Lira A. S., Bertrand A., et al. (2019). Length–weight relationships of eleven mesopelagic fishes from oceanic islands of the Southwestern Tropical Atlantic. J. Appl. Ichthyol. 35, 605–607. doi: 10.1111/jai.13840
Endo Y., Wiebe P. H. (2007). Temporal changes in euphausiid distribution and abundance in North Atlantic cold core rings in relation to the surrounding waters. Deep Sea Res. I. 54, 181–202. doi: 10.1016/j.dsr.2006.10.008
Ershova E., Wangensteen O., Descoteaux R., Barth-Jensen C., Præbel K. (2021). Metabarcoding as a quantitative tool for estimating biodiversity and relative biomass of marine zooplankton. ICES J. Mar. Sci. 78, 3342–3355. doi: 10.1093/icesjms/fsab171
Feagans-Bartow J. N., Sutton T. T. (2014). Ecology of the oceanic rim: pelagic eels as key ecosystem components. Mar. Ecol. Progr. Ser. 502, 257–266. doi: 10.3354/meps10707
Fiksen Ø., Carlotti F. (1998). A model of optimal life history and diel vertical migration in Calanus finmarchicus. Sarsia 83, 129–147. doi: 10.1080/00364827.1998.10413678
Flores C. O., Poisot T., Valverde S., Weitz J. S. (2016). BiMat: a MATLAB package to facilitate the analysis of bipartite networks. Meth. Ecol. Evol. 7, 127–132. doi: 10.1111/2041-210X.12458
Fraser-Brunner A. (1936). The occurrence of the Snipe-Eel (Nemichthys scolopaceus) on the Irish Atlantic Slope. Irish Nat. J. 6, 16–18. Available online at: https://www.jstor.org/stable/i25532522.
Gamfeldt L., Lefcheck J. S., Byrnes J. E. K., Cardinale B. J., Duffy E., Griffin J. N. (2015). Marine biodiversity and ecosystem functioning: what’s known and what’s next? Oikos 124, 252–265. doi: 10.1111/oik.2015.v124.i3
Gartner J. V., Musick J. A. (1989). Feeding habits of the deep-sea fish, Scopelogadus beanii (Pisces: Melamphaidae), in the western North Atlantic. Deep Sea Res. 36, 1457–1469. doi: 10.1016/0198-0149(89)90051-4
Geller J. B., Meyer C. P., Parker M., Hawk H. (2013). Redesign of PCR primers for mitochondrial Cytochrome c. oxidase subunit I for marine invertebrates and application in all-taxa biotic surveys. Molec. Ecol. Res. 13, 851–861. doi: 10.1111/men.2013.13.issue-5
Goetsch C., Conners M. G., Budge S. M., Mitani Y., Walker W. A., Bromaghin J. F., et al. (2018). Energy-rich mesopelagic fishes revealed as a critical prey resource for a deep-diving predator using quantitative fatty acid signature analysis. Front. Mar. Sci. 5, 1–19. doi: 10.3389/fmars.2018.00430
Gordon J. D. M., Duncan J. A. R. (1985). The ecology of the deep-sea benthic and benthopelagic fish on the slopes of the Rockall Trough, Northeastern Atlantic. Progr. Oceanogr. 15, 37–69. doi: 10.1016/0079-6611(85)90037-0
Govindarajan A. F., Francolini R. D., Jech J. M., Lavery A. C., Llopiz J. K., Wiebe P. H., et al. (2021). Exploring the use of environmental DNA (eDNA) to detect animal taxa in the mesopelagic zone. Front. Ecol. Evol. 9. doi: 10.3389/fevo.2021.574877
Govindarajan A. F., Llopiz J., Caiger P. E., Jech J. M., Lavery A. C., McMonagle H., et al. (2023). Assessing mesopelagic fish diversity and diel vertical migration with environmental DNA. Front. Mar. Sci. 10. doi: 10.3389/fmars.2023.1219993
Harry R. R. (1953). Studies on the bathypelagic fishes of the family Paralepididae. 1. Survey of the genera. Pac. Sci. 7, 219–249. Available online at: http://hdl.handle.net/10125/8728.
Hirai J., Kuriyama M., Ichikawa T., Hidaka K., Tsuda A. (2015). A metagenetic approach for revealing community structure of marine planktonic copepods. Molec. Ecol. Res. 15, 68–80. doi: 10.1111/men.2014.15.issue-1
Hopkins T. L., Baird R. C. (1985). Feeding ecology of four hatchetfishes (Sternoptychidae) in the eastern Gulf of Mexico. Bull. Mar. Sci. 36, 260–277.
Huggett J. A., Groeneveld J. C., Singh S. P., Willows-Munro S., Govender A., Cedras R., et al. (2022). Metabarcoding of zooplankton to derive indicators of pelagic ecosystem status. S. Afr. J. Sci. 118, 11–12. doi: 10.17159/sajs.2022/12977
Iglesias I. S., Santora J. A., Fiechter J., Field J. C. (2023). Mesopelagic fishes are important prey for a diversity of predators. Front. Mar. Sci. 10. doi: 10.3389/fmars.2023.1220088
Irigoien X., Klevjer T. A., Røstad A., Martinez U., Boyra G., Acuna J. L., et al. (2014). Large mesopelagic fishes biomass and trophic efficiency in the open ocean. Nat. Commun. 5, 1–10. doi: 10.1038/ncomms4271
Jech M., Lavery A. (2018). “Mesopelagic exploration with deep-see,” in Final Cruise Report of R/V Henry B. Bigelow (HB18-05). NOAA Northeast Fisheries Science Center, Narragansett, RI. 41 pp.
Jones D. L. (2017). Fathom Toolbox for MATLAB: software for multivariate ecological and oceanographic data analysis (St. Petersburg, FL, USA: College of Marine Science, University of South Florida). Available at: https://www.usf.edu/marine-science/research/matlab-resources/index.aspx/.
Kaartvedt S., Langbehn T. J., Aksnes D. L. (2019). Enlightening the ocean’s twilight zone. ICES J. Mar. Sci. 76, 1–10. doi: 10.1093/icesjms/fsz010
Käse L., Metfies K., Kraberg A. C., Neuhaus S., Meunier C. L., Wiltshire K. H., et al. (2021). Metabarcoding analysis suggests that flexible food web interactions in the eukaryotic plankton community are more common than specific predator-prey relationships at Helgoland Roads, North Sea. ICES J. Mar. Sci. 78, 3372–3386. doi: 10.1093/icesjms/fsab058
Kelly T. B., Davison P. C., Goericke R., Landry M. R., Ohman M. D., Stukel M. R. (2019). The importance of mesozooplankton diel vertical migration for sustaining a mesopelagic food web. Front. Mar. Sci. 6, 1–18. doi: 10.3389/fmars.2019.00508
Kourantidou M., Jin D. (2022). Mesopelagic–epipelagic fish nexus in viability and feasibility of commercial-scale mesopelagic fisheries. Nat. Res. Model. 35, e12350. doi: 10.1111/nrm.12350
Leray M., Knowlton N., Machida R. J. (2022). MIDORI2: A collection of quality controlled, preformatted, and regularly updated reference databases for taxonomic assignment of eukaryotic mitochondrial sequences. Envi. DNA 4, 894–907. doi: 10.1002/edn3.303
Leray M., Yang J. Y., Meyer C. P., Mills S. C., Agudelo N., Ranwez V., et al. (2013). A new versatile primer set targeting a short fragment of the mitochondrial COI region for metabarcoding metazoan diversity: application for characterizing coral reef fish gut contents. Front. Zool. 10, 34. doi: 10.1186/1742-9994-10-34
Levin A., Amon D. J., Lily H. (2020). Challenges to the sustainability of deep-seabed mining. Nat. sustainability. Nat. Sustain. 3, 784–794. doi: 10.1038/s41893-020-0558-x
Lindsay D. J., Grossmann M. M., Nishikawa J. (2015). DNA barcoding of pelagic cnidarians: current status and future prospects. Bull. Plank. Soc Japan 62, 39–43. Available online at: https://repository.si.edu/handle/10088/29737.
Lučić D., Benović A., Morović M., Batistić M., Onofri I. (2009). Diel vertical migration of medusae in the open Southern Adriatic Sea over a short time period (July 2003). Mar. Ecol. 30, 16–32. doi: 10.1111/j.1439-0485.2008.00264.x
Lusher A. L., O’Donnell C., Officer R., O’Connor I. (2016). Microplastic interactions with North Atlantic mesopelagic fish. ICES J. Mar. Sci. 73, 1214–1225. doi: 10.1093/icesjms/fsv241
Maes S. M., Schaafsma F. L., Christiansen H., Hellemans B., Lucassen M., Mark F. C., et al. (2022). Comparative visual and DNA-based diet assessment extends the prey spectrum of polar cod Boreogadus saida. Mar. Ecol. Progr. Ser. 698, 139–154. doi: 10.3354/meps14145
Manko P. (2016). Stomach content analysis in freshwater fish feeding ecology (University of Presov, Presov, Slovakia. Ph.D. Dissertation), 116 pp.
Matthews S. A., Goetze E., Ohman M. D. (2021). Recommendations for interpreting zooplankton metabarcoding and integrating molecular methods with morphological analyses. ICES J. Mar. Sci. 78, 3387–3396. doi: 10.1093/icesjms/fsab107
McCune G., Grace J. B., Urban D. L. (2002). Analysis of ecological communities (Gleneden Beach, Oregon. 300 pp: MjM Sofware Design).
McMonagle H., Llopiz J. K., Hilborn R., Essington T. T. (2023). High uncertainty in fish bioenergetics impedes precision of fish-mediated carbon transport estimates into the ocean’s twilight zone. Progr. Oceanogr. 217, 103078. doi: 10.1016/j.pocean.2023.103078
Morzaria-Luna H. N., Ainsworth C. H., Scott R. L. (2022). Impacts of deep-water spills on mesopelagic communities and implications for the wider pelagic food web. Mar. Ecol. Prog. Ser. 681, 37–51. doi: 10.3354/meps13900
Mundy B. C. (2005). Checklist of the fishes of the Hawaiian archipelago. Bishop Mus. Bull. Zool. 6, 1–704. Bishop Museum Press. ISBN 9781581780444.
Pan W., Qin C., Zuo T., Yu G., Zhu W., Ma H., et al. (2021). Is metagenomic analysis an effective way to analyze fish feeding habits? A case of the Yellowfin Sea Bream Acanthopagrus latus (Houttuyn) in Daya Bay. Front. Mar. Sci. 8. doi: 10.3389/fmars.2021.634651
Pauly D., Piroddi C., Hood L., Bailly N., Chu E., Lam V., et al. (2021). The biology of mesopelagic fishes and their catches, (1950–2018) by commercial and experimental fisheries. J. Mar. Sci. Eng. 9, 1057. doi: 10.3390/jmse9101057
Pereira L. S., Agostinho A. A., Winemiller K. O. (2017). Revisiting cannibalism in fishes. Rev. Fish. Biol. Fisheries 27, 499–513. doi: 10.1007/s11160-017-9469-y
Proud R., Handegard N. O., Kloser R. J., Cox M. J., Brierley A. S. (2019). From siphonophores to deep scattering layers: uncertainty ranges for the estimation of global mesopelagic fish biomass. ICES J. Mar. Sci. 76, 718–733. doi: 10.1093/icesjms/fsy037
Purcell J. E., Sturdevant M. V. (2001). Prey selection and dietary overlap among zooplanktivorous jellyfish and juvenile fishes in Prince William Sound, Alaska. Mar. Ecol. Progr. Ser. 210, 67–83. doi: 10.3354/meps210067
Pusch C., Schnack-Schiel S., Mizdalski E., von Westernhagen H. (2004). Feeding ecology of three myctophid species at the Great Meteor Seamount (Northeast Atlantic). Arch. Fish. Mar. Res. 51, 251–271.
Quast C., Pruesse E., Yilmaz P., Gerken J., Schweer T., Yarza P., et al. (2013). The SILVA ribosomal RNA gene database project: improved data processing and web-based tools. Nuc. Acids Res. 41, D590–D596. doi: 10.1093/nar/gks1219
Questel J. M., Hopcroft R. R., DeHart H. M., Smoot C. A., Kosobokova K. N., Bucklin A. (2021). Metabarcoding of zooplankton diversity within the Chukchi Borderland, Arctic Ocean: improved resolution from multi-gene markers and region-specific DNA databases. Mar. Biodiv. 51, 4. doi: 10.1007/s12526-020-01136-x
Quigley L. A., Caiger P. E., Govindarajan A. F., McMonagle H., Jech J. M., Lavery A. C., et al. (2023). Otolith characterization and integrative species identification of adult mesopelagic fishes from the western North Atlantic Ocean. Front. Mar. Sci. 10. doi: 10.3389/fmars.2023.1217779
Receveur A., Vourey E., Lebourges-Dhaussy A., Menkes C., Ménard F., Allain V. (2020). Biogeography of micronekton assemblages in the natural park of the Coral Sea. Front. Mar. Sci. 7. doi: 10.3389/fmars.2020.00449
Robison B. H. (2009). Conservation of deep pelagic biodiversity. Cons. Biol. 23, 847–858. doi: 10.1111/j.1523-1739.2009.01219.x
Robison B. H., Sherlock R. E., Reisenbichler R. K., McGill P. R. (2020). Running the gauntlet: assessing the threats to vertical migrators. Front. Mar. Sci. 7, 1–10. doi: 10.3389/fmars.2020.00064
Roe H. S. J. (1984). The diel migrations and distributions within a mesopelagic community in the North East Atlantic. 2. Vertical migrations and feeding of mysids and decapod Crustacea. Progr. Oceanogr. 13, 269–318. doi: 10.1016/0079-6611(84)90011-9
Rognes T., Flouri T., Nichols B., Quince C., Mahé F. (2016). VSEARCH: a versatile open source tool for metagenomics. PeerJ 4, e2584. doi: 10.7717/peerj.2584
Roslin T., Traugott M., Jonsson M., Stone G. N., Creer S., Symondson W. O. C. (2019). Introduction to special issue on species interactions, ecological networks and community dynamics: Untangling the entangled bank using molecular techniques. Molec. Ecol. 28, 157–164. doi: 10.1111/mec.14974
Saba G. K., Burd A. B., Dunne J. P., Hernández-León S., Martin A. H., Rose K. A., et al. (2021). Toward a better understanding of fish-based contribution to ocean carbon flux. Limnol. Oceanogr. 66, 1639–1664. doi: 10.1002/lno.11709
Sato Y., Miya M., Fukunaga T., Sado T., Iwasaki W. (2018). MitoFish and MiFish pipeline: A mitochondrial genome database of fish with an analysis pipeline for environmental DNA metabarcoding. Molec. Biol. Evol. 35, 1553–1555. doi: 10.1093/molbev/msy074
Schloss P. D., Westcott S. L., Ryabin T., Hall J. R., Hartmann M., Hollister E. B., et al. (2009). Introducing Mothur: open-source, platform-independent, community-supported software for describing and comparing microbial communities. Appl. Envi. Microbiol. 75, 7537–7541. doi: 10.1128/AEM.01541-09
Schroeder A., Stankovic D., Pallavicini A., Gionechetti F., Pansera M., Camatti E. (2020). DNA metabarcoding and morphological analysis - assessment of zooplankton biodiversity in transitional waters. Mar. Environ. Res. 160. doi: 10.1016/j.marenvres.2020.104946
Serite C. P., Emami-Khoyi A., Ntshudisane O. K., James N. C., Jansen van Vuuren B., Bodill T., et al. (2023). eDNA metabarcoding vs metagenomics: an assessment of dietary competition in two estuarine pipefishes. Front. Mar. Sci. 10. doi: 10.3389/fmars.2023.1116741
Shink K. G., Sutton T. M., Murphy J. M., López J. A. (2019). Utilizing DNA metabarcoding to characterize the diet of marine-phase Arctic lamprey (Lethenteron camtschaticum) in the eastern Bering Sea. Can. J. Fish. Aquat. Sci. 76, 1993–2002. doi: 10.1139/cjfas-2018-0299
Shortridge M. G. (2016). Diet analysis of Maumee River fishes using cytochrome c oxidase (COI) DNA metabarcoding - insights into a critical time of year (Ohio: M.Sc. Thesis. Bowling Green State University).
Smith D. G., Tighe K. A. (2002). “Snipe eels. Family nemichthyidae,” in Fishes of the Gulf of Maine, 3rd ed. Eds. Collette B. B., Klein-MacPhee G. (Smithsonian Institute Press, Washington), 100–101.
Stefanni S., Stanković D., Borme D., de Olazabal A., Juretić A., Pallavicini A., et al. (2018). Multi-marker metabarcoding approach to study mesozooplankton at basin scale. Sci. Rep. 8, 12085. doi: 10.1038/s41598-018-30157-7
Steinke D., Hanner R. (2011). The FISH-BOL collaborators' protocol. Mito. DNA 22, 10–14. doi: 10.3109/19401736.2010.536538
St. John M. A., Borja A., Guillem C., Heath M., Grigorov I., Mariani P. (2016). A dark hole in our understanding of marine ecosystems and their services: perspectives from the mesopelagic community. Front. Mar. Sci. 3, 1–6. doi: 10.3389/fmars.2016.00031
Su M., Liu H., Liang X., Gui L., Zhang J. (2018). Dietary analysis of marine fish species: enhancing the detection of prey-specific DNA sequences via high-throughput sequencing using blocking primers. Estuaries Coast 41, 560–571. doi: 10.1007/s12237-017-0279-1
Suca J. J., Pringle J. W., Knoreka Z. R., Hamilton S. L., Richardson D. E., Llopiz J. K. (2018). Feeding dynamics of Northwest Atlantic small pelagic fishes. Progr. Oceanogr. 165, 52–62. doi: 10.1016/j.pocean.2018.04.014
Suter L., Polanowski A. M., Clarke L. J., Kitchener J. A., Deagle B. E. (2021). Capturing open ocean biodiversity: Comparing environmental DNA metabarcoding to the continuous plankton recorder. Mol. Ecol. 30, 3140–3157. doi: 10.1111/mec.15587
Sutton T. T. (2005). Trophic ecology of the deep-sea fish Malacosteus Niger (Pisces: Stomiidae): An enigmatic feeding ecology to facilitate a unique visual system? Deep Sea Res. I 52, 2065–2076. doi: 10.1016/j.dsr.2005.06.011
Sutton T. T. (2013). Vertical ecology of the pelagic ocean: classical patterns and new perspectives. J. Fish Biol. 83, 1508–1527. doi: 10.1111/jfb.2013.83.issue-6
Sutton T. T., Hopkins T. L. (1996). species composition, abundance, and vertical distribution of the stomiid (Pisces: Stomiiformes) fish assemblage of the Gulf of Mexico. Bull. Mar. Sci. 3, 530–5542. Available at: https://nsuworks.nova.edu/occ_facarticles/528.
Symondson W. O. C., Harwood J. D. (2014). Introduction to special issue on molecular detection of trophic interactions: Unpacking the tangled bank. Molec. Ecol. 23, 3601–3604. doi: 10.1111/mec.12831
Taberlet P., Coissac E., Pompanon F., Brochmann C., Willerslev E. (2012). Towards next-generation biodiversity assessment using DNA metabarcoding. Molec. Ecol. 21, 2045–2050. doi: 10.1111/j.1365-294X.2012.05470.x
Tarling G. A., Cuzin-Roudy J., Buchholz F. (1999). Vertical migration behaviour in the northern krill Meganyctiphanes norvegica is influenced by moult and reproductive processes. Mar. Ecol. Progr. Ser. 190, 253–262. doi: 10.3354/meps190253
Wang Q., Garrity G. M., Tiedje J. M., Cole J. R. (2007). Naive Bayesian classifier for rapid assignment of rRNA sequences into the new bacterial taxonomy. Appl. Envi. Microbiol. 73, 5261–5267. doi: 10.1128/AEM.00062-07
Ward R. D., Hanner R., Hebert P. D. N. (2009). The campaign to DNA barcode all fishes, FISH-BOL. J. Fish Biol. 74, 329–356. doi: 10.1111/j.1095-8649.2008.02080
Webb T. J., Berghe E. V., O’Dor R. (2010). Biodiversity’s big wet secret: the global distribution of marine biological records reveals chronic under-exploration of the deep pelagic ocean. PloS One 5, 1–6. doi: 10.1371/journal.pone.0010223
Wiebe P. H., Morton A. W., Bradley A. M., Backus R. H., Craddock J. E., Cowles T. J., et al. (1985). New developments in the MOCNESS, an apparatus for sampling zooplankton and micronekton. Mar. Biol. 87, 313–323. doi: 10.1007/BF00397811
Williams A., Koslow J., Terauds A., Haskard K. (2001). Feeding ecology of five fishes from the mid-slope micronekton community off southern Tasmania, Aust. Mar. Biol. 139, 1177–1192. doi: 10.1007/s002270100671
Woodstock M. S., Blanar C. A., Sutton T. T. (2020). Diet and parasites of a mesopelagic fish assemblage in the Gulf of Mexico. Mar. Biol. 167, 184. doi: 10.1007/s00227-020-03796-6
Keywords: mesopelagic, fish diets, DNA metabarcoding, morphological prey counts, food web
Citation: Bucklin A, Batta-Lona PG, Questel JM, McMonagle H, Wojcicki M, Llopiz JK, Glancy S, Caiger PE, Francolini R, Govindarajan A, Thorrold SR, Jech M and Wiebe PH (2024) Metabarcoding and morphological analysis of diets of mesopelagic fishes in the NW Atlantic Slope Water. Front. Mar. Sci. 11:1411996. doi: 10.3389/fmars.2024.1411996
Received: 03 April 2024; Accepted: 19 September 2024;
Published: 04 October 2024.
Edited by:
Ciro Rico, Spanish National Research Council (CSIC), SpainReviewed by:
Michael Vecchione, National Oceanic and Atmospheric Administration (NOAA), United StatesDeborah Vicari, University of Oxford, United Kingdom
Copyright © 2024 Bucklin, Batta-Lona, Questel, McMonagle, Wojcicki, Llopiz, Glancy, Caiger, Francolini, Govindarajan, Thorrold, Jech and Wiebe. This is an open-access article distributed under the terms of the Creative Commons Attribution License (CC BY). The use, distribution or reproduction in other forums is permitted, provided the original author(s) and the copyright owner(s) are credited and that the original publication in this journal is cited, in accordance with accepted academic practice. No use, distribution or reproduction is permitted which does not comply with these terms.
*Correspondence: Ann Bucklin, YW5uLmJ1Y2tsaW5AdWNvbm4uZWR1
 Ann Bucklin
 Paola G. Batta-Lona
 Jennifer M. Questel
 Helena McMonagle
 Melissa Wojcicki1
 Joel K. Llopiz
 Annette Govindarajan
 Simon R. Thorrold
 Michael Jech
 Peter H. Wiebe