 Roberto Sorgente1
 Federica Pessini1Aldo Francis Drago2
 Alberto Ribotti1Simona Genovese3
 Marco Barra4
 Angelo Perilli1
 Giovanni Quattrocchi1
 Andrea Cucco1Ignazio Fontana3
 Giovanni Giacalone3
 Gualtiero Basilone3
 Antonia Di Maio5*Angelo Esposito6
 Angelo Bonanno3
- 1Istituto per lo Studio degli Impatti Antropici e Sostenibilità in Ambiente Marino, Consiglio Nazionale delle Ricerche, Oristano, Italy
- 2Institute of Engineering and Transport, Malta College of Arts, Science and Technology, Paola, Malta
- 3Istituto per lo Studio degli Impatti Antropici e Sostenibilità in Ambiente Marino, Consiglio Nazionale delle Ricerche, Trapani, Italy
- 4Istituto di Scienze Marine, Consiglio Nazionale delle Ricerche, Napoli, Italy
- 5Istituto per lo Studio degli Impatti Antropici e Sostenibilità in Ambiente Marino, Consiglio Nazionale delle Ricerche, Roma, Italy
- 6Istituto di Calcolo e Reti ad Alte Prestazioni, Consiglio Nazionale delle Ricerche, Napoli, Italy
The interannual variability of the physical properties of the shelf waters in Sardinia, western Mediterranean Sea, is studied by using hydrological data gathered during three oceanographic cruises: two in late summer of 2019 and 2021 respectively and another one in early autumn of 2020. The data consist of vertical profiles of salinity and potential temperature acquired by a multiparametric probe for a total of 171 casts performed along a set of transects extending from the nearshore to the continental slope, up to the depth of 200 m. Satellite remote sensing and numerical modelling oceanographic products support the phenomenological analysis. Atlantic Water, characterised by low salinity signatures (S<37.0), is detected in the surface waters of the southwestern shelf areas, induced by the Algerian Eddies, and with differences between years. It is also observed on the southern-eastern and north-eastern shelf areas of Sardinia, mainly driven by the interaction with large-scale circulation features like the southeast Sardinia Gyre and the Bonifacio Gyre. An upwelling phenomenology is identified as one of the major features of the coastal circulation on the western shelf area. The study provides the first assessment of the thermohaline features on the Sardinian shelf; an enhanced contribution to the current knowledge of the coastal sea phenomena, and contributes to numerical modelling applications and implementations for ecosystem services.
1 Introduction
Sardinia is the second largest Mediterranean island, after Sicily, located in the Western Mediterranean sub-basin (Figure 1). Towards west, Sardinia faces the Sardinian Sea forming part of the Algerian-Provencal sub-basin, while in the east spans the Tyrrhenian Sea. In the north, it is separated from the island of Corsica by the shallow (∼100 m) and narrow (∼11 km) Bonifacio Strait, and in the south from Tunisia by the deep (∼2000 m) Sardinia Channel.
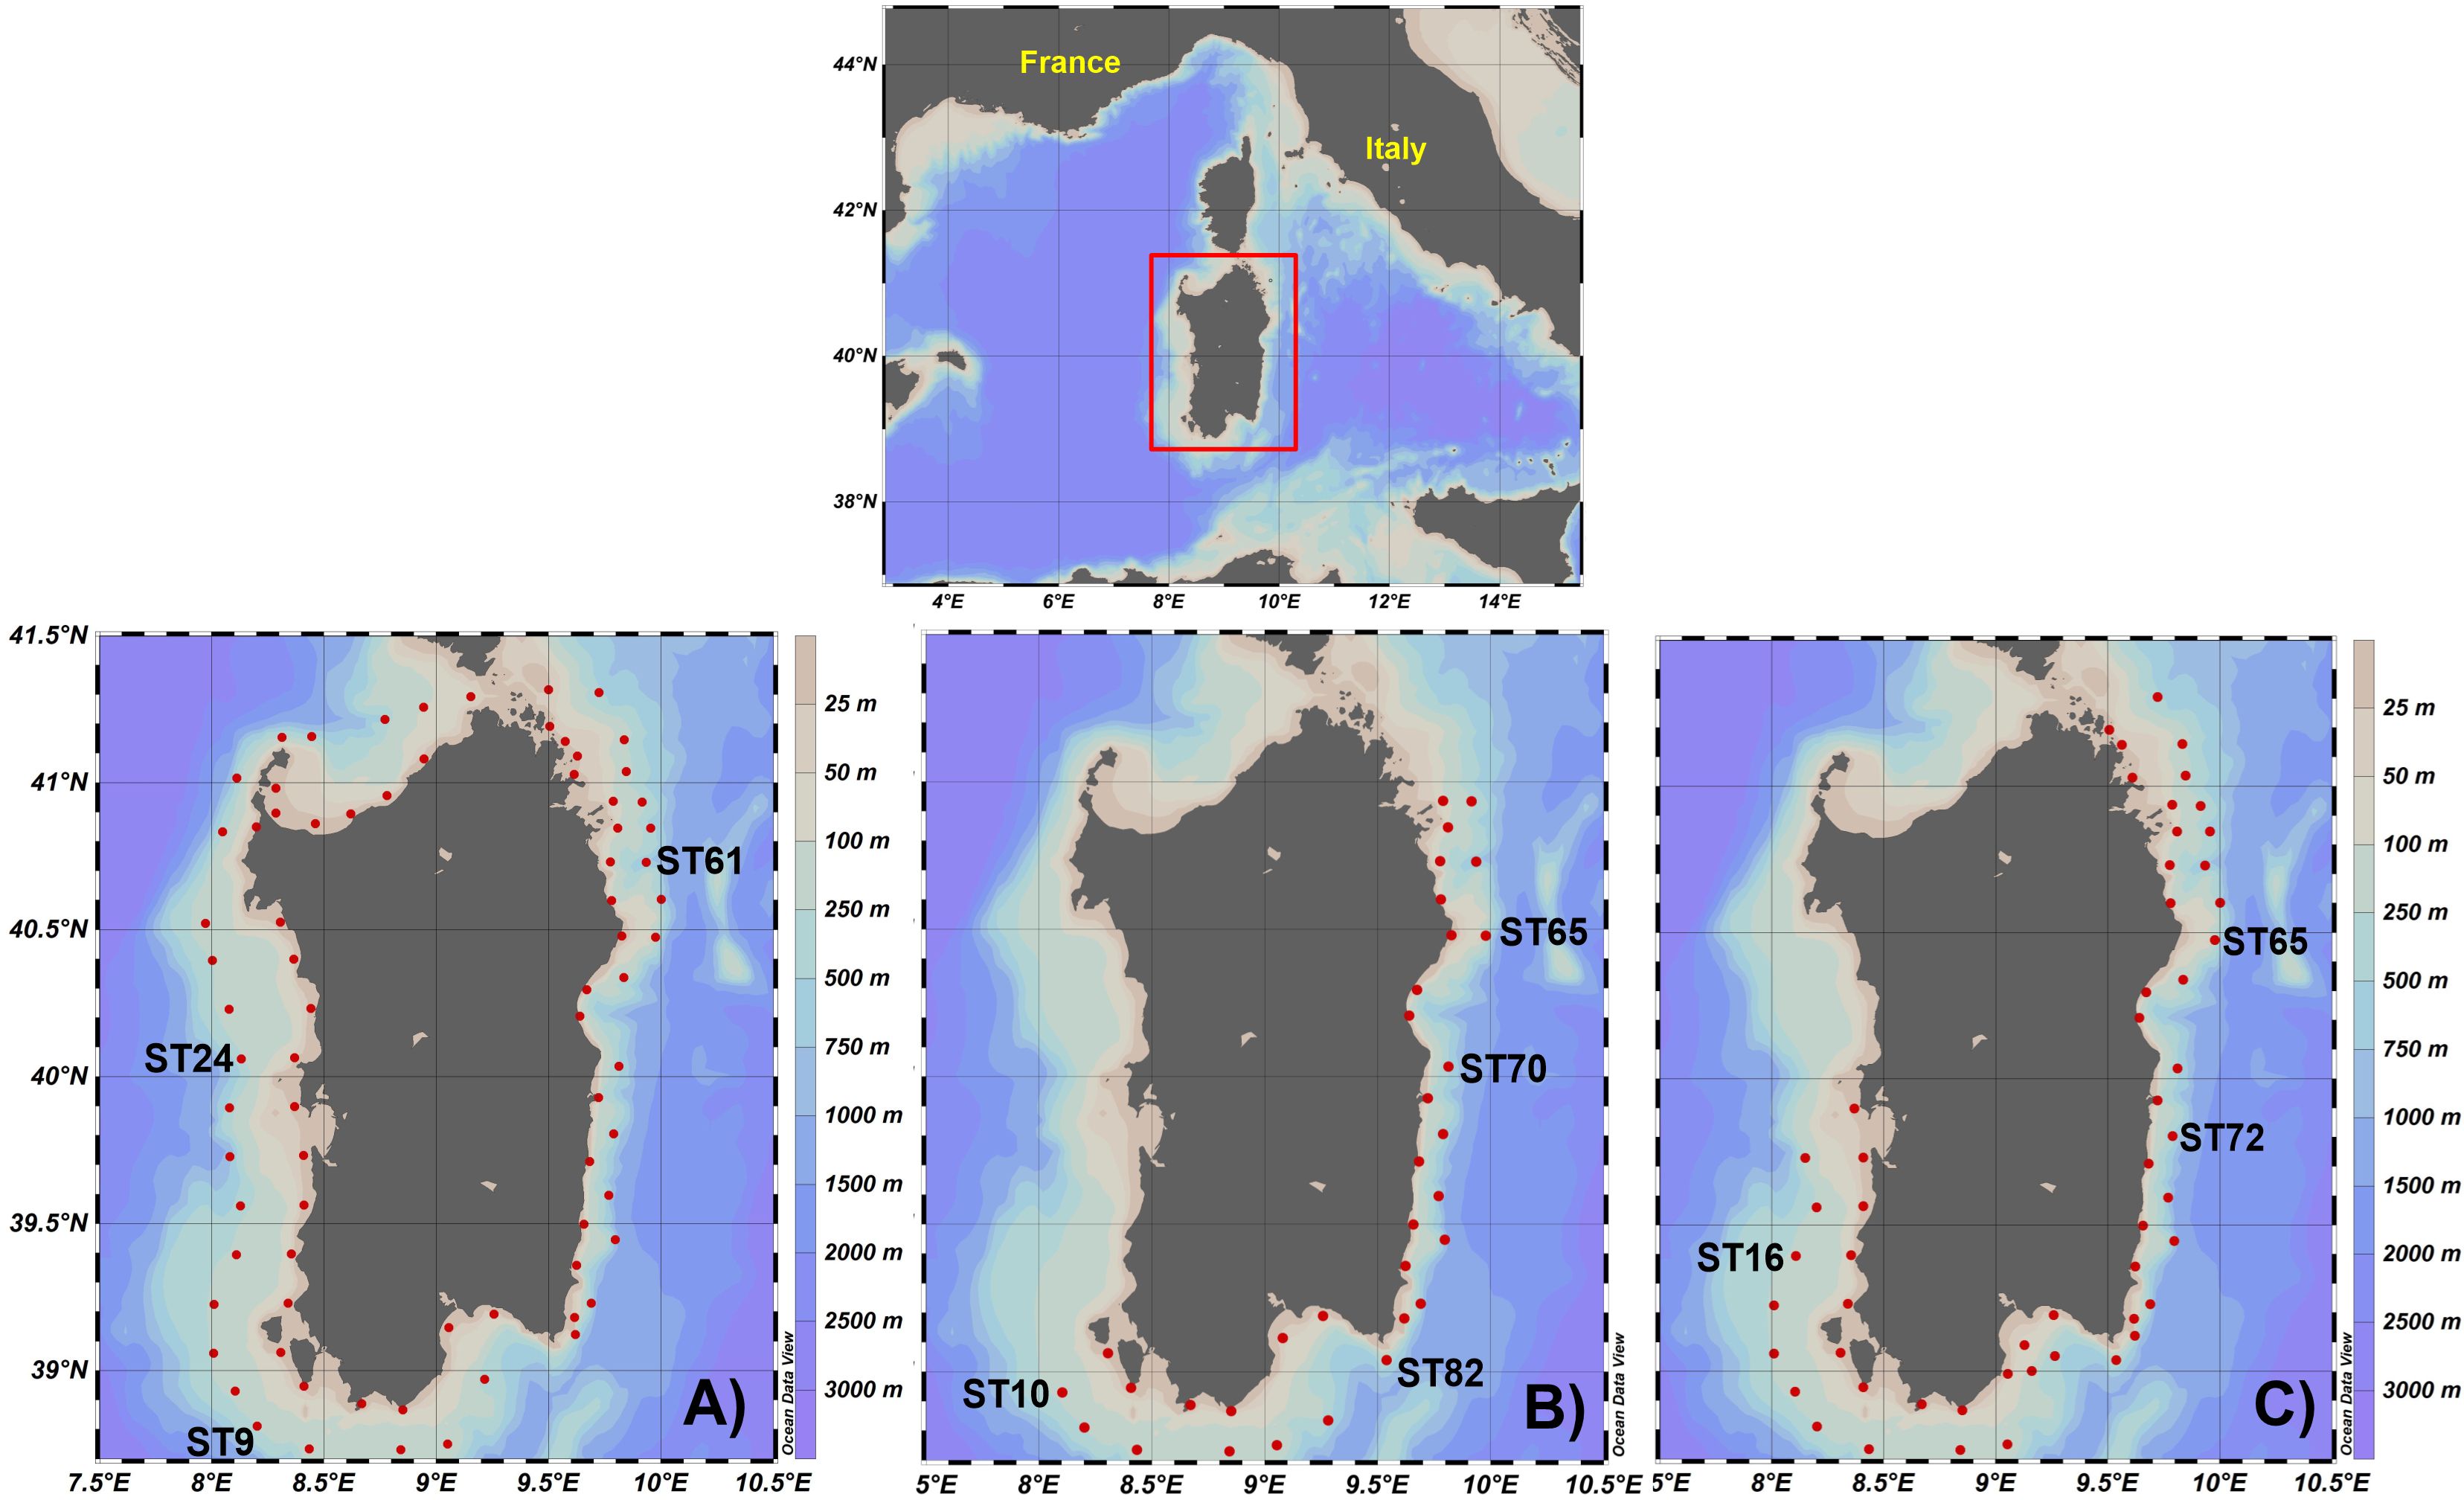
Figure 1 Spatial distribution of hydrological casts (red points) on the continental shelf of Sardinia carried out during the cruises: (A) IDMAR2019; (B) IDMAR2020; (C) IDMAR2021. The shaded colour shows the bathymetry (m). The casts indicated on the maps were used to assess temperature and salinity of the regional ocean model.
In the Sardinian Sea the fresh Atlantic Water [AW, Astraldi et al. (1996)] is driven northward by anticyclonic eddies shed by the Algerian Current [AC, Millot (1985)]. These mesoscale features, known as Algerian Eddies (AEs), are large anti-cyclonic eddies with diameters between 50 and 250 km, and a vertical extent ranging from hundreds of meters up to 1000 - 3000 m (Millot and Taupier-Letage, 2005). They are generated by baroclinic instabilities of the AC, following approximately a cyclonic path in the eastern Algerian basin (Fuda et al., 2000) and carrying ocean properties such as heat, nutrients, and biomass (Wunsch, 1999; Llinás et al., 2009; Colas et al., 2012; McGillicuddy, 2016). AEs interact with the Mediterranean waters at spatial scales from basin to sub-mesoscale, contributing to the spreading and mixing of the water masses (Millot and Taupier-Letage, 2005) in the southern sub-basin and along western Sardinia (Puillat et al., 2002; Cotroneo et al., 2019; Pessini et al., 2020). Furthermore, they strongly interact with the AC and can significantly modify its circulation (Millot, 1985; Taupier-Letage and Millot, 1988). Then, due to the transport of the AW, the AEs contribute to the formation of the North Balearic Front (Fuda et al., 2000; Olita et al., 2014; Seyfried et al., 2019; Barral et al., 2021), a Lagrangian barrier (Mancho et al., 2008) that separates the circulation of the Algerian area from the mean cyclonic circulation of the Provenc¸al through the Western Mid-Mediterranean Current [WMMC in Pinardi et al. (2015)]. WMMC is an eastward wide meandering free jet, flowing approximately at 39.5°N, exhibiting a significant seasonal variability (López Garciá et al., 1994), reaching the Sardinian Sea in winter at its southernmost position (Pessini et al., 2018). Here the WMMC takes the name of Southerly Sardinia Current [SSC in Pinardi et al. (2015)] and can interact with the AEs affecting the surface water masses and the offshore circulation (Ribotti et al., 2004). Additionally, the western coast of Sardinia is also affected by upwelling events triggered by the wind forcing (Olita et al., 2013).
The eastern coast of Sardinia overlooks the Tyrrhenian sub-basin, where the circulation is driven by local atmospheric forcing and water exchanges occurring at the Sardinia, Corsica, and Sicily channels (Artale et al., 1994), characterised by very relevant mesoscale dynamics (Vetrano et al., 2010). According to the representation of the geostrophic circulation by Krivosheya and Ovchinnikov (1973), the main dynamical features are the Northern Tyrrhenian Gyre (NTG), the Southwest Tyrrhenian Gyre, also known as South-East Sardinia Gyre [SESG in Sorgente et al. (2003)], and the South-East Tyrrhenian Gyre [SETG in Pinardi et al. (2015)]. The NTG drives the circulation in the northern part of the Tyrrhenian Sea by permanent dynamic structures like the wind-induced dipole known as the Bonifacio Gyre (Artale et al., 1994). It is centred just east of the Bonifacio Strait, represented by a cyclonic structure in the north, coupled to a smaller anti-cyclonic gyre companion to the south, both exhibiting a strong seasonal variability (Iacono et al., 2021). The SESG is feeble, weakened by the frequent AEs in the south-eastern Tyrrhenian Sea (Rinaldi et al., 2010). The SESG covers a wide marine area between Sardinia, Sicily and Tunisia, already present in the circulation scheme of Krivosheya (1983).
In the framework of the project Infrastruttura di ricerca Distribuita in MARe (translated: Distributed Research Infrastructure in the Sea, or IDMAR), the Italian National Research Council of Italy (CNR) organised three research cruises around Sardinia, during the late summers of 2019 and 2021, and in early autumn of 2020. In contrast to previous cruises that were mainly focused on the western (Onken et al., 2018; Ribotti et al., 2019a, Ribotti et al., 2019b, Ribotti et al., 2023) and southern parts of the island (Ribotti et al., 2004), the IDMAR cruises collected hydrological data and biological samples on the whole continental shelf of Sardinia, filling a gap in the current observational dataset and promoting a multidisciplinary approach to the study of the marine ecosystem in this domain (Bonanno et al., 2018). The analyses of these data provided a comprehensive overview of the hydrology around Sardinia, highlighting the thermohaline conditions in the shelf as well as the spatial and inter-annual variability of the properties of water masses. Specifically, vertical profiles of salinity and temperature were collected by a multiparametric probe (or Conductivity Temperature Depth - CTD) while atmospheric and oceanographic numerical modelling products as well as satellite remote sensing data were used to support the phenomenological analysis. The cruises and the collected data are described in Section 2, followed by their analyses and interpretation in Section 3. Section 4 is dedicated to the conclusions.
2 Observational and numerical modelling products
2.1 Surveys products
Table 1 displays general information on the three oceanographic cruises, namely IDMAR2019, IDMAR2020 and IDMAR2021.
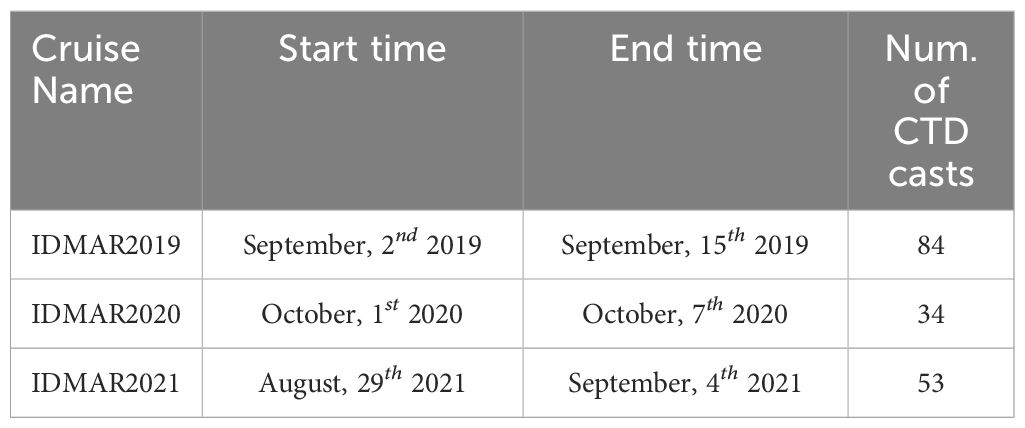
Table 1 The columns indicate the name of cruise, the start and end of CTD measurements, and finally the number of CTD casts.
The CTD casts were mainly on the continental shelf, between the nearshore in very shallow water and the continental shelf break region, with transects perpendicular to the coast, limiting the observations to the first 200 meters of the water column. Each transect was composed of two CTD casts spaced by a distance in the range of 13 to 29 km.
During the cruises high-resolution vertical profiles of temperature and salinity were acquired at each hydrological station (Figure 1) using a previously calibrated Sea Bird Electronics multiparametric probe, model SBE 911 plus, deployed from the 35-meters long R/V G. Dallaporta. The CTD was mounted on a General Oceanics Rosette system, equipped with sensors of conductivity, temperature, depth, and dissolved oxygen, used to sample the hydrological parameters along the vertical at 24 Hz and with a lowering speed of 1 ms−1. These data were respectively measured by means of: an SBE 4 water conductivity sensor (resolution of 0.00004 Sm−1 at 24 samples/sec and an accuracy of ±0.0003 Sm−1) an SBE 3F thermometer (resolution of 0.00015°C/bit at -1°C, or 0.00018°C/bit at 31°C, and an accuracy of ±0.001°C), a Paroscientific Digiquartz pressure sensor (with ±0.015% of full scale range of accuracy) and a SBE 43 polarographic membrane sensor for dissolved oxygen with a range of 120% of surface saturation and an accuracy of ±2% for saturation. After the acquisition, data were processed to eliminate spikes and low-quality values, using the SBE Data Processing ™ software. The SBE Data Processing is a specific software that also permits to align all sensors along the profile due to the different time responses of separate sensors, followed by a control of each profile to highlight further bad data. Then, potential temperature (hereafter temperature, θ), practical salinity (hereafter salinity, S), and potential density anomaly (σθ) were calculated and plotted using the Ocean Data View software (Schlitzer, 2023).
2.2 Satellite and modelling products
State of the art ocean model solutions were used to analyse the large-scale and mesoscale circulation around Sardinia during the oceanographic surveys. The simulated daily mean fields of the sea surface height, temperature, salinity, and current velocity were derived by the Mediterranean Sea Physical Reanalysis, product ID MEDSEA MULTIYEAR PHY 006 004 (Escudier et al., 2020; Nigam et al., 2020). The ocean model horizontal grid resolution was 1/24° (∼5 km) with 141 unevenly spaced vertical levels (Escudier et al., 2021). To validate the model data, the daily mean fields of potential temperature and salinity on the same dates of the CTD casts have been compared with selected vertical profiles (as shown in Figures 1A–C). The model products have been interpolated on the CTD positions in the horizontal plane by means of bi-linear interpolation, and in the vertical by means of linear interpolation of z-levels. The comparison between the modelled values and the observations is quantified by the bias, providing an assessment on the performance of the model to capture the temporal and spatial variability of the sea conditions. Moreover, the ocean model products, satellite observations and atmospheric model reanalysis have been used to support the physical analysis of the CTD data. Specifically, the ocean modelled daily mean fields of salinity and current velocity at specific depths have been averaged over the monitoring period of the cruise to support the interpretation of the observed hydrological structures such as the upwelling event and the presence of AW signatures over the continental shelf.
Satellite derived observations consisted of Sea Surface Temperature (SST) and Absolute Dynamic Topography (ADT). SST consists of daily (night-time) fields with a horizontal resolution of 0.05° (∼4 km), optimally interpolated (L4) from the original Pathfinder Advanced Very High-Resolution Radiometer (AVHRR) data (Pisano et al., 2016). ADT fields were estimated by Optimal Interpolation of the along-track data from the different available altimeter missions on a horizontal resolution of 1/8° x 1/8° in latitude and longitude (Pujol and Mertz, 2020; Tabure and Pujol, 2020). The geostrophic currents are derived from ADT by assuming a geostrophic balance. All these products are available through the Copernicus Marine Environment Monitoring Service.
The atmospheric conditions during the oceanographic cruises were described using 10-meter wind fields, derived from the atmospheric model reanalysis (ERA5), provided by the Copernicus Climate Change Service and generated by the European Centre Medium-range Weather Forecast (ECMWF), on a regular spatial grid of 0.125° x 0.125° and a temporal step of six-hours (00:00, 06:00, 12:00, 18:00 UTC time).
3 Results and discussion
The analysis of the hydrological data was used to identify AW signatures and its interannual variability as well as coastal upwelling phenomena. Satellite and numerical model products were used to support the discussion on the results. These data are presented for each oceanographic cruise divided in two sectors, western and eastern Sardinia, where the western includes casts with longitude λ <9.0°E while the eastern side for casts with λ ≥9°E.
3.1 The cruise IDMAR 2019
The spatial distribution of CTD casts (September 2nd-14th, 2019) is shown in Figure 1A, offering a quasi-synoptic view of the thermohaline characteristics of the water masses on the continental shelf of Sardinia. The average wind speed in the area, during this survey, was smaller than 2.5 m s−1, prevalently from north-west (Figure 2A). Such a low wind speed, and a substantially flat sea, have permitted to complete the whole planned casts around Sardinia in a relative short time.
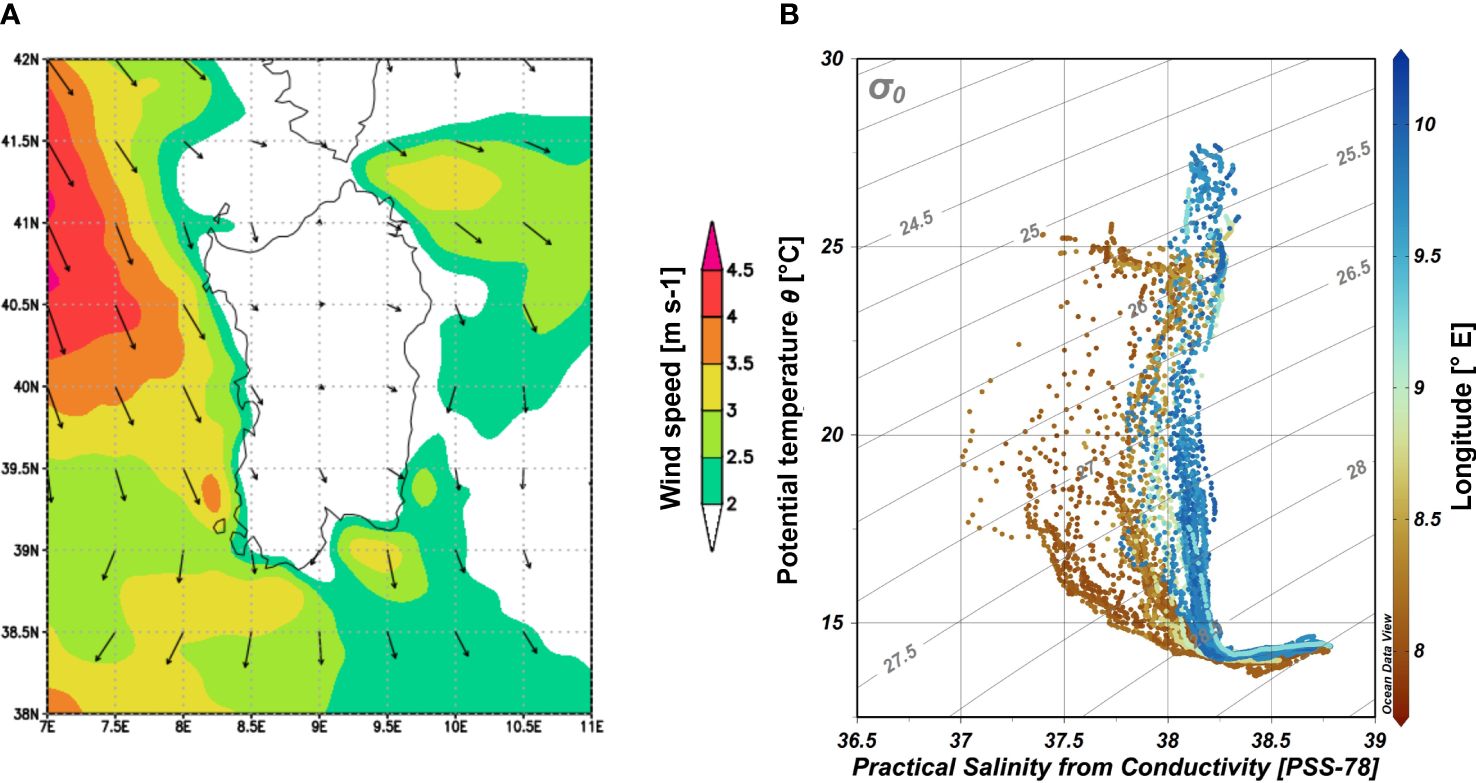
Figure 2 (A) Spatial distribution of the wind speed amplitude and direction averaged from 2nd to 15th September 2019. Unit is m s−1. The contour interval is 0.5 m s−1. wind speed amplitudes <2 m s-−1 are not plotted. (B) The θ-S diagram of the data collected in late summer 2019 during the CTD cruise IDMAR2019. Colours show the spatial distribution of the casts in longitude [°E]. The contour interval of the potential density anomaly is 0.5 kg m−3.
The θ-S diagram in Figure 2B summarises the hydrographic features of the water column observed in late summer 2019. The water masses were characterised by temperatures ranging from a minimum of ∼14°C to a maximum of ∼26°C observed on the eastern continental shelf, while the salinity spanned between ∼37.0 observed on the west side and ∼38.6 at the bottom depth.
The vertical distribution of the salinity observed along the western section is shown in Figure 3A. It is characterised by signatures of fresher AW influencing the vertical distribution with scattered patches of low salinity values. Specifically, low values of ∼37.0 are observed at 40 m depth (cast ST9 in Figure 1A), within 100 km, i.e. at the south-western continental shelf. Similarly, low values of sea surface salinities, lower than 37.2, were observed in the same area in June 2014 (Knoll et al., 2017). Low salinity was also measured in correspondence of two AEs, located offshore the western Sardinia shelf, during the cruise MedGOOS4 in May 2002 (Ribotti et al., 2004), and likewise Benzohra and Millot (1995) and Taupier-Letage et al. (2003), in the eastern part of the Algerian Basin. Other fresh AW patches (salinity core of ∼37.5 at 50 m depth) were detected northward, between 200 and 300 km, while the salinity increased toward the coast (not shown) as well as vertically along the halocline and below, up to the maximum cast depth. The mean salinity is 38.51 ± 0.09 at 200 m depth.
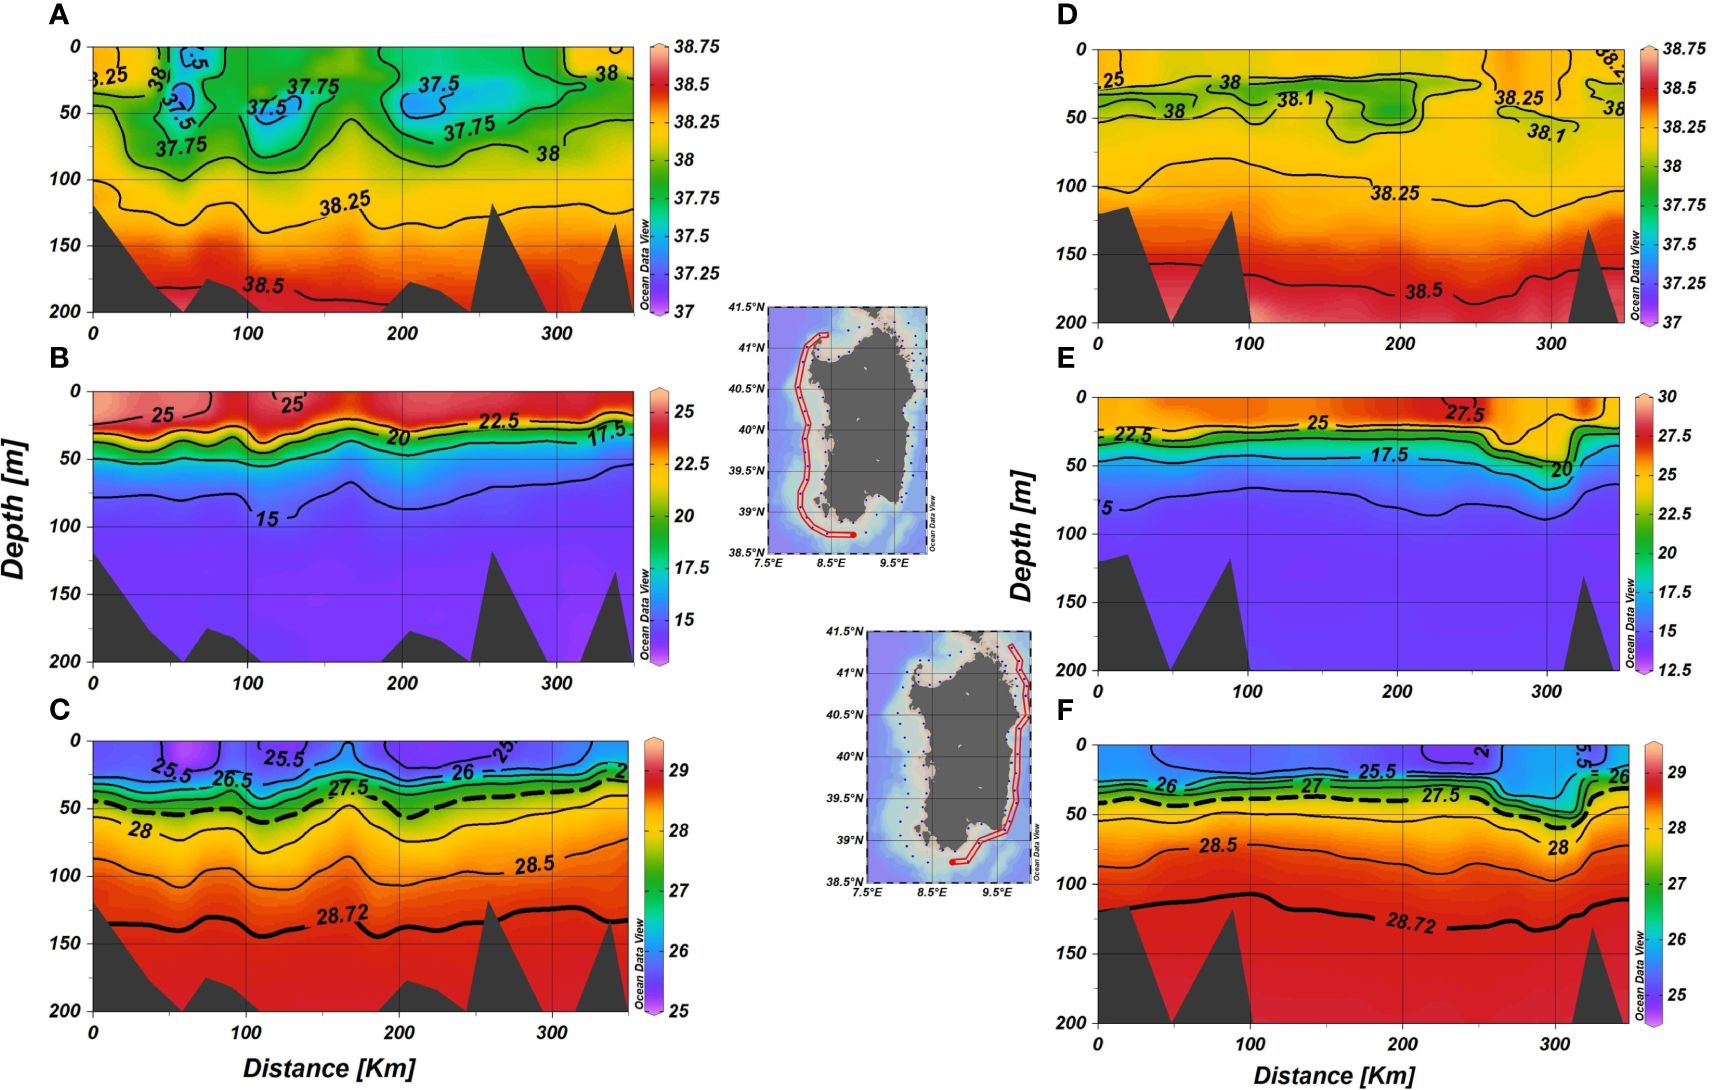
Figure 3 Vertical distribution of salinity (A, D), potential temperature (B, E) in [°C], and potential density anomaly (C, F) in [Kg m−3] observed in late summer 2019 along-section in [km] at the western (left column) and eastern (right column) continental shelf. The vertical distribution fields are shown for the upper layer (5–200 m depth) from south to north. The contour interval for salinity is 0.25, for temperature 0.5°C and for density 0.5 kg m−3. In panel (C, F), the isopycnal 28.72 Kg m−3 (bold black line) represents the deepest boundary of AW, as defined by Knoll et al. (2017), while 27.5 kg m−3 (dashed line) is the deepest limit of the fresh AW. Different palettes are used in panel (B, E) to highlight the vertical gradients of temperature.
The vertical distribution of the temperature was characterised by a warmer (∼25°C) upper layer in the southern side, i.e., within 100 m (Figure 3B). Northward, a homogeneous upper layer with a temperature of ∼22.5°C extended vertically from the sea surface to the mixed layer depth, at about 45 m. Below this level the temperature decreased, forming a sharp thermocline at about 50 m. The depth of the thermocline decreased towards north. As expected, the temperature decreased slowly below the thermocline along the water column. The mean temperature observed was 14.04 ±0.30°C at 200 m depth.
The corresponding density section is depicted in Figure 3C. The separation between the upper and less dense layer of AW from those deeper, saltier, and colder waters was marked by the isopycnal 28.72 kg m−3, as defined by Knoll et al. (2017), roughly located around 140 m. Hence the AW characterised the water column from the sea surface to this depth. Furthermore, patches of fresher AW (S<37.5) identified by CTD measurements, were also detected between the sea surface and 50 m depth, indicating the influence of the deeper core of the AW on the near surface hydrology.
Along the eastern side of Sardinia, the vertical distribution of the salinity field was again characterised by the presence of the AW (Figure 3D), but with some peculiarities. Indeed, in this case the salinity core of the AW was higher than in the western side with about 38.0, that is +0.8, and affected the water column between the 20 and 45 m depth, especially in the northern part, and within a stretch of 250 km. On the contrary, highest salinity values (S>38.25) were observed in the north-east region in the upper 50 m, between 250–300 km, above a thin signature of AW identified at the cast ST61 by a relative minimum of salinity of 38.03 at 50 m depth. The salinity increased towards the coast (not shown) and vertically along and below the halocline until the cast maximum depth. The mean value of 38.60 ± 0.07 was measured at 200 m depth and was higher by 0.09 with respect to that observed on the western side.
The isotherms in Figure 3E highlight a thinner homogenous upper layer characterised by a sea surface temperature of ∼25°C while, between 150 and 250 km, the sea surface temperature ranged between 27.5 and 30°C, namely about +3°C higher than that on the western side (see Figure 3B for comparison). Below this homogenous upper layer, a strong thermocline was detected as the maximum vertical temperature gradient ranged from 27.5 to 17.5°C between 25 and 50 m depth at 50 km, as shown in Figure 3B. The depth of the thermocline extended vertically approximately between 25 m and 50 m depth, except at the northern side where it sinks to 50 m, and then rises to 20 m at the distance of 300 km. Below the thermocline layer the temperature decreases to a mean value of 14.37 ± 0.16°C at 200 m depth, +0.33°C compared to the western coast.
The temperature strongly influences the density section, as reported in Figure 3F. The isopycnal shows the net separation between the thin upper layer of less dense water, slightly affected by signatures of AW, and the deeper, saltier, and colder water. Compared with the western coast, the interface depth between the upper layer of AW and the deeper, saltier, and colder layer, was more variable, ranging between 100 and 140 m, while the lower boundary of the fresher AW, detected by the isopycnal σθ=27.5 kg m−3, is shallower at a depth <50 m, except at 300 km from Figure 3F, where it sinks to 55 m depth.
Considering the oceanographic numerical model products, the salinity and velocity fields averaged over the monitoring period at 40 m depth (Figure 4) depicted a dynamical pattern that is characterised by large meso-scale features. Specifically, the circulation in the Sardinia Sea (Figure 4A) was characterised by mesoscale features represented by cyclonic (CE) and anticyclonic (AE) eddies, as described by Puillat et al. (2002). The interaction between AE1, constrained by the SESG on the east and the large CE on the west, contributed to the spreading of AW from the Algerian coast towards the south-western continental shelf of Sardinia. As described above, in this region (cast ST9 in Figure 1A) less saline water of ∼37.0 was observed at 35 m depth, while the model presents a salinity bias (i.e., Smodel-Sin−situ) of about +0.6 and a temperature bias of about +3.0°C. On the other hand, the largest northern AE2 contributed to the spreading of AW from the centre of the Algerian Basin toward the western continental shelf. The salinity bias at the core of the AW (cast ST24 in Figure 1A) was about +0.23 with a temperature bias of about +0.6°C.
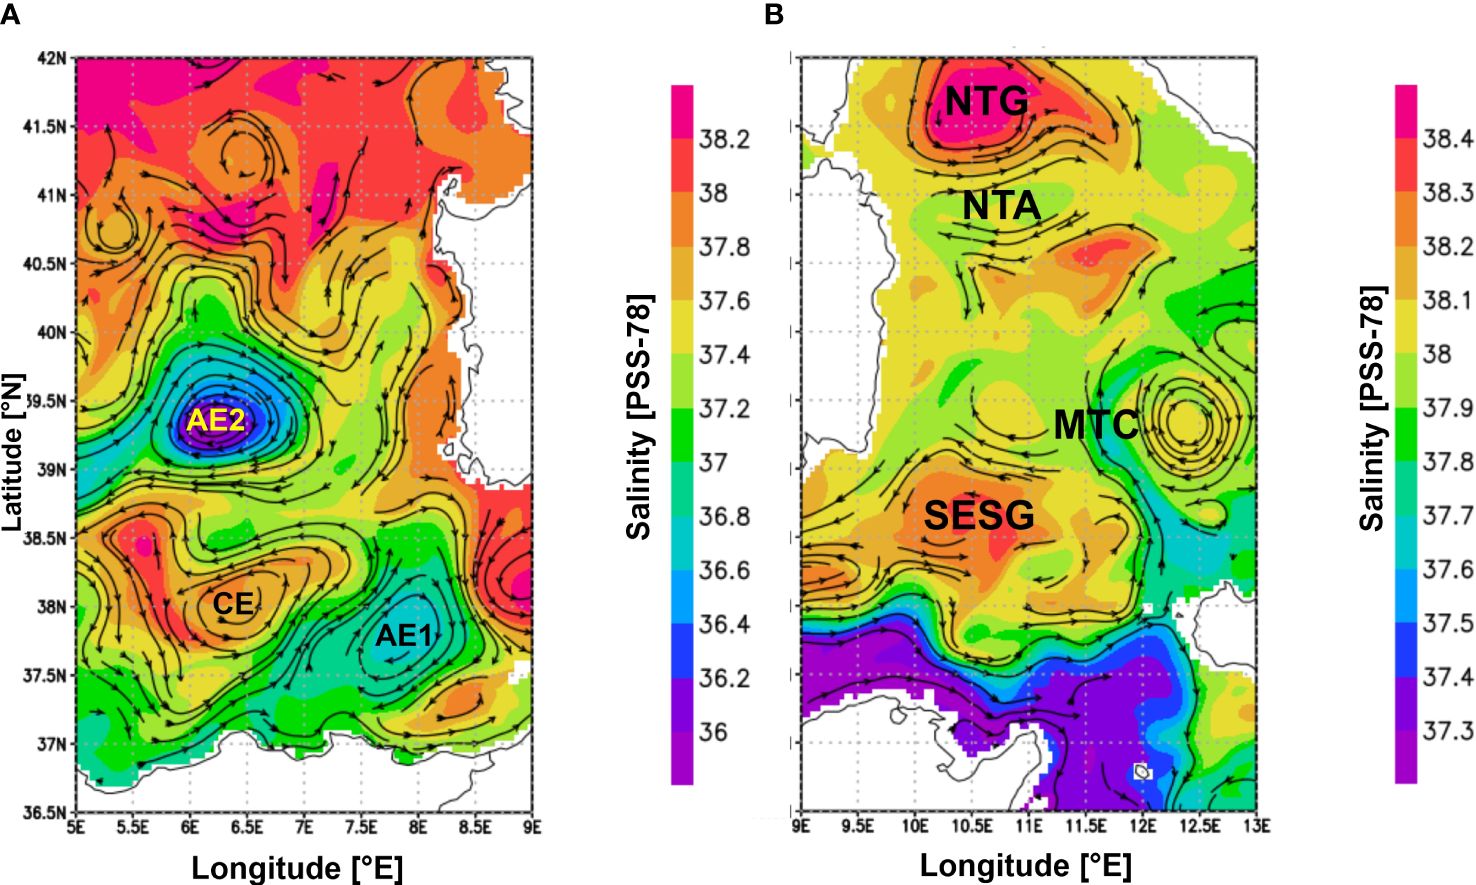
Figure 4 Spatial distribution of the simulated salinity and streamlines of the velocity fields from the Mediterranean Sea Physical Reanalysis. Panel (A) shows the fields for the eastern Algerian Basin, panel (B) the western Tyrrhenian Sea, both at 40 m depth. The salinity and velocity fields are averaged over the monitoring period, that is September 12th-15th 2019 (A) and September 7th-10th2019 (B). Different palettes are used to evidence the horizontal gradients of the salinity fields.
The weak signature of the AW along the eastern continental shelf was mainly due to the influence of the SESG and the mesoscale circulation. The ocean model describes the SESG as a wide and cyclonic gyre located in the Sardinia Channel capturing the major portion of the AW entering the Tyrrhenian Basin (Figure 4B). Its cyclonic circulation spreads the relatively fresh AW, transported by the AC, from the southern side of the Sardinia Channel towards the Tyrrhenian basin, in agreement with the scheme of circulation proposed by Béranger et al. (2004) and Pinardi et al. (2005). At 12°E and 39°N, the SESG forms the Middle Tyrrhenian Current [MTC in Pinardi et al. (2015)], that spreads a large portion of the AW towards the middle and eastern side of the Tyrrhenian Basin, and the westward stream current that feeds the AW toward the Sardinia Channel, in agreement with Lagrangian data collected in the 1990s (Poulain and Zambianchi, 2007). At the AW core (cast ST70 in Figure 1A, at 40 m depth) the model salinity bias is +0.21 (temperature bias of about +0.1°C). Another vein occurs farther eastward along the Sicilian coast, in agreement with Vetrano et al. (2010).
In the north-eastern continental shelf of Sardinia, the simulated circulation is weak and influenced by the western border of an anticyclonic gyre that did not feed the AW over the continental shelf, in agreement with our observation (Figure 3A between 250 and 320 km). The anti-cyclonic structure represents the southern side of the dipole known as the Bonifacio Gyre (Artale et al., 1994) or North Tyrrhenian Anticyclone [NTA in Rinaldi et al. (2010)]. The interaction between the north-eastern coast of Sardinia and the cyclonic and anti-cyclonic surface circulation induced by NTG and NTA respectively, induced a doming of surface warmer and saltier water up to 50 m depth between 200 and 300 km (Figures 3D–F). In this region, the model salinity bias is +0.05 with a temperature bias of about -1.3°C, while at 15 m depth it was -0.08 and a temperature bias of about +0.1°C.
The analysis of the CTD data in the shallowest coastal casts, at the north-western area, detected an evident signature of superficial coastal upwelling, with a decrease of the sea surface temperature to ∼21°C, downstream Cape Caccia (Figure 5A). The zonal sea surface temperature gradient was about -3°C, therefore characterised by colder waters. In the literature, the coastal upwelling phenomenology at the western coast of Sardinia was observed by Ribotti et al. (2004) in the northern area, associated to wind driven mechanisms. More recently, it was described as a signature involving almost the whole length of the western coast, and mainly induced by wind forcing and local mesoscale activity (Olita et al., 2013). The upwelling’s footprint, detected downstream of Cape Caccia, exhibits a distinct sea surface temperature (SST) signature, evident in the thermal satellite image (Figure 5B). This signature is characterised by lower SST values along the coastline compared to offshore areas. The ocean model results reproduce the anomaly surface temperature field successfully (Figure 5C) and identify it as an upwelling induced by current-bottom interactions (Kampf and Chapman, 2016). The interaction between the strong (about 25 cm s−1, not shown) southward long-shore surface current, known as the Western Sardinia Current [WSC in Olita et al. (2013)] reinforced by the north westerly wind field (Figure 2A), and the shape of the ridge of Cape Caccia, generate a positive vorticity downstream Cape Caccia, i.e., the velocity decreases and an inversion of direction is promoted towards the coast, generating a small cyclonic circulation. The intensity of the cyclonic circulation and the vertical stratification enhances upwelling, reducing the SST by ∼3°C at the core of the structure with respect to the ambient ocean. Other signatures of cold waters were detected also at the centre of the western coast (see Figure 5A). The time evolution of the alongshore component of the wind speed (Figure 6A) shows mainly negative values indicating a southward direction. Before September 13th2019, the alongshore component of the wind speed, with values lower than 10 m s−1, was mainly negative (southward), contributing to a lowering of the sea level at the western coast due to the offshore Ekman drift (Figure 6B).
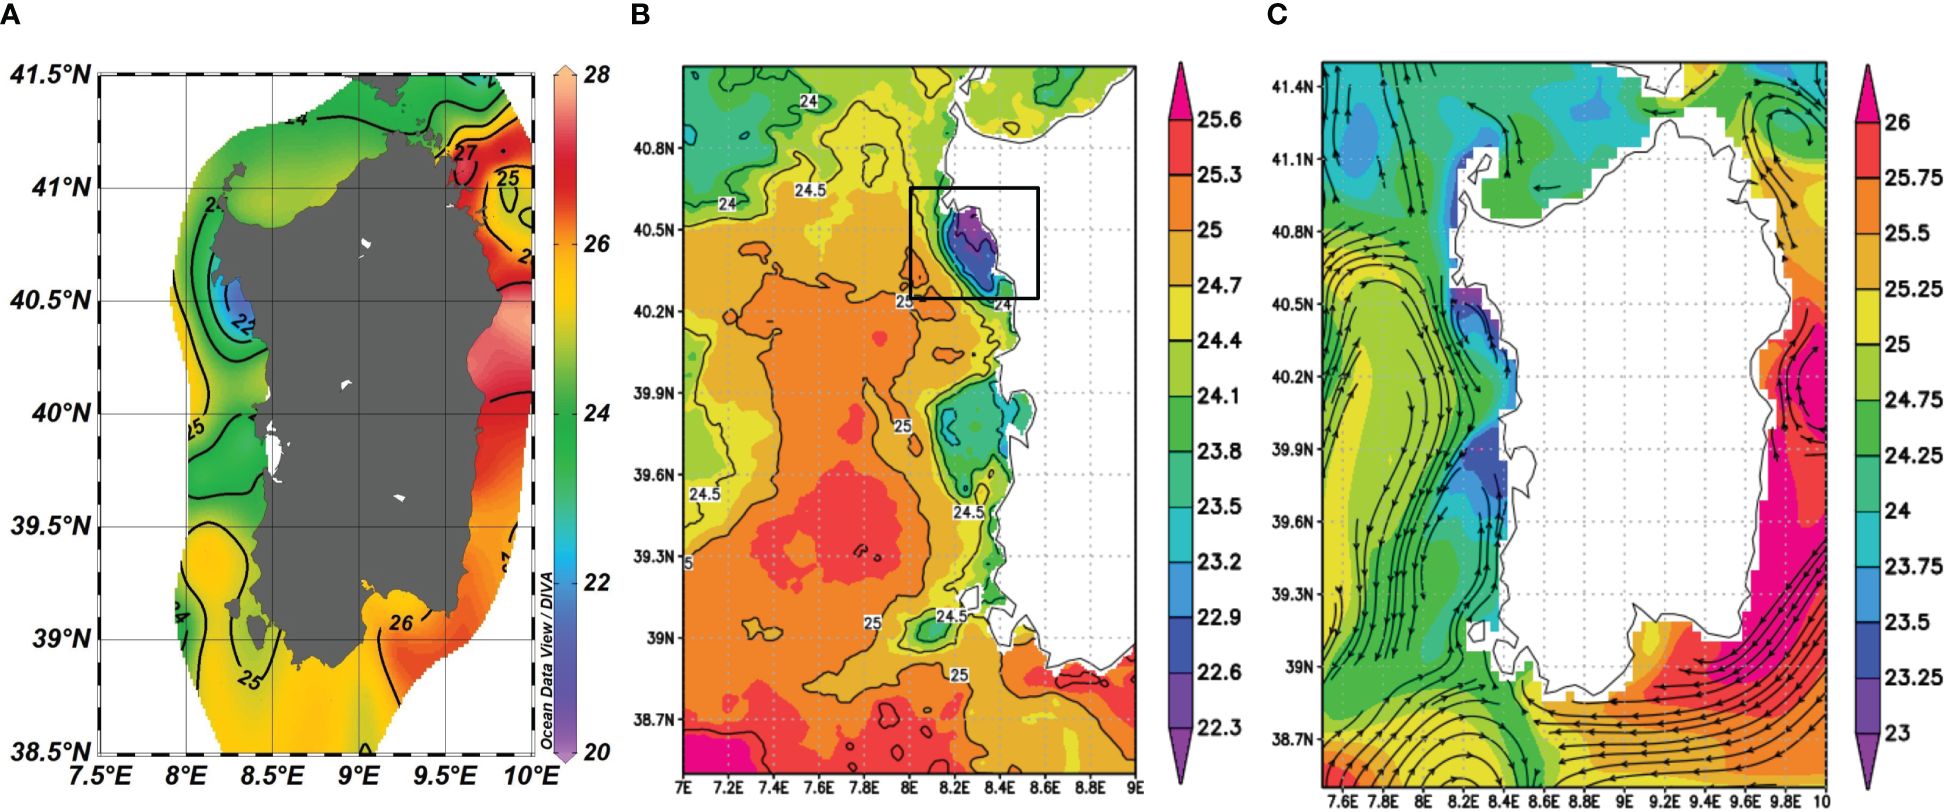
Figure 5 (A) Horizontal distribution of the mean temperature [°C] at 5 m depth observed from 2nd to 15th September 2019 during the cruise IDMAR 2019. The contour interval is 1°C. (B) SST (night-time) derived from satellite-based data. The square indicates the area of Cape Caccia. (C) Simulated daily mean temperature field at 1 m depth overlayed by the sea current streamlines from the Copernicus Marine Service.
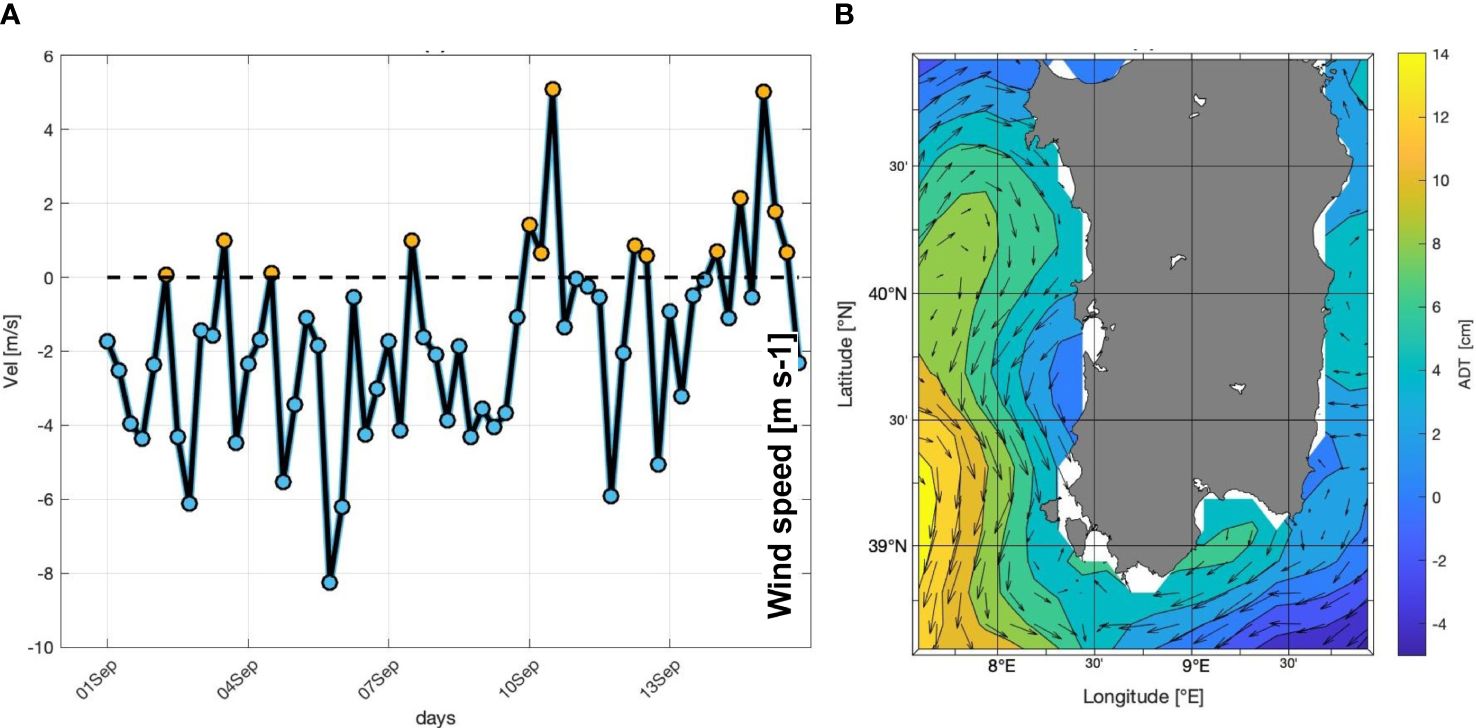
Figure 6 (A) Time evolution of the alongshore wind component every six hours (00:00, 06:00, 12:00, 18:00 UTC) at ϕ=40.5°N, λ=8.2°E from 1st to 15th September 2019. Positive values (yellow circle) means that the wind direction is northward, negative southward. (B) Absolute Dynamic Topography contours and the geostrophic velocity current field on September 13th 2019.
3.2 The cruise IDMAR 2020
This cruise took place between October 1st and 6th, 2020, at the south-western and eastern continental shelf of Sardinia (Figure 1B). The wind speed field (W), averaged throughout the measurement period, is shown in Figure 7A. The westerly wind prevailed, with stronger intensities (W> 7 m s−1) in the Bonifacio Strait whereas lower values, below 4.0 m s−1, at the continental shelf. Downstream, the wind speed decreased towards the middle part of the region.
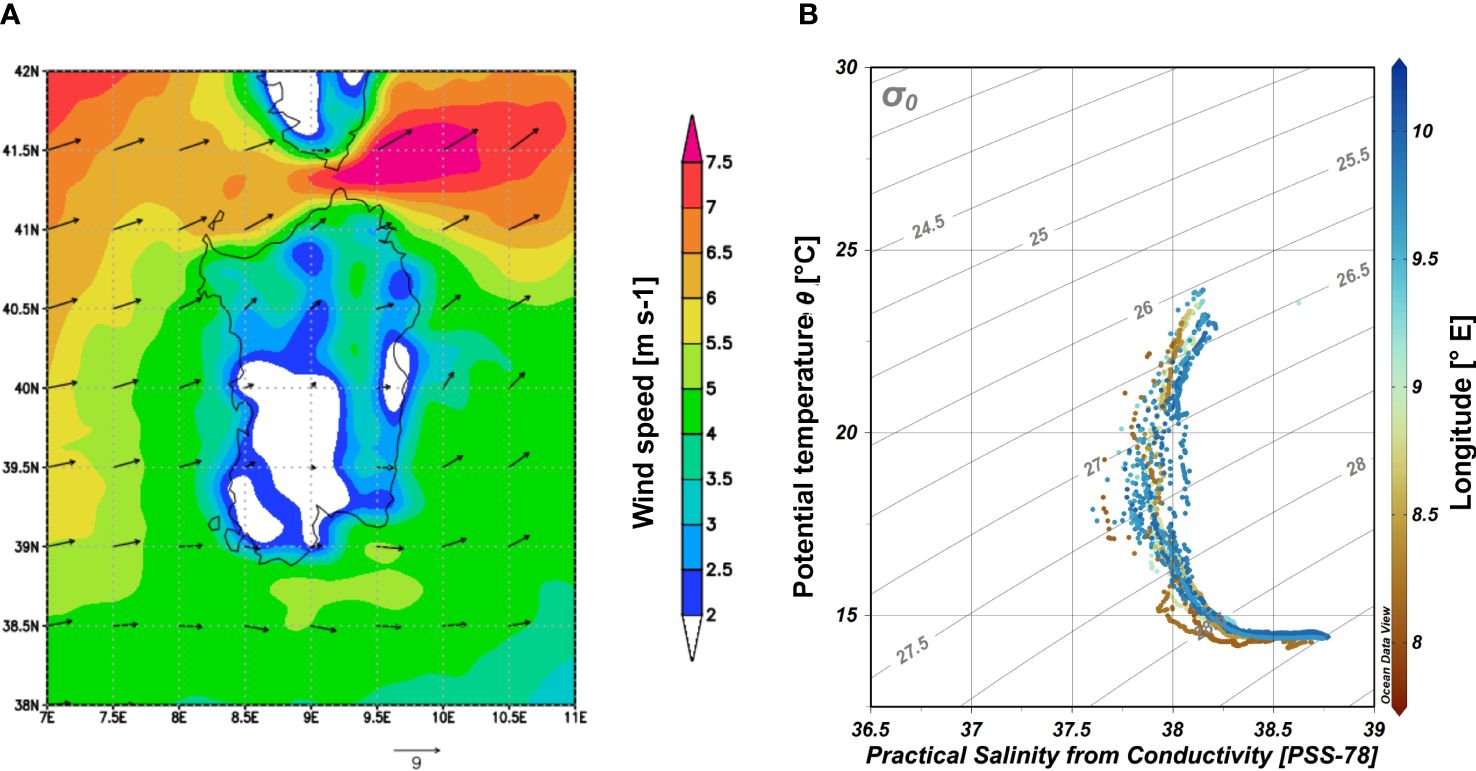
Figure 7 (A) Wind speed amplitude and direction averaged from the 1st to 7th October 2020. Unit is m s−1. The contour interval is 1.0 m s−1. wind speed amplitudes < 2 m s−1 are not plotted. (B) θ-S diagram of the data collected in early autumn 2020 along the southwestern and eastern continental shelf of Sardinia (see Figure 1B and Table 1). Colours show the spatial distribution in longitude of the casts. The contour interval of the potential density anomaly is 0.5 kg m−3.
The relationship between temperature and salinity is described by the θ-S diagram depicted in Figure 7B, with temperature ranging between ∼24°C at the surface and ∼14.8°C at the bottom, while salinity between ∼37.65 to ∼38.7, respectively at both the surface and the bottom. In this case, the spatial variability of salinity was significantly reduced compared to the previous survey carried out in late summer 2019 (Figure 3). Moreover, the AW core was 37.65 (cast ST10 in Figure 1B), that is +0.6 higher than previous observations.
The AW appeared as a fresher AW tongue (S<38) elongated northward (Figure 8A) with its core located at 40 m depth up to 300 km. The layer of AW sunk down to 70 m depth between 300 and 400 km. This region was also characterised by a homogeneous upper thermal layer (Figure 8B). The observed temperature was ∼23°C, while a warmer water with a maximum temperature of ∼24°C was measured between 100–200 km, down to about 30 m depth. Below, the temperature decreased forming a sharp thermocline and then slowly with depth, up to 14.45 ± 0.08°C measured at 200 m. Compared with the same depth in the previous cruise here the temperature is higher of +0.4°C and a mean salinity of 38.69 ± 0.04 was observed. This increase in temperature is due to the progressive sinking of surface heat energy during early autumn and the temperature field drives the potential density field, as shown in Figure 8C. The interface between the upper layer of AW and the water masses below varied approximately from 125 m to 100 m northward.
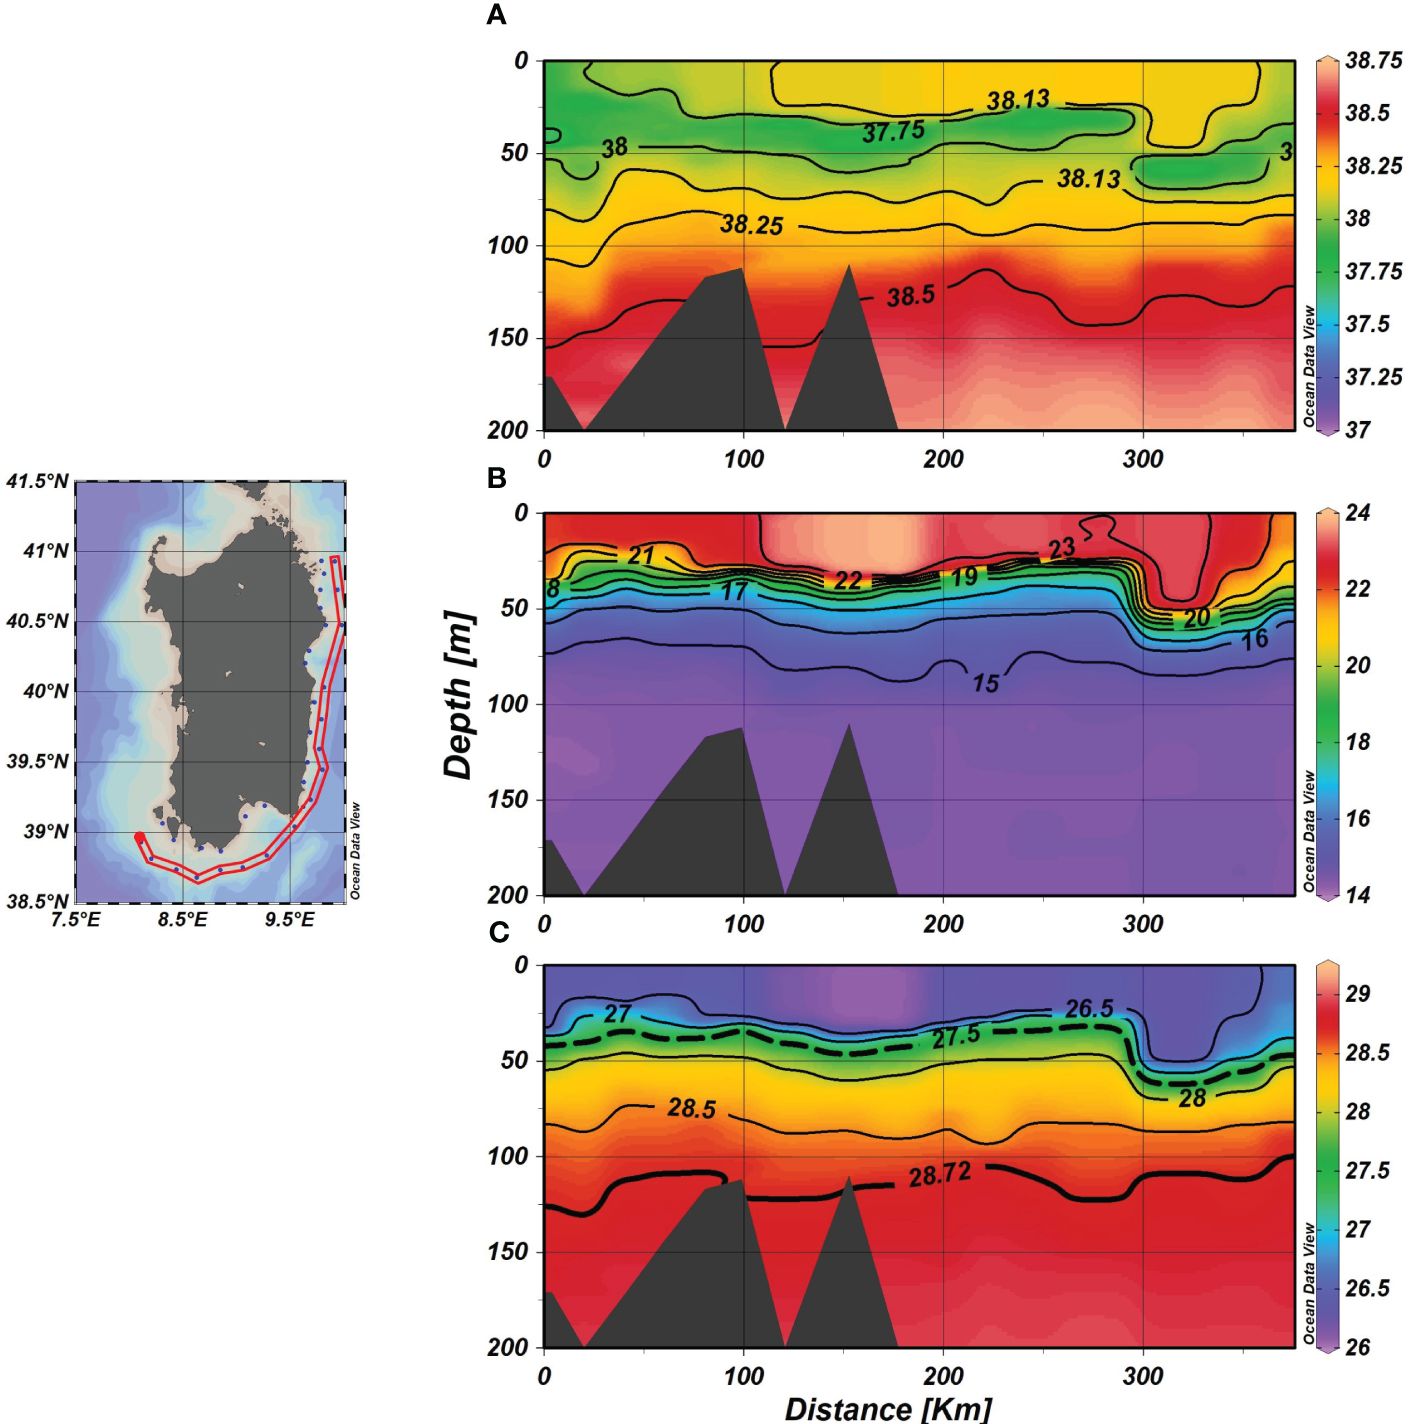
Figure 8 (A) Vertical distribution of the potential density anomaly [kg m−3]; (B) salinity; (C) temperature [°C] along-track (km) from the red point to northward (see left panel) observed in the upper 200 m on early fall 2020. In panel (A), the isopycnal 28.72 Kg·m−3 (the bold black line) represents the lowest boundary of AW as defined by Knoll et al. (2017), while 27.5 kg m−3 is the deepest limit of the fresher AW.
The average surface salinity and velocity fields from the CMEMS database show (Figure 9) the water column at the south-west continental shelf characterised by a salinity front located between the elongated AE1 and the SESG (Figure 9A). In the centre of AE1 (ϕ=38°N, λ=8°E), the simulated salinity at the surface was ∼36.9 while the core of the AW was characterised by a salinity of 36.7 at 40 m depth. The salinity front extended from the Sardinian coast towards Tunisia forming an intense southern stream current of about 0.4 m s−1 that converged with the AC flowing along the northern African coast, in agreement with Millot (1985). The southern stream current is known as the Southerly Sardinia Current [SSC in Pinardi et al. (2015)] and has been confirmed by the recent analysis of surface drifters (Poulain et al., 2012). The SSC flows southerly along the western Sardinia shelf break, forming a weak salinity front. Due to the few CTD observations carried out on the continental shelf break, the existence of this front is not clearly evidenced. The model salinity bias (cast ST10 in Figure 1B) at the AW core was +0.08 with a temperature bias of +1.07°C.
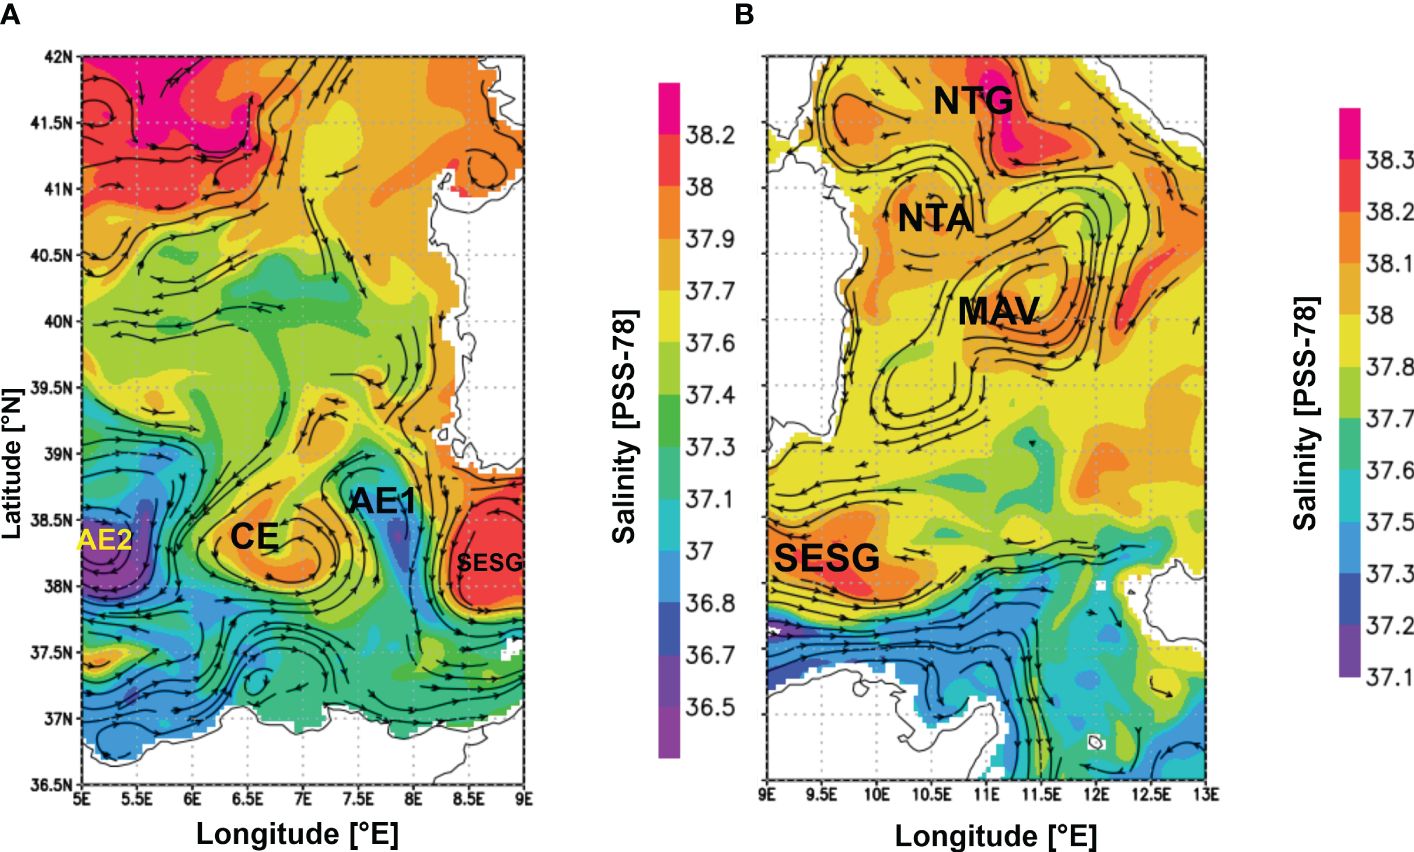
Figure 9 Spatial distribution for salinity and streamlines of the velocity re-analyses field simulated by CMEMS. (A) the fields for the eastern Algerian Sea; (B) at the western Tyrrhenian Sea at 35 m depth (the AW core depth). The salinity and velocity fields are daily mean on October 1st 2020 (A) and the average field between 7th-10th October 2020 (B). Different palettes are used to evidence the horizontal gradients of the salinity field in each panel.
On the southern and eastern continental shelf of Sardinia, the circulation was driven by the SESG, the anticyclonic gyre NTA and a Mesoscale Anti-cyclonic Vortex (MAV), both located in the western Tyrrhenian Basin (Figure 9B). Specifically, the MAV appeared in the form of an elliptic feature (along the southwestnortheast axis) located between 10 - 12.5°E and 39 – 41°N, while the NTA was located at 10.5°E and 37.5°N, further westward compared to the previous cruise in 2019. The SESG is also detected by the modelled salinity and velocity fields in Sardinia Channel. It cyclonically drives part of the eastward AW flow at the southern part of the Sardinia Channel towards the Sardinia coast, inducing a westward current in the northern part of the channel, as described also by Rinaldi et al. (2010) and by hydrological measurements (Sparnocchia et al., 1999; Astraldi et al., 2002) During this cruise, the MTC was not detected, while NTA and MAV appeared as large anti-cyclonic features that facilitated the spreading of the AW towards the centre of the Tyrrhenian basin and the eastern Sardinian coast. This was due to the interaction between the SESG and the MAV by the formation of a westward current flowing along the northern side of the SESG towards the Sardinian coast. This current influenced the thermohaline features of the water column up to the continental shelf of Sardinia with a signature of AW that appeared more marked compared to the previous cruise (Figures 3D, 8A). This is confirmed by the quality assessment performed on the CMEMS dataset in correspondence to the AW cores at specific CTD casts. Specifically, at 44 m depth of the cast ST82 the bias was +0.04 for salinity and -1.9°C for temperature, at 32 m of the cast ST70 was +0.05 and +1.6°C, while at 58 m of the cast ST65 was +0.21 and -0.74°C, respectively. Vice-versa, as already described in the previous section, the interaction between the north-eastern coast of Sardinia and the cyclonic and anti-cyclonic circulation induced by the NTG and the NTA, affected the water column characteristics resulting in the doming of superficial warmer and saltier water up to a depth of 50 m as shown in Figures 8A–C, between 200 and 300 km. At this depth, the core of the AW was characterised by 37.9 and the bias data was -0.08 for salinity and +0.1°C for temperature.
3.3 The cruise IDMAR 2021
This cruise was carried out from August 29st to September 4th2021 in the southwestern and eastern continental shelf (Figure 1C). The average wind speed field, throughout the measurement period and on the continental shelf, was less than 2.5 m s−1 and the direction was mainly from the north (Figure 10A).
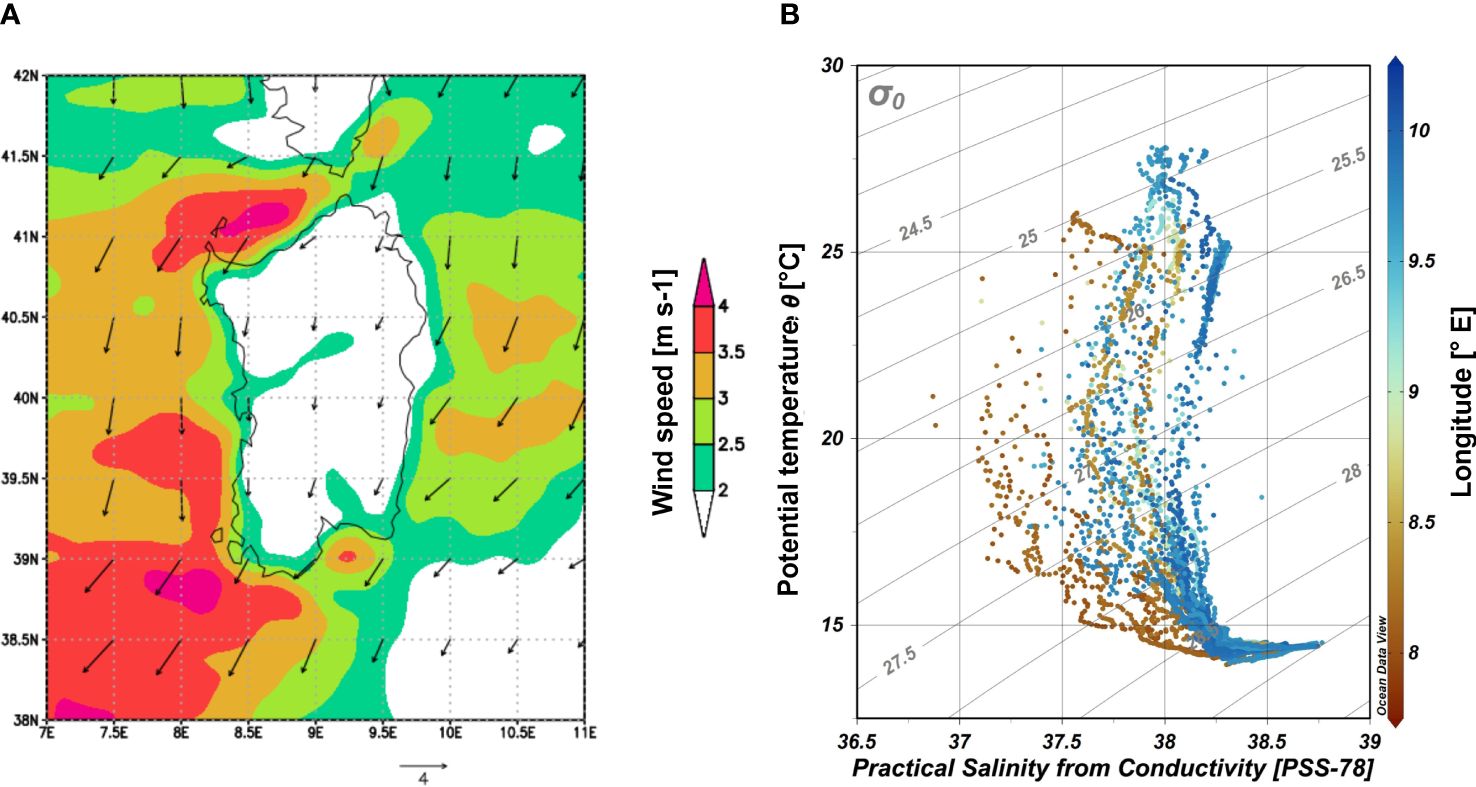
Figure 10 (A) Wind speed amplitude and direction field averaged from the 29th August to 4th September 2020. The wind speed unit is m·s−1. The contour interval is 0.5 m s−1. wind speed amplitudes < 2 m s−1 are not plotted. (B) θ-S diagram of the data collected in late summer 2021 during the CTD survey IDMAR2021 along the southwestern and eastern continental shelf of Sardinia (see Figure 1C and Table 1). Colours show the spatial distribution in longitude of the casts. The contour interval of potential density anomaly is 0.5 kg m−3.
The water column was again mainly affected by the AW and its progressive mixing with deeper waters (Figure 10B). The temperature ranged from ∼27.5°C at the surface, on the eastern continental shelf, to ∼14°C at the bottom, while the salinity ranged from a minimum of ∼36.87, observed on the western continental shelf, to a maximum of ∼38.95 at the bottom. Moreover, the spatial distribution of salinity on the eastern continental shelf was lower, compared to the western side. Vice-versa, the variability of potential temperature was higher.
The vertical distribution of the salinity field observed along-track is reported in Figure 11A. The AW affected the water column with patches of fresher AW (S<37.25) in the upper layer between the sea surface and 50 m depth within the first 100 km, i.e., on the southwest continental shelf. The core was characterised by a salinity of 36.87 observed at 33 m depth in correspondence of the cast ST16 (Figure 1C). Other patches of fresher AW, characterised by a minimum of salinity lower than 37.75, were detected between 200 and 400 km, i.e. on the eastern continental shelf into the surface layer between 20 and 50 m depth. Above this layer, the water column was characterised by relatively warmer (θ ∼27.5°C) water masses (Figure 11B). The maximum vertical extension of the mixed layer was found in correspondence of the casts located in the north-eastern section, at about 400 km, where the upper thermocline boundary was detected at about 40 m depth. Away from this warmer region, the mean thermocline depth slightly decreased. Along the thermocline layer the temperature decreased from 22.5°C to 17.5°C between 40 and 70 m depth. Below the thermocline, the temperature slowly decreased along the deeper water column. The mean temperature at 200 m depth was 14.39 ± 0.02°C, while the salinity was 38.61 ± 0.02. Both values are like those observed during the cruise carried out in late summer 2019. The interface between the upper AW layer and the underlying lay was detected at approximately 140 m depth, except northward where it raised to 100 m depth (Figure 11C). Vice-versa, the density interface (σθ=27.5 kg m−3), that separates the superficial fresher AW layer from the deeper saltier and colder layers, was detected at about 50 m depth along most of the track rising to the surface just between the 400 and 500 km.
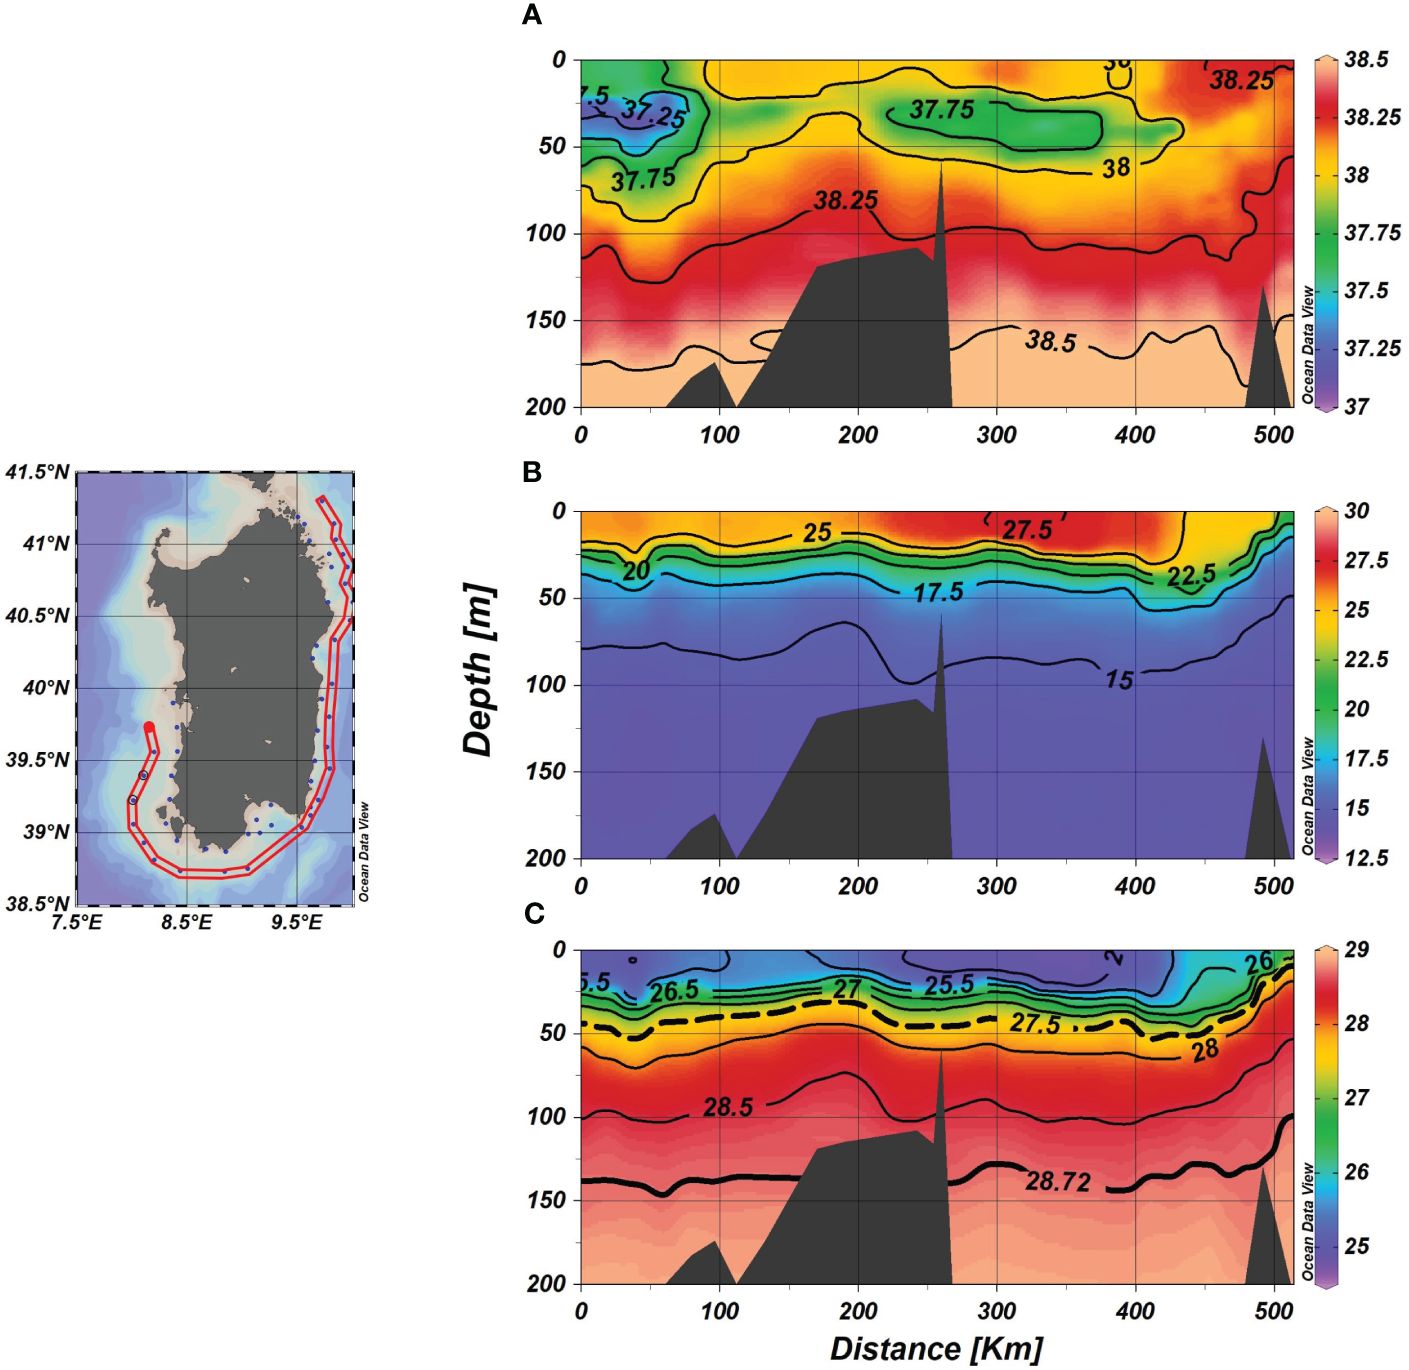
Figure 11 (A) Vertical distribution of temperature [°C]; (B) salinity; (C) potential density anomaly [kg m−3] along-track observed in the upper layer (0–200 m) in late summer 2021. In panel (C), the isopycnal 28.72 Kg m−3 (the bold black line) represents the lowest boundary of AW as defined by Knoll et al. (2017), while 27.5 kg m−3 is the deepest limit of the fresher AW.
Average salinity and velocity fields calculated from the CMEMS modelling dataset show (Figure 12) a circulation in the Sardinia Sea characterised by the presence of AEs and the SESG. The latter appeared to be wider compared to previous cruises, extending westward until the meridian 8°E and moving offshore along the WSC (Figure 12A). The western limit of the SESG constrained the spreading of the fresher AW directly from the centre of the Algerian Basin by AE2 and affecting the water column in the centre of the western continental shelf, in agreement with the CTD observations (Figure 11A). In this region (cast ST13 in Figure 1C), within the first 100 km, the bias between modelled and observed data at 20 m, corresponding to the depth of the AW core, was +0.6 for salinity and +0.8°C for temperature.
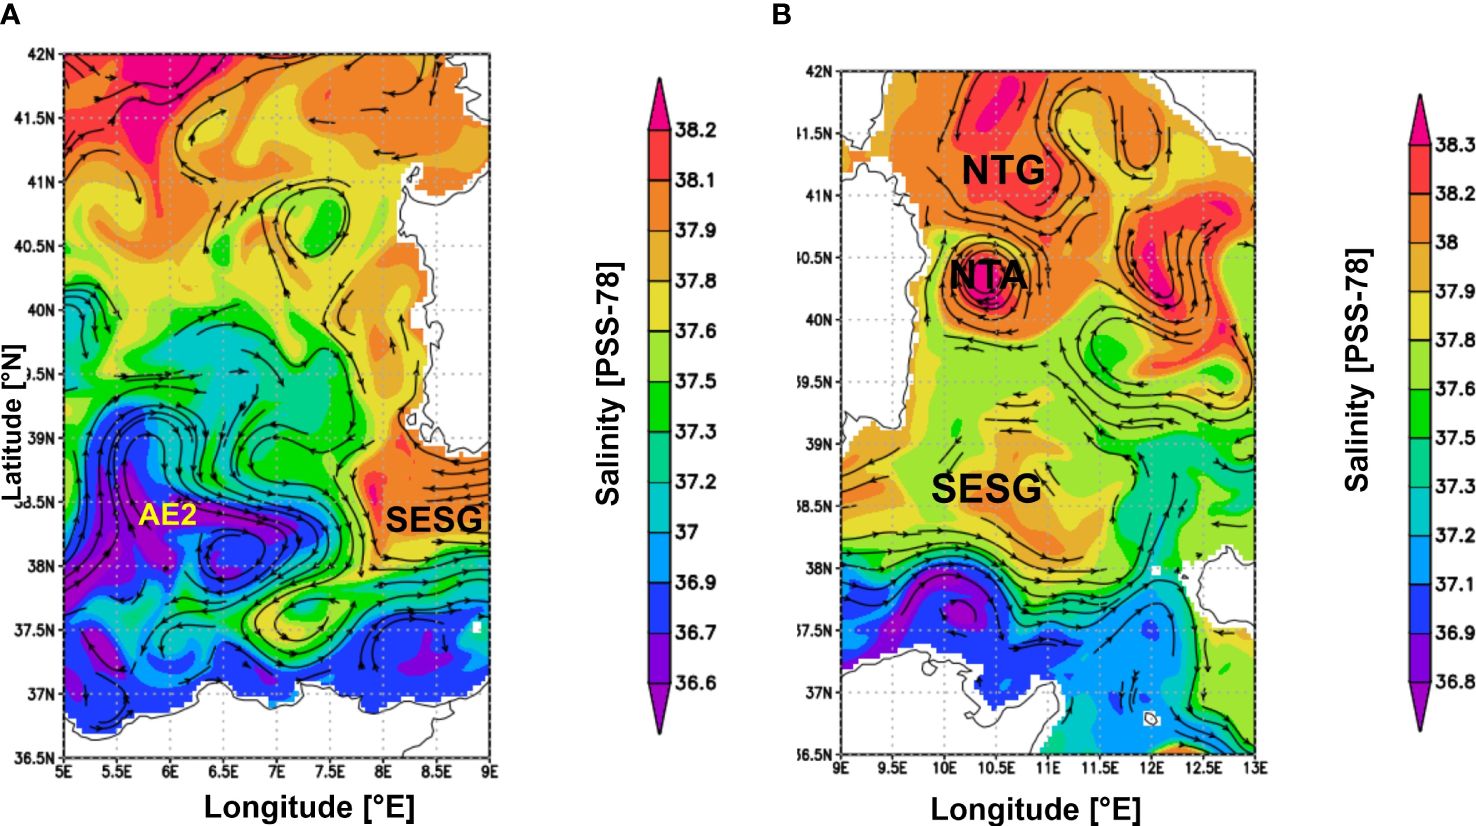
Figure 12 Spatial distribution for salinity and streamlines of the velocity re-analyses field simulated by CMEMS. (A) for the eastern Algerian Sea; (B) western Tyrrhenian Sea at 35 m depth (the AW core depth). The salinity and velocity fields are daily mean field on September 1st 2021 (A) and daily average fields between 29th and 30th August 2021 (B). Different palettes are used to evidence the horizontal gradients of the salinity field in each panel.
On the southern and eastern continental shelf area the circulation was mainly driven by the SESG and the NTA (Figure 12B). The SESG was very wide and covered the whole Sardinia Channel. The anti-clockwise circulation induced by the SESG eddies mainly affected the water column of the CTD cast located on the south-eastern continental shelf resulting from the formation of veins of fresh AW coming directly from the middle Tyrrhenian basin. The NTA was centred at ϕ=40.4°N, λ=10.5°E, with an advected part of the AW from the middle Tyrrhenian basin towards the Sardinian coast. This stream current contributed to the signatures of AW between 200–400 m depth as observed in Figure 11A. In this region (cast ST72 in Figure 1C), the bias was +0.37 for salinity and +1.12°C for temperature. Over 400 km, the water mass characteristics were affected by the circulation induced by the NTA and the NTG. The clockwise circulation induced by the NTA carried the AW toward the northern continental shelf. At the cast ST65 (Figure 1C), the bias at the AW core depth, at about 40 m, was -0.01 for salinity and -0.189°C for temperature. The influence of the NTA at the coast of Sardinia deviated the AW branch offshore. Upwind the salinity front, the model salinity bias at about 35 m of the cast ST56 (Figure 1C) was +0.69 with a temperature bias of +0.73°C.
3.4 Interannual variability of the AW signature
The interannual variability of the AW has been analysed considering, for each oceanographic survey, the mean values of the salinity minimum (Smin), the averaged potential temperature (θSmin) and the potential density anomaly (σSmin), at the same depth of Smin (i.e, the depth of AW core, hereafter HSmin), for the western (λ<9.0°E) and the eastern (λ>9°E) continental shelf.
From 2019 to 2021, Smin ranged from the minimum value of 37.54 ± 0.33 in 2021 to the maximum of 37.88 ± 0.10 in 2020 on the western continental shelf (Figure 13A). The average Smin value, computed throughout the three measurement periods, was 37.69 ± 0.24, with the highest spatial variability observed in 2021 (σ=0.33). At the eastern continental shelf, Smin ranged from 37.81 ± 0.25 in 2021 to 38.04 ± 0.11 in 2019. The mean value computed for all periods was 37.91 ± 0.16, on average higher than the western, but with a lower spatial variability. The minimum values of Smin were in 2021, due to the greater impact of the AW induced by the circulation at the western and eastern continental shelves, as described in Section 3.3. A lower spatial variability of Smin occurred in early fall 2020 (σ=0.12), when also low values of θSmin were detected (Figure 13B). Specifically, θSmin ranged between the minimum value of 19.83 ± 1.6°C in 2020 to a maximum of 20.90 ± 1.48°C in 2021, on the western continental shelf, while it ranged between 19.55 ± 1.83°C in 2020 to the maximum of 21.09 ± 2.45°C in 2019 on the eastern shelf. The HSmin varied around the mean depth of about 30.9 ± 11.2 m (Figure 13C).
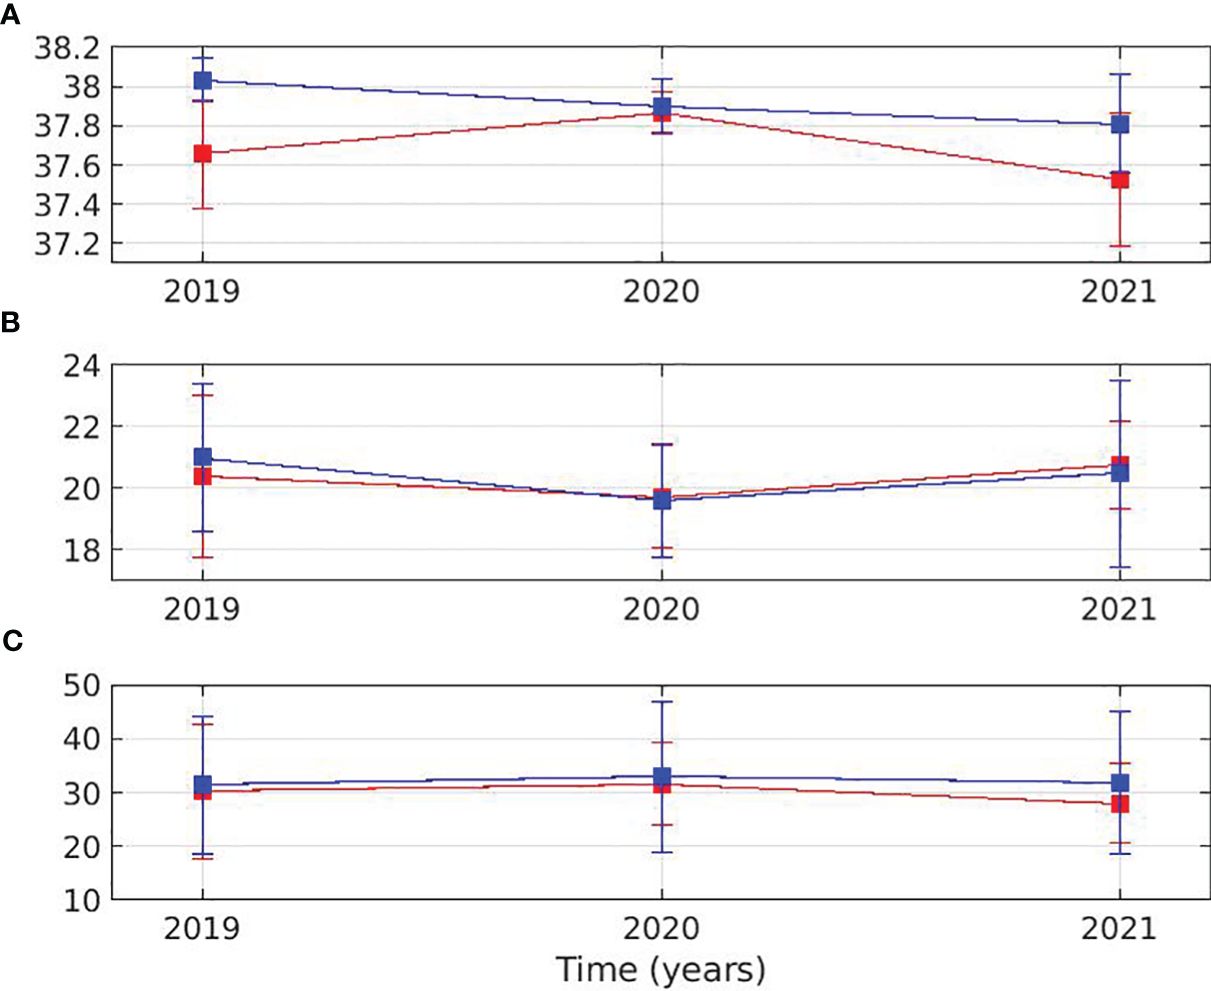
Figure 13 Interannual variability time series for: (A) Smin; (B) TSmin[°C]; (C) HSmin [m] from 2019 to 2021 on the western (red line) and eastern (blue line) continental shelf. The square symbol indicates the mean value, and the bars show the standard deviation (σ).
In the surface layer up to 20 m, the mean depth of the mixed layer, the interannual variability was marked, especially in terms of temperature (Figure 14A), influenced by different atmospheric forcings and conditions experienced at the time of three cruises. On the western continental shelf, the mean temperature ranged between the minimum value of 22.62 ± 0.96°C in 2020 and the maximum value of 24.76 ± 1.91°C in 2021, while the variation on the eastern shelf was between 22.65 ± 0.96°C in 2020 and 25.50 ± 0.39°C in 2019. The latter value was the highest observed during the IDMAR cruises. The mean lowest temperature was in 2020, when the survey was carried out in early fall, hence increasing the mean density field (Figure 14B). The salinity on the western continental shelf was always lower than on the eastern side (Figure 14C). The main value was 37.94, against 38.14 in the east.
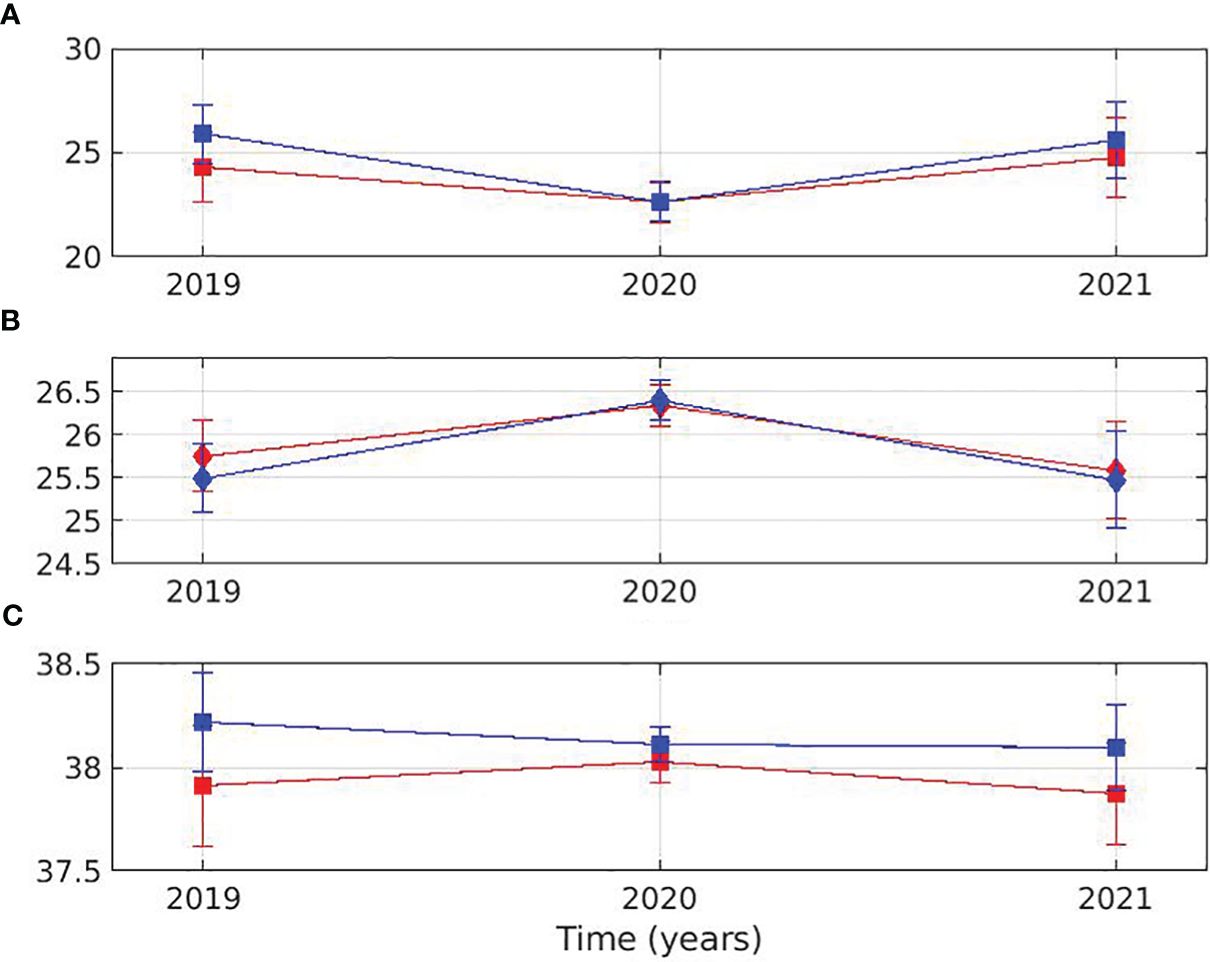
Figure 14 Interannual variability time series for: (A) potential temperature [°C]; (B) potential density anomaly [Kg m−3]; (C) salinity from 2019 to 2021 on the western (red line) and eastern (blue line) continental shelf computed into the surface layer (0–20 m). The square symbol indicates the mean value, and the bars show the standard deviation (σ).
4 Summary and conclusion
CTD casts acquired around Sardinia during three dedicated oceanographic cruises carried out in late summer 2019 and 2021, and early autumn 2020 (Table 1) have been analysed from the sea surface down to 200 m depth and supported by satellite remote sensing and ocean numerical modelling products. During each cruise, the weather on the study area was stable and influenced by weak winds. The AW was the main water mass observed to affect the upper layer of the water column from the sea surface to the intermediate depth, between 100 and 150 m. The AW signature displays an interannual variability. Specifically, on the western continental shelf the AEs spread the AW towards the south-western continental shelf as patches of fresher (S<37.0) and less dense Atlantic waters coming from the Algerian basin. The AW core was observed at about 50 m depth. In summer 2019, along the central-northern coast, the hydrographic characteristics of the water column showed AW signatures detected in the form of salinity values of about 37.2 at 40 m depth. These signatures were induced by the spreading of the AEs from the centre of the Algerian Basin. Downstream of Cape Caccia (north-west Sardinia), the interaction between the alongshore wind, the WSC, the geometry of the coast, and the bathymetry modified the hydrological characteristics and induced the formation of a coastal upwelling. The observed horizontal temperature anomaly was about -3°C, compared to the warmer surrounding waters. Vice-versa, on the eastern continental shelf, the circulation was mainly represented by the SESG in the Sardinia Channel, and by the Bonifacio Gyre and mesoscale features of the NTG in the Tyrrhenian Sea. The interaction between SESG and NTG modified the AW stream flowing towards the Tyrrhenian basin, thus deviating part of the AW on the southern and eastern Sardinia continental shelf. These currents influenced the thermohaline features of the water column with patches of fresher AW characterised by a minimum of salinity of 37.5 observed in the layer at 35–40 m depth. The AW transport towards the Sardinia eastern coast appeared strongly modified by the presence of the MTC, that spreads a large portion of the AW towards the middle and eastern side of the Tyrrhenian Basin, compared to the eastern Sardinian coast as shown during the cruise carried out in 2019. Another dynamical feature that affected the water mass characteristics at the north-eastern continental shelf was that due to the interaction between the coast, the North Tyrrhenian Anti-cyclonic gyre, and NTG, which induced the doming of the superficial waters up to 50 m depth. The signature of this feature was observed across all the surveys.
In conclusion, the analyses of the CTD data provided a picture of the Sardinian coastal hydrology in late summer of 2019 and 2021 and early autumn 2020, identifying the hydrological differences between the western and eastern continental shelf of Sardinia and the spatial and interannual variability of the Atlantic Water. AW represents the main water mass characterising the upper layer of the water column between 100 and 150 m depth. Moreover, supported by satellite and ocean model products, the results highlight the link between the mesoscale features of the surface circulation and the water column characteristics of the Sardinian continental shelf, namely the AEs and the WSC on the western continental shelf, and the SESG, the North Tyrrhenian Anti-cyclonic Gyre, the NTG and the mesoscale features on the eastern continental shelf.
The three IDMAR cruises served to collect data and biological samples for multidisciplinary studies on the marine ecosystems in Sardinian waters. Similarly to what was done in other areas of the Mediterranean (Passaro et al., 2014; Bonanno et al., 2015; Basilone et al., 2017; Bonanno et al., 2018; Manno et al., 2019), the results obtained from this study constitute an important reference for studies aimed at assessing the influence of environmental variables on the first levels of the trophic web (phytoplankton, micro- and meso-zooplankton, fish species) in the waters around Sardinia, and for studies on the habitat suitability of marine species of commercial and non-commercial importance. Furthermore, the described ocean dynamics define a solid benchmark to quantify the possible effects of climate change on the marine ecosystems (Barange et al., 2014). Nonetheless, it remains imperative to plan and carry out further multidisciplinary research surveys in this peculiar area of the Mediterranean Sea to acquire longer-term environmental data series and to delve further into the dynamics of deep ocean circulation and thermohaline features.
Data availability statement
The datasets presented in this study can be found in online repositories. The names of the repository/repositories and accession number(s) can be found below: SEANOE repository https://doi.org/10.17882/99196.
Author contributions
RS: Writing – original draft, Methodology, Writing – review & editing, Validation, Formal analysis, Conceptualization. FP: Writing – original draft, Conceptualization. AFD: Writing – review & editing. AR: Methodology, Data curation, Writing – review & editing, Formal analysis, Conceptualization. SG: Investigation, Writing – review & editing. MB: Writing – review & editing, Investigation. AP: Formal analysis, Writing – review & editing. GQ: Writing – review & editing. AC: Writing – review & editing. IF: Investigation, Writing – review & editing. GG: Investigation, Writing – review & editing. GB: Investigation, Writing – review & editing. ADM: Writing – original draft, Validation, Formal analysis, Conceptualization. AE: Writing – review & editing, Software. AB: Writing – original draft, Project administration, Investigation, Formal analysis, Data curation.
Funding
The author(s) declare financial support was received for the research, authorship, and/or publication of this article. The oceanographic data collection for this work was supported by the Infrastruttura di ricerca Distribuita in MARe (transl. Distributed Research Infrastructure in the Sea or IDMAR) Project funded by Consiglio Nazionale delle Ricerche and Programma Operativo Regionale “Sicily 2014–2020” in the framework of the European Regional Development Fund (ERDF). This study was supported by the National Recovery and Resilience Plan (NRRP), Mission 4 Component 2 Investment 1.4 – Call for tender No.3138 of 16 December 2021, rectified by Decree n.3175 of 18 December 2021 of Italian Ministry of University and Research funded by the European Union - NextGenerationEU. Project code CN 00000033, Concession Decree No. 1034 of 17 June 2022 adopted by the Italian Ministry of University and Research, CUP B83C22002930006, Project title “National Biodiversity Future Center – NBFC”.
Acknowledgments
We thank the captain and the cruise of R/V G. Dallaporta for their great support during the three cruises. We want to remind and dedicate this paper to our great friend and colleague Dr. Salvatore Mazzola, on whose work and teachings the IDMAR project is based, prematurely taken away by COVID-19 on January 17th 2021. The authors thank the two reviewers for their useful comments and suggestions.
Conflict of interest
The authors declare that the research was conducted in the absence of any commercial or financial relationships that could be construed as a potential conflict of interest.
The author(s) declared that they were an editorial board member of Frontiers, at the time of submission. This had no impact on the peer review process and the final decision.
Publisher’s note
All claims expressed in this article are solely those of the authors and do not necessarily represent those of their affiliated organizations, or those of the publisher, the editors and the reviewers. Any product that may be evaluated in this article, or claim that may be made by its manufacturer, is not guaranteed or endorsed by the publisher.
References
Artale V., Astraldi M., Buffoni G., Gasparini G. P. (1994). Seasonal variability of gyre-scale circulation in the northern tyrrhenian sea. J. Geophysical Research: Oceans 99, 14127–14137. doi: 10.1029/94JC00284
Astraldi M., Gasparini G. P., Sparnocchia S., Moretti M., Sansone E. (1996). “The characteristics of the water masses and the water transport in the sicily strait at long time scales,” in Dynamics of Straits and Channels, vol. 2. (CIESM, Monaco), 95–118.
Astraldi M., Gasparini G., Vetrano A., Vignudelli S. (2002). Hydrographic characteristics and interannual variability of water masses in the central mediterranean: a sensitivity test for long-term changes in the mediterranean sea. Deep Sea Res. Part I: Oceanographic Res. Papers 49, 661–680. doi: 10.1016/S0967-0637(01)00059-0
Barange M., Merino G., Blanchard J., Scholtens J., Harle J., Allison E., et al. (2014). Impacts of climate change on marine ecosystem production in societies dependent on fisheries. Nat. Climate Change 4, 211–216. doi: 10.1038/nclimate2119
Barral Q.-B., Zakardjian B., Dumas F., Garreau P., Testor P., Beuvier J. (2021). Characterization of fronts in the western mediterranean with a special focus on the north balearic front. Prog. Oceanography 197, 102636. doi: 10.1016/j.pocean.2021.102636
Basilone G., Mangano S., Pulizzi M., Fontana I., Giacalone G., Ferreri R., et al. (2017). European anchovy (engraulis encrasicolus) age structure and growth rate in two contrastedareas of the mediterranean sea: The paradox of faster growth in oligotrophic seas. Mediterr. Mar. Sci. 18, 504. doi: 10.12681/mms.2059
Benzohra M., Millot C. (1995). Characteristics and circulation of the surface and intermediate water masses off Algeria. Deep Sea Res. Part I: Oceanographic Res. Papers 42, 1803–1830. doi: 10.1016/0967-0637(95)00043-6
Béranger K., Mortier L., Gasparini G.-P., Gervasio L., Astraldi M., Crépon M. (2004). The dynamics of the sicily strait: a comprehensive study from observations and models. Deep Sea Res. Part II: Topical Stud. Oceanography 51, 411–440. doi: 10.1016/j.dsr2.2003.08.004
Bonanno A., Barra M., Mifsud R., Basilone G., Genovese S., Di Bitetto M., et al. (2018). Space utilization by key species of the pelagic fish community in an upwelling ecosystem of the mediterranean sea. Hydrobiologia 821, 173–190. doi: 10.1007/s10750-017-3350-9
Bonanno A., Zgozi S., Basilone G., Hamza M., Barra M., Genovese S., et al. (2015). Acoustically detected pelagic fish community in relation to environmental conditions observed in the central mediterranean sea: a comparison of Libyan and sicilian– maltese coastal areas. Hydrobiologia 755, 209–224. doi: 10.1007/s10750-015-2234-0
Colas F., McWilliams J., Capet X., Kurian J. (2012). Heat balance and eddies in the Peru-Chile current system. Climate Dynamics - CLIM DYNAM 39, 1–21. doi: 10.1007/s00382-011-1170-6
Cotroneo Y., Aulicino G., Ruiz S., Sánchez Román A., Torner Tomàs M., Pascual A., et al. (2019). Glider data collected during the Algerian basin circulation unmanned survey. Earth System Sci. Data 11, 147–161. doi: 10.5194/essd-11-147-2019
Escudier R., Clementi E., Cipollone A., Pistoia J., Drudi M., Grandi A., et al. (2021). A high resolution reanalysis for the mediterranean sea. Front. Earth Sci. 9. doi: 10.3389/feart.2021.702285
Escudier R., Clementi E., Omar M., Cipollone A., Pistoia J., Aydogdu A., et al. (2020). Mediterranean sea physical reanalysis (cmems med-currents). doi: 10.25423/CMCC/MEDSEA_MULTIYEAR_PHY_006_004_E3R1
Fuda J., Millot C., Taupier-Letage I., Send U., Bocognano J. (2000). Xbt monitoring of a meridian section across the western mediterranean sea. Deep Sea Res. Part I: Oceanographic Res. Papers 47, 2191–2218. doi: 10.1016/S0967-0637(00)00018-2
Iacono R., Napolitano E., Palma M., Sannino G. (2021). The tyrrhenian sea circulation: A review of recent work. Sustainability 13, 1–13. doi: 10.3390/su13116371
Kampf J., Chapman P. (2016). Upwelling Systems of the World (Cham: Springer). doi: 10.1007/978-3-319-42524-5
Knoll M., Borrione I., Fiekas H.-V., Funk A., Hemming M. P., Kaiser J., et al. (2017). Hydrography and circulation west of sardinia in june 2014. Ocean Sci. 13, 889–904. doi: 10.5194/os-13-889-2017
Krivosheya V. (1983). Water circulation and structure in the tyrrhenian sea. Oceanology 23, 166–171.
Krivosheya V., Ovchinnikov I. (1973). Peculiarities in geostrophic circulation of waters of the tyrrhenian sea. Oceanology 13, 822–827.
Llinás L., Pickart R. S., Mathis J. T., Smith S. L. (2009). Zooplankton inside an arctic ocean coldcore eddy: Probable origin and fate. Deep Sea Res. Part II: Topical Stud. Oceanography 56, 1290–1304. doi: 10.1016/j.dsr2.2008.10.020
López Garciá M. J., Millot C., Font J., García-Ladona E. (1994). Surface circulation variability in the Balearic Basin. J. Geophysical Res. 99, 3285–3296. doi: 10.1029/93JC02114
Mancho A. M., Hernández-García E., Small D., Wiggins S., Fernández V. (2008). Lagrangian transport through an ocean front in the northwestern mediterranean sea. J. Phys. Oceanography 38, 1222–1237. doi: 10.1175/2007JPO3677.1
Manno C., Rumolo P., Barra M., d’Albero S., Basilone G., Genovese S., et al. (2019). Condition of pteropod shells near a volcanic co2 vent region. Mar. Environ. Res. 143, 39–48. doi: 10.1016/j.marenvres.2018.11.003
McGillicuddy D. J. (2016). Mechanisms of physical-biological-biogeochemical interaction at the oceanic mesoscale. Annu. Rev. Mar. Sci. 8, 125–159. doi: 10.1146/annurev-marine-010814-015606
Millot C. (1985). Some features of the Algerian current. J. Geophysical Research: Oceans 90, 7169–7176. doi: 10.1029/JC090iC04p07169
Millot C., Taupier-Letage I. (2005). “Circulation in the Mediterranean Sea,” in The Mediterranean Sea (Springer Berlin Heidelberg, Berlin, Heidelberg), 29–66. doi: 10.1007/b107143
Nigam T., Escudier R., Pistoia J., Aydogdu A., Omar M., Clementi E., et al. (2020). Mediterranean sea physical reanalysis interim (cmems med-currents, e3r1i system) (version 1). doi: 10.25423/CMCC/MEDSEAMULTIYEARPHY006004E3R1I
Olita A., Ribotti A., Fazioli L., Perilli A., Sorgente R. (2013). Surface circulation and upwelling in the sardinia sea: A numerical study. Continental Shelf Res. 71, 95–108. doi: 10.1016/j.csr.2013.10.011
Olita A., Sparnocchia S., Cusí S., Fazioli L., Sorgente R., Tintoré J., et al. (2014). Observations of a phytoplankton spring bloom onset triggered by a density front in nw mediterranean. Ocean Sci. 10, 657–666. doi: 10.5194/os-10-657-2014
Onken R., Fiekas H.-V., Beguery L., Borrione I., Funk A., Hemming M., et al. (2018). High-resolution observations in the western mediterranean sea: the rep14-med experiment. Ocean Sci. 14, 321–335. doi: 10.5194/os-14-321-2018
Passaro S., Genovese S., Sacchi M., Barra M., Rumolo P., Tamburrino S., et al. (2014). First hydroacoustic evidence of marine, active fluid vents in the naples bay continental shelf (southern Italy). J. Volcanology Geothermal Res. 285, 29–35. doi: 10.1016/j.jvolgeores.2014.08.001
Pessini F., Cotroneo Y., Olita A., Sorgente R., Ribotti A., Jendersie S., et al. (2020). Life history of an anticyclonic eddy in the Algerian basin from altimetry data, tracking algorithm and in situ observations. J. Mar. Syst. 207, 103346. doi: 10.1016/j.jmarsys.2020.103346
Pessini F., Olita A., Cotroneo Y., Perilli A. (2018). Mesoscale eddies in the Algerian basin: do they differ as a function of their formation site? Ocean Sci. 14, 669–688. doi: 10.5194/os-14-669-2018
Pinardi N., Arneri A. E., Crise, Ravaioli M., Zavatarelli M. (2005). The Sea (Harvard UniversityPress), vol. 14B, chap. 32. The physical, sedimentary and ecological structure and variability of shelf areas in the Mediterranean Sea, 1243–1330. Available at: https://hdl.handle.net/11585/45709.
Pinardi N., Zavatarelli M., Adani M., Coppini G., Fratianni C., Oddo P., et al. (2015). Mediterranean sea large-scale low-frequency ocean variability and water mass formation rates from 1987 to 2007: A retrospective analysis. Prog. Oceanography 132, 318–332. doi: 10.1016/j.pocean.2013.11.003
Pisano A., Buongiorno Nardelli B., Tronconi C., Santoleri R. (2016). The new mediterranean optimally interpolated pathfinder avhrr sst dataset, (1982–2012). Remote Sens. Environ. 176, 107–116. doi: 10.1016/j.rse.2016.01.019
Poulain P.-M., Menna M., Mauri E. (2012). Surface geostrophic circulation derived from lagrangian drifter and satellite altimetry data. J. Phys. Oceanography 42, 973–990. doi: 10.1175/JPO-D-11-0159.1
Poulain P.-M., Zambianchi E. (2007). Surface circulation in the central mediterranean sea as deduced from lagrangian drifters in the 1990s. Continental Shelf Res. 27, 981–1001. doi: 10.1016/j.csr.2007.01.005
Puillat I., Taupier-Letage I., Millot C. (2002). Algerian eddies lifetime can near 3 years. J. Mar. Syst. 31, 245–259. doi: 10.1016/S0924-7963(01)00056-2
Pujol M.-I., Mertz F. (2020). Mediterranean sea gridded l4 sea surface heights and derived variables reprocessed [dataset]. Available at: https://resources.marine.copernicus.eu/?option=com_csw&view=details&product_id=SEALEVEL_MED_PHY_L4_REP_OBSERVATIONS_008_051.
Ribotti A., Bussani A., Menna M., Satta A., Sorgente R., Cucco A., et al. (2023). A mediterranean drifter dataset. Earth System Sci. Data 15, 4651–4659. doi: 10.5194/essd-15-4651-2023
Ribotti A., Di Bitetto M., Borghini M., Sorgente R. (2019a). Ctd profiles in western sardinia, (2000 - 2004), western mediterranean. doi: 10.17882/59867
Ribotti A., Perilli A., Sorgente R., Borghini M. (2019b). Hydrological profiles in the mediterranean sea, (2002 - 2006). doi: 10.17882/70340
Ribotti A., Puillat I., Sorgente R., Natale S. (2004). Mesoscale circulation in the surface layer off the southern and western sardinia island in 2000–2002. Chem. Ecol. 20, 345–363. doi: 10.1080/02757540410001727963
Rinaldi E., Buongiorno Nardelli B., Zambianchi E., Santoleri R., Poulain P.-M. (2010). Lagrangian and eulerian observations of the surface circulation in the tyrrhenian sea. J. Geophysical Research: Oceans 115, 1–13. doi: 10.1029/2009JC005535
Seyfried L., Estournel C., Marsaleix P., Richard E. (2019). Dynamics of the north balearic front during an autumn tramontane and mistral storm: air–sea coupling processes and stratification budget diagnostic. Ocean Sci. 15, 179–198. doi: 10.5194/os-15-179-2019
Sorgente R., Drago A. F., Ribotti A. (2003). Seasonal variability in the central mediterranean sea circulation. Annales Geophysicae 21, 299–322. doi: 10.5194/angeo-21-299-2003
Sparnocchia S., Gasparini G., Astraldi M., Borghini M., Pistek P. (1999). Dynamics and mixing of the eastern mediterranean outflow in the tyrrhenian basin. J. Mar. Syst. 20, 301–317. doi: 10.1016/S0924-7963(98)00088-8
Tabure G., Pujol M.-I. (2020). Quality information document for sea level TAC-DUACS products. Available at: https://marine.copernicus.eu/documents/QUID/CMEMS-SL-QUID-008-032-062.pdf.
Taupier-Letage I., Millot C. (1988). Surface circulation in the Algerian basin during 1984. Available at: https://archimer.ifremer.fr/doc/00267/37811/.
Taupier-Letage I., Puillat I., Millot C., Raimbault P. (2003). Biological response to mesoscale eddies in the Algerian basin. J. Geophysical Research: Oceans 108, 1–17. doi: 10.1029/1999JC000117
Vetrano A., Napolitano E., Iacono R., Schroeder K., Gasparini G. P. (2010). Tyrrhenian sea circulation and water mass fluxes in spring 2004: Observations and model results. J. Geophysical Research: Oceans 115, 1–18. doi: 10.1029/2009JC005680
Keywords: hydrology, mesoscale features, gyre, interannual variability, water masses, Sardinia shelf
Citation: Sorgente R, Pessini F, Drago AF, Ribotti A, Genovese S, Barra M, Perilli A, Quattrocchi G, Cucco A, Fontana I, Giacalone G, Basilone G, Di Maio A, Esposito A and Bonanno A (2024) Interannual variability of the hydrology on the Sardinia shelf. Front. Mar. Sci. 11:1411819. doi: 10.3389/fmars.2024.1411819
Received: 03 April 2024; Accepted: 07 June 2024;
Published: 27 June 2024.
Edited by:
Chunyan Li, Louisiana State University, United StatesReviewed by:
Manuel Vargas-Yáñez, Spanish Institute of Oceanography (IEO), SpainBéchir Béjaoui, Institut National des Sciences et Technologies de la Mer, Tunisia
Copyright © 2024 Sorgente, Pessini, Drago, Ribotti, Genovese, Barra, Perilli, Quattrocchi, Cucco, Fontana, Giacalone, Basilone, Di Maio, Esposito and Bonanno. This is an open-access article distributed under the terms of the Creative Commons Attribution License (CC BY). The use, distribution or reproduction in other forums is permitted, provided the original author(s) and the copyright owner(s) are credited and that the original publication in this journal is cited, in accordance with accepted academic practice. No use, distribution or reproduction is permitted which does not comply with these terms.
*Correspondence: Antonia Di Maio, YW50b25pYS5kaW1haW9AY25yLml0