Abstract
The Bohai Sea, known for being the lowest latitude seasonally frozen sea area in the world, experienced severe ice conditions with a 30-year recurrence period during the winter of 2009-2010. Water-sediment flux is a crucial parameter for water quality management in marine environment. Using a highly accurate three-dimensional hydrodynamic and sediment transport numerical model, the significant wave height (Hs), current velocity, suspended sediment concentration (SSC) and water-sediment flux in the Bohai Sea during ice-covered and ice-free conditions are compared. Our findings indicate that the current velocity and sediment resuspension decrease under the ice coverage, but increase at the edge of the ice. The net outflow tidal flux (TF) in winter under ice-free conditions accounts for 24.5% of the whole year. The net outflow TF increases by 32.7% during ice-covered conditions, primarily due to the pressure difference between high air pressure superimposing heavy sea ice in the northwest Bohai Sea and the low air pressure in Bohai Strait, resulting in increased ebb velocity and decreased flood velocity. The net outflow suspended sediment flux (SSF) during ice-free conditions in the winter is 2.32×10⁹ kg, while SSF increases by 1.24 times during ice-covered conditions, leading to worse water quality in the outer sea. The decrease of TF in the southern part of the Bohai Strait and the reduction of suspended sediment concentration by nearly 15 mg/l lead to the significant decrease in SSF. This study has significance guiding value for understanding the source-sink sedimentation system and water quality research in East China Sea.
Highlights
-
The current velocity reduces by direct ice cover, but increases along ice edge.
-
The area where the velocity increases during ebb tide is larger during ice cover.
-
The net outflow water-sediment flux from the Bohai Sea increase under ice cover.
-
The net outflow tidal flux increases by 32.7% due to the pressure difference.
-
The net outflow suspended sediment flux increases by 1.24 times.
1 Introduction
The Bohai Sea, known for being the lowest latitude seasonally frozen sea area in the northern hemisphere (Wang et al., 2021; Li et al., 2024), freezes for approximately 3-4 months annually (Su and Wang, 2012). Sea ice poses threats to marine transportation safety, oil platform structural safety, offshore engineering operations, as well as aquaculture (Zhang and Li, 1999; Zhang et al., 2018; Zhou et al., 2023; Wang et al., 2024). Additionally, the Yellow River carries around 1.1 billion tons of sediment into the Bohai Sea each year (Milliman and Meade, 1983). The sediment accumulates near the Yellow River estuary in summer and is strongly resuspended in winter, subsequently transported to the open sea (Yang et al., 2011; Wang et al., 2014). In the marine environment, suspended sediment concentration (SSC) plays a vital role in water quality management and influences biogeochemical processes (Bilotta et al., 2012; Zhou et al., 2022). As an important link between the Yellow River and the open sea, the exchange of water and sediment in the Bohai Sea is especially crucial (Liu et al., 2024). At present, global climate change is experiencing peak fluctuations, making mid- and high-latitude bays more susceptible to extreme ice conditions (Xu et al., 2019). Therefore, investigating the impacts of sea ice on water-sediment flux and sediment transport during heavy ice winters in the Bohai Sea has significance guiding value for understanding the source-sink sedimentation system and water quality research in East China Sea.
Previous research on the impact of sea ice on hydrodynamic dynamics has predominantly focused on polar regions, and few studies have been carried out in seasonal frozen areas with frequent human activities, such as the Bohai Sea (Kug et al., 2015; Manson et al., 2016; Jiao et al., 2019). Sea ice reduced significant wave height (Hs) (Che et al., 2019; Zhang et al., 2020), and suppressed tidal amplitude (Zhang et al., 2019). The wave direction under the ice coverage changed compared to open water (Wahlgren et al., 2023). Researchers believed that due to ice coverage, the maximum surface current velocity decreased and lagged (Su et al., 2003), as well as the vertical distribution of current velocity changed from the traditional logarithmic type to the parabolic type (Jiang et al., 2020). Additionally, it was proposed that energy transferring from the open sea to the inner bay remains constant, albeit with reduction in vertical amplitude, causing energy to transform into horizontal flow along the coastal ice boundary (Liu et al., 2022). Most scholars asserted that sea ice inhibited sediment resuspension by limiting wave and current speed (Forest et al., 2008; Lannuzel et al., 2010; Murray et al., 2012; Bonsell and Dunton, 2018). Due to ice coverage, the SSC in Liaodong Bay was lower than that in Bohai Bay and Laizhou Bay (Xie et al., 2023). Sediment efflux was lowest at stations that were most recently ice-covered in the Pacific Arctic (Barrett et al., 2023). However, some scholars argued that ice mass interference increased seawater resistance and water body instability, thereby making it easier to trigger sediment resuspension (Peck et al., 2005; Giesbrecht et al., 2013).
Despite numerous researches on the impacts of sea ice on hydrodynamics and sediment resuspension, the water-sediment flux exchange between the Bohai Sea and the outer sea under ice coverage has not been fully investigated. In the winter of 2009-2010, severe ice conditions with a recurrence period of 30 years occurred in the Bohai Sea (Zhao et al., 2012). The thickness and extent of sea ice during this period were depicted in Figure 1. Using the MIKE three-dimensional hydrodynamic and sediment transport numerical model, the Hs, current velocity and SSC in the Bohai Sea were compared during both ice-covered and ice-free conditions from December 2009 to February 2010 to investigate the impacts of sea ice on the water-sediment flux.
Figure 1

Sea ice extent and thickness of the Bohai Sea in February 2010. (A) Sea ice extent and thickness of the Bohai Sea from Landsat remote sensing images in February 2010. The red line is the Bohai Strait section. (B, C) The photos of sea ice on the west bank of Laizhou Bay in January 2010.
2 Data and methods
2.1 Data sources
The field water level, current, wave height and SSC data were provided by the Acoustic Wave and Current instrument (AWAC) and Optical Back Scattering (OBS) installed at seabed-based observation station QD12 (119.1°E, 38.48°N, depth 5.5 m), located in western Laizhou Bay. The observation period was from 2 April 2009 to 7 April 2010. Sea ice thickness referred to the vertical distance from the ice surface to the ice bottom, while sea ice concentration represented the ratio of the sea ice coverage area to the total sea area (Lu et al., 2004; Ren et al., 2022). These parameters are fundamental for characterizing sea ice. The sea ice thickness and concentration data in the Bohai Sea used in this model from December 2009 to February 2010 were obtained from previous studies (Zhang and Tang, 2010; Zhang et al., 2019). The near-shore sea ice concentration was 0.55 in Bohai Bay and Laizhou Bay, 0.6 in Liaodong Bay, and 0.5 far offshore in the three bays. The near-shore sea ice thickness was 30 cm in Bohai Bay and Laizhou Bay, 55 cm in Liaodong Bay, and 20 cm far offshore in the three bays.
2.2 Model description
The MIKE 3 hydrodynamic and sediment transport model, developed by the Danish Hydraulic Institute (DHI), was employed in this study. MIKE is widely recommended and applied commercial numerical simulation system in the international marine engineering field (Warren and Bach, 1992; DHI, 2012), predominantly in applications within ports, rivers, lakes, estuaries, coastal regions, and oceans. Its triangular grid offers precise simulation of intricate and irregular coastlines, distinctly excelling in extensive areas and long-time numerical simulations. The accuracy of simulating wave, tide, current and sediment transport was validated extensively (Wang et al., 2017; Liu et al., 2018; Liu et al., 2024).
The Hydrodynamic Module is based on the three-dimensional incompressible Reynolds-averaged Navier-Stokes equations and adopts Boussinesq approximation and hydrostatic assumption (DHI, 2012). The local continuity equation is written as Formula 1:
The motion equations in the x and y direction are written as Formulas 2 and 3:
Where t is the time, x, y, and z are the Cartesian coordinates, ζ is the surface elevation; d is the still water depth, h = ζ + d is the total water depth, u, v, and w are the velocity components in x, y and z directions, f is the Coriolis parameter (f = 2Ωsinθ), where Ω is the earth rotational angular velocity and θ is the latitude, g is the gravity acceleration, ρ is the seawater density, ρ0 is the reference seawater density, Sxx, Sxy, Syx, and Syy are components of the radiation stress tensor, νt is the vertical turbulent viscosity, pa is the atmospheric pressure, S is the magnitude of the discharge due to point sources, and (us, vs) is the velocity by which the water is discharged into the ambient water (DHI, 2012). The horizontal stress terms are described using a gradient-stress relation (DHI, 2012), which is simplified to Formulas 4 and 5:
where is horizontal eddy viscosity.
Based on the conservation equation of wave action, MIKE SW uses the wave action density spectrum () to describe waves. The independent variables of the model are relative wave frequency () and wave direction (). The relationship between wave action density and wave energy spectrum density () is written as Formula 6:
Where is the relative frequency and is the wave direction.
2.3 Model configuration
The calculation area of the model encompassed the entire Bohai Sea, covering 37°-41°N and 117.5°-122.5°E, with an opening boundary at 121.9°E. The model was horizontally divided into 17,075 triangular grids, and vertically divided into 7 sigma layers with the surface and bottom layer encrypted. The land boundary was derived from 2009 Landsat satellite images and partially smoothed. Water depth was determined through a combination of electronic chart depth and measured depth. The boundary water level conditions were obtained from TPXO8 tidal data set (https://www.tpxo.net/global) with a spatial resolution of 1/30°. Monthly runoff and sediment discharge data of the Yellow River was from the Yellow River Sediment Bulletin (http://yrcc.gov.cn/gzfw/nsgb/index.html). The sediments distribution in the Bohai Sea was determined according to Li (2005). Since temperature and salinity had little influence on this study, the water temperature and salinity field are taken as constants (Li et al., 2001). Atmospheric forcing field data were provided by the European Centre for Medium-Range Weather Forecasts Reanalysis v5 (ERA5), including wind and mean sea level pressure, with a temporal resolution of 1 hr and a spatial resolution of 0.25°. The models under ice-covered and ice-free conditions utilized identical shoreline, water depth, wind field, runoff and opening boundary. The sole disparity lied in the sea ice conditions to study the impacts of sea ice on hydrodynamics (current and wave) and sediment resuspension.
2.4 Model verification
The model performance was assessed quantificationally by four indices: mean absolute error (MAE), root mean square error (RMSE), correlation coefficient (R), and prediction skill (Skill) (Liu et al., 2024). RMSE indicated the average deviation between model results and observation data, while Skill demonstrated the consistency index between model results and observed data (Liu et al., 2024). A Skill value of 1 indicated complete consistency between the model prediction and the measured data (Liu et al., 2024). According to Willmott (1981), the calculation formulas were as Formulas 7, 8 and 9.
Where and were model and observation data, respectively, represented the average observation data, i was the instant, was the sample size. Harmonic analysis was conducted on the tidal data over one-year period (Pawlowicz et al., 2002), revealing that the amplitude and phase of M2, S2, O1 and K1 tidal constituents were in good agreement with measured in the Bohai Sea (Figures 2A–C). The data on current velocity and direction, water level and Hs under sea ice coverage were also well-verified (Figures 2D–I). The regularity and magnitude of bottom SSC corresponded well with the observed data (Figure 2J). Table 1 presented the error calculation of each element. The model utilized in this study is capable of simulating the actual hydrodynamic environment in the Bohai Sea and holds potential for future research applications.
Figure 2
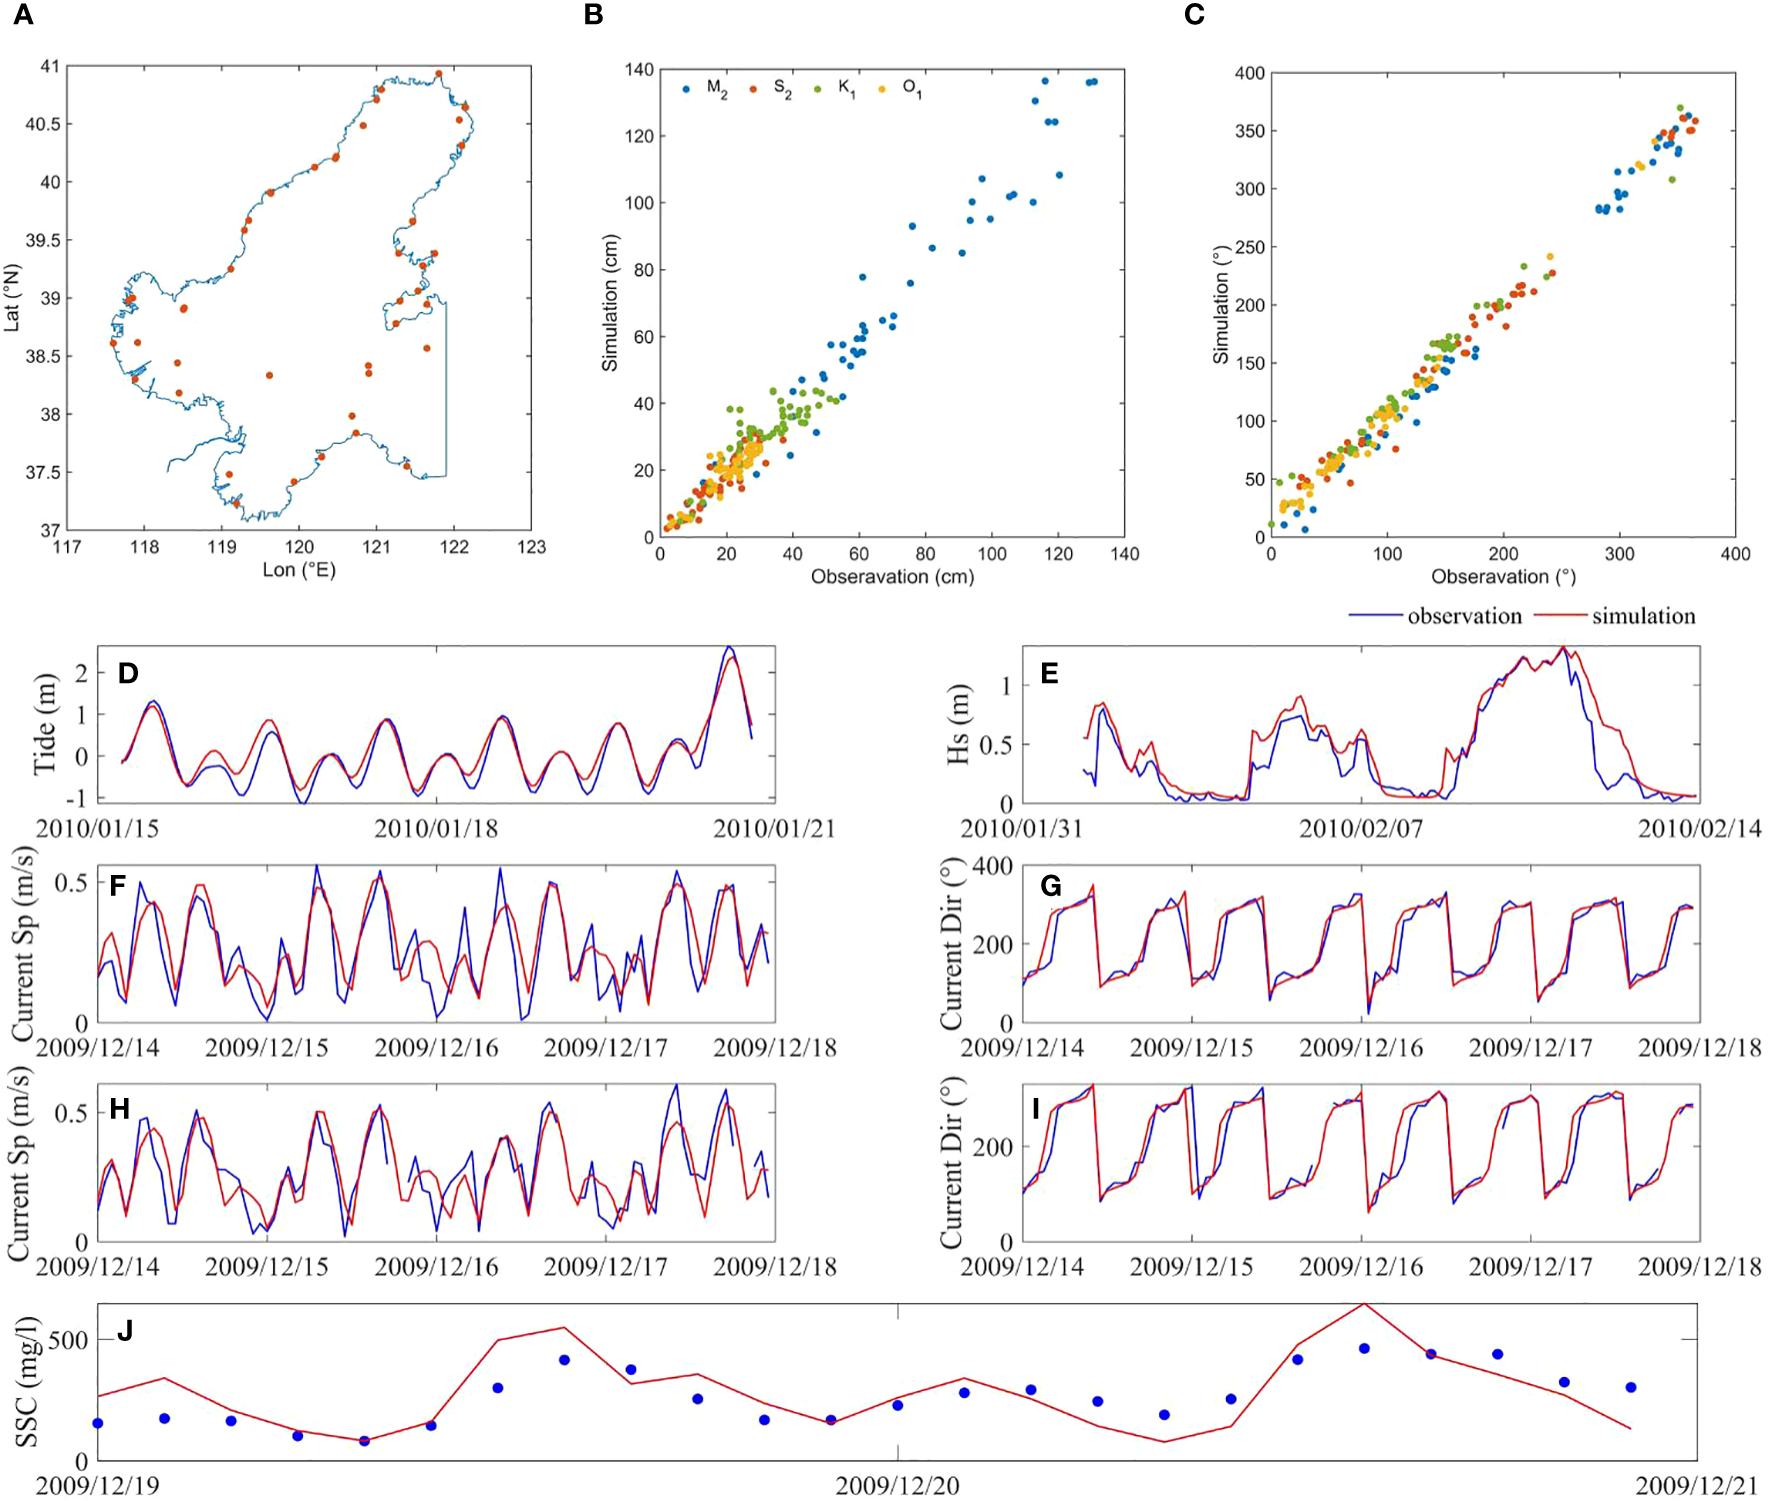
Comparison between model data and observation data. (A) The location of the tide stations. (B) Amplitude of M2, S2, O1 and K1 tidal constituents. (C) Phase of M2, S2, O1 and K1 tidal constituents. (D) Comparison of tide under ice coverage. (E) Comparison of Hs under ice coverage. (F) Comparison of bottom current velocity under ice coverage. (G) Comparison of bottom current direction under ice coverage. (H) Comparison of surface current velocity under ice coverage. (I) Comparison of surface current direction under ice coverage. (J) Comparison of bottom SSC.
Table 1
| Elements | MAE | RMSE | R | Skill | |
|---|---|---|---|---|---|
| M2 | Amplitude (cm) | 6.17 | 8.02 | 0.98 | 0.99 |
| Phase (°) | 7.57 | 9.95 | 1.00 | 1.00 | |
| S2 | Amplitude (cm) | 2.77 | 3.62 | 0.91 | 0.95 |
| Phase (°) | 10.06 | 12.66 | 0.99 | 1.00 | |
| K1 | Amplitude (cm) | 4.85 | 6.13 | 0.84 | 0.91 |
| Phase (°) | 13.58 | 16.03 | 0.99 | 0.99 | |
| O1 | Amplitude (cm) | 2.54 | 3.23 | 0.90 | 0.94 |
| Phase (°) | 8.17 | 9.33 | 1.00 | 1.00 | |
| Tide (m) | 0.12 | 0.16 | 0.98 | 0.98 | |
| Hs (m) | 0.11 | 0.17 | 0.93 | 0.95 | |
| Current | Bottom speed (m/s) | 0.07 | 0.09 | 0.83 | 0.88 |
| Surface speed (m/s) | 0.07 | 0.08 | 0.81 | 0.90 | |
| Bottom direction (°) | 11.18 | 13.67 | 0.99 | 0.99 | |
| Surface direction (°) | 9.25 | 11.93 | 0.99 | 1.00 | |
| Bottom SSC (kg/m3) | 0.08 | 0.10 | 0.76 | 0.84 | |
Error calculation of elements.
2.5 Calculation of water-sediment flux and wave-current induced shear stress
The annual tidal flux (TF) and suspended sediment flux (SSF) were calculated according to Formulas 10 and 11 (Liu et al., 2024).
Where, was the velocity vector of one point in a section, was the normal vector of the section, was the area of the micro-element, c was the SSC on the micro-element. The direction of TF and SSF in the Bohai Strait was positive to the east and negative to the west. For the Bohai Strait, inflow was considered negative and outflow was positive (Figure 1A).
Currents and waves play a pivotal role controlling sediment resuspension (MacVean and Lacy, 2014), and bottom shear stress is crucial for predicting SSC (Heath et al., 2016). The current-induced shear stress () was calculated by Formulas 12 and 13 (Soulsby, 1997):
U(z) is the average velocity (m/s) of the sampling period above the seabed (m), is the friction velocity (m/s), κ is the Carmen constant (0.4), is the seawater density (1025 kg/m3), and is the roughness length of the seabed (=ks/30, where ks = 2.5D50 is the Nikuradse particle roughness and D50 is the median grain size of the sediment) (Li, 2005).
According to linear wave theory, the amplitude of the wave orbit velocity and the major axis radius of near-bottom wave orbit Aw calculated by Formulas 14 and 15 (Shi et al., 2014):
Hrms is the root mean square wave height (m) [=Hs/, Hs is the significant wave height (m)], is the wave period (s), d is the water depth (m), and L is the wavelength (m), calculated by Formula 16 (Li and Amos, 2001; Wiberg and Sherwood, 2008):
The orbital motion of waves increases the bed shear stress. Herein, wave-induced shear stress ) is calculated by Formula 17 (Soulsby, 1997):
is the seawater density (1025 kg/m3) and is the wave friction coefficient related to the wave Reynolds number Rew [Rew =Aw/ν, where ν is the seawater kinematic viscosity coefficient (10-6 m2/s)].
The wave-current induced shear stress ) is calculated by Formulas 18 and 19 (Soulsby, 1995):
is the average shear stress under the action of waves and currents, and is the propagation angle of the waves and currents.
3 Results
3.1 Hydrodynamics and sediment resuspension variation
The sea ice coverage in Bohai Bay, Laizhou Bay, and Liaodong Bay has led to varying reductions in Hs and current velocity. The Hs decreased in the northeastern Liaodong Bay, with a maximum of nearly 1 m (Figures 3A, B). The friction of sea ice caused a reduction in surface velocity by over 6 cm/s and bottom velocity by over 2 cm/s in all three bays (Figures 3C–E). The central part of Bohai Sea and the Bohai Strait, not directly covered by sea ice, experienced current velocity fluctuations of within 2 cm/s. However, in the west of Dalian, current velocity increased significantly staying below 6 cm/s, most likely due to its proximity the ice edge.
Figure 3
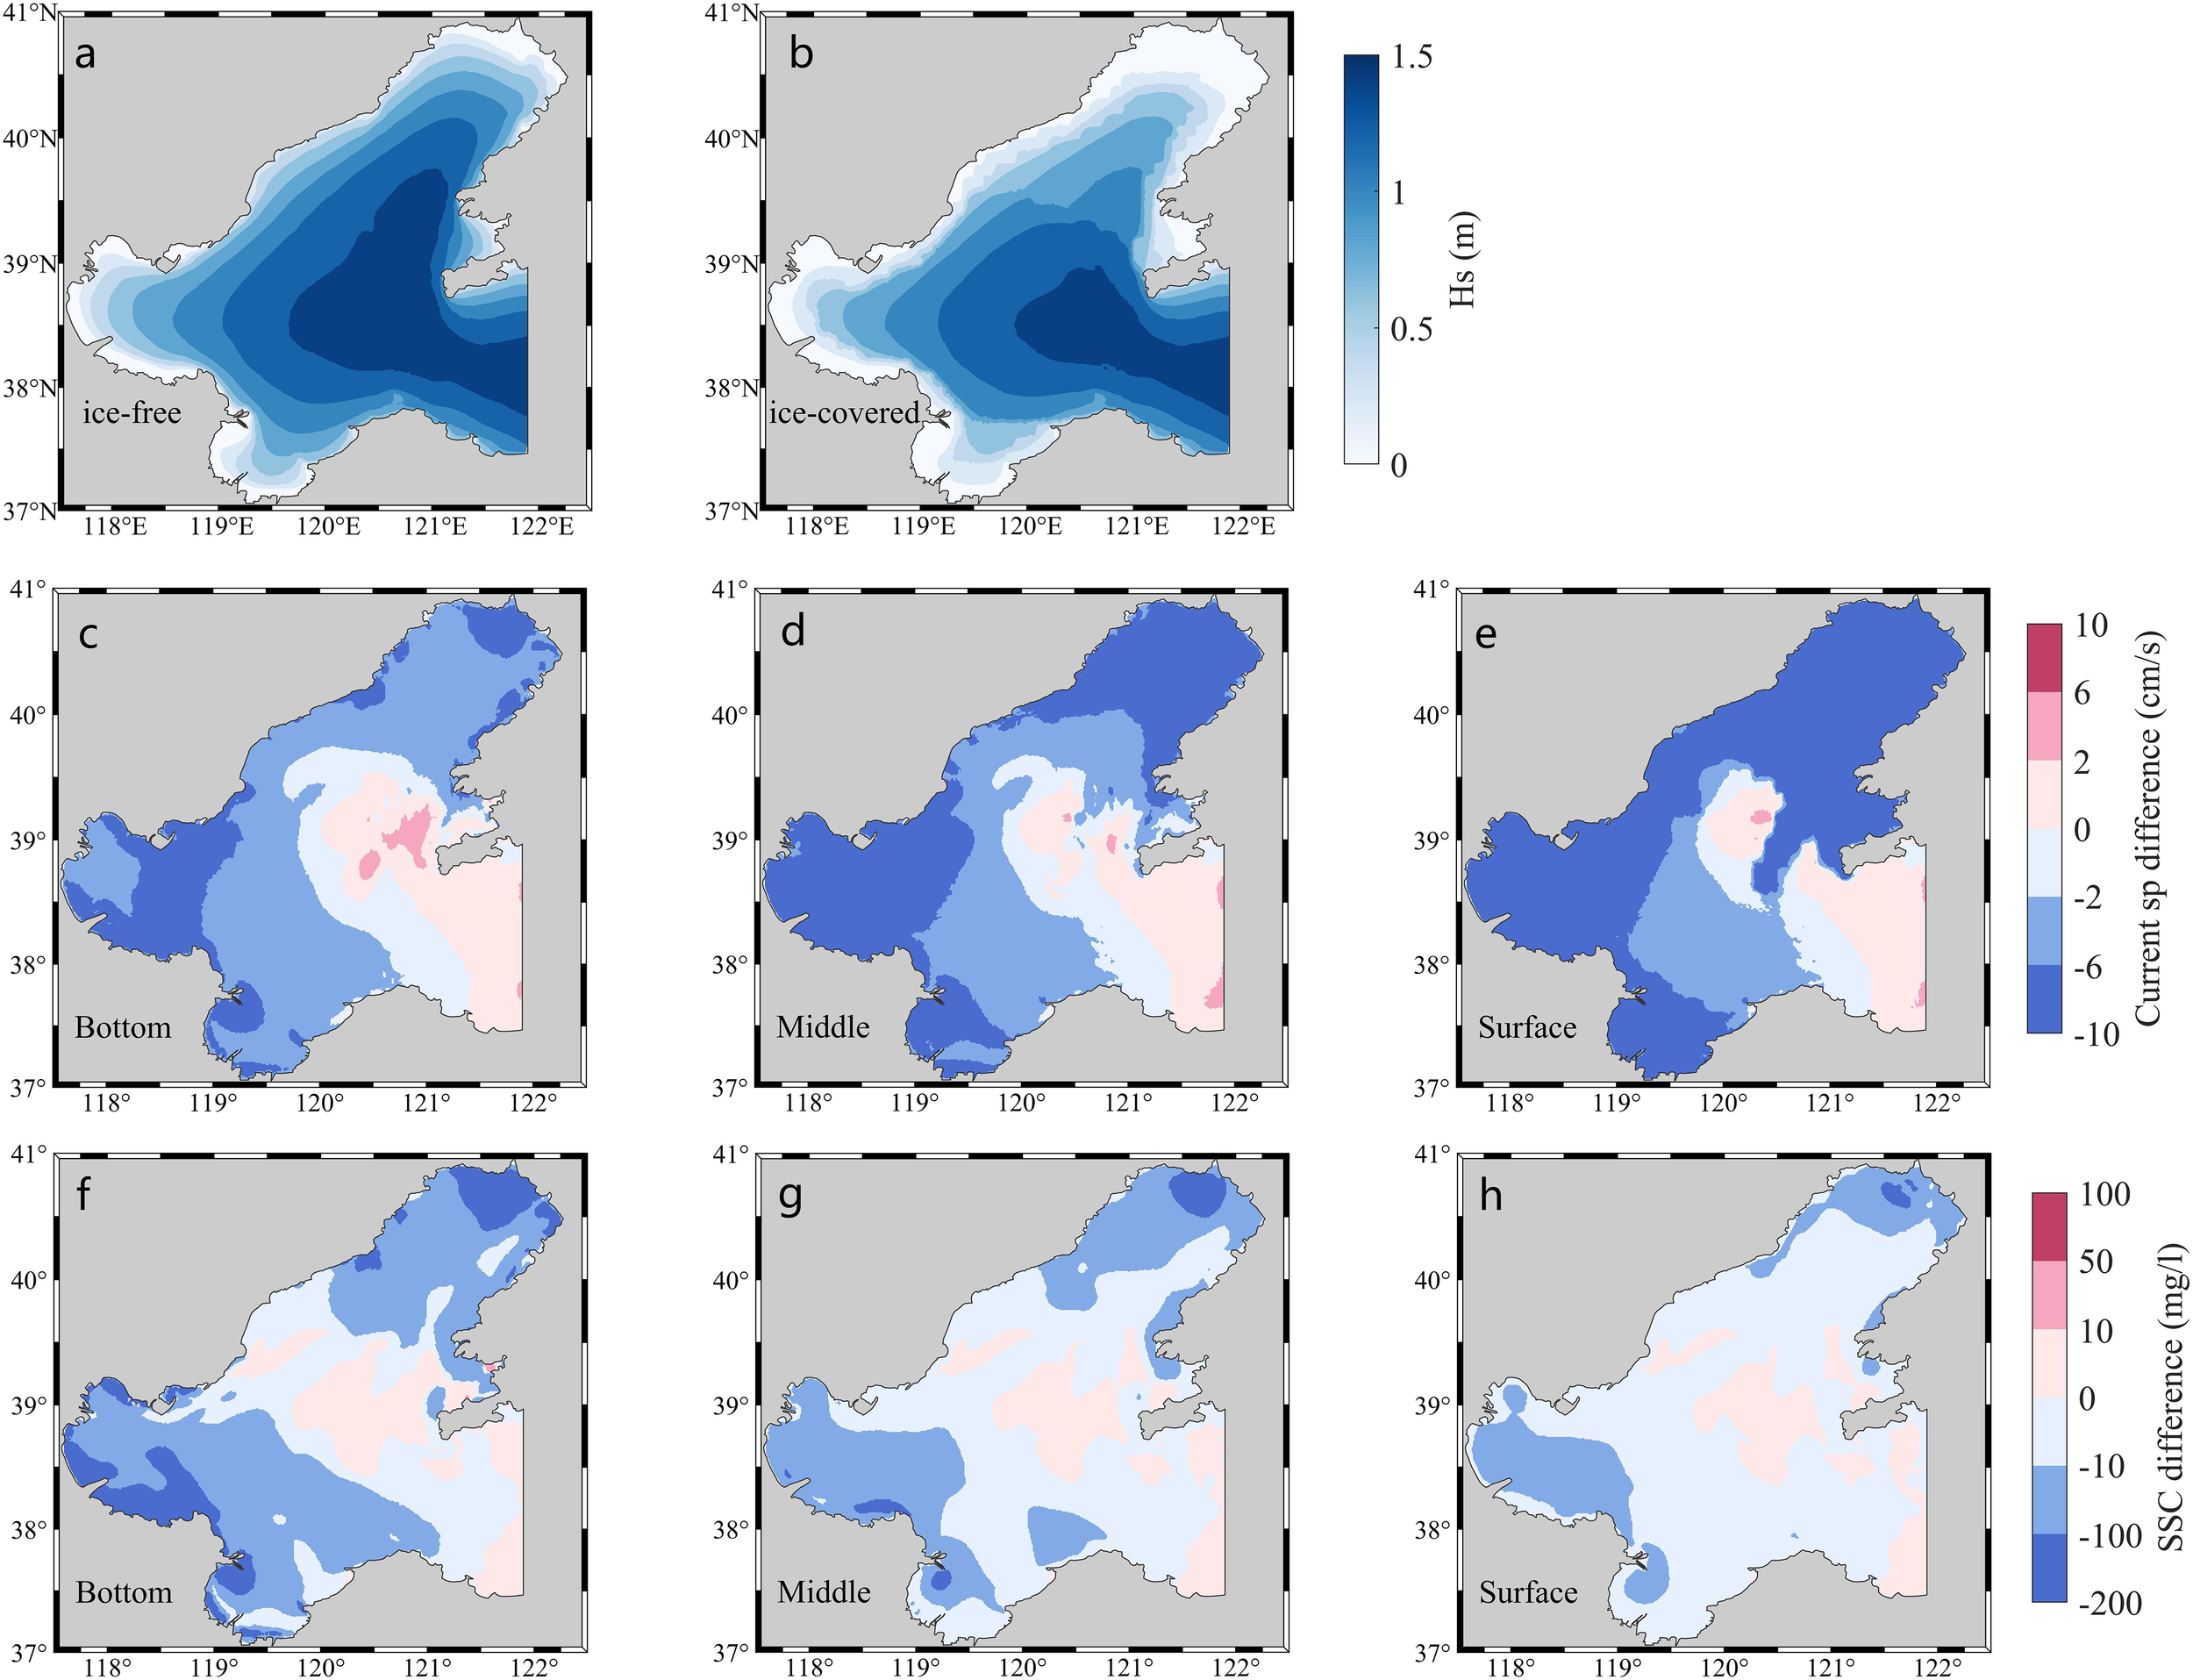
Comparison of significant wave height (Hs), current velocity and SSC in the Bohai Sea during winter (ice-covered minus ice-free). (A) Hs during ice-free condition. (B) Hs during ice-covered condition. (C) Bottom current velocity difference. (D) Middle current velocity difference. (E) Surface current velocity difference. (F) Bottom SSC difference. (G) Middle SSC difference. (H) Surface SSC difference.
Additionally, SSC decreased in most areas of the Bohai Sea under ice coverage, with the decreasing range of SSC increasing from surface to bottom (Figures 3F–H). Under ice coverage, SSC reduced by over 100 mg/l in the west of Bohai Bay, the north of Liaodong Bay and near the Yellow River Estuary. On the other hand, SSC in the central of Bohai Sea and near Bohai Strait either increased or decreased in the range of 10 mg/l. The disturbance to the bottom sediment caused by increased current velocity at the ice edge in the west of Dalian led to a significant increase in bottom SSC (Figure 3F). The variations in surface SSC were showed in Figure 3H, with a decrease by more than 100 mg/l in the northern Liaodong Bay, 10-100 mg/l near the Yellow River Delta and southwestern Bohai Bay, and minor fluctuations in most other areas.
Bottom shear stress played a crucial role in sediment erosion, sedimentation, and resuspension. The interaction of waves, currents, and their coupling effects were key contributors to sediment resuspension. Through the analysis of , , and under ice-covered and ice-free conditions, it was observed that the diminished in the Bohai Sea, with reduction of about 0.2 Pa near the coastline (Figure 4A). The decreased in all three bays, with the most significant decrease in the northern Liaodong Bay, up to 0.2 Pa, while increased approximately 0.04 Pa in the northern part of Bohai Strait (Figure 4B). The notably decreased in the three bays, particularly in the shallow coastal waters (Figure 4C), causing a significant decrease in bottom SSC during ice-covered conditions (Figure 3D). Conversely, the amplified in the northern Bohai Strait, leading to an increase in bottom SSC (Figure 3D).
Figure 4
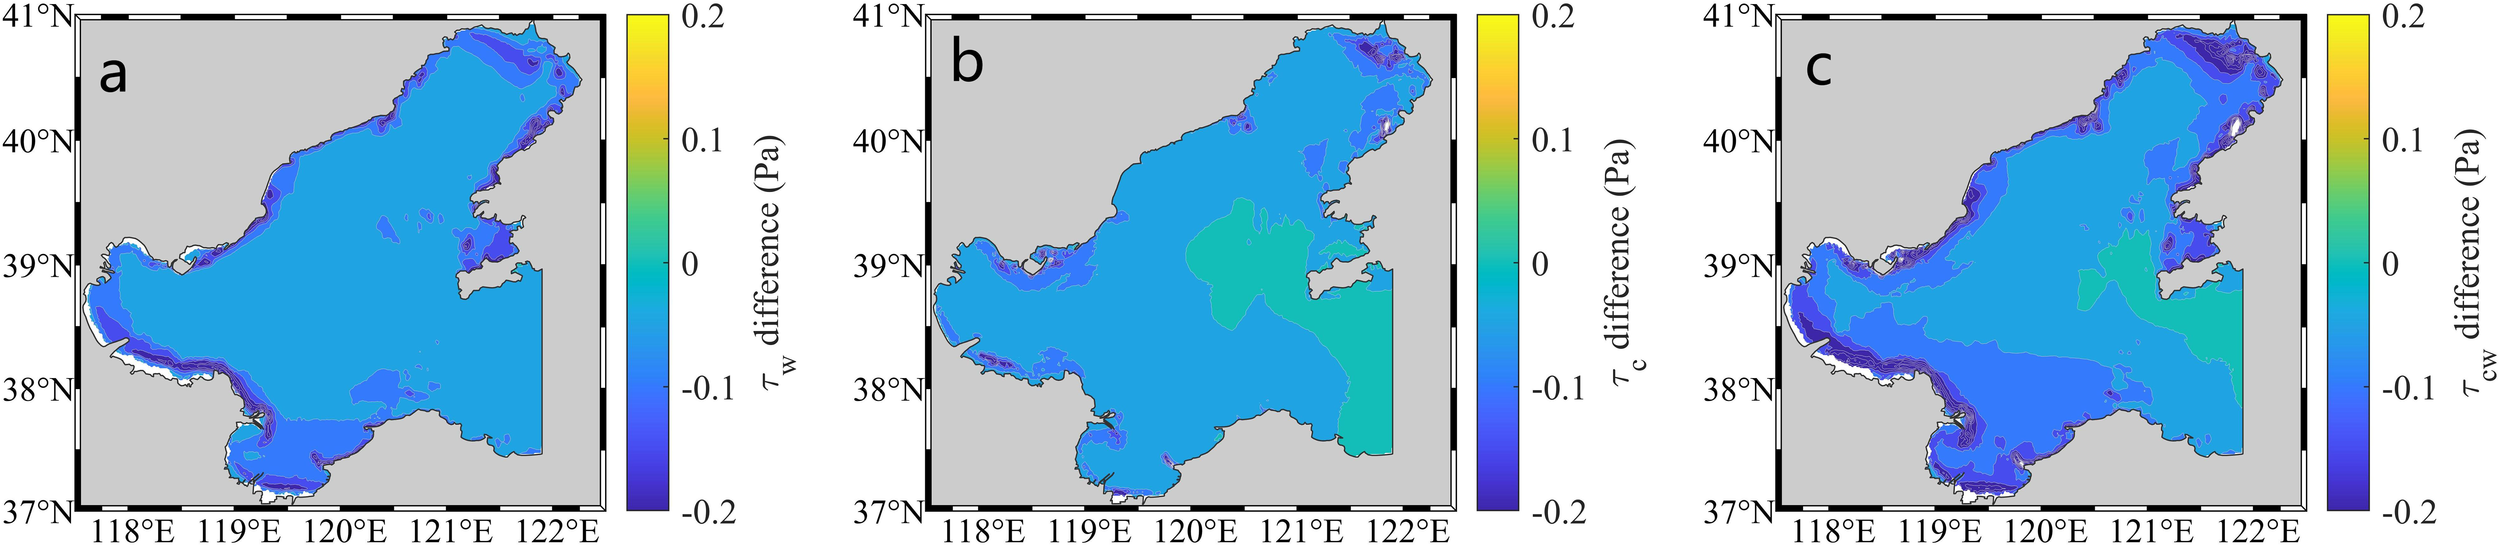
Comparison of shear stress in the Bohai Sea during winter (ice-covered minus ice-free). (A) Wave-induced shear stress (). (B) Current-induced shear stress (). (C) Wave-current induced shear stress ).
3.2 Impacts of sea ice on TF
Under ice-free conditions, the outflow and inflow TF of the Bohai Strait (the red line in Figure 1A) during the entire winter (from December 2009 to February 2010) were 5.541×10¹² m3 and 5.492×10¹² m3, respectively, indicating a net outflow TF of 4.9×10¹⁰ m3. The peak TF value was in the northern part of the Bohai Strait section (Figures 5C, D). Under ice-covered conditions, the outflow TF from the Bohai Strait in winter was 5.544×10¹² m3, which was 3×10⁹ m3 higher than that without ice. The inflow tidal flux was 5.479×10¹² m3, decreased by 1.3×10¹⁰ m3 compared with the ice-free conditions (Figures 5A, B). Under ice-covered conditions, the net outflow TF from the Bohai Sea in winter was 6.5×10¹⁰ m3, an increase of 32.7% compared with the ice-free conditions (Figures 5E, F). In the case of ice coverage, the outflow TF increased, while the inflow TF decreased.
Figure 5
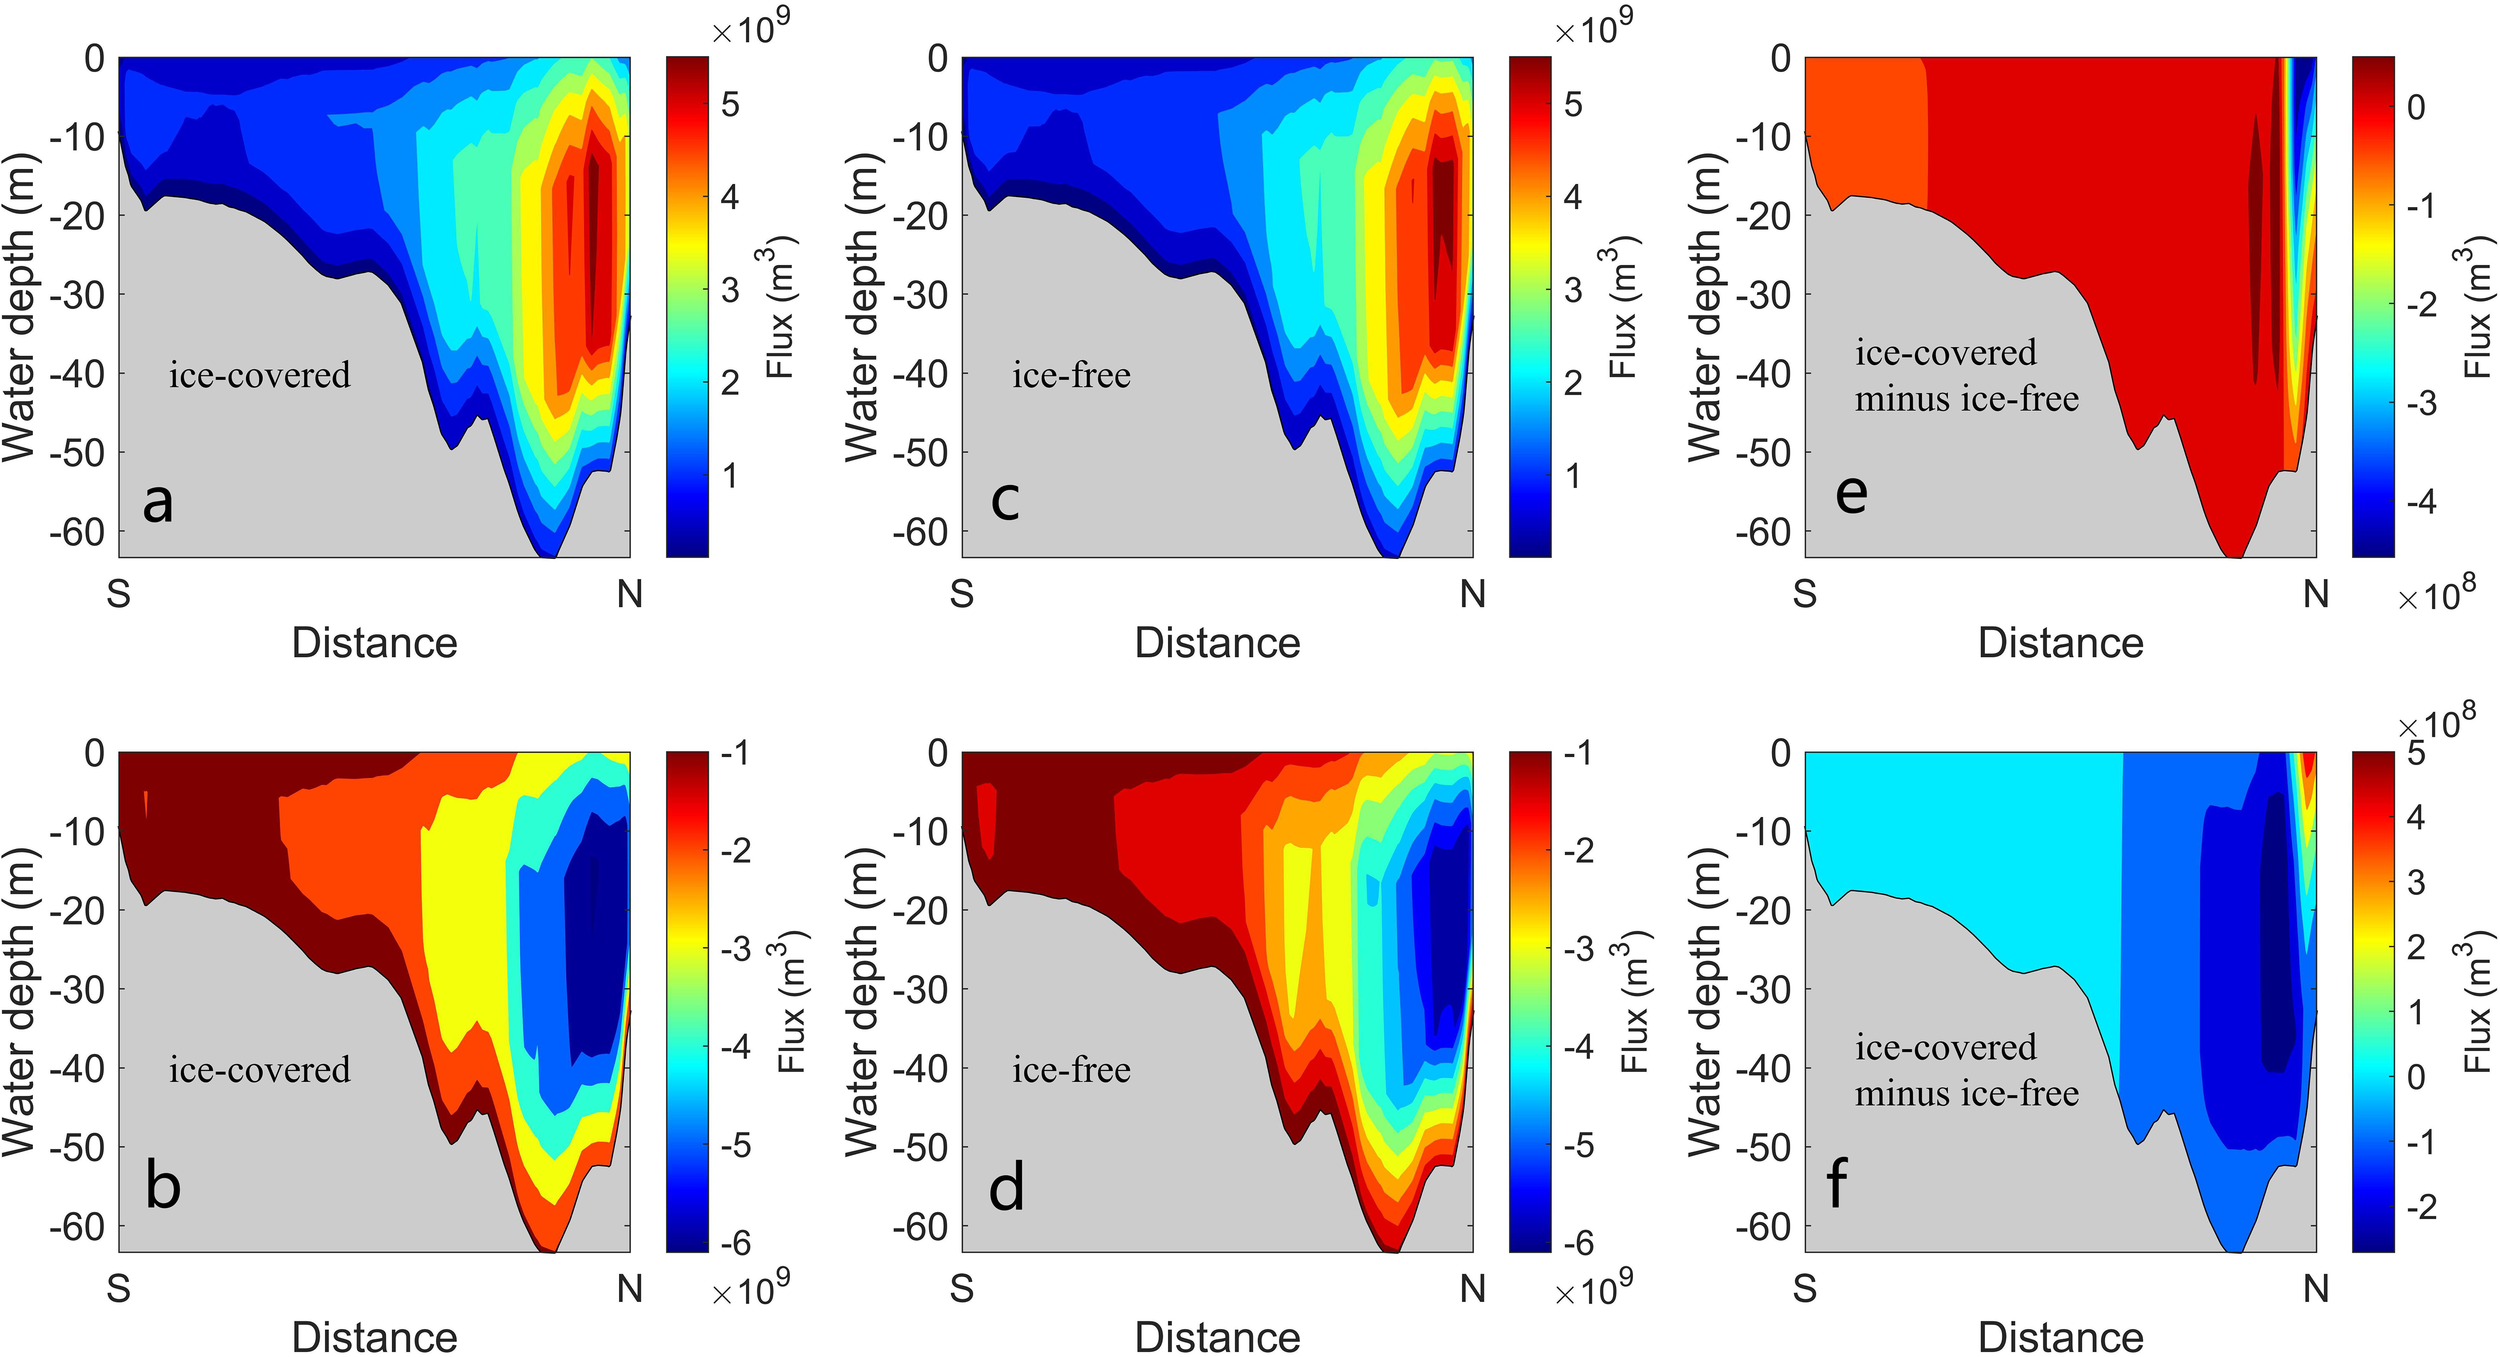
The net outflow and inflow TF under both ice-covered and ice-free conditions during winter in the Bohai Strait. (A) The outflow TF under ice-covered condition. (B) The outflow TF under ice-free condition. (C) The outflow TF difference (ice-covered minus ice-free). (D) The inflow TF under ice-covered condition. (E) The inflow TF under ice-free condition. (F) The inflow TF difference (ice-covered minus ice-free). The section orientation was shown in Figure 1A.
3.3 Impacts of sea ice on SSF
Under ice-free conditions, the outflow and inflow SSF in the Bohai Strait in winter were 3.960×10¹⁰ kg and 3.728×10¹⁰ kg, respectively, showing the net outflow SSF of 2.32×10⁹ kg. The highest value of SSF was in the southern part of the Bohai Strait section (the northern part of Shandong Peninsula; Figures 6C, D). Under ice-covered conditions, the outflow SSF from the Bohai Strait in winter was 3.489×10¹⁰ kg, which was 4.71×10⁹ kg lower than under ice-free conditions, accounting for 11.9%. The inflow SSF was 2.970×10¹⁰ kg, reduced by 7.58×10⁹ kg, accounting for 20.3% compared to the ice-free conditions (Figures 6A, B). Under ice-covered conditions, the net SSF in the Bohai Sea during winter was 5.19×10⁹ kg, which was 1.24 times higher than that in the absence of ice (Figures 6E, F). Although both the inflow and outflow SSF were reduced under ice coverage, the inflow was even less, leading to a significant increase in the net outflow SSF from the Bohai Strait under ice coverage.
Figure 6
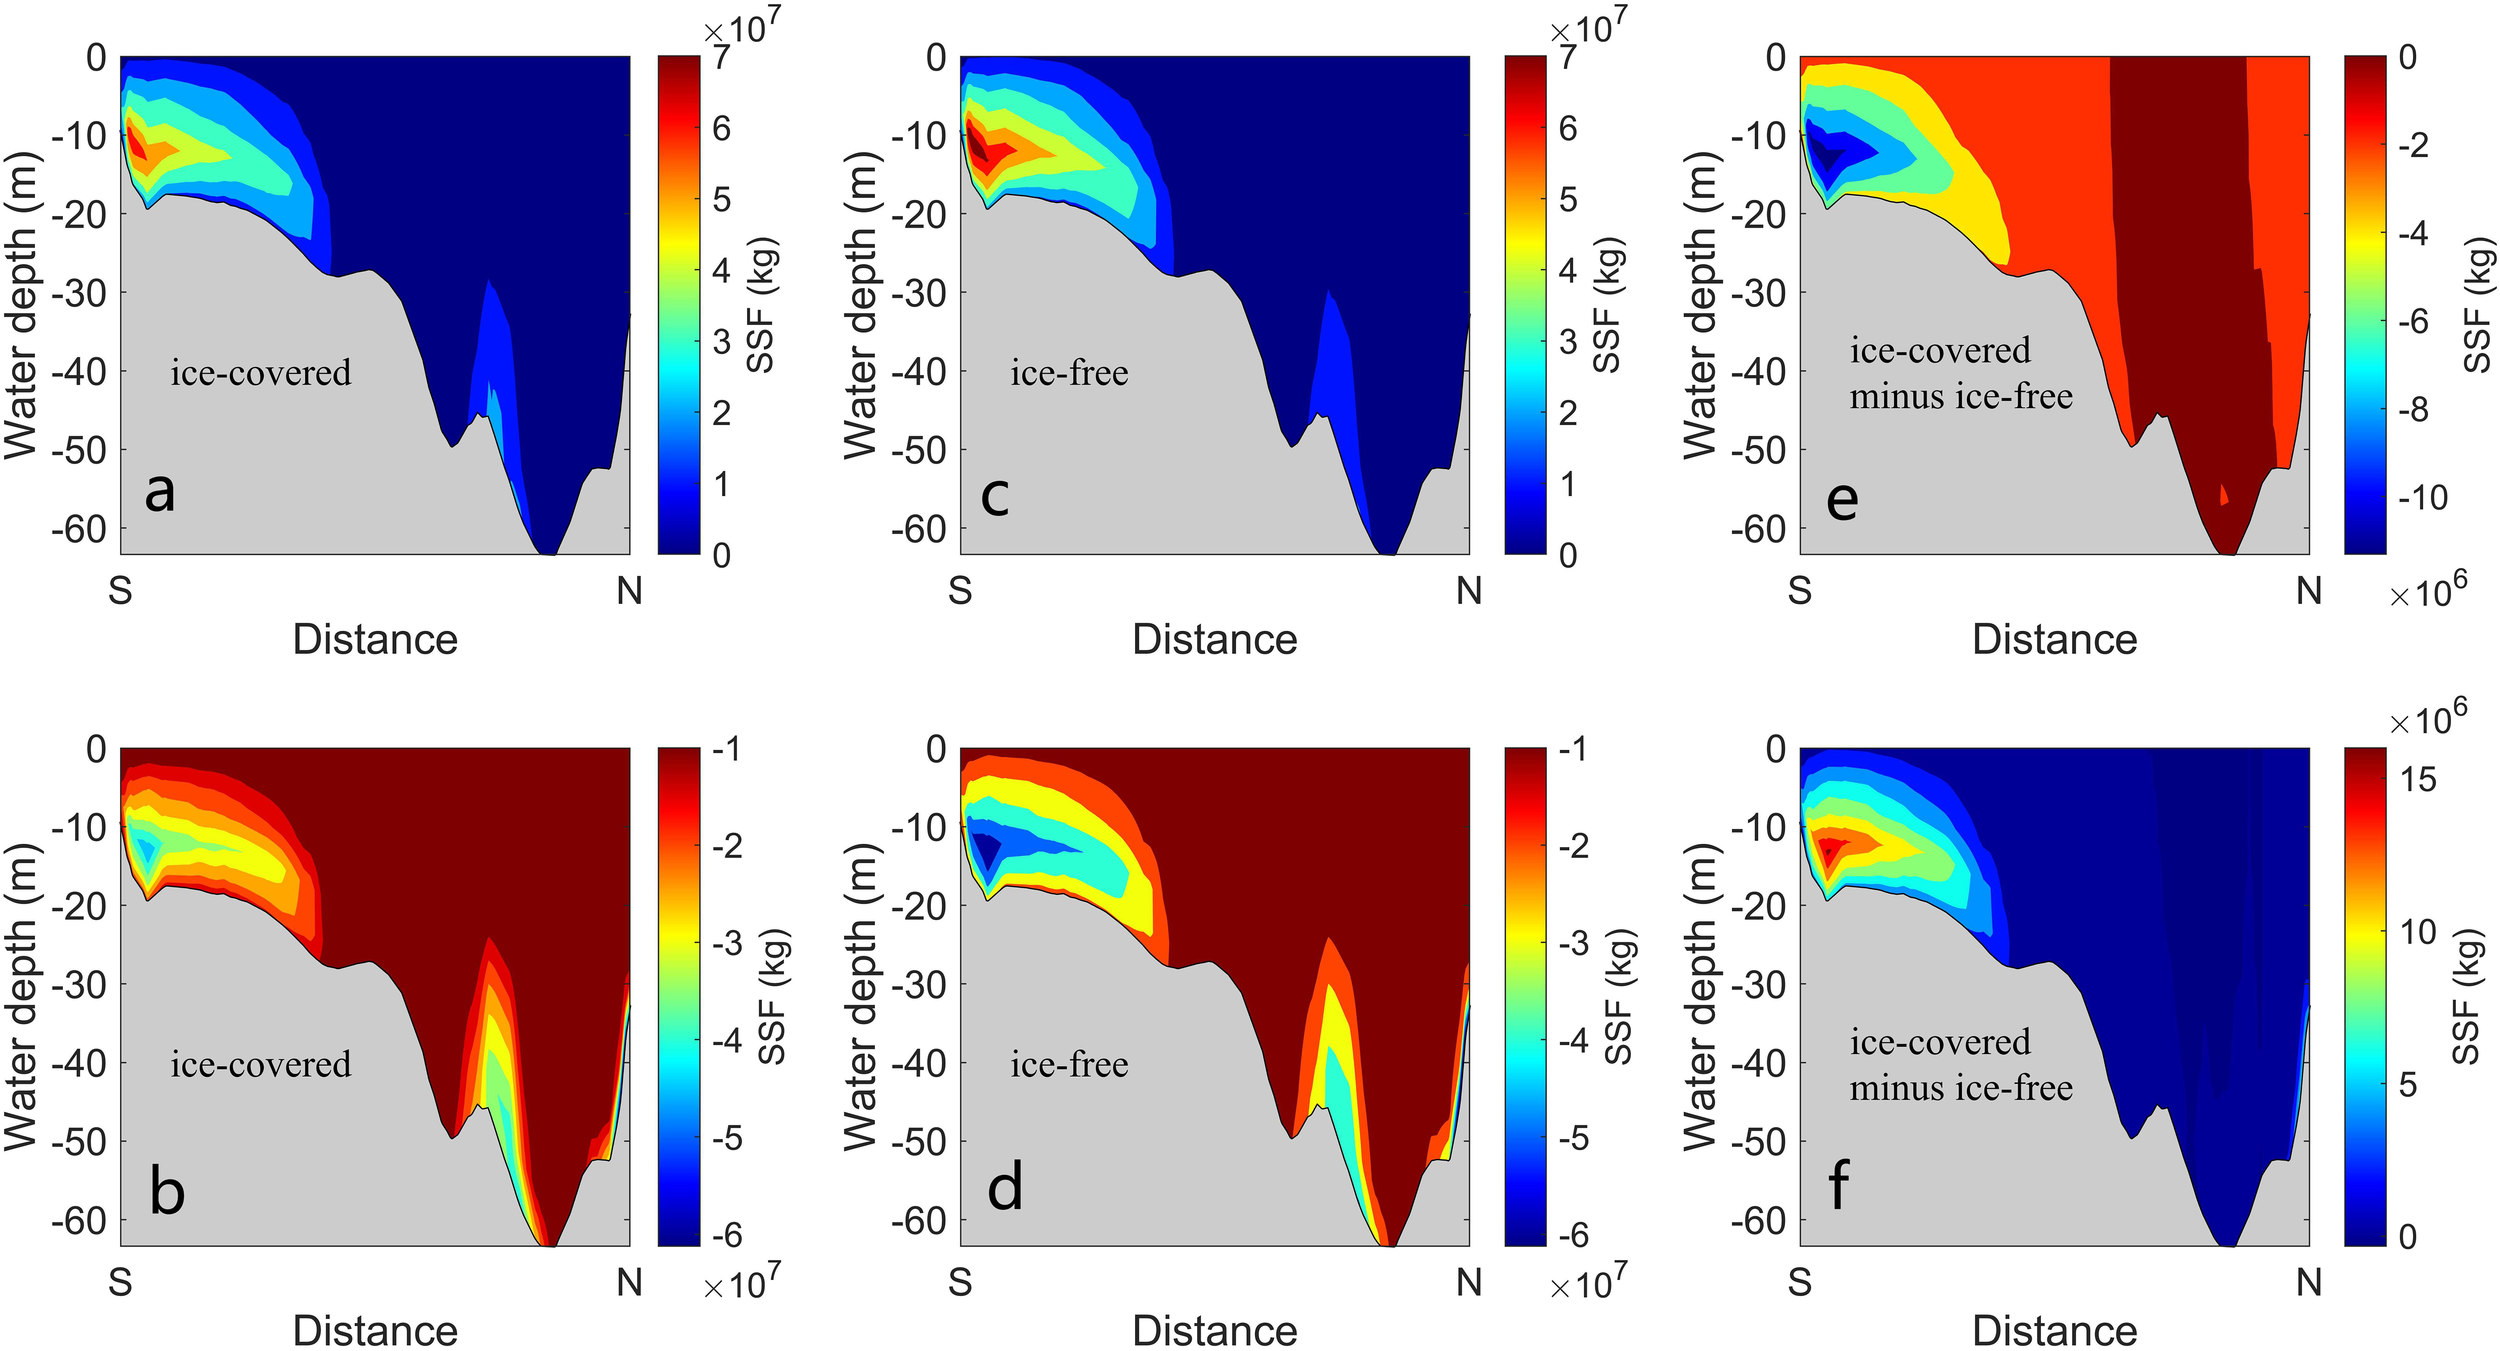
The net outflow and inflow SSF under both ice-covered and ice-free conditions during winter in the Bohai Strait. (A) The outflow SSF under ice-covered condition. (B) The outflow SSF under ice-free condition. (C) The outflow SSF difference (ice-covered minus ice-free). (D) The inflow SSF under ice-covered condition. (E) The inflow SSF under ice-free condition. (F) The inflow SSF difference (ice-covered minus ice-free).
4 Discussion
4.1 Sea surface pressure
Under ice coverage, the current velocity decreased by more than 30 cm/s during rapid flood and ebb tides in the northern Liaodong Bay, but increased by over 5 cm/s at the edge of sea ice (Figures 7A–D). Liu et al. (1993) observed an along-ice-edge jet in polar regions, attributing it to reduced wave energy due to sea ice coverage, with energy being transferred to the sea ice and the underlying seawater. Dai et al. (2019) suggested that the rapid decrease in wave energy resulted in the interaction between the waves and sea ice occurring only near the marginal ice zone, leading to the jet formation. Additionally, observations in the Bohai Sea revealed that decreased wave height and tidal amplitude under ice coverage caused energy conversion into horizontal flow along the ice edge, leading to higher velocities (Liu et al., 2022).
Figure 7
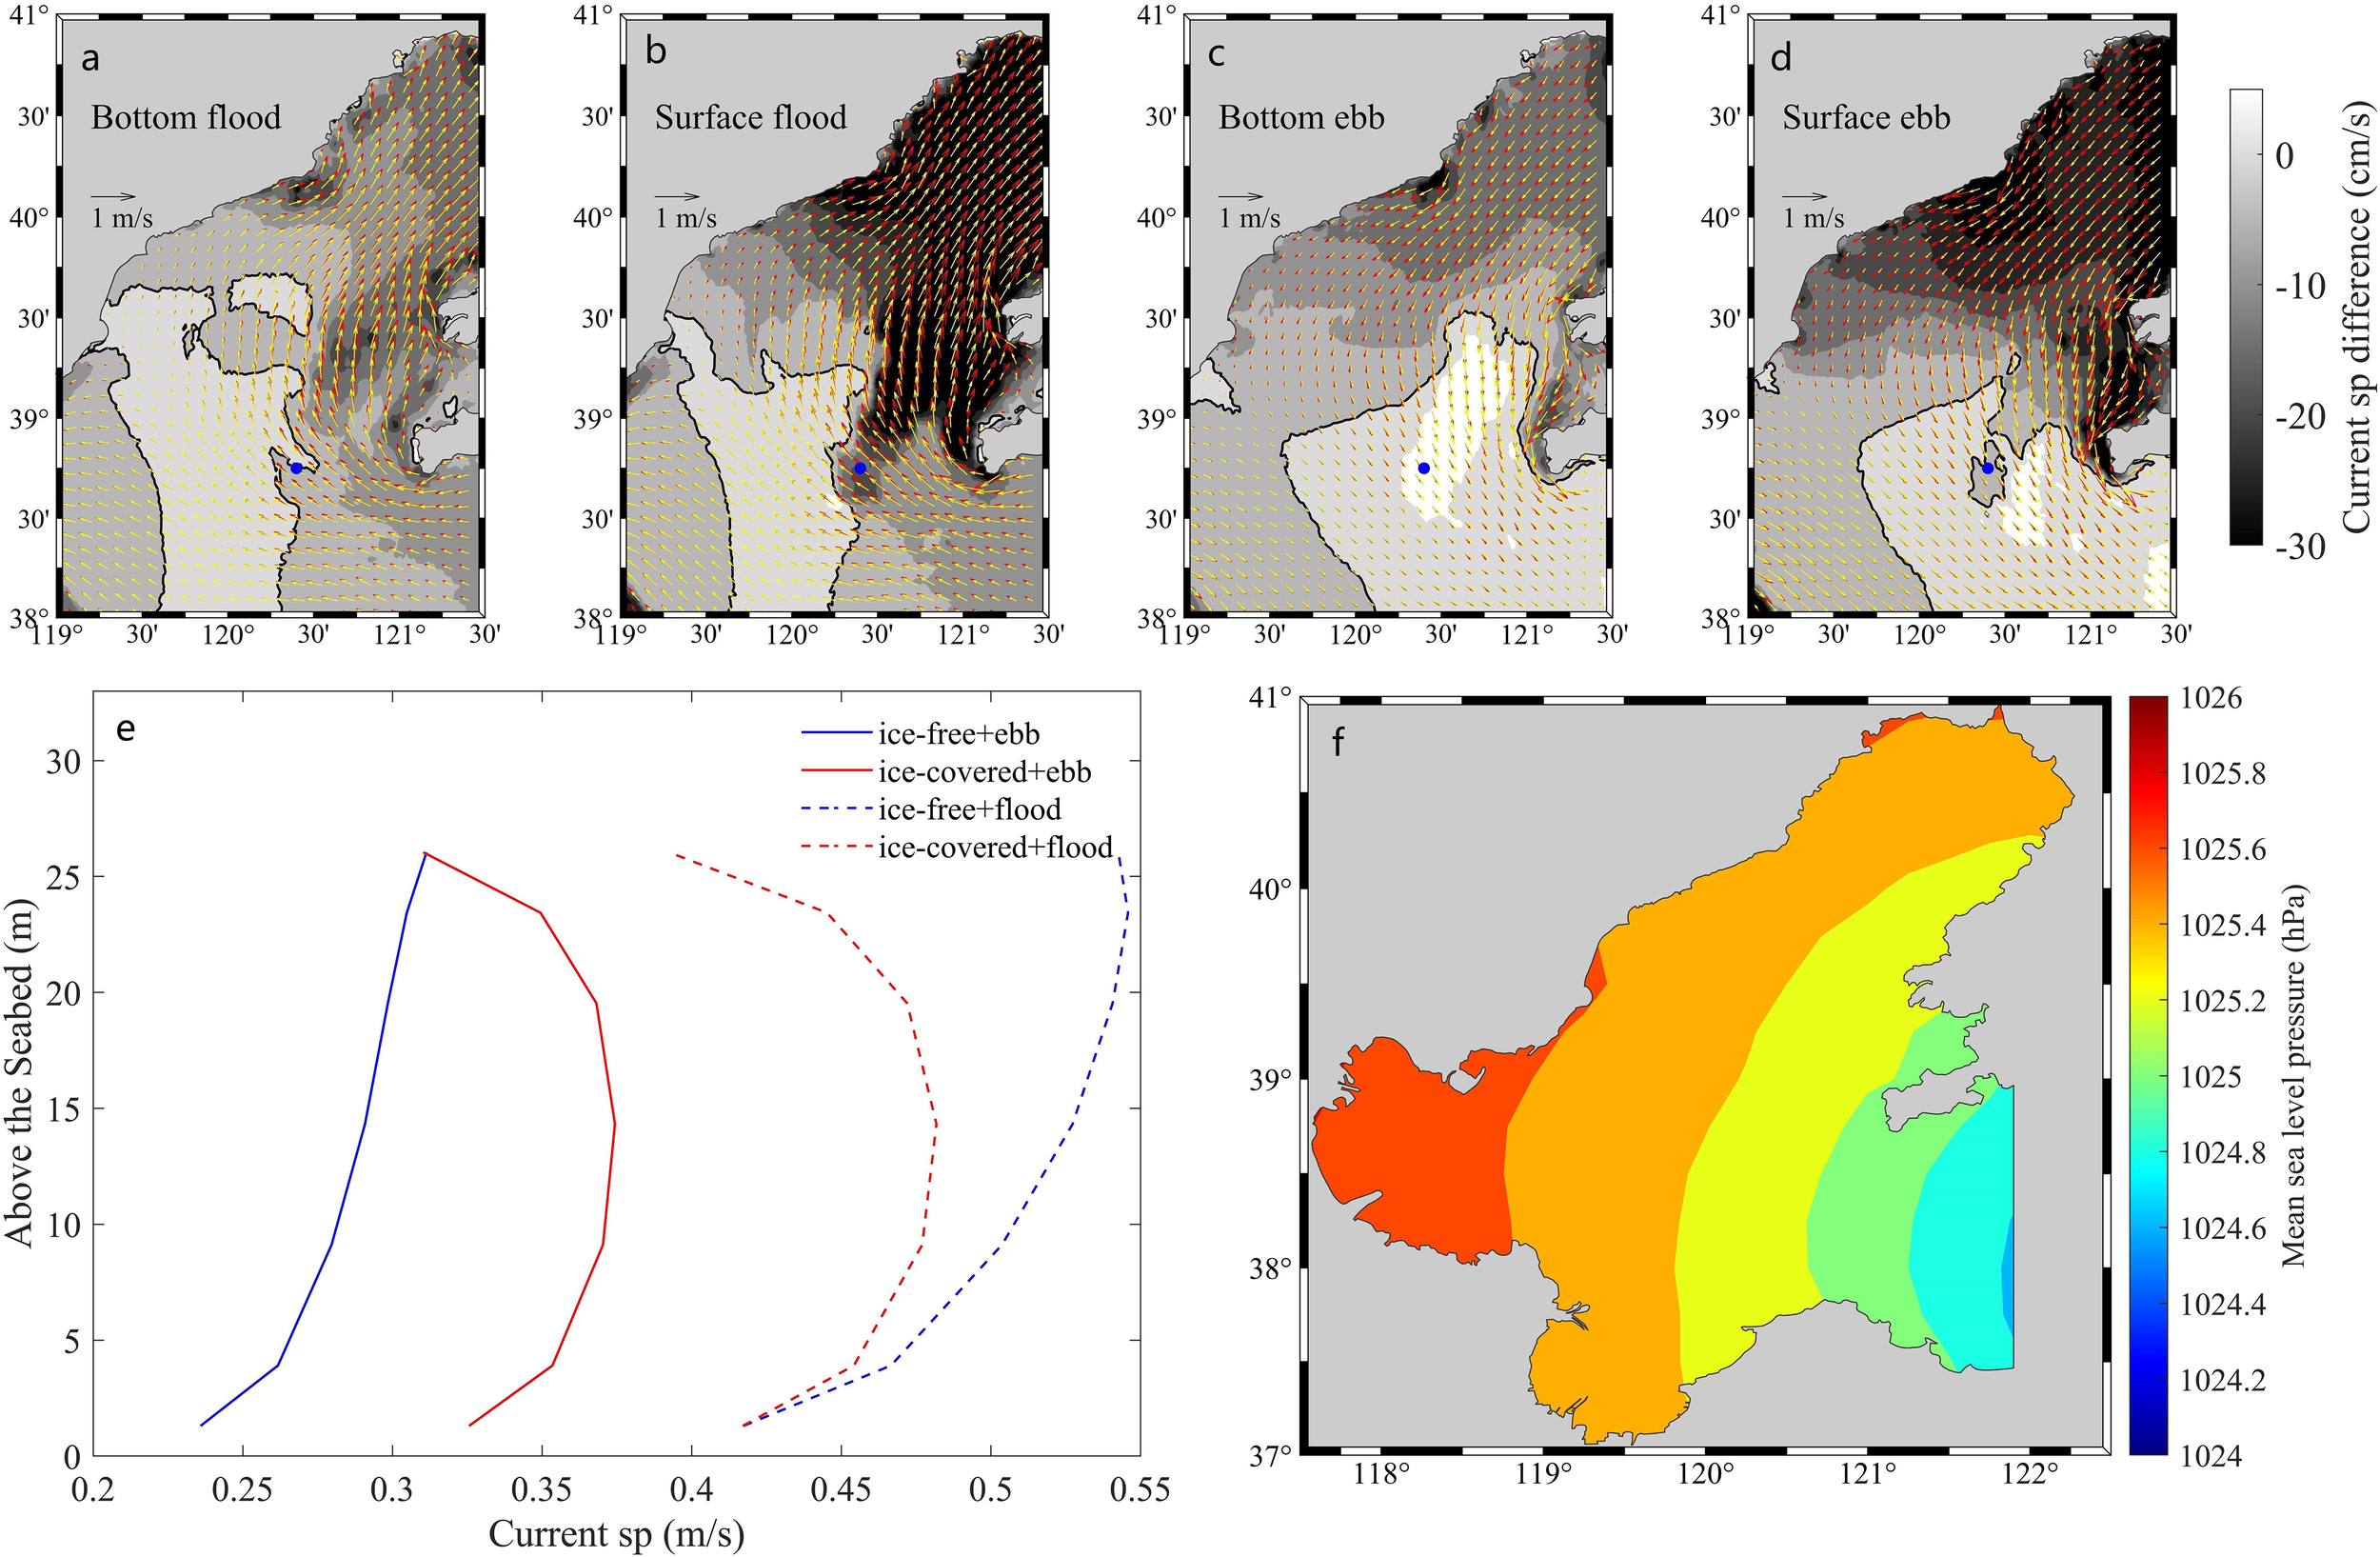
Comparison of bottom and surface current velocity and pressure in the northern Bohai Sea in winter. (A) Comparison of bottom current velocity at the rapid flood moment (ice-covered minus ice-free). The red arrow was the ice-free condition and the yellow arrow was the ice-covered condition. The black line served as the boundary between ice-covered and ice-free regions, equal to 0. (B) Comparison of surface current velocity at the rapid flood moment (ice-covered minus ice-free). (C) Comparison of bottom current velocity at the rapid ebb moment (ice-covered minus ice-free). (D) Comparison of surface current velocity at the rapid ebb moment (ice-covered minus ice-free). (E) The current velocity profile of a single point under ice-free and ice-covered conditions at the rapid flood and ebb moment. The point was located at the blue dot in (A–D). (F) Mean sea level pressure in the Bohai Sea from December 2009 to February 2010.
Although the current velocity increased at the edge of sea ice, the area of increasing current velocity was large at the rapid ebb moment, including the northern area of Bohai Strait, while the area of increasing current velocity at the rapid flood moment was comparatively limited (Figures 7A–D). Figure 7E depicted the vertical current velocity profile at the edge of the sea ice during the rapid flood and ebb. The current velocity from the bottom to the surface increased under ice-free conditions. However, under ice-covered conditions, the surface and bottom current velocity was lower due to friction, and the middle current velocity was largest. During the rapid ebb, the current velocity under ice-covered conditions exceeded that under ice-free conditions. Conversely, during the rapid flood, it was the opposite.
Section 3.2 revealed that sea ice coverage enhanced the outflow TF and lessened the inflow TF in the Bohai Sea. Comparison of mean sea level pressure data downloaded by ERA5 from December 2009 to February 2010 revealed a gradual pressure decrease from northwest to southeast (Figure 7F). During the ebb tide, the high pressure in Liaodong Bay combined with the pressure of heavy sea ice on the water body resulted in a pressure disparity between Liaodong Bay and the Bohai Strait, accelerating the current velocity in the north of the Bohai Strait, thereby increasing the outflow TF from the Bohai Sea. Conversely, during the flood tide, sea ice coverage impeded water from entering the Bohai Sea, thus diminishing the inflow TF into the Bohai Sea.
4.2 Current velocity and SSC
During winter, the average current velocity in the Bohai Strait was 0.37 m/s under ice-covered conditions and 0.38 m/s under ice-free conditions (Figures 8A, B). The current velocity in the northern part of the Bohai Strait (LaoTieshan waterway) was larger, averaging nearly 0.8 m/s, whereas the current velocity in the southernmost part was smaller, averaging approximately 0.5 m/s, which was similar as previous research (Jiang et al., 2019). In the northernmost part of the Bohai Strait, current velocity decreased due to substantial ice cover friction (Figure 8C). Conversely, in the northern sea ice margin area, current velocity slightly increased due to the effects of pressure. In the southern part of the Bohai Strait, the shallow water depth was affected by the surface sea ice, leading to a decrease in velocity.
Figure 8
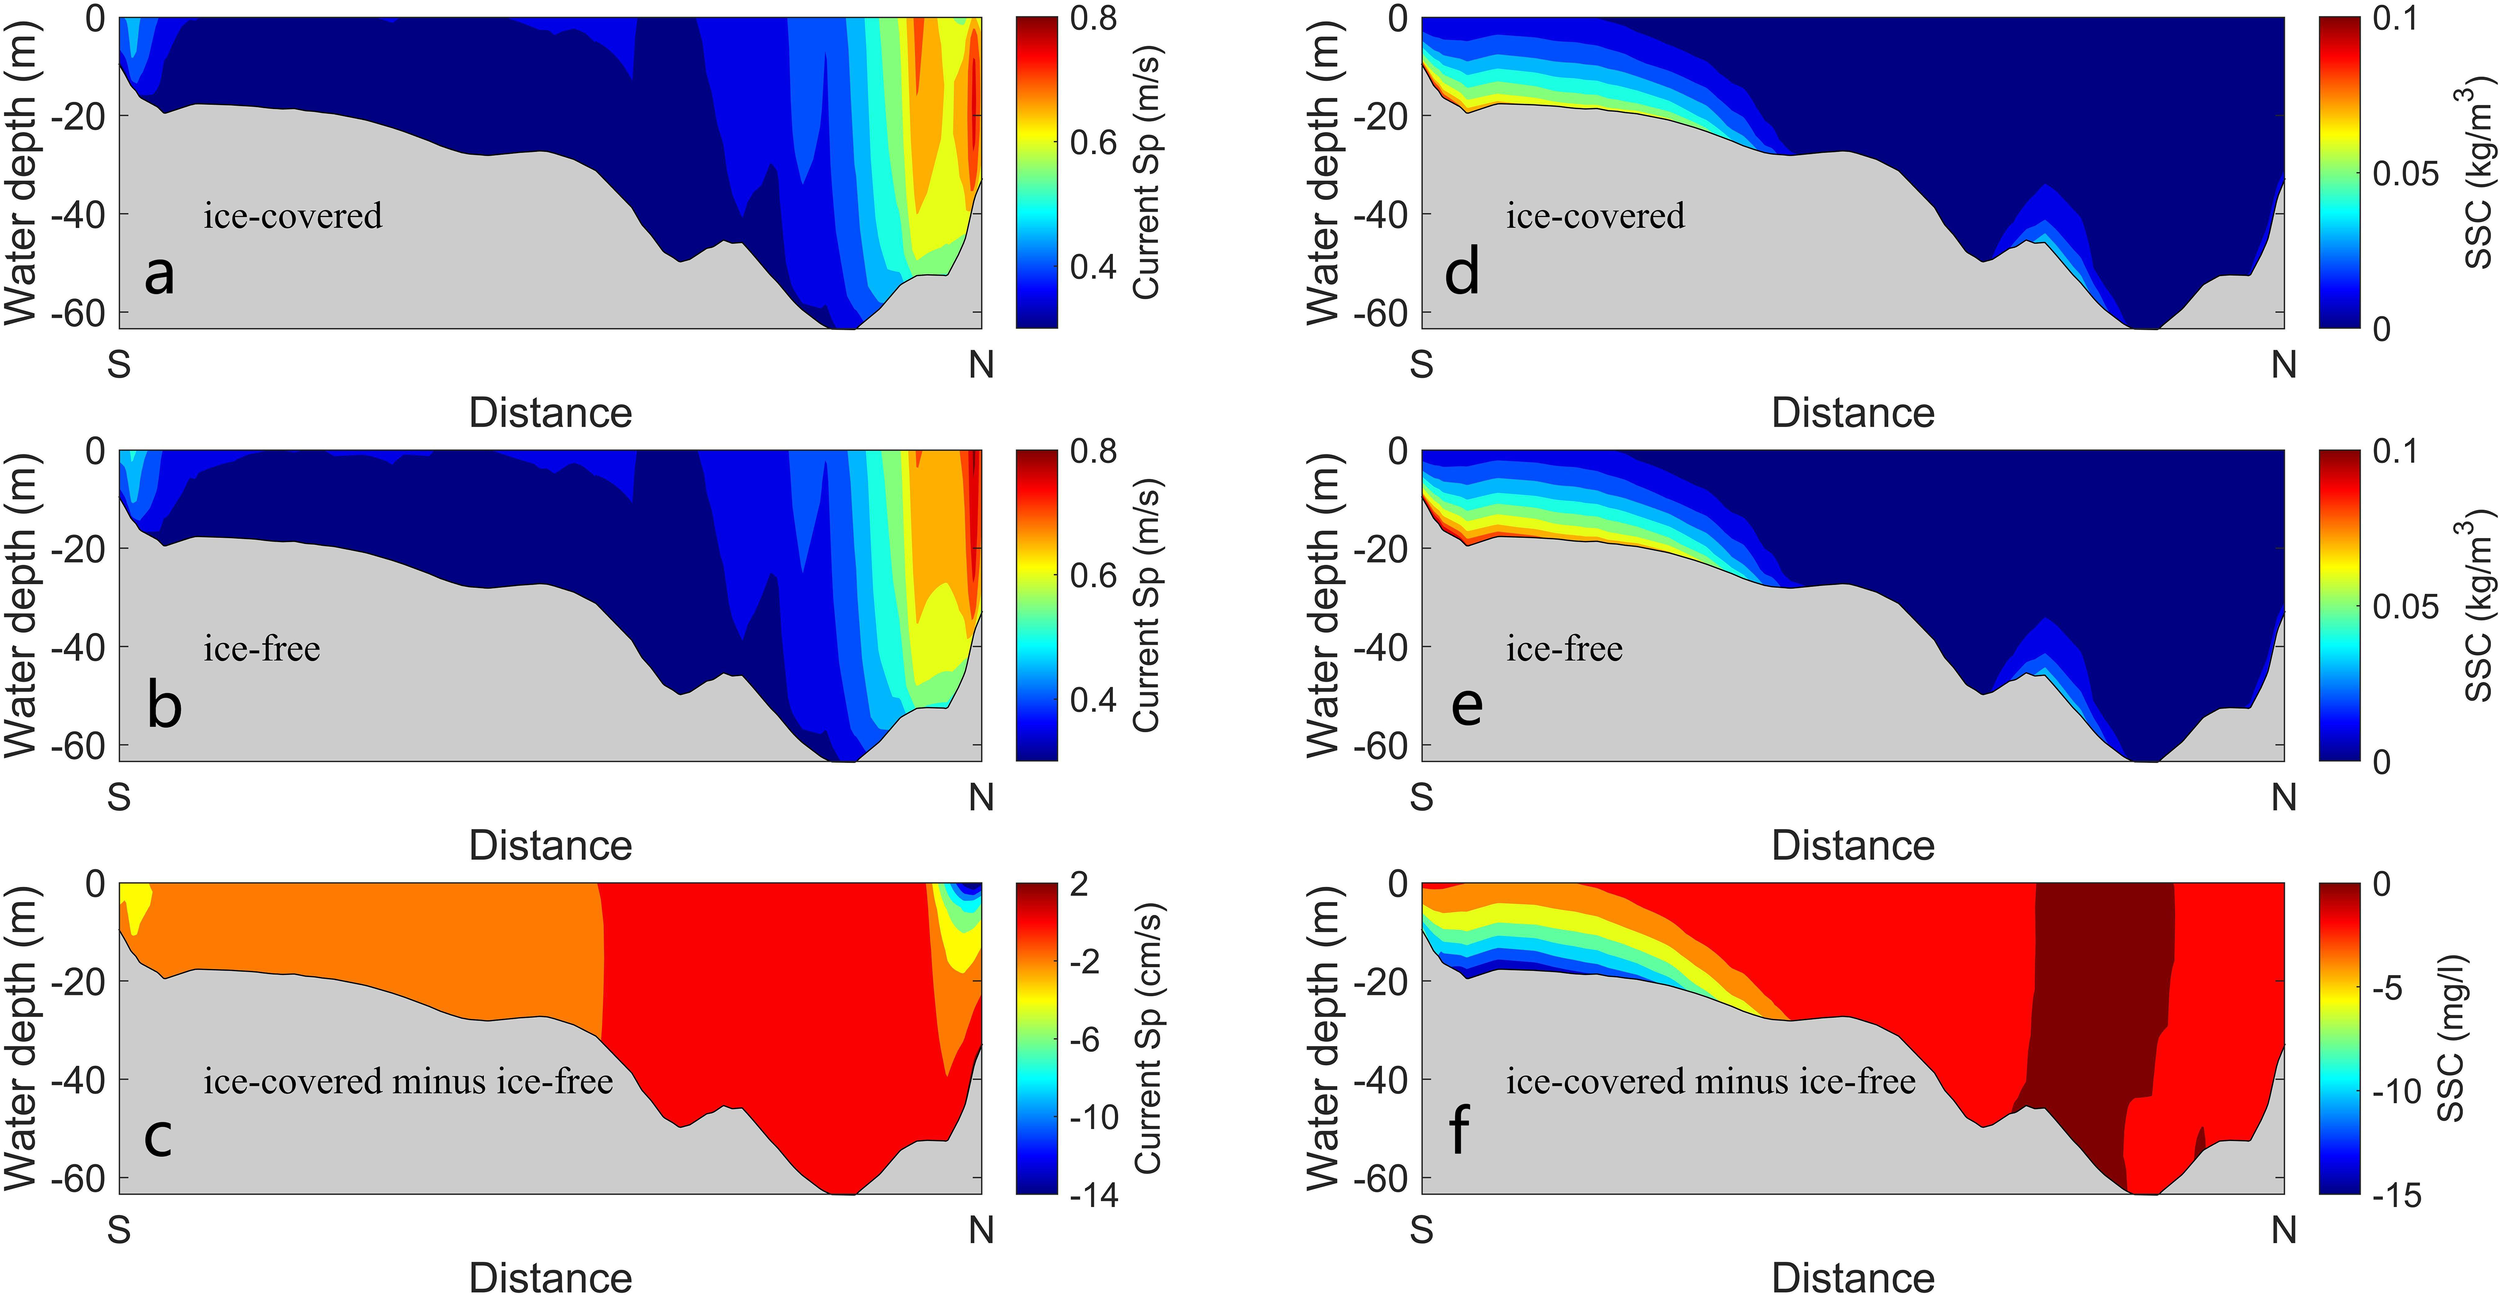
Comparison of current velocity and SSC in the Bohai Strait during winter. (A) The current velocity under ice-covered conditions. (B) The current velocity under ice-free conditions. (C) The current velocity difference (ice-covered minus ice-free). (D) The SSC under ice-covered conditions. (E) The SSC under ice-free conditions. (F) The SSC difference (ice-covered minus ice-free).
During winter, the average SSC in the Bohai Strait was 13.1 mg/l under ice-covered conditions and 15.2 mg/l under ice-free conditions (Figures 8D, E). In the southern part of the Bohai Strait (the north coast of the Shandong Peninsula), SSC was high, and the ice coverage reduced current velocity, thereby lowering the SSC to a maximum of nearly 15 mg/l (Figure 8F). Additionally, Yu (2012) supported that the high SSC near the north coast of Shandong Peninsula in winter was due to the strong wind waves and coastal currents in winter. Under ice-covered conditions, the reduction of SSF into the Bohai Sea by 20.3% was attributed to the decrease in inflow TF superimposing the decrease in SSC. In the northern part of the Bohai Strait, outflow TF increased, while SSC was low and changed minimally. On the other hand, in the southern part, the outflow TF decreased slightly, but the higher SSC decreased significantly. Ultimately, the outflow SSF from the entire Bohai Strait decreased by 11.9%, as opposed to increasing like the TF.
4.3 Annual water-sediment flux
The annual (March 2009 to February 2010) outflow TF from the Bohai Strait was 2.21×10¹³ m3 (Figure 9A), under ice-free conditions in winter representing approximately 25.1% of the total year (Figure 10A). Simultaneously, the annual inflow TF was 2.19×10¹³ m3 (Figure 9B), also under ice-free conditions in winter accounting for about 25.1% (Figure 10A). The annual net outflow TF from Bohai Sea was 2×10¹¹ m3; during ice-free winters, the net outflow was 4.9×10¹⁰ m3, making up 24.5% of the annual total, whereas during winters with ice coverage, the net outflow TF was 6.5×10¹⁰ m3, accounting for 32.5% of the annual total (Figure 10A).
Figure 9
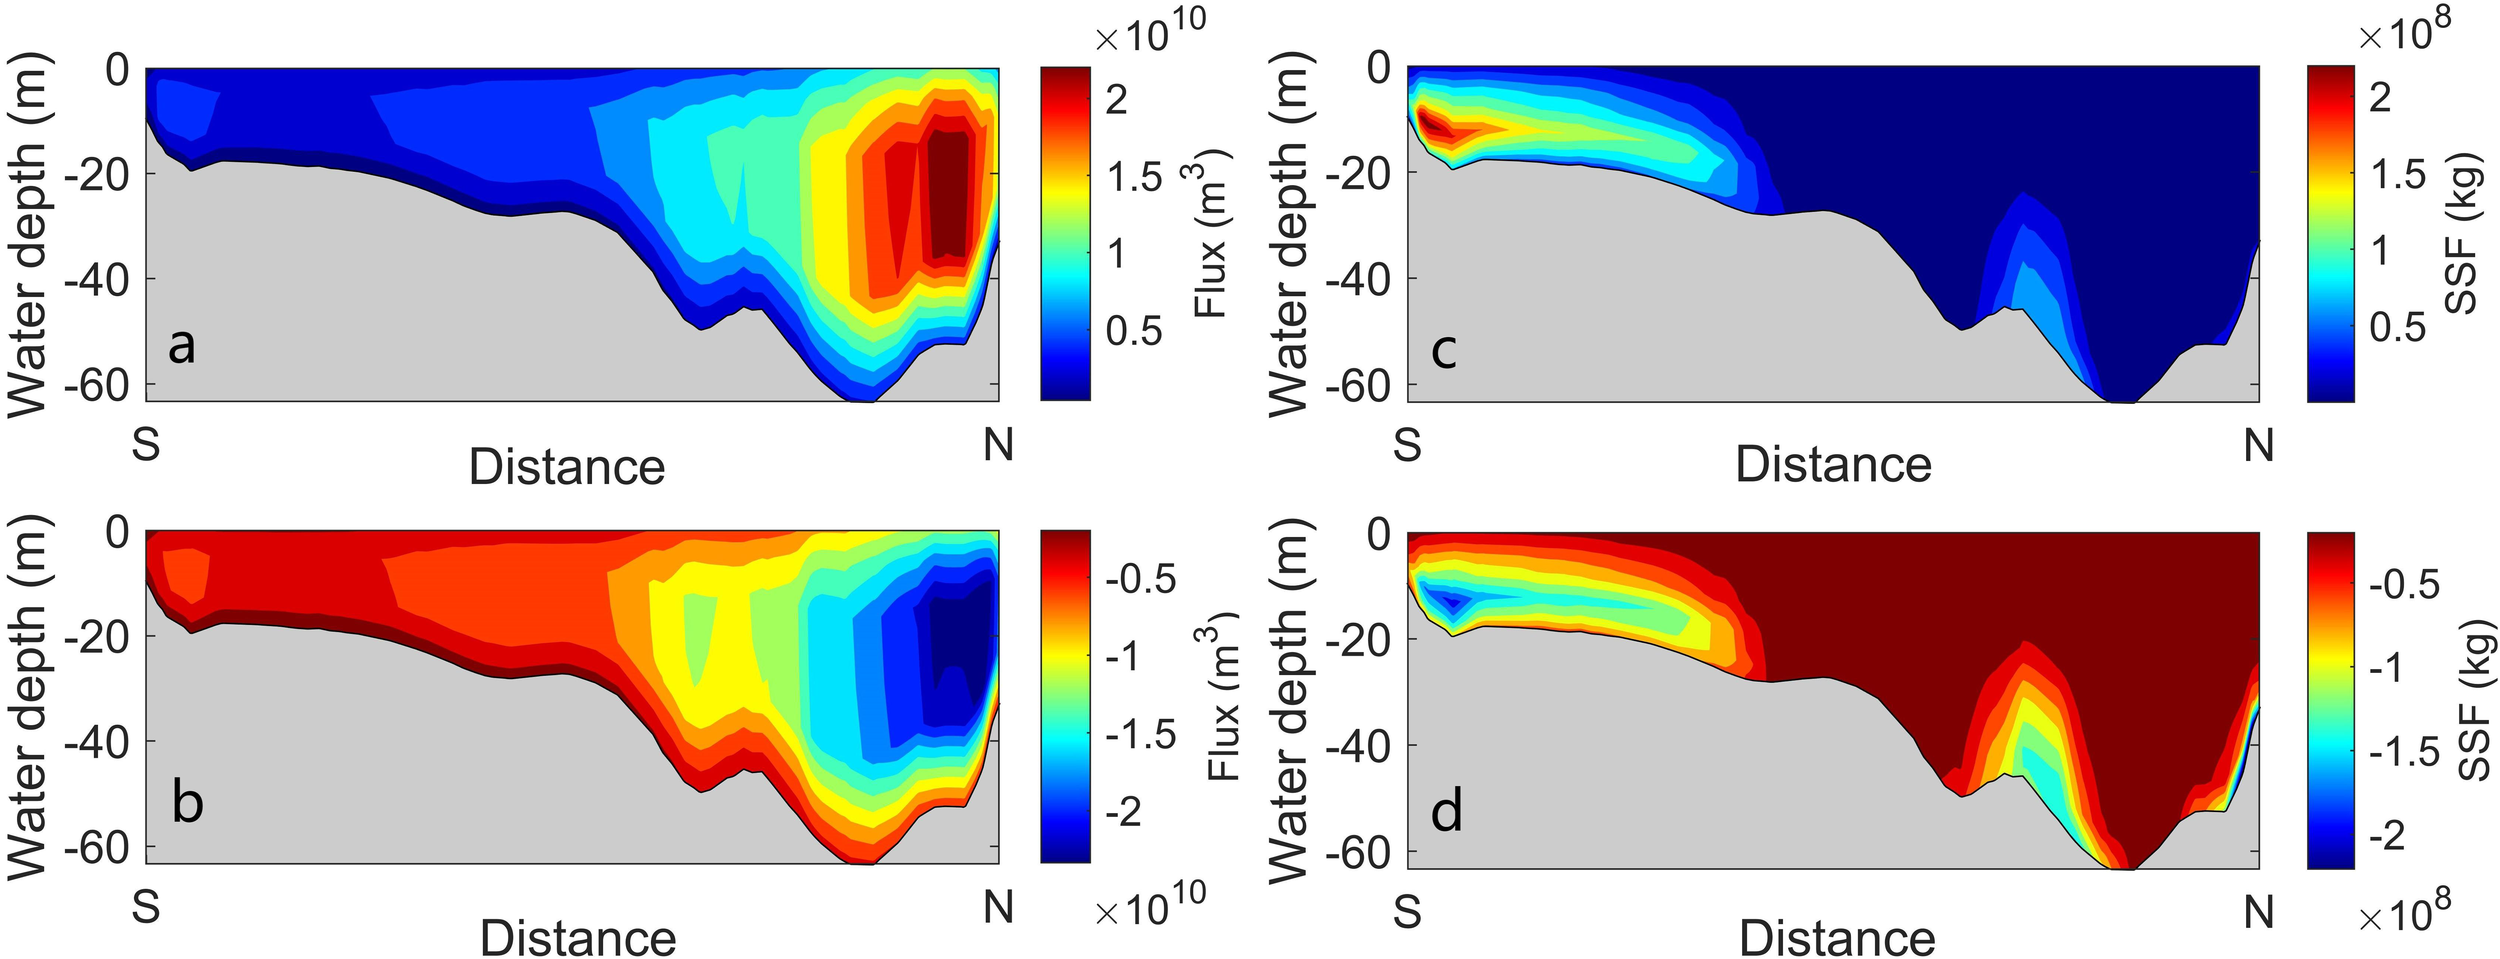
Annual inflow and outflow TF and SSF in the Bohai Strait. (A) Outflow TF. (B) Inflow TF. (C) Outflow SSF. (D) Inflow SSF.
Figure 10
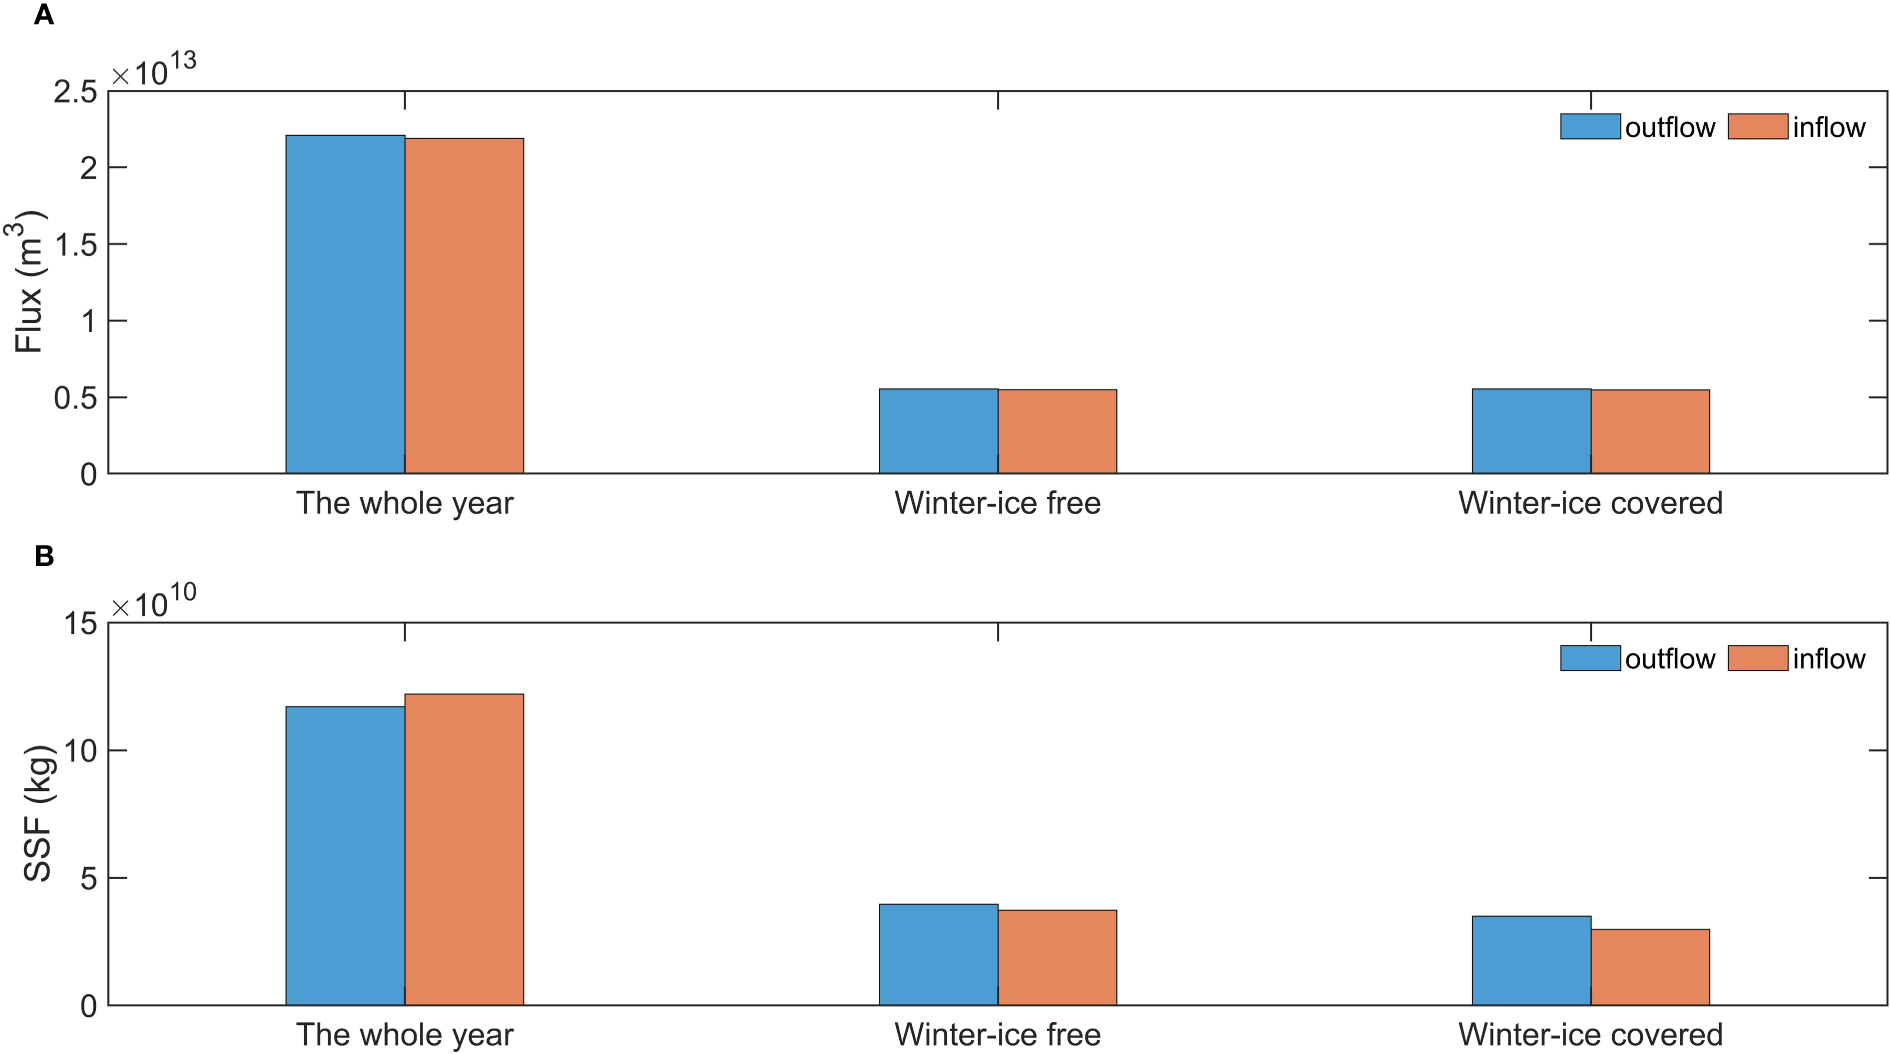
Statistical diagram of inflow and outflow water-sediment fluxes in the Bohai Strait throughout the whole year, under ice-free and ice-covered conditions. (A) TF. (B) SSF.
During the whole year, the outflow SSF from the Bohai Strait was 1.17×10¹¹ kg (Figure 9C), under ice-free conditions in winter accounting for about 33.8% and under ice-covered conditions for about 29.8% (Figure 10B). The annual inflow SSF was 1.22×10¹¹ kg (Figure 9D), under ice-free conditions in winter accounting for about 30.6% and under ice-covered conditions for about 24.3% (Figure 10B). The annual net inflow SSF to the Bohai Sea was 5×10⁹ kg. In winter, the net outflow SSF from the Bohai Sea was 2.32×10⁹ kg under ice-free conditions and 5.19×10⁹ kg under ice-covered conditions (Figure 10B).
Strong gale processes may induce significant wind-driven compensation flow and water exchange phenomena in the Bohai Sea (Wan et al., 2015a). In a year with consistent wind speed and tidal current velocity, the inflow and outflow TF and SSF during winter (92 days) accounted for 24.7% of the annual cycle (365 days). Numerical simulation results showed that under ice-free conditions, the inflow and outflow TF during winter contributed to 25.1% of the entire year. Moreover, the inflow and outflow SSF during winter under ice-free conditions contributed to 33.8% and 30.6% of the entire year, respectively. These findings indicated a slightly stronger water exchange capacity, sediment resuspension and diffusion in winter, primarily attributed to the winter gale processes (Wan et al., 2015b).
5 Conclusions
The paper established a high-precision MIKE 3D hydrodynamic and sediment transport numerical model in the Bohai Sea, along with a demonstration of its reliability through comparison with observation data. The changes in current velocity, SSC, and water-sediment flux in the Bohai Sea under both ice-free and ice-covered conditions was fully investigated. Furthermore, this study analyzed the response mechanism of suspended sediment transport to sea ice in the Bohai Sea during heavy ice years.
-
(1) Sea ice coverage inhibited the Hs, current velocity and sediment resuspension in the three bays of Bohai Sea, leading to varying degrees of decrease in Hs, current velocity and SSC. However, the current velocity increased at the edge of ice, intensifying disturbance to the bottom sediment. Additionally, under ice coverage, the current velocity in the middle layer was high, while it was low in the bottom and surface layer. Conversely, under ice-free conditions, the current velocity increased from the bottom to the surface.
-
(2) Under ice coverage, the inflow TF in the Bohai Sea decreased and the outflow TF increased. The net outflow TF in winter was 6.5×10¹⁰ m3, which was 32.7% higher than that without ice. During the ebb tide, the high pressure in Liaodong Bay and the pressure of heavy sea ice on the water body resulted in a pressure disparity between Liaodong Bay and the Bohai Strait, leading to the acceleration of current velocity and the larger outflow TF from the Bohai Sea. During flood tide, sea ice coverage made it difficult for water to enter the Bohai Sea, so the inflow TF decreased. The annual net outflow TF from the Bohai Sea was 2×10¹¹ m3, under ice-free conditions in winter accounting for about 24.5% and under ice-covered conditions for about 32.5%.
-
(3) The average SSC in the Bohai Strait was 13.1 mg/l under ice-covered conditions and 15.2 mg/l under ice-free conditions. Under ice coverage, the decrease of SSF into Bohai Sea was attributed to the reduction of inflow TF and SSC, resulting in the inflow SSF decreasing by 20.3%. Despite an increase in outflow TF from the northern part of the Bohai Strait, the low and stable SSC led to minimal change. Conversely, the outflow TF in the southern part of the Bohai Strait decreased, significantly reducing the SSC by nearly 15 mg/l. Overall, the outflow SSF from the Bohai Sea decreased by 11.9%, unlike the TF. The annual net inflow SSF to the Bohai Sea was 5×10⁹ kg, while in winter net outflow SSF was 5.19×10⁹ kg under ice-covered conditions, which was 1.24 times higher than that under ice-free conditions.
Statements
Data availability statement
The numerical modeling data were generated by the MIKE 3D Hydrodynamic and mud transport module by the Danish Hydraulic Institute (DHI, 2012) (https://www.mikepoweredbydhi.com/). Field measurement data at BH02 station used in this paper are provided by College of Marine Geosciences, Ocean University of China (https://doi.org/10.6084/m9.figshare.23691366.v1). The model data used in this paper are available online (https://doi.org/10.6084/m9.figshare.25218113).
Author contributions
SYL: Formal analysis, Methodology, Software, Writing – original draft, Writing – review & editing. GL: Conceptualization, Formal analysis, Funding acquisition, Software, Supervision, Writing – review & editing. SDL: Formal analysis, Methodology, Software, Writing – original draft. LZ: Data curation, Writing – original draft. ML: Methodology, Software, Writing – original draft. QF: Data curation, Methodology, Writing – original draft. LX: Conceptualization, Investigation, Writing – original draft. DY: Investigation, Methodology, Writing – original draft. YP: Formal analysis, Methodology, Writing – original draft.
Funding
The author(s) declare financial support was received for the research, authorship, and/or publication of this article. This study was jointly supported by the National Natural Science Foundation of China (grants 42121005), and Taishan Scholars Project (GXLI). Any users of the materials are required to clearly acknowledge the support of Ocean University of China.
Conflict of interest
Author ML was employed by PetroChina company.
The remaining authors declare that the research was conducted in the absence of any commercial or financial relationships that could be construed as a potential conflict of interest.
Publisher’s note
All claims expressed in this article are solely those of the authors and do not necessarily represent those of their affiliated organizations, or those of the publisher, the editors and the reviewers. Any product that may be evaluated in this article, or claim that may be made by its manufacturer, is not guaranteed or endorsed by the publisher.
References
1
Barrett L. Vlahos P. Hammond D. Mason R. (2023). Sediment-water fluxes of inorganic carbon and nutrients in the Pacific Arctic during the sea ice melt season. Continental Shelf Res.268, 105116. doi: 10.1016/j.csr.2023.105116
2
Bilotta G. Burnside N. Cheek L. Dunbar M. Grove M. Harrison C. et al . (2012). Developing environment-specific water quality guidelines for suspended particulate matter. Water Res.46, 2324–2332. doi: 10.1016/j.watres.2012.01.055
3
Bonsell C. Dunton K. (2018). Long-term patterns of benthic irradiance and kelp production in the central Beaufort sea reveal implications of warming for Arctic inner shelves. Prog. Oceanography162, 160–170. doi: 10.1016/j.pocean.2018.02.016
4
Che Y. Li J. Guan C. Lian X. Wu K. (2019). Surface wave simulation during winter with sea ice in the bohai sea. J. Oceanol. Limnol.37, 1857–1867. doi: 10.1016/j.oceaneng.2018.06.062
5
Dai H. McWilliams J. Liang J. (2019). Wave-driven currents in a marginal ice zone. Ocean Model.134, 1–17. doi: 10.1016/j.ocemod.2018.11.006
6
DHI (2012). MIKE 21 & MIKE 3 flow model FM. Hydrodynamic and Transport module scientific documentation, Release 2012 (Denmark: Danish Hydraulic Institute).
7
Forest A. Sampei M. Makabe R. Sasaki H. Barber D. Gratton Y. et al . (2008). The annual cycle of particulate organic carbon export in Franklin Bay (Canadian Arctic): Environmental control and food web implications. J. Geophysical Research: Oceans113, C03S99. doi: 10.1029/2008JC004782
8
Giesbrecht T. Sim N. Orians K. J. Cullen J. (2013). The distribution of dissolved and total dissolvable aluminum in the Beaufort Sea and Canada Basin region of the Arctic Ocean. J. Geophysical Research: Oceans118, 6824–6837. doi: 10.1002/2013JC009202
9
Heath M. Sabatino A. Serpetti N. Mccaig C. Murray R. (2016). Modelling the sensitivity of suspended sediment profiles to tidal current and wave conditions. Ocean Coast. Manage.147, 49–66. doi: 10.1016/j.ocecoaman.2016.10.018
10
Jiang M. Pang C. Liu Z. Jiang J. (2020). mpact of sea ice on the hydrodynamics and suspended sediment concentration in the coastal waters of Qinhuangdao, China. Water12 (2), 611. doi: 10.3390/w12020611
11
Jiang S. Wang N. Cheng H. Yin Y. (2019). The study on hydrodynamic distribution characteristics of the bohai strait. Periodical Ocean Univ. China49, 66–73. doi: 10.16441/j.cnki.hdxb.20190032
12
Jiao C. Zhang W. Dong S. (2019). Statistical Prediction for Annual Start Date and Duration of Sea ice Coverage at Qinhuangdao Observation Station. J. Ocean Univ. China18, 1265–1272. doi: 10.1007/s11802-019-4060-x
13
Kug J. Jeong J. Jang Y. Kim B. Folland C. Min S. et al . (2015). Two distinct influences of Arctic warming on cold winters over North America and East Asia. Nat. Geosci.8, 759–762. doi: 10.1038/ngeo2517
14
Lannuzel D. Schoemann V. Jong J. Pasquer B. Merwe P. Masson F. et al . (2010). Distribution of dissolved iron in Antarctic sea ice: Spatial, seasonal, and inter-annual variability. J. Geophysical Research: Biogeosciences115, G03022. doi: 10.1029/2009JG001031
15
Li G. (2005). Study of Sedimentary Environment in the East China Sea (Beijing: Science press).
16
Li M. Amos C. (2001). Sedtrans96: the upgraded and better calibrated sediment-transport model for continental shelves. Comput. Geosciences27, 619–645. doi: 10.1016/S0098-3004(00)00120-5
17
Li G. Jiao Y. Chen X. Zhao Y. Li R. Guo D. et al . (2024). Investigation of the recent ice characteristics in the Bohai sea in the winters of 2005–2022 using multi-source data. Water16, 290. doi: 10.3390/w16020290
18
Li G. Tang Z. Yue S. Zhuang K. Wei H. (2001). Sedimentation in the shear front off the Yellow River mouth. Continental Shelf Res.21, 607–625. doi: 10.1016/S0278-4343(00)00097-2
19
Liu A. Häkkinen S. Peng C. (1993). ). Wave effects on ocean-ice interaction in the marginal ice zone. J. Geophysical Res. Atmospheres98, 10025–10036. doi: 10.1029/93JC00653
20
Liu S. Li G. Liu S. Xing L. Pan Y. Yu D. (2024). Impacts of reclamation on hydrodynamic and suspended sediment transport in the Bohai Sea. J. Geophysical Research: Oceans129, e2023JC020570. doi: 10.1029/2023JC020570
21
Liu S. Liu S. Li G. Zhang S. Xu J. Zhang L. et al . (2022). Impacts of sea ice on marine dynamics in western Laizhou Bay, Bohai Sea. Estuar. Coast. Shelf Sci.275, 105116. doi: 10.1016/j.ecss.2022.107958
22
Liu S. Qiao L. Li G. Shi J. Huang L. Yao Z. et al . (2018). Variation in the current shear front and its potential effect on sediment transport over the inner shelf of the East China Sea in winter. J. Geophysical Research: Oceans123, 8264–8283. doi: 10.1029/2018JC014241
23
Lu P. Li Z. Dong X. Zhang Z. Chen S. (2004). Sea ice thickness and concentration analysis methods in arctic based on remote sensing images. Chin. J. Polar Res.4, 317–323. doi: 10.1007/BF02873097
24
MacVean L. Lacy J. R. (2014). Interactions between waves, sediment, and turbulence on a shallow estuarine mud flat. J. Geophysical Research: Oceans119, 1534–1553. doi: 10.1002/2013JC009477
25
Manson G. Davidson-Arnott R. Ollerhead J. (2016). Attenuation of wave energy by nearshore sea ice: Prince edward Island, Canada. J. Geophysical Research: Oceans318 (2), 253–263. doi: 10.2112/JCOASTRES-D-14-00207.1
26
Milliman J. Meade R. (1983). World-wide delivery of river sediment to the oceans. J. Geology91, 1–21. doi: 10.1086/628741
27
Murray K. Miller M. Bowser S. (2012). Depositional processes beneath coastal multi-year sea ice. Sedimentology60 (2), 391–410. doi: 10.1111/j.1365-3091.2012.01345.x
28
Pawlowicz R. Beardsley B. Lentz S. (2002). Classical tidal harmonic analysis including error estimates in MATLAB using T_TIDE. Comput. Geosciences28, 929–937. doi: 10.1016/S0098-3004(02)00013-4
29
Peck L. Barnes D. Willmott J. (2005). Responses to extreme seasonality in food supply: Diet plasticity in Antarctic brachiopods. Mar. Biol.147, 453–463. doi: 10.1007/s00227-005-1591-z
30
Ren Y. Li X. Zhang W. (2022). A data-driven deep learning model for weekly sea ice concentration prediction of the Pan-Arctic during the melting season. IEEE Trans. Geosci. Remote Sens.60, 1–19. doi: 10.1109/TGRS.2022.3177600
31
Shi B. Yang S. Wang Y. Yu Q. Li M. (2014). Intratidal erosion and deposition rates inferred from field observations of hydrodynamic and sedimentary processes: a case study of a mudflat–saltmarsh transition at the yangtze delta front. Continental Shelf Res.90, 109–116. doi: 10.1016/j.csr.2014.01.019
32
Soulsby R. (1995). Bed shear stresses due to combined waves and currents. In Advances in Coastal Morphodynamics, 4–23.
33
Soulsby R. (1997). Dynamics of Marine Sands (HR Wallingford Titles): A Manual for Practical Applications (New York: Thomas Telford Publications).
34
Su H. Wang Y. (2012). Using MODIS data to estimate sea ice thickness in the Bohai Sea (China) in the 2009–2010 winter. J. Geophysical Research: Oceans117, C10018. doi: 10.1029/2012JC008251
35
Su J. Wu H. Knuth M. A. Gao G. (2003). Modeling dynamic interaction of ice-ocean in the bohai sea. J. Glaciol. Geocryol.S2), 292–298.
36
Wahlgren S. Thomson J. Biddle L. Swart S. (2023). Direct observations of wave-sea ice interactions in the Antarctic marginal ice zone. J. Geophysical Research: Oceans128, e2023JC019948. doi: 10.1029/2023JC019948
37
Wan K. Bao X. Wang Y. Wan X. Li H. Liu K. (2015a). Barotropic current oscillations coupled with the drawdown in Yellow and Bohai Sea. Chin. J. Oceanology Limnology33, 272–281. doi: 10.1007/s00343-015-4056-3
38
Wan X. Ma Q. Ma W. (2015b). The effect of high frequency strong winds on winter circulation andWater exchange in the bohai sea by ROMS. Periodical Ocean Univ. China4, 1–8. doi: 10.16441/j.cnki.hdxb.20140146
39
Wang N. Li G. Qiao L. Shi J. Dong P. Xu J. et al . (2017). Long-term evolution in the location, propagation, and magnitude of the tidal shear front off the Yellow River Mouth. Continental Shelf Res.137, 1–12. doi: 10.1016/j.csr.2017.01.020
40
Wang X. Liu J. Liu H. (2024). Seasonal variability of arctic mid-level clouds and the relationships with sea ice from 2003 to 2022: a satellite perspective. Remote Sens.16, 202. doi: 10.3390/rs16010202
41
Wang A. Tang M. Zhao Q. Liu Y. Li B. Shi Y. et al . (2021). Analysis of sea ice parameters for the design of an offshore wind farm in the Bohai Sea. Ocean Eng.239, 109902. doi: 10.1016/j.oceaneng.2021.109902
42
Wang H. Wang A. Bi N. Zeng X. Xiao H. (2014). Seasonal distribution of suspended sediment in the Bohai Sea, China. Continental Shelf Res.90, 17–32. doi: 10.1016/j.csr.2014.03.006
43
Warren I. Bach H. (1992). MIKE 21: A modelling system for estuaries, coastal waters and seas. Environ. Software7, 229–240. doi: 10.1016/0266-9838(92)90006-P
44
Wiberg P. Sherwood C. (2008). Calculating wave-generated bottom orbital velocities from surface-wave parameters. Comput. Geosciences34, 1243–1262. doi: 10.1016/j.cageo.2008.02.010
45
Willmott C. (1981). On the validation of models. Phys. Geogr.2, 184–194.
46
Xie J. Feng X. Chen H. Yin B. (2023). Study on the mechanisms of interannual variation in suspended sediment concentration in the bohai sea based on GOCI. J. Sea Res.195, 102416. doi: 10.1016/j.seares.2023.102416
47
Xu N. Yuan S. Yan Q. (2019). Sea ice in the Bohai Sea and its impact on marine ecological environment. Environment Projection (07), 20–25. doi: 10.14026/j.cnki.0253-9705.2019.07.005
48
Yang Z. Ji Y. Bi N. Lei K. Wang H. (2011). Sediment transport off the Huanghe (Yellow River) delta and in the adjacent Bohai Sea in winter and seasonal comparison. Estuarine Coast. Shelf Sci.93, 173–181. doi: 10.1016/j.ecss.2010.06.005
49
Yu J. (2012). Seasonal variation and distribution of suspended sediment in the yellow sea (Qingdao: Ocean University).
50
Zhang Q. Li B. (1999). A comparative study on the characteristics of winter ice conditions between Bohai Sea in 1998/99 and other years. Marrine Forecasts02, 80–87. doi: CNKI:SUN:HYYB.0.1999-01-006
51
Zhang N. Li S. Wu Y. Wang K. Zhang Q. You Z. et al . (2020). Effects of sea ice on wave energy flux distribution in the Bohai Sea. Renew. Energy162, 2330–2343. doi: 10.1016/j.renene.2020.10.036
52
Zhang N. Ma Y. Zhang Q. (2018). Prediction of sea ice evolution in Liaodong Bay based on a back-propagation neural network model. Cold Regions Sci. Technol.145, 65–75. doi: 10.1016/j.coldregions.2017.10.002
53
Zhang Q. Tang M. (2010). “Analysis of the causes of a 30-year ice situation in Bohai Sea,” in The 26th Annual Meeting of the Chinese Geophysical Society, 452–453. Beijing: National Marine Environmental Forecasting Center.
54
Zhang N. Wang J. Wu Y. Wang K. Zhang Q. Wu S. et al . (2019). A modelling study of ice effect on tidal damping in the Bohai Sea. Ocean Eng.173, 748–760. doi: 10.1016/j.oceaneng.2019.01.049
55
Zhao J. Bu Q. Liu C. (2012). Genetic analysis of Sea ice in the Bohai Sea in January 2010. Tianjin Sci. Technol.39, 68–70. doi: 10.14099/j.cnki.tjkj.2012.03.038
56
Zhou S. Meijers A. Meredith M. Abrahamsen E. Holland P. Silvano A. et al . (2023). Slowdown of Antarctic Bottom Water export driven by climatic wind and sea-ice changes. Nat. Climate Change13, 701–709. doi: 10.1038/s41558-023-01695-4
57
Zhou Y. Yu D. Cheng W. Gai Y. Yao H. Yang L. et al . (2022). Monitoring multi-temporal and spatial variations of water transparency in the Jiaozhou Bay using GOCI data. Mar. pollut. Bull.180, 113815. doi: 10.1016/j.marpolbul.2022.113815
Summary
Keywords
Bohai Sea, sea ice, water-sediment flux, sediment resuspension, pressure
Citation
Liu S, Li G, Liu S, Zhang L, Li M, Feng Q, Xing L, Yu D and Pan Y (2024) Impacts of sea ice on suspended sediment transport during heavy ice years in the Bohai Sea. Front. Mar. Sci. 11:1411770. doi: 10.3389/fmars.2024.1411770
Received
04 April 2024
Accepted
22 July 2024
Published
08 August 2024
Volume
11 - 2024
Edited by
Xiuyu Liang, Southern University of Science and Technology, China
Reviewed by
Fei Gao, Qingdao Institute of Marine Geology (QIMG), China
Li Li, Zhejiang University, China
Updates
Copyright
© 2024 Liu, Li, Liu, Zhang, Li, Feng, Xing, Yu and Pan.
This is an open-access article distributed under the terms of the Creative Commons Attribution License (CC BY). The use, distribution or reproduction in other forums is permitted, provided the original author(s) and the copyright owner(s) are credited and that the original publication in this journal is cited, in accordance with accepted academic practice. No use, distribution or reproduction is permitted which does not comply with these terms.
*Correspondence: Guangxue Li, estuary@ouc.edu.cn
Disclaimer
All claims expressed in this article are solely those of the authors and do not necessarily represent those of their affiliated organizations, or those of the publisher, the editors and the reviewers. Any product that may be evaluated in this article or claim that may be made by its manufacturer is not guaranteed or endorsed by the publisher.