 Ping Wang1
 Xue Liu
- 1South China Sea Information Centre, State Oceanic Administration & Southern Marine Science and Engineering Guangdong Laboratory (Zhuhai), Zhuhai, China
- 2College of Geodesy and Geomatics, Shandong University of Science and Technology, Qingdao, China
The rapid development of maritime transport and the gradual increase in the number of ports, ships and shipping routes can produce direct economic benefits for regional development, and a profound grasp of the actual situation of maritime transport makes it possible to make practical plans for economic development and thus rationally develop and use marine resources. However, there is a lack of research on maritime transport, so this study is based on the AIS, waterways, routes and ports data in the near-shore sea area of Guangdong Province. Using GIS spatial analysis technology and various mathematical models, we refer to the evaluation method of road traffic dominance. It analyses and proposes the evaluation indexes of maritime traffic advantages, such as the density of maritime traffic network and the proximity of ports. Based on the actual situation of the study regions, the indicators were quantitatively evaluated and analyzed. The economic development level of each region was also quantitatively evaluated using principal component analysis, and the study regions were classified based on the coupling-coordination model. The results show that the coastal area of Guangdong Province is divided into four types of zones according to the coupling-coordination type of zoning criteria. Corresponding development suggestions are put forward for different zones, and the research results provide certain practical guidelines for promoting the benign cycle development of maritime traffic and economy, and have important guiding significance and application value for the organization and safety of maritime traffic.
1 Introduction
With the maritime economy development, the number of ships, maritime traffic volume, maritime traffic density, transportation infrastructure (Cosimo Magazzino and Ila Maltese, 2021), and other related data are in a climbing trend. As transportation serves as a bridge linking geographic space and socio-economic activities, the construction of a stable and coordinated maritime transportation network system can promote regional development (Ramesh et al., 2023) and provide protection and support for it (Chen et al., 2022a), and transportation has been studied as an important topic of economic geography at home and abroad (Liu and Meng, 2022; Miao et al., 2021; Yue et al., 2024). With the establishment of ground-based networks of automatic identification systems (AIS), scholars have gradually expanded their research on maritime traffic and ships (Alberto et al., 2023; Muhammad et al., 2024a; Yasir et al., 2024). Maritime transportation can guide, secure, and support the development and progress of a region, and is an important indicator of a region’s development (Sun et al., 2021; Banister and Berechman, 2001). A key factor in economic growth is the availability of a sufficient quantity and quality of maritime transportation infrastructure, and improving the accessibility of the transportation system will have a direct economic benefit to the development of a region (Huang et al., 2021; Duan et al., 2022).
Maritime traffic has a long history, from the beginning of the twentieth century until now, from the initial designated sea traffic routes to the current increasingly complex system of sea traffic networks. For maritime transport, there are a number of scholars who have carried out some studies on aspects such as the trajectory of shipping and the important role of ports (Ronald et al., 2023; Lisa et al., 2024). For example, in terms of transportation, scholars in China have made many studies on maritime traffic management. Chen et al. (2006) confirmed that the road traffic network is a scale-free network. Huang et al. (2022) put forward a deep learning ship tracks forecast method that fuses discrete meteorological data and realizes precise tracks forecast on a worldwide scale. Meng et al. (2012) introduced the entropy weighting method in the calculation of the weights of indicators related to each traffic dominance degree. Cheng et al. (2016) established an evaluation index system specifically for the northwest, containing both arterial impact and facility density, and used it to conclude that the spatial pattern of transportation dominance in the northwest showed a high level in the east and a low level in the mid-west. Foreign scholars have also conducted many studies on transport (Xu et al., 2022; Wang et al., 2024; Lu and Osorio, 2022), for example, in terms of traffic dominance, most foreign researchers have used indicators such as distance or travel time cost to compare the evaluation from the aspect of accessibility (Geurs and Bert, 2004; Wee, 2011). Hansen (1959), as the initiator of the definition of accessibility, described it as the opportunity of interaction of nodes in the transportation network and used this comprehensive evaluation index to evaluate the traffic location. Ingram (2007) used accessibility to judge the situation of a spatial barrier and concluded that the two were negatively correlated. Hu et al. (2015) described and proposed a quantitative measure of traffic dominance. Davis et al. (2020) analyzed the correlation between traffic and economy using weighted and spatial autocorrelation models. Kwan et al. (2003) used the likelihood of proximity as a criterion for accessibility and concluded that the two were positively correlated. For domestic scholars, the indexes used are different from them. For example, Jin et al. (2008) introduced the concept of traffic dominance for the first time and evaluated the traffic dominance of a region by using three components: potential, quality and quantity. Generally speaking, the higher the value of the traffic advantage degree in a region, the better the overall traffic advantage. In real-life applications, it is more to evaluate the network density, location advantage and traffic trunk influence of integrated transportation equipment (Jin et al., 2008).
Despite the above studies, the existing traffic dominance evaluation mainly focuses on land, and there are the following differences between marine traffic and land traffic: in terms of transportation, ships are larger and slower than land transportation such as cars; in terms of transportation routes, there are mainly roads and railroads on land, which are easy to measure, while marine transportation routes are more widely distributed; in terms of deployment area, the ocean area is more extensive, and the deployment routes are more complex and have a large amount of data, etc. Therefore, the study of maritime transportation will be more complicated compared to land. With the advantages of strong continuity and low cost, maritime transportation is one of the important components of the national transportation artery, and maritime transportation achieves more than ninety percent of China’s total import and export freight. From a macro point of view, maritime transportation plays a vital role in a country’s economy to the world. Muhammad et al. (2024b) presented a SAR vessel following framework named YOLOv8-BYTE to improve the vessel tracking effectiveness. Jin et al. (2008) and other scholars have proposed the use of traffic dominance to describe the development of land transportation, however, marine transportation is different from land transportation because of its vast scope and diversified route distribution, and the application of land models to marine transportation cannot reflect the specific situation of its routes and port distribution and other related factors, and therefore, road-based models cannot be directly applied to marine traffic. The establishment of marine transportation dominance index to analyze can effectively grasp the actual distribution and density range of marine transportation in each region, considering factors such as waterways, routes, ports and vessels, and then takes into account the region’s economic progress and provides a basis for policy-making for the harmonious development of the marine shipping and the economy of the region. However, there are limitations in the existing traffic dominance and its corresponding research methods and related factors for the evaluation of maritime traffic dominance, and there is a lack of research specifically on maritime traffic dominance, and the evaluation methods and related influencing factors of maritime traffic dominance need to be explored.
Comparing the global marine economy, it is easy to see that China’s marine economy is developing fast and growing in scale, and the gross marine product of the marine economic circle is all showing an upward trend (Fu and Liu, 2022). Objectively speaking, the contribution of our marine economy to the global marine economy is also very considerable. The planning of marine transportation is closely related to the development of the marine economy. Under the premise of grasping the marine transportation survey, we can make a practical economic development plan, so that we can really maximize the rational development and use of marine resources and achieve sustainable development (Wang and Zhang, 2023).
Based on the above analyses, this study compares land transport with marine transport based on shipping big data such as AIS, taking the sea and land areas included in 14 prefecture-level cities in the coastal area of Guangdong Province as a unit, and explores the relationship between the degree of dominance of marine transport and economic development. It reveals the current situation of the dominance degree of marine transportation, as well as to provide theoretical basis and decision support for the coordinated sustainable development of marine economy and region, and further expansion of marine transportation and economy by analyzing the relationship between marine transportation and economy. The main contributions of this study are as follows.
1. Analyzing the evaluation methods of land transport, proposing relevant indicators applicable to maritime transport, and improving the road network density and other relevant research methods, proposing the density of maritime transport network and the proximity of ports as the main factors, and establishing a relevant factor system and evaluation model suitable for evaluating the degree of superiority of maritime transport.
2. The spatial pattern was analyzed by using Geographic Information System (GIS) method, and the quantitative assessment of the economic development level of each region was carried out by using SPSS software to explore the interrelationship between maritime transport and marine economic development.
3. Based on the coupling-coordination relationship model, the development situation among regions is analyzed, and targeted development strategies are proposed for each part of the study area.
2 Materials and methods
2.1 Study area
The primary areas of research in this study is the coastal cities of Guangdong Province and its adjacent sea areas, between 20°10′ and 25°01′ N and 109°09′ and 117°59′ E (Figure 1). Guangdong, abbreviated as “Yue”, is a provincial administrative region of the People’s Republic of China, with Guangzhou as its capital. It is located south of the South Ridge, near the South China Sea, bordering Guangxi, Hong Kong, Fujian, Hunan, Jiangxi and Macao, and across the sea from Hainan. With a gross domestic product (GDP) of 12.4 trillion yuan in 2021, Guangdong Province became the first province to rank first with a GDP exceeding 12 trillion yuan (Liu et al., 2023). As a large marine province of Guangdong, because of the sea and prosperous, because of the sea and rich, for 26 consecutive years its gross marine product ranked first in the country, its marine economic development in the overall pattern of the country occupies a pivotal position. According to Guangdong Marine Economic Development Report (2022), the province’s marine GDP of 1.99 trillion yuan accounted for 22.1% of the national marine GDP, ranking first in the country. According to the data of China Port Yearbook (2020), Guangdong Province has a total of 2273 productive berths in the province, ranking the first in the country; its coastline is more than 8000 kilometers, accounting for one-third of the country, of which more than 4000 kilometers of the mainland coastline, ranking the first in the country. According to the above information, this study is more representative to select Guangdong Province for the research. The development trend of ocean-related industries in Guangdong Province is relatively good, and the strategic emerging marine industries are increasing rapidly, with the proportion of gross domestic product increasing and the industrial structure being optimized (Feng et al., 2023). taking Guangdong District as the research area, the research on three-dimensional layered management and three-dimensional expression of sea registration data was carried out to realize efficient loading, expression and hierarchical utilization analysis of massive three-dimensional sea registration data. Maritime transportation, as the southern gate of China’s Guangdong Province, is located in the South China Sea shipping hub area, has a wealth of waterway resources, can pass a relatively large amount of ships, and can simultaneously accommodate a high density of ships, become the “21st Century Maritime Silk Road” one of the key coast, but also as a distribution center to deal with domestic and foreign materials.
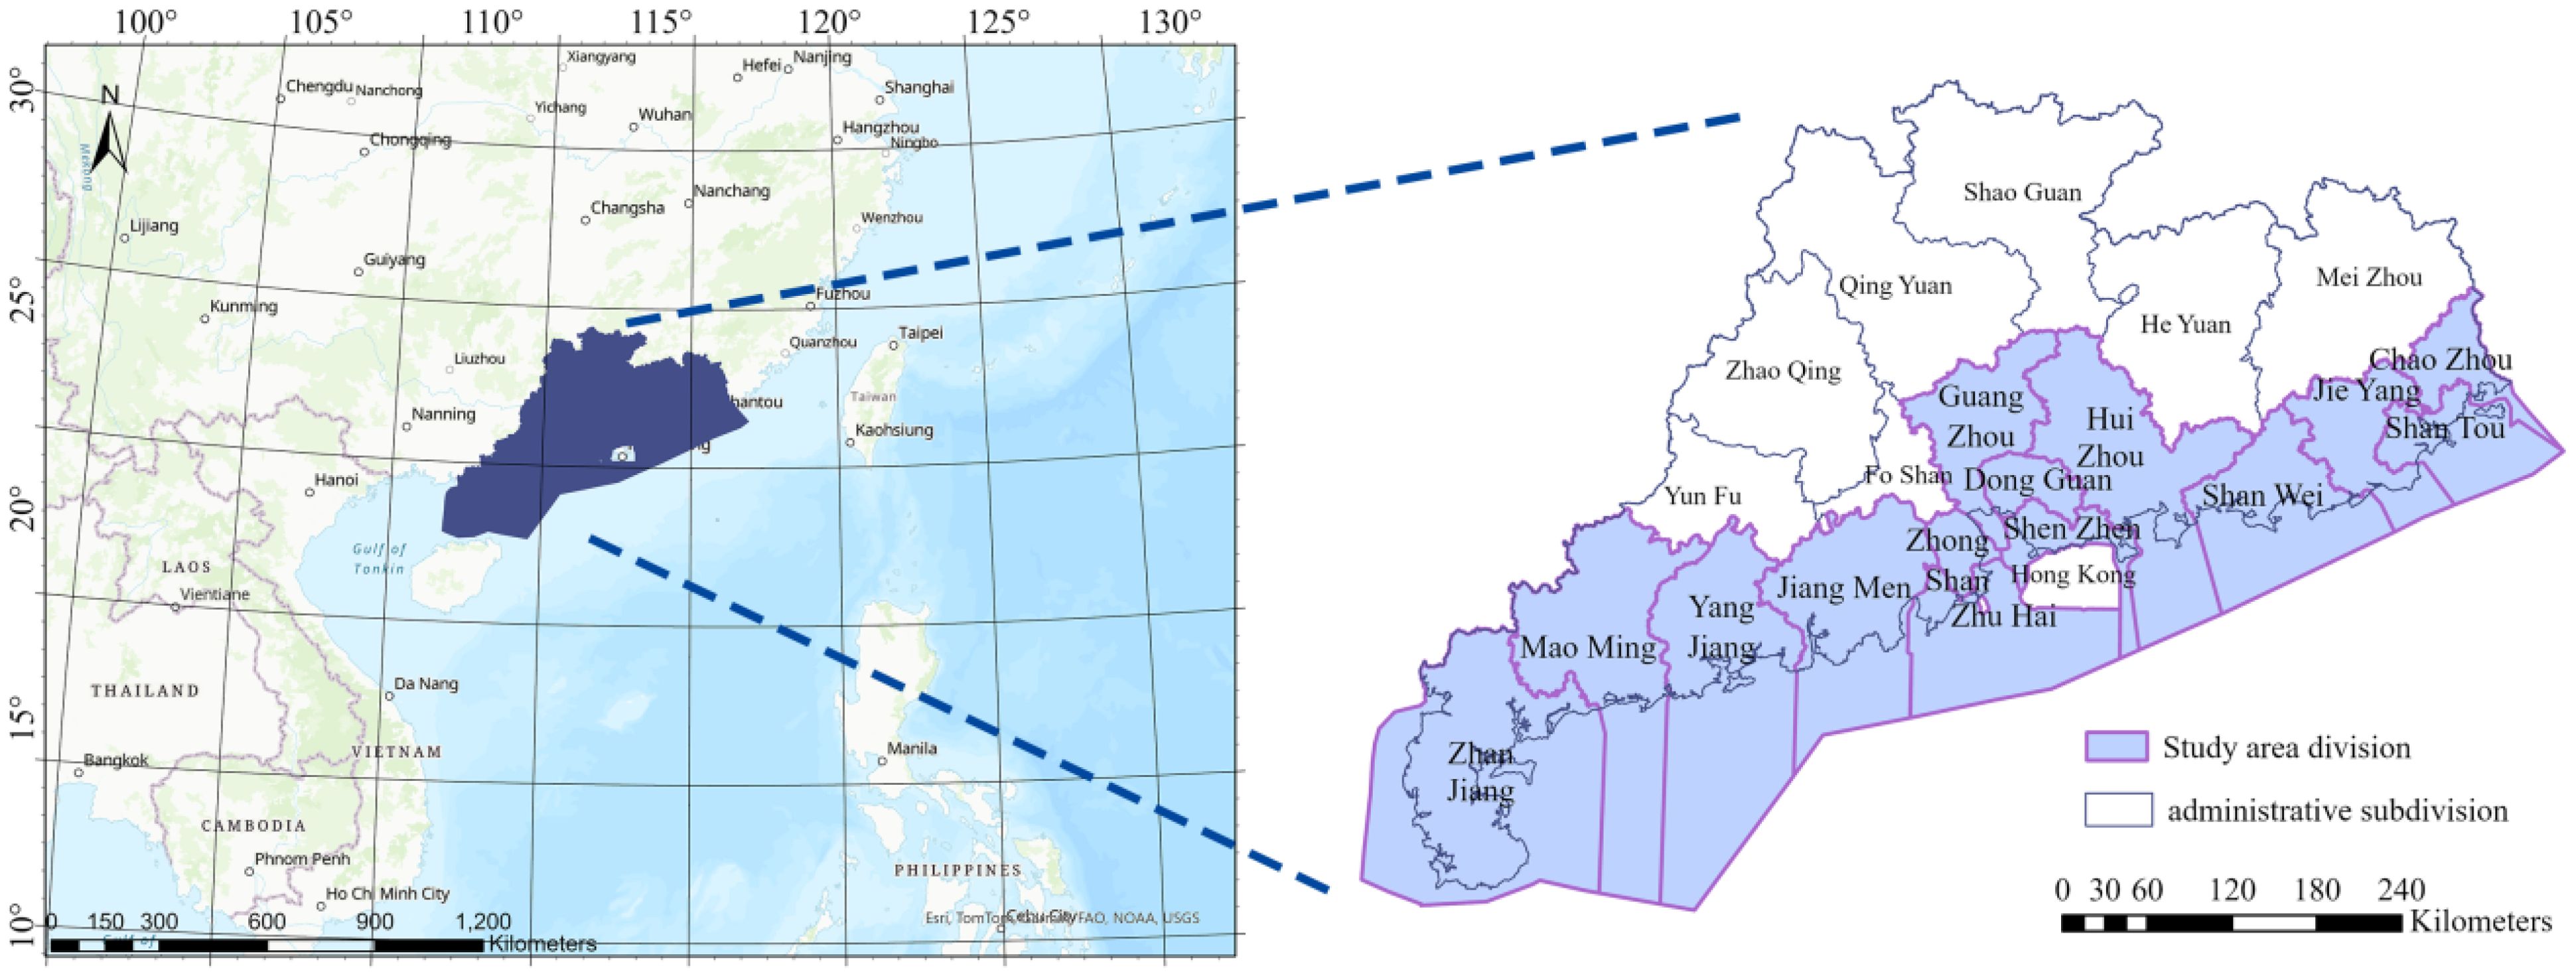
Figure 1. Overview of the study area.
There are 14 coastal prefecture-level cities in Guangdong Province, namely Zhongshan, Huizhou, Chaozhou, Dongguan, Guangzhou, Jieyang, Maoming, Shantou, Shanwei, Shenzhen, Yangjiang, Zhanjiang, Zhuhai, and Jiangmen. The corresponding sea area zoning is divided according to the prefecture-level city to which the coastal sea area belongs, and the outer boundary of the zoning is the territorial sea line, which is 12 nautical miles away from the baseline of the territorial sea, and the corresponding data is provided by the Guangdong Provincial Marine Development Planning and Research Center, which is divided into 14 study areas (Figure 1).
2.2 Data sources
The data used in this study mainly includes AIS data, channel route data, port data, basic geographic information data such as sea area division, and economic data.
Among them, the AIS data collected 10,696,238 track points in 2021, each record contains the dynamic information related to navigation speed, navigation direction, ship’s longitude and latitude position (from GPS), ship’s navigation status, etc. reported in real time during the ship’s voyage, and also includes the ship’s water mobile communication service identification code (MMSI), International Maritime Organization (IMO) number, ship type (cargo ships, tankers, tugboats, high-speed ships, passenger ships and operating ships, etc.), antenna position and other static information, this data is provided by the treasure ship network (www.myships.com). The raw AIS data are records of vessel positions at different times, which are reflected as some discrete points in space and are not conducive to the analysis of spatio-temporal characteristics of maritime traffic. Therefore, it is necessary to generate routes of different voyages for further study based on the trajectory point attribute information. First, using Python to clean and quality control the AIS data based on the MMSI field to remove data with abnormal speed size (speed > 100 knots/h), invalid MMSI (MMSI = 0), and redundant data from the same vessel (e.g., two records with the same data location and time information). Secondly, the processed AIS data is divided into different ship trajectories according to MMSI, and the time field is transformed into a timestamp type according to the time transformation rule, and then MMSI is set as the unique identifier of the route, and according to the timestamp connection, a global trajectory is generated for each ship in chronological order. Then, the different voyages of each ship are divided according to the time interval of adjacent track points and connected in order to form a route set, generating more than 100,000 original routes. According to the time field in the MMSI attribute of cargo ship, two adjacent time fields are interpolated by time stamps, and when the interval is more than 1 hour, the voyage is divided, and the original ship route map by hour is obtained, as shown in Figure 2.
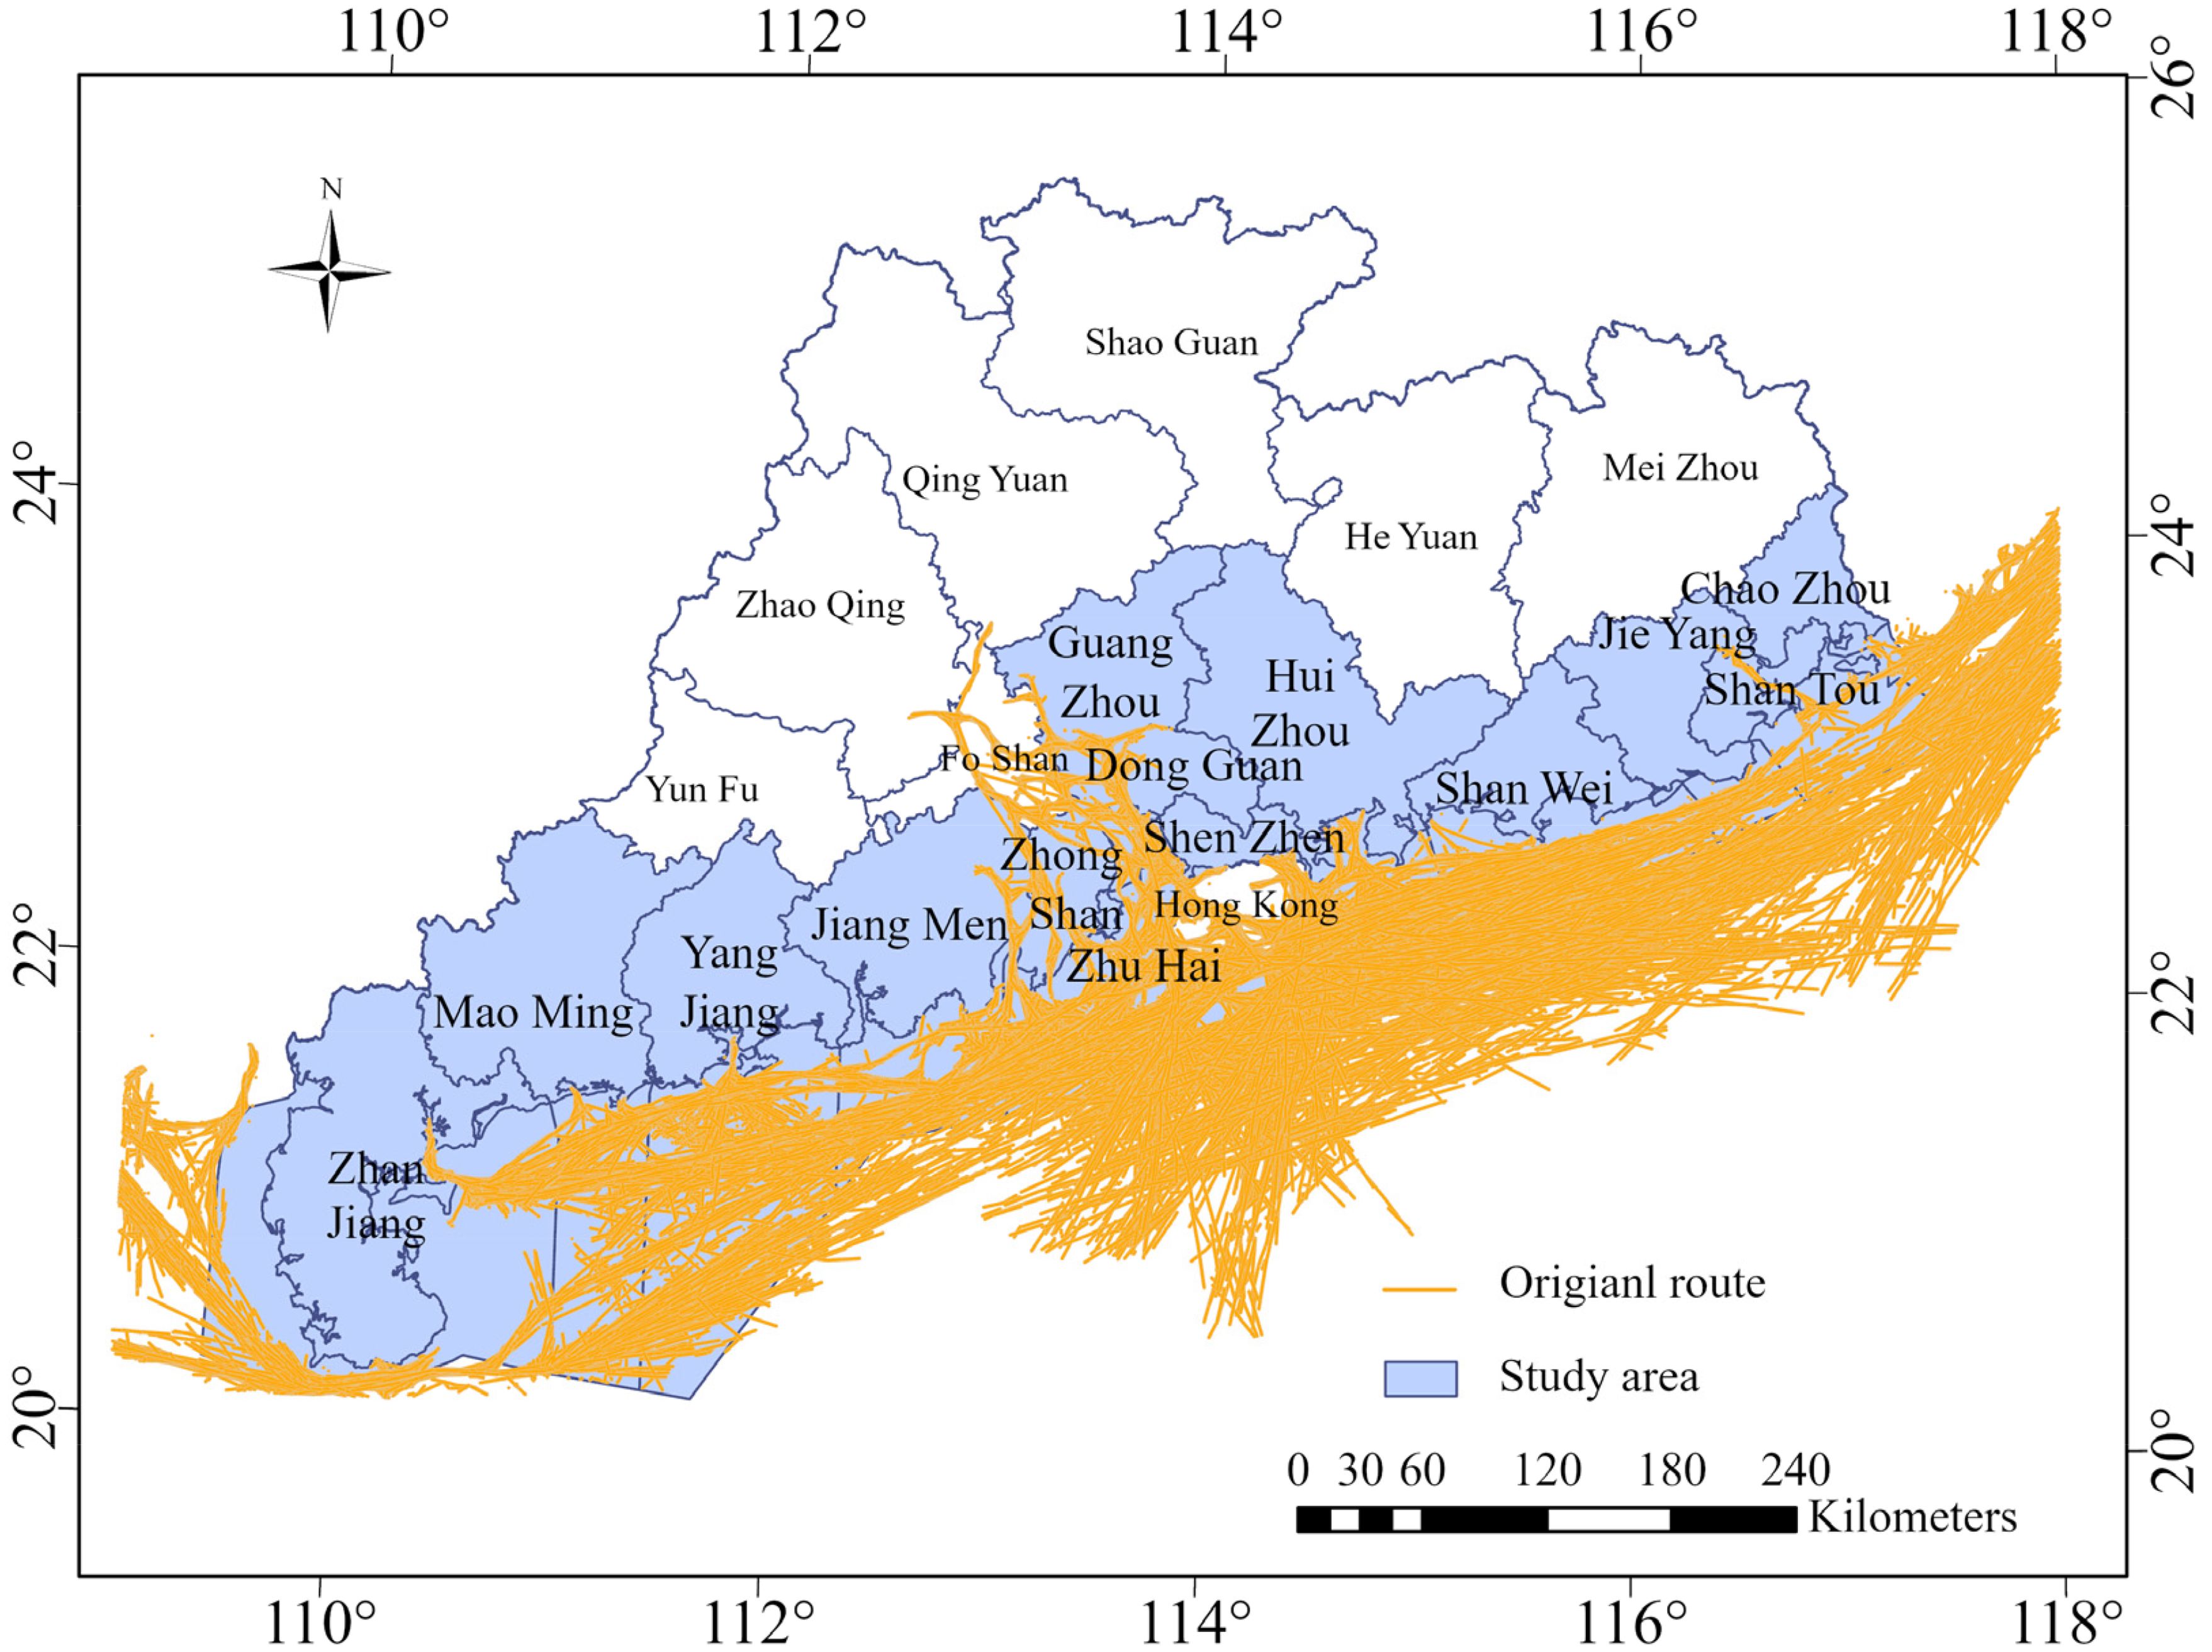
Figure 2. AIS original track line map.
Waterway route data used by the Guangdong Provincial Marine Development Planning and Research Center to provide the waterway route survey data, including Guangdong Province and the sea within the scope of a variety of transport routes, freight and passenger routes.
In addition, the basic geographic data include administrative division data of 21 prefecture-level cities in Guangdong Province provided by the Ocean Center, as well as data on the coastline, 112 major ports data, division of adjacent sea areas and other relevant water data in the study area. Among them, the shoreline data are the shoreline results data of Guangdong Uninhabited Islands Survey and Shoreline Management Project (Guangdong Ocean Development Planning Research Center, unpublished; data can be obtained from the corresponding author if there is a legitimate research need). The economic data are taken from the Guangdong Provincial Statistical Yearbook (2021).
2.3 Methods
2.3.1 Advantageous degree of maritime traffic
We propose the combination of maritime traffic network density and port proximity. The maritime traffic network density is based on the recommended channel, route data, as well as the identification of the marine traffic network based on AIS data, and the results are obtained by using GIS software to calculate the track line, route, and channel data in each region, and then combining the analysis with the regional area. The proximity is mainly used to analyze the proximity of ports within each region using port data, and then the two are combined to analyze the dominance of maritime traffic.
The evaluation of the dominance of maritime traffic is based on the study of Jin et al. (2008), and the model used for its dominance evaluation refers to the relevant studies of Wang et al. (2015) and Huang et al. (2011). Compared with land traffic, maritime traffic also has diverse types, such as cargo ships, tankers, passenger ships, high-speed ships, etc. By analogy with road network density, the calculation of maritime traffic in this study uses maritime traffic network density as a factor for analysis. Secondly, for the stations, there are bus stations, railway stations, etc. on land, while the sea takes each port as a station, so the port proximity is introduced as an evaluation factor in the formula push to process. As the sea area is more extensive compared with the land, its routes are laid out in a wide range of extension, based on this increase in the degree of influence of the density of marine transportation networks, and consider the factors of data types, after a comparative analysis to obtain the derived model as shown in Equation 1. After standardizing the data of maritime traffic network density and port proximity of each study node, a weighted summation mathematical model is applied to obtain the maritime traffic dominance of each region according to its corresponding weights, as follows.
Where Mj denotes the maritime traffic dominance value of region j, Cj denotes the standardized Maritime traffic network density value of region j, Pj denotes the standardized port proximity value of region j, W1 and W2 correspond to the weight assignment value of the scope to which they belong, j denotes the geographical area and sea area within the study node, and γ denotes the number of data indicator types involved in the dominance calculation. n is the number of study area, and , the dominance is positive; if , its value is negative and meaningless. β represents the influence factor, which is used to adjust the degree of influence between the density of maritime traffic network and the proximity of ports. By varying and adjusting β, the changes in the results of maritime traffic dominance are observed. According to the changes of the results, the sensitivity of the influence factor to the final results is judged, and the appropriate influence factor is further optimized and determined. The results of data analysis are combined when determining the factors to ensure the reasonableness and accuracy of the factors.
In order to verify the scientific nature and reasonableness of the evaluation indexes proposed in this study for the maritime traffic dominance model, a number of factors affecting the final effect are considered comprehensively in this study, and the regional dominance value is calculated and verified with the coastal region of Guangdong Province, and the research nodes are set for each prefecture-level city and the sea area to which it belongs, and the actual situation of the coastal cities of Guangdong Province and the relevant sea area is combined for the calculation, in which each index is calculated using the letter j to indicate the research node, and then the research results are evaluated comprehensively.
2.3.1.1 Maritime traffic network density
The calculation of road network density in a given range is described by the ratio of the total number of kilometers of the road network to the area of the territory in which it is located, expressed by . Based on this, the density of maritime traffic network is expressed by the ratio of the total mileage of each track line, route and channel to the area of the sea to which they belong. The density of maritime transportation network is an important indicator to evaluate the level of regional maritime transportation infrastructure protection (Huang et al., 2011; Li et al., 2022). In contrast to the definition, this paper proposes that the density of marine transportation network is a limit to the development relationship between the length of the route and the area of the sea to which it belongs, which describes the level of development of water transport in different sea sizes from the length, and indicates the number of routes in a certain sea, as well as the proportion of the sea covered in this area, which is one of the basic indicators to evaluate whether the deployment of regional route networks is reasonable. In this paper, we refer to the research on road network density in literature (Zhou et al., 2018; Wang et al., 2015; Huang et al., 2011) and the research on comprehensive traffic network density by Chen et al. (2018), compare the differences between land transportation network and maritime shipping network, based on the characteristics of maritime traffic, for the calculation of maritime traffic network density the track line, route and channel data are selected. The density of maritime traffic network is a positive indicator, the larger the value, the higher the density of maritime traffic network in a region, after calculating and comparing, the specific calculation method used is as follows (Equation 2):
Where Cj denotes the density of maritime traffic network in the study area j, Tj, Rj, Lj are respectively the sum of the lengths of the track lines, routes, and channels in the study area j, and Hj is the area of the study area j.
2.3.1.2 Proximity
Proximity is an index describing the proximity of two features in a certain geographic range. The determination of its value is an important tool for spatial analysis and an important indicator for evaluating the convenience of the region’s external connections, which plays an important guiding role in the socio-economic layout (Wang et al., 2015). In this study, we refer to the influence factors in the literature (Huang et al., 2011; Tang et al., 2020) and combine the actual situation of the study area, and after a comprehensive comparison, the final objects selected for the study are the important waterway routes, ports and the administrative center cities of each part, so as to calculate the statistical proximity values of each port and its administrative center city. Its estimation refers to the weight assignments in different cases in the literature (Jin et al., 2008; Zhou et al., 2018; Tang et al., 2020) and the expert scoring method used to assign weights to the distance between water transportation and the administrative center of the prefecture-level city, and the results are compared and analyzed, and the results of the three comparisons are listed in Table 1. Finally, the impact degree indexes of the marine traffic arteries as well as important shipping infrastructure equipment are quantified and treated according to the actual situation of the study area and with reference to the opinions of professionals (Table 2).
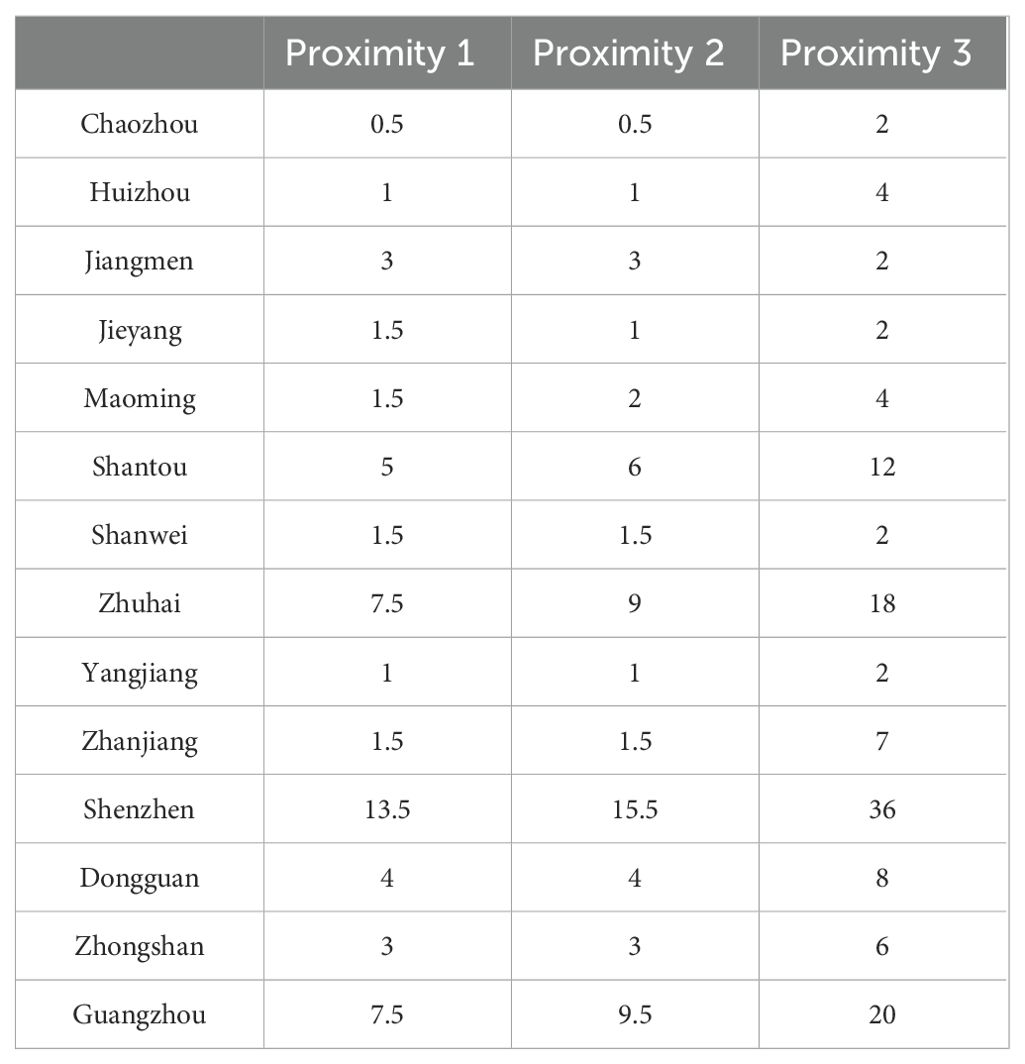
Table 1. Comparative analysis of weight assignment.
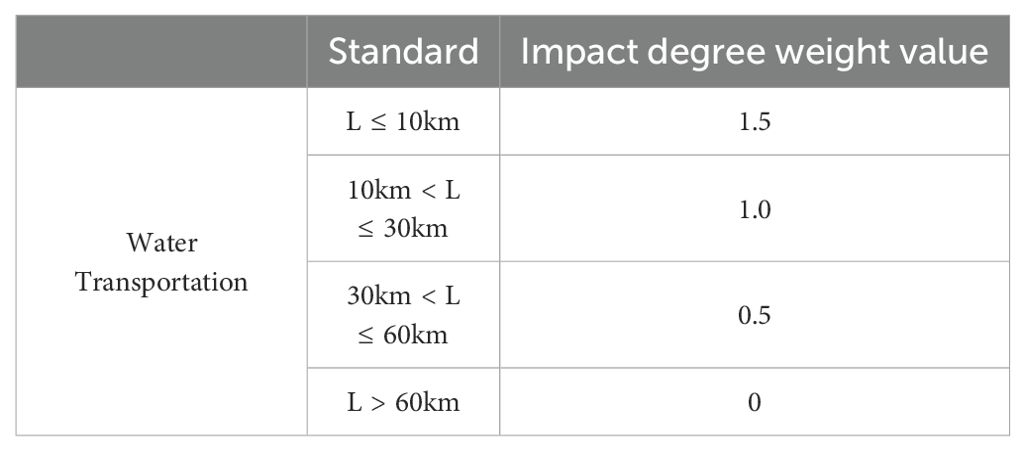
Table 2. Impact degree assignments for maritime critical traffic and shipping infrastructure.
Based on the above analysis, the model formula for calculating the total port proximity based on each study area is derived in this study as follows (Equation 3):
In which, the proximity assignment (i.e., the corresponding weight value) from the ith port or important route to the administrative center city in study region j is denoted by Pij, and Pj is the total proximity value in region j. In addition, a high total port proximity value, indicating that the closer the port or maritime traffic artery is to the central city, the more convenient access to the sea, and the closer connected to the outside world (Kwan et al., 2003).
2.3.2 Economic development level assessment
This paper uses Principal Component Analysis (PCA) to assess the economic status of the study area. Since each factor selected reflects some relevant information to varying degrees, in practice it is common to present as many relevant factors as possible to make the analysis of the problem more comprehensive. In this paper, the most typical method was chosen, using the variance of the first composite indicator (F1) selected to represent that the larger Var(F1) is, the more information this indicator contains, and thus F1 is the linear combination with the largest variance, as the first principal component of the evaluation (Yan et al., 2020).
In this paper, with the help of SPSS software, as many indicators as possible were selected based on the data of Guangdong Provincial Statistical Yearbook (2021), and multiple principal component analyses were conducted to compare the obtained results, and finally 31 indicators were selected, including the growth rate of energy consumption per unit of GDP, total import/export, total export of foreign-invested enterprises, tourism income, and per capita gross regional product.
The 31 economic indicators selected in this paper were standardized using the extreme value method, and then subjected to principal component analysis, and the selected economic indicators were judged to be eligible for doing factor analysis based on the calculated KMO values, and those below 0.5 were not suitable, and the Bartlett’s sphericity test was used to test their companion probabilities to determine whether they could provide basic support for factor analysis, and if the significance p < 0.001 indicates that the selected variables are highly correlated, it can be provided. Finally, we extracted principal component analysis based on the indicators judged to be suitable for factor analysis to study the regional economic development.
2.3.3 Coupling coordination analysis
Coupling describes the intensity of interaction between elements or systems (Du et al., 2022). Maritime transportation and regional economic development and maritime economic development are systems that interact and promote each other, therefore, this paper draws on the capacity coupling coefficient model (Chen et al., 2022b) for the evaluation of the coupling degree of maritime transportation dominance and economic development level in coastal regions, and the functional relationship (Equation 4) was used:
Where the coupling degree value is denoted by C, U1 denotes the value of maritime traffic dominance evaluation, and U2 denotes the value of economic development level evaluation subsystem. Using 0.3, 0.5, and 0.8 as the cut-off points for the coupling degree values (Qu, 2022), the coupling results of maritime traffic and economy are classified into four levels: low, lower, higher, and high.
Coordination is a virtuous circle of relationships between systems or between elements within a system through mutual cooperation (Gao et al., 2022). Therefore, the use of the coordination degree model enables us to analyze more comprehensively the mutual coupling-coordination relationship between maritime transportation and economic development. The model equation used in this paper is as follows (Equation 5):
Where, D denotes coordination degree, C denotes coupling degree, T is a coordinated composite for the overall synergy or contribution of the degree of transportation dominance with the level of economic development, α, β are coefficients to be determined, and . This study α and β take the value of 0.5, specific references (Huang et al., 2021; Zhou et al., 2018; Chen et al., 2022a) show that the transportation system has the same synergistic effect as the economic system. Based on coupling and coordination criteria, coupling degree is divided into 4 stages and coordination degree is divided into 6 stages, considering the actual situation of coastal cities and sea areas (Table 3).
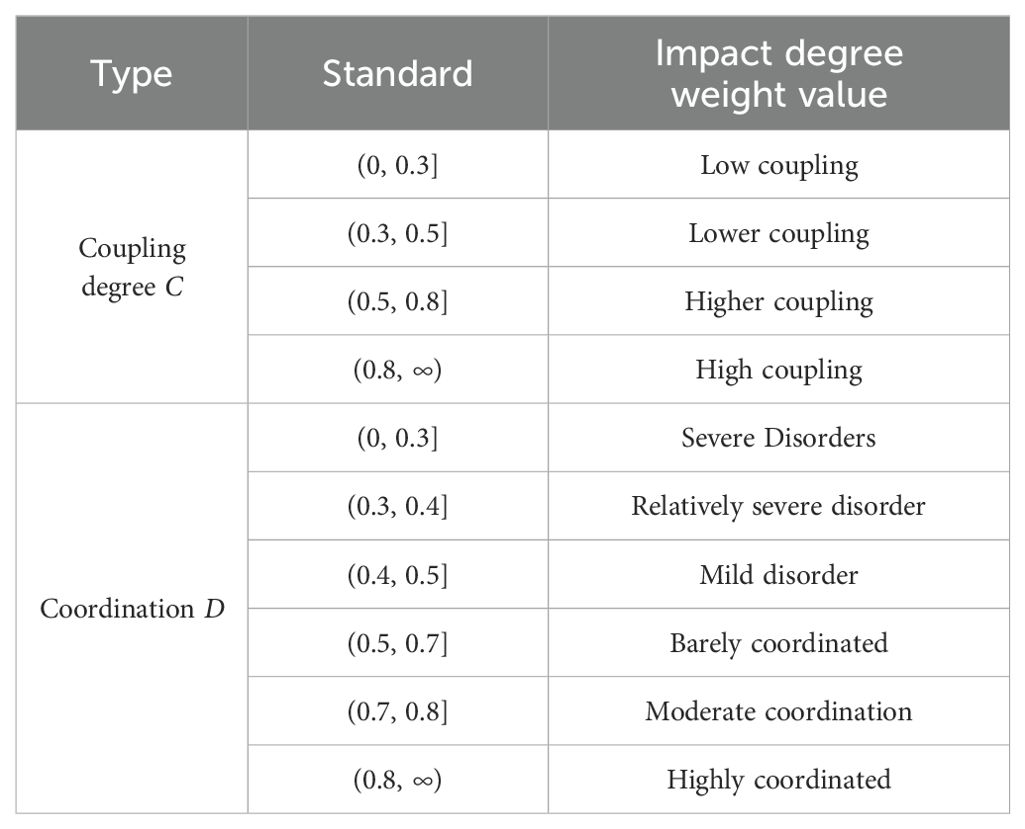
Table 3. Coupling and coordination thresholds.
3 Results and discussion
3.1 Analysis of sea traffic advantage degree
3.1.1 Maritime traffic network density
General analysis from the point of view of spatial patterns, it can be seen that the distribution of the density of the maritime traffic network in the coastal region of Guangdong Province shows a spatial structure that gradually decreases from Zhuhai (1.0121) to both sides, with some relatively dense areas in the Zhanjiang (0.4913) region on the west wing. Figure 3 shows that the density spread of the marine transportation network is relatively concentrated, with the sea area where the Pearl River Delta (PRD) is placed having a clearly higher density compared to the two flanking regions and a lower density compared to the east and west flanking regions, the Delta region and the region between them, such as Yangjiang (0.1252), Maoming (0.1840), Jieyang (0.2375), Shanwei (0.2341), etc., the Maritime traffic network distribution is relatively low, in the West wing of the Zhanjiang sea maritime traffic network density is slightly higher.
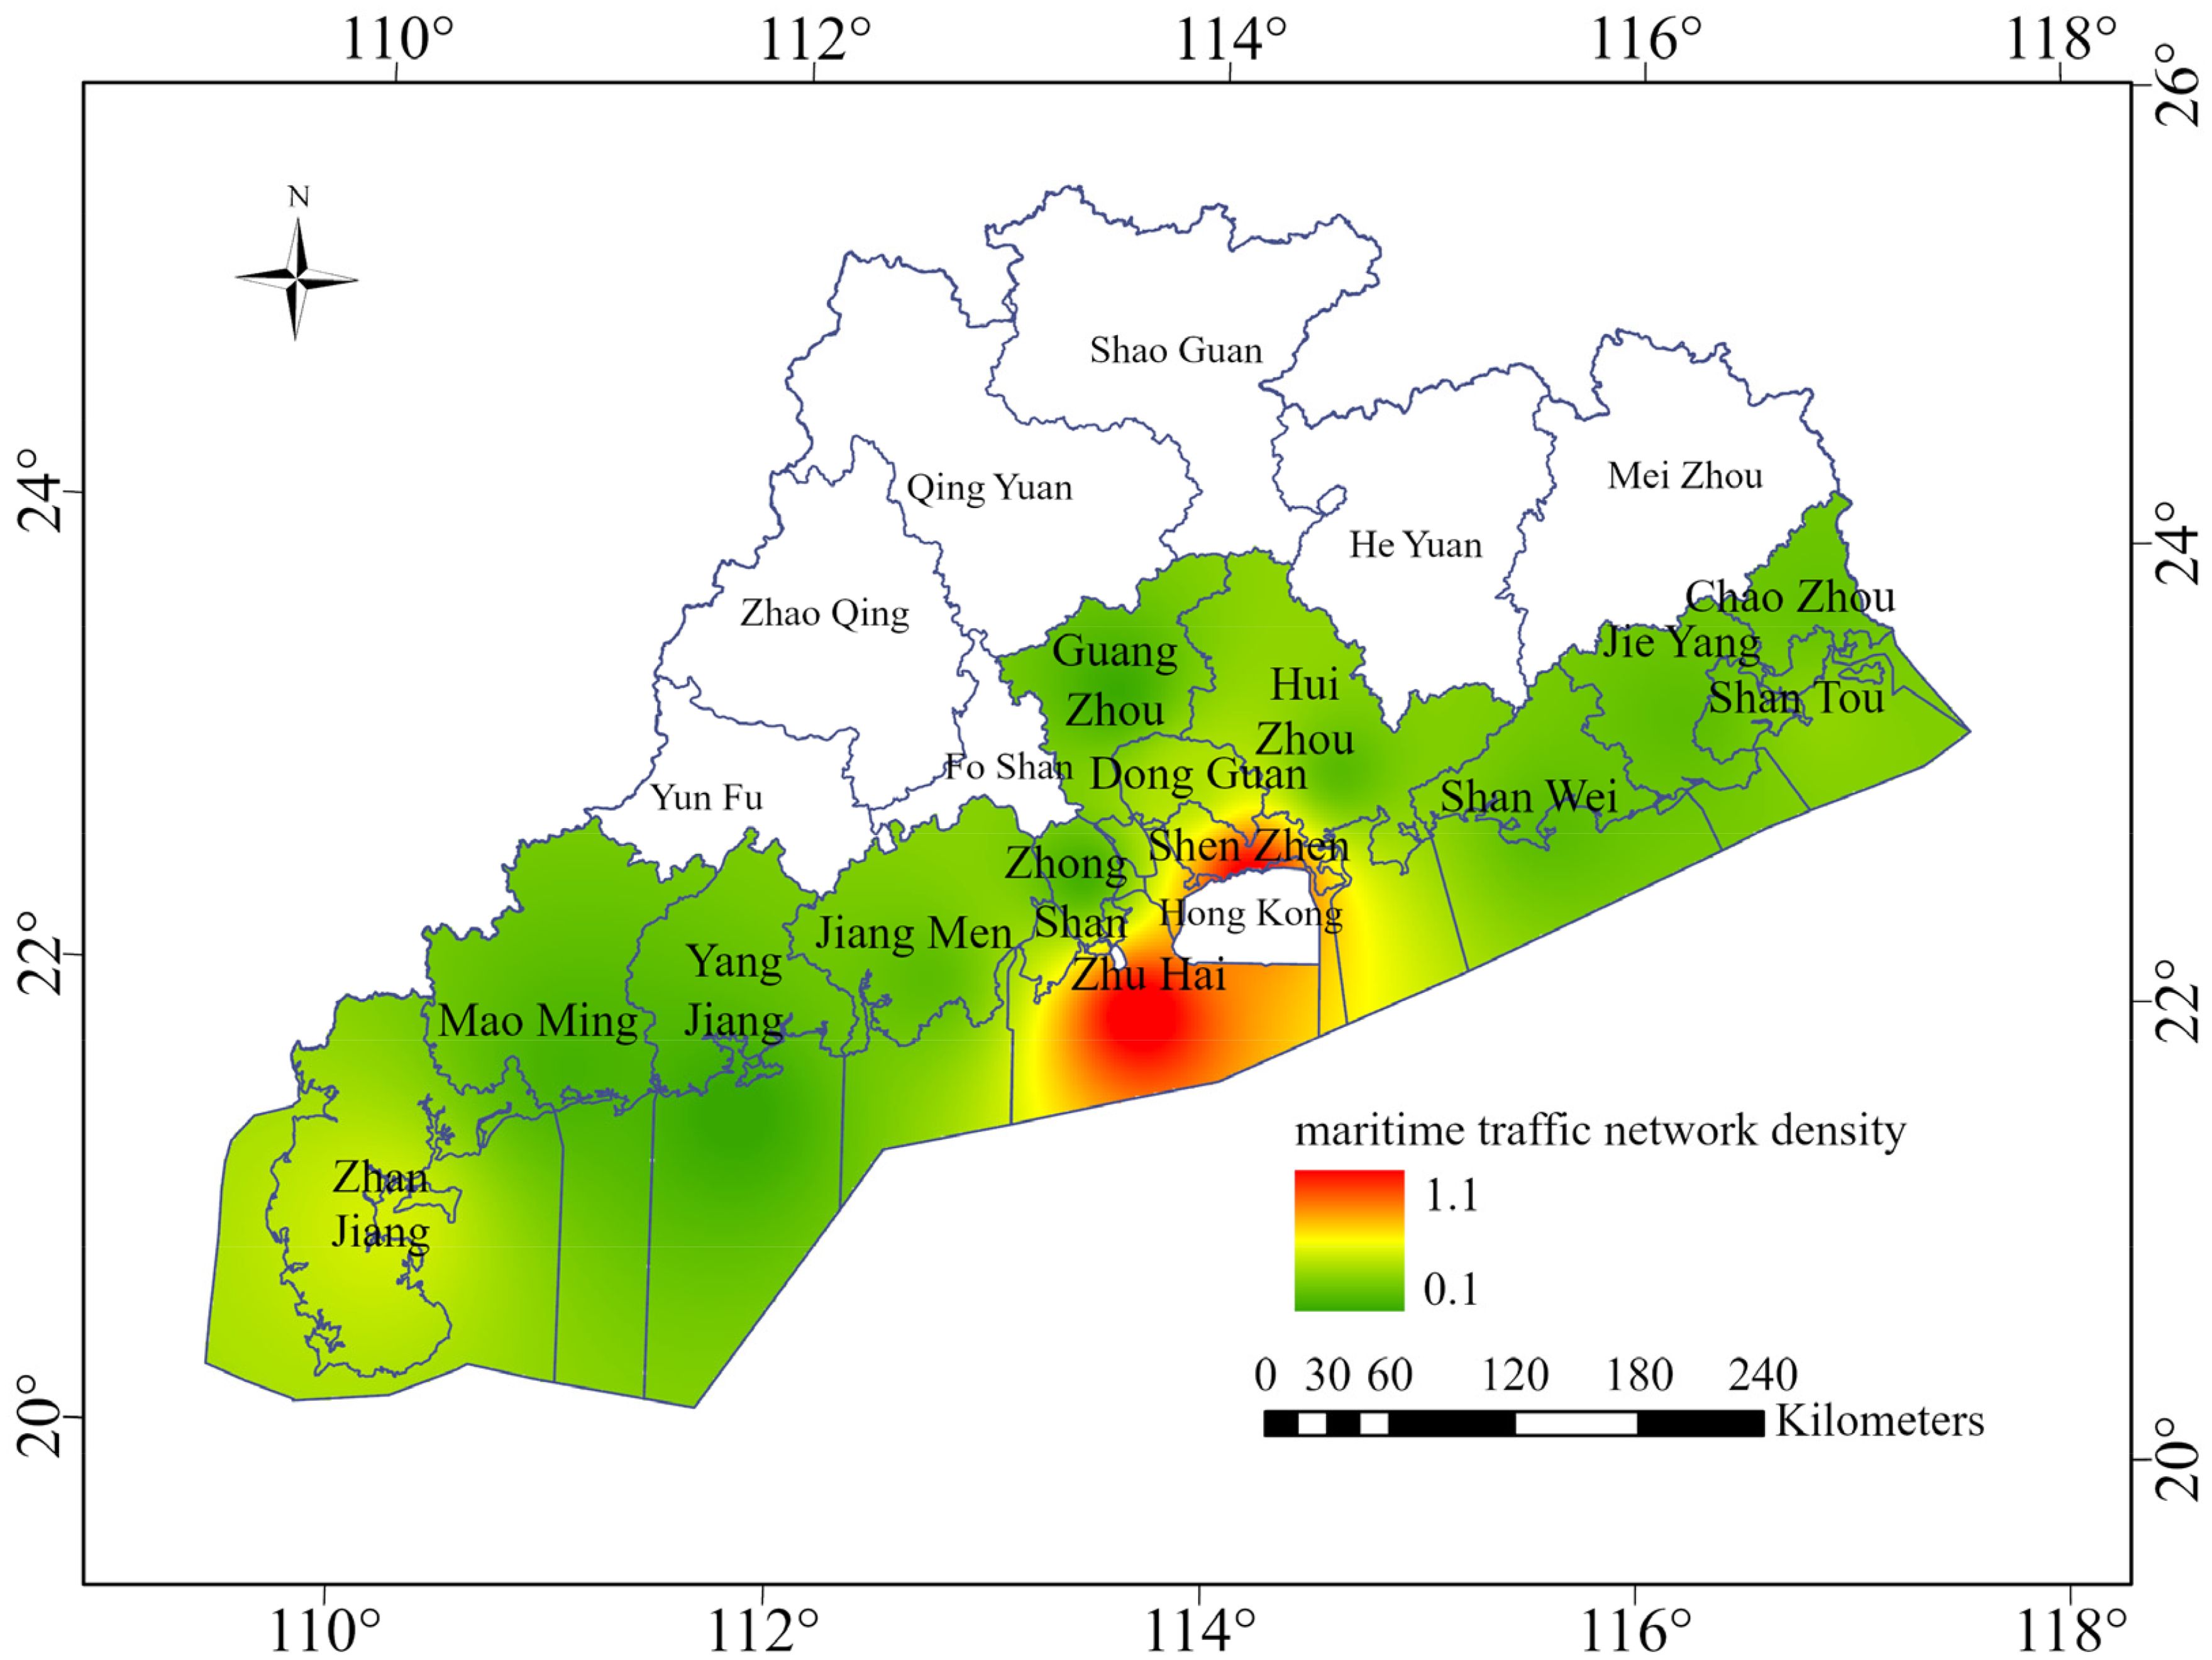
Figure 3. Distribution of maritime transportation network density in coastal areas of Guangdong Province by space.
3.1.2 Proximity
From the overall analysis of the spatial pattern, it is concluded that the proximity of the coastal region of Guangdong Province has a high advantage in the PRD region. The proximity of both sides of the PRD is high compared to other regions and gradually decreases from the center outward (Figure 4), and with Shenzhen (7.5), Zhuhai (13.5) and Guangzhou (7.5) as its maritime transportation hubs, its coastal region proximity values generally show a higher trend in the east than in the west, with fewer ports in Zhanjiang (1.5), Maoming (1.5), Chaozhou (1.5), Yangjiang (1.0) and other regions and relatively lower proximity. The results further indicate that the development of the waterway route network system effectively guarantees and supports the service level of maritime transportation in the PRD region, and provides strong support for its development.
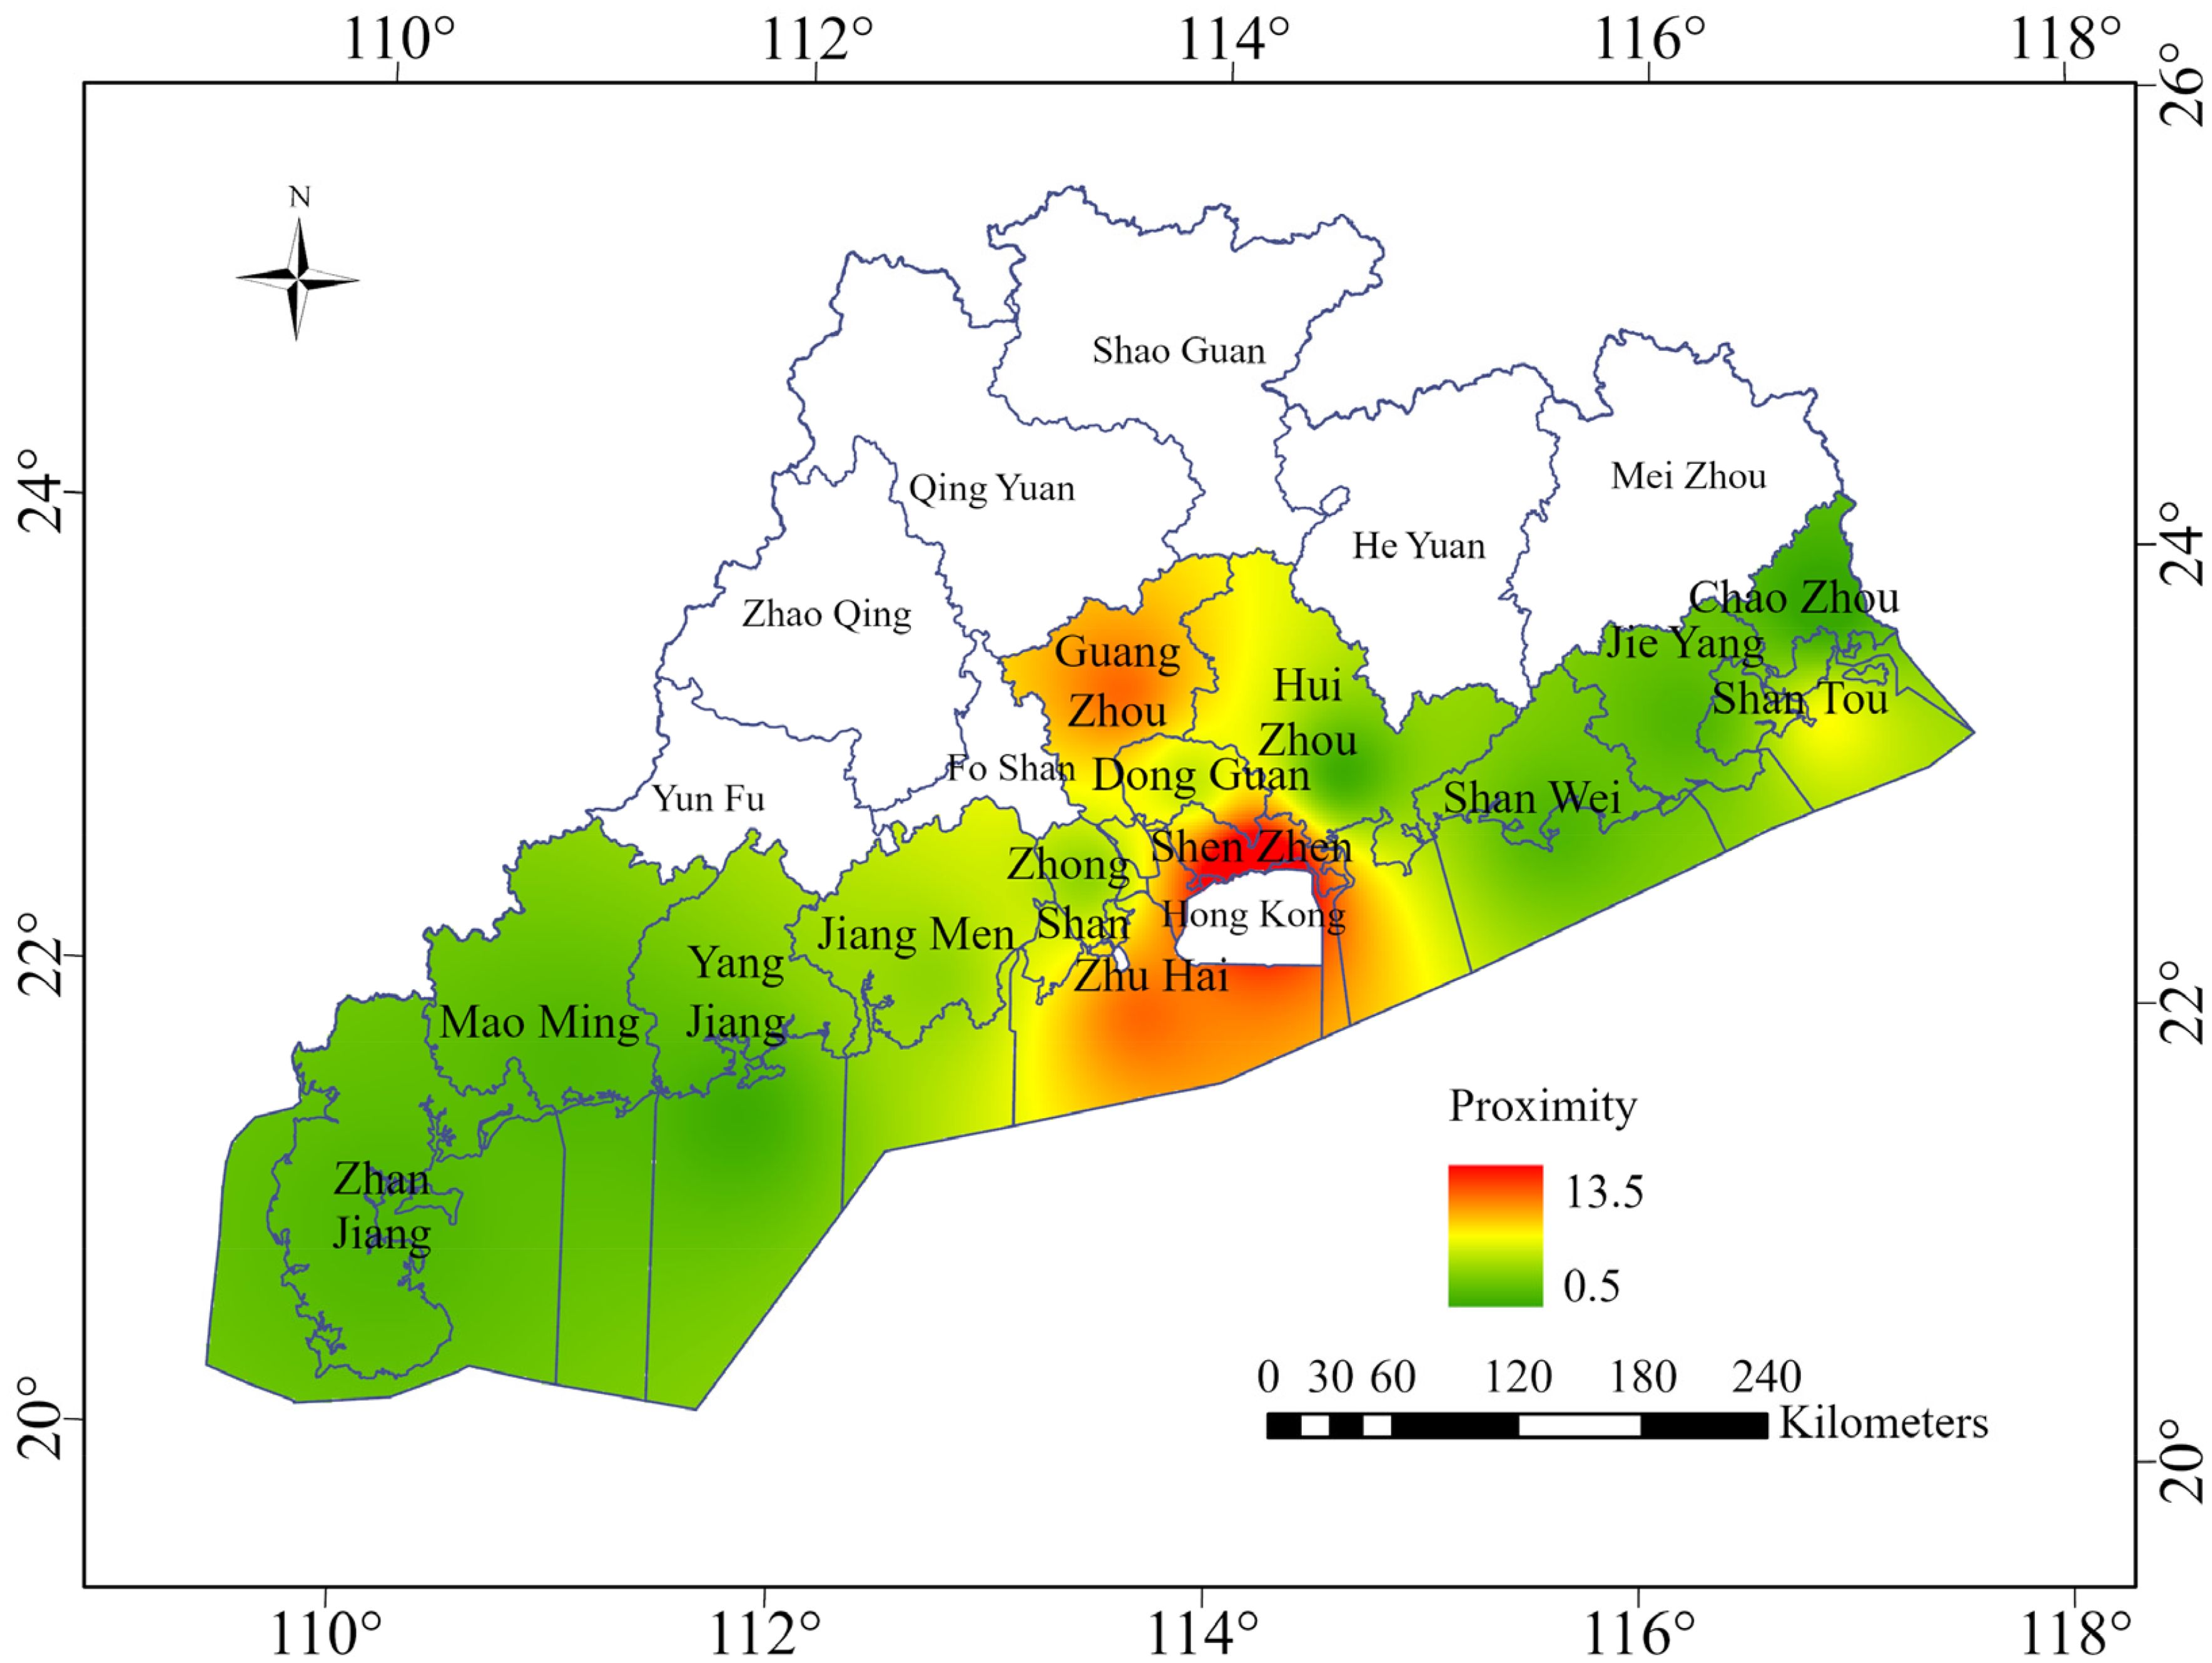
Figure 4. Spatial distribution of proximity of coastal areas in Guangdong Province.
3.1.3 Advantageous degree of maritime traffic
Referring to the weight assignments studied by Huang (Huang et al., 2011) and others, and consulting relevant suggestions from experts, the weight assignments of maritime traffic network density and port proximity are set to 1 in this paper for weighting, and the maritime traffic dominance of each region is obtained (Table 4).
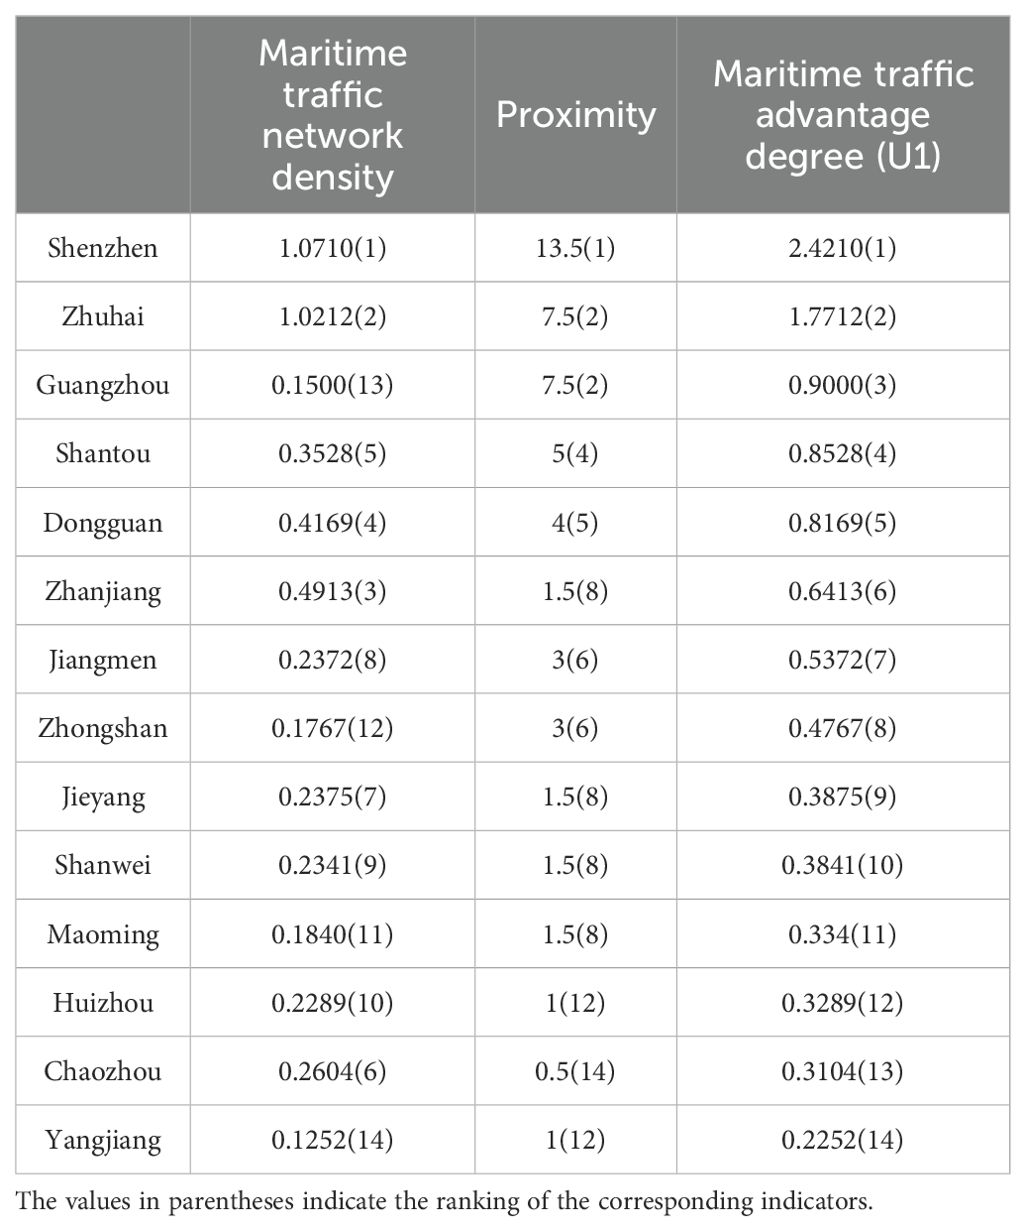
Table 4. Maritime traffic advantage degree by region.
From the numerical point, the mean and median of maritime traffic dominance in the study area are 0.7419 and 0.5069. and the mean is significantly larger than the median, It is indicated that the polarization of maritime traffic dominance in the region is significant, and the spatial distribution of maritime traffic dominance in general shows a gradual decrease from Shenzhen (2.4210) and Zhuhai (1.7712) city to both sides. The dominance decreases gradually with distance, centering on the PRD region, with a slight undulation on the east and west sides (Figure 5).
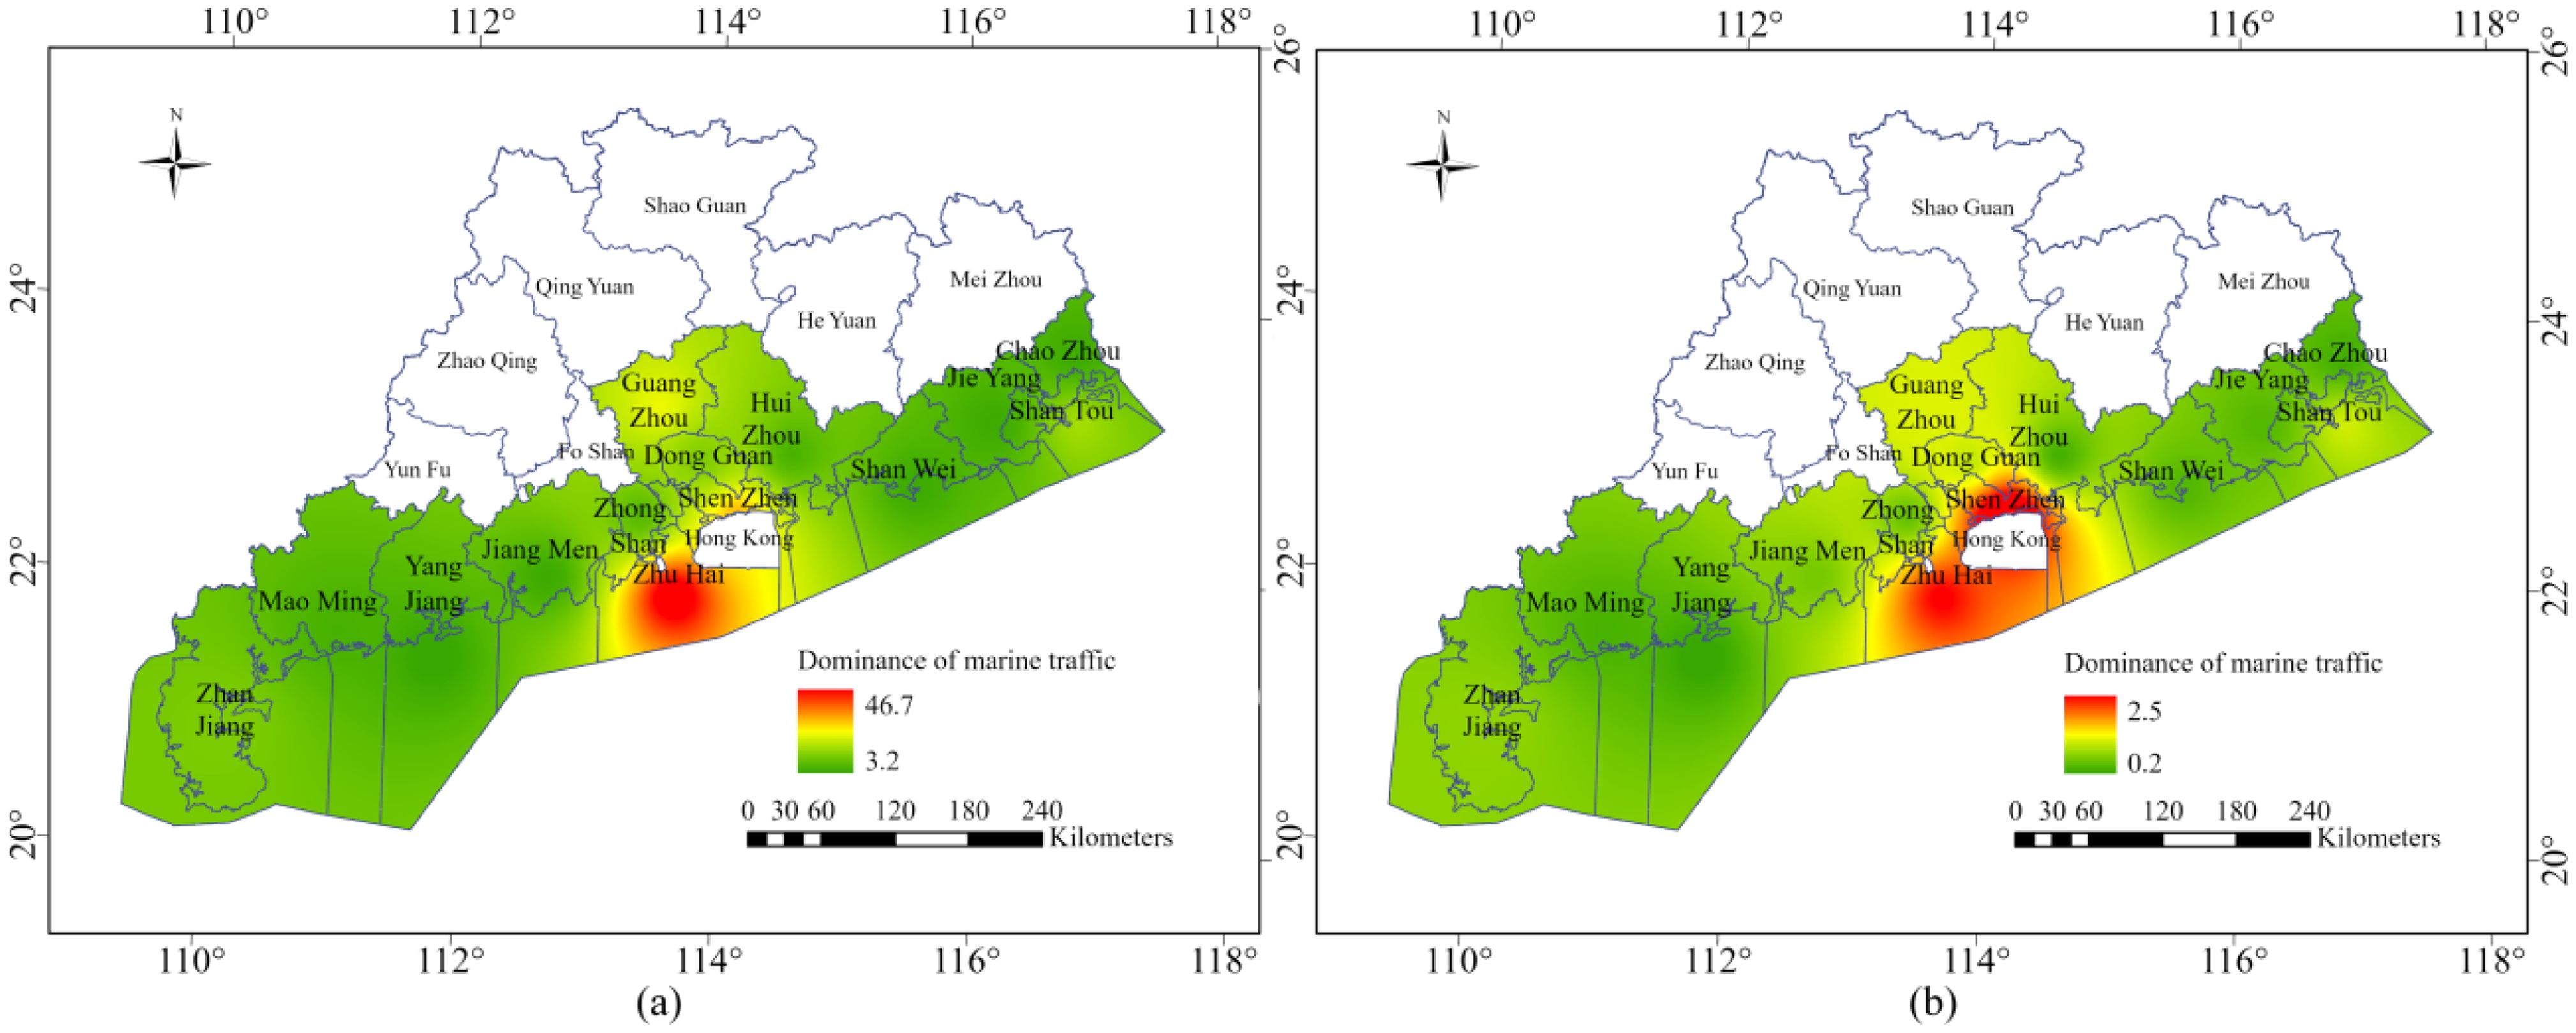
Figure 5. Comparative chart of sea traffic advantage degree. (A) Results of directly quoting the land transportation dominance degree. (B) Results of the proposed maritime traffic dominance model.
To prove the efficacy of the model proposed in this study, a comparison experiment is made between this model and the traditional model as follows. Among them, Figure 5A shows the results of directly quoting the land transportation dominance degree. Firstly, it can be seen that there is a huge gap between the dominance degrees obtained using this model, and secondly, the results show that Zhuhai is better than Shenzhen, while the global port ranking of Shenzhen is much higher than Zhuhai, which is seriously inconsistent with the reality. Figure 5B shows the results of the proposed maritime traffic dominance model based on the density of maritime traffic network and the proximity of ports. The comparison shows that the results obtained by using the model proposed in this paper are more realistic in terms of numerical values and visualization, and can clearly analyze the differences in the maritime traffic dominance of each region.
3.2 Analysis of the evaluation results of marine economic development level
The results of the principal component analysis are obtained after processing the 31 economic indicators. Table 5 shows that the KMO value (0.768) meets the criteria for doing factor analysis, and the probability of compatibility 0.000 is less than the significance level 0.05, so the 0 hypothesis is rejected. Therefore, the economic indicators selected in this study are suitable for factor analysis. According to the general criteria of factor usefulness, the starting eigenvalue needs to be greater than 1 and the cumulative percentage is used to indicate the contribution of the extracted factor, the greater the value indicates the greater the explanation of the factor to the overall, in general, the cumulative percentage is higher than 70% indicates more satisfactory. From the principal component analysis, it can be seen that there are two components with starting eigenvalues greater than 1 in the data analyzed in this paper, the cumulative percentage of component one is 79.601 and component two is 19.535, with a cumulative contribution of 99.136%, which meets the extraction criteria.
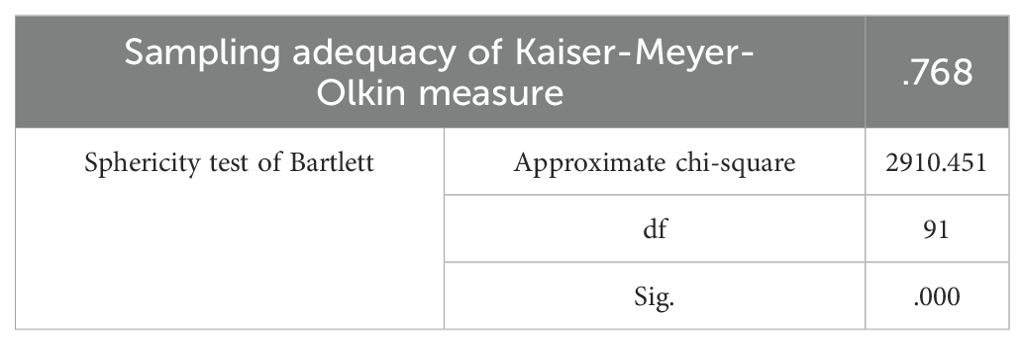
Table 5. KMO and Bartlett’s test.
According to the above analysis, the two main components with Eigen value more than 1 and total variance contribution more than 99% were extracted, which can represent the comprehensive level of economic development of 14 cities in the coastal region of Guangdong Province. Based on the loading matrices of the two selected principal components, the expressions of each component are calculated, and then the values of each indicator are substituted into the expressions to obtain the scores of each regional principal component. The weight of the variance contribution ratio is then used to weight each principal component to find the comprehensive score of the weighted value of each regional economic development level, the greater the score, the greater level of regional economic development (Li et al., 2022).
Based on the above results, the interpolation analysis result graph of economic development level of each region was obtained (Figure 6). It can be seen that the economic development of the coastal regions of Guangdong Province shows a gradually decreasing structure from the PRD region to the east and west wings. With the overall economic development level of the PRD region being on the high side, among which Zhuhai, Shenzhen and Guangzhou are more prominent, with their overall economic development level scores of 1.383, 1.375 and 1.405 respectively, much higher than other regions (Table 6). However, Shantou, Chaozhou, Maoming and Zhanjiang on the east and west sides are relatively backward. Comparing the results of principal component analysis, the contribution of the first principal component was 79.601% and the second was 19.535%, the overall pattern of spatial distribution of regional economic development level is high in the PRD region and low in the east and west wings.
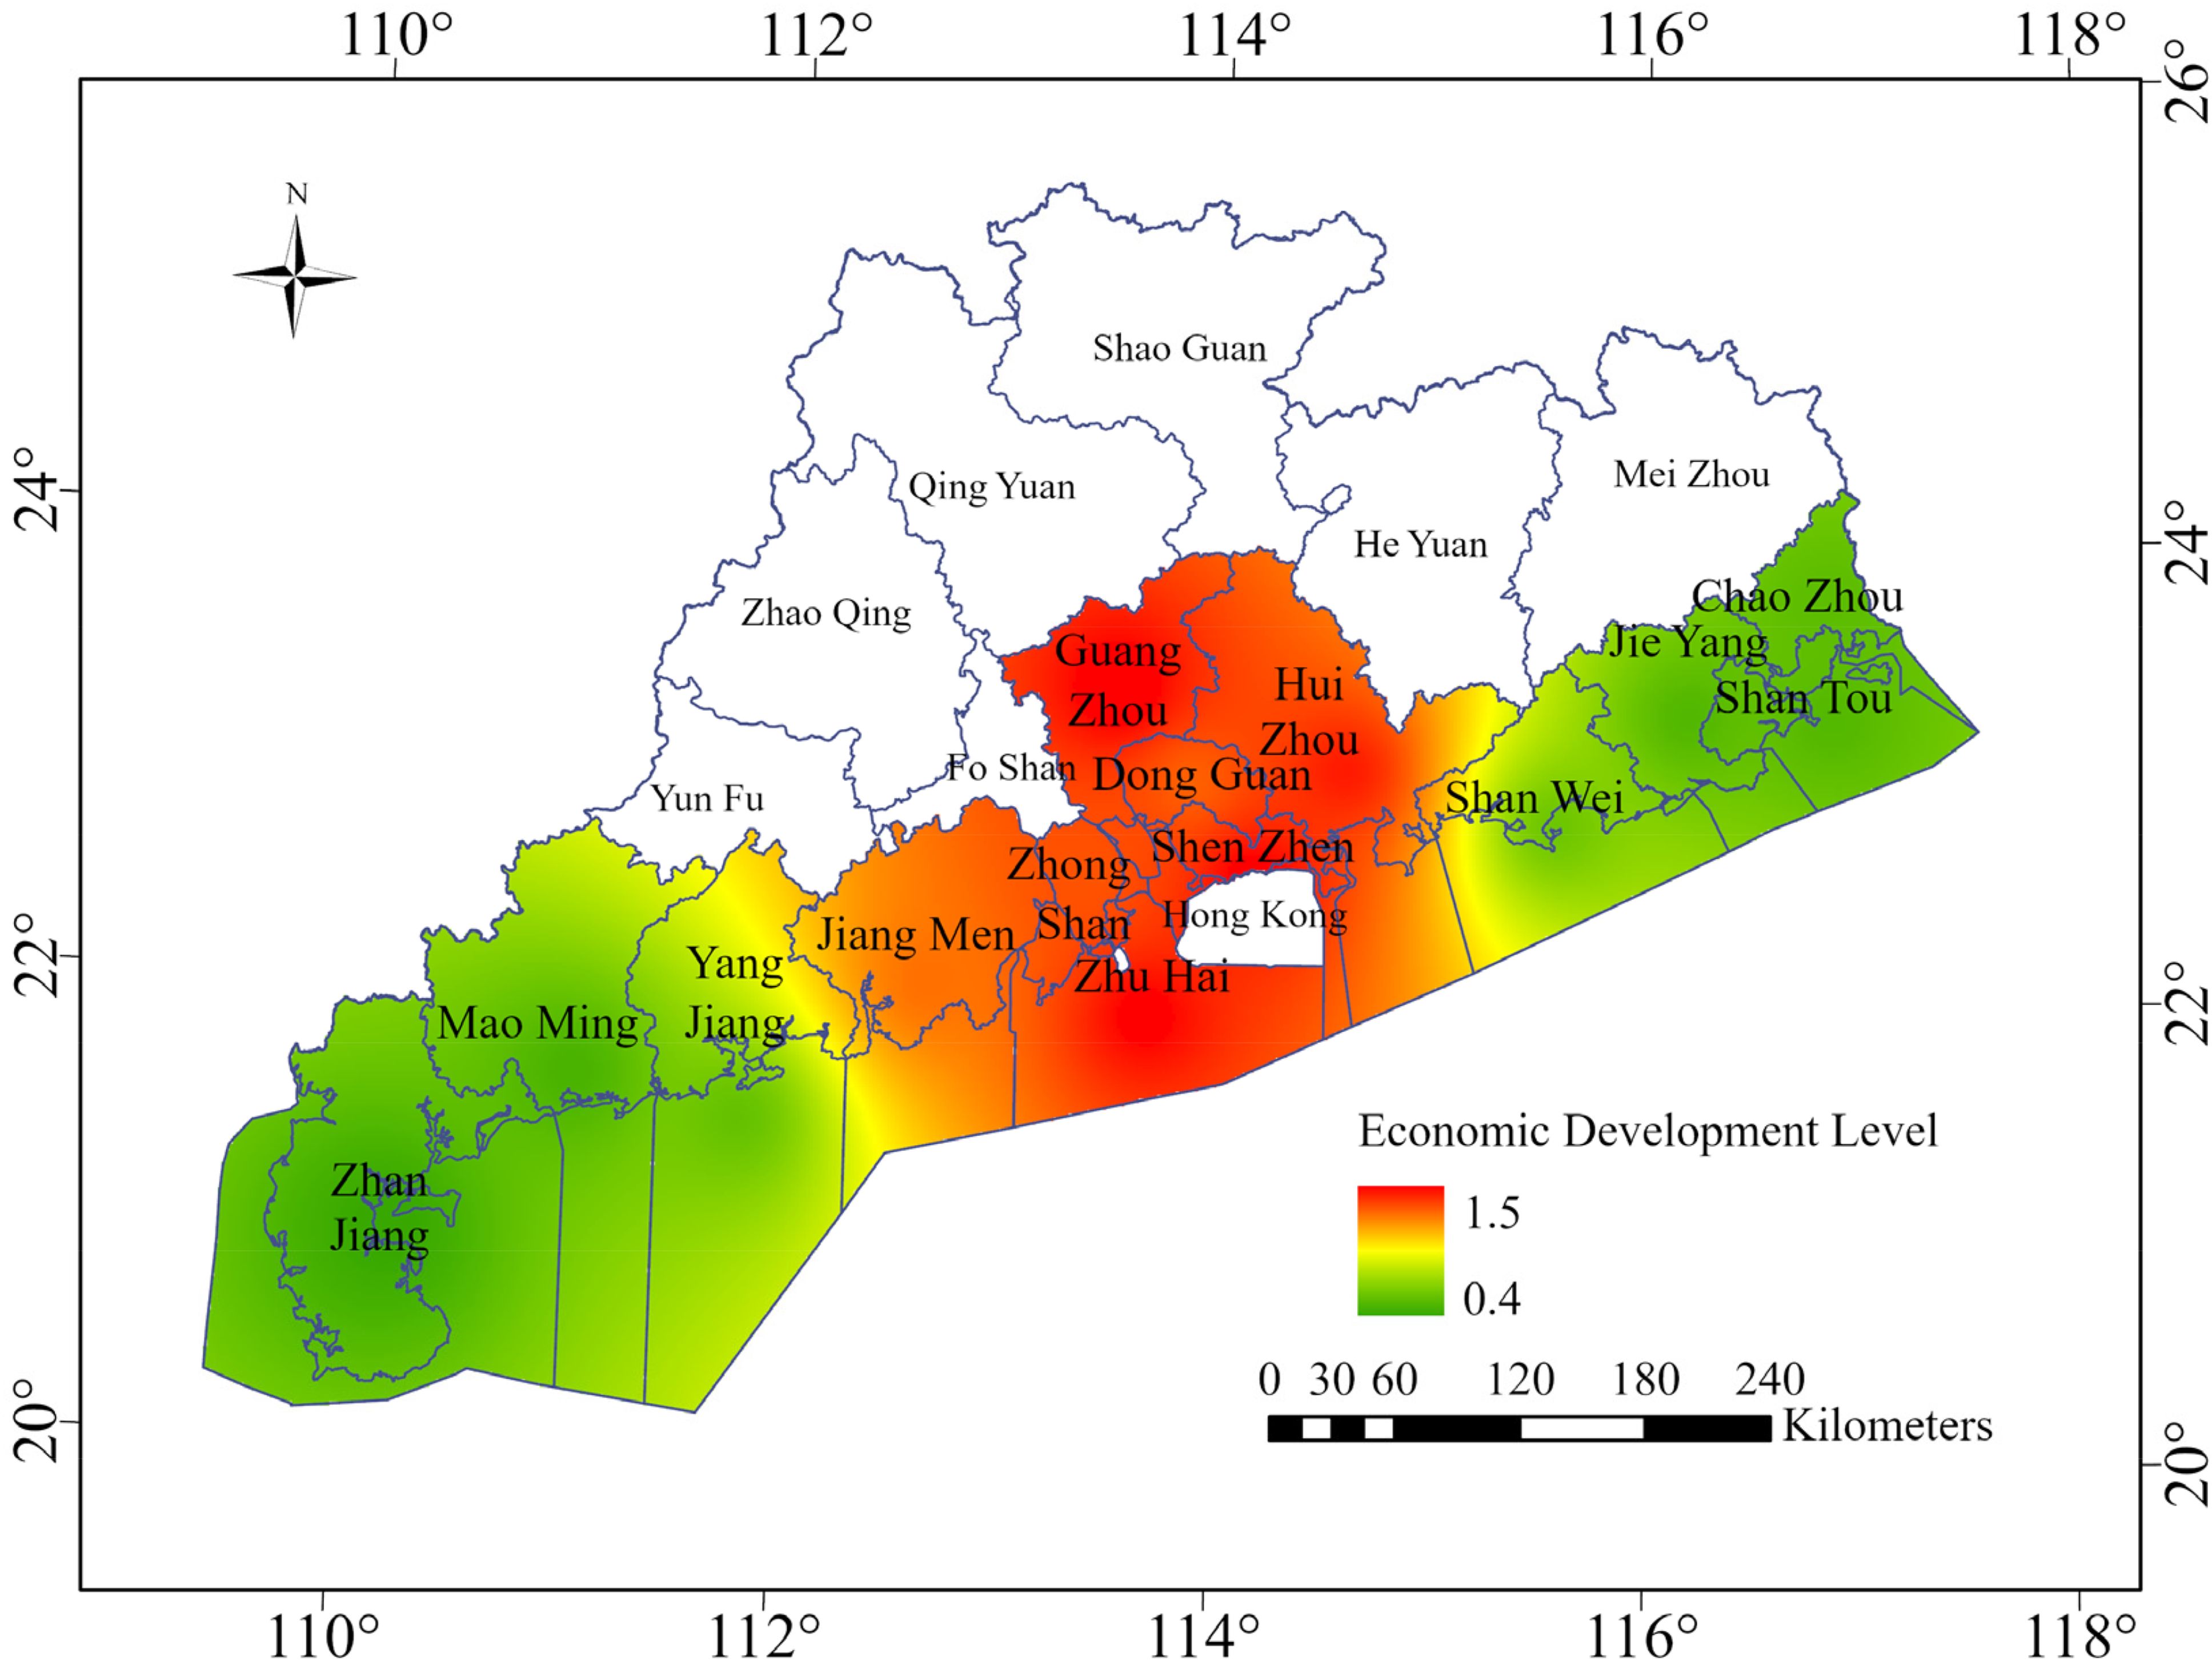
Figure 6. Analysis of economic development level.
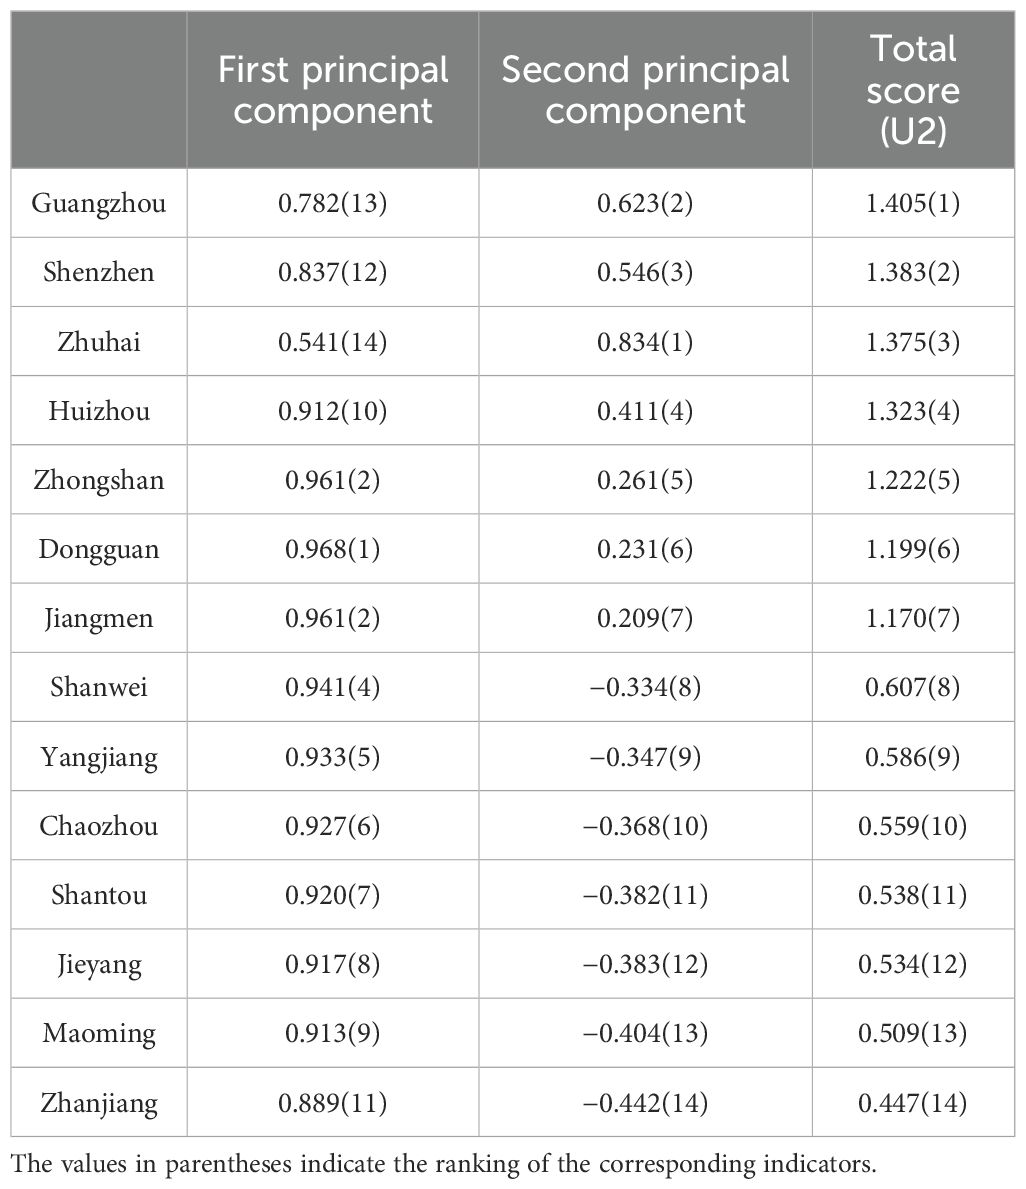
Table 6. Comprehensive economic development level of each region.
3.3 Coupling-coordination analysis
The coupling-coordination model is used to verify the relationship between marine traffic and economic development level in the coastal region of Guangdong Province, and the regional marine traffic dominance and economic development level are normalized based on the extreme value method, and the coupling-coordination degree values are obtained from Equations 4 and 5 (Table 7).
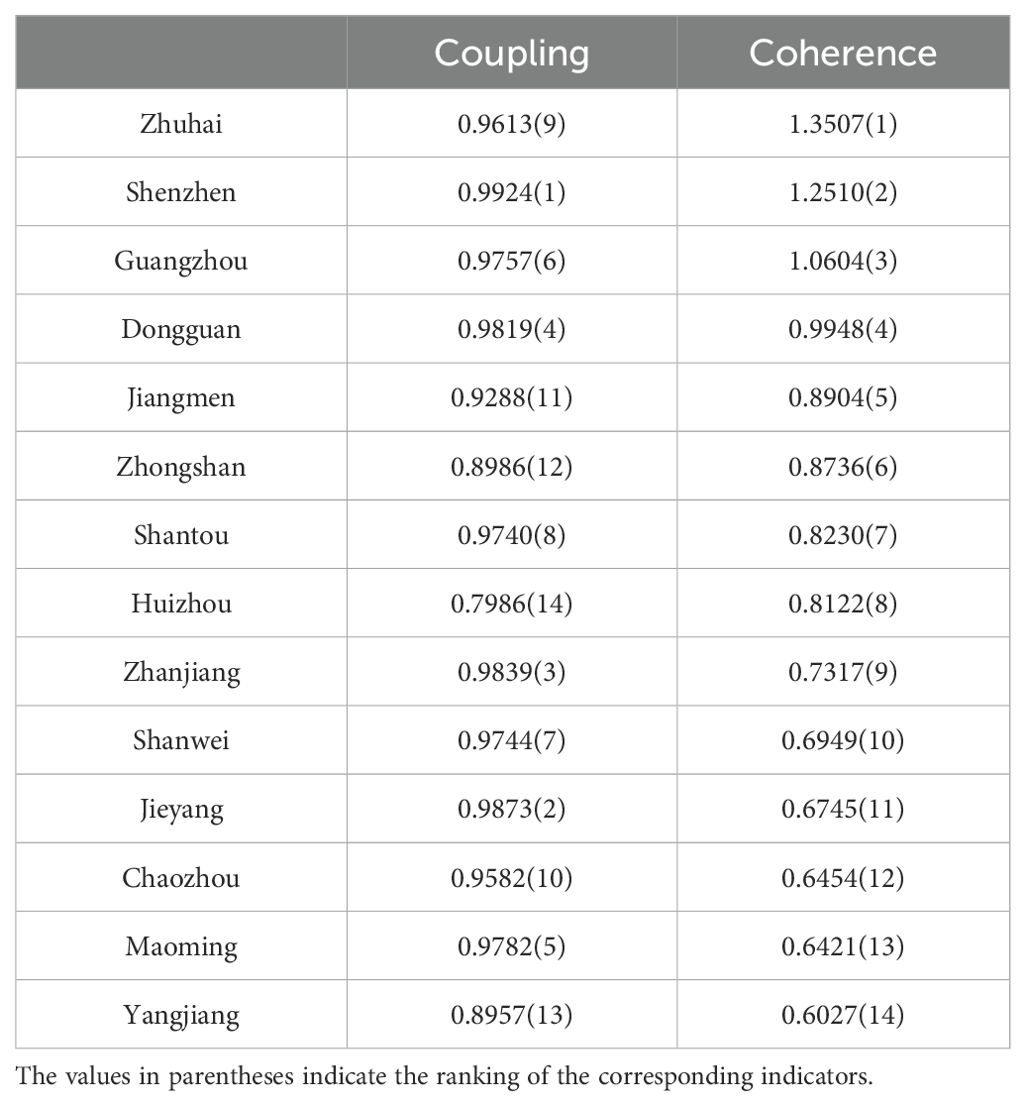
Table 7. Economic coupling and coordination of transportation in each region.
By the criteria of coupling-coordination type area classification, the study area can be divided into four type areas as follows (Figure 7).

Figure 7. Coastal region of Guangdong province maritime transportation and economy coordination-coupling type zone.
3.3.1 Highly coupled and highly coordinated area
Zhuhai, Shenzhen, Jiangmen, Shantou, Dongguan, Zhongshan, Guangzhou, these seven regions of maritime transportation and marine economic development can form a virtuous circle. Zhuhai, Guangzhou and Shenzhen have a relatively concentrated density of shipping lanes, which is conducive to the development of foreign trade. We can further develop the marine economy and promote industrial development by virtue of geographical advantages. The high level of coupling coordination in Jiangmen is mainly due to the relatively balanced level of both economic growth and maritime transportation in the area, and its maritime traffic benefits from the radiating effect of Zhuhai city. Shantou, as one of the first economic zones to open up in China, should rely on the West China Sea Economic Zone to enhance its own regional economic status. Dongguan has taken advantage of its geographical location to develop maritime transportation and economy by taking advantage of the radiation from the PRD region. Zhongshan is closer to the inland and has a relatively small area by the sea. It should make full use of the existing marine resources to develop the marine transportation industry.
3.3.2 Highly coupled and barely coordinated area
Yangjiang, Maoming, Chaozhou, Jieyang, Shanwei, these five regions are slightly better than the level of economic development in terms of the degree of maritime transportation advantage. Yangjiang is on the periphery of the PRD region, and should establish links with the PRD region, expand the density of the maritime transportation network, and provide more convenient support for import and export trade. Maoming is relatively remote and should deepen its deep-water logistics system and vigorously develop its petrochemical and mineral industries. Chaozhou’s maritime transportation and economic development level are not optimistic, so it should take advantage of the geographical advantage of being at the “southern gate” of Guangdong Province and develop cultural tourism industry by combining its unique Chaoshan culture. Jieyang is located in the eastern part of Guangdong, can make use of its own long history and cultural heritage, vigorously develop marine tourism projects. Shanwei can take advantage of the radiation from the periphery of the PRD region to establish links with the inner region.
3.3.3 High coupled and moderate coordinated area
Zhanjiang, the degree of maritime transportation advantage of the region is better than the level of economic development. Relatively speaking, Zhanjiang is at a disadvantage in geographical location. It should take advantage of its vast marine resources to expand the scope of its maritime transportation network system and add to its network of shipping lanes and routes. Its regional economic development will make a spurt of progress.
3.3.4 Relatively high coupled and high coordinated area
Huizhou sea area is relatively small, should take advantage of the economic radiation effect of the PRD region, the development of marine economy industry, enhance the level of development.
4 Conclusion
This study uses the spatial analysis function of GIS and the related model of traffic analysis to establish the evaluation model of the dominance of marine traffic and the related index system. Based on the sea data in many aspects, the spatial distribution of the marine traffic network system in the coastal region of Guangdong Province is analyzed. Then, its characteristics are summarized. Using the data of sea areas such as waterway routes, AIS and ports for analysis, the economic development level of each region was quantitatively evaluated by factor analysis and principal component analysis, which provided data support for the study of various factors affecting regional economic development. On the basis of the coupled coordination model, the correlation between the degree of maritime transportation superiority and economic development level of the Guangdong coastal area is explored, and the main contributions are as follows:
To deeply grasp the spatial pattern of maritime traffic and its changes, based on the road network density algorithm, we propose an algorithm that evaluates the density of maritime traffic network and port proximity as two factors.
To study the degree of maritime traffic advantage, the two factors are combined to establish a maritime traffic advantage evaluation model. And the study area is analyzed as an example, and the distribution of sea traffic in each region is obtained.
To capture the coupled coordination relationship between maritime traffic and economy, the regions are divided according to the coupled coordination model. A total of four types of regions are obtained. And on this basis, corresponding development suggestions are put forward for different regions, which provide certain practical guidance for promoting the virtuous cycle of maritime traffic and economy as well as sustainable development.
However, the current study area is limited to the vicinity of Guangdong Province and the number of evaluation factors is limited. In order to comprehensively understand the maritime transport and economic development of each region, it is necessary to expand the scope of the study and further increase the relevant indicators of the evaluation factors, so as to make the method more complete and obtain better evaluation results. In addition, the coupled coordination model can be optimized and improved to further enhance the universality of the evaluation results.
Data availability statement
The data analyzed in this study is subject to the following licenses/restrictions: For maritime transportation and economic analysis studies only. Requests to access these datasets should be directed to XL, TGl1XzIwMDAwNTEzQDE2My5jb20=.
Author contributions
PW: Writing – original draft. YW: Writing – original draft. BA: Writing – review & editing. XL: Writing – review & editing.
Funding
The author(s) declare financial support was received for the research, authorship, and/or publication of this article. The research presented in this article was funded by: 1) Southern Marine Science and Engineering Guangdong Laboratory (Zhuhai) (SML2021SP102); 2) National Marine Data Center, Guangdong-Hong Kong-Macao Greater Bay Area Branch (2024B1212080006); 3) National Natural Science Foundation of China (grant number No.62071279); 4) Taishan Industrial Experts Program; 5) Nansha Islands Coral Reef Ecosystem National Observation and Research Station.
Conflict of interest
The authors declare that the research was conducted in the absence of any commercial or financial relationships that could be construed as a potential conflict of interest.
Publisher’s note
All claims expressed in this article are solely those of the authors and do not necessarily represent those of their affiliated organizations, or those of the publisher, the editors and the reviewers. Any product that may be evaluated in this article, or claim that may be made by its manufacturer, is not guaranteed or endorsed by the publisher.
References
Alberto G., Marijn O., Tyler C., Guillaume M., Giulio N., Noe P., et al. (2023). Analysis of the global shipping traffic for the feasibility of a structural recovery program of Argo floats. Front. Mar. Sci. 10. doi: 10.3389/fmars.2023.1161580
Banister D., Berechman Y. (2001). Transport investment and the promotion of economic growth. J. Transport Geogr. 9, 209–218. doi: 10.1016/S0966-6923(01)00013-8
Chen S., Li Y., Wei P., Wang W. (2022a). Evolution of China's overland transportation dominance and its economic effect: A county-level analysis. Acta Geographica Sin. 77, 1937–1952. doi: 10.11821/dlxb202208007
Chen W., Bian J., Liang J., Pan S., Zeng Y. (2022b). Traffic accessibility and the coupling degree of ecosystem services supply and demand in the middle reaches of the Yangtze River urban agglomeration, China. J. Geographical Sci. 32, 1471–1492. doi: 10.1007/S11442-022-2006-5
Chen X., Zhang X., Chen S., Zhang L. (2018). The coupling relationship between integrated transport superiority and regional economic performance in China-ASEAN. J. Transportation Syst. Eng. Inf. Technol. 2018, 18(05):26–31+81. doi: 10.16097/j.cnki.1009-6744.2018.05.005
Chen Y., Li N., He D. (2006). A study on some urban bus transport networks. Physica A: Stat. Mechanics its Applications. 376, 747–754. doi: 10.1016/j.physa.2006.10.071
Cheng J., Wang C., Liu W. (2016). Distribution configuration and spatial differentiation of transport superiority degree in northwest China. Adv. Earth Sci. 31, 192–205. doi: 10.11867/j.issn.1001-8166.2016.02.0192
China Port Yearbook. (2020). Available online at: https://www.stats.gov.cn/sj/ndsj/.
Cosimo Magazzino and Isla Maltese. (2021). Editorial: Transport infrastructures: Investments, evaluation and regional economic growth. Res. Transportation Economics 88, 101125. doi: 10.1016/j.retrec.2021.101125
Davis C., Indraneel K., Konstantina G., Jon D., Lionel J. (2020). The role of transportation accessibility in regional economic resilience. J. Transport Geogr. 84, 0966–6923. doi: 10.1016/j.jtrangeo.2020.102695
Du Q., Wang X., Li Y., Zou P. X. W., Han X., Meng M. (2022). An analysis of coupling coordination relationship between regional economy and transportation: empirical evidence from China. Environ. Sci. pollut. Res. 29, 34360–34378. doi: 10.1007/S11356-022-18598-0
Duan W., Madasi J. D., Khurshid A., Ma D. (2022). Industrial structure conditions economic resilience. Technological Forecasting Soc. Change 183, 121944. doi: 10.1016/j.techfore.2022.121944
Feng C., Zhong J., Zhou Y., Ai B. (2023). Three-dimensional model construction and conflict detection of sea entities for Stereostratified ownership of sea areas. Sci. Surveying Mapp. 48, 220–228. doi: 10.16251/j.cnki.1009-2307.2023.08.026
Fu M., Liu L. (2022). The global marine economy : cognitive differences, comparative studies, and China's opportunities. Pacific J. 30, 78–91. doi: 10.14015/j.cnki.1004-8049.2022.01.007
Gao J., An T., Shen J., Zhang K. (2022). Development of a land-sea coordination degree index for coastal regions of China. Ocean Coast. Manage. 230, 0964–5691. doi: 10.1016/J.OCECOAMAN.2022.106370
Geurs K., Bert V. W. (2004). Accessibility evaluation of land-use and transport strategies: review and research directions. J. Transport Geogr. 12, 127–140. doi: 10.1016/j.jtrangeo.2003.10.005
Guangdong Marine Economic Development Report. (2002). Department of Natural Resources of Guangdong Province. Available online at: https://nr.gd.gov.cn/attachment/0/493/493677/3972658.pdf.
Guangdong Provincial Statistical Yearbook. (2021). Available online at: http://stats.gd.gov.cn/gdtjnj/.
Hansen W. G. (1959). How accessibility shapes land use. J. Am. Plann. Assoc. 25, 73–76. doi: 10.1080/01944365908978307
Hu H., Wang J., Jin F., Ding N. (2015). Evolution of regional transport dominance in China 1910-2012. J. Geographical Sci. 25, 723–738. doi: 10.1007/s11442-015-1198-3
Huang X., Cao X., Li T. (2011). The relationship between regional transport superiority and regional econonic performance in Hinan. Geographical Res. 30, 985–999. doi: 10.11821/yj2011060003
Huang P., Chen Q., Wang D., Wang M., Wu X., Huang X. (2022). TripleConvTransformer: A deep learning vessel trajectory prediction method fusing discretized meteorological data. Front. Environ. Sci. 10. doi: 10.3389/fenvs.2022.1012547
Huang C., Li Y., Chen Y. (2021). Research on the spatio-temporal evolution pattern and influence mechanism of traffic dominance in Chengdu-Chongqing Economic Circle. J. Xi'an Univ. Technol. 37, 478–487. doi: 10.19322/j.cnki.issn.1006-4710.2021.04.004
Ingram D. R. (2007). The concept of accessibility: a search for an operational form. Reg. Stud. 5(2), 101–107. doi: 10.1080/09595237100185131
Jin F., Wang C., Li X. (2008). Discrim ination method and its application analysis of regional transport superiority. Acta Geographica Sinica. 63 (8), 787–798. doi: 10.3321/j.issn:0375-5444.2008.08.001
Kwan M., Alan T. M., Morton E. O., Michael T. (2003). Recent advances in accessibility research: Representation, methodology and applications. J. geographical systems. 5, 129–138. doi: 10.1007/s101090300107
Li T., Cui L., Li J., Chen H., Cao X. (2022). Spatial pattern of transport condition and its matching with county development in the Yellow River Basin. Prog. Geogr. 41, 2030–2043. doi: 10.18306/dlkxjz.2022.11.004
Lisa W., Jonathan J., Seth J. T., Brandon J., John K., Trent H., et al. (2024). Balancing conflict and opportunity - spatial planning of shellfish and macroalgae culture systems in a heavily trafficked maritime port. Front. Mar. Sci. 10. doi: 10.3389/fmars.2023.1294501
Liu H., Meng D. (2022). Spatial heterogeneity of transport superiority degree and its impact factors of provincial capital cities in China in the background of high-speed railway construction. World Regional Stud. 31, 107–119. doi: 10.3969/j.issn.1004-9479.2022.01.2020307
Liu X., Zhong J., Ai B., Yuan F., Zhou Y. (2023). Evaluation of maritime traffic superiority in Shipping big data. Sci. Surveying Mapp. 48.09, 231–239. doi: 10.16251/j.cnki.1009-2307.2023.09.022
Lu J., Osorio C. (2022). On the analytical probabilistic modeling of flow transmission across nodes in transportation networks. Transportation Res. Rec. 2676, 209–225. doi: 10.1177/03611981221094829
Meng D., Shen J., Lu Y. (2012). Spatial coupling between transportation superiority and economy in central plain economic zone. Economic Geogr. 32, 7–14. doi: 10.15957/j.cnki.jjdl.2012.06.002
Miao Y., Lu W., Dai T., Song J. (2021). Comprehensive traffic advantage degree and its spatial characteristics at the prefecture level on the Qinghai-Tibet Plateau: A case study of Linzhi City. Prog. Geogr. 40, 1332–1343. doi: 10.18306/dlkxjz.2021.08.007
Muhammad Y., Liu S., Xu M., Wan J., Pirasteh S., Dang K. B. (2024a). ShipGeoNet: SAR image-based geometric feature extraction of ships using convolutional neural networks. IEEE Trans. Geosci. Remote Sens. 62, 1–13, 5202613. doi: 10.1109/TGRS.2024.3352150
Muhammad Y., Liu S., Xu M., Wan J., Sheng H., Shah N., et al. (2024b). YOLOv8-BYTE: Ship tracking algorithm using short-time sequence SAR images for disaster response leveraging GeoAI. Int. J. Appl. Earth Observation Geoinformation 128, 103771. doi: 10.1016/j.jag.2024.103771
Qu X. (2022). Research on the coupling degree and coordinated development mechanism ofTourism economy and ecological environment: taking the provincial capital cities in the yellow river basin as an example. Ecol. Economy 38, 125–130.
Ramesh P., Luca B., Marco T. (2023). How does transportation facilitate regional economic development? A heuristic mapping of the literature. Transportation Res. Interdiscip. Perspect. 19, 100817. doi: 10.1016/j.trip.2023.100817
Ronald R., Miguel B., Armin D., Michael W., Wei W. (2023). Verification and modeling of the maritime channel for maritime communications and navigation networks. Front. Mar. Sci. 10. doi: 10.3389/fmars.2023.1158524
Sun H., Liu Y., Zhou G. (2021). The spatiotemporal differentiation and mechanisms of traffic dominance in Northeast China. Acta Geographica Sin. 76, 444–458. doi: 10.11821/dlxb202102014
Tang Y., Wang C., Wang R., Xue M., Li M. (2020). Study on the spatial correlation of regional transportation and economic development in the yellow river basin. Economic Geography 1–14. Available at: http://kns.cnki.net/kcms/detail/43.1126.k.20201014.1342.002.html.
Wang F., Xin X., Lei Z., Zhang Q., Yao H., Wang X., et al. (2024). Transformer-based spatio-temporal traffic prediction for access and metro networks. J. Lightwave Technol. 42, 5204–5213. doi: 10.1109/JLT.2024.3393709
Wang W., Yang W., Cao X. (2015). Road transport superiority degree and impact on economic growth in the concentrated contiguous severe poverty areas in China. Prog. Geogr. 34, 665–675. doi: 10.18306/dlkxjz.2015.06.002
Wang R., Zhang R. (2023). Techno-economic analysis and optimization of hybrid energy systems based on hydrogen storage for sustainable energy utilization by a biological-inspired optimization algorithm. J. Energy Storage 66, 107469. doi: 10.1016/j.est.2023.107469
Wee B. (2011). Evaluating the impact of land use on travel behaviour: the environment versus accessibility. J. Transport Geogr. 19, 1530–1533. doi: 10.1016/j.jtrangeo.2011.05.011
Xu X., Liu W., Yu L. (2022). Trajectory prediction for heterogeneous traffic-agents using knowledge correction data-driven model. Inf. Sci. 608, 375–391. doi: 10.1016/j.ins.2022.06.073
Yan C., Zhang W., Yin J., Wang P., Xue Z. (2020). Comprehensive evaluation of ship maneuverability based on principal component analysis. J. Shanghai Maritime Univ. 41, 11–15. doi: 10.13340/j.jsmu.2020.02.003
Yasir M., Shanwei L., Mingming X., Jianhua W., Nazir S., Islam Q. U., et al. (2024). SwinYOLOv7: Robust ship detection in complex synthetic aperture radar images. Appl. Soft Computing 160, 1568–4946. doi: 10.1016/j.asoc.2024.111704
Yue W., Li J., Li C., Cheng N., Wu J. (2024). A channel knowledge map-aided personalized resource allocation strategy in air-ground integrated mobility. IEEE Trans. Intelligent Transportation Syst., 1–14. doi: 10.1109/TITS.2024.3409415
Keywords: maritime transport network density, economic development level, traffic advantage degree, coupling and coordination, automatic identification system (AIS)
Citation: Wang P, Wen Y, Ai B and Liu X (2024) Spatial pattern and coupling characteristics analysis of maritime traffic and economic development based on shipping big data. Front. Mar. Sci. 11:1410885. doi: 10.3389/fmars.2024.1410885
Received: 02 April 2024; Accepted: 28 August 2024;
Published: 24 September 2024.
Edited by:
Tsz Leung Yip, Hong Kong Polytechnic University, Hong Kong SAR, ChinaReviewed by:
Naixia Mou, Shandong University, ChinaMuhammad Yasir, China University of Petroleum (East China), China
Copyright © 2024 Wang, Wen, Ai and Liu. This is an open-access article distributed under the terms of the Creative Commons Attribution License (CC BY). The use, distribution or reproduction in other forums is permitted, provided the original author(s) and the copyright owner(s) are credited and that the original publication in this journal is cited, in accordance with accepted academic practice. No use, distribution or reproduction is permitted which does not comply with these terms.
*Correspondence: Yubo Wen, MzA0MDg4NjAzQHFxLmNvbQ==