
94% of researchers rate our articles as excellent or good
Learn more about the work of our research integrity team to safeguard the quality of each article we publish.
Find out more
ORIGINAL RESEARCH article
Front. Mar. Sci., 02 July 2024
Sec. Marine Ecosystem Ecology
Volume 11 - 2024 | https://doi.org/10.3389/fmars.2024.1408828
This article is part of the Research TopicThe Importance of Understanding Benthic Ecosystem FunctioningView all 7 articles
 Tasnuva Ming Khan1,2,3*
 Huw J. Griffiths3
 Rowan J. Whittle3
 Nile P. Stephenson1,2
 Katie M. Delahooke4
 Autun Purser5
 Andrea Manica1
 Emily G. Mitchell1,2
Predator-prey interactions in marine ecosystems control population sizes, maintain species richness, and provide intermediate disturbance. Such ecosystem structuring interactions may be rare in Antarctic epibenthic communities, which are unique among marine ecosystems worldwide for their dominance of soft bodied fauna (sponges, soft and hard corals, and echinoderms) and a simultaneous paucity of shell crushing predators (sharks, rays and durophagous decapods). In the shallow benthos, instead of durophagy, important Antarctic predators such as starfish, pycnogonids (sea spiders), nemertean worms, and nudibranchs employ grazing, scavenging, or sucking strategies. Far less is known about deep sea (>1000 m) Antarctic benthic communities due to the challenging nature of polar data collection, so that photographic surveys provide one of the only means of making in situ observations of these deep sea communities. We used seabed photographs of the deep (~2000m) slope of the Powell Basin, northwest Weddell Sea, taken by the Ocean Floor Observation and Bathymetry System on board the RV Polarstern (PS118, April 2019) to investigate the epibenthic community composition, and Bayesian Network Inference (BNI) to determine the ecological network, namely the ecological associations, including potential invertebrate predator-prey relationships between taxa. Photographs show that the rocky substrates of the basin slope support between 10-22 morphotaxa per photo, and highly abundant communities (density between 106 to 553 individuals/m2). BNI results reveal a network of associations between the sessile and mobile suspension and filter feeding organisms and their physical environment. However, associations between invertebrate predators like starfish, and other organisms, were not detected in the network. This lack of inclusion within the network suggests that, despite the presence of these normally important mobile predators, invertebrate predator-prey interactions on the rocky Powell Basin slope do not have the same ecosystem-regulating impact that they do on shallow Antarctic epibenthic communities.
Ecosystem dynamics are a complex interplay between multiple taxa in a given location, and their associated environmental parameters. One of the most important interactions is that of top-down predator-prey relationships, where the presence of predators modulates population size at lower trophic levels (Paine, 1969; Hunt Gl et al., 1992; Stanley, 2008; López et al., 2010; Tucker and Rogers, 2014; Belgrad and Griffen, 2016). In marine benthic ecosystems, decapods (crabs and lobsters) and asteroids (starfish) are common predators that regulate benthic population sizes by actively hunting or grazing on their prey and preventing monopolies of single habitat-altering taxa from completely colonizing space (Paine, 1966, 1969; Nelson, 1981). In reefs, high level meso-predatory sharks (Roff et al., 2016) and teleost fish (Skinner et al., 2020) regulate the community by providing intermediate disturbance and opportunistically feeding on weak and diseased individuals.
Predator-prey interactions may not be common in all Antarctic benthic ecosystems, which are unique because they generally lack durophagous predators like sharks and rays (Gili et al., 2001; Gutt et al., 2013b; Crame et al., 2014). Durophagous fish and decapods are largely responsible for structuring food webs in subtidal marine communities at temperate, tropical and subtropical latitudes (Aronson et al., 2007), but different processes operate in Antarctica. Brachyuran crabs and durophagous lobsters were important predators before the cooling and Cenozoic glaciation of Antarctica, but became locally extinct sometime in the last two million years, after the last occurrence of a single lobster in the Pliocene (Feldmann and Quilty, 1997). The exact timing and cause of the disappearance of durophagous predators remain areas of active research (Griffiths et al., 2013; Whittle et al., 2014) but it is generally accepted that due to the general absence of durophagy, Antarctic epibenthic communities became dominated by soft-bodied suspension feeding organisms such as sponges, soft and hard corals, and slow moving epifaunal invertebrates like echinoderms (Gil, 2004; Aronson et al., 2007; Griffiths et al., 2009; Griffiths, 2010; Gutt et al., 2013a). Antarctic epibenthic communities are known to be heterogenous in nature (Gutt et al., 2013b), but are more or less dominated by these groups in varying proportions depending on water depth and substrate (Gutt et al., 2013b). Since cooling and glaciation are likely responsible for the current community structure and composition, ongoing climate warming may leave these communities vulnerable to change with the potential introduction of novel predators (Aronson et al., 2007).
In shallow (<100m), mud-dominated, Antarctic benthic communities, important invertebrate predators include starfish, nemertean worms, peracarid crustaceans (which also performs herbivory, carrion feeding, ectoparasitism, detritus and filter feeding), and pycnogonids, which regulate the species composition and population size-structure (Dayton et al., 1974; Oliver and Slattery, 1985; Cerrano et al., 2000; Thrush et al., 2006). Notably, in the 30-50 m zones of the McMurdo Sound in coastal regions of the Ross Sea, the sea stars Perknaster fuscus antarcticus (Koehler, 1907) and Acodontaster conspicuus (Koehler, 1920) are specialist sponge predators that prevent the fast growing sponge Mycale (Oxymycale) acerata (Kirkpatrick, 1907) from outcompeting other sponge species (Dayton et al., 1974). The specialist A. conspicuus is itself occasionally preyed upon by the generalist sea star Odontaster validus (Koehler, 1906), sometimes in concert with the large nemertean worm Parborlasia corrugatus (McIntosh, 1876), to regulate the population of A. conspicuus and facilitate the development of the sponge community (Dayton et al., 1974; Thrush et al., 2006). In fact, O. validus has been elevated to “keystone species” status, as its impact on the community extends well beyond predicted for its abundance or biomass (Dayton et al., 1974; McClintock et al., 2008). Predators like O. validus and the brittle star Ophionotus victoriae (Bell, 1902) also scavenge, possibly due to ice scour-driven high faunal mortality (Smale et al., 2007).
In response to predation by starfish, many shallow water-dwelling sessile invertebrates such as ascidians, sponges and cnidarians have evolved to produce natural products or secondary metabolites as chemical defense strategies (Avila et al., 2008; Moles et al., 2015). Mobile ophiuroids and gastropods have sympatrically evolved escape responses to predatory sea stars (Schram et al., 2019). These chemical and behavioral adaptations imply that invertebrate predators have influenced the evolution of these species, but predator-prey interactions may not necessarily be the structural driving factor for the ecosystem today. The known invertebrate predator-prey interactions are only observed through experimental studies from shallow shelf regions in Antarctica, collected using scuba diving, benthic trawls, cores and dredges. However, due to the high logistical effort and time-consuming nature of sampling the deep sea, the vast majority of Antarctic benthic samples come from depths of less than 500 m whereas 90% of the region is actually deeper than 1000 m (Griffiths, 2010), with the ANDEEP I-III expeditions being a notable exception (Brandt et al., 2004, Brandt et al., 2007). As such, our understanding of how predator-prey interactions shape deep-sea Antarctic benthic ecosystems is limited.
Marine communities are shaped by a number of abiotic and biotic factors, which are highly scale dependent (Gutt et al., 2019). In Antarctica, on large spatial scales (e.g. >60 km), physical factors, such as depth, temperature and salinity largely determine the structure and composition of the community (Gutt et al., 2019) In shallow settings, sea ice extent and dynamics influence the pulsed seasonal primary production (Rossi et al., 2019; Caputi et al., 2020), while oceanographic fronts and geomorphology affect current speed and/or sedimentation rate, thereby influencing the ability of organisms to filter or deposit feed (Riisgård and Larsen, 2017). Iceberg scour in the shallows provides intermediate disturbance, which maintains high biodiversity in shallow Antarctic systems (Robinson et al., 2021), and also allows for the coexistence of different successional stages (Gutt, 2006; Gutt et al., 2019). Biological factors affecting community dynamics include primary production and food availability, which are strongly coupled with sea ice dynamics, and dispersal ability of organisms; i.e., successful recruitment and survival of early life stages, which can also be tied to the availability of substrate (Gutt and Starmans, 1998; Gutt, 2006). On smaller spatial scales (meter scale), the associations and interactions between the organisms are less well understood (Gutt et al., 2019). In deeper regions, local variations on the seafloor, e.g. ruggedness, slope and bathymetric terrain models can correlate with faunal compositions at meso-scale levels, however, the environment-biota relationship is generally weak, and may be the result of unknown environment factors or the effects of early-life history traits (Gutt et al., 2019). Given the heterogenous and patchy nature of Antarctic benthos (Gutt et al., 2013b), and the scale dependent drivers of community structure noted above, the predator-prey interactions observed in the muddy bottom or nearshore communities cannot be assumed to also be operating in the deeper regions of the Southern Ocean.
Bayesian Network Inference (BNI) is a powerful tool to examine ecological associations by modelling ecosystems as a network. These ecological networks could consist only of trophic relationships, but may also include habitat associations and inter-specific interactions, or a combination of all or some of these (Milns et al., 2010; Spiers et al., 2016; Mitchell et al., 2020a, Mitchell et al., 2021). The utility of BNs in capturing known ecological relationships have previously been tested against well studied ecosystems (Milns et al., 2010; Spiers et al., 2016; Hui et al., 2022), with the BN accurately finding the observed associations, leading confidence in the BN’s ability to capture associations, without a priori defining what sort of interaction or association they may be. While it is not possible to infer underlying processes from BNI alone, the most likely processes can sometimes be elucidated using biological observations (Milns et al., 2010), or other statistical approaches (Mitchell and Harris, 2020).
Advances in technology have now made vast amounts of data from previously under-sampled regions, such as the Western Weddell Sea, and depths greater than 500 m, globally available. Despite these advancements, sea ice conditions and high operational costs mean sampling by Agassiz Trawls or Rauschert dredges can often fail, or only be operated for very short periods of time, especially in areas of high topographic complexity and hard substrates (Dorschel, 2019). Photos and videos of the seabed using towed camera systems are therefore one of the only methods available to assess vast areas of the seafloor, allowing us to make in situ observations of these otherwise difficult to sample ecosystems.
Using BNI, we investigate taxa associations on different substrate types within the deeper Antarctic ecosystem, which would include invertebrate predator-prey interactions, if they are present. Based on observations in shallow epibenthic communities, our null hypothesis is that invertebrate predators will play a key role in structuring the rocky substrate and the muddy substrate communities, which, in a network framework, will appear as a node with multiple edges, and we expect these edges to be positive (indicating spatial aggregations).
Here, we used seabed photographs collected by the Ocean Floor Observation and Bathymetry System (OFOBS) (Purser et al., 2021), a towed camera system mounted on the icebreaker RV Polarstern, to investigate ecosystem structure, complexity and invertebrate predator-prey interactions. OFOBS photographs were taken for the purposes of assessing epibenthic megafauna communities and establishing temporal baselines for comparison with future studies (Dorschel, 2019; Purser et al., 2021).
In this study we determine the epibenthic community dynamics and ecological interactions and associations of the deep sea Powell Basin slope community in the Western Weddell Sea (Figure 1). The Powell Basin slope is composed of pillow lavas, creating a rocky, topographically complex seafloor. We use BNI to reconstruct the community structure as a network and infer causal dependencies between the taxa observed, and so resolve the influence invertebrate predators have on ecosystem structure. Unlike shallow water areas, the Powell Basin slope is beyond the reach of icebergs (Dowdeswell and Bamber, 2007), so intermediate disturbance by sea ice dynamics are less likely to be structural driving factors (Dowdeswell and Bamber, 2007; Stanley, 2008). This location is therefore ideally placed to study mesoscale associations such as invertebrate predatory-prey interactions without having to account for the highly structuring impact of ice.
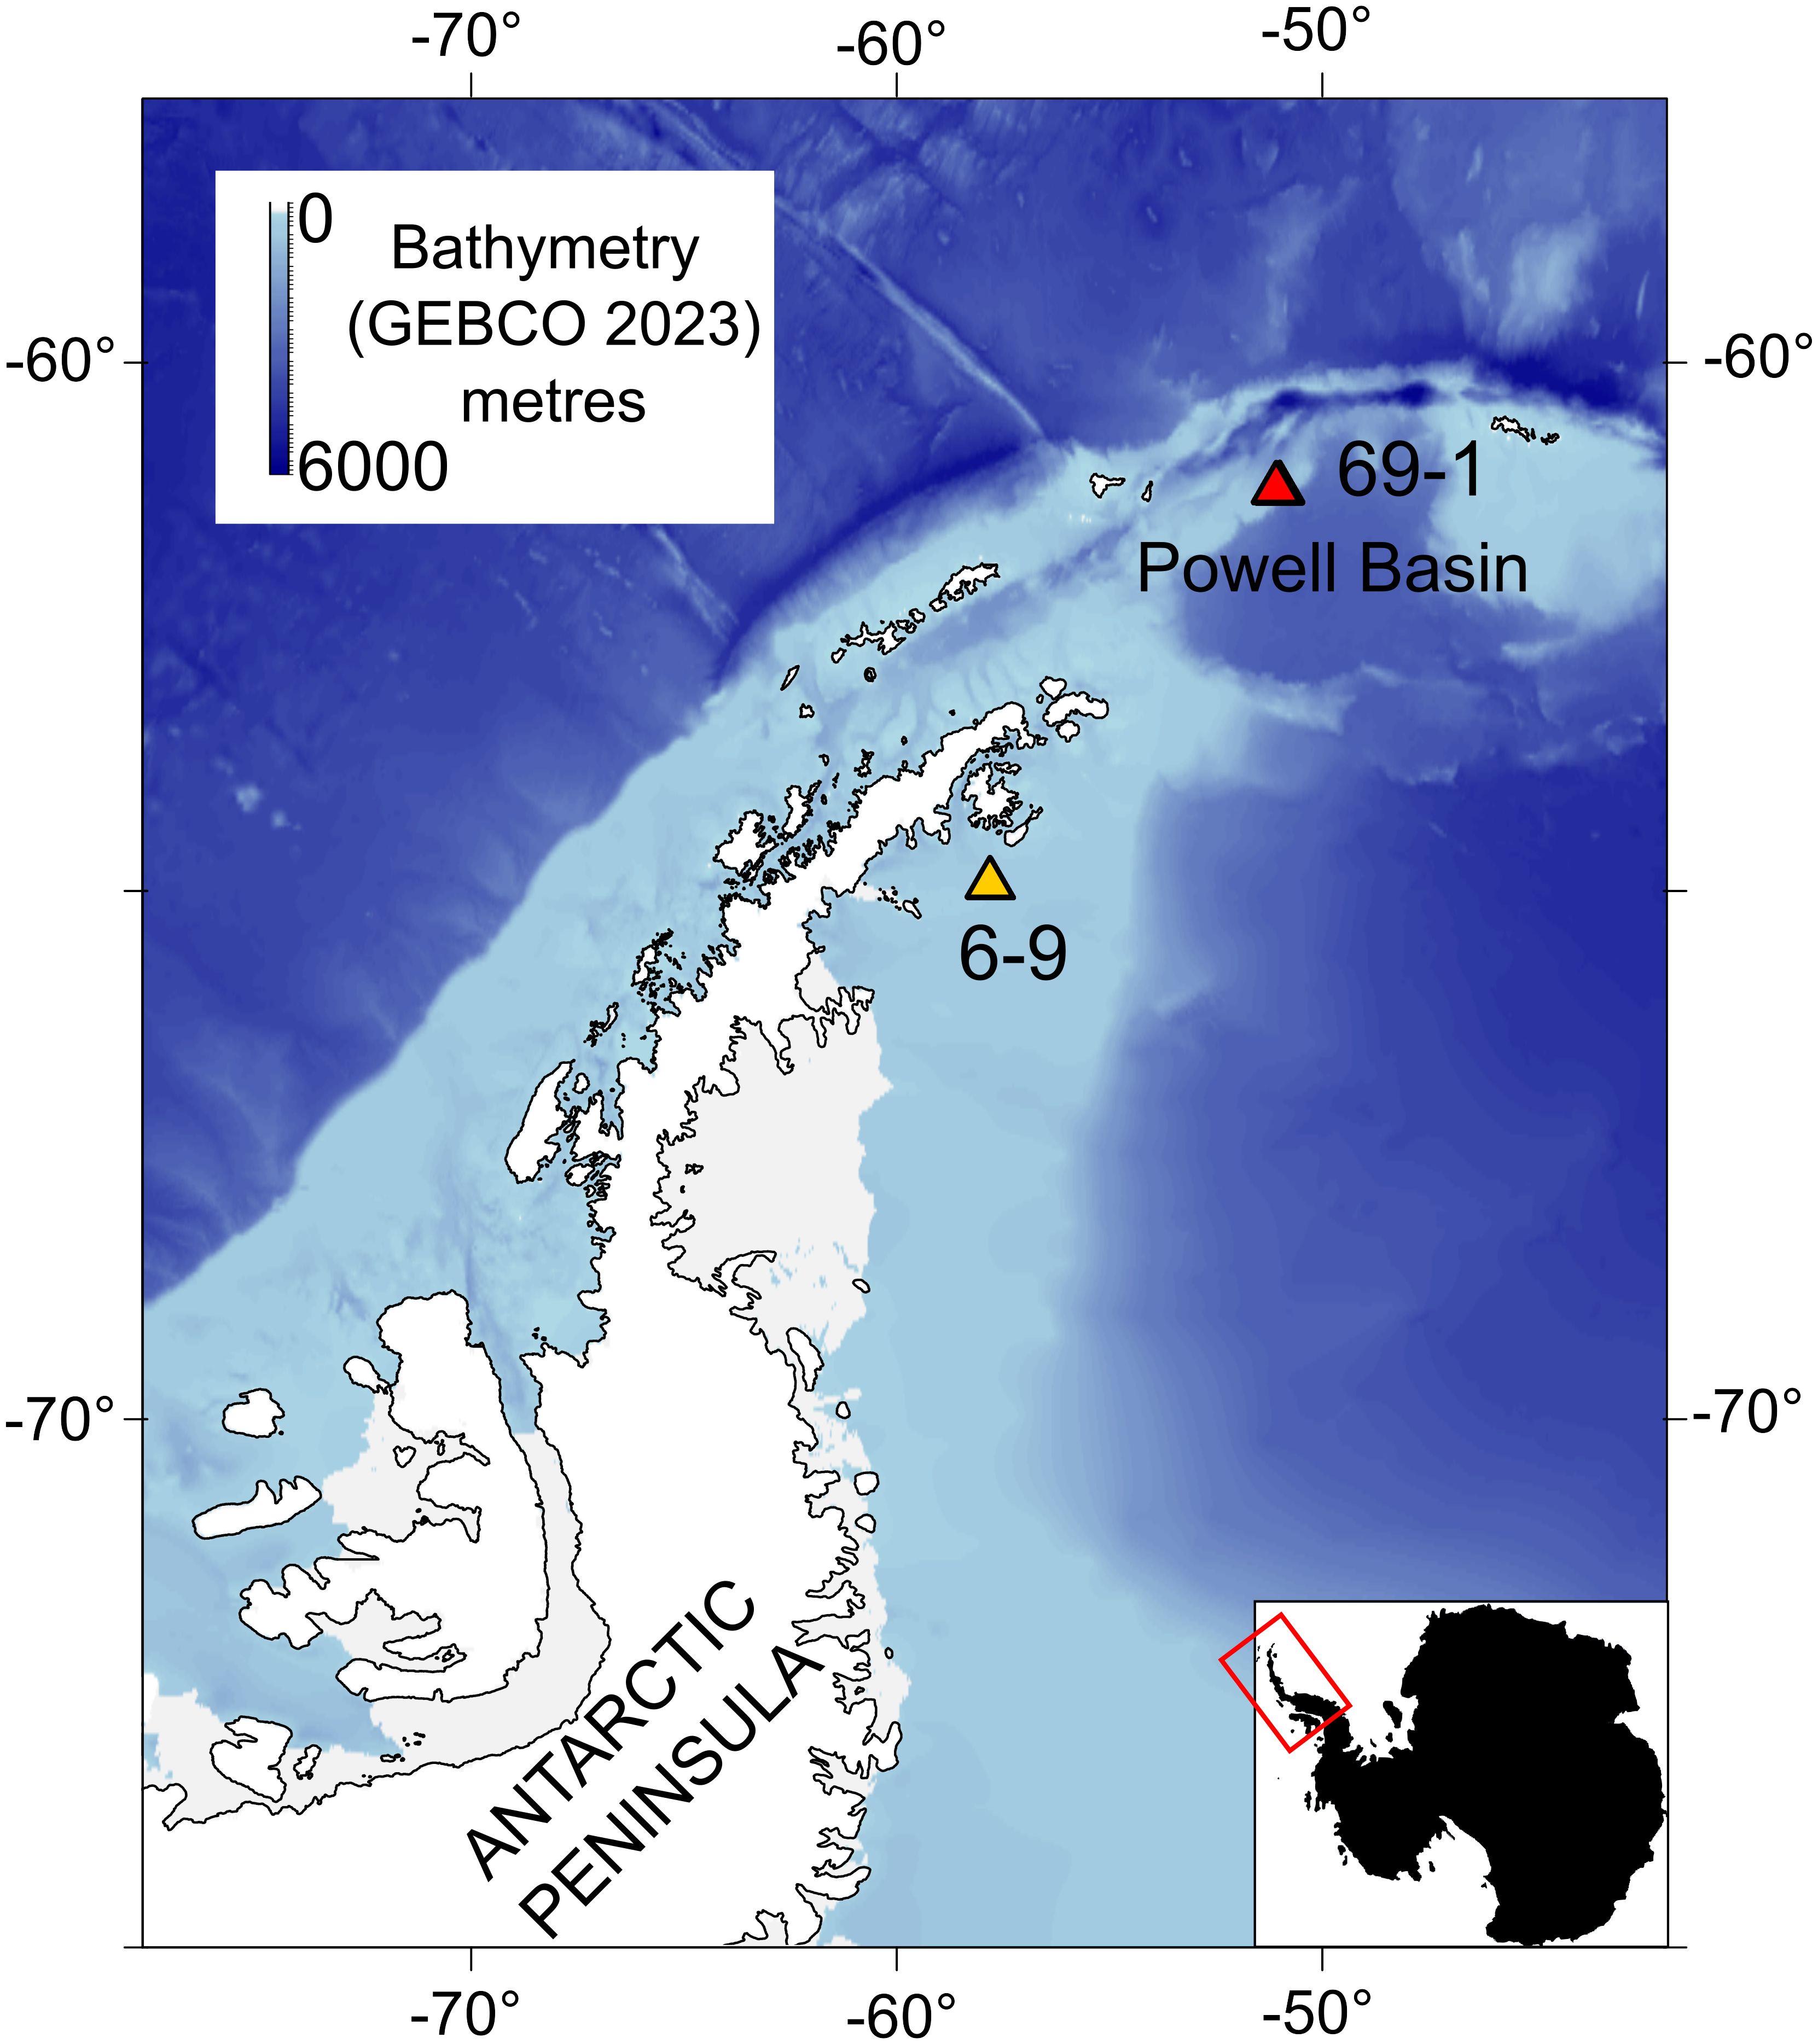
Figure 1 Main OFOBS transect used in this study is from the deep (~2045 m) rocky substrates of the Powell Basin slope, PS118/69-1. We compare observations with a shallow water (~432.5 m), muddy transect in the Weddell Sea, PS118/6-9. The bathymetric map data come from GEBCO 2023, and the shape files for Antarctica come from GADM.
As a comparator, we also study the epibenthic community composition and network structure of a shallower (~420 m) soft sediment shelf community in the western Weddell Sea, approximately 50 nautical miles off the Antarctic Peninsula coast (Figure 1).
The expedition PS118 (February-April 2019) extensively photographed the Western Weddell Sea in order to assess community composition, establish a 2019 baseline, and specifically for the Powell Basin flank, investigate a sparsely surveyed region of the Southern Ocean seafloor (Purser et al., 2020a).
Full details of the OFOBS deployment practices can be found in Purser et al. (2019). Still images of 26-megapixel resolution and HD quality video were recorded throughout each deployment of the OFOBS. In order to localize the collected data, the OFOBS was mounted with a Posidonia transponder for ultra-short baseline triangulation. Each photograph had three laser dots placed in an equilateral triangle (50 cm sides) near the center of the photograph and had both the geographical coordinates and the water depth at which the photograph was taken.
The availability of hard substrates is especially important for epibenthic taxa (Gutt et al., 2019), therefore, in this study we focused on a rocky transect: Profile 69-1, which pictured the deep (1670.2 – 2202.1 m, median 2045.9 m) flank of the Powell Basin, where pillow lavas form the rocky seafloor (Purser et al., 2020b) (Figures 2A–E). However, to quantify the impact of hard substrate on community composition, we also studied a transect that was photographed on relative shallow (422.3 – 443.5 m, median 432.5 m), muddy substrates in the northern Antarctic Peninsula (Supplementary Figure 1), approximately 50 nautical miles off the coast (Figure 1).
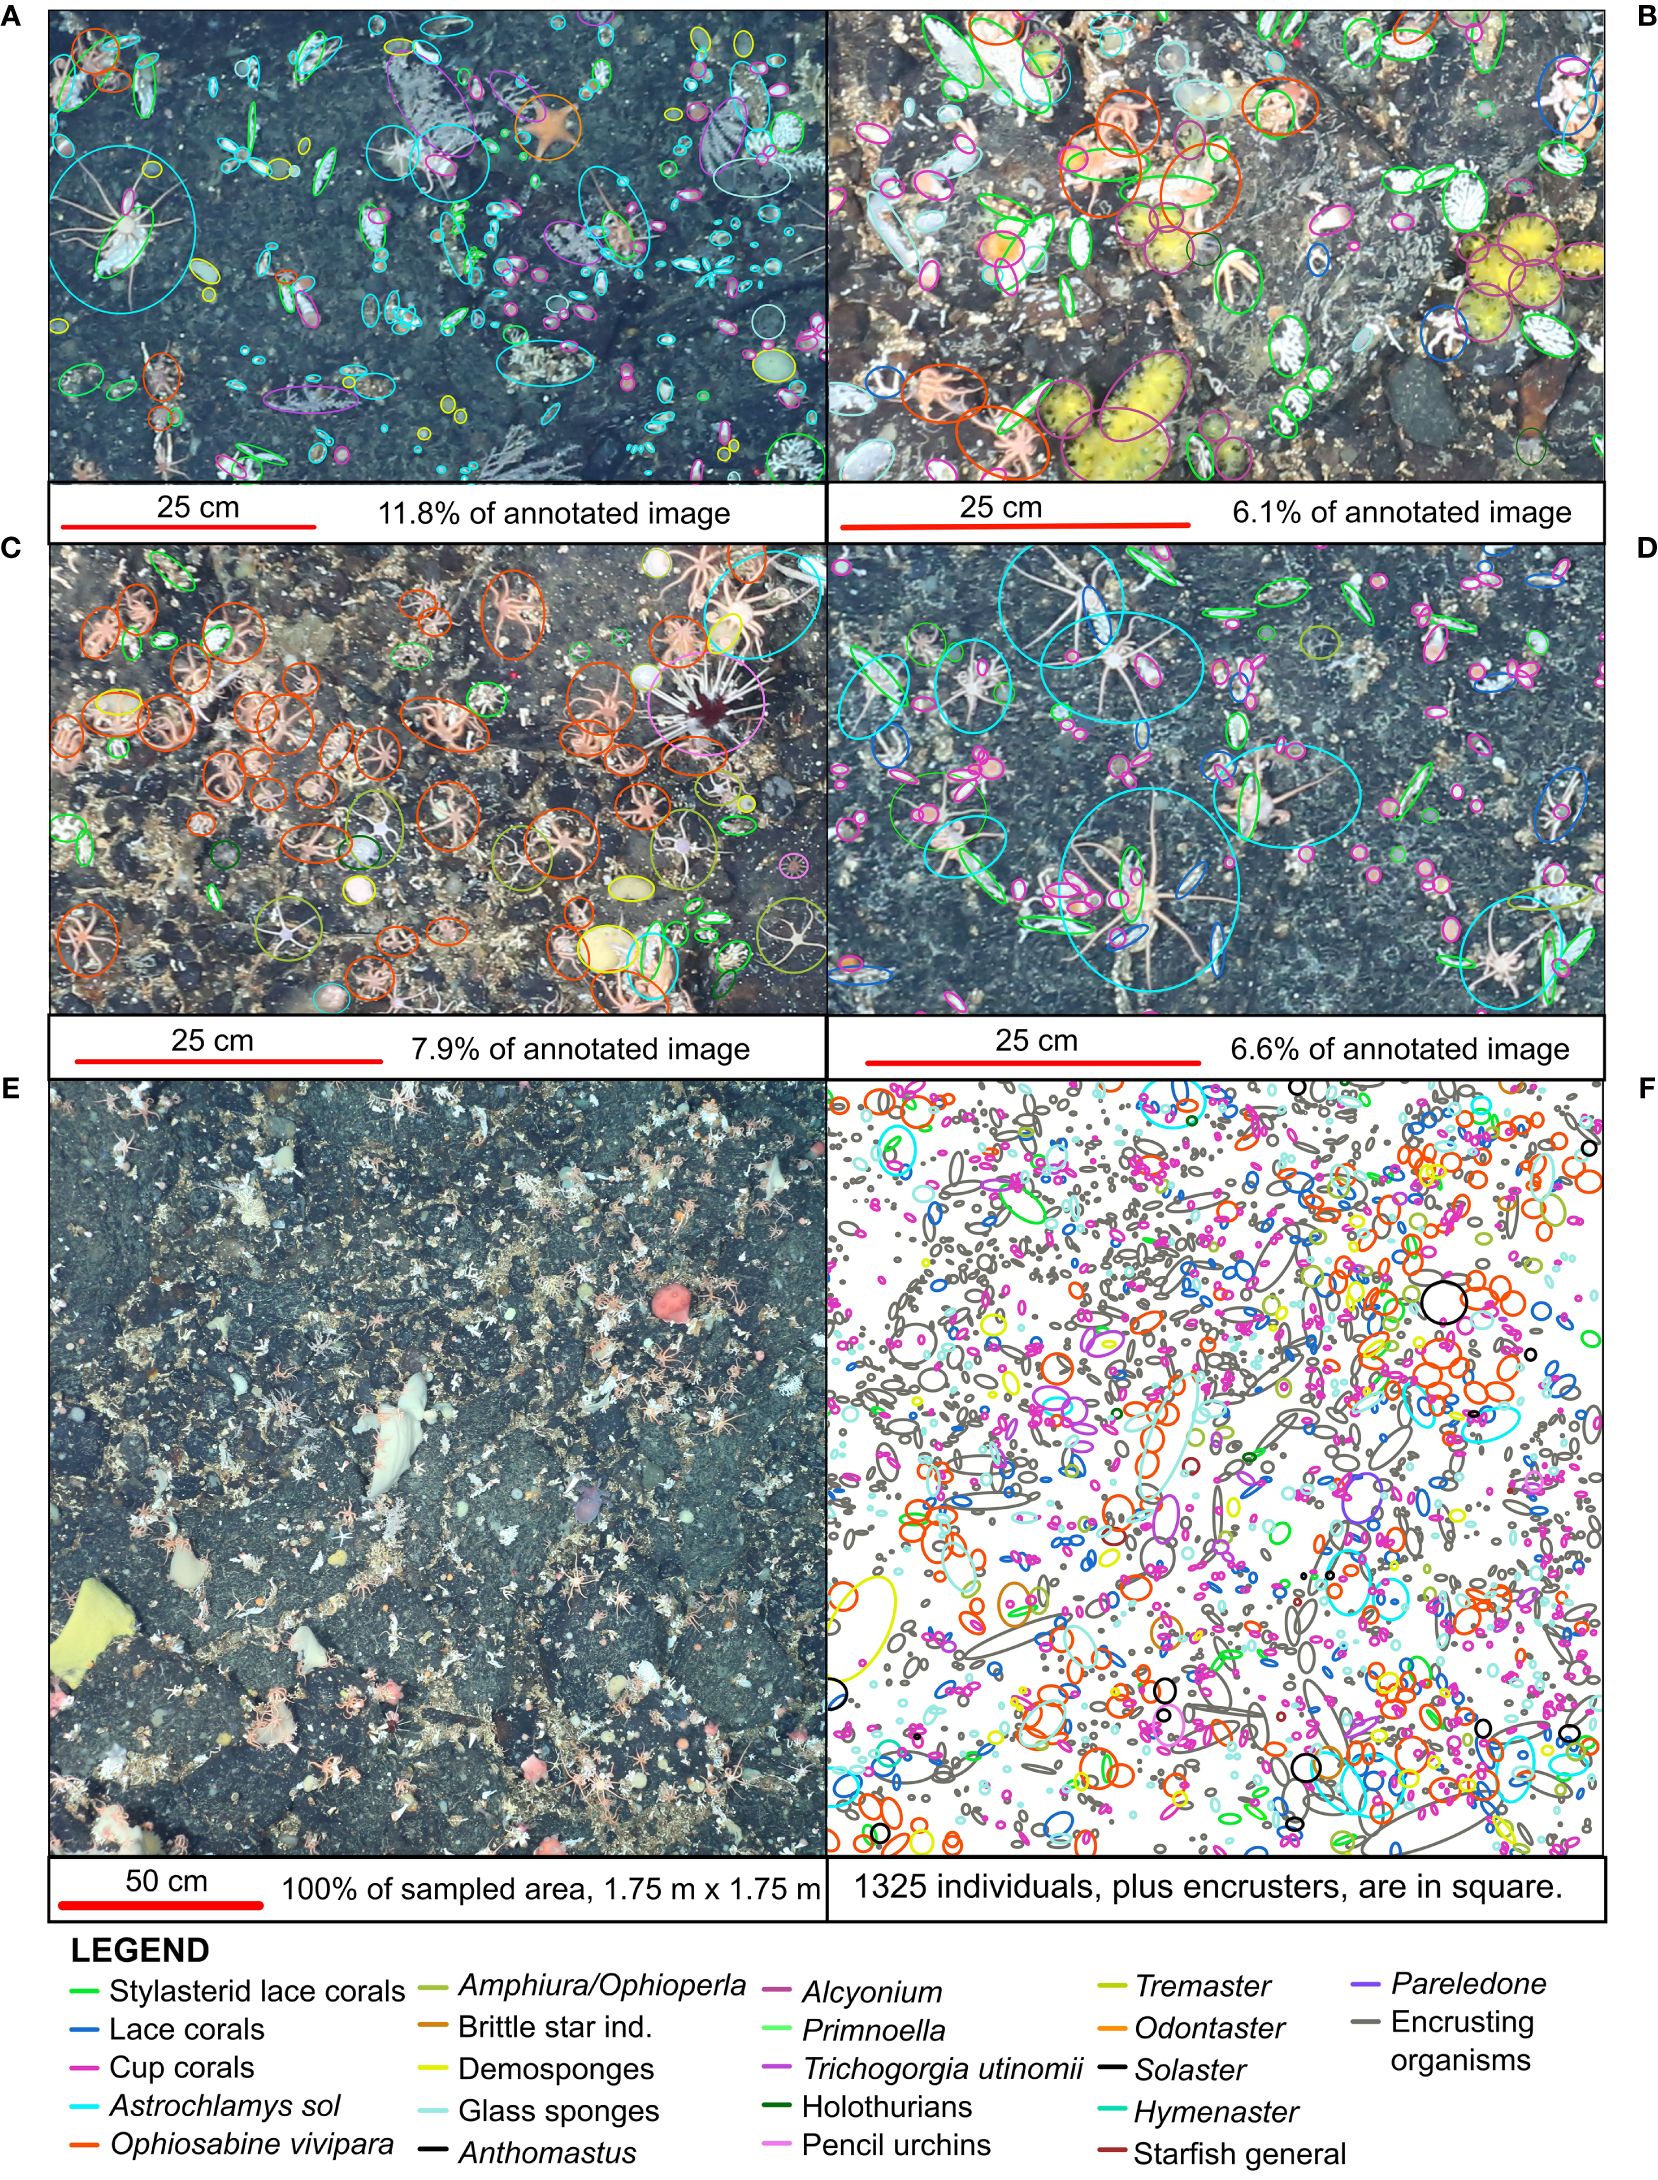
Figure 2 Magnified sections of four photos from the rocky Powell Basin slope. Annotations (circles) counts every observed individual animal. (A) TIMER_2019_03_31 at 11_56_08 IMG_0470 (B) TIMER_2019_03_31 at 14_10_49 IMG_1023 (C) HOTKEY_2019_03_31 at 14_30_54 IMG_1106 (D) TIMER_2019_03_31 at 12_02_22 IMG_0494. (E) TIMER_2019_03_31 at 11_53_00 IMG_0458, unlabeled. (F) Annotations on the same photo in panel (E).
These two profiles provided the maximum variation in substrate and water depth for this cruise, allowing us to examine the relative structures of Antarctic mega-epibenthic communities. While videos were available, we used photographs only as they were of a much higher resolution and enabled more accurate identifications.
On the rocky substrates of the Powell Basin slope, we manually selected photographs in order to maximize photo quality, since the distance from the seafloor to the imaging platform and lighting were highly variable. We selected 40 optimal photographs which had the following four properties 1) which contained GPS metadata, 2) were photographed roughly parallel to the seafloor, 3) were optimally lit, and 4) were taken from ⪅ 4 m above the ground. We scaled each photograph using the three laser dots of 50 cm. These parameters help position the photograph in space, minimize size distortion of observed features, and improve taxonomic identification, as detailed morphological features can be better observed when distance from ground to imaging platform is minimal. There was considerable variation in the flight height (therefore, image area) as terrain over the slope was very steep, and sufficient care needed to be taken by the OFOBS operators to avoid the towed sled snagging on any tall structures such as cliffs. As a result, variation in the coverage area of each photograph was on the meter scale, so we applied a sample box of 1.75 m x 1.75 m, providing a sample area of 3.06 m2 in 40 photographs. The selected photographs were 165 meters (by median) apart.
For the muddy Weddell Sea, we used ArcGIS (ESRI, version 10.6) to select 61 photos, spaced (by median) 32 meters apart and all occurring at 432 m water depth. We assessed every photograph for quality: if a randomly selected photo was blurry or poorly lit, the nearest photo of optimal quality was selected. Photos on this transect were collected roughly 1.5 m above the seafloor, providing coverage over an area of about 2.5 m x 2 m (Purser et al., 2021). Total area of photographs was observed to vary on the centimeter scale, so to uniformly sample, we used a sample box of 2 m x 1.5 m for each photograph, providing a sample area of 3.00 m2.
We annotated 101 photographs using Inkscape (Inkscape Developers, version 1.1) (c.f. Mitchell et al., 2019), scaled using the three laser dots of 50 cm. We identified, at least to class, often to genus and species levels, every macrobenthic organism visible in the photographs. Each annotated specimen contained a morphological ID, and its length and width. In the absence of physical specimens, the morphotaxa ID applied to each object was the best description we could apply based on graphic evidence only, an approach which is commonly used in ecological studies (e.g. Sahade et al., 2015; Brasier et al., 2018; Marina et al., 2024). Morphologically very distinct organisms such as Astrochlamys sol (Mortensen, 1936) or Ophiosabine vivipara (Ljungman, 1871) are referred to by name. Other brittle stars, likely of the genera Amphiura (Forbes, 1843) or Ophioperla (Koehler, 1912) are considered together as “Amphiura/Ophioperla” as they are difficult to distinguish from photographs at the resolution we are working with.
The maximum number of organisms found in one photograph was 1,694, in total we identified 31,616 organisms (Supplementary Data Sheets 1, 2). We fully utilized Rauschert and Arntz (2015) and Segelken-Voigt et al. (2016) for taxonomic identification, as well as consultation with specific taxonomic experts (personal communication) to aid in our annotations.
In addition to morphotype identification, we also quantified two further variables: On the rocky Powell Basin slope, we estimated coverage by hard encrusting organisms as a percentage, and so were included as a biotic variable (c.f. Brasier et al., 2018). These encrusters are taxa that cannot be clearly identified from this scale of imagery, including bryozoans, corals, tube worms and other taxa, including potentially disarticulated remains. In the muddy Antarctic Peninsula, dropstones were sometimes present, so were included as an abiotic factor.
This study focusses on the epibenthos, yet some nototheniid fishes can be attracted by the light from the OFOBS (and so found in photographs), while others may intentionally avoid it (La Mesa et al., 2022). As such, it is uncertain the extent to which the fish abundance in the photographic data represents the true population, so due to this limitation we exclude fishes from our study and focus instead on sessile and slower moving taxa only.
We used a custom script (https://github.com/Mingmingkhan/starfish) to import the annotations within the Inkscape SVG files into R (R Core Team, 2022), which we used to create photo-by-morphotype abundance matrices. We used these abundance data for our network analyses. Abundance data, as well as specimen densities, can be found in Supplementary Data Sheets 1, 2. A screenshot of each identified morphotype is present in Supplementary Tables 2, 3.
In a Bayesian network variables such as morphotypes or environmental variables are considered “nodes”, and dependencies between nodes are described as “edges” (Yu et al., 2002; Milns et al., 2010). Associations and interactions manifest within the network as edges, and are commonly found because organisms are rarely randomly distributed (Taylor et al., 1978). In marine ecological studies, BNs have been used to identify known functional relationships (Hui et al., 2022), interactions between groups of taxa (Trifonova et al., 2015; Mitchell and Harris, 2020; Mitchell et al., 2020a, Mitchell et al., 2020b), assess ecosystem resilience (Mitchell et al., 2021; Hui et al., 2022), ecosystem vulnerability (Stafford et al., 2013; Mitchell et al., 2020a, Mitchell et al., 2020b) and predict trophic cascade effects based on predator-prey interactions (Spiers et al., 2016).
Networks found using BNI indicates the associations caused by frequent co-localizations, and identifies only direct dependencies, which minimizes secondary correlations between two variables. For example, if A depends on B, which depends on C, there could be an association found between A and C, but this association is not a primary association, merely the result of two primary correlations. BNI would separately report edges A to B, and B to C, and not report A to C, thereby ensuring only primary associations are found.
We performed BNI in Banjo v2.2.0 (Smith et al., 2005; Bernard and Hartemink, 2006; Milns et al., 2010). A necessary constraint of the BN algorithm is that discretization is needed to maximize statistical power (Yu et al., 2002). This means that instead of raw abundance counts, observations need to be discretized into bins. These discrete data are assumed to have uniform priors with approximately equal samples across discrete categories, so we discretized our abundance data into abundance bins rather than raw counts. Discretization additionally weighs the relative abundance of each taxonomic group, so very high abundances do not dominate all signals, and rarer groups do not get masked. This discretization means that, at the input level, all taxa and environmental variables are considered to be equally important. For ecological data, three discrete bins are a good balance between maintaining information present in the original dataset (requires more bins), and greater statistical power (requires fewer bins) (Yu et al., 2002). We therefore used zero, low and high counts for most nodes, with the median abundance value demarcating between low and high categories. Zero was treated as a separate entity because the presence of one individual has a very different ecological signal to a zero presence. Some nodes were also discretized into presence/absence bins to ensure uniform distributions.
At the raw collection level, not every taxon can be discretized evenly into two or three bins, so ecologically and taxonomically similar taxa are grouped together prior to discretization (c.f. Milns et al., 2010; Stafford et al., 2013; Trifonova et al., 2015; Spiers et al., 2016; Mitchell et al., 2020a, Mitchell et al., 2020b, Mitchell et al., 2021). Grouping similar taxa into coarser categories is well established for BN methods as it enables understanding of associations at ecosystem levels, beyond simple pairwise associations between taxa (e.g. Milns et al., 2010; Stafford et al., 2013; Spiers et al., 2016; Mitchell et al., 2020b), with the group definitions dependent on the hypothesis being tested. Grouping can be categorized by biogeographic regions, to investigate biogeographical patterns (c.f. Mitchell et al., 2021); investigation of functional relationships within a community, with taxa categorized by functional group (c.f. Trifonova et al., 2015); trophic interactions with taxa grouped trophically (c.f. Spiers et al., 2016). At the input level, each node in a network is scale agnostic, allowing for environmental and biological data to be tested together. This scale independence additionally means that biological groups can be assessed in a mixture of taxonomic levels, i.e., at species, genus, class, or family levels (c.f. Stafford et al., 2013; Mitchell et al., 2020a), as long as a single individual observation is counted only once.
We discretized our raw abundance counts into several groups. The percentage of encrusting organisms was discretized into quartiles (c.f. Mitchell et al., 2020b). Group definitions with their constituent morphotypes can be found in Table 1 (rocky Powell Basin) and Supplementary Table 1 (muddy Weddell Sea). The discretized inputs for the BNI for both the rocky Powell Basin Slope and muddy Weddell Sea can be found in Supplementary Data Sheets 3 and 4.
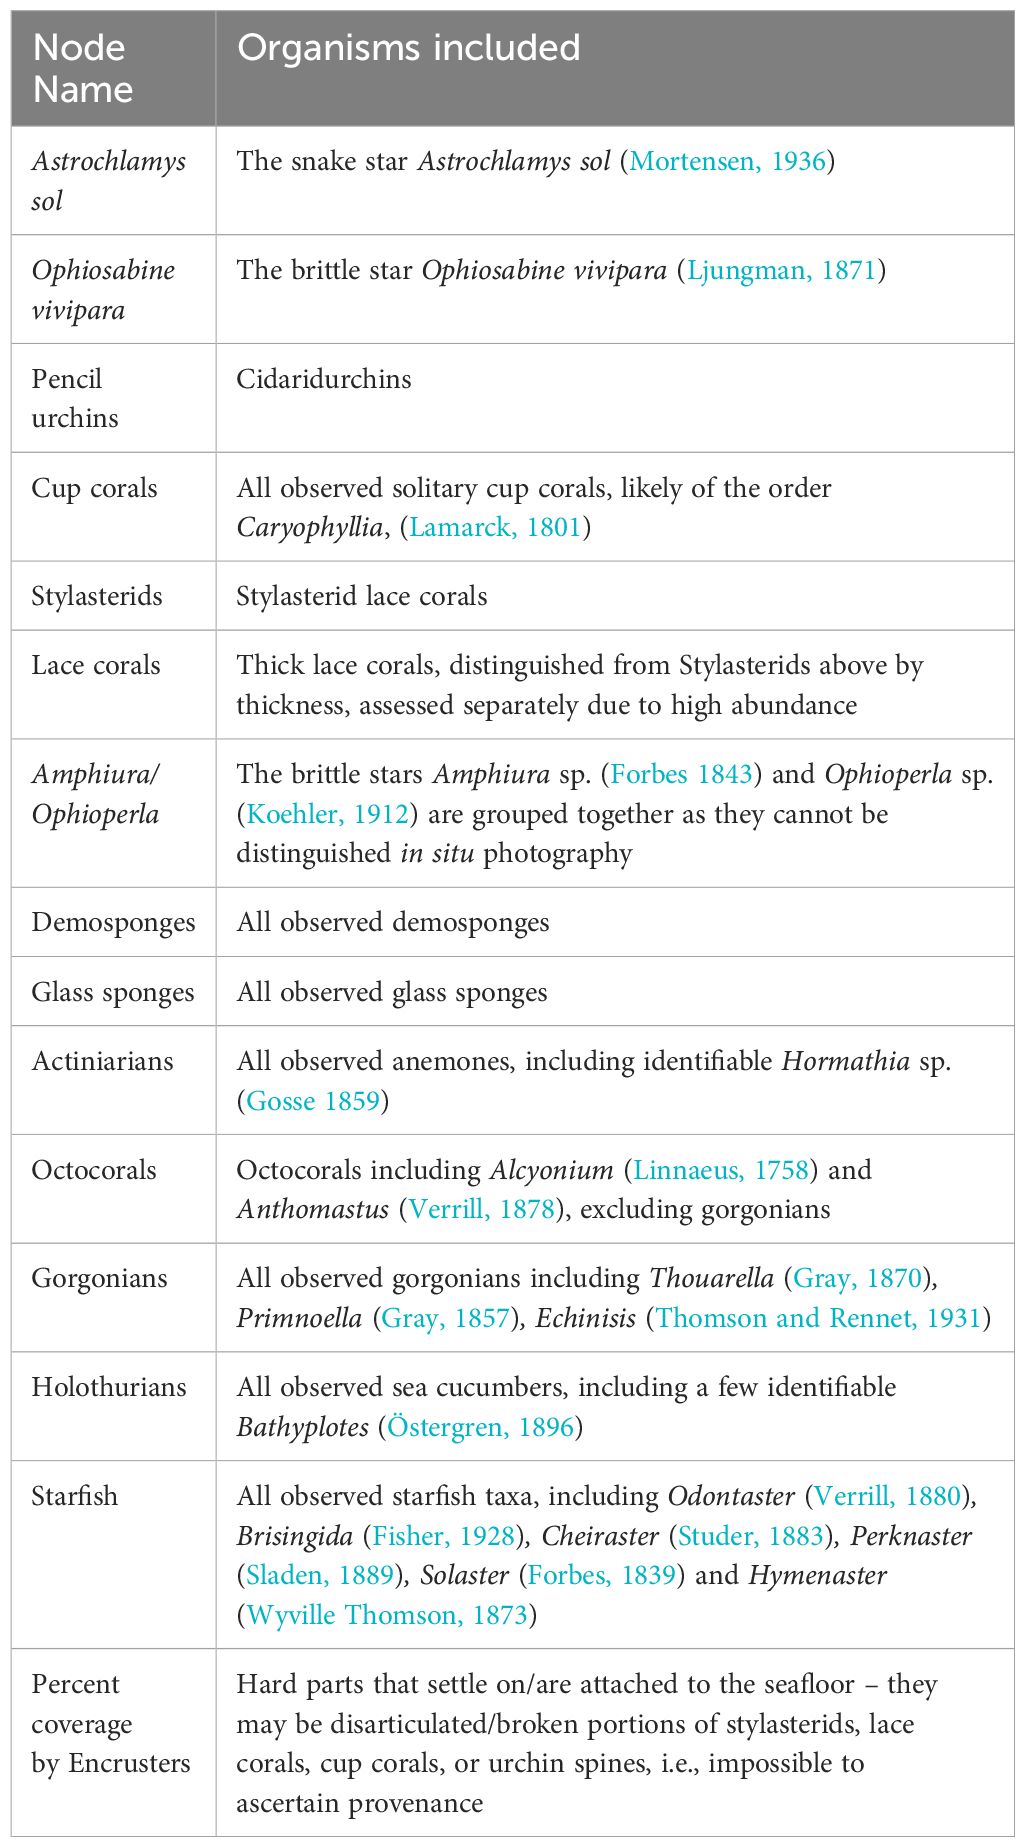
Table 1 List of nodes, and the morphotaxa placed within each node – Powell Basin Slope.
However, the BN framework also comes with some disadvantages. Rare taxa, i.e., those that usually occur in less than 33% of occupied space (c.f. Yu et al., 2002; Milns et al., 2010), can lead to groups with large zero counts. Zero heavy nodes in many variables can lead the Bayesian Scoring Metric to find relationships due to zero of one group being good at predicting zero of another, regardless of taxon presence (Yu et al., 2002; Milns et al., 2010). Countering for this false positive requires either exclusion of this data (e.g. excluding pycnogonids in this present study) or incorporating the rarer taxa into another meaningful group (e.g. grouping in the few identifiable Bathyplotes (Östergren, 1896) into our “holothurians” group, see Table 1). Further disadvantage of BNs are that the biological nature of the dependencies cannot be inferred using BNI alone (Milns et al., 2010), and that a recovered network represents a static snapshot of ecological interactions at a single time-step, so may not represent changing ecological dynamics through time (Hui et al., 2022).
Despite these limitations, computational inference of complex networks are an efficient way to reveal associations (Hui et al., 2022), and it has been established that understanding interactions is crucial in understanding the impacts of disturbances such as climate change, or introduction of novel predators, on ecological systems (Pearson and Dawson, 2003; Proulx et al., 2005).
For networks with a high number of variables, such as in this study, the network cannot be analytically found, so instead a search algorithm was used to find the network which best fits the data. Greedy searches enable local maxima to be overcome, so are best for ecological analyses (Heckerman, 1995; Milns et al., 2010). We determined the best network by using a greedy search (Heckerman, 1995) to find the best ten million networks for each bootstrapped dataset (c.f. Milns et al., 2010).
To minimize outlier bias (c.f. Milns et al., 2010), we bootstrapped 1000 samples at the 95% level (with replacement) (https://github.com/Mingmingkhan/starfish). On the Powell Basin slope, the threshold for being “highly probable” was taken to be the edges that occurred in greater than 60%, and “most probable” edges were ones that occurred in greater than 40% of the analyzed networks. For each edge determined by the network, the probability of occurrence, and the strength of the connection (known as the Influence Score, IS) was calculated. Graphically, the percentage that an edge occurs in the bootstrapped samples is shown by the width of the edge. The IS, which ranges from -1 to 1, can be used to gauge the type and strength of the interaction between the two nodes. If the IS is positive, the correlation is positive and indicates aggregation [e.g. due to predation, symbiosis or shared habitat preferences (Mitchell et al., 2020a)], and when node 1 is high, node 2 will also be high. An IS of -1 corresponds to a negative correlation: when node 1 is high, node 2 will be low, indicating segregation [e.g., due to competitive exclusion or segregated niches (Mitchell et al., 2020a)].
We performed sensitivity analyses as follows: In order to ensure that biological patterns were not masked by over-categorization of morphotypes into the coarser classes used in the nodes in Table 1, we used BNI to analyze a separate data set using only the morphotypes which, at the raw collection level, could be discretized uniformly. Although fewer morphotypes could therefore be studied, this sensitivity analysis ensured that the grouping and discretization process did not mask signals. BNI inputs and results for these can be found in Supplementary Data Sheet 5 and Supplementary Figure 2.
On the rocky substrates of the deep-sea Powell Basin slope, we found high numbers of individual animals - we identified 30,575 individual animals from 53 morphotypes in 40 annotated photographs (Figure 3A; Supplementary Data Sheet 1). The median number of individuals per 3.06 m2 photograph was 695. The densest photograph contained 1694 individual animals, while the least dense contained 325 individual animals. Stylasterid lace corals were by far the most abundant group but abundance varied by site: numbers ranged from 20 to 680 specimens, with a median of 235.5 specimens per photograph. In seven photographs, stylasterid numbers were particularly low (between 20 and 76), with solitary stony large-polyp cup corals making up the abundance with 519 to 834 specimens.
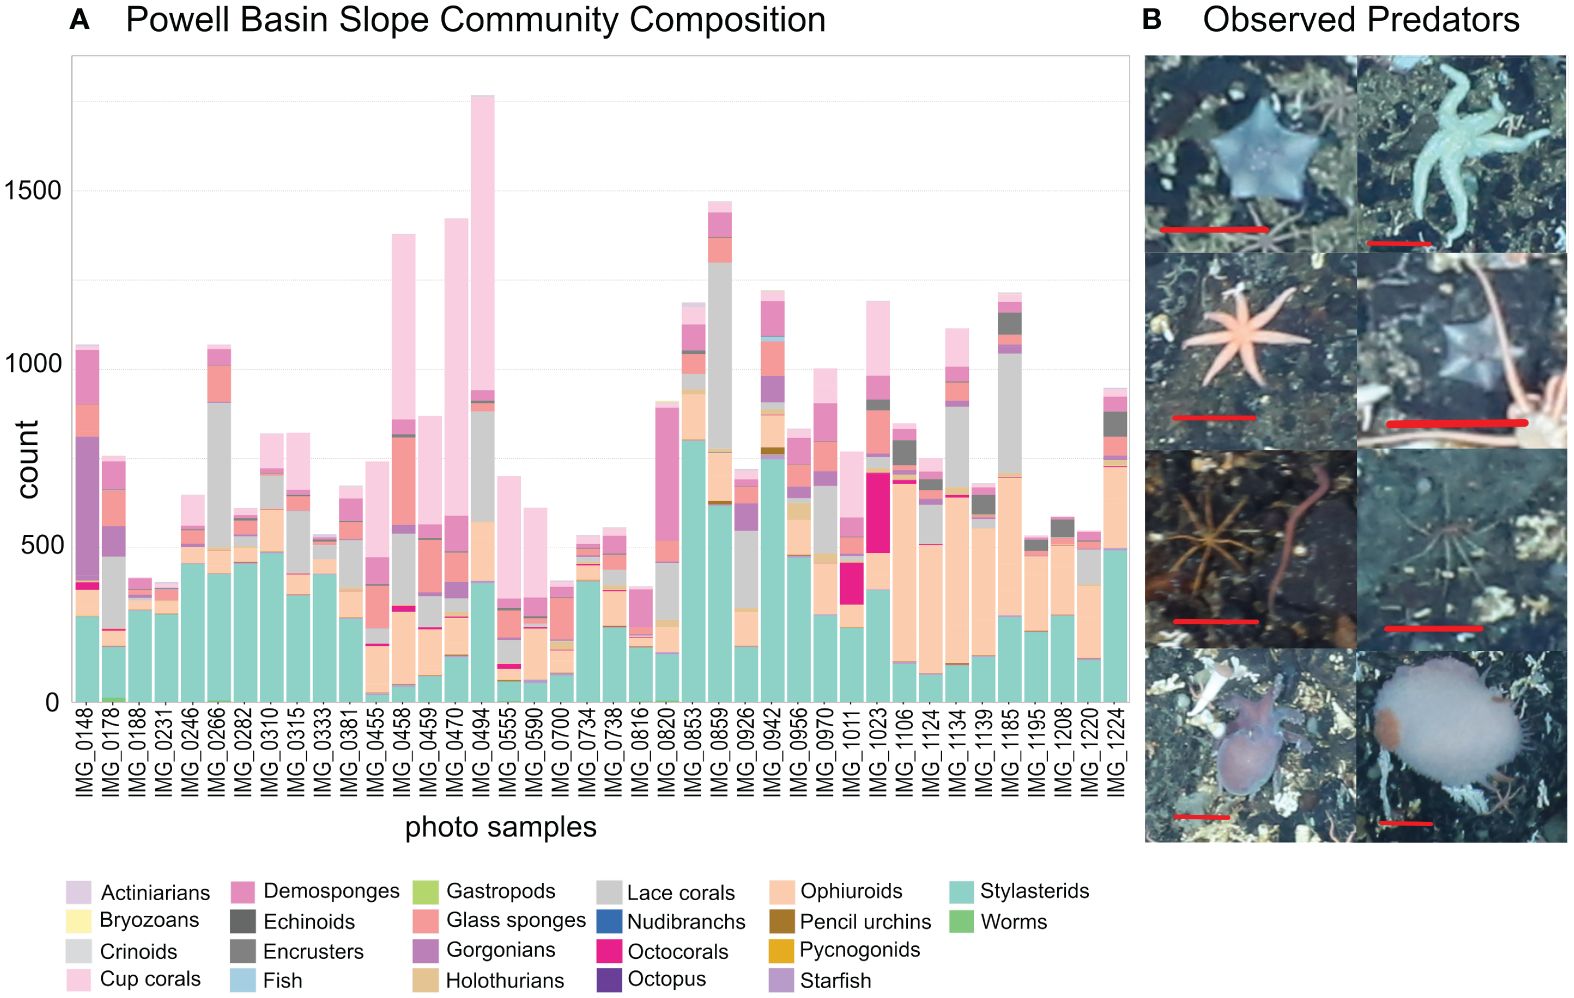
Figure 3 (A) Community composition of the Powell Basin slope. Each bar refers to a single photograph. Stylasterid corals and cup corals were most common morphotypes in the PB, with large numbers of ophiuroids also present. (B) Examples of observed predators; from top left: Hymenaster, Solaster, Solaster, Hymenaster, a pycnogonid next to a nemertean worm, a pycnogonid, Pareledone octopus, Doris nudibranch. Red scale bars equal 5 cm.
Several morphotaxa of brittle stars were present in every photograph: a median of 47.5 specimens of likely Ophiosabine vivipara, a filter feeding brittle star, were present. They also often formed large colonies comprising between 101 and 349 individuals – some clusters can be seen in Figure 2. The morphotaxa we identified as likely Amphiura and/or Ophioperla had median values of 22 specimens per photograph. They also formed large colonies containing between 96 and 148 individuals. The orange, ten or more armed, snake star Astrochlamys sol were rarer, with 11.5 individuals (by median) present per photograph, but could occasionally be found in large clusters containing up to 55, and in one photograph, 99 individuals. Several starfish taxa, were present in 92.5% of photographs at low numbers of 1-14.
Of the 30,575 individuals observed, we found only a handful of invertebrate predators (Figure 3A) - a single Sterechinus (Koehler, 1901) echinoid, a single Marseniopsis (Bergh, 1886) gastropod, two Doris (Linnaeus, 1758) nudibranchs, a single Pareledone (G. C. Robson, 1932) octopus, and 10 pycnogonids (sea spiders) (examples in Figure 3B). Starfish were the most common invertebrate predators, and were the only predatory group that had high enough abundance to be included in the Bayesian Network. We observed a total of 147 individuals in 37 photographs. Most abundant were Hymenaster (Wyville Thomson, 1873) (37 individuals), general starfish species (Rauschert and Arntz, 2015) (32 individuals), and Solaster (Forbes, 1839) (31 individuals). The median number of starfish observed in a single photo is 3. The maximum number of starfish in a single photo is 14.
The Bayesian ecological network on the hard substrates of Powell Basin slope demonstrates that most taxa are connected within the network (Figure 4). Of the 15 nodes considered, 12 exhibited edges with at least one other node. For the network containing only the highest probable edges (i.e., those that occurred in >60% of the bootstrapped networks), Astrochlamys sol was the most connected node, with associations with holothurians, cup corals, and the Amphiura/Ophioperla morphotaxa. For the lower probability network (>40% bootstrapped network) the percentage of encrusting organisms, demosponges, the snake star Astrochlamys sol, and the brittle stars Amphiura or Ophioperla were the most connected, each with 3 connections (Figure 4). The predatory starfish node was unconnected to the network.
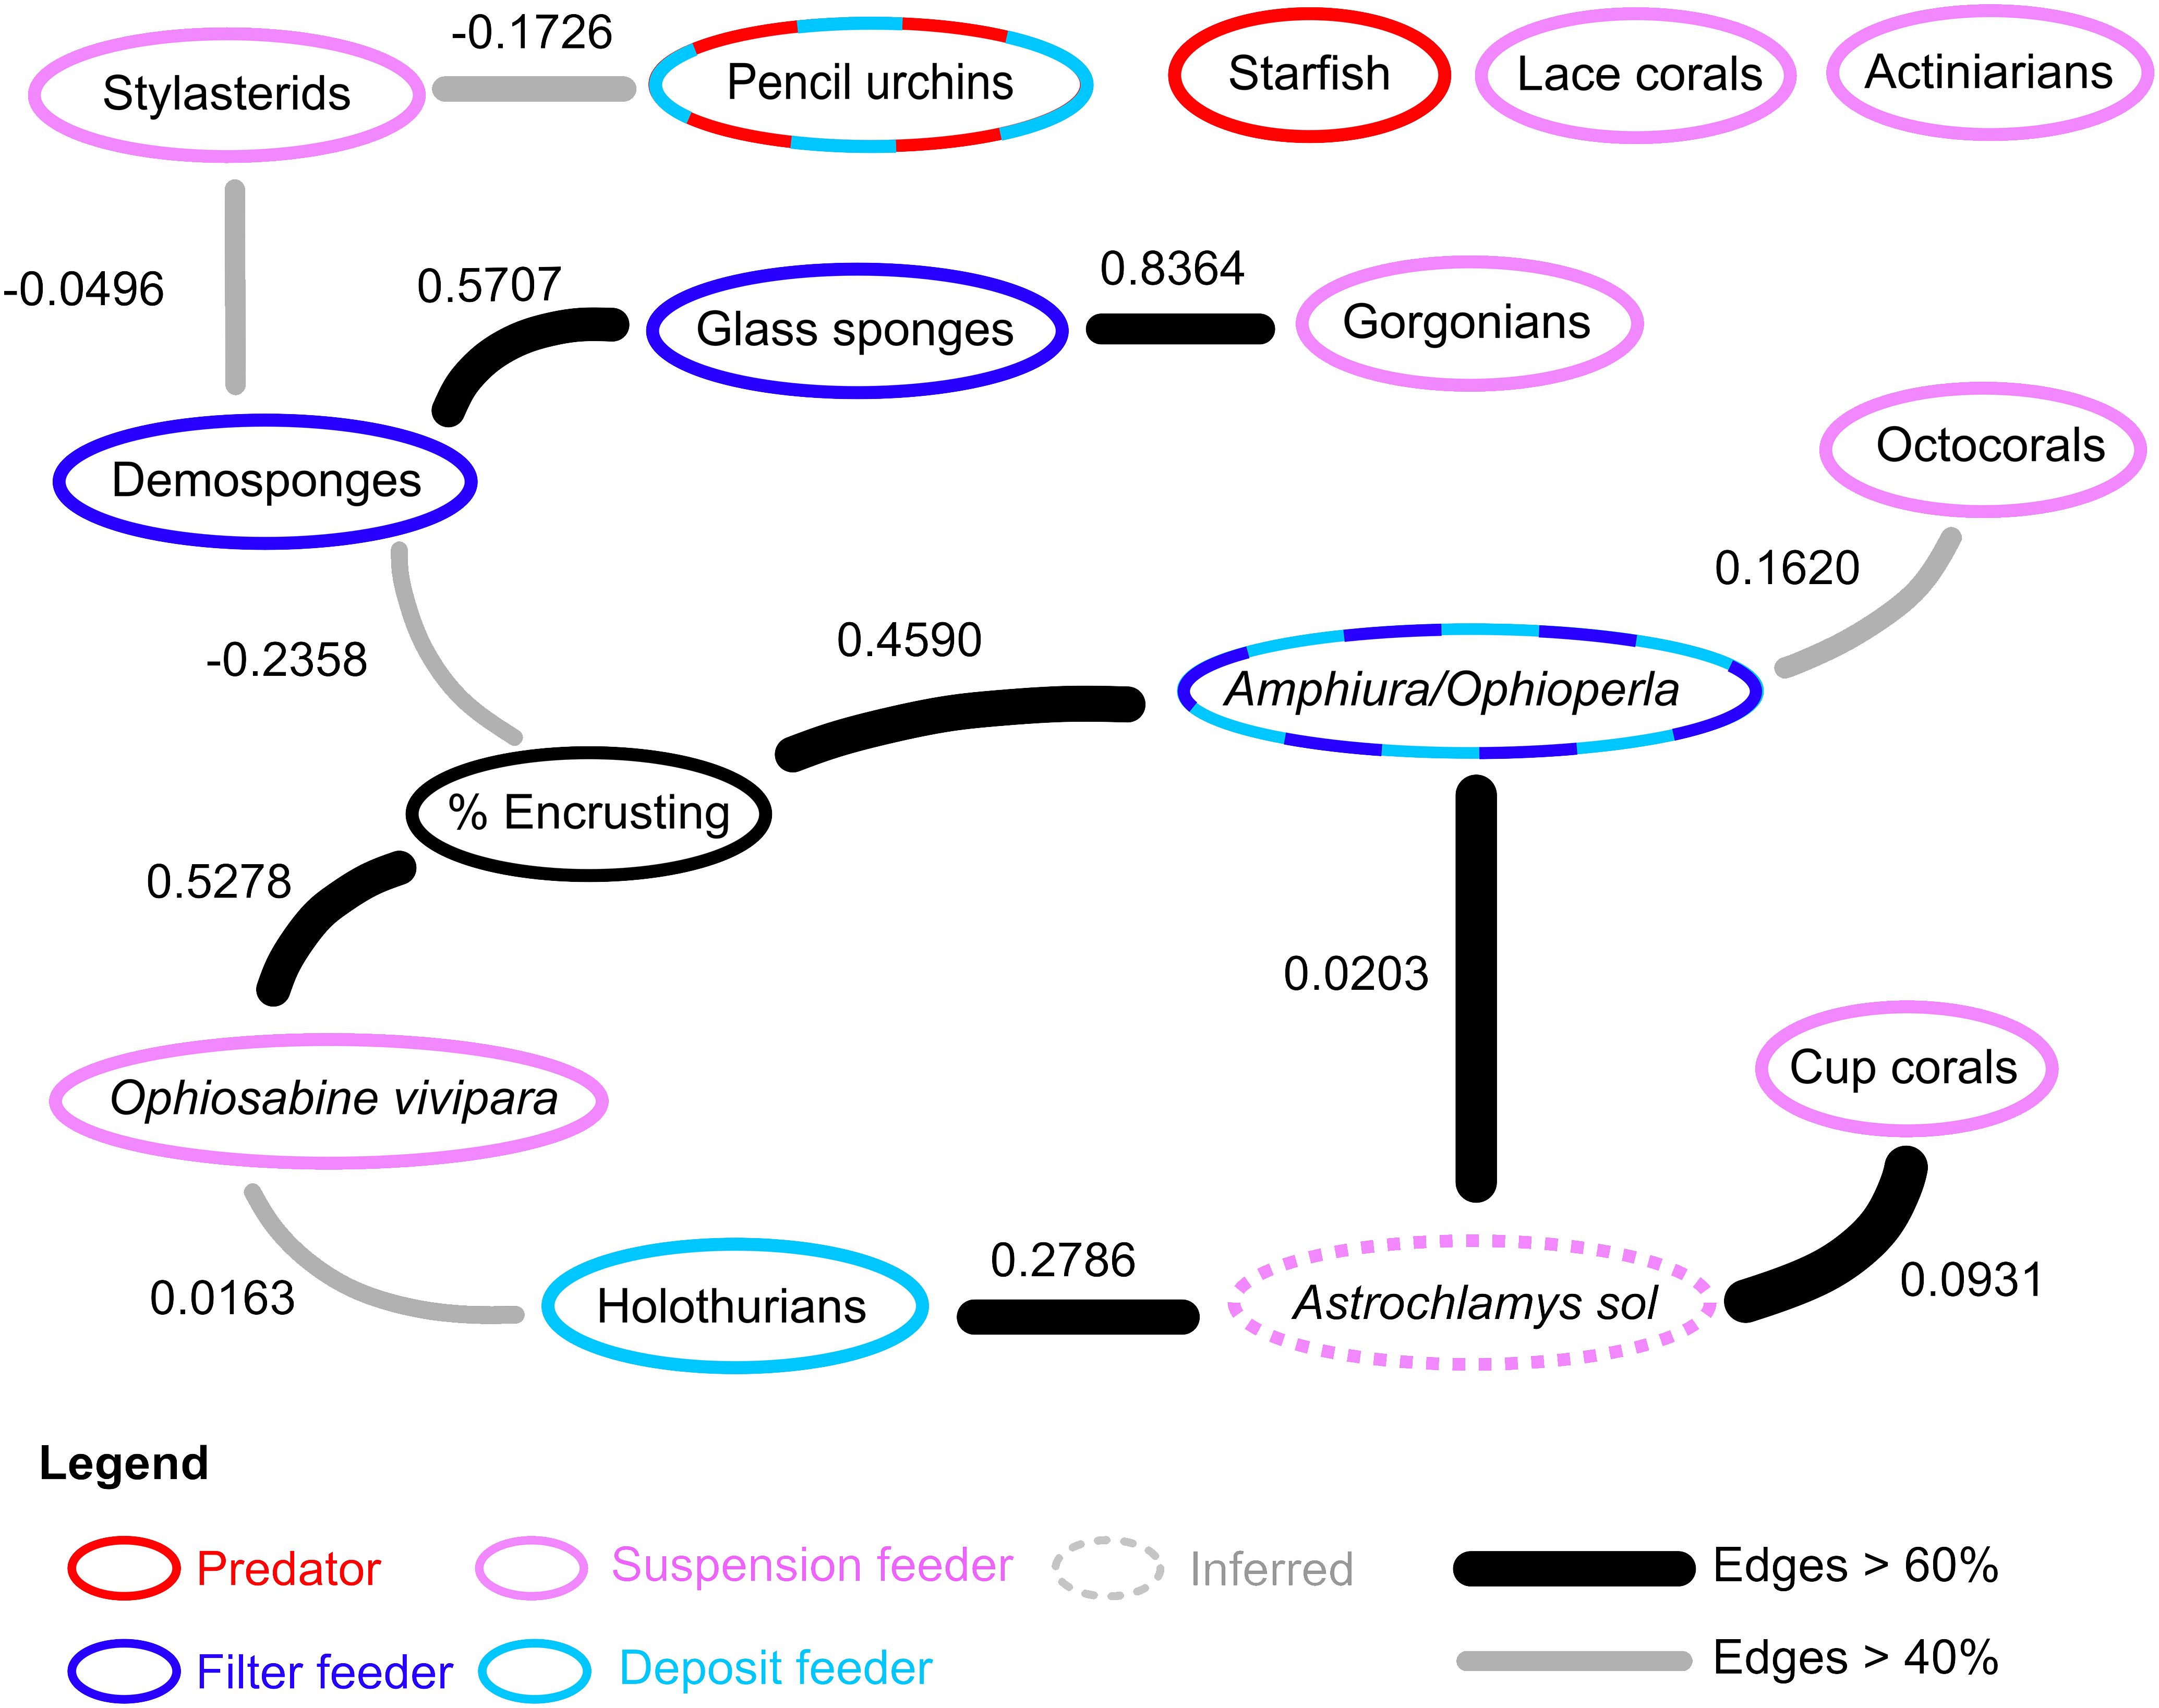
Figure 4 Ecological network in on the rocky Powell Basin slope. In the rocky substrates, 12 of the 15 studied nodes had associations with at least one other node. Nodes with dashed rings indicate diet plasticity or mixed feeding groups. Feeding behavior of Astrochlamys sol was inferred (dotted ring) from the snake star Astrotoma agassizzi. Suspension and filter feeding organisms (pink and blue rings) were mostly connected in the rocky network. Predatory starfish (red ring) were not connected to the rest of the ecological network.
Network properties for the Powell Basin are summarized in Table 2. Link density is defined as the mean number of edges per node (calculated as edges/number of nodes). Connectance is the number of realized interactions from the total possible number (calculated as edges/number of nodes2) (May, 1973). We present both link density and connectance calculated using all nodes, and connected nodes only, in Table 2.
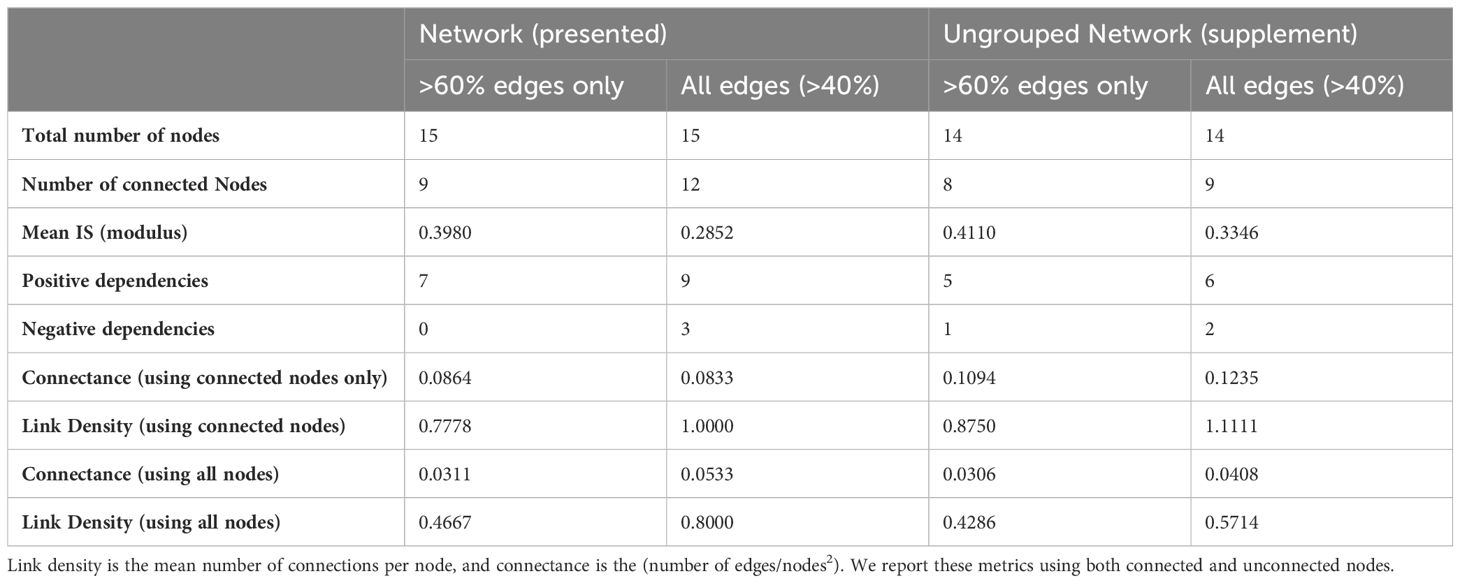
Table 2 Network properties of the presented Powell Basin slope network (Figure 4), and sensitivity network (Supplementary Figure 1).
In our networks, link density is less than 1 (Table 2), due to starfish, lace corals and actiniarians being unconnected from the lower probability (edge occurrence >40%) network, and stylasterids, pencil urchins, and octocorals further disconnected in the higher probability (edge occurrence >60%) network. Connectance, a measure of ecosystem complexity based on the number of associations found, is low (0.0533 for the lower probability network and 0.0311 for the higher probability network). These values increase as expected in the connected network, with connectance being 0.0833 for the lower probability network and 0.0864 for the higher probability network.
In contrast to the highly abundant Powell Basin slope, we observed far fewer animals in the shallow region of the Weddell Sea. In the muddy substrates of the Weddell Sea, we identified 1,041 individual animals from 49 morphotypes in 61 annotated photographs (Supplementary Data Sheet 2 and Supplementary Figure 3A). Photographs contained a median of 15 animals per photograph. The densest photograph contained 31 individual identifiable animals, while the least dense contained only five. The brittle star Ophionotus victoriae (Supplementary Figure 1) was the most commonly occurring morphotype and was present in 88% of the photographs. Sessile, suspension-feeding tunicates were also common, occurring in 76% of the photos, especially the solitary ascidian Pyura bouvetensis (Michaelsen, 1904) (present in 50% of the photos). A total of 32 dropstones were present in 20 of the photographs and always colonized by the epibenthos (Supplementary Figure 1). Observed invertebrate predators are O. victoriae, starfish, and mysids (Supplementary Figure 3B).
The Bayesian ecological network in the muddy substrates of the Antarctic Peninsula was largely unconnected: Of the 10 nodes observed, 8 did not have any edges (Supplementary Figure 4). Nodes with red rings indicate groups with predatory behavior. There was only one strong, positive connection between sponges and dropstones.
Our results, based on photographic evidence, in the Powell Basin slope suggest that a range of biological processes shape the community dynamics at the morphotype level. While BNI alone cannot determine the nature of interactions, we can interpret these pairwise associations in a biological and ecological context to infer the likely underlying processes (Milns et al., 2010; Spiers et al., 2016; Hui et al., 2022). A strong, positive association between the brittle star Ophiosabine vivipara and encrusting organisms, and between Amphiura/Ophioperla and encrusters, indicates spatial aggregation and may be due to shared habitat preferences. This aggregation may also be a facilitatory association, as brittle stars are generally suspension or filter feeders, but if needed, can employ other feeding strategies. Amphiura filter feeds on live plankton and detritus using small spines on their arms, but can also graze (Josefson, 1998), while Ophioperla is an opportunistic feeder (McClintock, 1994). Encrusting organisms with hard parts increase microscale topographic complexity and currents (Gutt and Starmans, 1998; Gutt et al., 2013b), and within the photographs brittle stars are observed to be anchoring themselves to the encrusters (Figure 2), possibly catching food particles with their free arms.
Positive associations between glass sponges and demosponges, and glass sponges and gorgonians, may also indicate aggregation due to shared habitat preferences, while negative associations between demosponges and stylasterid lace corals, and demosponges and encrusting organisms may indicate spatial segregation due to different habitat requirements or competitive exclusion, as all three groups require the direct availability of hard substrate.
In terms of the other network associations, the unbranched snake star Astrochlamys sol was connected to multiple edges (cup corals, holothurians and Amphiura/Ophioperla). The Astrochlamys-Amphiura/Ophioperla, and Astrochlamys-holothurians associations were more likely due to shared habitat preferences rather than trophic relationships. Little is known of A. sol’s feeding behavior, but they are unlikely to be eating other brittle stars or holothurians. Based on the feeding behavior of the closely related, much larger Euryalid snake star Astrotoma agassizzi (Lyman, 1875), which has also been documented in Antarctic waters, we inferred a suspension feeding ecology for Astrochlamys sol (Figure 4). Stomach contents analyses of A. agassizzi have indicated that their diet consists of pelagic copepods and chaetognath worms, and demersal mysids (Dearborn et al., 1986). For both taxa, the long unbranched arms are highly flexible, enabling them to climb upon and anchor themselves to organisms that project above the seafloor (Dearborn et al., 1986), such as cup corals (Figure 2), while the remaining free arms capture zooplankton and subsequently transfer them to the mouth (Dearborn et al., 1986). We therefore inferred the Astrochlamys-cup coral association to also be a facilitatory one.
Pairwise associations between nodes all combine to the ecosystem network, with the pattern of the edges within the network determining the ecosystem functioning. From our results (Figure 4) we can see that while important trophic guilds on the Powell Basin slope, such as suspension and filter feeders, are present in the network, there is no single taxa that shapes the network structure. This lack of a highly connected taxa may suggest a functional redundancy within this system.
Direct comparisons of our results with other benthic networks is limited by the paucity of similar studies. However, similar analyses have been used to assess benthic ecosystem structure in the South Orkney Islands (Mitchell et al., 2020b), which is a much shallower (500 m to 1000 m depth) Antarctic benthic system than this study. While the South Orkney Islands (SOI) network was assessed at a much coarser taxonomic resolution to the present study, network metrics enable a direct comparison. On the fine scale (between photographs) substrate type is the most important node, with direct relationships with sessile bryozoans, porifera, cnidarians and encrusting organisms, with mobile echinoderms depending on cnidaria (Figure 2, Mitchell et al., 2020b). Similarly, here we also detect the importance of substrate (albeit at a simpler scale) – hard substrates host a much greater density of organisms than soft, muddy substrates (Figure 3; Supplementary Figure 3A). In contrast to our Powell Basin network, the large scale network in the South Orkney Islands (Figure 3; Mitchell et al., 2020b) is shaped by a central node, Porifera, whose direct connections with the other taxa resulted in significant changes in modelled taxa abundance. Ecosystem complexity (as inferred by link density and connectance) is higher on the SOI than on the Powell Basin (link density 1.25 vs 0.8 and connectance of 0.179 vs 0.053), suggesting that the SOI are likely less vulnerable to changes than the Powell Basin because increased ecosystem complexity is highly correlated with resilience (Pimm, 1984; Hughes et al., 2005; O’Leary et al., 2017). However, because the SOI networks are highly vulnerable if Porifera are impacted, the Powell Basin could be more robust in terms of specific taxa threats.
Deep-water (4850m) epibenthic systems exhibited both similarities and differences in terms of ecosystem structure compared to both the shallow and deep water Antarctic BNs. The two Porcupine Abyssal Plain communities exhibited similar structure to the Powell Basin BN in terms of edge distribution with no central taxa (Figure 2, Mitchell et al., 2020a), suggesting high functional redundancy on the abyssal plain, similar to our observed Powell Basin network (Figure 4, Table 2). They did, however, have greater complexity than the Powell Basin (connectance: 0.1224 and 0.1124; link densities: 0.8571 and 1.4615). The Porcupine Abyssal hill network has similarities with the SOI networks, with a strong dependence on a single morphotype: Ophiuroids (Figure 2, Mitchell et al., 2020a) and similar levels of complexity to the Powell Basin (connectance: 0.0586, link density: 0.9375). The Abyssal Hill and SOI ecosystems have higher nutrient flow that the Abyssal Plains and Powel Basin ecosystems (Durden et al., 2020), suggesting that food availability may lead to the dominance of single taxa within the networks. While more complex, these networks have single points of vulnerability in contrast to the Abyssal Plain and Powell Basin communities, which potentially have more functional redundancy. As such, our Powell Basin system, the SOI and the Porcupine Abyssal Plains will likely have different responses to future changes.
Mobile invertebrate predators, like starfish, were included in the network analyses but did not contribute to the structure of the ecological network in the rocky substrates (Figure 4). This lack of association suggests that on the Powell Basin slope, starfish may not be contributing to the structure of the ecosystem. Experimental studies on starfish ecology in the shallow benthos, especially in the McMurdo Sound, have shown that sympatry is necessary for starfish to predate on its prey (Dayton et al., 1974; McClintock, 1994; Cerrano et al., 2000; McClintock et al., 2008), and that the starfish Odontaster validus can be said to have “keystone” status (Dayton et al., 1974; McClintock et al., 2008). O. validus was rare in our observations (because it is generally a shallow water taxon); Solaster and Hymenaster, which can be found in very deep water, were more common. Even so, our discretization process allowed for starfish to have keystone status, since they were equally weighted against all other nodes. Since sympatry is deemed necessary, for starfish predator-prey interactions to be an ecosystem structuring role, we would have expected to see positive associations between starfish and other morphotaxa in our ecosystem network structure. One analyzed photograph contains an unusually high number of starfish (14). This photo is unusual because it is one of the very few in situ observations of a feeding aggregation on a deep sea food fall in the Southern Ocean (Stauffer et al., 2022). We tested our network both with and without this photograph and found that inclusion or exclusion of this anomalously high starfish count does not change the ecological network structure.
On the Powell Basin slope, we could also expect to see predatory relationships between mobile cidarid urchins and some sessile taxa, as stomach content analyses on cidarids in the Weddell Sea have demonstrated that, in addition to deposit feeding, they also prey on sponges, bryozoans and other sessile taxa (Jacob et al., 2003). However, in our network, there was no association between pencil urchins and abundant potential prey sources (Figure 4), suggesting any predation by urchins was random and non-specific. We detected one unusual relationship between cidarid pencil urchins and stylasterids (Figure 4). Stylasterid lace corals lack the soft tissue that is usually preyed upon, but cidarids’ unique Aristotle’s lantern feeding apparatus permits flexibility regarding the hardness of food items (Jacob et al., 2003), so the network association between urchins and stylasterids is surprising, as it is not a predatory one. This interaction was weak (demonstrated by the low influence score, -0.1726), was not widespread (detected in fewer than 60% of the networks (grey edge, Figure 4)), and was negative, suggesting weak avoidance rather than preferential feeding.
All other invertebrate predators in the rocky substrates, such as pycnogonids, the nudibranch Doris, and the single nemertean worm, were too rare to be included in our methodology (i.e., they were extremely zero-heavy groups, occurring only in 9 photos), and thus predation by them was unlikely to play any major role in shaping the community. While we record a general rarity of invertebrate predators on the Powell Basin slope, we do not know the reason for this absence.
From our findings and given the absence of other forms of evidence, our null hypothesis, which predicted that starfish predation would be an ecosystem structuring role at small spatial scales, cannot be supported. This rejection could have crucial implications for benthic ecosystem functioning on the Powell Basin slope. The absence of durophagous predators in the Antarctic is generally attributed to glaciation (Aronson et al., 2009), but climate change and ocean warming may open up habitats to currently excluded predators. It is important to note that causal connections between global cooling and reduction in durophagy cannot be drawn, as durophagous predation remains strong in the modern Arctic (Aronson and Blake, 2001), and lithodid crabs have persisted in Antarctic waters warmer than 1.4°C (Griffiths et al., 2013). The deep-water Powell Basin community studied here is much colder than the observed present-day thermal tolerance of lithodid crabs in the Southern Ocean. However, anomuran crabs and lobsters have been observed as deep as 3 km down in the warmer regions of the Southern Ocean (Griffiths et al., 2013), often in large numbers (Smith et al., 2012), and may have an influence on communities in those regions. As climate change continues to warm the waters around Antarctica, it is presently unknown what impact a potential range expansion of crabs and lobsters might have (Avila et al., 2022), but it is likely that ecosystem will change significantly.
The use of seafloor imagery enables us to survey large areas of seafloor in situ and in a non-destructive way. However, photographic data alone lacks information that enables the accurate identification of most taxa to species or even genus level. For example, species-level identification is particularly difficult in Antarctica, because fewer than 50% of Antarctic benthic species have been collected more than once or twice (Clarke et al., 2007) and most species lack ecologically important information such as diet, reproductive mode, growth and maturity rates, and habitat preferences. Where such information is unavailable it must be inferred or assumed based upon existing knowledge from related taxa. Of the morphotypes we identified (Supplementary Data Sheet 1, Supplementary Table 2), traits can be reasonably inferred for some of the inferred taxa based on documented occurrences elsewhere in the Southern Ocean. For some groups general feeding or reproductive strategies can be assumed from overarching patterns in better studied species, e.g. filter or suspension feeding in sessile sponges (such as for our groups: glass sponges and demosponges) and cnidarians (our groups of stylasterid lace corals, lace corals, cup corals, octocorals, gorgonians, and actiniarians). Other groups with more varied traits, e.g. echinoderms (urchins, brittle stars, starfish and holothurians and malacostracans) encompass high species numbers with diverse and often plastic behaviors and lifestyles that are unlikely to be well represented by a single set of traits. These plastic behaviors and lifestyles means that it might not be possible to pinpoint the underlying process of any associations found relating to that group. These diverse traits could also mean that, for some rarer species incorporated into larger groupings, strong associations and ecological connections might be missed or give the impression of an association for the whole group, rather than for the individual rare species.
Within our brittle star groupings, morphologically distinct organisms such as the brittle stars Astrochlamys sol (Mortensen, 1936) and Ophiosabine vivipara (Ljungman, 1871), both having greater number of arms than their closest related species in the Antarctic, are referred to by name. Other brittle stars, likely of the genera Amphiura (Forbes, 1843) or Ophioperla (Koehler, 1912) are considered together as “Amphiura/Ophioperla” as they are difficult to distinguish from photographs and often require microscopic examination. These two brittle stars have different feeding modes (Figure 4), so our resulting network could be picking up only the associations from the dominant group (whether it is Amphiura or Ophioperla), or if the specimens in our group are evenly mixed we are likely picking up the shared habitat associations and/or shared feeding, but are likely to miss any opportunistic feeding from Ophioperla.
The resolution and scale of the photographs used impacts the size of individual organisms that can be detected and identified from images. Despite Antarctica being known for gigantism within benthic invertebrates, most taxa from common groups such as arthropods, mollusks, and polychaetes would be undetected or excluded from this type of analysis. Our category “encrusters” is likely a mix of multiple small taxa and different types of encrusting organisms. The complex three-dimensional nature of benthic habitats also means that many animals will not be visible to the camera, and this might be further biased by habitat preferences in some taxa, e.g. organisms that live inside sponges or on the underside of boulders. These unaccounted-for taxa, both small and hidden, undoubtably play important roles within the ecosystem that are impossible to quantify from photographs alone.
Mobile organisms provide a challenge because their position can be constantly changing. The use of images to capture a single snapshot in time may introduce a bias depending on the mobility and behavior of the organisms involved. Slow moving organisms, such as echinoderms (urchins, brittle stars, starfish and holothurians), are unlikely to have dramatically different distributions over time and do not have time to react to the lights and disturbance from the camera system. Some highly mobile nototheniid fishes can be attracted by the light from the OFOBS (and so found in photographs), while others may intentionally avoid it (La Mesa et al., 2022). As such, it is uncertain the extent to which the fish abundance in the photographic data represents the true population, so due to this limitation we exclude fishes from our study and focus instead on sessile and slower moving taxa only.
Unlike in the rocky Powell Basin, we observe an even simpler network in the muddy substrates of the western Weddell Sea (Supplementary Figure 4). In the Antarctic Peninsula, we saw very limited evidence of associations in the network, with only a single strong connection between dropstones and sponges detected. Dropstones increase habitat heterogeneity by providing a hard substrate for epibenthic organisms to colonize in both the Antarctic (Ziegler et al., 2017; Post et al., 2020) and the Arctic (Hasemann et al., 2013). Dropstones have been described as “key habitats” (Post et al., 2020) and “island habitats” (Ziegler et al., 2017). The association between sponges and dropstones was therefore not unexpected and can also be observed in the OFOBS photographs (Supplementary Figure 1).
Other associations, however, were not detected, despite invertebrate predatory organisms being included in the network. This lack of detection may have been because the association between the morphotypes is too weak to be detected by our methods given our sample size. Furthermore, associations between the morphotypes may be occurring at a much larger spatial scale than currently studied (>32 m). Therefore, the lack of edges is not conclusive evidence of lack of biological associations, and could also be due to the nature of photographic surveys, where a large section of the benthic community may actually be completely unsampled.
Photo and video surveys can only survey the macro to mega epibenthic members of a benthic community. Any organism that dwells within the mud – i.e., the infaunal component – will generally not be visible in photographic observations. This lack of visibility means that any ecological associations between the infaunal and epibenthic members of the community cannot be ascertained through photographic means. Whether infauna are present can only be fully answered through trawling, dredging and coring. BNI analyses on photographic observations in muddy areas are therefore limited and so ideally should be used in tandem with trawled/dredged/cored observations to ensure the complete community is sampled.
Photographic surveys on hard substrate communities enable a near-census observation of the community because of the lack of a soft sediment component, and a dark background, makes organisms more visible. Sessile taxa are easily recorded and slow moving vagile taxa such as starfish and pencil urchins are also photographed easily. Continuous video recordings show that vagile taxa do not move fast enough to avoid being photographed. However, some sampling incompleteness does exist as small mobile organisms such as crustaceans are unlikely to be photographed as the camera maintains distance from the jagged surface, and larger, sessile fauna can obscure smaller fauna sheltering within or behind them, from view. Nonetheless, photographic imagery remains the best data source for deep and rocky bottomed habitats, where infauna are rare, and other places where physical organism sampling is impossible.
In the rocky slope Antarctic epibenthic communities studied here, we found that there was no single process or taxa that shaped community dynamics, with the even distribution of associations amongst the taxa suggesting that there may be some functional redundancy to epibenthic communities on the Powell Basin slope. The epibenthic community had an ecological structure that was dominated by filter and suspension feeders and while invertebrate predators such as starfish, pycnogonids and nudibranchs were present in the community in low numbers, they did not contribute to the ecological network structure at this meter-level spatial scale. This lack of interaction suggests that predator-prey associations were unlikely to play an ecosystem structuring role here, and instead invertebrate predation likely is an opportunistic process. Our results show a different sort of ecosystem dynamics to shallow water Antarctic epibenthic communities, suggesting they may be more vulnerable to the introduction of novel predators as waters around Antarctica continue warming.
The datasets presented in this study can be found in online repositories. The names of the repository/repositories and accession number(s) can be found in the article/Supplementary Material.
TK: Conceptualization, Formal Analysis, Investigation, Methodology, Visualization, Writing – original draft, Writing – review & editing. HG: Conceptualization, Investigation, Supervision, Visualization, Writing – original draft, Writing – review & editing. RW: Conceptualization, Supervision, Visualization, Writing – original draft, Writing – review & editing, Investigation. NS: Investigation, Methodology, Writing – original draft, Writing – review & editing. KD: Investigation, Methodology, Writing – original draft, Writing – review & editing. AP: Data curation, Resources, Writing – original draft, Writing – review & editing. AM: Conceptualization, Methodology, Supervision, Visualization, Writing – original draft, Writing – review & editing, Investigation. EM: Conceptualization, Investigation, Methodology, Resources, Supervision, Visualization, Writing – original draft, Writing – review & editing, Funding acquisition.
The author(s) declare financial support was received for the research, authorship, and/or publication of this article. This work has been supported by Natural Environment Research Council (NERC) Independent Research Fellowship NE/S014756/1, awarded to EM. TK is funded by a Cambridge International and Newnham College Scholarship, administered by Cambridge Trust. RW and HG are funded by UK Research and Innovation (UKRI) Future Leaders Fellowship MR/W01002X/1 “The past, present and future of unique cold-water benthic (seafloor) ecosystems in the Southern Ocean” awarded to RW. HG is also funded by BIOPOLE, funded by the NERC, part of UKRI, under the National Capability Science Multi-Centre award scheme (NC-SM2).
We thank all members of crew and participants of the RV Polarstern Expedition PS118, Laura Hehemann, Simon Dreutter, Boris Dorschel, and Axel Nordhausen for operating OFOBS and making photos available. We also thank Michelle Taylor, Christopher Mah, Estefania Rodriguez and Louise Allcock for helping us ID some specimens.
The authors declare that the research was conducted in the absence of any commercial or financial relationships that could be construed as a potential conflict of interest.
All claims expressed in this article are solely those of the authors and do not necessarily represent those of their affiliated organizations, or those of the publisher, the editors and the reviewers. Any product that may be evaluated in this article, or claim that may be made by its manufacturer, is not guaranteed or endorsed by the publisher.
The Supplementary Material for this article can be found online at: https://www.frontiersin.org/articles/10.3389/fmars.2024.1408828/full#supplementary-material
Aronson R. B., Blake D. B. (2001). Global climate change and the origin of modern benthic communities in Antarctica. Am. Zool. 41, 27–39. doi: 10.1093/icb/41.1.27
Aronson R. B., Moody R. M., Ivany L. C., Blake D. B., Werner J. E., Glass A. (2009). Climate change and trophic response of the antarctic bottom fauna. PloS One 4, e4385. doi: 10.1371/journal.pone.0004385
Aronson R. B., Thatje S., Clarke A., Peck L. S., Blake D. B., Wilga C. D., et al. (2007). Climate change and invasibility of the antarctic benthos. Annu. Rev. Ecol. Evol. Syst. 38, 129–154. doi: 10.1146/annurev.ecolsys.38.091206.095525
Avila C., Buñuel X., Carmona F., Cotado A., Sacristán-Soriano O., Angulo-Preckler C. (2022). Would antarctic marine benthos survive alien species invasions? What chemical ecology may tell us. Mar. Drugs 20, 543. doi: 10.3390/md20090543
Avila C., Taboada S., Núñez-Pons L. (2008). Antarctic marine chemical ecology: what is next? Mar. Ecol. 29, 1–71. doi: 10.1111/j.1439-0485.2007.00215.x
Bell F. J. (1902). Reports on the collections of natural history made in the antarctic regions during the voyage of the “Southern cross”. VIII. Echinoderma 214-220, 2 pl.
Belgrad B. A., Griffen B. D. (2016). Predator–prey interactions mediated by prey personality and predator hunting mode. Proc. R. Soc B Biol. Sci. 283, 20160408. doi: 10.1098/rspb.2016.0408
Bergh R. (1886). Report on the marseniadae collected by H.M.S. challenger during the years 1873-1876. report on the scientific results of the voyage of H.M.S. challenger during the years 1873–76. Zoology 15 (part 41), 1–24.
Bernard A., Hartemink A. J. (2006). Evaluating algorithms for learning biological networks. In DIMACS Workshop on Dialogue on Reverse Engineering Assessment and Methods (DREAM).
Brandt A., De Broyer C., Gooday A. J., Hilbig B., Thomson M. R. A. (2004). Introduction to ANDEEP (ANtarctic benthic DEEP-sea biodiversity: colonization history and recent community patterns)—a tribute to Howard L. Sanders. Deep Sea Res. Part II Top. Stud. Oceanogr. 51, 1457–1465. doi: 10.1016/j.dsr2.2004.08.006
Brandt A., Ebbe B., Gooday A. J. (2007). Introduction to ANDEEP, summary and outlook. Deep Sea Res Part II: Top Stud Oceanogr. 4 (16-17), 1645–1651. doi: 10.1016/j.dsr2.2007.07.001
Brasier M. J., Grant S. M., Trathan P. N., Allcock L., Ashford O., Blagbrough H., et al. (2018). Benthic biodiversity in the South Orkney Islands southern shelf marine protected area. Biodiversity 19, 5–19. doi: 10.1080/14888386.2018.1468821
Caputi S. S., Careddu G., Calizza E., Fiorentino F., Maccapan D., Rossi L., et al. (2020). Seasonal food web dynamics in the antarctic benthos of tethys bay (Ross sea): implications for biodiversity persistence under different seasonal sea-ice coverage. Front. Mar. Sci. 7. doi: 10.3389/fmars.2020.594454
Cerrano C., Bavestrello G., Calcinai B., Cattaneo-Vietti R., Sarà A. (2000). Asteroids eating sponges from Tethys Bay, East Antarctica. Antarct. Sci. 12, 425–426. doi: 10.1017/S095410200000050X
Clarke A., Griffiths H. J., Linse K., Barnes D. K. A., Crame J. A. (2007). How well do we know the Antarctic marine fauna? A preliminary study of macroecological and biogeographical patterns in Southern Ocean gastropod and bivalve molluscs. Divers. Distrib. 13, 620–632. doi: 10.1111/j.1472-4642.2007.00380.x
Crame J. A., Beu A. G., Ineson J. R., Francis J. E., Whittle R. J., Bowman V. C. (2014). The early origin of the antarctic marine fauna and its evolutionary implications. PloS One 9, e114743. doi: 10.1371/journal.pone.0114743
Dayton P. K., Robilliard G. A., Paine R. T., Dayton L. B. (1974). Biological accommodation in the benthic community at McMurdo Sound, Antarctica. Ecol. Monogr. 44, 105–128. doi: 10.2307/1942321
Dearborn J. H., Ferrari F. D., Edwards K. C. (1986). “Can pelagic aggregations cause benthic satiation? Feeding biology of the Antarctic brittle star Astrotoma agassizii (Echinodermata: Ophiuroidea),” in Antarctic Research Series. Ed. Kornicker S. (American Geophysical Union, Washington, D. C.), 1–28. doi: 10.1029/AR044p0001
Dorschel B. (2019). “The expedition PS118 of the research vessel POLARSTERN to the weddell sea in 2019,” in Berichte zur Polar- und Meeresforschung = Reports on Polar and Marine Research (Alfred-Wegener-Institut, Helmholtz-Zentrum für Polar- und Meeresforschung). doi: 10.2312/BZPM_0735_2019
Dowdeswell J. A., Bamber J. L. (2007). Keel depths of modern Antarctic icebergs and implications for sea-floor scouring in the geological record. Mar. Geol. 243, 120–131. doi: 10.1016/j.margeo.2007.04.008
Durden J. M., Bett B. J., Ruhl H. A. (2020). Subtle variation in abyssal terrain induces significant change in benthic megafaunal abundance, diversity, and community structure. Prog. Oceanogr. 186, 102395. doi: 10.1016/j.pocean.2020.102395
Feldmann R. M., Quilty P. G. (1997). First Pliocene decapod crustacean (Malacostraca: Palinuridae) from the Antarctic. Antarct. Sci. 9, 56–60. doi: 10.1017/S0954102097000084
Fisher W. K. (1928). Asteroidea of the north pacific and adjacent waters. part 2. forcipulata (part). Bull. United States Natl. Museum. 76, 1–245.
Forbes E. (1839). On the asteriadae of the irish sea. Memoirs Wernerian Natural History Soc. Edinburgh. 8, 114–129.
Forbes E. (1843). XVIII. on the radiata of the eastern mediterranean. part i., ophiuridæ. Trans. Linn. Soc. London 19 (2), 143–153.
Gil J. M. R. (2004). hallow-water mega-epibenthic communities in the high Antarctic (Weddell Sea) and the west coast of the Antarctic Peninsula. (Doctoral dissertation, Universität Bremen).
Gili J.-M., Coma R., Orejas C., López-González P., Zabala M. (2001). Are Antarctic suspension-feeding communities different from those elsewhere in the world? Polar Biol. 24, 473–485. doi: 10.1007/s003000100257
Gosse P. H. (1859). Characters and descriptions of some new british sea-anemones. Ann. Magazine Natural History. 3 (3), 46–50.
Gray J. E. (1857). Synopsis of the families and genera of axiferous zoophytes or barked corals. Proc. Zoological Soc. London. 25 (1), 278–294.
Gray J. E. (1870). Catalogue of lithophytes or stony corals in the collection of the british museum. 1–51.
Griffiths H. J. (2010). Antarctic marine biodiversity – what do we know about the distribution of life in the southern ocean? PloS One 5, e11683. doi: 10.1371/journal.pone.0011683
Griffiths H. J., Barnes D. K. A., Linse K. (2009). Towards a generalized biogeography of the Southern Ocean benthos. J. Biogeogr. 36, 162–177. doi: 10.1111/j.1365-2699.2008.01979.x
Griffiths H. J., Whittle R. J., Roberts S. J., Belchier M., Linse K. (2013). Antarctic crabs: invasion or endurance? PloS One 8, e66981. doi: 10.1371/journal.pone.0066981
Gutt J. (2006). Coexistence of macro-zoobenthic species on the Antarctic shelf: An attempt to link ecological theory and results. Deep Sea Res. Part II Top. Stud. Oceanogr. 53, 1009–1028. doi: 10.1016/j.dsr2.2006.02.012
Gutt J., Arndt J., Kraan C., Dorschel B., Schröder M., Bracher A., et al. (2019). Benthic communities and their drivers: A spatial analysis off the Antarctic Peninsula. Limnol. Oceanogr. 64, 2341–2357. doi: 10.1002/lno.11187
Gutt J., Barnes D., Lockhart S. J., Van De Putte A. (2013a). Antarctic macrobenthic communities: A compilation of circumpolar information. Nat. Conserv. 4, 1–13. doi: 10.3897/natureconservation.4.4499
Gutt J., Griffiths H. J., Jones C. D. (2013b). Circumpolar overview and spatial heterogeneity of Antarctic macrobenthic communities. Mar. Biodivers. 43, 481–487. doi: 10.1007/s12526-013-0152-9
Gutt J., Starmans A. (1998). Structure and biodiversity of megabenthos in the Weddell and Lazarev Seas (Antarctica): ecological role of physical parameters and biological interactions. Polar Biol. 20, 229–247. doi: 10.1007/s003000050300
Hasemann C., Bergmann M., Kanzog C., Lochthofen N., Sauter E., Schewe I., et al. (2013). Effects of dropstone-induced habitat heterogeneity on Arctic deep-sea benthos with special reference to nematode communities. Mar. Biol. Res. 9, 229–245. doi: 10.1080/17451000.2012.739694
Heckerman D. (1995). Learning bayesian networks: the combination of knowledge and statistical data. Mach. Learn 20, 197–243. doi: 10.1023/A:1022623210503
Hughes T., Bellwood D., Folke C., Steneck R., Wilson J. (2005). New paradigms for supporting the resilience of marine ecosystems. Trends Ecol. Evol. 20, 380–386. doi: 10.1016/j.tree.2005.03.022
Hui E., Stafford R., Matthews I. M., Smith V. A. (2022). Bayesian networks as a novel tool to enhance interpretability and predictive power of ecological models. Ecol. Inform. 68, 101539. doi: 10.1016/j.ecoinf.2021.101539
Hunt Gl G., Heinemann D., Everson I. (1992). Distributions and predator-prey interactions of macaroni penguins, Antarctic fur seals, and Antarctic krill near Bird Island, South Georgia. Mar. Ecol. Prog. Ser. 86, 15–30. doi: 10.3354/meps086015
Jacob U., Terpstra S., Brey T. (2003). High-Antarctic regular sea urchins – the role of depth and feeding in niche separation. Polar Biol. 26, 99–104. doi: 10.1007/s00300-002-0453-0
Josefson A. B. (1998). “Resource limitation in marine soft sediments — differential effects of food and space in the association between the brittle-star Amphiura filiformis and the bivalve Mysella bidentata?,” in Recruitment, Colonization and Physical-Chemical Forcing in Marine Biological Systems. Eds. Baden S., Phil L., Rosenberg R., Strömberg J.-O., Svane I., Tiselius P. (Springer Netherlands, Dordrecht), 297–305. doi: 10.1007/978-94-017-2864-5_24
Kirkpatrick R. (1907). XXXIX.–preliminary report on the monaxonellida of the national antarctic expedition. J. Natural History 20 (117), 271–291.
Koehler R. (1901). Expédition antarctique belge. resultats du voyage du SY “Belgica”. zoologie; echinides et ophiures.
Koehler R. (1907). Astéries, ophiures et echinides recueillis dans les mers australes par la" Scotia"(1902-1904).
Koehler R. (1912). “). echinodermes (Asteries, ophiures et echinides),” in Deuxième expèdition antarctique francaise 1908-1910 j. charcot. masson et cie, paris, 1–277.
Koehler R. (1920). “Echinodermata: Asteroidea,” in Scientific reports of the australiasian antarctic expedition, vol. C8. , 1–308.
Lamarck J. B. (1801). Système des animaux sans vertèbres, ou tableau général des classes, des ordres et des genres de ces animaux; présentant leurs caractères essentiels et leur distribution, d'apres la considération de leurs rapports naturels et de leur organisation, et suivant l'arrangement établi dans les galeries du muséum d'Histoire naturelle, parmi leurs dépouilles conservées; précédé du discours d'ouverture du cours de zoologie, donné dans le muséum national d'Histoire naturelle l'an 8 de la république (Paris: Deterville), viii + 432.
La Mesa M., La Mesa G., Piepenburg D., Gutt J., Eastman J. T. (2022). Spatial patterns and behaviour of notothenioid fishes off the northern Antarctic Peninsula. Polar Biol. 45, 971–985. doi: 10.1007/s00300-022-03047-y
Linnaeus C. (1758). “Systema naturae per regna tria naturae, secundum classes, ordines, genera, species, cum characteribus, differentiis, synonymis, locis,” in Editio decima, reformata [10th revised edition], vol. 1. (Holmiae: Laurentius Salvius), 824.
Ljungman A. V. (1870). “Om tvänne nya arter ophiurider,” in Öfversigt af kongl, vol. 27. (Stockholm: Vetenskaps-Akademiens Förhandlingar), 471–475.
López M., Coutinho R., Ferreira C., Rilov G. (2010). Predator–prey interactions in a bioinvasion scenario: differential predation by native predators on two exotic rocky intertidal bivalves. Mar. Ecol. Prog. Ser. 403, 101–112. doi: 10.3354/meps08409
Lyman T. (1875). Zoological results of the hassler expedition. 2. ophiuridae and astrophytidae. illustrated catalogue of the museum of comparative zoology at harvard college, Vol. 8. 1–34.
Marina T., Schloss I., Lovrich G., Boy C., Bruno D., Capitanio F., et al. (2024). Complex network of trophic interactions in Burdwood Bank, a sub-Antarctic oceanic marine protected area. Mar. Ecol. Prog. Ser. 736, 1–18. doi: 10.3354/meps14600
May R. M. (1973). Qualitative stability in model ecosystems. Ecology 54, 638–641. doi: 10.2307/1935352
McClintock J. (1994). Trophic biology of Antarctic shallow-water echinoderms. Mar. Ecol. Prog. Ser. 111, 191–202. doi: 10.3354/meps111191
McClintock J. B., Angus R. A., Ho C., Amsler C. D., Baker B. J. (2008). A laboratory study of behavioral interactions of the Antarctic keystone sea star Odontaster validus with three sympatric predatory sea stars. Mar. Biol. 154, 1077–1084. doi: 10.1007/s00227-008-1001-4
McIntosh W. C. (1876). XXXI.–descriptions of some new species of annelida from kerguelen's island. J. Natural History 17 (100), 318–323.
Michaelsen J. W. (1904). Die stolidobranchiaten ascidien der deutschen tiefsee-expedition (Verlag von Gustav Fischer).
Milns I., Beale C. M., Smith V. A. (2010). Revealing ecological networks using Bayesian network inference algorithms. Ecology 91, 1892–1899. doi: 10.1890/09-0731.1
Mitchell E. G., Durden J. M., Ruhl H. A. (2020a). First network analysis of interspecific associations of abyssal benthic megafauna reveals potential vulnerability of abyssal hill community. Prog. Oceanogr. 187, 102401. doi: 10.1016/j.pocean.2020.102401
Mitchell E. G., Harris S. (2020). Mortality, population and community dynamics of the glass sponge dominated community “The forest of the weird” From the ridge seamount, Johnston Atoll, Pacific Ocean. Front. Mar. Sci. 7. doi: 10.3389/fmars.2020.565171
Mitchell E. G., Harris S., Kenchington C. G., Vixseboxse P., Roberts L., Clark C., et al. (2019). The importance of neutral over niche processes in structuring Ediacaran early animal communities. Ecol. Lett. 22, 2028–2038. doi: 10.1111/ele.13383
Mitchell E. G., Wallace M. I., Smith V. A., Wiesenthal A. A., Brierley A. S. (2021). Bayesian Network Analysis reveals resilience of the jellyfish Aurelia aurita to an Irish Sea regime shift. Sci. Rep. 11 (1), 3707. doi: 10.1038/s41598-021-82825-w
Mitchell E. G., Whittle R. J., Griffiths H. J. (2020b). Benthic ecosystem cascade effects in Antarctica using Bayesian network inference. Commun. Biol. 3, 582. doi: 10.1038/s42003-020-01310-8
Moles J., Núñez-Pons L., Taboada S., Figuerola B., Cristobo J., Avila C. (2015). Anti-predatory chemical defences in Antarctic benthic fauna. Mar. Biol. 162, 1813–1821. doi: 10.1007/s00227-015-2714-9
Nelson W. (1981). Experimental studies of decapod and fish predation on seagrass macrobenthos. Mar. Ecol. Prog. Ser. 5, 141–149. doi: 10.3354/meps005141
O’Leary J. K., Micheli F., Airoldi L., Boch C., De Leo G., Elahi R., et al. (2017). The resilience of marine ecosystems to climatic disturbances. BioScience 67, 208–220. doi: 10.1093/biosci/biw161
Oliver J. S., Slattery P. N. (1985). Effects of crustacean predators on species composition and population structure of soft-bodied infauna from McMurdo sound, Antarctica. Ophelia 24, 155–175. doi: 10.1080/00785326.1985.10429725
Paine R. T. (1966). Food web complexity and species diversity. Am. Nat. 100, 65–75. doi: 10.1086/282400
Paine R. T. (1969). The Pisaster-tegula interaction: prey patches, predator food preference, and intertidal community structure. Ecology 50, 950–961. doi: 10.2307/1936888
Pearson R. G., Dawson T. P. (2003). Predicting the impacts of climate change on the distribution of species: are bioclimate envelope models useful? Glob. Ecol. Biogeogr. 12, 361–371. doi: 10.1046/j.1466-822X.2003.00042.x
Pimm S. L. (1984). The complexity and stability of ecosystems. Nature 307, 321–326. doi: 10.1038/307321a0
Post A. L., Lavoie C., Domack E. W., Leventer A., Fernandez R. (2020). “Dropstones on a glaciated continental shelf as key habitat, Sabrina Shelf, East Antarctica,” in Seafloor Geomorphology as Benthic Habitat (Elsevier), 641–653. doi: 10.1016/B978-0-12-814960-7.00038-5
Proulx S., Promislow D., Phillips P. (2005). Network thinking in ecology and evolution. Trends Ecol. Evol. 20, 345–353. doi: 10.1016/j.tree.2005.04.004
Purser A., Dreutter S., Griffiths H., Hehemann L., Jerosch K., Nordhausen A., et al. (2021). Seabed video and still images from the northern Weddell Sea and the western flanks of the Powell Basin. Earth Syst. Sci. Data 13, 609–615. doi: 10.5194/essd-13-609-2021
Purser A., Hehemann L., Dreutter S., Dorschel B., Nordhausen A. (2020a). OFOBS Seafloor images from the Antarctic Peninsula and Powell Basin, collected during RV POLARSTERN cruise PS118 (Bremerhaven, PANGAEA: Alfred Wegener Institute, Helmholtz Centre for Polar and Marine Research). doi: 10.1594/PANGAEA.911904
Purser A., Hehemann L., Dreutter S., Dorschel B., Nordhausen A. (2020b). Seabed photographs taken along OFOBS profile PS118_69-1 during RV POLARSTERN cruise PS118 (Bremerhaven, PANGAEA: Alfred Wegener Institute, Helmholtz Centre for Polar and Marine Research). doi: 10.1594/PANGAEA.918924
Purser A., Marcon Y., Dreutter S., Hoge U., Sablotny B., Hehemann L., et al. (2019). Ocean floor observation and bathymetry system (OFOBS): A new towed camera/sonar system for deep-sea habitat surveys. IEEE J. Ocean. Eng. 44, 87–99. doi: 10.1109/JOE.2018.2794095
R Core Team. (2022). R: A language and environment for statistical computing (Vienna: R Foundation for Statistical Computing). Available at: https://www.R-project.org/roject.org.
Rauschert M., Arntz W. (2015). Antarctic Macrobenthos: A Field Guide of the Invertebrates Living at the Antarctic Seafloor ().
Riisgård H. U., Larsen P. S. (2017). “Filter-feeding zoobenthos and hydrodynamics,” in Marine Animal Forests. Eds. Rossi S., Bramanti L., Gori A., Orejas C. (Springer International Publishing, Cham), 787–811. doi: 10.1007/978-3-319-21012-4_19
Robinson B. J. O., Barnes D. K. A., Grange L. J., Morley S. A. (2021). Intermediate ice scour disturbance is key to maintaining a peak in biodiversity within the shallows of the Western Antarctic Peninsula. Sci. Rep. 11, 16712. doi: 10.1038/s41598-021-96269-9
Robson G. C. (1932). A monograph of the recent cephalopoda based on the collections in the british museum (Natural history). part II (London: The Octopoda).
Roff G., Doropoulos C., Rogers A., Bozec Y.-M., Krueck N. C., Aurellado E., et al. (2016). The ecological role of sharks on coral reefs. Trends Ecol. Evol. 31, 395–407. doi: 10.1016/j.tree.2016.02.014
Rossi L., Sporta Caputi S., Calizza E., Careddu G., Oliverio M., Schiaparelli S., et al. (2019). Antarctic food web architecture under varying dynamics of sea ice cover. Sci. Rep. 9, 12454. doi: 10.1038/s41598-019-48245-7
Sahade R., Lagger C., Torre L., Momo F., Monien P., Schloss I., et al. (2015). Climate change and glacier retreat drive shifts in an Antarctic benthic ecosystem. Sci. Adv. 1, e1500050. doi: 10.1126/sciadv.1500050
Schram J. B., Amsler C. D., McClintock J. B. (2019). Contrasting chemotactic escape responses of the common Antarctic gastropod Margarella Antarctica to four species of sympatric sea stars. Polar Sci. 22, 100486. doi: 10.1016/j.polar.2019.100486
Segelken-Voigt A., Bracher A., Dorschel B., Gutt J., Huneke W., Link H., et al. (2016). Spatial distribution patterns of ascidians (Ascidiacea: Tunicata) on the continental shelves off the northern Antarctic Peninsula. Polar Biol. 39, 863–879. doi: 10.1007/s00300-016-1909-y
Skinner C., Mill A. C., Newman S. P., Alsagoff S. N., Polunin N. V. C. (2020). The importance of oceanic atoll lagoons for coral reef predators. Mar. Biol. 167, 19. doi: 10.1007/s00227-019-3634-x
Sladen W. P. (1889). Report on the asteroidea. report on the scientific results of the voyage of H.M.S. challenger during the years 1873–1876. Zoology 30 (part 51), xlii + 893.
Smale D. A., Barnes D. K. A., Fraser K. P. P., Mann P. J., Brown M. P. (2007). Scavenging in Antarctica: Intense variation between sites and seasons in shallow benthic necrophagy. J. Exp. Mar. Biol. Ecol. 349, 405–417. doi: 10.1016/j.jembe.2007.06.002
Smith C. R., Grange L. J., Honig D. L., Naudts L., Huber B., Guidi L., et al. (2012). A large population of king crabs in Palmer Deep on the west Antarctic Peninsula shelf and potential invasive impacts. Proc. R. Soc B Biol. Sci. 279, 1017–1026. doi: 10.1098/rspb.2011.1496
Smith V. A., Yu J., Smulders T., Hartemink A. J., Jarvis E. D. (2005). Computational inference of neural information flow networks. PloS Comput. Biol. 2 (11), e161. doi: 10.1371/journal.pcbi.0020161.eor
Spiers E. K. A., Stafford R., Ramirez M., Vera Izurieta D. F., Cornejo M., Chavarria J. (2016). Potential role of predators on carbon dynamics of marine ecosystems as assessed by a Bayesian belief network. Ecol. Inform. 36, 77–83. doi: 10.1016/j.ecoinf.2016.10.003
Stafford R., Smith V. A., Husmeier D., Grima T., Guinn B. (2013). Predicting ecological regime shift under climate change: New modelling techniques and potential of molecular-based approaches. Curr. Zool. 59, 403–417. doi: 10.1093/czoolo/59.3.403
Stanley S. M. (2008). Predation defeats competition on the seafloor. Paleobiology 34, 1–21. doi: 10.1666/07026.1
Stauffer J. B., Purser A., Griffiths H. J., Smith C. R., Hoving H.-J. T. (2022). Food falls in the deep northwestern Weddell Sea. Front. Mar. Sci. 9. doi: 10.3389/fmars.2022.1055318
Studer T. (1883). Über der asteriden, welche während der reise S.M.S. Gazelle um die erde gesammelt wurden. Sitzungsberichte der Gesellschaft Naturforschender Freunde zu Berlin. 1883 (8), 128–132.
Taylor L. R., Woiwod I. P., Perry J. N. (1978). The density-dependence of spatial behaviour and the rarity of randomness. J. Anim. Ecol. 47, 383. doi: 10.2307/3790
Thomson J. A., Rennett N. (1931). Alcyonaria, madreporaria and antipatharia. Aust. Antarctic Expedition 1911-1914 Sci. Rep. Ser. C - Zoology Bot. 9 (3), 1–46.
Thrush S., Dayton P., Cattaneo-Vietti R., Chiantore M., Cummings V., Andrew N., et al. (2006). Broad-scale factors influencing the biodiversity of coastal benthic communities of the Ross Sea. Deep Sea Res. Part II Top. Stud. Oceanogr. 53, 959–971. doi: 10.1016/j.dsr2.2006.02.006
Trifonova N., Kenny A., Maxwell D., Duplisea D., Fernandes J., Tucker A. (2015). Spatio-temporal Bayesian network models with latent variables for revealing trophic dynamics and functional networks in fisheries ecology. Ecol. Inform. 30, 142–158. doi: 10.1016/j.ecoinf.2015.10.003
Tucker M. A., Rogers T. L. (2014). Examining predator–prey body size, trophic level and body mass across marine and terrestrial mammals. Proc. R. Soc B Biol. Sci. 281, 20142103. doi: 10.1098/rspb.2014.2103
Verrill A. E. (1878). Art. 46. notice of recent additions to the marine fauna of the eastern coast of north america, no. 2. Am. J. Sci. Arts. 16 (95), 371–378.
Verrill A. E. (1880). Notice of the remarkable marine fauna occupying the outer banks off the southern coast of new england. Am. J. Science. 3 (20), 390–403.
Whittle R. J., Quaglio F., Griffiths H. J., Linse K., Crame J. A. (2014). The Early Miocene Cape Melville Formation fossil assemblage and the evolution of modern Antarctic marine communities. Naturwissenschaften 101, 47–59. doi: 10.1007/s00114-013-1128-0
Yu J., Smith V. A., Wang P. P., Hartemink A. J., Jarvis E. D. (2002). Using Bayesian network inference algorithms to recover molecular genetic regulatory networks. In International conference on systems biology (Vol. 2002).
Keywords: photographic survey, ecological network, predator-prey interaction, community composition, Antarctic Peninsula, starfish
Citation: Khan TM, Griffiths HJ, Whittle RJ, Stephenson NP, Delahooke KM, Purser A, Manica A and Mitchell EG (2024) Network analyses on photographic surveys reveal that invertebrate predators do not structure epibenthos in the deep (~2000m) rocky Powell Basin, Weddell Sea, Antarctica. Front. Mar. Sci. 11:1408828. doi: 10.3389/fmars.2024.1408828
Received: 28 March 2024; Accepted: 17 June 2024;
Published: 02 July 2024.
Edited by:
Julie Bremner, Centre for Environment, Fisheries and Aquaculture Science (CEFAS), United KingdomReviewed by:
Helena Passeri Lavrado, Federal University of Rio de Janeiro, BrazilCopyright © 2024 Khan, Griffiths, Whittle, Stephenson, Delahooke, Purser, Manica and Mitchell. This is an open-access article distributed under the terms of the Creative Commons Attribution License (CC BY). The use, distribution or reproduction in other forums is permitted, provided the original author(s) and the copyright owner(s) are credited and that the original publication in this journal is cited, in accordance with accepted academic practice. No use, distribution or reproduction is permitted which does not comply with these terms.
*Correspondence: Tasnuva Ming Khan, dGZtazJAY2FtLmFjLnVr
Disclaimer: All claims expressed in this article are solely those of the authors and do not necessarily represent those of their affiliated organizations, or those of the publisher, the editors and the reviewers. Any product that may be evaluated in this article or claim that may be made by its manufacturer is not guaranteed or endorsed by the publisher.
Research integrity at Frontiers
Learn more about the work of our research integrity team to safeguard the quality of each article we publish.