 Calum J. G. Murie
 Simon P. Oliver
 Livia Gavard2
94% of researchers rate our articles as excellent or good
Learn more about the work of our research integrity team to safeguard the quality of each article we publish.
Find out more
ORIGINAL RESEARCH article
Front. Mar. Sci., 21 May 2024
Sec. Marine Megafauna
Volume 11 - 2024 | https://doi.org/10.3389/fmars.2024.1408727
Investigating the spatiotemporal ecology of elasmobranchs is an important precursor to their effective management. Understanding long-term patterns in the movement and habitat use of threatened species can improve management plans so that they yield increased conservation benefits. We investigated the spatiotemporal and environmental drivers that underpin the abundance and distribution of elasmobranchs around reef habitats in southern Mozambique to highlight reefs that are important (“hotspots”) to the regional elasmobranch community. Visual belt transects (n = 738), supported by video recordings, were completed on 16 reef sites off the coast of southern Mozambique from 2018 to 2022. Nine elasmobranch species were encountered annually (Carcharhinus amblyrhynchos, Triaenodon obesus, Stegostoma tigrinum, Neotrygon caeruleopunctata, Pateobatis jenkinsii, Taeniurops meyeni, Mobula kuhlii, Mobula alfredi, Mobula birostris) and 11 individual environmental and spatiotemporal parameters (horizontal water visibility, tidal range and state, moon illumination, temperature on the reef, cloud cover, time of day, day of the year, transect distance from shore, transect depth, and the region that the transect occurred in) were measured. All species, (bar P. jenkinsii) were significantly more abundant around certain reefs in the sampled region. Total counts for most species were highest in the austral summer however two species’ (M. birostris and S. tigrinum) were most abundant in the winter months. The tidal state, tidal range, and moon illumination correlated significantly with the numbers of each of the nine elasmobranch species. Non-Metric Multidimensional Scaling (NMDS) indicated that species’ responses to the measured parameters grouped taxonomically. Environmental influences resulted in strong seasonal patterns of reef use by large-bodied and pelagic elasmobranch species (e.g. manta rays). The measured environmental parameters also resulted in daily, monthly, and seasonal patterns of abundance of reef-resident stingray and shark species. Banning extraction of elasmobranch species around the reefs where they aggregate and reflecting species distributions within fisheries regulations may significantly benefit the regional elasmobranch community.
Coastal reef habitats provide elasmobranch species with refugia, nursery areas, ontogenetic staging points and stable locations for social convergence and reproduction (Wolff et al., 2018; Freeman, 2019; Maioli et al., 2023). Characterizing the mechanisms that underpin elasmobranch species’ use of, and relative fidelity to, reef habitat can provide important information for how the habitat could be managed to conserve elasmobranch populations (Friedlander et al., 2022; Hsu et al., 2022; Maioli et al., 2023). Depleted elasmobranch populations across the Indian Ocean, a changing climate, and the worldwide degradation of reefs means that understanding how elasmobranchs use coral reefs is becoming ever more important (Field et al., 2009; Sherman et al., 2023; Simpfendorfer et al., 2023).
Many elasmobranch species including reef sharks, manta rays and stingrays show preferences for visiting some reefs over others (Dulvy et al., 2014, Dulvy et al., 2021; Hsu et al., 2022; Maioli et al., 2023). Grey reef sharks (Carcharhinus amblyrhynchos), white tip reef sharks (Triaenodon obesus), zebra sharks (Stegostoma tigrinum), giant manta rays (Mobula birostris), reef manta rays (Mobula alfredi), shortfin devil rays (Mobula kuhlii), Kuhl’s mask rays (Neotrygon caeruleopunctata), and blotched fantail stingrays (Taeniurops meyeni) predictably return to specific reef sites to utilize cleaning stations, forage, or reproduce (Pierce et al., 2009; O’Shea et al., 2010; Peñaherrera et al., 2012; Dudgeon et al., 2013; Rohner et al., 2013; Murie et al., 2020; Maioli et al., 2023). Since a variety of elasmobranch species collectively show fidelity for specific reef sites, the benefits of protecting these locations are obvious (Luo et al., 2012; Dulvy et al., 2014; Friedlander et al., 2022). Identifying these reefs and characterizing the environmental and spatiotemporal drivers that underpin elasmobranch reef-use can help tailor regional fisheries policies to benefit their conservation (Schlaff et al., 2014; Filous et al., 2017; Heupel et al., 2019).
Elasmobranch reef use is influenced by a variety of environmental drivers (Schlaff et al., 2014; Heupel et al., 2019). Changes to the water temperature, tide, moon, and currents can affect elasmobranch respiration, metabolism, growth, foraging, and reproduction (Schlaff et al., 2014; Wolff et al., 2018; Heupel et al., 2019). The overlapping life histories and spatial/ecological characteristics of some reef-dwelling species mean that they experience and respond to environmental changes over similar spatiotemporal scales (Schlaff et al., 2014; Friedlander et al., 2022; Hsu et al., 2022; Maioli et al., 2023). Reef-resident species can be acutely affected by environmental change (O’Shea et al., 2010; Heupel et al., 2019). For many species of reef shark and stingray this results in hourly, daily, and monthly patterns of migrations between reef systems (O’Shea et al., 2010; Heupel et al., 2019). Pelagic sharks and rays’ range across broad spatial scales and their seasonal patterns of regional presence often coincide with periods of heightened productivity (O’Shea et al., 2010; Rohner et al., 2013; Hsu et al., 2022; Maioli et al., 2023). Understanding periods when elasmobranch species become abundant in a region and examining their high-use of reef sites can allow managers to tailor fisheries regulations and implement site-specific management practices (Schlaff et al., 2014; Hsu et al., 2022; Daly et al., 2023; Maioli et al., 2023).
Currently only CITES listed elasmobranch species are protected in Mozambican waters (Pierce et al., 2008; O’Connor and Cullain, 2021). Whilst information is scarce published reports indicate that elasmobranchs are harvested at an unsustainable rate in artisanal, semi-industrial, and industrial fisheries (Afonso, 2006; Pierce et al., 2008; Tung and Mozambique, 2016). Artisanal fishers target elasmobranchs and extract them as bycatch to sell their meat and fins (Pierce et al., 2008). Longline fisheries reports reveal that Prionace glauca (16%), Isurus oxyrinchus (11%), Carcharhinus sorrah (10%), Squalus asper (8%), and Carcharhinus leucas (8%) are the most commonly caught and that longline boats catch up to 570 kilograms of shark per day (Tung and Mozambique, 2016). Population declines have been reported for manta rays in Mozambican waters but few investigations have focused on other elasmobranch species despite the region being classified as one of the worlds Important Shark and Ray Areas (Rohner et al., 2013; O’Connor and Cullain, 2021; Jabado et al., 2024). This study aims to characterize the spatiotemporal and environmental drivers that underpin elasmobranch reef use in southern Mozambique. A series of SCUBA based visual belt transects were completed over several years (2018 – 2022) to highlight reefs that are important to the regional elasmobranch community. We address the following hypotheses: 1 elasmobranch species are more common on deeper reefs farther from the shore; 2 elasmobranch species’ visits vary on a seasonal basis and are influenced by the water temperature, tide, water currents, and moon illumination; and 3 closely related species use similar reef habitats and have similar responses to changes in the water temperature, tide, water currents, and moon illumination. The findings will be discussed in the context of regional elasmobranch conservation.
This study was conducted in accordance with all relevant regulations and was ethically approved by the University of Chester’s animal ethics committee.
Elasmobranch visits were recorded at 16 reefs off the coast of Praia do Tofo (23° 51.205’ S; 35° 32.882’ E) in the Inhambane Province of southern Mozambique (Figure 1, Table 1) from 2018 to 2022. The region’s principal oceanographic features include anticyclonic and cyclonic mesoscale eddies that flow over a narrow continental shelf (Schouten et al., 2003; Rohner et al., 2013). This creates regular and productive upwellings proximate to the regions inshore reefs (Schouten et al., 2003; O’Connor and Cullain, 2021). Upwellings consistently drive periods of high coastal productivity that promote the biodiversity of the region’s reef systems (Marshall, 2008; Rohner et al., 2013).
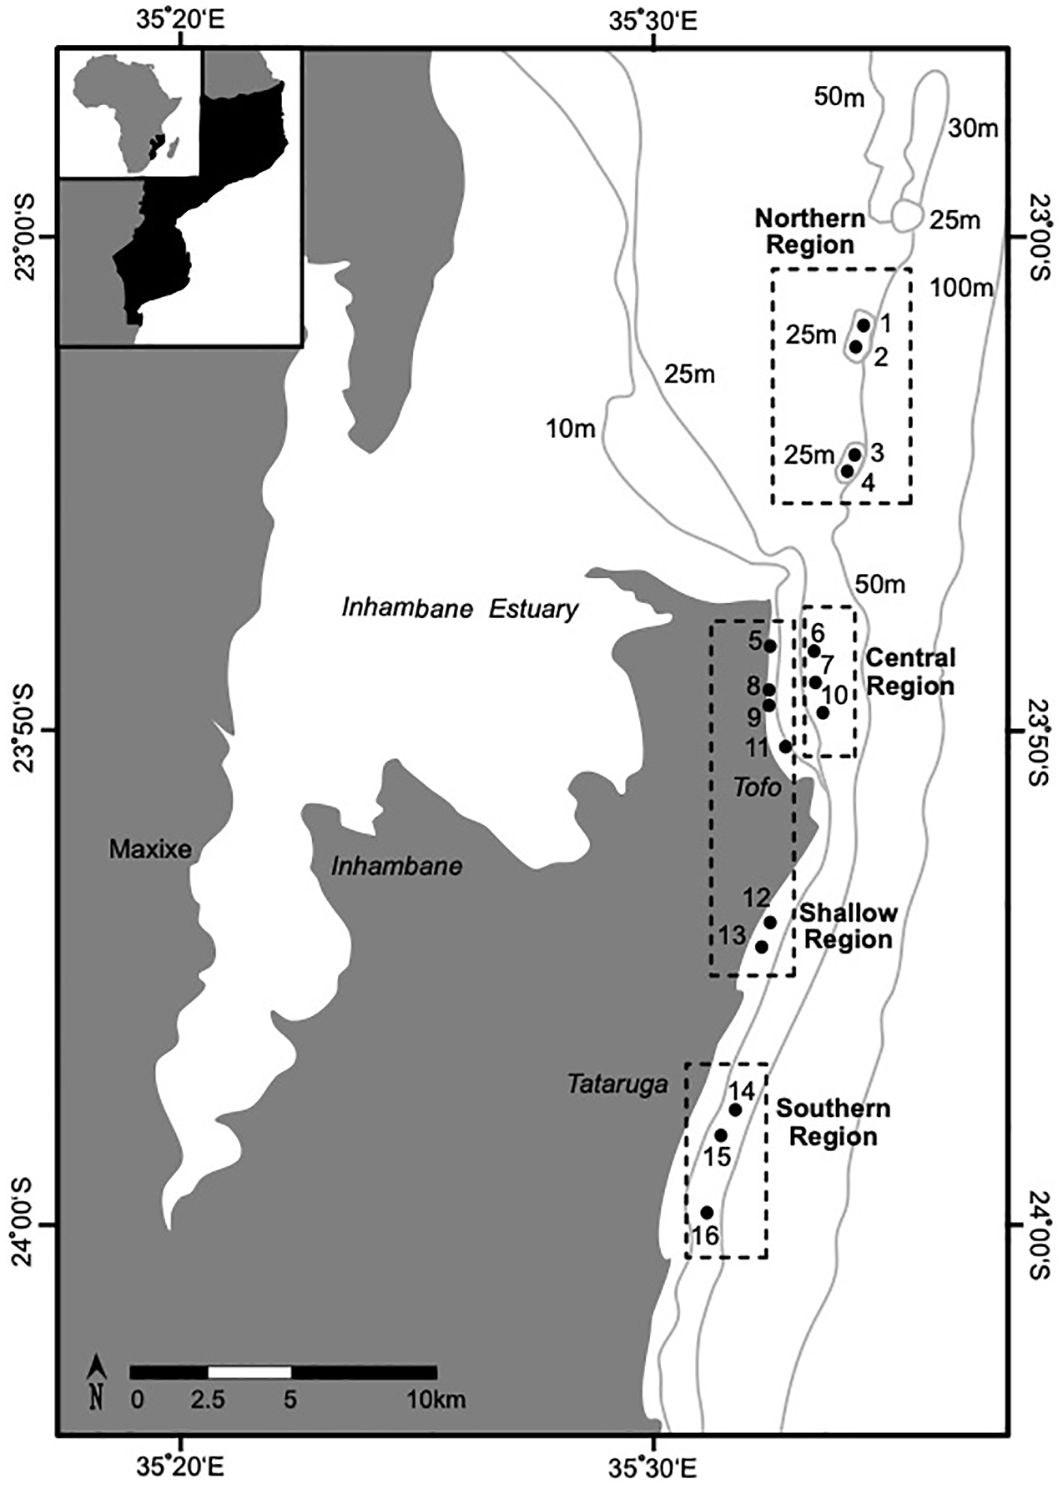
Figure 1 The locations of the 16 sites (denoted by solid circles; see Table 1.) in the four reef regions (denoted by dashed lines) that were surveyed for elasmobranchs offshore of Praia do Tofo in southern Inhambane, Mozambique. Shallow reefs in the region have been demonstrated to have shared biological characteristics that group them into a reef type that is distinct from deeper (< 20 m) reefs (see: Chapter Two) (Costa et al., 2005; Schleyer et al., 2019). The labels surrounding the figure show the longitude and latitude. The light grey lines show the bathymetry of the studied region.
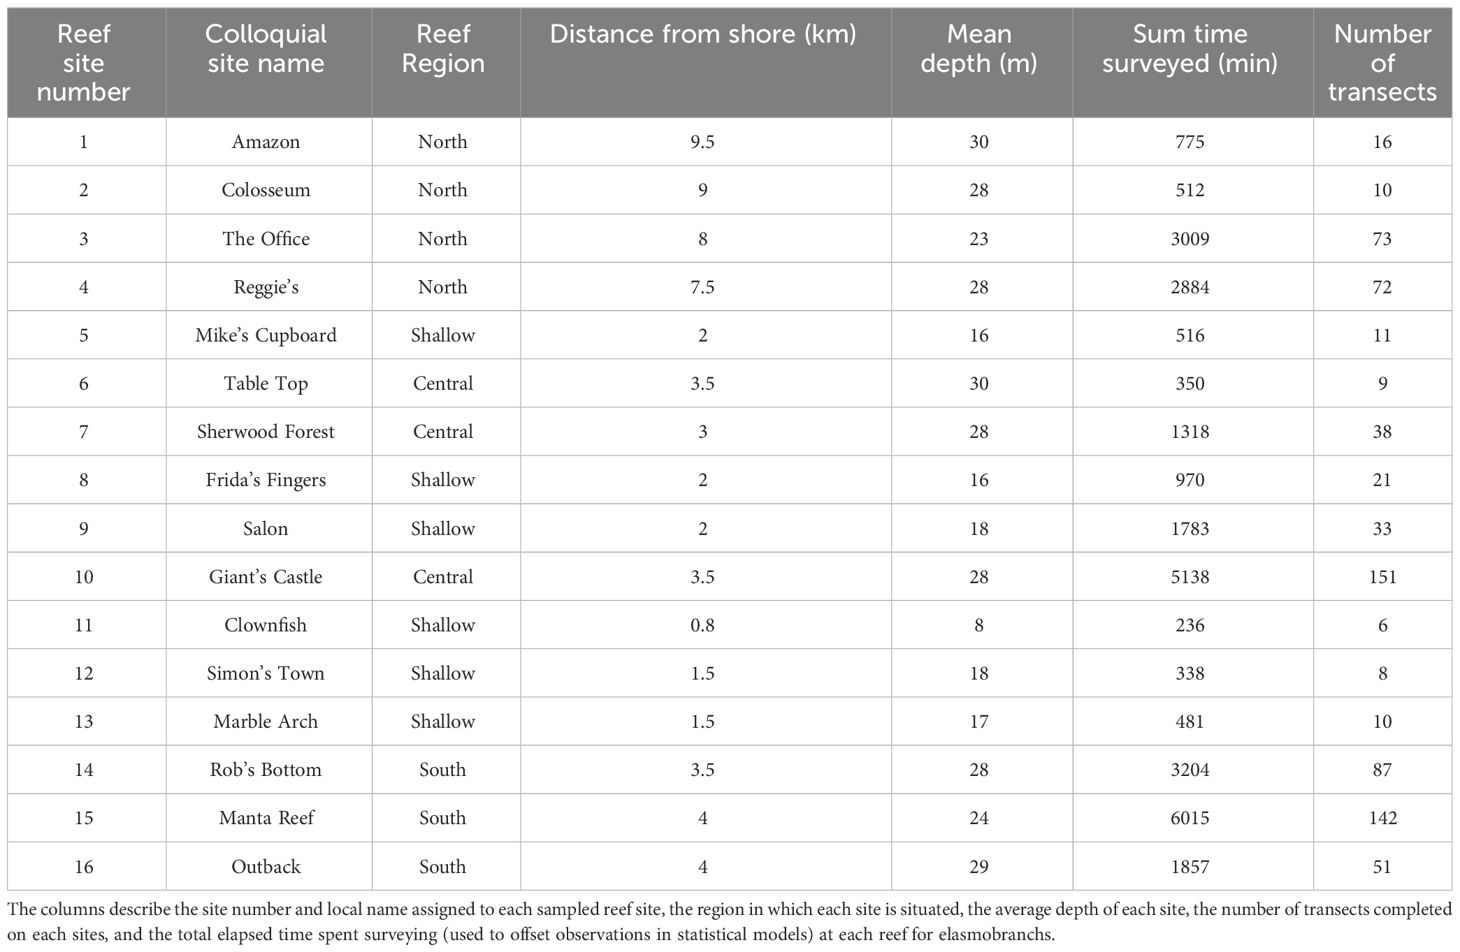
Table 1 The 16 sites offshore of Tofo, Mozambique, monitored in the current study (see: Figure 1).
To assess how elasmobranch visits varied in accordance with the geographic characteristics of the sampled reefs, the study area was divided into four “Reef Regions” each with distinct benthic structures, depth profiles, and reef crest ecologies (Figure 1, Table 1) (Logan and Sealey, 2013; Maioli et al., 2023). The shoreline (8 – 17 m depth) of the studied area is dominated by patches of reef consisting of shallow (~ 8 - 17 m) scattered coral-encrusted rock pinnacles fractured by small gullies (Figure 1, Table 1) (Costa et al., 2005). These shallow reefs have been demonstrated to have shared biological characteristics that group them into a reef type that is distinct from the deeper (> 20 m) reefs found in the region (Costa et al., 2005; Schleyer et al., 2019; O’Connor and Cullain, 2021). Beyond the “Shallow Reefs” is a stretch of hard sandy benthos that separates them from the deeper reefs (22 – 30 m depth) that fringe the oceanic (> 30 m) drop off. The 30 m isobath approximates the regional oceanic drop off, where benthic sloping steepens to > 45° as the seabed drops towards the continental shelf (Logan and Sealey, 2013; O’Connor and Cullain, 2021).
The deeper reefs that were sampled in the studied area are clustered in three distinct geographic locations (Figure 1, Table 1). In particular, the “Northern Reefs” (22 – 28 m depth) are geographically isolated as they lie on pinnacles ~ 15 km from the tidal outlets of a large estuary (Figure 1, Table 1). It is likely that the tidal outflow from the Inhambane estuary significantly influences the biology of the “Northern Reefs” but it is yet to be examined. The “Northern Reefs” reefs are characterized by overhangs, canyons, and pinnacles, with diverse assemblages of Acropora hard corals (Table 1). The “Central Reefs” fringe Praia do Tofo Bay and feature outcrops of Tubastraea micranthus along a seaward crest that runs parallel to the oceanic drop off (Murie pers. obvs.). Approximately 1 km inshore of these reefs are several “Shallow Reefs” that fringe the intertidal area of Praia do Tofo Bay (Table 1). The “Southern Reefs” lie ~ 2 km from a series of “Shallow Reefs” and are regularly exposed to strong currents flowing across large, topographically complex, reef plateaus that are dominated by hard encrusting algal growths and patchy distributions of Acropora (Table 1).
Visual belt transects (n =738) were completed on 16 reef sites (14.47 ± 0.79 mean transects completed per month) along the southern coast of the Inhambane province of Mozambique. Two SCUBA divers swam 5 m apart, along a standardized transect path, at the same depth, for 200 m (transect lengths measured by boat based GPS and surface marker buoys). Each transect ran for 30 minutes with divers surveying the reef crest. The divers would initiate the transect at either the north or south end of its path, depending on the current direction (for site details and depths see: Table 1; Rohner et al., 2013). Both members of the dive team recorded sightings of elasmobranchs with video cameras (Canon© 5D Mark iii). The identity of each elasmobranch species was determined in situ and then confirmed post survey based on video recordings and with the use of an identification guide (Compagno, 2005). On some rare occasions, the video footage was not sufficient to confirm an individual’s species identification. The individual in question was only counted if both observers’ in situ identifications matched. If a species was observed twice inside of 5-minutes, it was assumed to be the same individual, unless robust features (e.g., unique scarring, pigmentation, missing fins/extremities) in the video recordings indicated otherwise (Oliver et al., 2011).
Eleven environmental, spatial, and temporal parameters that are assumed to influence the reef use of the studied species were recorded during each transect (Marshall and Bennett, 2010; O’Shea et al., 2010; Oliver et al., 2011; Rohner et al., 2013; Schlaff et al., 2014; Espinoza et al., 2015; Murie et al., 2020). Eight parameters were recorded in situ. These were the distance from shore of each transect and the region that it occurred in; the horizontal water visibility [estimated by the dive team in situ (White et al., 2015)]; the day of the year; the transect depth (collected by divers in situ based on the readings of a Mares© Puck dive computer, varied with the tides); the water temperature at the transect depth/bottom (recorded at the transect midpoint from the readouts of the dive computer to 0.1 C°); the cloud cover [as % of total sky area, estimated in situ prior to the transect (Rohner et al., 2013)] and, the time of each elasmobranch encounter [based on the dive computer’s recording of when the divers initiated the transect plus the divers’ records of their bottom time prior to the encounter (nearest minute, normalized to 8:00 am)]. Three parameters: the moon illumination (% of the full moon); tidal range (nearest cm difference between the low tide and high tide heights), and the time to or from the nearest high tide (nearest minute; downloaded from www.tides4fishing.com; for interpretation, high tide is referred to as being around 0 or 720 minutes and low tide is taken to be around 360 minutes) were downloaded from an online repository (www.tides4fishing.com).
The per transect count of nine species of stingray, shark, and mobula ray (Carcharhinus amblyrhynchos, Triaenodon obesus, Stegostoma tigrinum, Neotrygon caeruleopunctata, Pateobatis jenkinsii, Taeniurops meyeni, Mobula kuhlii, Mobula alfredi, Mobula birostris) that were sighted in each year of the study were compared with eleven measured parameters in nine general additive models (GAMs) in the mgcv package of RStudio (Wood and Wood, 2015; Barley et al., 2017; Wood, 2017; R Core Team, 2024 version 6.1; Table 2). Each species’ per transect count, including zero values, represented the response variable for each of the models, whilst the horizontal water visibility was included as an offset term and Poisson error distributions were applied (Jain and Consul, 1971; Rohner et al., 2013). Explanatory variables were investigated for potential cross-covariance by using the “acf” function in the base package of RStudio with a default lag and the covariance type specified (Venables and Ripley, 2002). Examination of acf plots and partial correlation coefficients did not indicate any cross-covariance between the explanatory variables (Venables and Ripley, 2002).
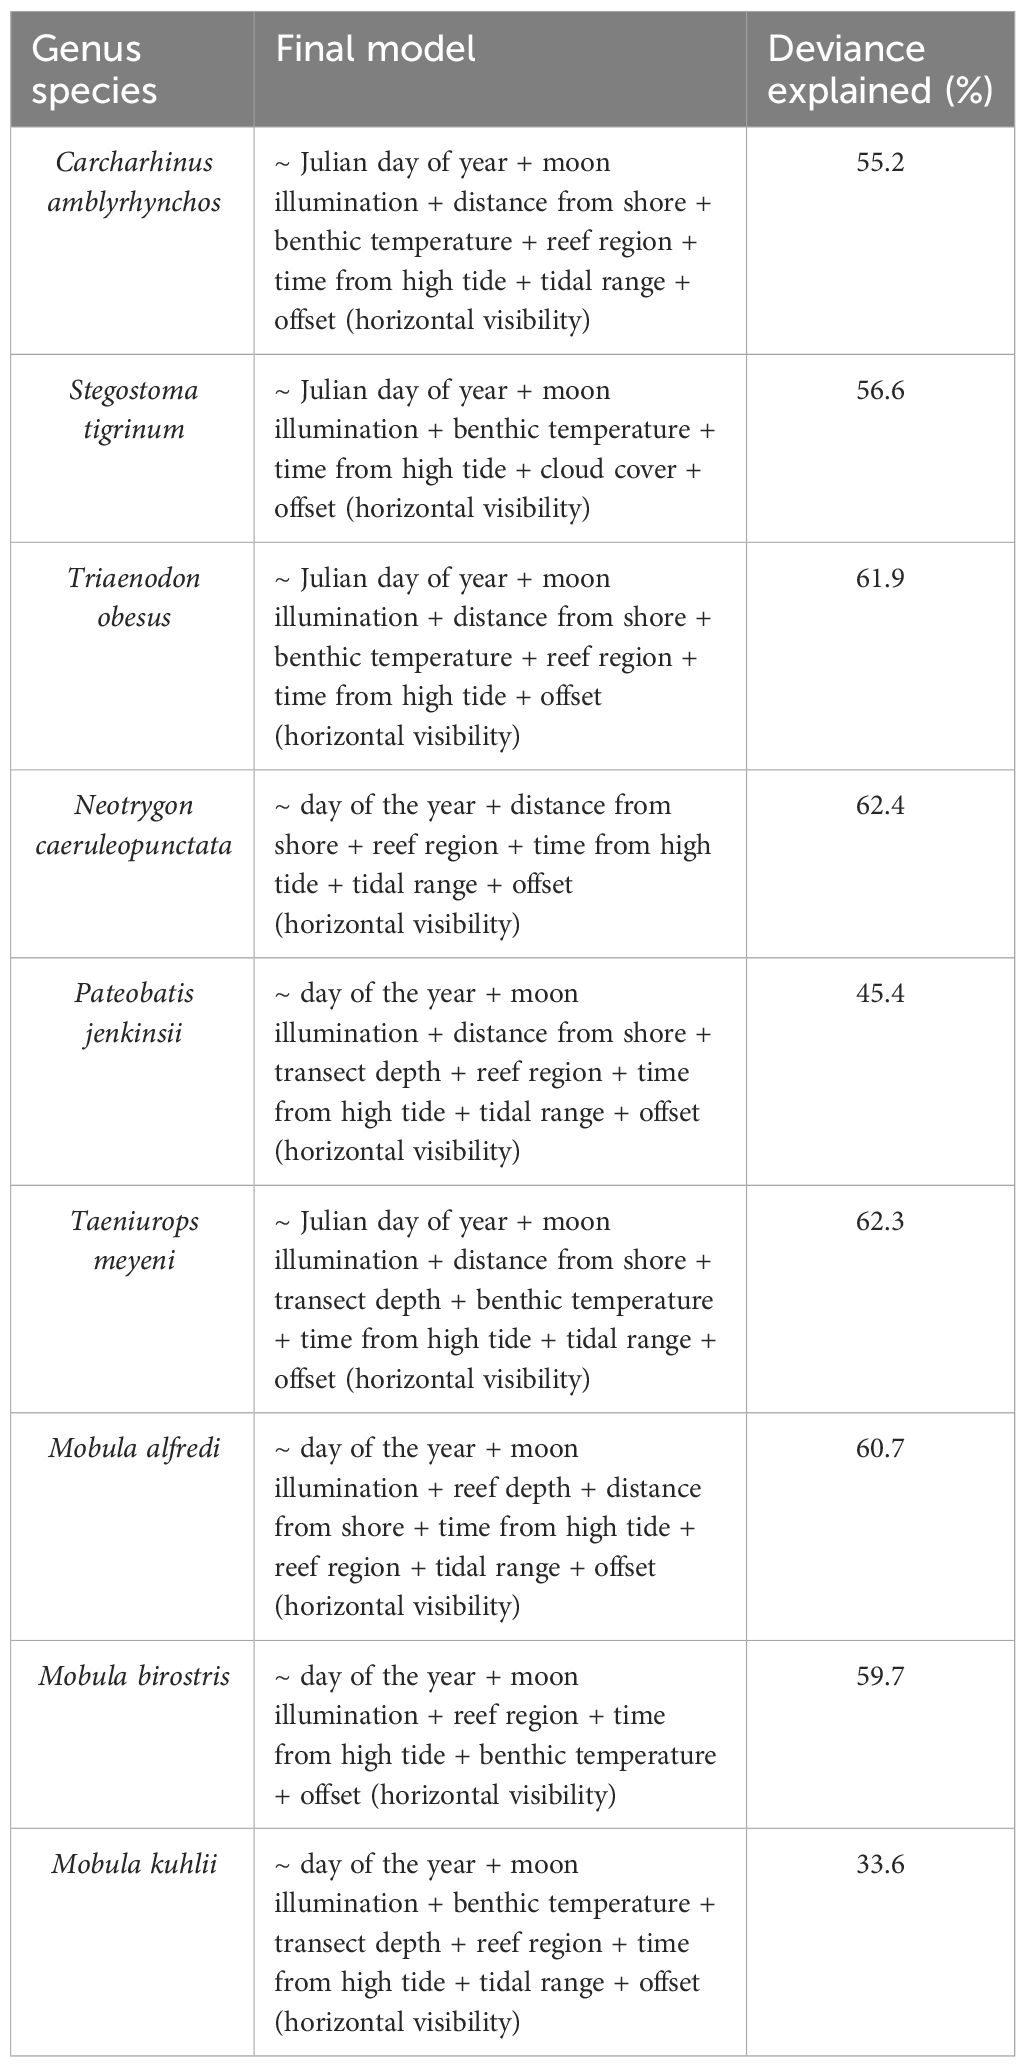
Table 2 The model parameters included in and the deviance of the most accurate model of each elasmobranch species’ per transect count when considering the effects of the eleven measured environmental and spatiotemporal parameters (location, time, day, tide and range, cloud cover, visibility, lunar phase, benthic temperature, current strength, and direction).
Each explanatory variable in each model was smoothed with cubic splines except for the reef region which was included as a factor (Wood and Wood, 2015). The distance from shore and reef depth were assessed to have a linear relationship with the species counts (Wood and Wood, 2015). The distance from shore and reef depth parameters had a asymmetrically skewed distribution when plotted and so were natural log transformed (Berehulyak and Vorobel, 2020). Cyclical splines were applied to the day of the year and time from high tide (Wood, 2017). Knots were conservatively set to three for all parameters except for the day of the year whereby plots indicated four knots best mirrored inflections in plotted species counts (Wood and Wood, 2015). Models were summarized, plotted, and checked using the ‘gam.check’ function and assessed graphically by comparing the mean regression line with the 1:1 diagonal line (Wood and Wood, 2015). Model checks did not reveal any obvious issues with convergence or overdispersion and did not indicate that per-variable k dimensions were low (< 0.5). An iterative approach was applied to select the most accurate model of the per-transect counts of each species. Each parameter was sequentially deleted, and each new iteration of the model was compared to the last using a χ2-based analysis of variance (ANOVA) test under the assumption that a significantly different model (p < 0.05), with an improved deviance and lower Akaike Information Criterion score indicated a better fit (Table 2.).
Nonmetric multidimensional scaling (NMDS) ordinations (Kruskal, 1964) were performed using PC-ORD (McCune and Grace, 2002) to produce a visual representation of potential similarities between the nine species of shark, mobula ray, and stingray (Carcharhinus amblyrhynchos, Triaenodon obesus, Stegostoma tigrinum, Neotrygon caeruleopunctata, Pateobatis jenkinsii, Taeniurops meyeni, Mobula kuhlii, Mobula alfredi, Mobula birostris) based on the influence of each of the 11 environmental and spatial-temporal parameters. The NMDS was applied with the Sorenson (Bray-Curtis) distance measure in PC-ORD to calculate the dissimilarity matrix using the “slow and thorough estimation method” (McCune and Grace, 2002).
A control variable representing an imaginary species was included since species counts in rows (representing individual dives) in the main matrix should not sum to zero and some individual transects and sums across rows existed for which all species observations = 0. The control variable had a value of one for its count in every row representing every transect (Clarke and Green, 1988; Clarke et al., 2006) except in a single random case where a value of two was included to introduce the variability (> 0) that the control variable required (McCune and Mefford, 1999; McCune and Grace, 2002). To account for potential outliers, Sorenson-Bray outlier analysis was applied in PC-ORD and indicated M. kuhlii counts should be root transformed (McCune and Grace, 2002). PC-ORD determined the optimal number of dimensions for the ordination. To avoid local minima, stress vs. iteration confirmed that ordination stress had stabilized, that the final instability was < 15.50, and that the deviation of the final instability was < 0.00090 over the final 15–30 iterations (McCune and Grace, 2002).
To understand which environmental and spatiotemporal variables were associated with each ordination axis, the axis score ranks were correlated for each transect in the final NMDS output with the ranks of these predictor variables using Kendall’s tau (significance ≤ 0.05). All standard deviations for Sorenson-Bray based distance measures for species counts were lower than the default threshold in PC-ORD. K-means cluster analysis in the Statistics Package for the Social Sciences (SPSS, Version 20.0, IBM) was applied to coordinate-based results from the NMDS analyses and indicated if species clustered due to some common factor(s) influencing the grouped species counts (McCune and Grace, 2002). Based on the species number in the NMDS (10), seven was selected as the optimal number of clusters. Maximum iterations (N = 999) were used to promote convergence and accuracy (McCune and Grace, 2002).
Overall, 21 elasmobranch species were encountered including six sharks, three guitarfish, three mobula rays, one eagle ray, one torpedo ray, and seven species of stingray (Table 3). Nine species (Carcharhinus amblyrhynchos, Triaenodon obesus, Stegostoma tigrinum, Neotrygon caeruleopunctata, Pateobatis jenkinsii, Taeniurops meyeni, Mobula kuhlii, Mobula alfredi, Mobula birostris) of adult shark, mobula ray, guitarfish, and stingray were encountered in each studied year (> 20 sightings per year) and were modelled against a series of spatial-temporal and environmental explanatory parameters (Table 3). All of the species encountered were at an adult life stage.
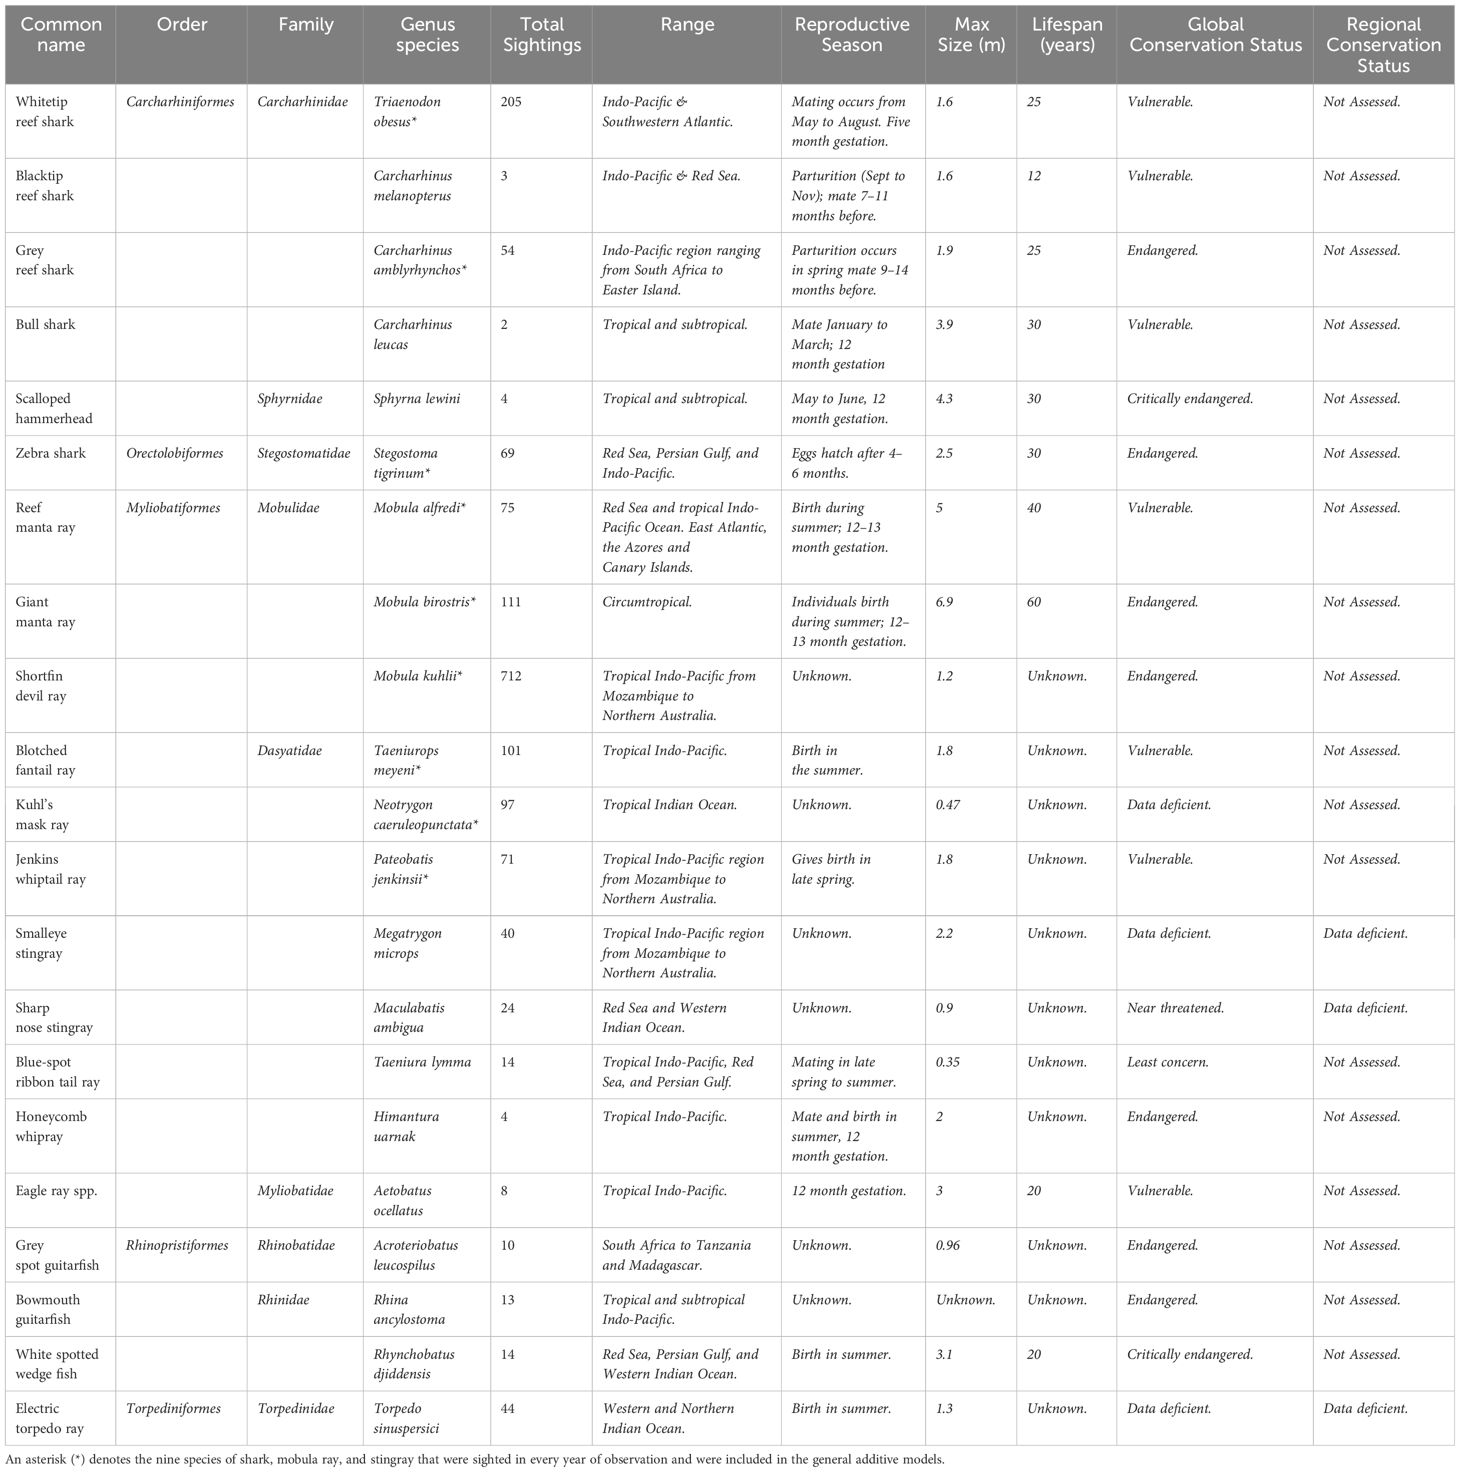
Table 3 The elasmobranch species encountered during transects on reefs off southern Mozambique as well as their geographical range, reproductive season, maximum size, life span and conservation status.
The outputs from the general additive models showed that the partial coefficients of six species (Taeniurops meyeni, Pateobatis jenkinsii, Neotrygon caeruleopunctata, Mobula alfredi, Carcharhinus amblyrhynchos, Triaenodon obesus) varied with the distance from shore of each transect (Figure 2). Plotted partial coefficients and reported z values indicate that the number of observed individuals of T. meyeni (df = 2, z value = 9.190, p < 0.001), P. jenkinsii (df = 2, z value = 12.488, p < 0.001), M. alfredi (df = 2, z value = 2.858, p = 0.004), C. amblyrhynchos (df = 2, z value = 10.125, p < 0.001), and T. obesus (df = 2, z value = 12.187, p < 0.001) have a significantly positive relationship with the transects distance from shore (Figure 2). The numbers of one species, N. caeruleopunctata, significantly decreased as the transects distance from shore increased (df = 2, z value = -6.091, p < 0.001) (Figure 2). The results that stemmed from each species’ general additive model showed that there was a significant difference in the numbers of three species (T. meyeni, P. jenkinsii, M. alfredi) through the depth range (8 – 30 m) of the completed transects (Figure 2). Plotted partial coefficients and reported z values indicated that the numbers of T. meyeni (df = 2, z value = 9.190, p < 0.001), P. jenkinsii (df = 2, z value = 12.488, p < 0.001) and, M. alfredi (df = 2, z value = 2.858, p < 0.001) all significantly increased as the transect depth increased (Figure 2).
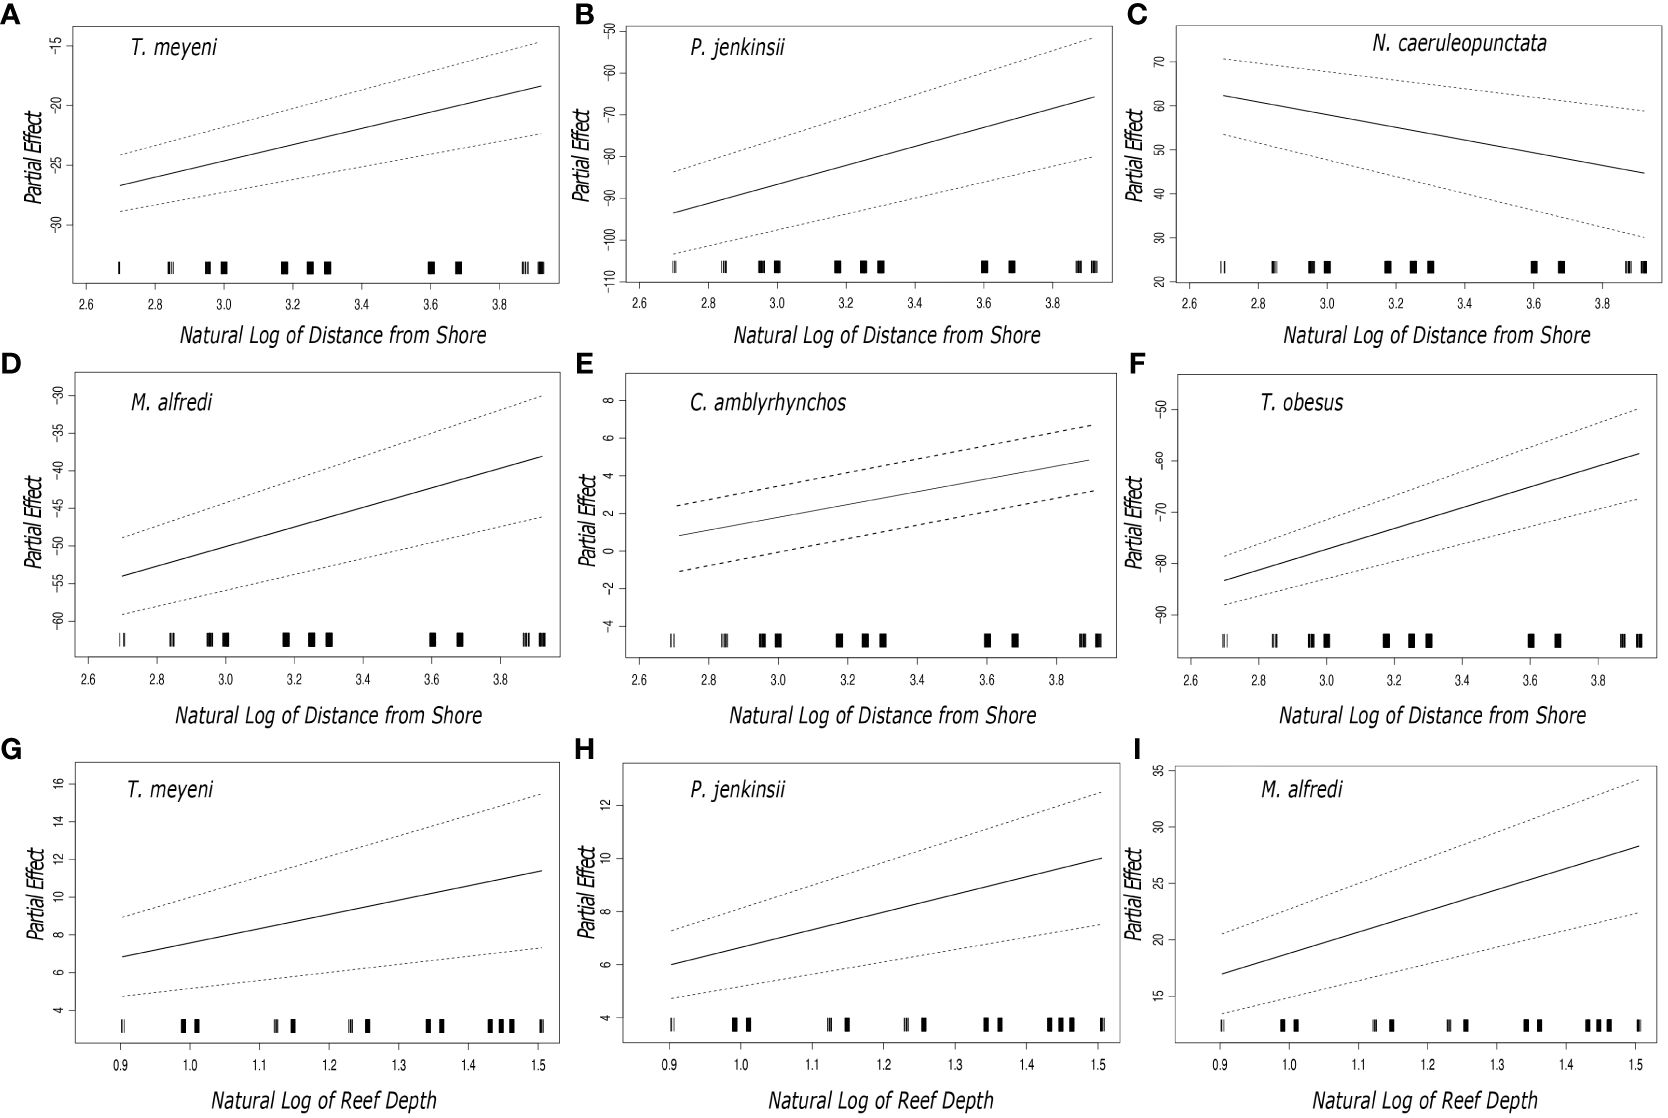
Figure 2 Plotted partial effects of each of the coefficients formed when comparing the relationship between the number of individuals of the studied species [(A, G) Taeniurops meyeni, (B, H) Pateobatis jenkinsii, (C) Neotrygon caeruleopunctata, (D, I) Mobula alfredi, (E) Carcharhinus amblyrhynchos, (F) Triaenodon obesus] and the natural log of the reefs distance from shore and depth. The gradient of the plotted black line represents the change in the relationship between the plotted partial coefficients and the distance from shore whilst the dashed lines represent the 95% confidence interval. The black bars along the x axis indicate the number of samples that were taken in terms of the distance from shore. Each of the sampled reef sites nomenclature, region, and depth are summarized in Table 1.
General additive models showed that seven species (Mobula kuhlii, Mobula birostris, Mobula alfredi, Carcharhinus amblyrhynchos, Pateobatis jenkinsii, Neotrygon caeruleopunctata, Triaenodon obesus) were more likely to be encountered in a particular region (Figure 3). Post model comparisons showed that M. kuhlii were least likely to be observed in the Shallow Region (df = 3, z value = -2.486, p = 0.013), regularly encountered in the Southern Region (df = 3, z value = 4.054, p = < 0.001), and most frequently encountered (df = 3, z value = 6.884, p = < 0.001) in the Northern Region (Figure 3). M. birostris were more likely to be encountered in the Southern Region (df = 3, z value = 12.374, p = < 0.001) but were much less likely to be encountered in the Northern Region (df = 3, z value = -16.581, p = < 0.001) (Figure 3). M. alfredi were most likely to be encountered in the Southern Region (df = 3, z value = 18.374, p = < 0.001). P. jenkinsii were most encountered in the Northern Region (df = 3, z value = 12.153, p = < 0.001), followed by the Southern Region (df = 3, z value = 9.048, p = < 0.001) and were rarely observed in the Shallow Region (df = 3, z value = -5.542, p = < 0.001) (Figure 3). C. amblyrhynchos (df = 3, z value = 28.191, p = < 0.001) and T. obesus (df = 3, z value = 16.548, p = < 0.001) were both observed more in the Northern Region (Figure 3). N. caeruleopunctata was most often encountered in the Shallow Region (df = 3, z value = 1445, p = < 0.001) (Figure 3).
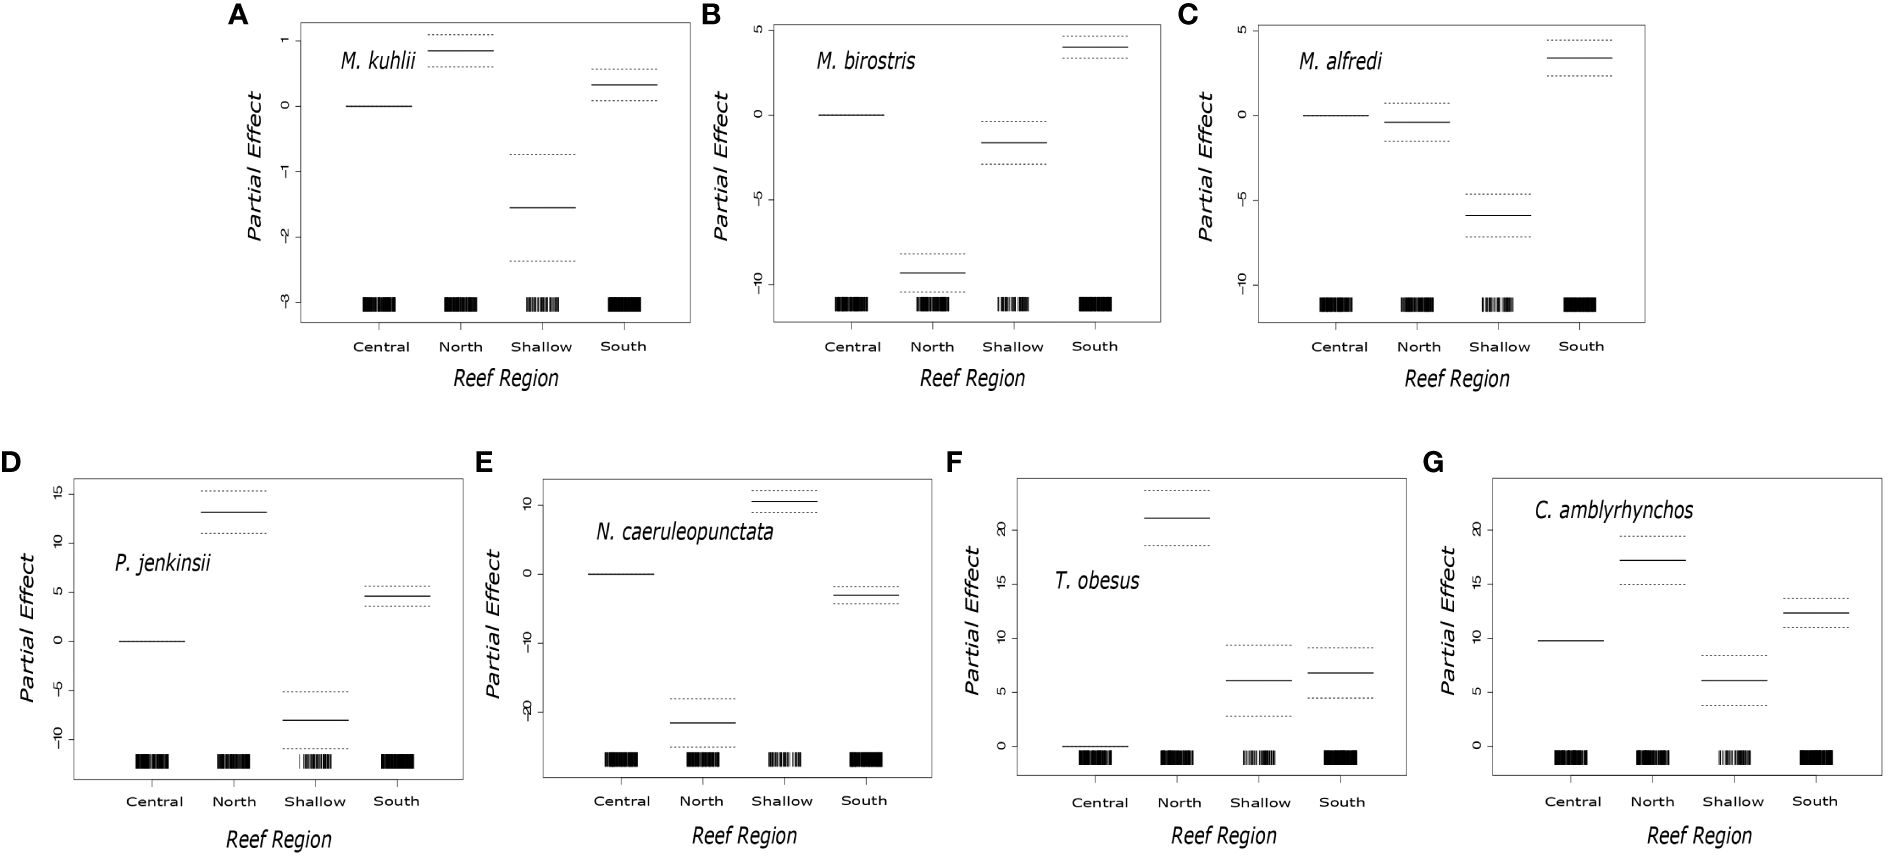
Figure 3 Plotted partial effects of each of the coefficients formed when comparing the relationship between the number of individuals of the studied species [(A) Mobula kuhlii, (B) Mobula birostris, (C) Mobula alfredi (D) Pateobatis jenkinsii (E) Neotrygon caeruleopunctata, (F) Triaenodon obesus (G) Carcharhinus. Amblyrhynchos] across the sampled reef regions. The solid black horizontal lines indicate the partial effect of each region. The dotted horizontal lines characterize the 95% confidence interval. The solid vertical black bars along the x axis represent the sampling distribution in each of the Reef Regions.
General additive models showed that the day of the year was a significant predictor of the likelihood of observing eight species (Taeniurops meyeni, Neotrygon caeruleopunctata, Mobula kuhlii, Mobula alfredi, Pateobatis jenkinsii, Carcharhinus amblyrhynchos, Stegostoma tigrinum, Triaenodon obesus) (Figure 4). Plotted partial coefficients indicated that T. meyeni (df = 2, χ2 = 449.621, p < 0.001), C. amblyrhynchos (df = 2, χ2 = 130.1, p < 0.001), and T. obesus (df = 2, χ2 = 37.91, p < 0.001) were most likely to be observed between October and February (~ day 300 to ~ day 50) but became rare during May and June (~ day 145) (Figure 4). M. alfredi (df = 2, χ2 = 758.588, p < 0.001) were most observed during early October (~ day 275) but were rarely observed in the days surrounding late March (~ day 90) (Figure 4). M. kuhlii (df = 2, χ2 = 135.019, p < 0.001) were most likely to be encountered in late September (~ day 260) with observations of this species becoming less likely between November (~ day 334) and April (~ day 92) (Figure 4). Observations of P. jenkinsii (df = 2, χ2 = 105.21, p < 0.00) peaked during late July (~ day 210) but were rare around the turn of the year (~ day 365) (Figure 4). S. tigrinum (df = 2, χ2 = 12.24, p < 0.001) and M. birostris (df = 2, χ2 = 334.339, p < 0.001) were most likely to be observed during May (~ day 130) but were rarely observed between November (~ day 334) and April (~ day 92) (Figure 4).
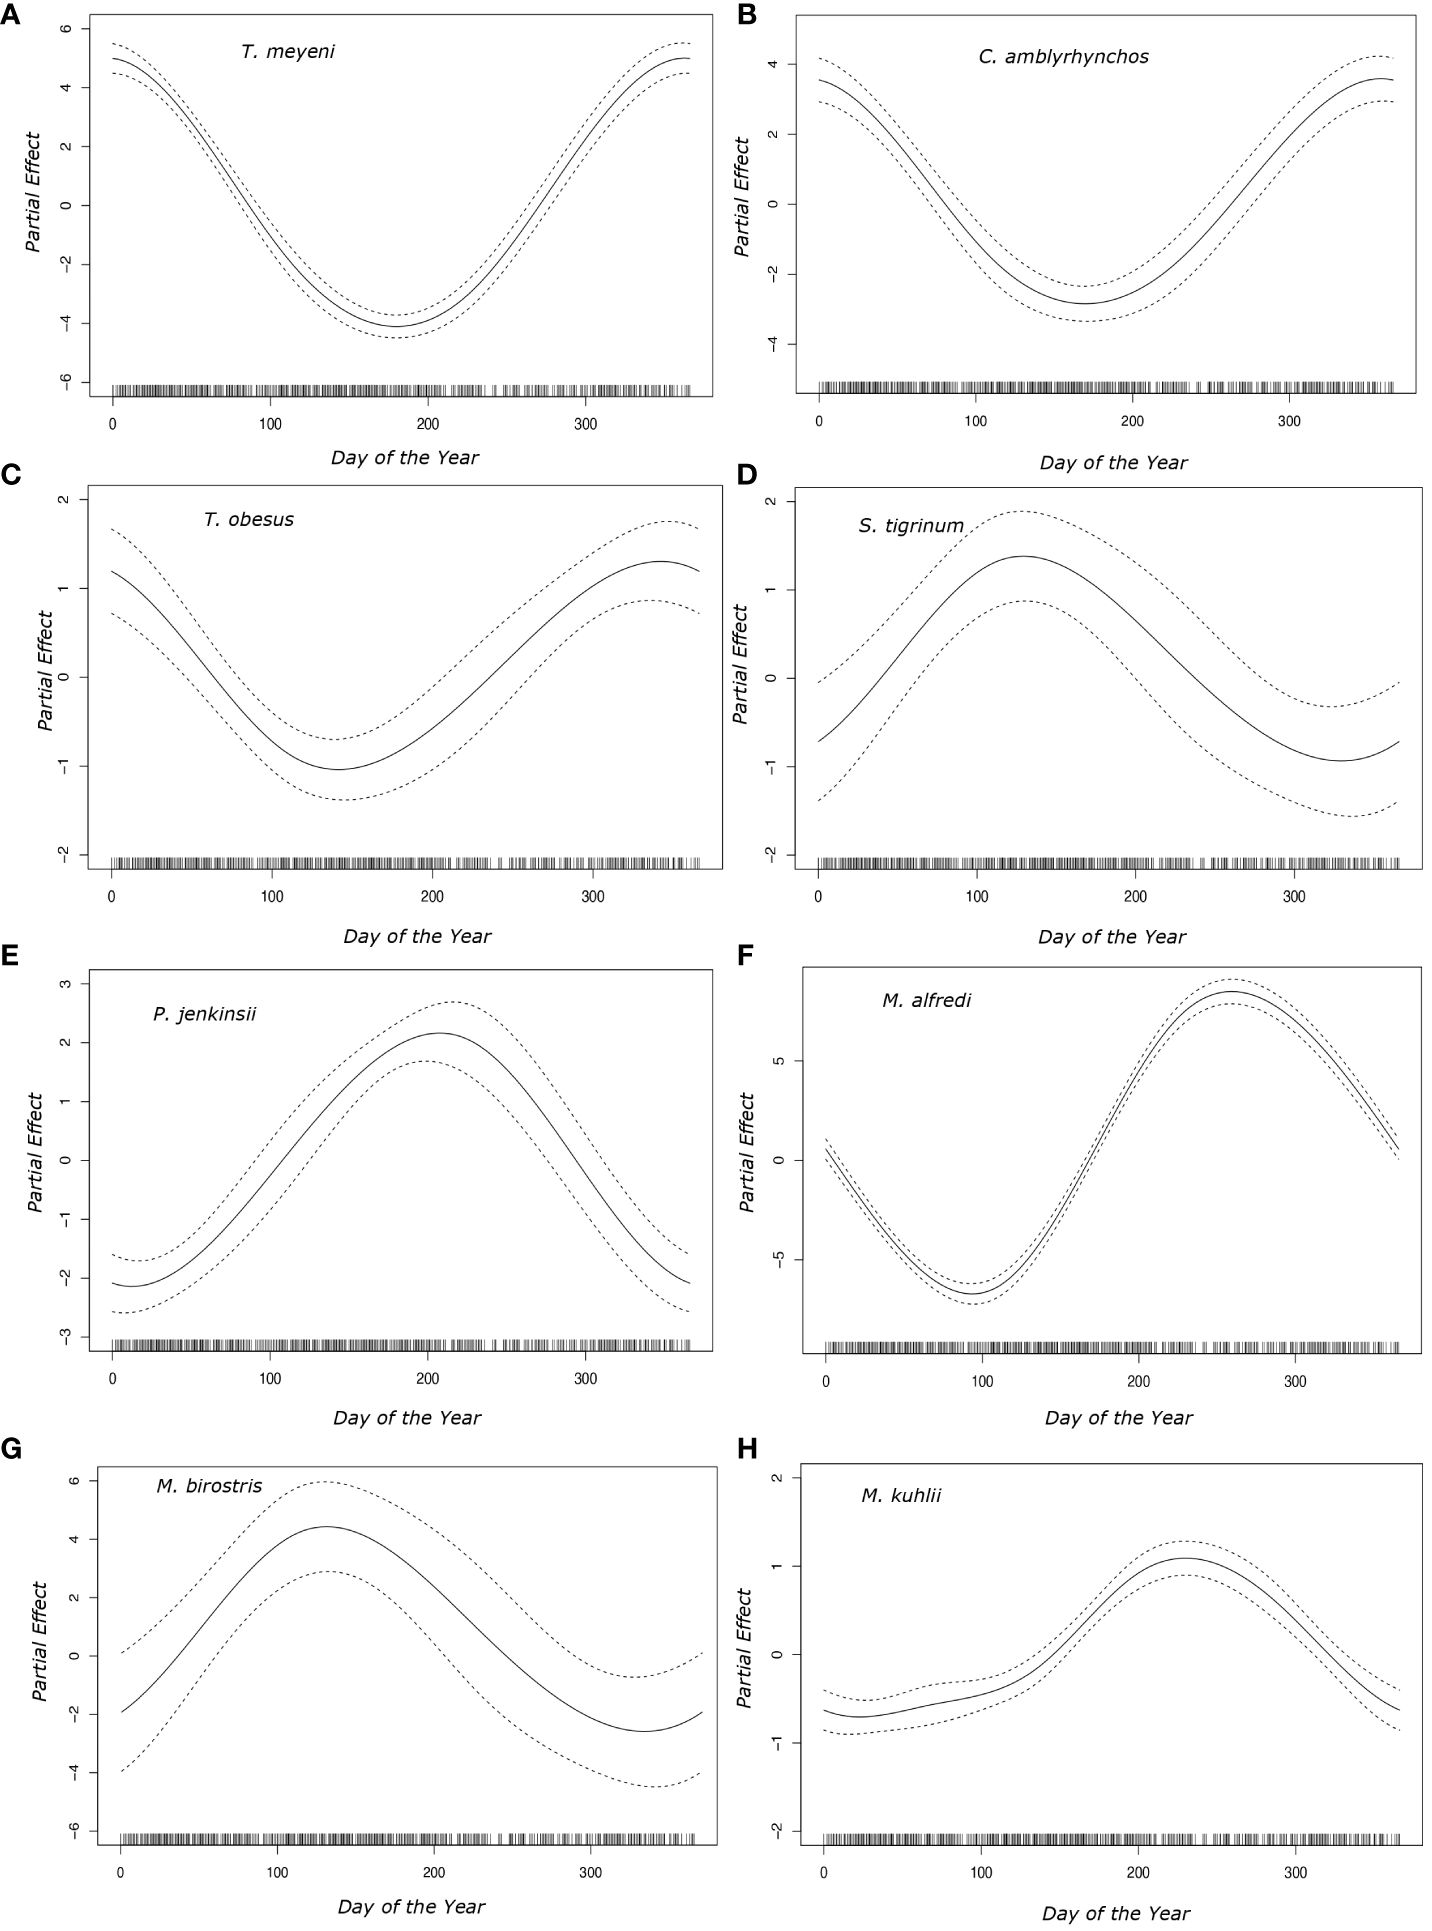
Figure 4 Plotted partial effects of the coefficients formed when comparing the relationship between the number of individuals of each of the studied species [(A) Taeniurops meyeni, (B) Carcharhinus amblyrhynchos, (C) Triaenodon obesus, (D) Stegostoma tigrinum, (E) Pateobatis jenkinsii, (F) Mobula alfredi, (G) Mobula birostris, (H) Mobula kuhlii] across the days of the year. The solid black line represents the partial effect that each day of the year had on the day of the year parameter coefficient whilst the dotted lines represent the 95% confidence interval. The solid vertical black bars along the x axis represent the sampling distribution throughout the year.
General additive models showed that the bottom water temperature (°C) was a significant predictor of the likelihood of observing six species (Taeniurops meyeni, Mobula kuhlii, Mobula birostris, Carcharhinus amblyrhynchos, Stegostoma tigrinum, Triaenodon obesus) (Supplementary Figure 1). Both T. obesus (df = 2, χ2 = 392.07, p < 0.001) and C. amblyrhynchos (df = 2, χ2 = 3924.75, p < 0.001) were more likely to be observed in warmer water temperatures (> 25°C), whilst S. tigrinum (df = 2, χ2 = 46.02, p < 0.001) was most likely to be observed in colder water temperatures (< 23°C) (Supplementary Figure 1). The likelihood of observing M. kuhlii (df = 2, χ2 = 7.79, p = 0.014) and M. birostris (df = 2, χ2 = 216.417, p < 0.001) decreased as the water temperature increased, with temperatures above 25°C significantly reducing the likelihood of observing each species (Supplementary Figure 1). Observations of T. meyeni were significantly more likely in water temperatures above 25°C (df = 2, χ2 = 624.481, p < 0.001) (Supplementary Figure 1).
General additive models indicated that the minute after the high tide was a strong predictor in the likelihood of observing seven species of elasmobranch (Carcharhinus amblyrhynchos, Stegostoma tigrinum, Triaenodon obesus, Taeniurops meyeni, Pateobatis jenkinsii, Neotrygon caeruleopunctata, Mobula alfredi) (Figure 5). Observations of C. amblyrhynchos (df = 2, χ2 = 90.11, p < 0.001), S. tigrinum (df = 2, χ2 = 211.29, p < 0.001), T. obesus (df = 2, χ2 = 39.44, p < 0.001), T. meyeni (df = 2, χ2 = 8.851, p = 0.004), and P. jenkinsii (df = 2, χ2 = 167.03, p < 0.001), were most likely when the tide was high (~ minute 0 and ~ minute 720) but were rare when the tide was low (~ minute 360) (Figure 5). Encounters with M. alfredi were also most likely when the tide was high (df = 2, χ2 = 49.04, p < 0.001) however, their numbers fell sharply during the incoming tide then increased as the tide rose (Figure 5). Observations of N. caeruleopunctata became were most likely when the tide was low (df = 2, χ2 = 142.057, p < 0.001) (Figure 5).
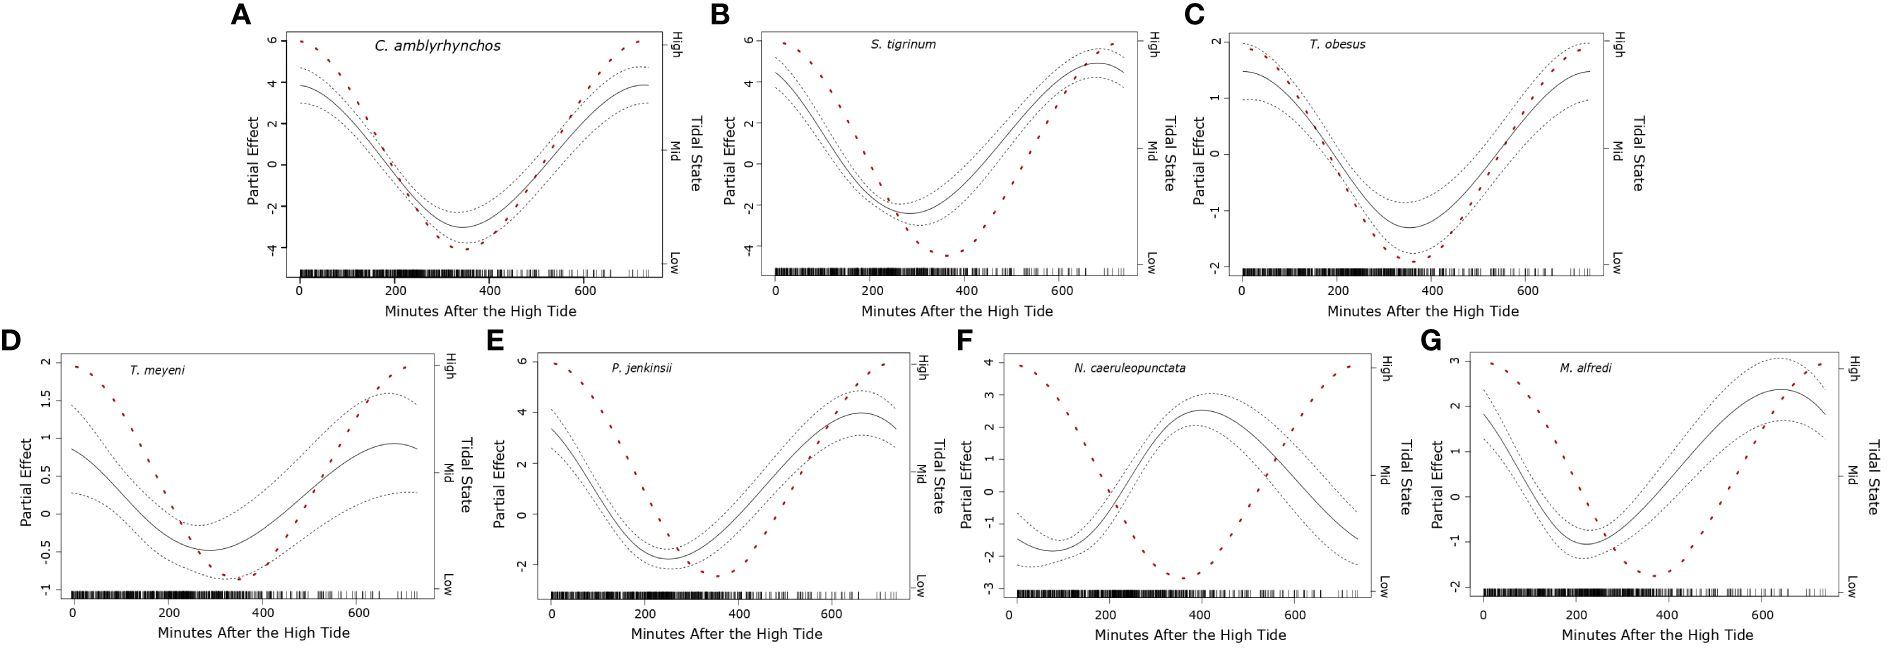
Figure 5 Plotted partial effects of each of the significant coefficients formed when comparing the relationship between the number of individuals of seven of the studied elasmobranch species [(A) Carcharhinus amblyrhynchos, (B) Stegostoma tigrinum, (C) Triaenodon obesus, (D) Taeniurops meyeni, (E) Pateobatis jenkinsii, (F) Neotrygon caeruleopunctata, (G) Mobula alfredi] and minute after the high tide (recorded daily to the nearest minute) recorded for each transect. The gradient of the plotted black line represents the change in the relationship between the calculated partial coefficients and the moon illumination, whilst the dashed lines surrounding the solid black line represent the 95% confidence interval. The red dashed line represents the change in the tidal state per minute after the high tide, whilst the right-hand y axis denotes common characterizations of “tidal states” (Dushaw & Menemenlis, 2023). The black bars along the x axis indicate the sampling distribution throughout the recorded minutes after the high tide (0 – 720 minutes).
General additive models indicated that the percentage of the moon illumination was a strong predictor in the likelihood of observing eight species of elasmobranch (Taeniurops meyeni, Mobula kuhlii, Mobula alfredi, Mobula birostris, Carcharhinus amblyrhynchos, Stegostoma tigrinum, Triaenodon obesus, Pateobatis jenkinsii) (Supplementary Figure 2). Observations of T. meyeni (df = 2, χ2 = 78.593, p < 0.001), M. kuhlii (df = 2, χ2 = 95.094, p < 0.001), M. alfredi (df = 2, χ2 = 139.409, p < 0.001), M. birostris (df = 2, χ2 = 428.325, p < 0.001), and S. tigrinum (df = 2, χ2 = 40.62, p < 0.001) were most likely when the moon was either new (~ 0% illumination) or full (~ 100% illumination) (Supplementary Figure 2). Encounters with T. obesus (df = 2, χ2 = 119.74, p < 0.001), C. amblyrhynchos (df = 2, χ2 = 274.54, p < 0.001), and P. jenkinsii were most likely when the moon was new (df = 2, χ2 = 16.56, p < 0.001) (Supplementary Figure 2).
Results from general additive models and plotted partial effects of model coefficients indicate that the tidal range was a strong predictor in the likelihood of observing four species of elasmobranch (Supplementary Figure 3). Encounters with Taeniurops meyeni were significantly increased when the tidal range was lowest (0 – 100 cm), becoming much more likely when the tidal range was greater than 250 cm (df = 2, χ2 = 95.038, p < 0.001; Supplementary Figure 3). Encounters with Pateobatis jenkinsii became more likely as the tidal range increased (df = 2, χ2 = 62.97, p < 0.001; Supplementary Figure 3). Observations of Mobula kuhlii were more likely with tidal ranges of 100 cm or greater but the relationship plateaued following tidal ranges of 250 cm (df = 2, χ2 = 92.725, p < 0.001; Supplementary Figure 3). Encounters with Mobula alfredi were significantly more likely when tidal ranges were greater than 250 cm df = 2, χ2 = 34.07, p < 0.001; Supplementary Figure 3).
Non-metric Multidimensional Scaling results showed that nine of the eleven environmental parameters examined in this study were significant in relation to the three axes defining the ordination space (Figure 6). Moon illumination correlated with two of the three axes whilst reef region, transect depth, distance from shore, time of day, day of the year, bottom temperature, tidal range, and time from high tide were significantly correlated with one axis in the ordination space (Figure 6). Cluster analyses, delimited by the software, indicated that the three species of mobula ray (M. alfredi, M. birostris, M. kuhlii) formed a single cluster with the moon illumination, day of the year, and reef region appearing to have the most important influences on this cluster (Figure 6). The second cluster (C. amblyrhynchos, T. obesus, and S. tigrinum) included the three species of shark with distance from shore, day of the year, and water temperature appearing to have the strongest influences on these species (Figure 6). The third and final cluster was composed of two of the three modelled stingray species (T. meyeni and P. jenkinsii) whilst N. caeruleopunctata formed a cluster with the control species (see: methods; Figure 6).
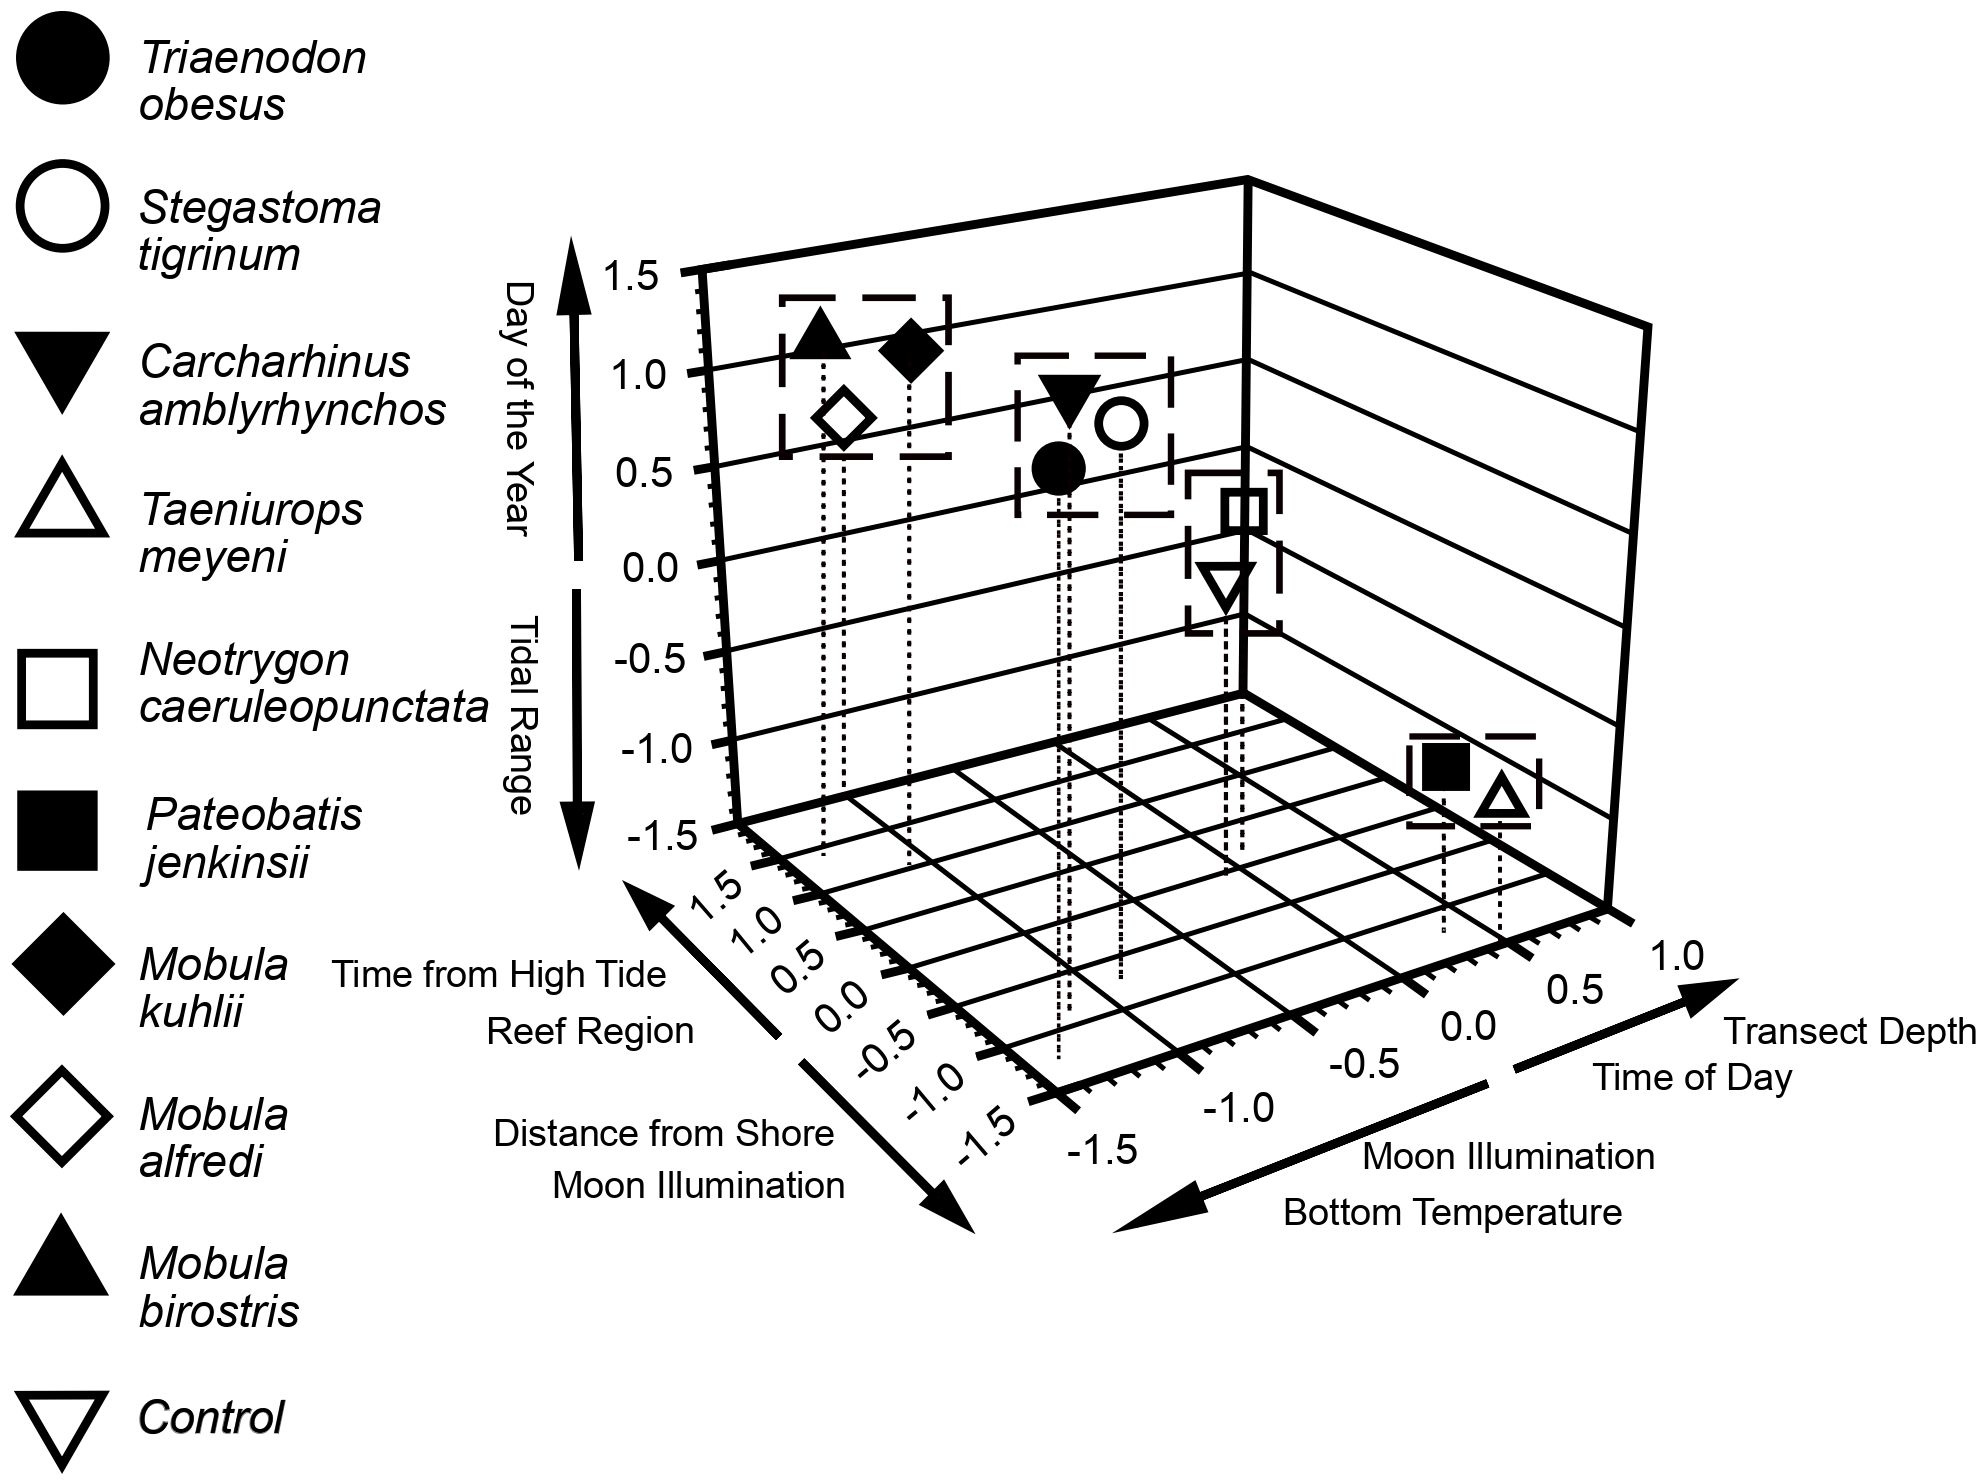
Figure 6 Nonmetric multidimensional scaling (NMDS). Variables listed significantly correlated with respective axes, and either in the positive or negative direction as indicated. Scientific names (Genus species) for each taxon are in the main body of the manuscript (Table 3.). The dummy variable was non-existent and had a count = 1 for each dive except for one random dive for which the count = 2. For Devil Ray counts we used a square root transformation before the NMDS procedure because of high outlier counts for some dives, but all other data used actual counts. The Dummy variable is essentially centered upon zero for each of the three axes. Species clustered together were likely influenced by similar environmental factors, whereas a single species alone from others indicated uniqueness with respect to variables that influenced its counts compared to other species. Besides variables listed on the axes, current strength, lunar phase, reef sample site, tidal range, and dive duration were included as parameters in the NMDS procedure. Dashed drop lines can indicate values for each species for the first and second (horizontal) axes. The further in a positive or negative direction on an axis that a species is located, the more that species was influenced by at least one or influenced by more than one of the corresponding listed variables in the same direction on the same axis.
This study is the first to examine the spatial, temporal, and environmental factors that underpin the coastal reef habitat use of an elasmobranch community in southern Mozambique and Important Shark and Ray Area in the Southwestern Indian Ocean (Jabado et al., 2024). The long term sightings data indicate that multiple species of elasmobranch visit specific reef sites (Heupel et al., 2019; Friedlander et al., 2022). Our findings support the consensus that environmental parameters are important considerations when investigating heterogenous patterns of reef use by elasmobranch species (Friedlander et al., 2022; Hsu et al., 2022; Maioli et al., 2023). The results stemming from the NMDS analysis indicate that the same spatial-temporal and environmental parameters affect closely related elasmobranch species in similar ways (Dulvy et al., 2021; Hsu et al., 2022).
At least 30 elasmobranch species are known to preferentially visit specific reef sites including pelagic rays, stingrays, and reef sharks (Espinoza et al., 2015; Maioli et al., 2023). Reef-associated mesopredators (such as elasmobranchs) often have distinct habitat requirements (Heupel et al., 2019). Multiple studies have linked the rate at which elasmobranch species visit reef habitats with site-specific environmental conditions (Espinoza et al., 2015; Filous et al., 2017). A reef’s invertebrate and fish species composition is linked with the reefs depth profile and distance from shore both in Mozambique (Logan and Sealey, 2013; Desbiens et al., 2021) and circumglobally (Asher et al., 2017; Hsu et al., 2022; Maioli et al., 2023). Since most elasmobranch species occupy high trophic levels in reef food webs, changes in relative abundances throughout the food web can significantly impact the resources available for elasmobranch species to forage on (Hsu et al., 2022; Maioli et al., 2023).
Both species of requiem shark (C. amblyrhynchos, T. obesus) were most observed around the offshore pinnacle reefs in the Northern Reef Region (Figures 1, 2). The pinnacle reef sites in the Northern Reef Region are surrounded on all sides by relatively deep (60 – 100 m) waters with a sandy benthos and are situated in relatively close proximity to the mouths (n = 3) of a large estuary (Inhambane estuary; see Figure 1). Prior research from the Marshall Islands and Hawaii has shown that both C. amblyrhynchos and T. obesus are more resident around semi-isolated pinnacle reefs (McKibben and Nelson, 1986; Holzwarth et al., 2006; Friedlander et al., 2022). The proximity of the semi-isolated pinnacles in the Northern Reef Region to the outflows of the Inhambane estuary may create unique ecological conditions that provide greater foraging opportunities for C. Amblyrhynchos and T. Obsesus (Espinoza et al., 2015; Filous et al., 2017; Maioli et al., 2023).
The semi-isolated nature of the reef pinnacles in the Northern Reef Region may also lead to a comparative reduction in fishing pressure since distance from shore is a common proxy for fishing pressure (Stewart et al., 2010; Logan and Sealey, 2013; Filous et al., 2017). Targeted shark extraction has persisted in coastal fisheries in southern Mozambique for decades (Pierce et al., 2008; Asher et al., 2017; Heupel et al., 2019). As reef sharks grow slowly, mature late, and have a slow intrinsic rate of population growth, their populations are acutely affected by extractive pressures (Pierce et al., 2008; Asher et al., 2017; Heupel et al., 2019). It may be that a combination of factors influence likelihood of observing C. amblyrhynchos and T. obesus on reef sites in the Northern Reefs Region. These may include (but not be limited to) their suitability as a habitat and/or foraging ground or that their position further from the shore has reduced the number of sharks extracted by local fisheries (Pierce et al., 2008; Maioli et al., 2023).
Our findings indicate that the distance from shore and reef depth were important predictors for the likelihood of observing both T. meyeni and P. jenkinsii. Both species of stingray were recorded at a higher rate on deeper (> 20 m) reefs positioned further from the shore (Kyne et al., 2012; Rizkiantino and Binol, 2020). Both these species can reach a relatively large body size (> 1 m disk width). Several reports (Coleman et al., 2018; O’Connor and Cullain, 2021; Hsu et al., 2022; Maioli et al., 2023) list them as inhabiting deeper reef sites throughout their range where they principally forage on small fish and crustaceans (Last and Stevens, 1994; Kyne et al., 2012; Rizkiantino and Binol, 2020). N. caeruleopunctata was most observed on the reefs in the Shallow Reefs Region, proximate to the shoreline. Mask rays (Neotrygon spp.) are known to show an affinity for shallow habitats, regularly being observed in coastal bays and lagoons throughout their range (Last and Stevens, 2009; Pierce et al., 2009; Puckridge et al., 2013; Borsa et al., 2016). Mask rays principally forage on Carids and Polychaetes on inshore tidal sand flats which surround the reefs sampled in the Shallow Reef Region (Pierce et al., 2009; Beckman, 2017). Habitat requirements, likely underpinned by localized foraging opportunities, appear to be important to all three species of stingray in southern Mozambique (Pierce et al., 2009; Puckridge et al., 2013; Borsa et al., 2016).
The three species of mobula ray (M. alfredi, M. birostris, and M. kuhlii) were most likely to be observed on reefs in the Southern Reef Region. This matches results stemming from prior investigations into mobula species in the region (Marshall and Bennett, 2010; Rohner et al., 2013). As mobuliids are large-bodied planktivores food availability is thought to be the primary driver that influence their movements between habitats (Marshall and Bennett, 2010; Rohner et al., 2013; Burgess et al., 2016). The proximity of the Southern Reef Region to mobula foraging grounds has previously been offered as an explanation for their habitat preferences in the region (Marshall and Bennett, 2010; Rohner et al., 2013; Burgess et al., 2016). Besides foraging, Mobula rays are thought to spend a considerable amount of time (up to six hours a day) visiting cleaning stations on reefs where they are serviced by cleaner fish that control their ectoparasitic infections (Marshall, 2008; Marshall and Bennett, 2010; Murie et al., 2020). A combination of localised foraging opportunities and the suitability of the cleaning stations in the Southern Reef Region may give rise to heterogenous reef use by mobula rays in southern Mozambique (Marshall, 2008; Marshall and Bennett, 2010; Couturier et al., 2012). Future studies should aim to map mobula movements between high-use regional reefs and foraging areas to assess if this explains their patterns of reef use (Couturier et al., 2012; Rohner et al., 2013).
Warm waters trigger reproductive responses in most elasmobranch species (Dudgeon et al., 2013; Daly et al., 2023). A study showed that the levels of three sex hormones [testosterone (T), estradiol (E2), and progesterone (P4)] in the blood plasma of one shark (Mustelus schmitti) varied with the water temperature off Argentina (Elisio et al., 2019; Dulvy et al., 2021). The authors theorized that warmer water temperatures may trigger reproductive behaviors in several species of elasmobranch (Elisio et al., 2019; Dulvy et al., 2021). Reports indicate that reef-associated elasmobranchs engage in reproductive behaviors around reefs during the austral summer in southern Mozambique (October – March) (Marshall and Bennett, 2010; Dudgeon et al., 2013; Daly et al., 2023). Our analysis suggests the day of the year is an important factor in the likelihood of observing seven species (T. obesus, C. amblyrhynchos, S. tigrinum, T. meyeni, M. kuhlii, M. alfredi, M. birostris) of elasmobranch on reefs off southern Mozambique. Observations of five species (T. obesus, C. amblyrhynchos, T. meyeni, M. kuhlii, M. alfredi) were more likely during the months of austral summer (October-March). Observations of two species (S. tigrinum, M. birostris) were most likely to occur in May (austral winter). The likelihood of observing five (T. obesus, C. amblyrhynchos, S. tigrinum, T. meyeni, M. birostris) of these species also varied with the water temperature. Three (T. obesus, C. amblyrhynchos, T. meyeni) were most likely to be observed when water temperatures were greatest (~ 30°C) whilst two (S. tigrinum, M. birostris) were most likely when water temperatures were coldest (~ 20°C).
T. obesus and C. amblyrhynchos are both known to reside around reef habitats with warmer water temperatures since they benefit several of their physical/metabolic processes, including gestation (Vianna et al., 2013; Espinoza et al., 2015; Duffy et al., 2017). The results presented here support investigations on T. obesus and C. amblyrhynchos from Costa Rica, Hawaii, and Australia where increased sightings around reefs during the summer have been linked with their reproductive behaviour (McKibben and Nelson, 1986; Holzwarth et al., 2006; Friedlander et al., 2022).
Both M. alfredi and M. kuhlii were observed more frequently during October and on two transect surveys M. alfredi were seen engaging in courtship behaviour (Murie pers. obvs.). This observation supports conclusions from a prior report on M. alfredi in the same region that a peak in observations of M. alfredi on reef sites during October is related to their reproductive cycle (Marshall and Bennett, 2010; Rohner et al., 2013). As a part of courtship, multiple male mobula rays form a “mating train” that aims to follow a female (Marshall and Bennett, 2010; Deakos, 2012; Whitney et al., 2012; Rohner et al., 2013). This behaviour is thought to most frequently initiate on reef sites (Deakos, 2012; Whitney et al., 2012). Whilst reports on M. kuhlii are particularly scarce in southeast Africa, it may be that like M. alfredi they are reproductively active in the region between October and November (Marshall and Bennett, 2010; Rohner et al., 2013).
Observations of M. birostris were most likely in May, a period when encounters with M. kuhlii and M. alfredi began to rise following their respective lowest numbers of observations in April (Rohner et al., 2013). The channel off southern Mozambique is characterized by cyclonic and anti-cyclonic mesoscale (∼ 100 km) eddies (Malauene, 2010; Rohner et al., 2013). Between April and July (~ day 90 – 180) falling water temperatures offshore of South Africa drive prevalent winds from the southeast that perpendicularly intersect the eddies (Malauene, 2010; Rohner et al., 2013). This results in Ekman transport that creates offshore down-wellings and coastal up-wellings close to the sampled reefs due to the region’s narrow continental shelf which triggers plankton blooms (Malauene, 2010; Rohner et al., 2013). Regional productivity is a strong predictor of mobula abundance as they must sustain their large body size through a planktivorous diet (White and Dharmadi, 2007; Marshall and Bennett, 2010; Rohner et al., 2013). Prior studies on Mobula birostris have linked heightened productivity with a peak in their sightings (Dewar et al., 2008; Rohner et al., 2013; Murie et al., 2020). Raised ocean productivity has previously been identified as the driver behind increased observations of M. birostris in southern Mozambique during the month of May (Marshall and Bennett, 2010; Rohner et al., 2013; Murie et al., 2020).
The moon’s illumination has been shown to influence site-specific productivity and food availability due to its interaction with plankton in the marine environment (Alldredge and King, 1980; Behrenfeld et al., 2005; Dewar et al., 2008). Specific periods of moon illumination can cause plankton to migrate to the surface and can create tidal conditions that concentrate plankton (Behrenfeld et al., 2005; Dewar et al., 2008). The effect of this process is strengthened during the new and full moon (Behrenfeld et al., 2005; Dewar et al., 2008). Studies have shown that these periods can cause mass predation events that significantly reduce regional planktonic abundance (Alldredge and King, 1980; Davis and Dawes, 1981; Drazen et al., 2011). As large-bodied planktivorous fish, food availability is the primary driver underlying the movements and habitat use of mobula rays (Rohner et al., 2013; Burgess et al., 2016). Our results showed that the likelihood of observing all three of the studied mobula species (M. kuhlii, M. alfredi, M. birostris) was increased during the new and full moon. This finding supports similar findings from southern Mozambique (Rohner et al., 2013), Indonesia (Dewar et al., 2008) and the Red Sea (Osada, 2010). The authors of these studies attributed increased observations of mobula rays during new and full moons to increases in the local availability of their planktonic prey (Dewar et al., 2008; Osada, 2010; Deakos, 2012).
Observations of grey reef sharks (C. amblyrhynchos) and white tip reef sharks (T. obesus) occurred most commonly during the new moon. The moon illumination is known to influence the movements of prey and predators around reef systems worldwide (Drazen et al., 2011; Vianna et al., 2013; Heupel and Simpfendorfer, 2014). Both grey reef sharks and white tip reef sharks are known to be nocturnal predators which most actively forage on reefs during low-light conditions (Drazen et al., 2011; Vianna et al., 2013; Heupel and Simpfendorfer, 2014). This has been linked with the sharks’ senses for detecting prey (outside of the visual) including their ability to detect fine scale changes in dissolved biological compounds through olfaction and their ability to sense bioelectric activity through their Ampullae of Lorenzini (Kajiura and Holland, 2002; Heinrich et al., 2022). In both Palau and the Great Barrier Reef, grey reef sharks have been observed moving to reef habitats during the new moon (Vianna et al., 2013; Heupel and Simpfendorfer, 2014). It may be that the low light conditions during the new moon improve grey reef and white tip reef shark foraging efficiency which increased the likelihood of observing these species in our current study during new moons (Kajiura and Holland, 2002; Heinrich et al., 2022).
Three species of shark (C. amblyrhynchos, T. obesus, S. tigrinum) and two of the three modelled species of stingray (P. jenkinsii, T. meyeni) were most commonly observed when the tide was high. Sightings of four of the ray species (M. alfredi, M. kuhlii, P. jenkinsii, T. meyeni) were most common when the tidal range (flow) was greatest. Tides can significantly influence the movements and habitat use of elasmobranchs (O’Shea et al., 2011; Blevins, 2012). A ray’s morphology and undulatory mode of locomotion makes them ideally suited to utilize tides and currents to extend their movements (Gilliam and Sullivan, 1993; Silliman, 1999; O’Shea et al., 2011; Blevins, 2012). Eagle rays (Aetobatus narinari), southern stingrays (Dasyatis americana), and Kuhl’s mask rays (N. caeruleopunctata) have all been shown to use tides to aid their movements between habitats in the Bahamas and Western Australia (Gilliam and Sullivan, 1993; Silliman, 1999; O’Shea et al., 2011). Both P. jenkinsii and M. alfredi have been observed accessing reef habitats in the studied region during high tides, and their close taxonomic relationship with T. meyeni and M. kuhlii may suggest the tide has a significant influence on large-bodied ray species in the region (Rohner et al., 2013; Keeping et al., 2021). The observations presented here suggest that the moon illumination and the tides significantly influence elasmobranch visits to reefs in southern Mozambique (O’Shea et al., 2011; Rohner et al., 2013; Keeping et al., 2021). Future investigations should aim to examine if this is linked with their foraging patterns (O’Shea et al., 2011; Rohner et al., 2013).
Understanding environmental, spatial, and temporal patterns in elasmobranch reef use can have significant applications when considering how their populations should be managed (Dulvy et al., 2014; Hsu et al., 2022; Maioli et al., 2023). Having the ability to group species based on the factors that influence their patterns of reef use has proven useful when managing elasmobranch communities throughout the world (Dulvy et al., 2021; Hsu et al., 2022; Maioli et al., 2023).
The NMDS findings indicate that specific environmental, temporal, and spatial parameters influence the reef visits of species in closely related elasmobranch genera in similar ways. The three species of mobula ray (M. alfredi, M. birostris, M. kuhlii) formed a group within the NMDS analysis. Their visits most commonly occurred in the Southern Region during specific months (M. alfredi and M. kuhlii: October; M. birostris: May) during full or new moons. This matches findings from prior investigations on these species both in southern Mozambique (Marshall and Bennett, 2010; Rohner et al., 2013) and throughout these species’ range (Dewar et al., 2008; Osada, 2010; Couturier et al., 2012). The three species of shark formed the second cluster, with their visits most commonly occurring offshore, on a seasonal basis, when water temperatures were either warmest (T. obesus, C. amblyrhynchos) or coldest (S. tigrinum) (Heupel et al., 2019; Dulvy et al., 2021). Multiple prior studies have linked seasonal elasmobranch sightings with the species becoming reproductively active in a region (Brunnschweiler and Baensch, 2011; Brunnschweiler et al., 2014; Daly et al., 2023). It is possible that the increase in sightings of these species during this period may be linked with their reproductive behaviour (Brunnschweiler and Baensch, 2011; Brunnschweiler et al., 2014; Heupel et al., 2019).
The model outputs and species clusters that are identified here provide insights into the reefs where several elasmobranch species commonly aggregate. Reflecting this in the management of regional reefs may benefit several threatened elasmobranch species. Fishing pressures should be carefully managed around these reefs as they could significantly impact the regional elasmobranch community in an Important Shark and Ray Area (Jabado et al., 2024). Future investigations should consider patterns in the reef use of rarer elasmobranch species and the ecological characteristics of the reefs where elasmobranchs congregate.
The raw data supporting the conclusions of this article will be made available by the authors, without undue reservation.
The animal study was approved by University of Chester Board of Ethics. The study was conducted in accordance with the local legislation and institutional requirements.
CM: Conceptualization, Data curation, Formal analysis, Investigation, Methodology, Project administration, Resources, Software, Supervision, Validation, Visualization, Writing – original draft, Writing – review & editing, Funding acquisition. SO: Conceptualization, Methodology, Project administration, Supervision, Writing – original draft, Writing – review & editing, Formal analysis. ML: Resources, Validation, Writing – review & editing, Funding acquisition, Methodology, Project administration. LG: Project administration, Resources, Validation, Writing – review & editing, Visualization, Writing – original draft. JB: Project administration, Supervision, Writing – review & editing, Methodology, Resources, Validation. AL: Project administration, Supervision, Writing – review & editing, Methodology, Resources.
The author(s) declare that no financial support was received for the research, authorship, and/or publication of this article.
The authors declare that the research was conducted in the absence of any commercial or financial relationships that could be construed as a potential conflict of interest.
All claims expressed in this article are solely those of the authors and do not necessarily represent those of their affiliated organizations, or those of the publisher, the editors and the reviewers. Any product that may be evaluated in this article, or claim that may be made by its manufacturer, is not guaranteed or endorsed by the publisher.
The Supplementary Material for this article can be found online at: https://www.frontiersin.org/articles/10.3389/fmars.2024.1408727/full#supplementary-material
Supplementary Figure 1 | Plotted partial effects of each of the coefficients formed when comparing the relationship between the number of individuals of the studied species [(A) Triaenodon obesus, (B) Stegostoma tigrinum, (C) Carcharhinus amblyrhynchos, (D) Taeniurops meyeni, (E) Mobula kuhlii, (F) Mobula birostris] and the mean bottom temperature [recorded per transect to the nearest degree Celsius (°C)] recorded during each transect. The gradient of the plotted black line represents the change in the relationship between the plotted partial coefficients and the bottom temperature, whilst the dashed lines represent the 95% confidence interval. The black bars along the x axis indicate the sampling distribution throughout the recorded water temperature.
Supplementary Figure 2 | Plotted partial effects of each of the significant coefficients formed when comparing the relationship between the number of individuals of eight of the studied species [(A) Taeniurops meyeni, (B) Mobula kuhlii, (C) Mobula alfredi, (D) Mobula birostris, (E) Pateobatis jenkinsii, (F) Carcharhinus amblyrhynchos, (G) Stegostoma tigrinum, (H) Triaenodon obesus] and moon illumination (recorded daily to the nearest percentage) recorded for each transect. The gradient of the plotted black line represents the change in the relationship between the calculated partial coefficients and the moon illumination, whilst the dashed lines surrounding the solid black line represent the 95% confidence interval. The black bars along the x axis indicate the sampling distribution throughout the recorded percentage of moon illumination (0 – 100%).
Supplementary Figure 3 | Plotted partial effects of each of the significant coefficients formed when modelling the relationship between the number of individuals of six of the studied species [(A) Taeniurops meyeni, (B) Pateobatis jenkinsii, (C) Mobula kuhlii (D) Mobula alfredi] and the tidal range (recorded daily to the nearest centimeter) recorded for each transect. The gradient of the plotted black line represents the change in the relationship between the calculated partial coefficients and the recorded values of the tidal range, the sampling of which is represented by the solid black bars along the x axis. The dashed lines surrounding the solid black line represent the 95% confidence interval.
Afonso P. S. (2006). Country review: Mozambique. Review of the state of the world marine capture fisheries management: Indian Ocean. FAO Fisheries Tech. Paper 488), 415–423.
Alldredge A. L., King J. M. (1980). Effects of moonlight on the vertical migration patterns of demersal zooplankton. J. Exp. Mar. Biol. Ecol. 44, 133–156. doi: 10.1016/0022-0981(80)90150-1
Asher J., Williams I. D., Harvey E. S. (2017). Mesophotic depth gradients impact reef fish assemblage composition and functional group partitioning in the Main Hawaiian Islands. Front. Mar. Sci. 4, 98. doi: 10.3389/fmars.2017.00098
Barley S. C., Meekan M. G., Meeuwig J. J. (2017). Species diversity, abundance, biomass, size, and trophic structure of fish on coral reefs in relation to shark abundance. Mar. Ecol. Prog. Ser. 565, 163–179. doi: 10.3354/meps11981
Beckman J. E. (2017). Foraging ecology of a benthic feeding elasmobranch, Neotrygon Australiae. Brisbane, Australia: Univeristy of Queensland. Master of Philosophy Thesis.
Behrenfeld M. J., Boss E., Siegel D. A., Shea D. M. (2005). Carbon-based ocean productivity and phytoplankton physiology from space. Global Biogeochemical Cycles 19. doi: 10.1029/2004GB002299
Berehulyak O., Vorobel R. (2020). “The algebraic model with an asymmetric characteristic of logarithmic transformation,” in 2020 IEEE 15th International Conference on Computer Sciences and Information Technologies (CSIT), Vol. 2. 119–122 (IEEE).
Blevins E. L. (2012). Undulatory locomotion in freshwater stingray Potamotrygon orbignyi: kinematics, pectoral fin morphology, and ground effects on rajiform swimming. Cambridge, Massachusetts, USA: Harvard University. Doctoral dissertation.
Borsa P., Shen K. N., Arlyza I. S., Hoareau T. B. (2016). Multiple cryptic species in the blue-spotted maskray (Myliobatoidei: Dasyatidae: Neotrygon spp.): An update. Comptes Rendus Biologies 339, 417–426. doi: 10.1016/j.crvi.2016.07.004
Brunnschweiler J. M., Abrantes K. G., Barnett A. (2014). Long-term changes in species composition and relative abundances of sharks at a provisioning site. PloS One 9, e94148. doi: 10.1371/journal.pone.0086682
Brunnschweiler J. M., Baensch H. (2011). Seasonal and long-term changes in relative abundance of bull sharks from a tourist shark feeding site in Fiji. PloS One 6, e16597. doi: 10.1371/journal.pone.0016597
Burgess K. B., Couturier L. I., Marshall A. D., Richardson A. J., Weeks S. J., Bennett M. B. (2016). Manta birostris, predator of the deep? Insight into the diet of the giant manta ray through stable isotope analysis. R. Soc. Open Sci. 3, 160–177. doi: 10.1098/rsos.160717
Clarke K. R., Green R. H. (1988). Statistical design and analysis for a’biological effects’ study. Mar. Ecol. Prog. Ser. 46 (1/3), 213–226. doi: 10.3354/meps046213
Clarke K. R., Somerfield P. J., Chapman M. G. (2006). On resemblance measures for ecological studies, including taxonomic dissimilarities and a zero-adjusted Bray–Curtis coefficient for denuded assemblages. J. Exp. Mar. Biol. Ecol. 330, 55–80. doi: 10.1016/j.jembe.2005.12.017
Coleman R. R., Copus J. M., Coffey D. M., Whitton R. K., Bowen B. W. (2018). Shifting reef fish assemblages along a depth gradient in Pohnpei, Micronesia. PeerJ 6, 158–169. doi: 10.7717/peerj.4650
Costa A., Pereira M. A., Motta H., Schleyer M. (2005). “Status of coral reefs of Mozambique: 2004,” in Coral Reef Degradation in the Indian Ocean: Status Report (Kalmar, Sweden: CORDIO, Department of Biology and Environmental Sciences, University of Kalmar), 54–60.
Couturier L. I. E., Marshall A. D., Jaine F. R. A., Kashiwagi T., Pierce S. J., Townsend K. A., et al. (2012). Biology, ecology, and conservation of the Mobulidae. J. Fish Biol. 80, 1075–1119. doi: 10.1111/j.1095-8649.2012.03264.x
Daly R., Venables S. K., Rogers T. D., Filmalter J. D., Hempson T. N., Murray T. S., et al. (2023). Persistent transboundary movements of threatened sharks highlight the importance of cooperative management for effective conservation. Mar. Ecol. Prog. Ser. 720, 117–131. doi: 10.3354/meps14413
Davis M. A., Dawes C. J. (1981). Seasonal photosynthetic and respiratory responses of the intertidal red alga, Bostrychia binderi Harvey (Rhodophyta, Ceramiales) from a mangrove swamp and a salt marsh. Phycologia 20, 165–173. doi: 10.2216/i0031-8884-20-2-165.1
Deakos M. H. (2012). The reproductive ecology of resident manta rays (Manta alfredi) off Maui, Hawaii, with an emphasis on body size. Environ. Biol. Fishes 94, 443–456. doi: 10.1007/s10641-011-9953-5
Desbiens A. A., Roff G., Robbins W. D., Taylor B. M., Castro‐Sanguino C., Dempsey A., et al (2021). Revisiting the paradigm of shark-driven trophic cascades in coral reef ecosystems. Ecology 102 (4), e03303.
Dewar H., Mous P., Domeier M., Muljadi A., Pet J., Whitty J. (2008). Movements and site fidelity of the giant manta ray, Manta birostris, in the Komodo Marine Park, Indonesia. Mar. Biol. 155, 121–133. doi: 10.1007/s00227-008-0988-x
Drazen J. C., Lisa G., Domokos R. (2011). Micronekton abundance and biomass in Hawaiian waters as influenced by seamounts, eddies, and the moon. Deep Sea Res. Part I: Oceanographic Res. Papers 58, 557–566. doi: 10.1016/j.dsr.2011.03.002
Dudgeon C. L., Lanyon J. M., Semmens J. M. (2013). Seasonality and site fidelity of the zebra shark, Stegostoma fasciatum, in southeast Queensland, Australia. Anim. Behav. 85, 471–481. doi: 10.1016/j.anbehav.2012.12.013
Duffy C. A. J., Forrester N. D., Gibson T. K., Hathaway S. (2017). Occurrence of the whitetip reef shark Triaenodon obesus at the Kermadec Islands, Southwest Pacific Ocean. New Z. J. Zoology 44, 354–360. doi: 10.1080/03014223.2017.1340312
Dulvy N. K., Fowler S. L., Musick J. A., Cavanagh R. D., Kyne P. M., Harrison L. R., et al. (2014). Extinction risk and conservation of the world’s sharks and rays. Elife 3, 101–113. doi: 10.7554/eLife.00590
Dulvy N. K., Pacoureau N., Rigby C. L., Pollom R. A., Jabado R. W., Ebert D. A., et al. (2021). Overfishing drives over one-third of all sharks and rays toward a global extinction crisis. Curr. Biol. 31, 4773–4787. doi: 10.1016/j.cub.2021.08.062
Dushaw B. D., Menemenlis D.. (2023). Resonant diurnal internal tides in the North Atlantic: 2. Modeling. Geophysical Research Letters 50 (3), e2022GL101193.
Elisio M., Awruch C. A., Massa A. M., Macchi G. J., Somoza G. M. (2019). Effects of temperature on the reproductive physiology of female elasmobranchs: the case of the narrownose smooth-hound shark (Mustelus schmitti). Gen. Comp. Endocrinol. 284, 113–122. doi: 10.1016/j.ygcen.2019.113242
Espinoza M., Heupel M. R., Tobin A. J., Simpfendorfer C. A. (2015). Residency patterns and movements of grey reef sharks (Carcharhinus amblyrhynchos) in semi-isolated coral reef habitats. Mar. Biol. 162, 343–358. doi: 10.1007/s00227-014-2572-x
Field I. C., Meekan M. G., Buckworth R. C., Bradshaw C. J. (2009). Susceptibility of sharks, rays and chimaeras to global extinction. Adv. Mar. Biol. 56, 275–363. doi: 10.1016/S0065-2881(09)56004-X
Filous A., Friedlander A., Wolfe B., Stamoulis K., Scherrer S., Wong A., et al. (2017). Movement patterns of reef predators in a small isolated marine protected area with implications for resource management. Mar. Biol. 164, 1–16. doi: 10.1007/s00227-016-3043-3
Freeman A. (2019). A nursery for the Giant Shovel-nosed Ray (Glaucostegus typus) in the northern Great Barrier Reef. North Queensland Nat. 49, 34–37. doi: 10.3316/informit.460799084031872
Friedlander A. M., Ballesteros E., Breedy O., Naranjo-Elizondo B., Hernández N., Salinas-de-León P., et al. (2022). Nearshore marine biodiversity of Osa Peninsula, Costa Rica: Where the ocean meets the rainforest. PlosOne 17, e0271731. doi: 10.1371/journal.pone.0271731
Gilliam D. S., Sullivan K. M. (1993). Diet and feeding habits of the southern stingray Dasyatis americana in the central Bahamas. Bull. Mar. Sci. 52, 1007. Available at: https://nsuworks.nova.edu/occ_facarticles/560
Heinrich D. D., Huveneers C., Houslay T. M., Dhellemmes F., Brown C. (2022). Shark habituation to a food-related olfactory cue. Anim. Behav. 187, 147–165. doi: 10.1016/j.anbehav.2022.03.003
Heupel M. R., Papastamatiou Y. P., Espinoza M., Green M. E., Simpfendorfer C. A. (2019). Reef shark science–key questions and future directions. Front. Mar. Sci. 6, 12. doi: 10.3389/fmars.2019.00012
Heupel M. R., Simpfendorfer C. A. (2014). Importance of environmental and biological drivers in the presence and space use of a reef-associated shark. Mar. Ecol. Prog. Ser. 496, 47–57. doi: 10.3354/meps10529
Holzwarth S. R., DeMartini E. E., Zgliczynski B. J., Laughlin J. L. (2006). Sharks and jacks in the Northwestern Hawaiian Islands from towed-diver surveys 2000–2003. Atoll Res. Bull., 308–314.
Hsu H. H., Yacoubi L., Lin Y. J., Le Loc’h F., Katsanevakis S., Giovos I., et al. (2022). Elasmobranchs of the western Arabian Gulf: Diversity, status, and implications for conservation. Regional Stud. Mar. Sci. 56, 102–117. doi: 10.1016/j.rsma.2022.102637
Jabado R. W., Kyne P. M., García-Rodríguez E., Charles R., Armstrong A. O., Mouton T. L., et al. (2024). Western Indian Ocean: A regional compendium of Important Shark and Ray Areas. (Dubai: IUCN SSC Shark Specialist Group). doi: 10.59216/ssg.isra.2023.r7
Jain G. C., Consul P. C. (1971). A generalized negative binomial distribution. SIAM J. Appl. Mathematics 21, 501–513. doi: 10.1137/0121056
Kajiura S. M., Holland K. N. (2002). Electroreception in juvenile scalloped hammerhead and sandbar sharks. J. Experiment. Biol. 205(23), 3609–3621. doi: 10.1242/jeb.205.23.3609
Keeping J., Milligan R. J., Reeve-Arnold K., Bailey D. (2021). Trends in sightings of the stingrays of southern Mozambique. Mar. Freshw. Res. 72, 1824–1837. doi: 10.1071/MF21013
Kruskal J. B. (1964). Nonmetric multidimensional scaling: a numerical method. Psychometrika 29, 115–129. doi: 10.1007/BF02289694
Kyne P. M., Bennett M. B., Gribble N. A., Johnson J. W. (2012). The biology and ecology of the blotched fantail ray Taeniura meyeni in a coral reef lagoon system in Papua New Guinea. Mar. Biol. 159, 1751–1763.
Last P. R., Stevens J. D. (1994). Morphology of stingrays (Chondrichthyes: Batoidea) with emphasis on disk width. J. Fish Biol. 45, 579–605.
Last P. R., Stevens J. D. (2009). Sharks and rays of Australia. 2nd ed. (Collingwood (Australia: CSIRO Publishing).
Logan A., Sealey K. S. (2013). The reefs of the Turks and Caicos Islands (Coral Reefs of the United Kingdom Overseas Territories) Coral Reefs of the World, vol 4. Springer, Dordrecht 97–114. doi: 10.1007/978-94-007-5965-7_9
Luo J. J., Sasaki W., Masumoto Y. (2012). Indian Ocean warming modulates Pacific climate change. Proc. Natl. Acad. Sci. 109, 18701–18706. doi: 10.1073/pnas.1210239109
Maioli F., Weigel B., Chiarabelli E., Manfredi C., Anibaldi A., Isailović I., et al. (2023). Influence of ecological traits on spatio-temporal dynamics of an elasmobranch community in a heavily exploited basin. Sci. Rep. 13, 95–96. doi: 10.1038/s41598-023-36038-y
Malauene B. S. (2010). Shelf edge upwelling off Northern Mozambique. Cape Town, South Africa: University of Cape Town. Master’s Thesis.
Marshall A. D. (2008). Biology and population ecology of Manta birostris in southern Mozambique. Brisbane, Australia: University of Queensland. Doctoral Thesis.
Marshall A. D., Bennett M. B. (2010). Reproductive ecology of the reef manta ray Manta alfredi in southern Mozambique. J. Fish Biol. 77, 169–190. doi: 10.1111/j.1095-8649.2010.02669.x
McCune B., Grace J. B., Urban D. L. (2002). Analysis of ecological communities. (Vol. 28, pp. 1–300). Gleneden Beach, OR: MjM software design. doi: 10.1016/S0022-0981(03)00091-1
McCune B., Mefford M. J. (1999). PC-ORD: multivariate analysis of ecological data; Version 4 for Windows;[User’s Guide] (MjM software design).
McKibben J. N., Nelson D. R. (1986). Patterns of movement and grouping of gray reef sharks, Carcharhinus amblyrhynchos, at Enewetak, Marshall Islands. Bull. Mar. Sci. 38, 89–110.
Murie C., Spencer M., Oliver S. P. (2020). Current strength, temperature, and bodyscape modulate cleaning services for giant manta rays. Mar. Biol. 167, 1–11. doi: 10.1007/s00227-020-3674-2
O’Connor B., Cullain N. (2021). Distribution and community structure of at-risk and Data Deficient elasmobranchs in Zavora Bay, Mozambique. Afr. J. Mar. Sci. 43, 521–532. doi: 10.2989/1814232X.2021.1997814
Oliver S. P., Hussey N. E., Turner J. R., Beckett A. J. (2011). Oceanic sharks clean at coastal seamount. PloS One 6, e14755. doi: 10.1371/journal.pone.0014755
Osada K. (2010). Relationship of zooplankton emergence, manta ray abundance and SCUBA diver usage Kona Hawaii. Hawai’i: University of Hawai’i at Hilo. Doctoral Thesis.
O’Shea O. R., Kingsford M. J., Seymour J. (2010). Tide-related periodicity of manta rays and sharks to cleaning stations on a coral reef. Mar. Freshw. Res. 61, 65–73. doi: 10.1071/MF08301
O’Shea O. R., Thums M., Van Keulen M., Meekan M. (2011). Bioturbation by stingrays at Ningaloo reef, Western Australia. Mar. Freshw. Res. 63, 189–197. doi: 10.1071/MF11180
Peñaherrera C., Hearn A. R., Kuhn A. (2012). Diel use of a saltwater creek by white-tip reef sharks Triaenodon obesus (Carcharhiniformes: Carcharhinidae) in Academy Bay, Galapagos Islands. Rev. Biología Trop. 60, 735–743. doi: 10.15517/rbt.v60i2.3993
Pierce S. J., Pardo S. A., Bennett M. B. (2009). Reproduction of the blue-spotted maskray Neotrygon kuhlii (Myliobatoidei: Dasyatidae) in south-east Queensland, Australia. J. Fish Biol. 74, 1291–1308. doi: 10.1111/j.1095-8649.2009.02202.x
Pierce S. J., Trerup M., Williams C., Tilley A., Marshall A. D., Raba N. (2008). Shark fishing in Mozambique: A preliminary assessment of artisanal fisheries. Eyes on the Horizon, Maputo.
Puckridge M., Last P. R., White W. T., Andreakis N. (2013). Phylogeography of the Indo-West Pacific maskrays (Dasyatidae, Neotrygon): A complex example of chondrichthyan radiation in the Cenozoic. Ecol. Evol. 3, 217–232. doi: 10.1002/ece3.448
R Core Team. (2024). R: A Language and Environment for Statistical Computing. R Foundation for Statistical Computing, Vienna, Austria. Available at: https://www.R-project.org/
Rizkiantino R., Binol R. M. (2020). The conjecture of causa mortis in Jenkins’ Whipray pateobatis jenkinsii (Annandale 1909): A Case Report Dugaan Penyebab Kematian pada Ikan Pari Cambuk Jenkins Pateobatis jenkinsii (Annandale 1909): laporan kasus. Jurnal Sain Veteriner, 38(1). doi: 10.22146/jsv.48850
Rohner C. A., Pierce S. J., Marshall A. D., Weeks S. J., Bennett M. B., Richardson A. J. (2013). Trends in sightings and environmental influences on a coastal aggregation of manta rays and whale sharks. Mar. Ecol. Prog. Ser. 482, 153–168. doi: 10.3354/meps10290
Schlaff A. M., Heupel M. R., Simpfendorfer C. A. (2014). Influence of environmental factors on shark and ray movement, behaviour and habitat use: a review. Rev. Fish Biol. Fisheries 24, 1089–1103. doi: 10.1007/s11160-014-9364-8
Schleyer M. H., Downey-Breedt N. J., Benayahu Y. (2019). Species composition of Alcyonacea (Octocorallia) on coral reefs at Europa Island and associated connectivity across the Mozambique Channel. Mar. Biodiversity 49, 2485–2491. doi: 10.1007/s12526-019-00975-7
Schouten M. W., de Ruijter W. P., Van Leeuwen P. J., Ridderinkhof H. (2003). Eddies and variability in the Mozambique channel. Deep Sea Res. Part II: Topical Stud. Oceanography 50, 1987–2003. doi: 10.1016/S0967-0645(03)00042-0
Sherman C. S., Simpfendorfer C. A., Pacoureau N., Matsushiba J. H., Yan H. F., Walls R. H., et al. (2023). Half a century of rising extinction risk of coral reef sharks and rays. Nat. Commun. 14, 15. doi: 10.1038/s41467-022-35091-x
Silliman W. (1999). Behavioral biology of the spotted eagle ray, Aetobatus narinari. Bahamas J. Sci. 7, 13–20.
Simpfendorfer C. A., Heithaus M. R., Heupel M. R., MacNeil M. A., Meekan M., Harvey E., et al. (2023). Widespread diversity deficits of coral reef sharks and rays. Science 380, 1155–1160. doi: 10.1126/science.ade4884
Stewart K. R., Lewison R. L., Dunn D. C., Bjorkland R. H., Kelez S., Halpin P. N., et al. (2010). Characterizing fishing effort and spatial extent of coastal fisheries. PloS One 5, e14451. doi: 10.1371/journal.pone.0014451
Tung A. M. T., Mozambique M. (2016). Sharks caught in Mozambican waters. Maputo, Mozambique: University of Eduardo Mondlane.
Venables W. N., Ripley B. D. (2002). Random and Mixed Effects. In: Modern Applied Statistics with S. 4th ed. (New York, NY: Springer). doi: 10.1007/978-0-387-21706-2_10
Vianna G. M., Meekan M. G., Meeuwig J. J., Speed C. W. (2013). Environmental influences on patterns of vertical movement and site fidelity of grey reef sharks (Carcharhinus amblyrhynchos) at aggregation sites. PloS One 8, e60331. doi: 10.1371/journal.pone.0060331
White W. T., Dharmadi (2007). Species and size compositions and reproductive biology of rays (Chondrichthyes, Batoidea) caught in target and non-target fisheries in eastern Indonesia. J. Fish Biol. 70, 1809–1837. doi: 10.1111/j.1095-8649.2007.01458.x
White E. R., Myers M. C., Flemming J. M., Baum J. K. (2015). Shifting elasmobranch community assemblage at Cocos Island—an isolated marine protected area. Conserv. Biol. 29, 1186–1197. doi: 10.1111/cobi.12478
Whitney N. M., Pyle R. L., Holland K. N., Barcz J. T. (2012). Movements, reproductive seasonality, and fisheries interactions in the whitetip reef shark (Triaenodon obesus) from community-contributed photographs. Environ. Biol. Fishes 93, 121–136. doi: 10.1007/s10641-011-9897-9
Wolff N. H., Mumby P. J., Devlin M., Anthony K. R. (2018). Vulnerability of the Great Barrier Reef to climate change and local pressures. Global Change Biol. 24, 1978–1991. doi: 10.1111/gcb.14043
Wood S. N. (2017). Generalized Additive Models: An Introduction with R, Second Edition (2nd ed.). (Chapman and Hall/CRC), (161–194). doi: 10.1201/9781315370279
Keywords: elasmobranchs, behavior, environment, habitat use, reef habitat, environmental change, aggregation sites
Citation: Murie CJG, Oliver SP, Gavard L, Lebrato M, Brown J and Lawrence A (2024) Environmental factors modulate the distribution of elasmobranchs in southern Mozambique. Front. Mar. Sci. 11:1408727. doi: 10.3389/fmars.2024.1408727
Received: 28 March 2024; Accepted: 30 April 2024;
Published: 21 May 2024.
Edited by:
Xuelei Zhang, Ministry of Natural Resources, ChinaReviewed by:
Peter Gausmann, Ruhr University Bochum, GermanyCopyright © 2024 Murie, Oliver, Gavard, Lebrato, Brown and Lawrence. This is an open-access article distributed under the terms of the Creative Commons Attribution License (CC BY). The use, distribution or reproduction in other forums is permitted, provided the original author(s) and the copyright owner(s) are credited and that the original publication in this journal is cited, in accordance with accepted academic practice. No use, distribution or reproduction is permitted which does not comply with these terms.
*Correspondence: Calum J. G. Murie, Y2FsdW1AdW5kZXJ3YXRlci1hZnJpY2EuY29t
Disclaimer: All claims expressed in this article are solely those of the authors and do not necessarily represent those of their affiliated organizations, or those of the publisher, the editors and the reviewers. Any product that may be evaluated in this article or claim that may be made by its manufacturer is not guaranteed or endorsed by the publisher.
Research integrity at Frontiers
Learn more about the work of our research integrity team to safeguard the quality of each article we publish.