
95% of researchers rate our articles as excellent or good
Learn more about the work of our research integrity team to safeguard the quality of each article we publish.
Find out more
ORIGINAL RESEARCH article
Front. Mar. Sci. , 26 June 2024
Sec. Ocean Observation
Volume 11 - 2024 | https://doi.org/10.3389/fmars.2024.1406381
This article is part of the Research Topic Advances in Autonomous Ships (AS) For Ocean Observation View all 12 articles
 Noriko Tada1*
 Akira Nagano2
 Satoru Tanaka1
 Hiroshi Ichihara1,3
 Daisuke Suetsugu1
 Daisuke Matsuoka4
 Makoto Ito2
 Tatsu Kuwatani1
 Makio C. Honda2
Monitoring of volcanic eruptions, the atmosphere, and the ocean, along with their scientific understanding, can be achieved through multifaceted observations that include camera images, topographic deformations, elastic waves, geology, and the chemical constituents and temperatures of air and water. However, regions of increased volcanic activity and/or shallow waters are difficult to access by crewed ship due to danger or grounding risk. To overcome these difficulties, we used an uncrewed surface vessel (USV), Bluebottle, to operate multiple observation around oceanic volcanoes in the Bonin Island arc in May 2023. Even under adverse sea conditions, the USV successfully reached a remote observation site, Nishinoshima volcano, which is about 130 km away from Chichijima Island where the USV started out from. The USV conducted five days of observations at shallower than 500 m water depth around Nishinoshima Island, the first time after violent eruptions of Nishinoshima in June 2020. The USV is equipped with various sensors and data collection technologies, including a single-beam echosounder, oceanographic and meteorological sensors, an Acoustic Doppler Current Profiler, and a time-lapse camera. These tools have provided a multi-dimensional view of the underwater landscape and marine conditions near the volcano for the first time in the world. We obtained new bathymetric data, sub-bottom images, and measurements of temperature, salinity, and pH. This study leverages advanced technologies and innovative methodologies to enhance our understanding of marine and geological phenomena.
Volcanic activities, many of which occur in volcanic islands and submarine volcanoes in the Earth, can potentially cause severe damage to human activities, as the 2022 eruption of the Hunga Tonga-Hunga Ha’aoai volcano generated a huge amount of volcanic ash that reached the mesosphere (e.g., Matoza et al., 2022) and a global tsunami (e.g., Proud et al., 2022). Monitoring of volcanic eruptions and their scientific understanding can be achieved by multifaceted observations, including camera images, topographic deformations, elastic waves, geology, and chemical constituents and temperatures of air and water. Recently, the understanding and monitoring of inland volcanoes have progressed based on integrated land-based observations (e.g., Iguchi et al., 2019). However, studies of oceanic volcanoes have lagged far behind those of inland volcanoes due to fundamental inaccessibility and difficulty for the scientists to deploy instruments. In addition, observations by crewed ship are very costly. Moreover, areas inaccessible to crewed vessels, such as regions of increased volcanic activity and/or shallow waters prone to grounding risks, become blind spots for observations even in coastal waters.
Sea surface currents vary on wide ranges from basin-scale to mesoscale (~10–100 km) and smaller scale (i.e., submesoscale) and decadal to daily scales. Recently, mesoscale and submesoscale eddies have been highlighted because they may contribute to the transport and redistribution of heat and materials (Ando et al., 2021). The kinetic energies of mesoscale and submesoscale eddies are limited to western boundary currents such as the Kuroshio and the Gulf Stream and around topographies such as islands and seamounts. Mesoscale and submesoscale eddies in the Kuroshio Extension region have been intensively studies (e.g., Inoue et al., 2016; Nagano et al., 2016). Meanwhile, observations of mesoscale and submesoscale features generated by topographies are quite limited except for areas performed in specific projects (Johnston et al., 2019). In addition, the atmosphere is considered to be modified by the temperature variations associated with topography-induced mesoscale and submesoscale ocean features through the air–sea interaction but the modification has not been revealed yet.
The advancements in automation and miniaturization of observing instruments have enabled the efficient and cost-effective execution of observations through the use of uncrewed surface vessels (USVs) (Patterson et al., 2022). Besides, such small platforms do not disturb the atmosphere and ocean as much as shipboard observations (Nagano et al., 2022). Thus, uncrewed observations provide a remarkable means realizing data acquisition in previously inaccessible oceanic regions. In particular, USV’s observations of oceanic volcanoes have great potential in term of 1) the ability to observe in the near-shore region can fill observation gap the above-mentioned, 2) multiple USVs can be deployed around the volcano to build a cost-effective observation network, and 3) USVs can obtain atmospheric and oceanic parameters related to volcanic activities and the topography-generated eddies (however, note that chemical investigations often require sampling and analysis of water from volcanic lakes on land). On the other hand, USV observations still face challenges such as navigation permit issues and lack of fuel, power, and communication capacity.
Nishinoshima Island and Fukutoku-Oka-no-Ba submarine volcano (hereafter, FOB) in the Bonin Island arc (Figure 1) are recently erupted volcanoes with the above-mentioned observational difficulties. Nishinoshima Island is an uninhabited island located about 1000 km south of Tokyo and about 130 km west of the nearest inhabited island, Chichijima Island. Nishinoshima volcano resumed volcanic activity in 2013 for the first time in about 40 years and has been actively erupting ever since, significantly enlarging the portion of the island above sea level (Maeno et al., 2021). In June 2020, due to navigation warnings, it became not possible to go within 1.5 km of the summit crater of Nishinoshima, resulting in blank areas on the latest topographical and nautical charts.
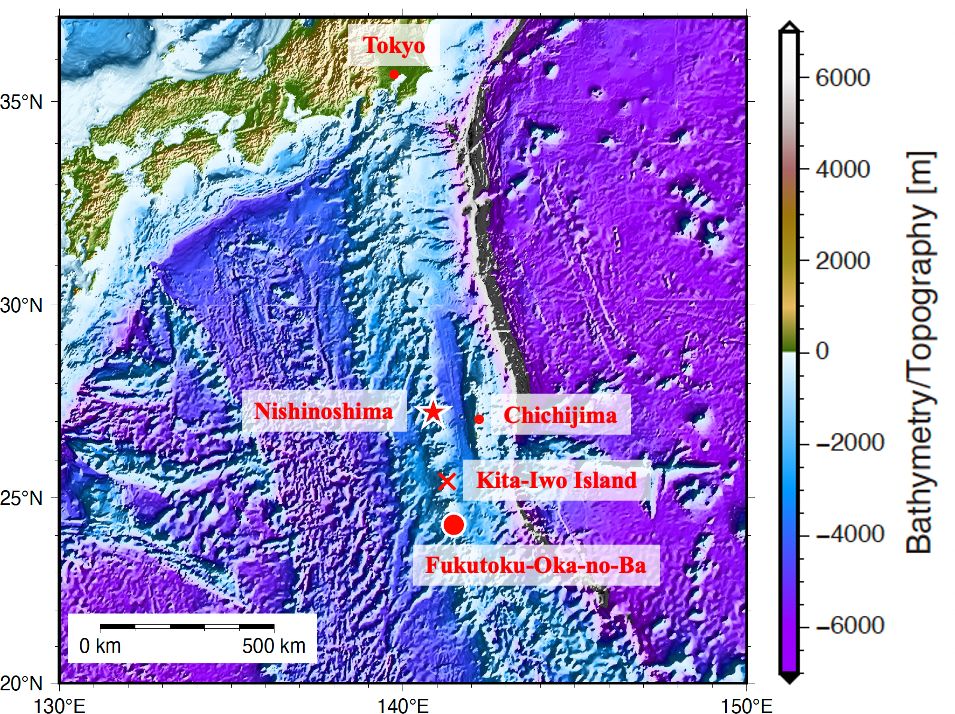
Figure 1 Location of Chichijima Island, Nishinoshima Island, Kita-Iwo Island, and Fukutoku-Oka-no-Ba submarine volcano (FOB). Elevation data are from the ETOPO1 global relief model (NOAA, 2009).
FOB is situated about 335 km south of Nishinoshima Island. On August 13, 2021, FOB experienced a major eruption, producing a vast amount of pumice and an eruption column up to 16,000 m (e.g., Maeno et al., 2022; Yoshida et al., 2022). An island temporarily emerged but was eroded by waves and disappeared below the sea surface about three months later. FOB is expected to have very shallow waters, making observation by crewed vessels risky due to the high probability of grounding. After significant eruptions at both volcanoes, attempts were made to acquire new bathymetric data to compare with pre-eruption maps. We do not have any bathymetric data, i.e., depth data, following eruption, so it is unclear whether the changes in depth are gradual or if features like side volcanoes or chimneys have formed, suddenly making the water shallower. Additionally, discolored water and bubbles, presumably caused by volcanic activity, have been observed around Nishinoshima Island and crater area of FOB, and the potential impacts on crewed ships and their occupants are not yet understood. Therefore, in the 2022 crewed voyage, we adopted a precautionary approach by not approaching areas shallower than 500 meters with crewed ships.
In this paper, we present a considerably challenging observation conducted using a single engineless USV targeting the volcanoes Nishinoshima and FOB, which are located a significant distance from any inhabited islands. The study includes multiple observational objectives deploying USVs in remote volcanic regions for the first time in the world. First, the USV and the observation instruments mounted on the USV are described. Then an overview of the operations from departure to observation and return is given. Next, the obtained data are described. Based on these results, the usefulness and problems of these observations, including operations, are discussed.
We utilized a USV Bluebottle (Supplementary Table S1; Figure 2), developed and owned by the Australian private company OCIUS (https://ocius.com.au/). The Bluebottle boasts a total length of 6.8 m and, when its sail is deployed, reaches a height of approximately 5.0 m above the waterline. The vessel is designed with a payload capacity of up to 350 kg. Figures 2A, B illustrate the Bluebottle with its sail raised and lowered, respectively, showcasing the vessel’s versatility in adapting to various marine research and observation conditions. The Bluebottle is propelled primarily by wind power and supplemented by wave and solar power (photovoltaics) and does not use an engine. Remote control, facilitated through the use of Iridium, adjusts the sail angle for wind-driven navigation from a land-based station. The current location of the Bluebottle, along with essential navigation information such as wind direction and speed, and the view ahead, can be monitored nearly in real-time via a web interface (Figure 3). The vessel sails at speed of 2–4 knots under the solar-powered mode and 0.5–1.5 knots wave-powered mode. The nominal maximum speed can reach 6.0 knots. The Bluebottle is equipped with an Automatic Identification System (AIS), a 360-degree time-lapse camera, radar, lights, and a horn. OCIUS monitors Bluebottle’s navigation around the clock using AIS, radar, and the 360-degree camera. While the vessel lacks automated obstacle avoidance capabilities, potential collisions or accidents are mitigated through remote control operation.
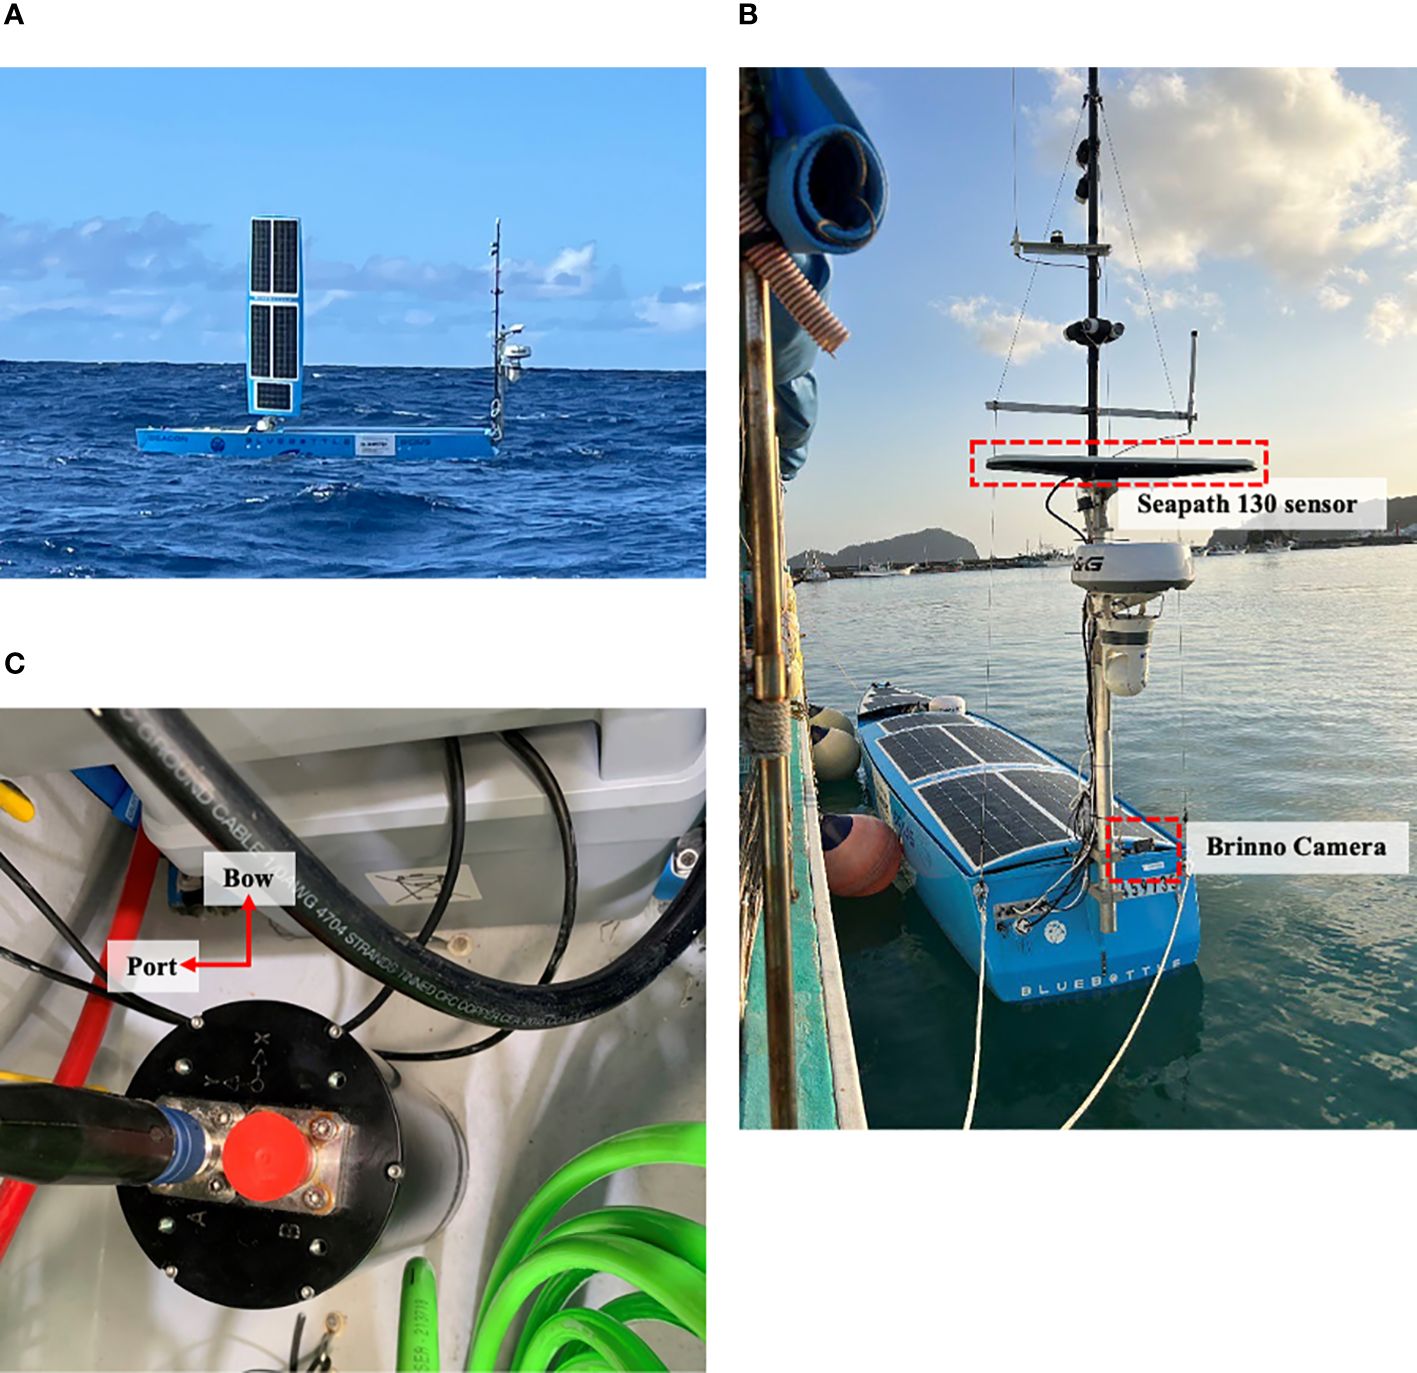
Figure 2 The Bluebottle (A) with its sail raised and (B) lowered. The locations of Seapath 130 sensor, Brinno Timelapse camera. (C) Spider cable connected to a fixed motion reference unit.
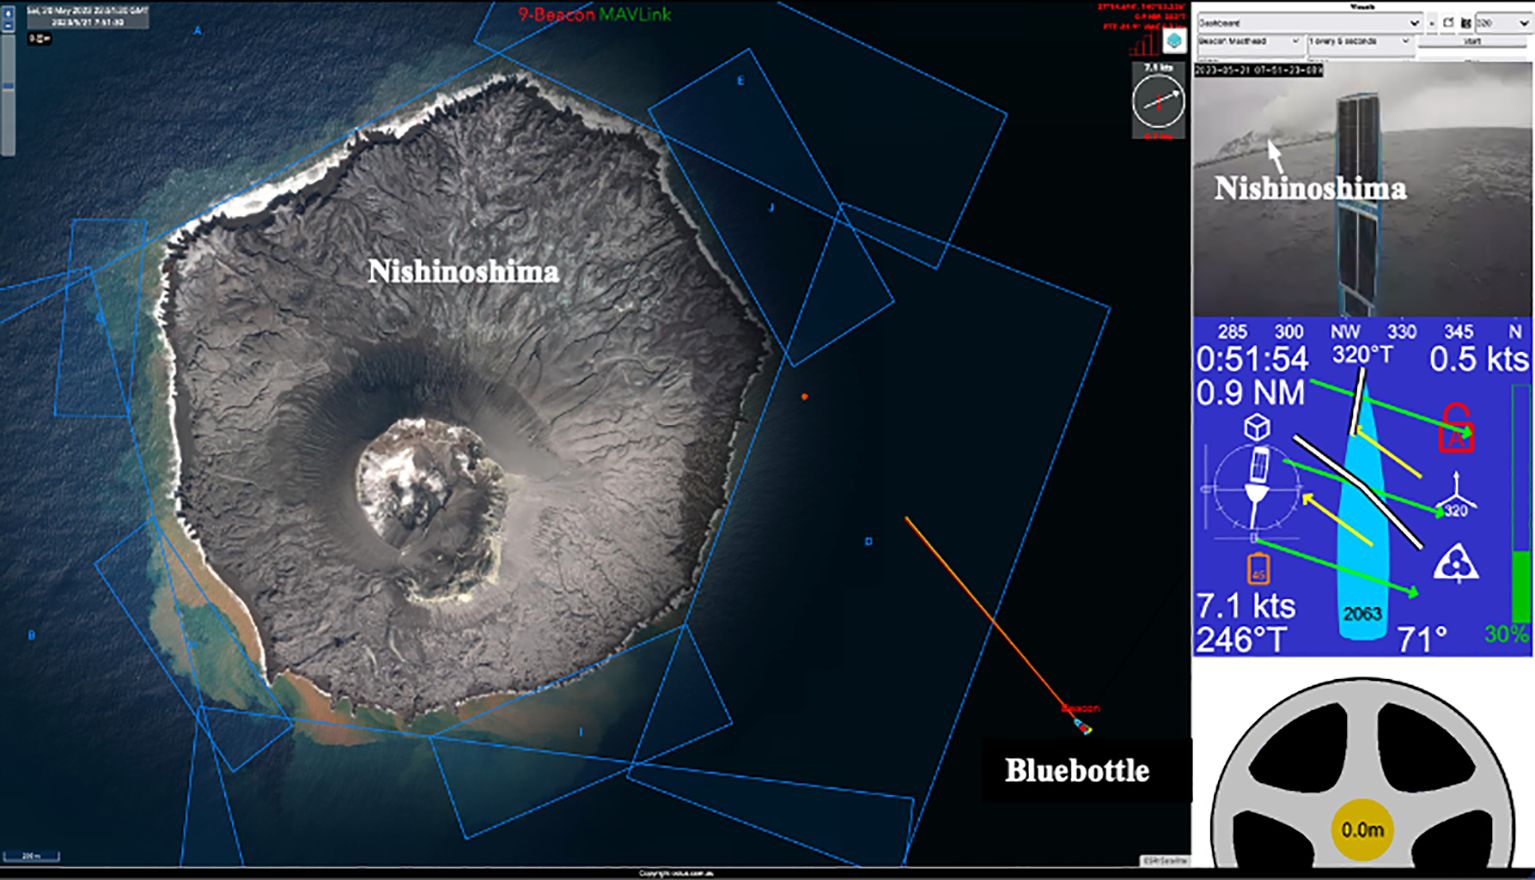
Figure 3 An example of a web interface showing the current location of the Bluebottle with essential navigation information.
Prior to the Bluebottle survey commencement, all instruments were configured to meet project specifications (Supplementary Table S2). Heading, rolling, and positional data was collected using a Seapath 130 sensor settled on top of the Bluebottle (Figure 2B). The Seapath 130 sensor contains integrated Global Navigation Satellite System (GNSS) antennas and receivers and is connected to a fixed motion reference unit (MRU), which is housed within an underwater enclosure, using a spider cable (Figure 2C). The MRU orientation was installed based on guidelines and configured within the Seapath 130 software to ensure accurate Inertial Navigation System (INS) and positional data.
Acquiring accurate topographical and geological data is paramount for understanding the dynamic changes of oceanic island volcanoes and submarine volcanoes. Depth data, essential for this purpose, can be comprehensively obtained through sub-bottom profiling, enabling the determination of sediment layer thickness and, in areas of volcanic activity, the depth of volcanic ash layers. Additionally, side-scan sonar data facilitate the examination of reflectance intensity, serving as a critical tool for discerning the composition of the seabed, particularly for identifying exposed lava formations in regions not obscured by volcanic ash. To achieve this integrated data acquisition, the Kongsberg EA640/EA440 All-in-one system was deployed on the Bluebottle, as illustrated in Figure 4. The advanced system incorporates a 200 kHz side-scan sonar, a 15 kHz sub-bottom profiler/transducer, and a 200kHz transducer, all connected through the EA440 Wide Band Transceiver (WBT) operating with a sampling interval of 0.1 seconds. The bathymetry survey utilized both 15 kHz and 200 kHz frequencies to maximize data accuracy and resolution. Installation of the single-beam echosounder, side-scan sonar, and sub-bottom profiler at the aft end of the keel ensures optimal performance and data collection efficiency. The entire suite of instruments is meticulously configured and managed via the EA440 software interface, ensuring seamless operation for the collection of submarine topography and geology data.
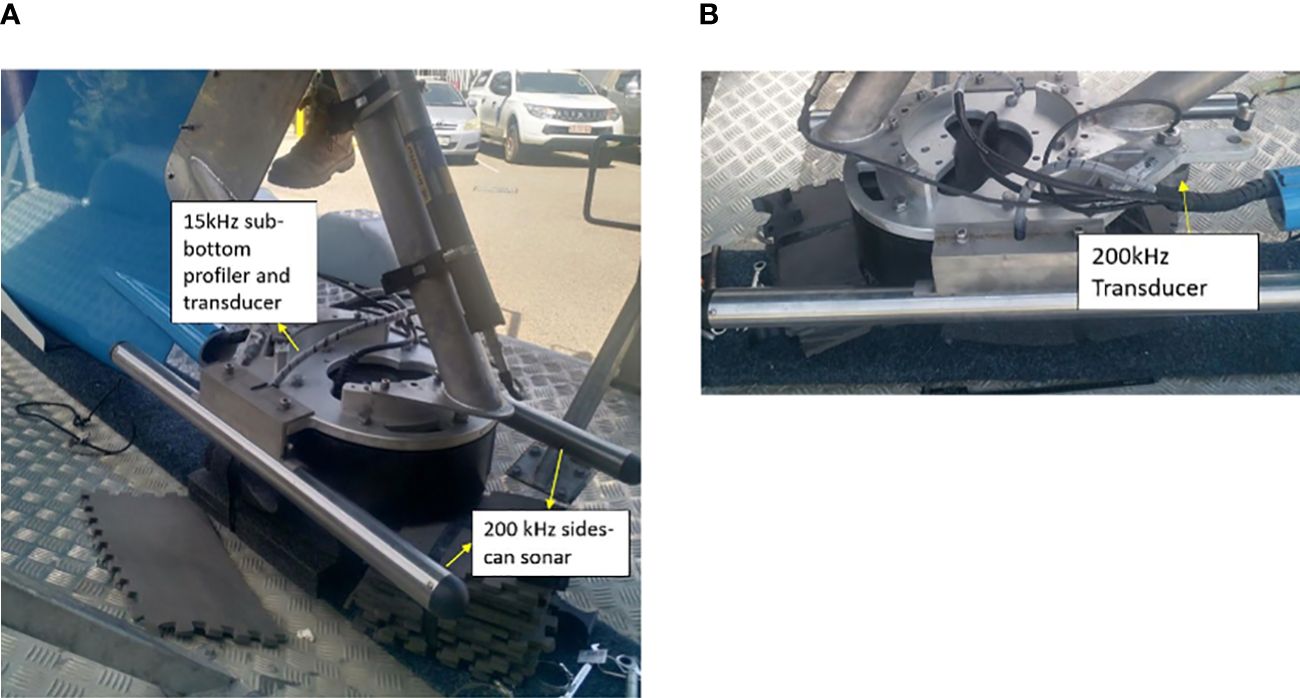
Figure 4 The location of the EA640/440 All-in-one system.
We used a suit of meteorological sensors, an Airmar WS-200WX IPx7, mounted on the Bluebottle to obtain variations in atmospheric parameters (air temperature, atmospheric pressure, and wind speed/direction). The device was installed to the highest point of the communications mast (the rear mast) of the vessel to ensure minimal interference with wind speed and direction readings for collection of wind speed/direction, air temperature, and atmospheric pressure data (Figure 5A). The height of the device from the sea level was approximately 3 m. A YDHS-01 humidity sensor was used to measure relative humidity on this mission (Figure 5A). However, the humidity sensor and a cable connection between the sensor and data logging system was submerged by heavy rainfall in the first trial. Because the connector could not be completed the repair until the deployment on May 16, 2003, we abandoned the humidity measurement. Infrared thermometers, Heitronics CT15.10 and CT9.10WT, were installed to monitor the sea surface skin temperature. The CT15.10 was installed downward facing, and the CT9.10WT faced the sky (Figure 5A). The CT9.10WT readings were used to provide temperature compensation signal. Readings of these devices were uploaded in real-time to the OCIUS database at 1 Hz.
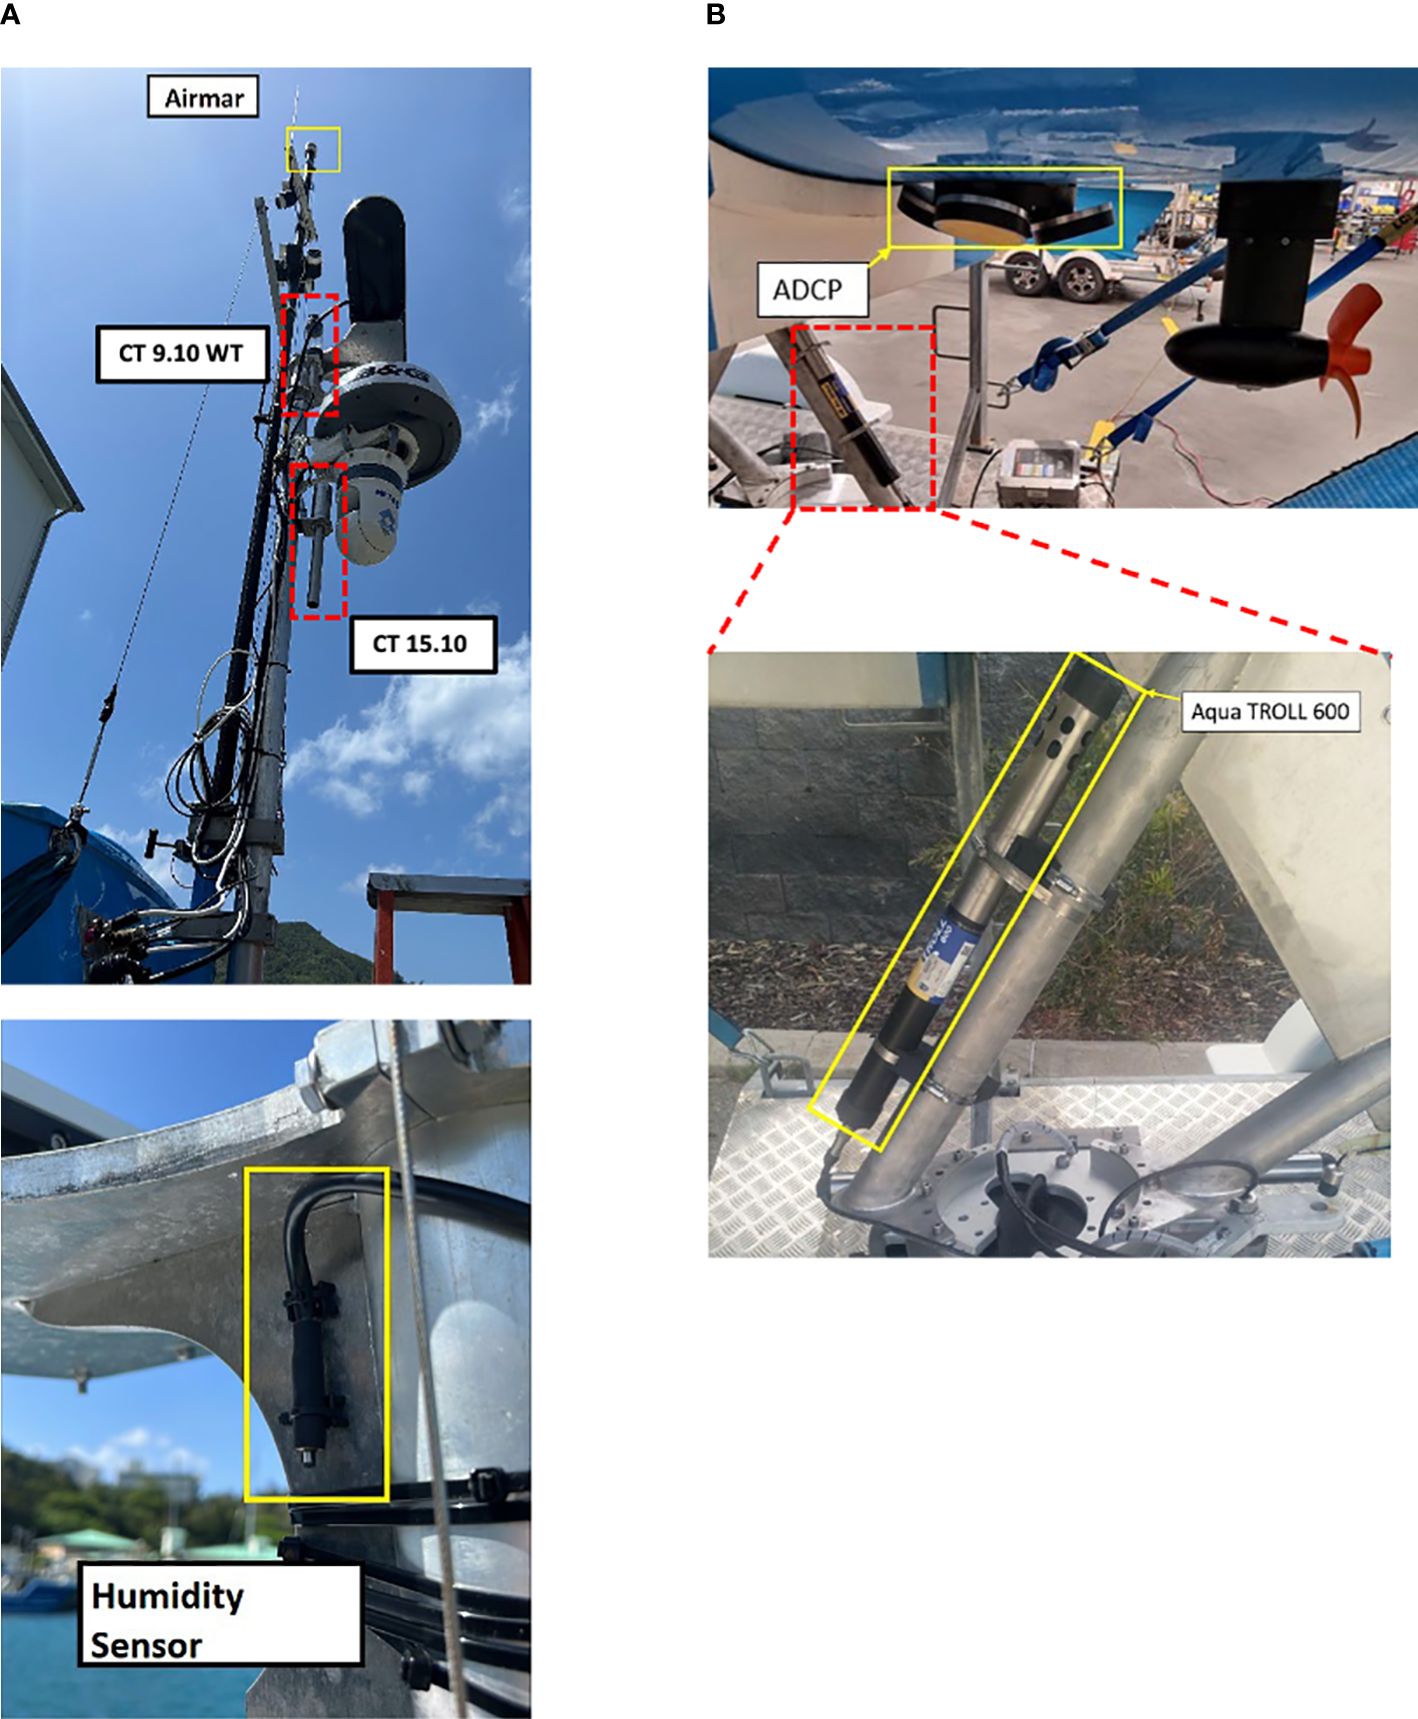
Figure 5 ADCP, Airmar, and Aqua TROLL 600.
Changes in water temperature, salinity, dissolved oxygen concentration (DO), turbidity, phytoplankton concentration, and pH resulting from volcanic activity and ocean current variability excited by the topography were monitored using a multiparameter probe Aqua TROLL 600 (In-Situ, Port Colins, CO, USA) mounted on the Bluebottle. The device is anti-corrosive and has a low power consumption, rendering it highly suitable for this USV survey. The probe was installed aft end of the keel of the Bluebottle at a depth of approximately 1 m with the sensor orientation pointed towards the keel to ensure minimal interference with sonar equipment (Figure 5B) and which measured pH, DO, conductivity, temperature, chlorophyll-a fluorescence, and pressure with 1-minute sampling intervals. Salinity in practical salinity unit was calculated from temperature and conductivity values. The accuracies of the instrument are 0.1°C for temperature, 0.1 for salinity, 0.1 for pH, and 0.1 mg/L for DO.
For more detailed analysis of the hydrographic structures around the island and volcano, temperature and salinity were also measured each 10 min by using another conductivity-temperature-depth sensor JES10mini (Offshore Technologies, Yokohama, Japan) installed near the Aqua TROLL 600 probe. The temperature and conductivity accuracies of the JES10mini are 0.005°C and 0.005 S/m, respectively. The accuracy of computed salinity is better than 0.04.
Moreover, a backscatter meter with fluorometer (FLBBSB, Seabird Science, USA) was installed next to JES10mini to observe the spatio-temporal variabilities in underwater biogenic and lithogenic particles.
Additionally, an Acoustic Doppler Current Profiler (ADCP) (Nortek Signature100 ADCP, Norway) was installed downward to the bottom end of the rear keel (Figure 5B) to measure the vertical structure of current velocity, enhancing our understanding of underwater current patterns and temporal variations. The ADCP is a long-range current profiler and collects a current profile at depths from 0 to 500 m every 1 minute. In this survey, the instrument was set to record current profiles after averaging 10 minutes. Because this instrument does not detect the seabed, we removed data deeper than the water depth based on data collected by the 15 kHz sub-bottom profiler. In regions of water depths greater than 500 m, where are located far from the island, no data was obtained below 500 m depth.
To monitor the color of the seawater and floating objects in the area where the Bluebottle is sailing, we took time-lapse photos of the ocean surface. Specifically, understanding how marine debris, including ocean plastics, is distributed in the open sea is crucial for grasping the overall situation of the marine plastic issue, which has become a significant problem in recent years. The Brinno TLC2020-C Timelapse Camera (Figure 2B) was utilized to capture downward facing images of the water’s surface during the mission. The camera’s picture frequency was chosen to maximize the framerate of the images while ensuring a sufficient level of charge was maintained. Information from the device was recovered at the end of the mission.
The Bluebottle was transported from Fremantle (Australia) to Chichijima Island (Japan), which is an inhabited island of Japan relatively close to Nishinoshima and FOB, to conduct observation cruises in the Bonin region. As the Bluebottle is a USV owned by OCIUS, an Australian company, transporting and operating it in a territory of Japan through challenging procedures related to import and adherence to Japanese laws. For instance, any floating object exceeding 3.3 meters in length requires ship registration and inspection on site before its voyages. That forced us to have an additional preparation period and costs for the USV surveillance.
The Leg 1 cruise of the Bluebottle started on April 24, 2023, from Futami port of Chichijima Island toward FOB (Figure 1). The Bluebottle had advanced near the southern vicinity of Kita-Iwo Jima. However, due to difficulties encountered in data acquisition, it was decided to return to Chichijima Island on April 27. The Bluebottle arrived back at Futami port of Chichijima Island on May 1, marking the conclusion of Leg 1 of the cruise. Unfortunately, topographical, geological, meteorological, and oceanographic data were not acquired around FOB this time.
The ship track of each day in the Leg 2 journey is illustrated in Figure 6A. The Leg 2 cruise of the Bluebottle commenced on May 16 from Futami port, heading towards Nishinoshima Island. Upon arrival in the observation area on May 19, the Bluebottle began operations of the EA640/440 All-in-one system to acquire topographical and geological datasets. Initially, the Bluebottle navigated along planned survey lines running northeast to southwest on the northwest side of Nishinoshima Island, spaced 50 m apart, to collect data. The Bluebottle complete two round trips mostly along planed survey lines. However, the interaction between the vessel’s heading, tidal currents, and wind direction and power prevented it from sailing linearly along the survey lines at all times. Figure 6B shows the fluctuation in the battery’s remaining charge during this phase. From Figure 6B, it is evident that during May 19 to May 21, 2023, the solar-powered battery was hardly able to charge, and the battery percentage consistently decreased. This suggests that the sunlight was insufficient to recover the battery’s remaining charge, and just five days after departure, the battery’s remaining charge had already halved. Consequently, to acquire accurate bathymetric data over a wider area while minimizing power consumption, we decided to navigate the Bluebottle in a way that requires minimal power, adjusting the navigation according to the prevailing wind directions and tidal currents at the eastern side of Nishinoshima Island. Moreover, interested in the variations in water depth depending on the direction from the crater, we also conducted circumnavigational observations around the island. With the approach of the powerful Typhoon Mawar on May 20 (minimum pressure 900 hPa and maximum wind speed 60 m/s; Japan Meteorological Agency, 2023), the Bluebottle was forced to depart from the observation area around Nishinoshima Island on May 23, and arrived back at Chichijima Island on May 28, thereby concluding the Leg2 cruise. Even under adverse sea conditions, the Bluebottle, which operates solely on natural energy without a combustion engine, successfully reached a remote observation site and conducted five days of observations. However, the inability to allocate a sufficient observation period remains a challenge for future endeavor.
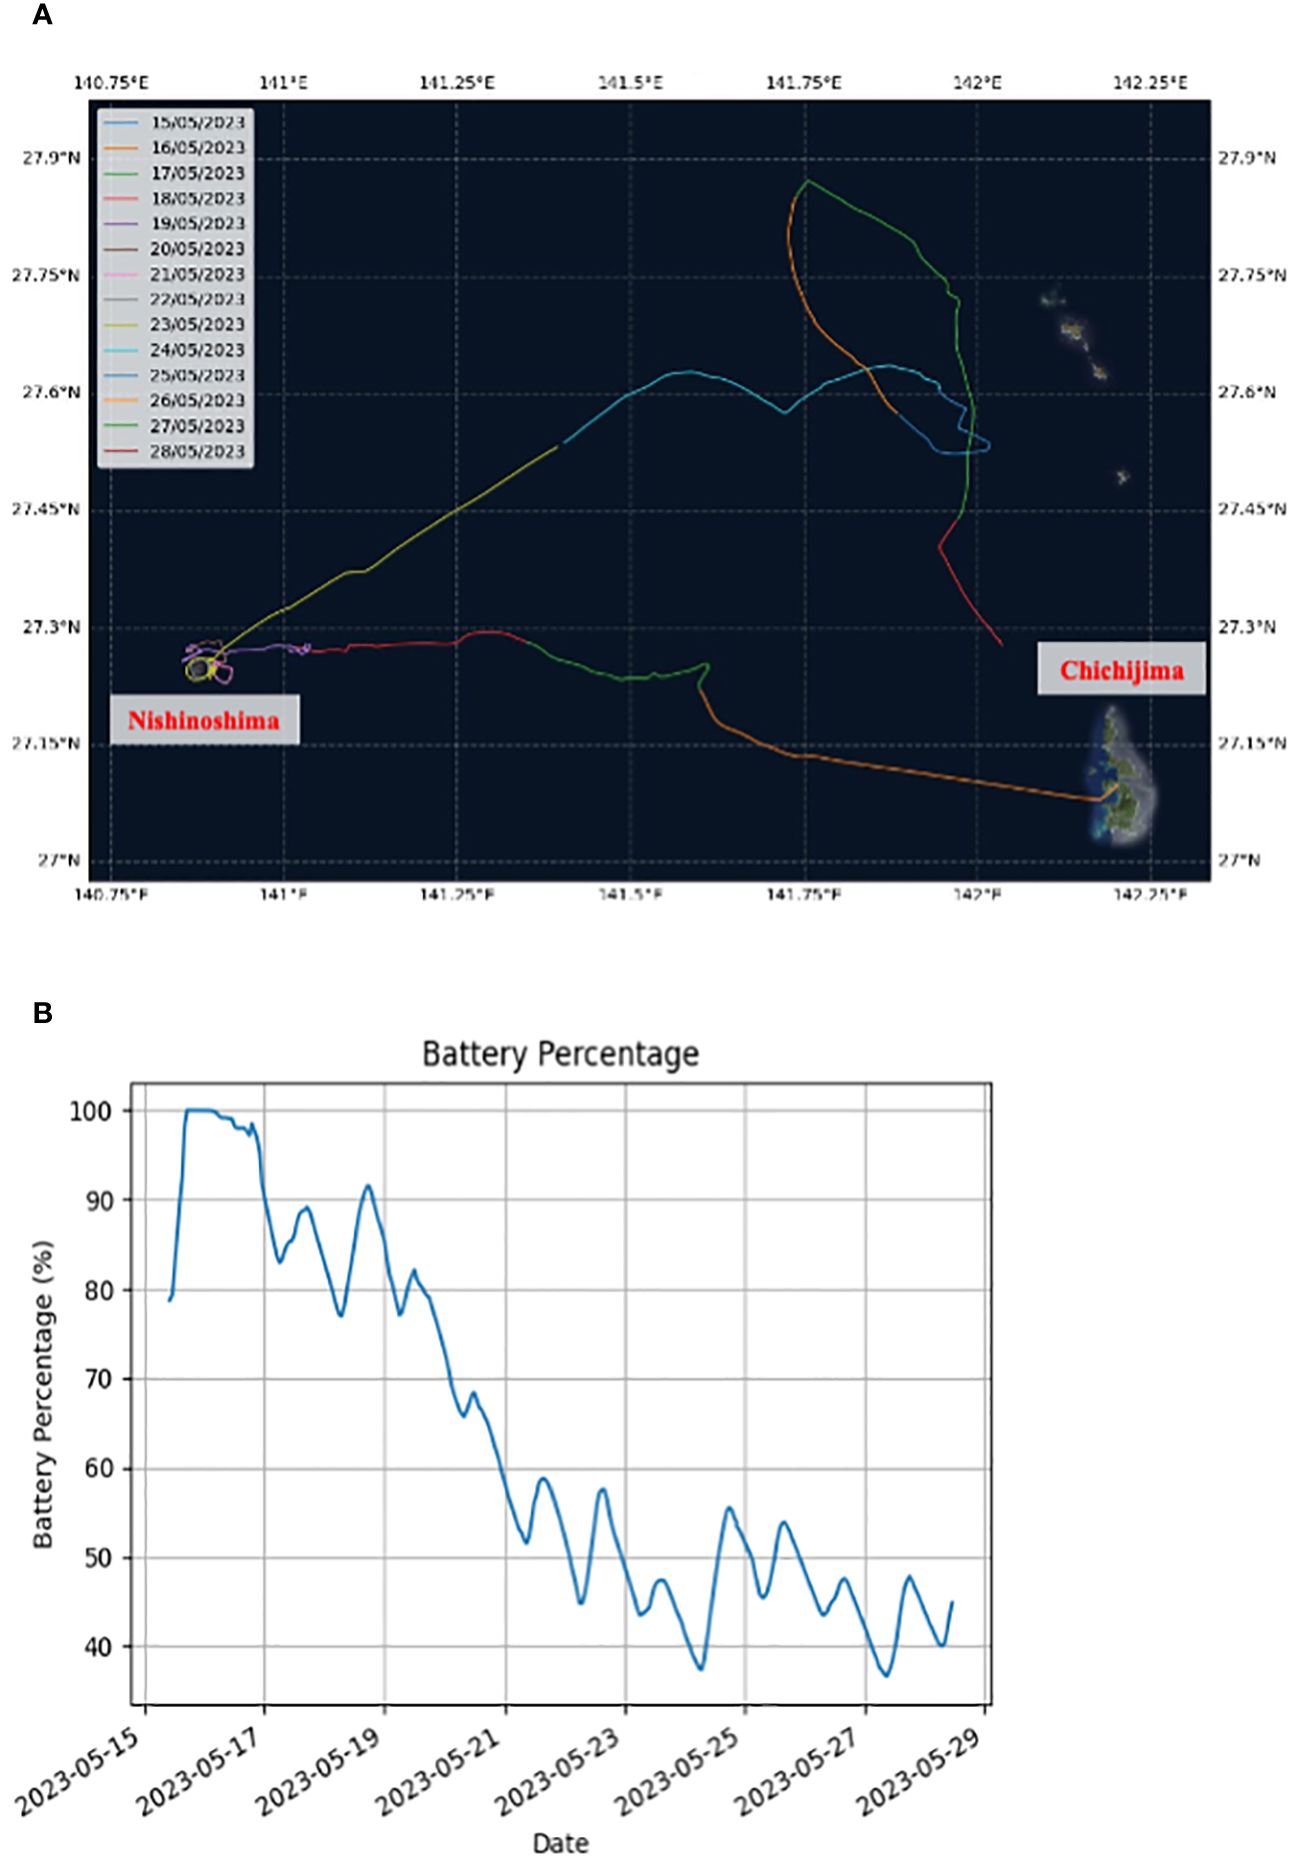
Figure 6 (A) Mission track of the Leg 2 cruise and (B) the battery charge remaining during the Leg 2 cruise.
The currents around Nishinoshima Island were much stronger than previously anticipated. In this condition, the Bluebottle needed to use a significant amount of throttle to achieve the desired transects. Because the Bluebottle had to save throttle usages for sustainable operation, the Bluebottle had to loiter in the lee of the currents. In the western North Pacific, typhoons frequently occurs and the Kuroshio current, other adjacent current systems, and mesoscale eddies are associated with quite strong currents. To conduct observations in the severe sea conditions in the western North Pacific, USVs, including Bluebottle, should have so strong body as to stay under such severe conditions and sufficient mobility to escape typhoons and other atmospheric disturbances. Additionally, in the extratropical regions, cloudy and rainy days are relatively more frequent particularly in winter and early summer (the rainy season in Japan). More development of the solar-powered battery management system is considered to be essential to perform long-term observations regardless of the season.
In the Leg 2 cruise, single-beam bathymetric data were collected from May 19 to May 23 around Nishinoshima Island. Over this five-day survey period, a total of 27,717 raw bathymetric files were logged. The data from the single-beam echosounder, covering depths of 0–1200 m at 15 kHz and 0–150 m at 200 kHz were processed into a grid with a resolution of 10 meters and are presented in Figures 7A, B, respectively. Figure 7A reveals that although the data acquisition is uneven, it clearly delineates the contrasting seabed topographies on the northwestern and eastern sides of the island. The depth reaches 400 meters at about 3 km from the crater and approximately 2 km from the shoreline on the northwestern side, whereas on the eastern side, it occurs less than 2 km from the crater and about 1 km from the shoreline. This suggests a more gradual slope on the northwestern side compared to the eastern side. The same trend is observable in Figure 7B, which has higher resolution in shallower areas. The bathymetric data, which nearly encircles the island, indicate that the northern to northwestern sides have shallower depths compared to other directions. The bathymetric data reveal a steep slope of approximately 40 degrees on the northeast to eastern flank of the volcano, where water depths exceed 100 m.
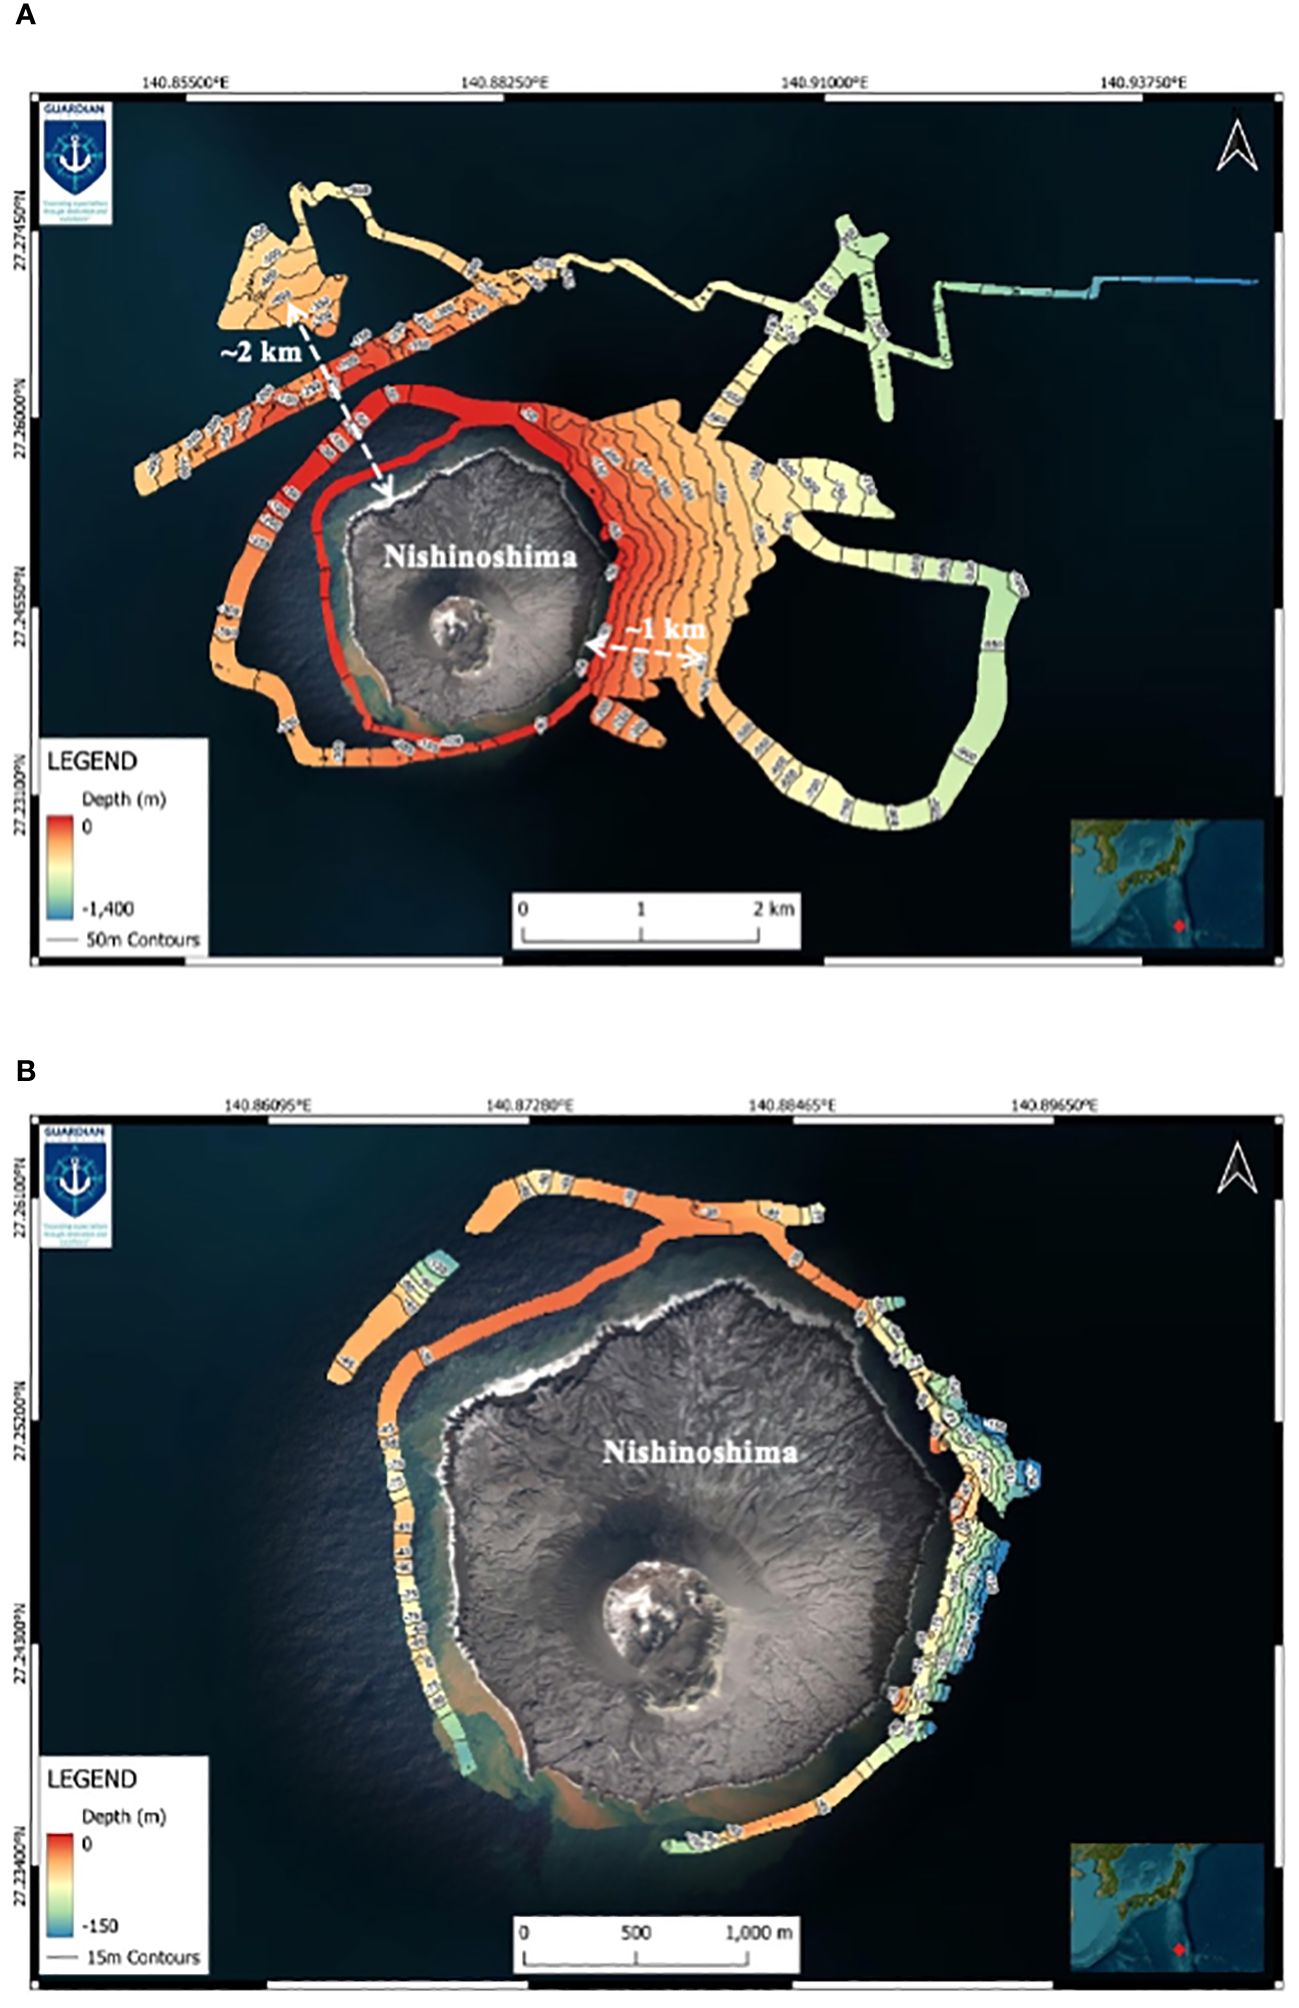
Figure 7 Seafloor topography data sampled (A) at 15 kHz and (B) at 200 kHz. The white double arrows and numbers indicate the distances from the shoreline to a water depth of 400 meters.
Sub-bottom profiler data collected at 15 kHz to the northeast and to the southeast of Nishinoshima Island are shown in Figures 8A, B, respectively. Both sub-bottom profiler datasets exhibit continuous high reflection layers. Figure 8A displays two such layers, with the lower high reflection layer appearing similar to the high reflection layer in Figure 8B, suggesting that these layers represent the seabed foundation. In contrast, the upper high reflection layer in Figure 8A shows lower reflectivity on the west side, and the layer thickness between the high reflection layers seems to thin towards the east. The thinning of layers away from Nishinoshima Island indicates that volcanic ash erupted from the volcano has accumulated on top of the foundation, forming layers. The weak reflection area on the west side may indicate that the volcanic ash has not yet solidified sufficiently. Moving forward, we aim to extract as much information as possible about the horizontal extent and thickness variation of this presumed ash layer from the data we got in this observation, to assess the amount of volcanic ash deposited on the seabed.
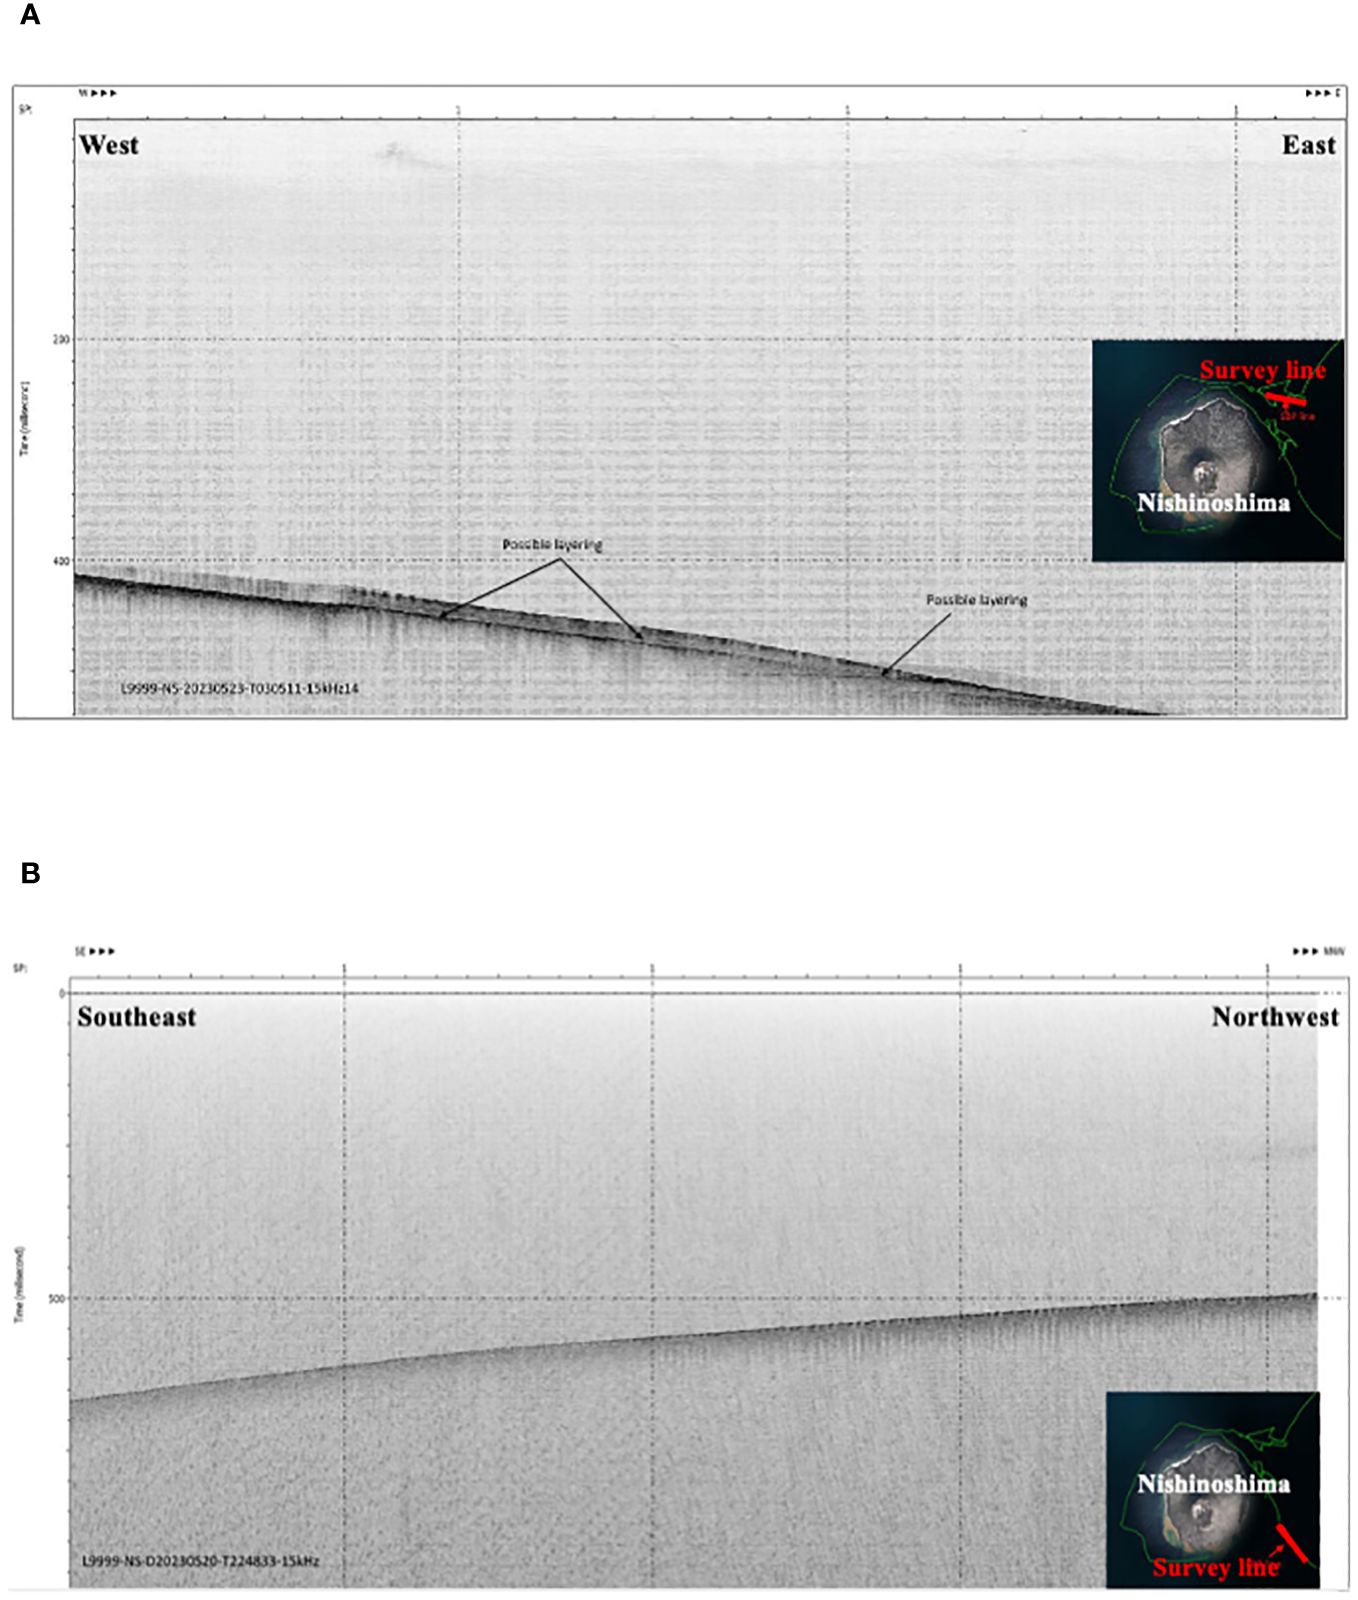
Figure 8 Sub-bottom profiles acquired (A) in the northeast and (B) in the southeast of Nishinoshima Island.
The attempt to obtain meaningful acoustic image of the seabed using side-scan sonar was unsuccessful. The side-scan sonar used in this study operated at a high frequency of 200 kHz, which is highly effective in shallow water. Given that the shallowest observed water depth was around 30 meters (Figure 7B), it is unlikely that no data were captured at all. Therefore, future efforts will involve verifying the side-scan sonar data in conjunction with sub-bottom profiler data and water depth data. This will allow us to thoroughly review whether any data were indeed collected by the side-scan sonar and to revalidate the data accordingly.
Immediately after the passage of a low-pressure system, the Bluebottle departed at the Chichijima Island and observed the northwesterly wind (Figure 9A). Throughout the observation, two low-pressure systems passed during the observation. Associated with the atmospheric disturbances, the wind was observed to rotate and to be equivalent to or exceeds approximately 10 m/s during the most of the observation. Because of cloudiness during the passages of the low-pressure systems, the Bluebottle battery was concerned not to be sufficiently charged and not to continue the observation.
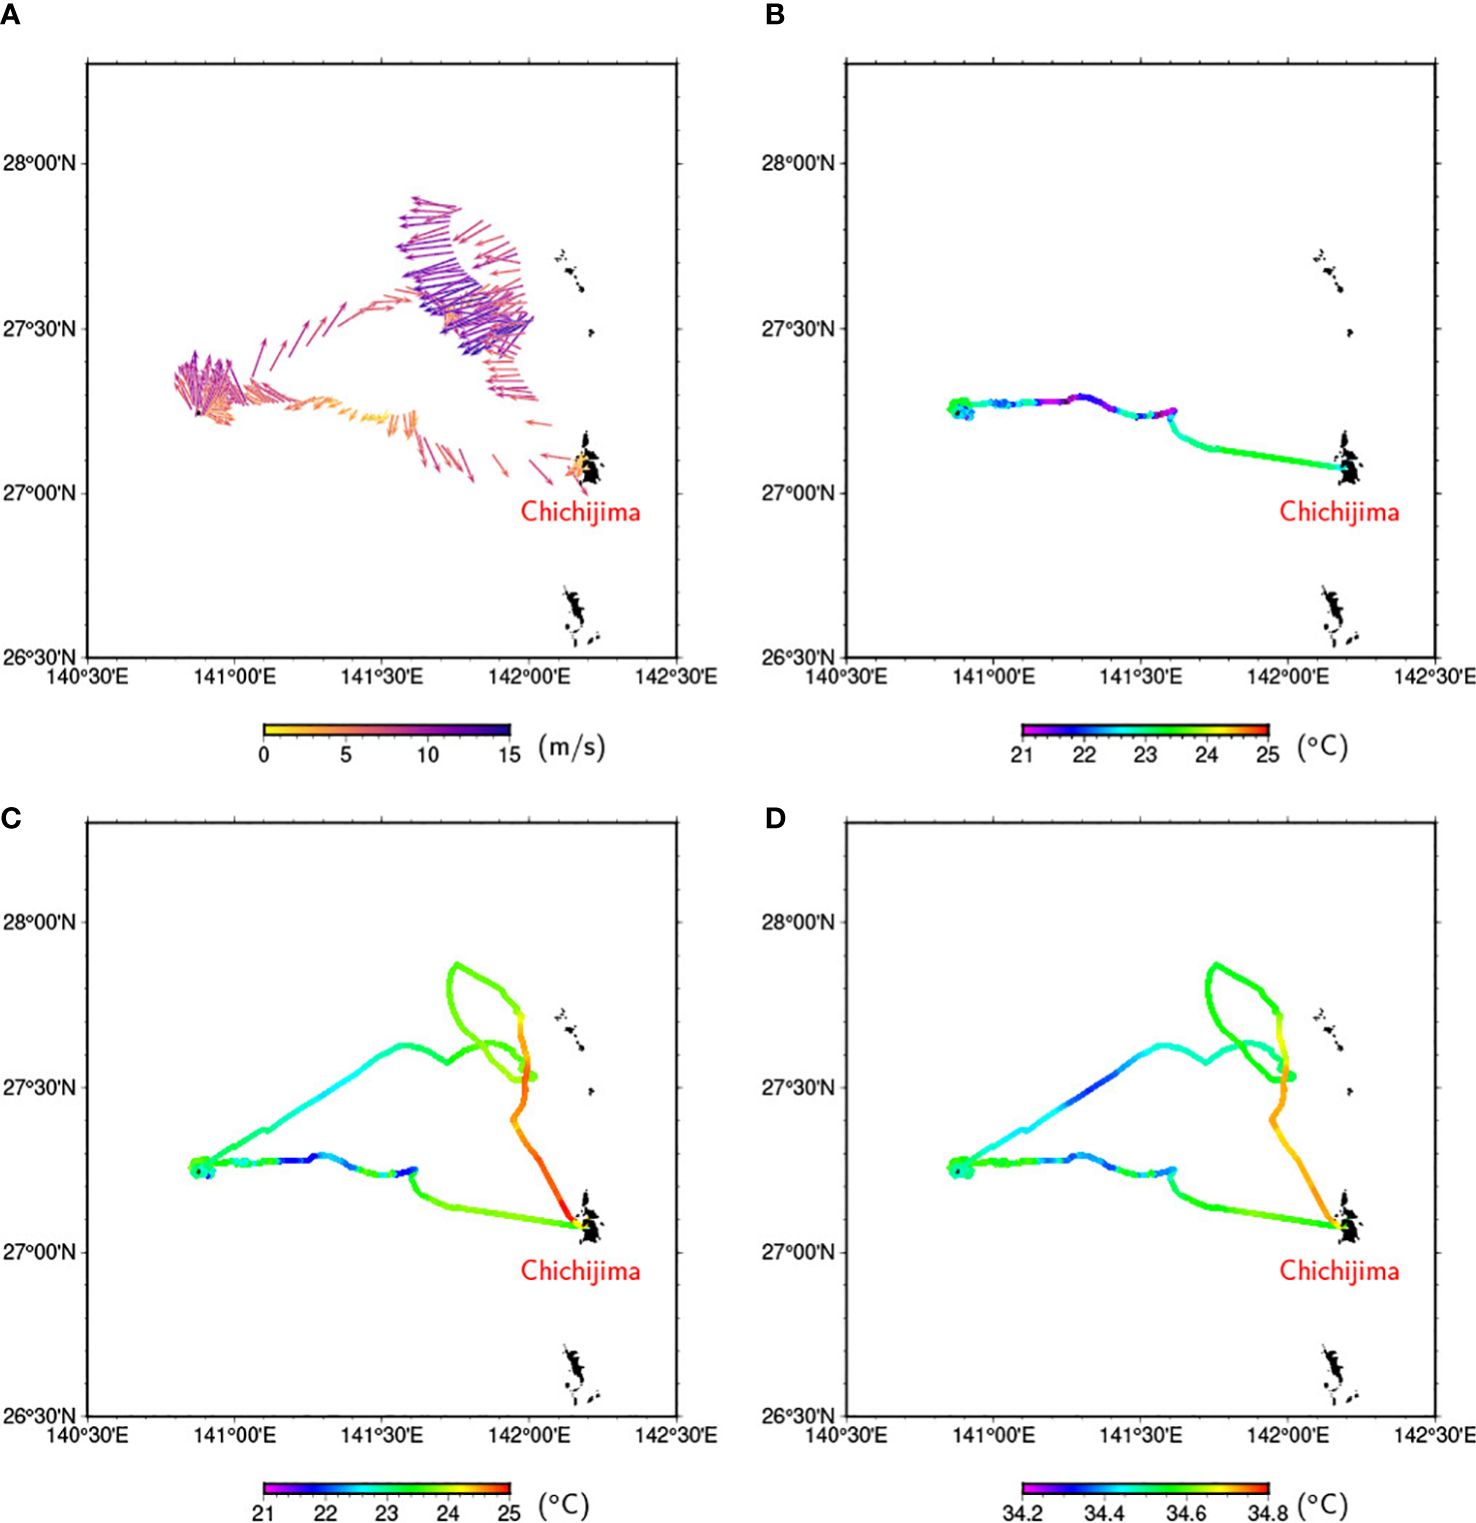
Figure 9 (A) Wind vectors in m/s on the Bluebottle track. Wind speed is indicated by color bar at the bottom of the panel. (B) Skin temperature in °C on the Bluebottle track. (C) Temperature and (D) salinity on the Bluebottle track observed by the CTD JES10mini.
Due to the cold skin effect (e.g., Saunders, 1967), skin temperature similarly varied with temperature at 1 m depth, i.e., SST, but was always lower than SST (Figures 9B, C). The low skin temperature is considered to be closely related to the heat exchange between the atmosphere and ocean. The low-skin-temperature may suggest that the turbulent plus long-wave heat flux was always upward.
Figures 9C, D show temperature and salinity observed by the CTD JES10mini along the Bluebottle track, which are referred in this paper as sea surface temperature (SST) and sea surface salinity (SSS), respectively. SST and SSS ranged in 21–25°C and 34.2–34.8, respectively, which are consistent with climatology in this region. Notably, the SST and SSS are found to covary on spatial scales of about 10–50 km, which is within the mesoscale range. For example, the Bluebottle observed cold and fresh water on the westward track from 141.6°E to 141.1°E and warm and saline water on the southward track from 27.6°N to 27.0°N. Furthermore, focusing on the variations in temperature and salinity around Nishinoshima Island, the SST and SSS varied on time scales shorter than approximately 6 hours (Supplementary Figure S1). During the observation, a mesoscale cyclonic eddy was detected to the northeast of Nishinoshima Island by the satellite sea surface height observation. The high-frequency SST and SSS variabilities may be attributed to submesoscale (< 10 km) hydrographic structures generated around the volcano in a background southeastward flow generated by the mesoscale eddy.
Eastward currents over 0.5 m/s were observed to be along the contours of the topography to the northwest of the island by the ADCP (for example, current velocity vectors at 7 m depth are shown in Figure 10). The current speed is much larger than the estimated velocity from altimetric sea surface height data (~0.2 m/s). The strong current may be driven by the cyclonic eddy and modified by the topography. Remarkably, the ADCP observed currents directed to the west on the leeward side of the island or east of the island. Such current normal to topographic contours must not be in the geostrophic balance and be highly variable in space and time, as observed in SST and SSS (Figures 9C, D).
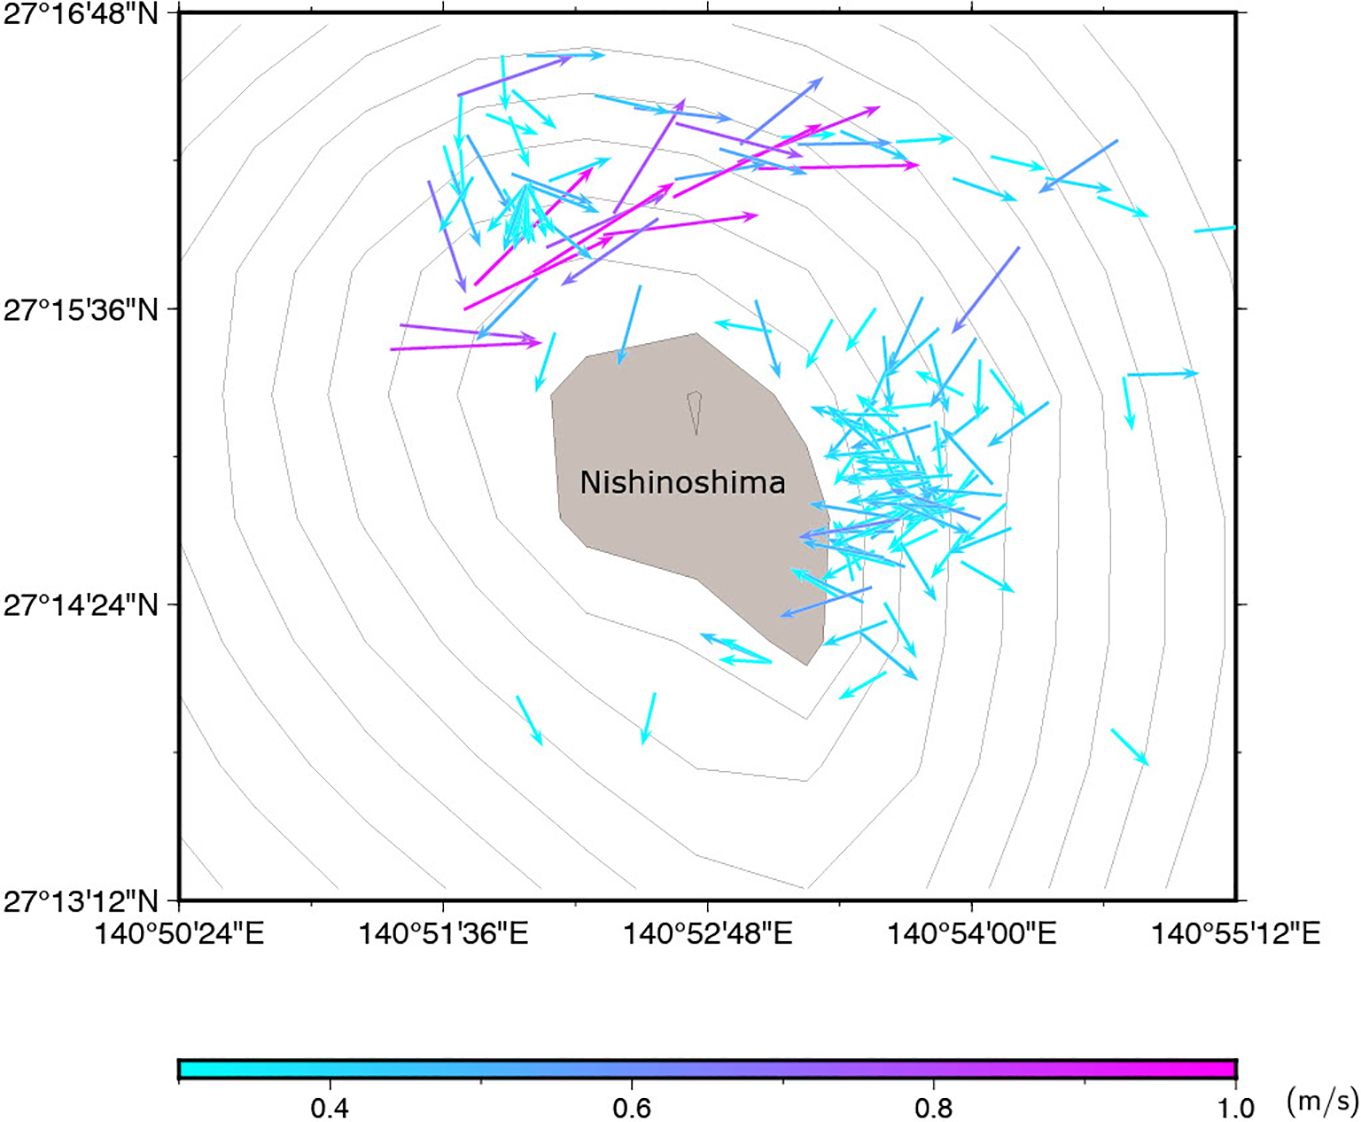
Figure 10 ADCP velocity vectors in m/s at the uppermost layer (7 m depth). Current speed is represented by the color bar at the bottom. Vectors with speed greater than 0.3 m/s were plotted. Bottom topography based on ETOPO 2022 was shown by contours at intervals of 100 m. The area shaded in gray represents Nishinoshima Island.
On the way to Nishinoshima Island, DO varied from 6.3 to 6.6 mg/l (197 to 206 micro mol/l) (Figure 11A). These values are typical values observed in late spring in the western Pacific subtropical region (~ 200 micro mol/l; e.g., Honda, 2020). East of Nishinoshima Island, DO decreased suddenly although data were limited (Figure 11B). Essentially, DO correlated well with SST (Supplementary Figure S2), while DO did not correlate with Chl-a (not shown). It is indicative of that DO concentration were determined by, not primary productivity, but solubility. However, lower DO deviated from SST-DO linier regression line. Thus, the water east of Nishinoshima Island was likely affected by outflow from the island. This outflow water might be reductive due to volcanic gas such as CO2 and SO2 (e.g., de Ronde and Stucker, 2015).
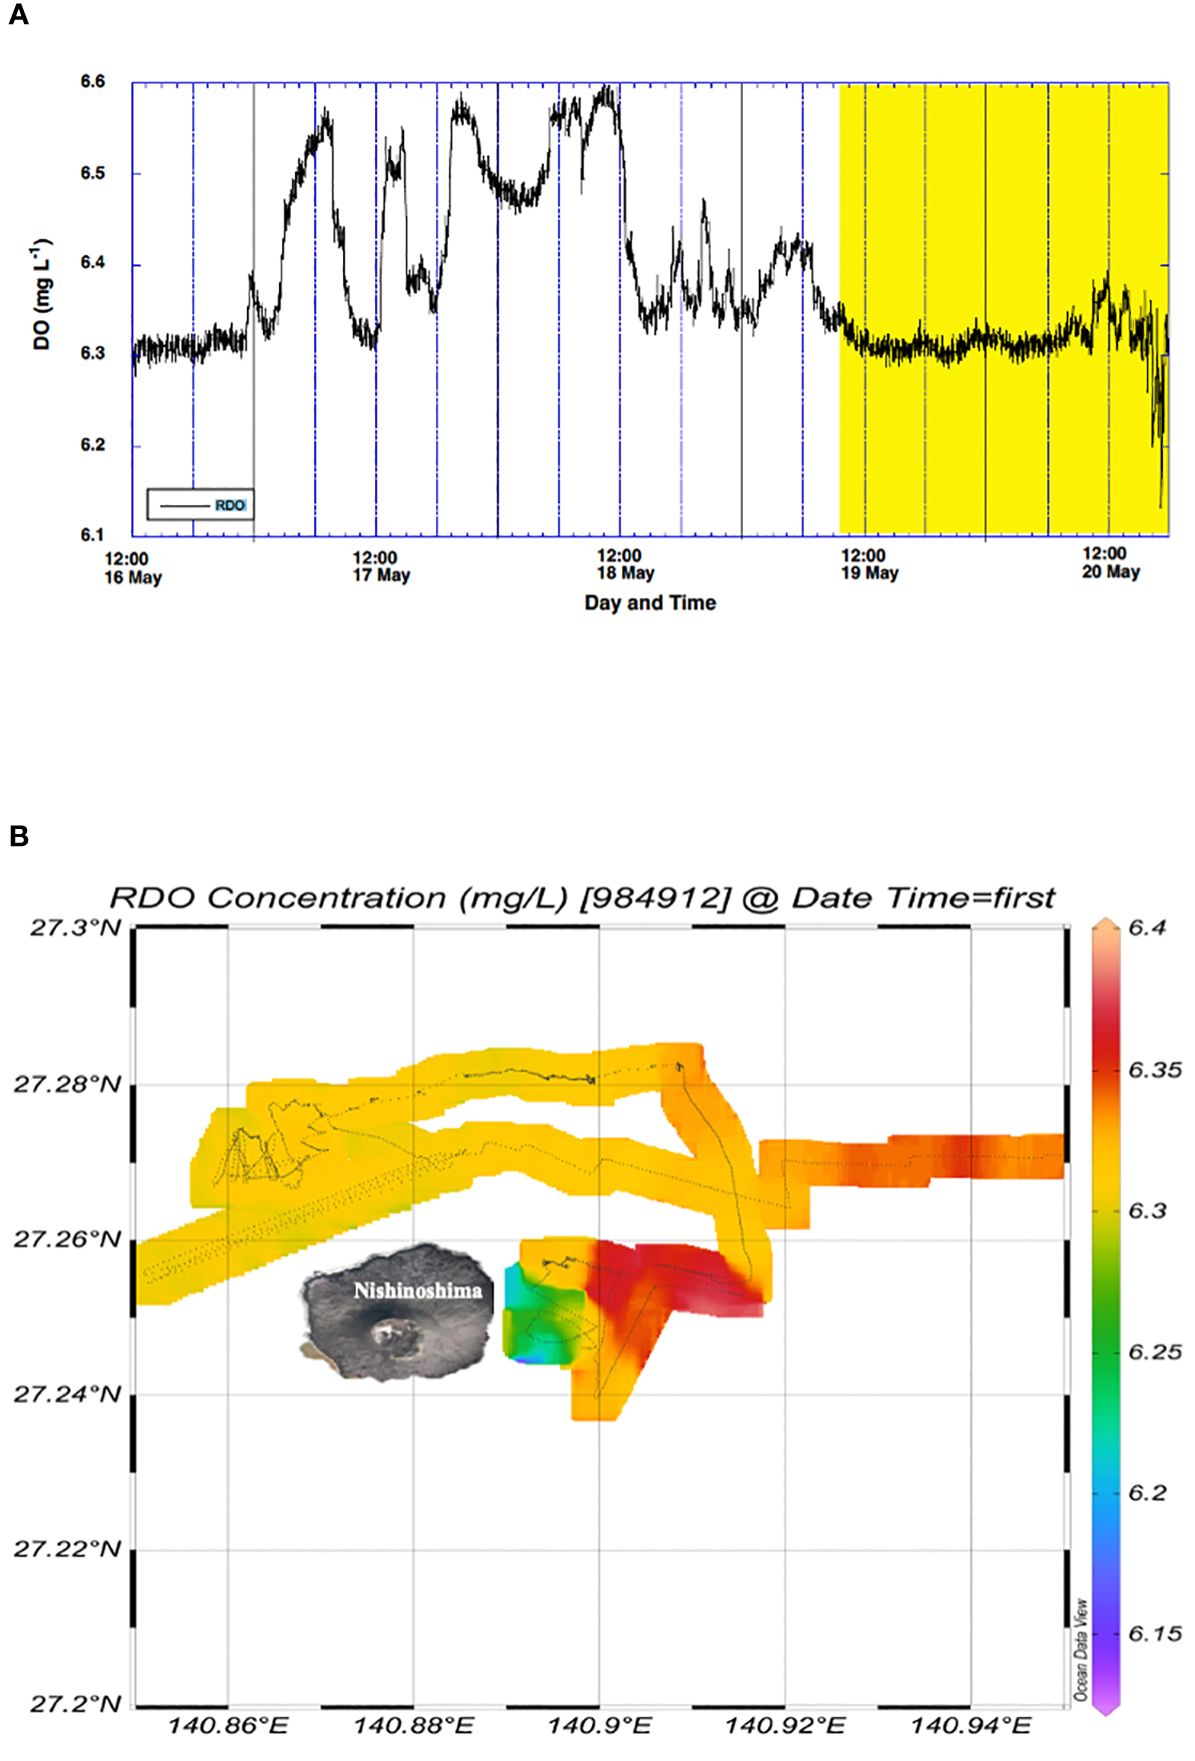
Figure 11 DO data (A) time-series variability west of 142°E. Yellow hatched area denotes the period when the USV-BB stayed near Nishinoshima. (B) horizontal distribution near Nishinoshima.
As the Bluebottle was approaching to Nishinoshima Island, pH values decreased and the minimum was observed at the east of the island (Figure 12). Lower pH near volcanically-active Nishinoshima Island was expected before this investigation as reported previously (Sato et al., 2018). However, absolute value ranged from 8.6 and 9.7 and these values are never observed in the surface water of western North pacific subtropical area (usually ~ 8.1; Honda et al., 2017). Based on pH measurement of discolored seawater sampled by using multicopter, low pH of ~6.5 was observed around Nishinoshima (Takai, 2024). In addition, pH sensor values monotonically decreased during deployment and did not have any significant correlations with other properties; unfortunately, the observed change might be artifact.
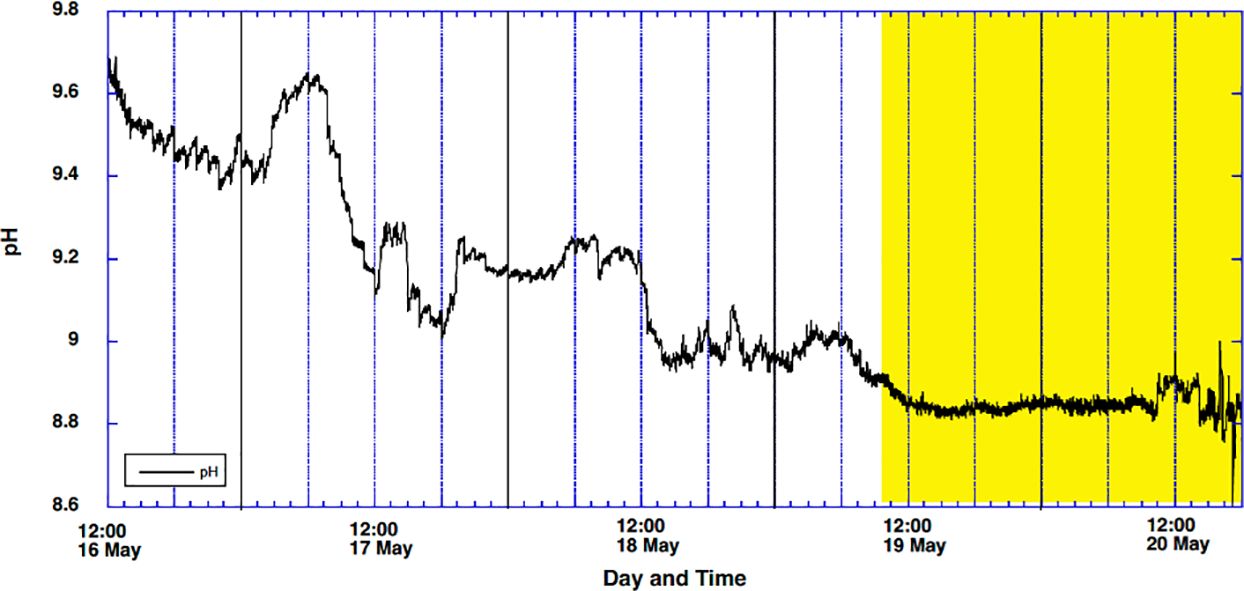
Figure 12 Time-series variability in pH west of 142°E. Yellow hatched area denotes the period when the USV-BB stayed near Nishinoshima.
Backscatter of light of 700 nm wave length (bbp(700)) values were lower than 0.01 m-1 or under detection limit on the way to and north of Nishinoshima (Figure 13A). This is typical value in the open ocean in the western Pacific subtropical area (e.g., Fujiki, 2019; Taketani, 2021; Kitamura, 2022). However, backscatter increased largely east side of Nishinoshima (Figure 13B). The bbp(700) > 0.05 m-1 (upper detection limit) has not been observed in the open ocean of the western Pacific previously. This unusual high backscatter coincides with the fact that the surface seawater around Nishinoshima Island discolored shown in pictures taken by time-lapse camera on the Bluebottle (Figure 14). Based on chemical analysis, Takai (2024) reported that this discoloring (red-brown color) was attributed to suspended particles rich in iron.
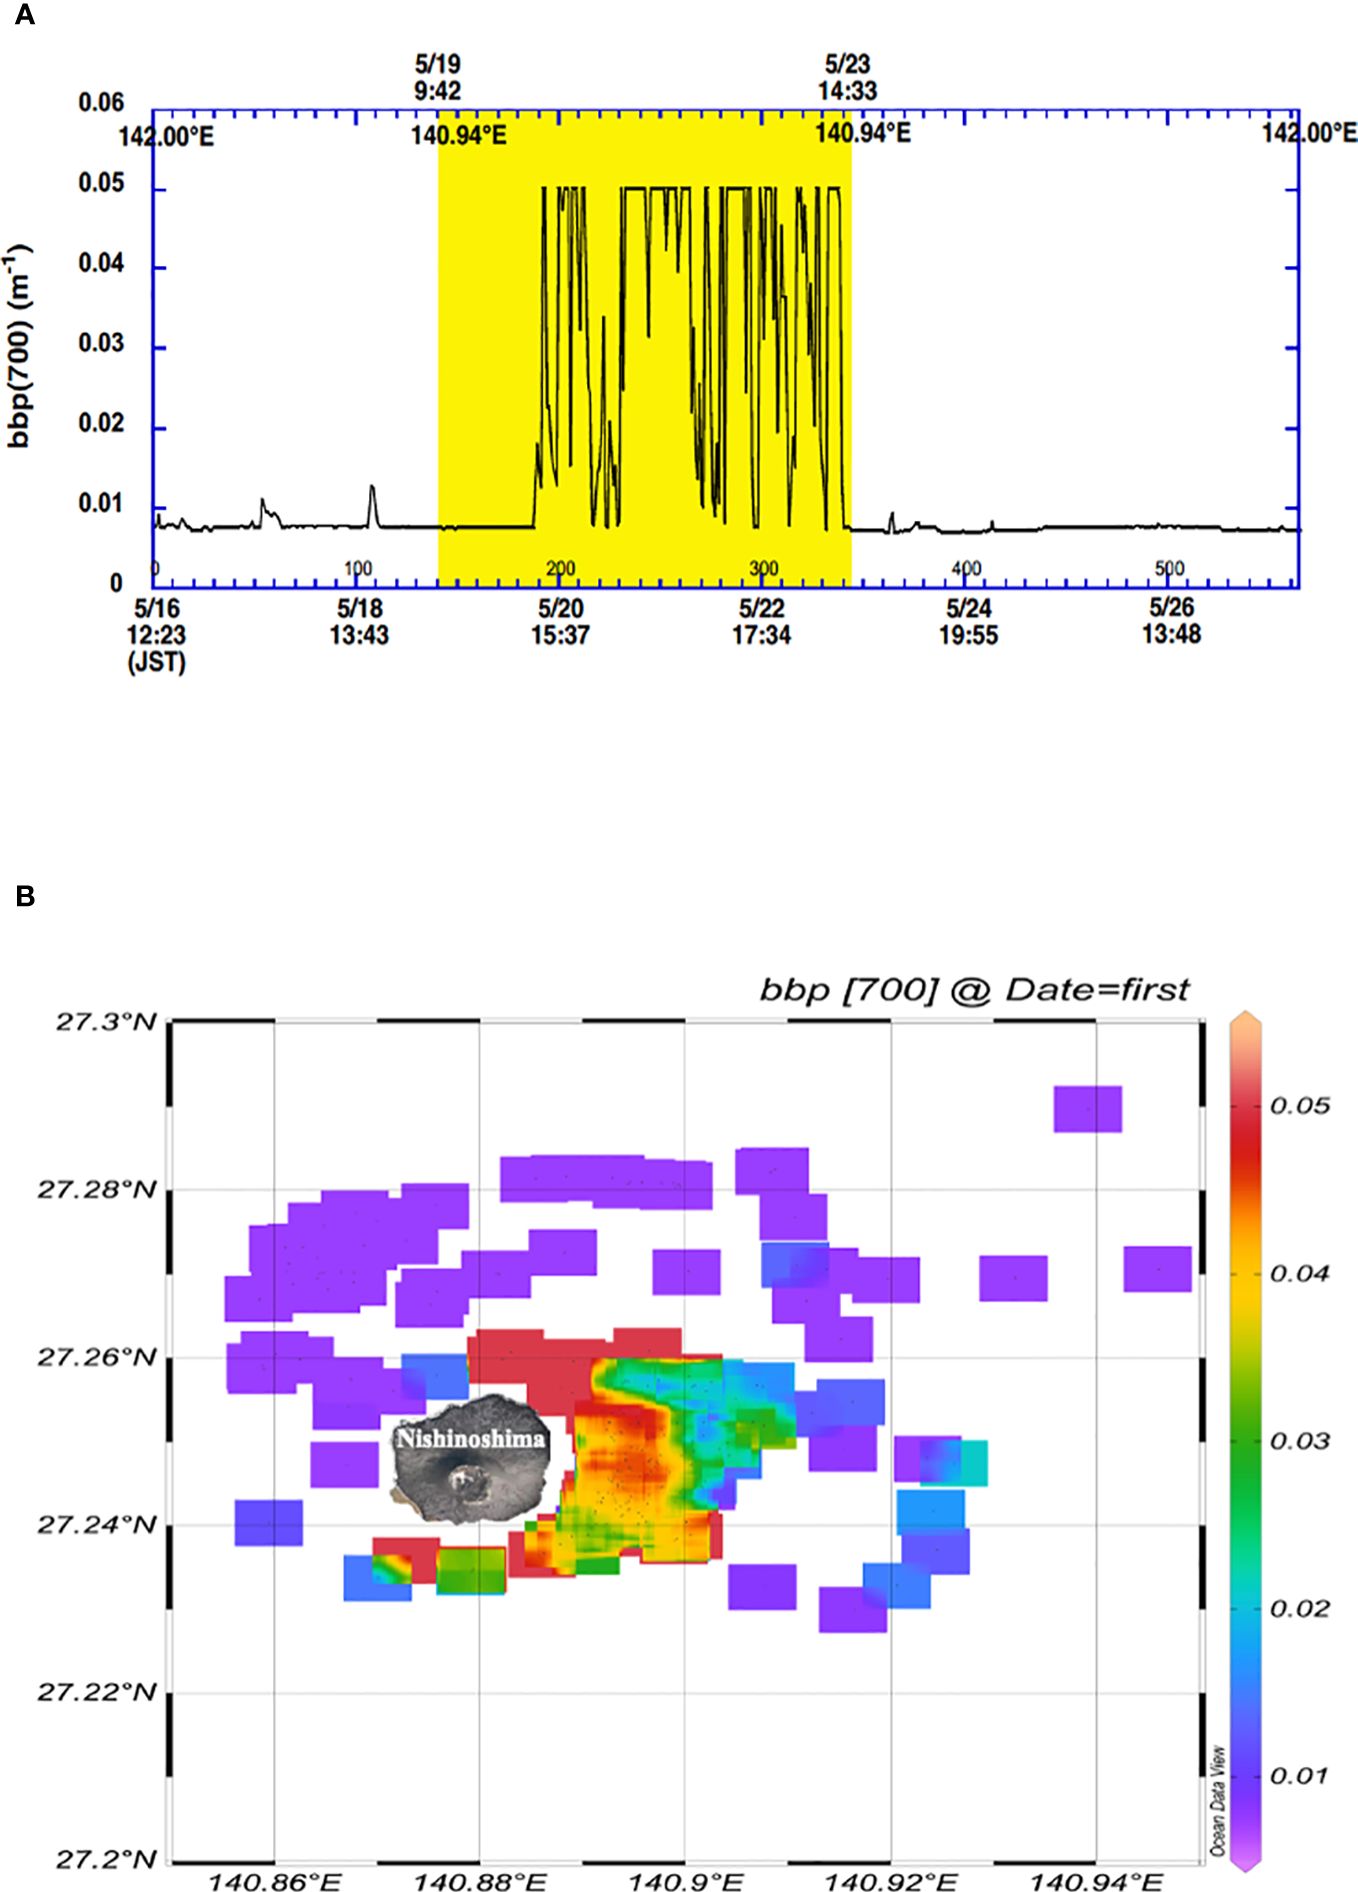
Figure 13 Backscatter data [bbp(700) (m-1)] (A) time-series variability west of 142°E. Yellow hatched area denotes the period when the USV-BB stayed near Nishinoshima shown in (B). (B) horizontal distribution near Nishinoshima.
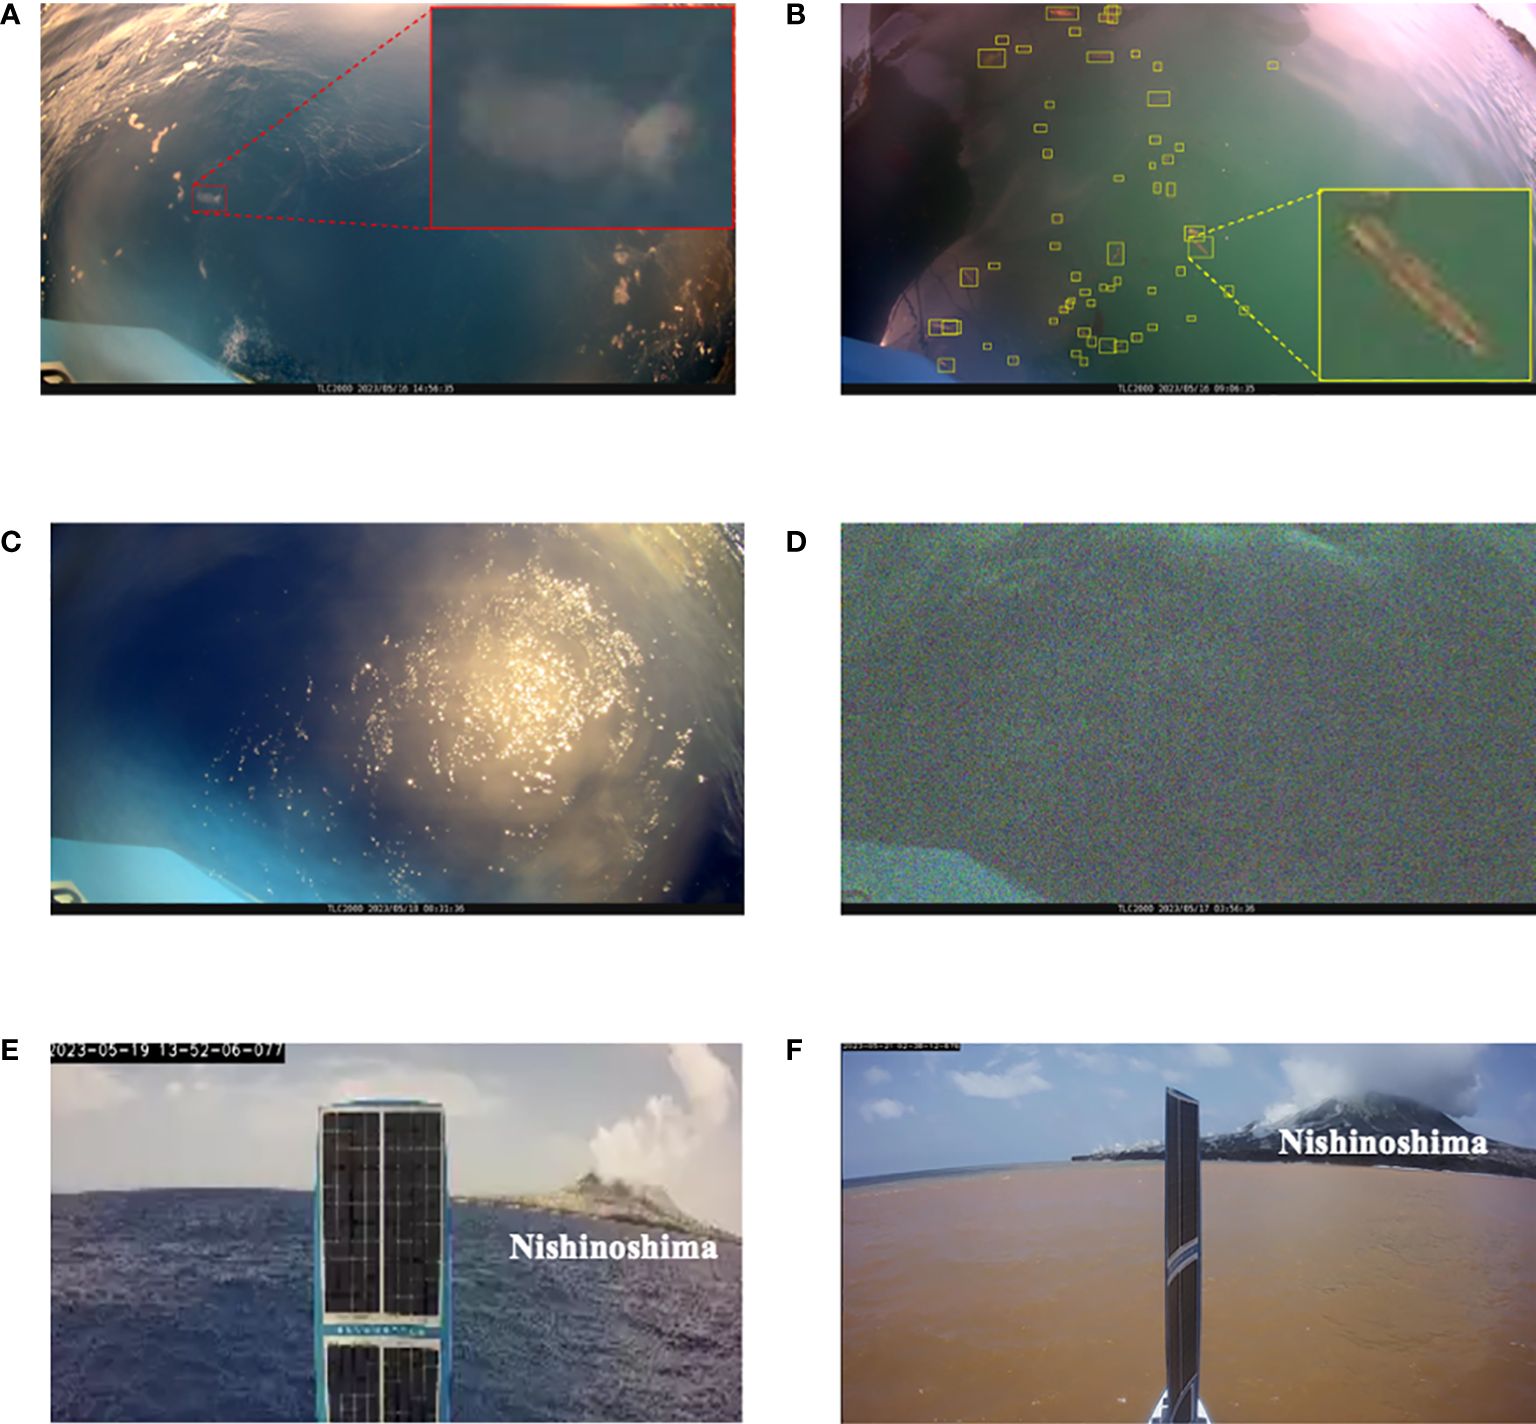
Figure 14 Downward facing camera and Bluebottle’s 360-degree camera images.
Chl-a also increased slightly east of Nishinoshima Island (Figure 15). Weak but significant positive correlation was observed between Chl-a and backscatter, especially near Nishinoshima Island (solid black circles in Supplementary Figure S3A). Thus, although high backscatter was mainly attributed to iron-rich suspended particles as discussed in the previous paragraph, particles detected as backscatter might be partly phytoplankton. In addition, Chl-a observed at night near Nishinoshima Island correlated negatively with temperature (solid blue crosses in Supplementary Figure S3B). However, the maximum of Chl-a was very low (at most 0.15 mg/m3) and, thus, it is hard to say that, due to supply of micro (iron)/macro (e.g., nitrogen and phosphate) nutrient, volcanic activity or the outflow from Nishinoshima Island enhanced phytoplankton.
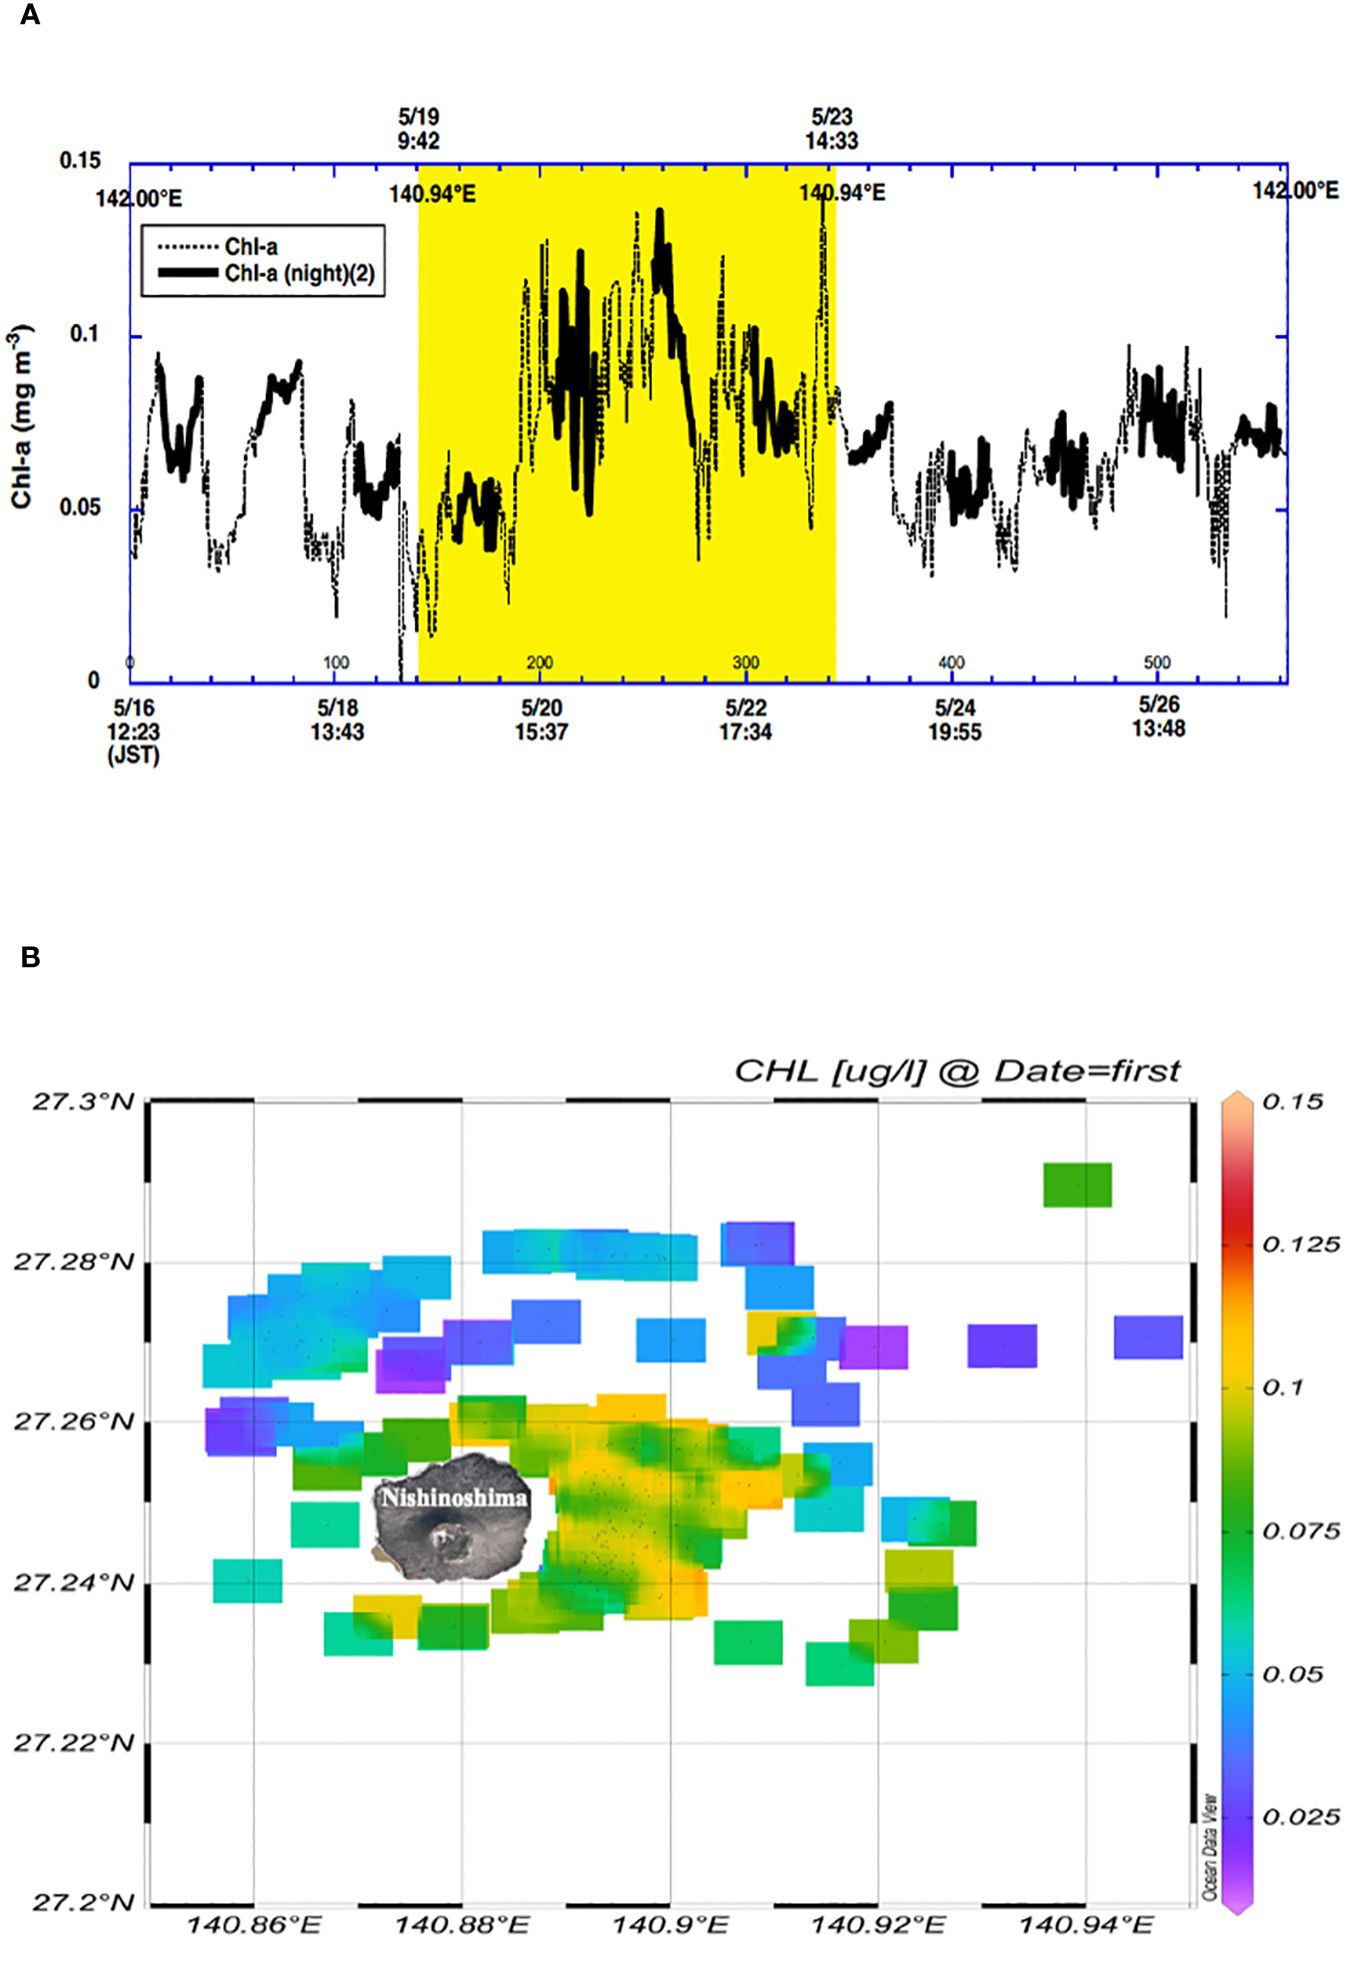
Figure 15 Chl-a data (A) time-series variability west of 142°E. Yellow hatched area denotes the period when the USV-BB stayed near Nishinoshima shown in (B). Bold line shows Chl-a at night (19:00–04:00) without occurrence of quenching at day time. (B) horizontal distribution near Nishinoshima.
From May 16, 2023, to May 28, 2023, the Brinno Timelapse Camera recorded data, capturing photos every five minutes, resulting in a total of 3506 photos throughout the mission. These images, with timestamps in Japan Standard Time (JST, UTC+9), offer a detailed visual log of the marine environment during this period. Figures 14A-D shows varying oceanic conditions: Figures 14A, B reveal possibly marine debris (plastic bottle) and leaves floating on the sea surface, respectively. Figures 14C, D both show the effect of time on the images. Figure 14C, taken at 8:31 a.m. after dawn, shows sunlight reflecting off the surface of the water, reducing visibility. Figure 14D, taken around 4:00 a.m. before dawn, is mostly a noise-like image.
Figures 14E, F, derived from Bluebottle’s 360-degree camera, further illustrates these observations. Figure 14E shows Nishinoshima Island and its fumarolic gases, with the surrounding seawater appearing in its normal blue state. In contrast, Figure 14F, taken closer to the island, clearly shows the Bluebottle navigating through discolored waters, reinforcing the impact of volcanic activity on water coloration. This photographic evidence, cross-referenced with vessel data including location, heading, and gyroscopic measurements, provides a comprehensive view of the environmental changes encountered. The variation in water color, from the typical oceanic blue to a murky appearance near Nishinoshima Island, underscores the significant influence of volcanic activity on marine conditions.
The utilization of the Brinno Timelapse Camera and Bluebottle’s 360-degree camera system provided unprecedented visual data on marine conditions, enabling a detailed analysis of changes over time. The timelapse photography allowed for continuous monitoring of the marine environment, capturing dynamic processes and transient events that traditional observation methods might miss.
The USV conducted five days of observations at shallower than 500 m water depth around Nishinoshima Island, the first time after the big eruption of Nishinoshima in June 2020. The single-beam bathymetric data around Nishinoshima Island reveal the presence of a steep slope with an inclination of approximately 40 degrees on the eastern flank (Figure 7). This is significantly larger than the inclinations observed on the north side and is consistent with the major growth of Nishinoshima Island on the north side of the crater during the large-scale eruptions from December 2019 to June 2020 (Maeno et al., 2021). The clear reflective surfaces and their depth changes in the sub-bottom profile data (Figure 8) are likely indicative of the distribution of volcanic sediments. Although these volcanological interpretations will be left for subsequent papers, these results hold important implications for understanding the formation of Nishinoshima volcano. Additionally, the continuous day-time observations of fumarolic activity obtained through 360-degree time-lapse photography (Figure 14) serve as evidence that our observations have realized real-time monitoring of Nishinoshima volcano.
pH anomalies particularly on the east side near Nishinoshima Island (Figure 12) and the color anomalies in seawater observed through camera images (Figure 14) suggest seawater abnormalities associated with the activity of Nishinoshima volcano. Besides, the observed submesoscale variations in water temperature, salinity, and current around Nishinoshima Island may be influenced by the presence of this massive volcano, which extends from 4000 m below the sea floor to above the sea surface, and potentially by volcanic activities. The submesoscale ocean variations can have impacts on the atmospheric boundary layer. Clarifying phenomena that involve interactions among the solid Earth, oceans, and atmosphere, as observed in this comprehensive USV-based observation, hold great significance.
Our preliminary investigation around the volcanic island evinced that the employment of USV presents a significant advantage in marine research, particularly in hazardous or inaccessible areas, although we have to overcome some operational problems, such as increasing of electrical capacity and driving power of USV, to realize sustainable observations. Its ability to navigate autonomously and gather multiple data in real-time under challenging conditions, such as near volcanic activity zones or in turbulent weather, minimizes risks to human researchers and reduces operational costs. Additionally, the integration of various sensors and data collection technologies, such as the single-beam echosounder for bathymetric data, and the oceanographic and meteorological sensors, despite their limitations, has provided a multi-dimensional view of the underwater landscape and marine conditions. In this study, we discussed the data acquired individually; however, moving forward, we plan to advance the understanding of various phenomena around Nishinoshima Island by integrating and analyzing multiple datasets in conjunction.
The raw data supporting the conclusions of this article will be made available by the authors, without undue reservation.
NT: Writing – original draft, Writing – review & editing, Project administration, Validation. AN: Writing – original draft, Writing – review & editing, Validation, Visualization. ST: Writing – review & editing, Project administration. HI: Writing – original draft, Writing – review & editing, Validation. DS: Writing – review & editing, Project administration. DM: Writing – original draft, Writing – review & editing, Validation. MI: Writing – review & editing, Project administration. TK: Writing – review & editing. MH: Writing – original draft, Writing – review & editing, Project administration, Validation, Visualization.
The author(s) declare financial support was received for the research, authorship, and/or publication of this article. This work was partly supported by the Japan Society for the Promotion of Science, Grant-in-Aid for Scientific Research (Grant Nos. JP20H02236).
We extend our sincere gratitude to the OCIUS for their technology and acceptance of our challenging mission, and the Chichijima Fisheries Cooperative, Ogasawara Village Office, Tokyo Metropolitan Ogasawara Island Branch Office, OCIUS, the Ministry of Land, Infrastructure, Transport and Tourism, the Japan Coast Guard, and people of Chichijima Island for their invaluable support and assistance to conduct the Bluebottle observation. We would like to express our sincere gratitude to Dr. Toshiya Fujiwara for his invaluable advices and discussions for this study. This study was supported by ERI JURP 2024-W-03 in Earthquake Research Institute, the University of Tokyo. We are also grateful to the two reviewers for their insightful comments and suggestions, which significantly improved the manuscript.
The authors declare that the research was conducted in the absence of any commercial or financial relationships that could be construed as a potential conflict of interest.
All claims expressed in this article are solely those of the authors and do not necessarily represent those of their affiliated organizations, or those of the publisher, the editors and the reviewers. Any product that may be evaluated in this article, or claim that may be made by its manufacturer, is not guaranteed or endorsed by the publisher.
The Supplementary Material for this article can be found online at: https://www.frontiersin.org/articles/10.3389/fmars.2024.1406381/full#supplementary-material
Ando K., Lin X., Villanoy C., Danchenkov M., Lee J.-H., He H.-J., et al. (2021). Half century of scientific advancements since the cooperative study of the kuroshio and adjacent regions (CSK) program –need for a new kuroshio program. Prog. Oceanogr 193, 102513. doi: 10.1016/j.pocean.2021.102513
de Ronde C. E. J., Stucker V. K. (2015). “Seafloor Hydrothermal Venting at Volcanic Arcs and 81 Backarcs,” in The Encyclopedia of Volcanoes, Chapter 47, (Netherlands: Elsevier) 823–849.
Fujiki T. (2019). MR19-02 Preliminary Cruise Report (Yokosuka, Japan: JAMSTEC). doi: 10.17596/0002620
Honda M. C. (2020). Effective vertical transport of particulate organic carbon in the western north pacific subarctic region. Front. Earth Sci. 8. doi: 10.3389/feart.2020.00366
Honda M. C., Wakita M., Matsumoto K., Fujiki T., Siswanto E., Sasaoka K., et al. (2017). Comparison of carbon cycle between the western Pacific subarctic and subtropical time-series stations: highlights of the K2S1 project. J. Oceanography. 73:647–667. doi: 10.1007/s10872-017-0423-3
Iguchi M., Nakamichi H., Tanaka H., Ohta Y., Shimizu A., Miki D. (2019). Integrated monitoring of volcanic ash and forecasting at sakurajima volcano, Japan. J. Disaster Res. 14, 798–809.
Inoue R., Suga T., Kouketsu S., Kita T., Hosoda S., Kobayashi T., et al. (2016). Western North Pacific Integrated Physical-Biogeochemical Ocean Observation Experiment (INBOX): Part 1. Specifications and chronology of the S1-INBOX floats. J. Mar. Res. 74, 43–69.
Japan Meteorological Agency (2023). Available online at: https://www.data.jma.go.jp/yoho/data/typhoon/T2302.pdf.
Johnston T. M. S., Schönau M. C., Paluszkiewicz T., MacKinnon J. A., Arbic B. K., Colin P. L., et al. (2019). Flow Encountering Abrupt Topography (FLEAT): A multiscale observational and modeling program to understand how topography affects flows in the western North Pacific. Oceanography 32, 10–21. doi: 10.5670/oceanog.2019.407
Kitamura M. (2022). MR21-06 Preliminary Cruise Report (Yokosuka, Japan: JAMSTEC). doi: 10.17596/0002532
Maeno F., Kaneko T., Ichihara M., Suzuki Y. J., Yasuda A., Nishida K., et al. (2022). Seawater-magma interactions sustained the high column during the 2021 phreatomagmatic eruption of Fukutoku-Oka-no-Ba. Commun. Earth Environ. 3, 260. doi: 10.1038/s43247-022-00594-4
Maeno F., Yasuda A., Hokanishi N., Kaneko T., Tamura Y., Yoshimoto M., et al. (2021). Intermittent growth of a newly-born volcanic island and its feeding system revealed by geological and geochemical monitoring 2013-2020, nishinoshima, ogasawara, Japan. Front. Earth Sci. 9. doi: 10.3389/feart.2021.773819
Matoza R. S., Fee D., Assink J. D., Iezzi A. M., Green D. N., Kim K., et al. (2022). Atmospheric waves and global seismoacoustic observations of the January 2022 Hunga eruption, Tonga. Science 377, 95–100. doi: 10.1126/science.abo7063
Nagano A., Hasegawa T., Ariyoshi K., Iinuma T., Fukuda T., Fujii N., et al. (2022). USV-Observed Turbulent Heat Flux Induced by Late Spring Cold Dry Air Incursion over Sub-Mesoscale Warm Regions off Sanriku, Japan. Sensors 22, 9695. doi: 10.3390/s22249695
Nagano A., Suga T., Kawai Y., Wakita M., Uehara K., Taniguchi K. (2016). Ventilation revealed by the observation of dissolved oxygen concentration south of the Kuroshio Extension during 2012–2013. J. Oceanogr. 72, 837–850. doi: 10.1007/s10872-016-0386-9
Patterson R. G., Lawson E., Udyawer V., Brassington G. B., Groom R. A., Campbell H. A. (2022). Uncrewed surface vessel technological diffusion depends on cross-sectoral investment in open-ocean archetypes: A systematic review of USV applications and drivers. Front. Mar. Sci. 8:736984. doi: 10.3389/fmars.2021.736984
Proud S. R., Prata A. T., Schmauss S. (2022). The January 2022 eruption of Hunga Tonga-Hunga Ha’apai volcano reached the mesosphere. Science 378, 554–557. doi: 10.1126/science.abo4076
Sato I., Ono T., Morishita T., Hamasaki S., Takahashi H., Nogami K. (2018). Temporal change in chemical composition of seawater around Nishinoshima volcano according to volcanic activity. Rep. Hydrographic Oceanographic Res. 55, 101–109.
Saunders P. M. (1967). The temperature at the ocean-air interface. J. Atmos. Sci. 24, 269–273. doi: 10.1175/1520-0469(1967)024<0269:TTATOA>2.0.CO;2
Takai S. (2024). Geochemical study of seawater and hydrothermal fluids obtained around volcanic edifices in the Japan waters. Tokyo University of Marine Science and Technology, 85.
Taketani F. (2021). Preliminary Cruise Report MR21-01 (Yokosuka, Japan: JAMSTEC). doi: 10.17596/0002527
Keywords: USV, volcanic islands, Nishinoshima, bathymetric survey, marine geological survey, ocean monitoring, ocean surveillance
Citation: Tada N, Nagano A, Tanaka S, Ichihara H, Suetsugu D, Matsuoka D, Ito M, Kuwatani T and Honda MC (2024) Challenge for multifaceted data acquisition around active volcanoes using uncrewed surface vessel. Front. Mar. Sci. 11:1406381. doi: 10.3389/fmars.2024.1406381
Received: 25 March 2024; Accepted: 11 June 2024;
Published: 26 June 2024.
Edited by:
Xinyu Zhang, Dalian Maritime University, ChinaCopyright © 2024 Tada, Nagano, Tanaka, Ichihara, Suetsugu, Matsuoka, Ito, Kuwatani and Honda. This is an open-access article distributed under the terms of the Creative Commons Attribution License (CC BY). The use, distribution or reproduction in other forums is permitted, provided the original author(s) and the copyright owner(s) are credited and that the original publication in this journal is cited, in accordance with accepted academic practice. No use, distribution or reproduction is permitted which does not comply with these terms.
*Correspondence: Noriko Tada, bm9yaWtvdEBqYW1zdGVjLmdvLmpw
Disclaimer: All claims expressed in this article are solely those of the authors and do not necessarily represent those of their affiliated organizations, or those of the publisher, the editors and the reviewers. Any product that may be evaluated in this article or claim that may be made by its manufacturer is not guaranteed or endorsed by the publisher.
Research integrity at Frontiers
Learn more about the work of our research integrity team to safeguard the quality of each article we publish.