 Heng Wu
 Yosuke Yamada
 Po-Shun Chuang
 Kota Ishikawa
 Satoshi Mitarai
- Marine Biophysics Unit, Okinawa Institute of Science and Technology Graduate University, Okinawa, Japan
Transparent exopolymer particles (TEP), a major component of coral mucus, are responsible for particle aggregation. These particles contribute substantially to the carbon cycle in coral reefs, and serve as an energy source for bacteria and other microorganisms. Water flows and induced turbulent mixing control material exchange between the coral canopy and the surrounding water, which is critical for coral health. However, how these factors affect TEP release by coral colonies has yet to be evaluated. Using a recirculating flume, we assessed TEP release by branching Acropora coral colonies and associated bacterial growth in the water column under different unidirectional flows. Changes in TEP and bacterial concentrations after 24-h incubation were quantified for flow speeds of 0, 5, 10, and 30 cm/s. Particle image velocimetry (PIV) measurements provided an estimate of turbulent mixing efficiency above the coral canopy. TEP and bacterial concentrations in the water column increased after 24 h of incubation. The increase in TEP and bacterial concentrations were 6.2–9.3 times and 3.4–5.1 times higher in the absence of flows, respectively, than mean values under water flows. Although mixing efficiency increased linearly with mean flow speeds, TEP release and bacterial growth differed only marginally at flows ranging from 5–30 cm/s. Detailed flow measurements combined with evaluation of TEP release suggest that the complex geometry of corals facilitates efficient material exchange at a range of flow speeds, and highlight the importance of considering these factors when estimating coral reef biogeochemistry.
1 Introduction
Transparent exopolymer particles (TEPs) are sticky, low-density, gel-like, acidic polysaccharides released by phytoplankton, bacteria, and corals, and they are responsible for particle aggregation in the ocean (Passow, 2002). Depending on the composition of ballasted particles, aggregates formed of TEPs may float on the sea surface, forming biofilms, or they may sink, becoming accessible to the benthic heterotrophic community and bacteria (Wurl et al., 2011; Passow and Carlson, 2012; Mari et al., 2017). Given that TEPs usually have C:N ratios higher than the Redfield ratio (C:N=106:16), their vertical movements imply a significant role in cycling of organic carbon in marine environments (Passow, 2002).
In aquatic environments, TEP concentration correlates with phytoplankton abundances, suggesting phytoplankton as a major contributor of TEPs (Engel and Passow, 2001). In coral reefs, which are characterized by low nutrient concentrations and low phytoplankton biomass, corals are potentially a major source of TEPs. Up to half of the carbon fixed by coral holobionts through photosynthesis is released as mucus, which may comprise up to 80% of coral exudates (Crossland et al., 1980; Davies, 1984). Aggregates induced by coral mucus may contribute to up to one-third of particulate organic carbon and it significantly modifies the biogeochemistry of reef lagoons (Huettel et al., 2006).
Due to their richness in polysaccharides, TEPs serve as a substrate for bacteria and other microorganisms in oligotrophic seawater, such as coral reef ecosystems (Wild et al., 2004; Nakajima et al., 2009; Taniguchi et al., 2014). The role of bacteria in the TEP pool is complicated, as they both produce and consume TEPs (Sugimoto et al., 2007). Previous studies have reported a wide range of mucus decomposition rates by bacteria. Such decomposition could be as rapid as 28–40% reduction of dissolved organic carbon in 24 h (Nakajima et al., 2009), while Vacelet and Thomassin (1991) reported that mucus was not fully decomposed even after 21 days of incubation. In addition to degradation, bacterial production contributes to the TEP pool. Based on field observations, TEP production by bacteria in seawater may vary from 0–156 µg XG eq. L-1 day-1 (Sugimoto et al., 2007). As both a source and sink for the TEP pool, it is necessary to monitor changes in bacterial abundance when studying TEP concentration.
Corals generally secrete mucus as a self-defense mechanism under environmental stresses (Bythell and Wild, 2011). Coral mucus also acts as a food trap and facilitates feeding by corals themselves and other organisms (Bythell and Wild, 2011). Most laboratory experiments investigating environmental effects on coral mucus or organic matter release have been conducted in beakers with stirrers, in which generated flow characteristics were very different from what corals experience in nature (Tanaka et al., 2008; Naumann et al., 2010). Several studies were conducted in situ, but it was difficult to isolate the effect of flows in a reef (Crossland, 1987). So far as we know, only one study has examined the relationship of water flow speed and organic matter release by corals (Wild et al., 2012). Through laboratory flume experiments with small fragments of corals, Wild et al. (2012) showed that corals release significantly more particulate organic carbon when subjected to water flows than with no current, which they attributed to hydrodynamic impact. However, the amount of particulate organic matter release in low and high flows (~5 cm/s and ~15 cm/s) did not differ significantly. Stronger flows not only cause stronger hydrodynamic impact, but also greatly enhance material exchange between coral tissue and seawater, which mitigates coral stress response (bleaching) (Nakamura, 2010). Water flow characteristics at coral-colony or polyp scale modulate many biological processes of coral reefs (Dennison and Barnes, 1988; Nakamura and Yamasaki, 2005; Finelli et al., 2007). The effect of water flows on coral biological processes is generally related to efficiency of material exchange between corals and ambient water in the form of nutrient uptake and waste disposal (Guizien and Ghisalberti, 2016; Davis et al., 2021).
Material exchange, including exchange of particulate organic matter, between corals and seawater relates directly to mixing and shear stress at the tops of coral canopies. The extremely rough surface of corals induces strong frictional shear that enhances mass transfer across the interface between coral canopies and free stream flows (Bilger and Atkinson, 1992). Efficiency of material exchange between the coral canopy and seawater can be described by diffusivity (or the diffusion coefficient), which is the sum of turbulent diffusivity and molecular diffusivity of some substance in seawater (such as nutrients, oxygen or carbon dioxide) (Chin, 2012). In the absence of flows, molecular diffusion is the sole mechanism for material exchange between the coral canopy and ambient water. In the case of water flows, vertical turbulent diffusivity is usually much stronger than molecular diffusivity and controls the vertical material exchange.
Vertical exchange coefficient marks the material exchange efficiency between the coral canopy and ambient water flows and is determined by friction at the interface between the canopy and free stream flows (Ghisalberti and Nepf, 2005). When coral colonies are exposed to steady, unidirectional flows, a shear layer forms at the interface between the top of the coral colonies and the free stream flows. The shear layer determines the momentum, and in turn the amount of material that can be delivered into coral colonies (Hearn et al., 2001). The strength of the shear layer is often quantified by friction at the upper surface of colonies, which is dominated by Reynolds shear stress, peaking near the top of the coral canopy. Friction at the upper surface of colonies is mainly determined by coral morphology. The high spatial heterogeneity of coral geometries, compared to canopies with homogeneous heights, produces a larger momentum deficit in the canopy and generates more complicated flows (Hamed et al., 2017). Very rough coral geometries, which enhance the mass transfer rate, may explain how coral reefs maintain high productivity in low-nutrient tropical waters (Hearn et al., 2001). However, effects of flow characteristics on organic matter, especially TEP release from corals have not been assessed at colony scale.
Studying changes in transparent exopolymer particle concentrations in the water column caused by coral colonies and the effect of ambient flows on the TEP concentration change should enhance understanding of coral roles in the marine carbon cycle. This study evaluated how ambient flows, including the mean flow speed and the induced turbulent mixing efficiency, affect net TEP release from Acropora coral colonies and associated bacterial growth in the water column through systematic laboratory flume experiments.
2 Materials and methods
2.1 Setup and experimental design
Acropora colonies were placed in a closed-system flume and exposed to unidirectional flows of 0, 5, 10, and 30 cm/s. Flow speeds were selected based on flow speeds measured in situ near coral collection sites, which ranged from 0 to 30 cm/s (Rintoul et al., 2022).
Branching Acropora corals were selected as the study subject based on their dominance in shallow reefs in Okinawa, Japan (Loya et al., 2009), their wide distributions in the Indo-Pacific region (Veron et al., 2000), and their large mucus production, compared to other coral genera (Nakajima and Tanaka, 2014). Two sets of Acropora corals colonies were collected near the shore at Maeganeku, Okinawa island (26°26’29.77˝N, 127°47’24.84˝E) at a depth of about 3–5 m. Set A was collected on July 8 2021 and set B was collected on April 26 2022. For each set of corals, the size and number of the coral colonies were chosen to fully cover the test section of the flume to test the effect of flows at a scale of multiple coral colonies (Supplementary Figure S1). Set A consisted of 14 colonies with 1–9 branches, each branch with a length of 5–18 cm and diameter of 0.7–1.7 cm. Set B was composed of 20 colonies with 3–15 branches, each branch with a length of 2–12 cm and diameter of 0.5–1.5 cm. Experiments on Acropora set A were conducted between September 6 2021 and October 14 2021. Experiments on Acropora set B were carried out between May 16 2022 and July 5 2022. Prior to and after trials, corals were kept in an open outdoor tank with running filtered natural seawater.
To better describe the geometry of the coral canopies, was defined as, at each elevation from the bottom of the test section, the ratio between the area occupied by the corals and the total bottom area of the test section in the flume (Lowe et al., 2008). Following the method in Lowe et al. (2008) to estimate , we placed the coral colonies (the dried skeleton after all of the coral colonies bleached) into a rectangular tank and filled the tank at a known rate. Pictures of a ruler taped to the side of the tank were taken to evaluate the water level change. The water level change with and without the coral colonies in the tank was compared to obtain . The profiles of each coral sets are presented in Figure 1. The plan area fraction occupied by the coral colonies decreased with elevation and varied between 0 and 0.10 (for coral set A) and 0.13 (coral set B).
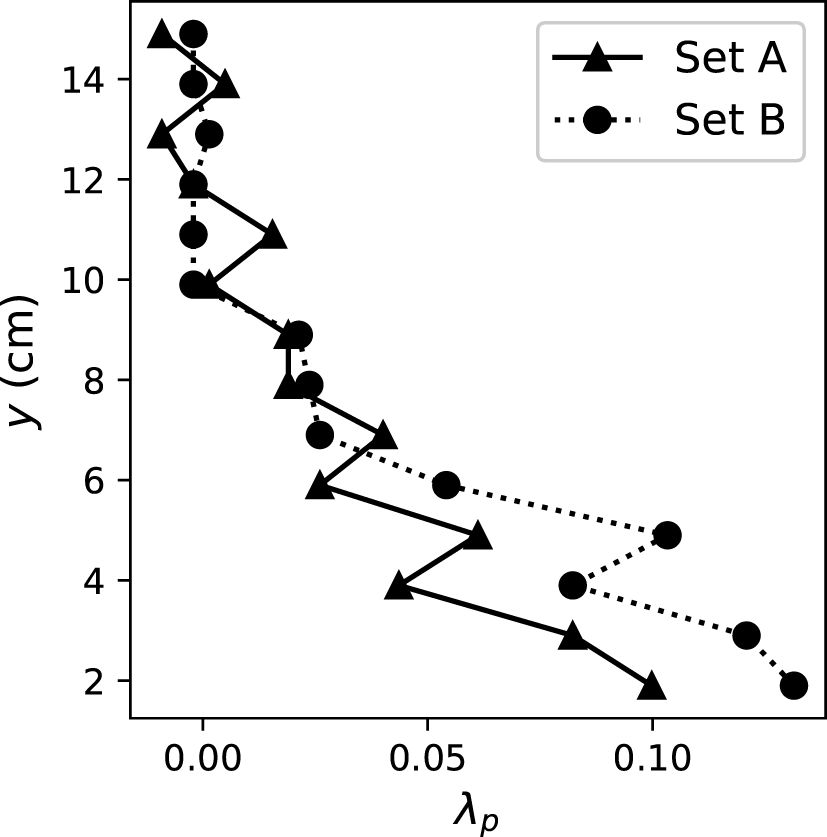
Figure 1 Profile of for the two coral sets. was defined as the ratio of the area occupied by the coral colonies and the total area of the flume test section at each elevation (Lowe et al., 2008).
All experiments were conducted in a recirculating, closed-system flume (West Japan Fluid Engineering Laboratory Co., Nagasaki, Japan), at the Marine Science Station of the Okinawa Institute of Science and Technology, Japan. The test section was an open channel with zero slope and a rectangular cross-section, 98 cm long and 30 cm wide. Water depth was around 30 cm. Flow in the flume was driven and controlled with a variable-speed impeller. Flow through the test section circulated back from a pipe underneath the test section. Acropora colonies were placed in the flume so as to cover the bottom of the entire test section (Figure 2A; Supplementary Figure S1). The submergence ratio, defined as the ratio between the height of the coral colonies and the total water depth, was around 0.2, such that the setup fell into the category of depth-limited canopy flows and the blocking effect was negligible (Asher and Shavit, 2019). Three aquarium lights (Spectra SP200, Blue Harbor) were positioned atop the flume test section. The color spectrum was adjusted to match light conditions at 5 m depth and scheduled to turn on between 06:00 h and 18:00 h. Light intensities were ~200 µmol m-2 s-1 at the bottom of the test section using a quantum light meter MQ-210 (Apogee Instruments, Utah, USA). Light intensities agreed well with those reported for reefs 5 m deep (Crossland, 1987). The x-axis was defined as the streamwise direction with the positive end downstream and the origin placed at the inlet of the test section. The y-axis was defined as vertical with positive pointing upward and the origin at the bottom of the test section. The z axis was in the spanwise direction.
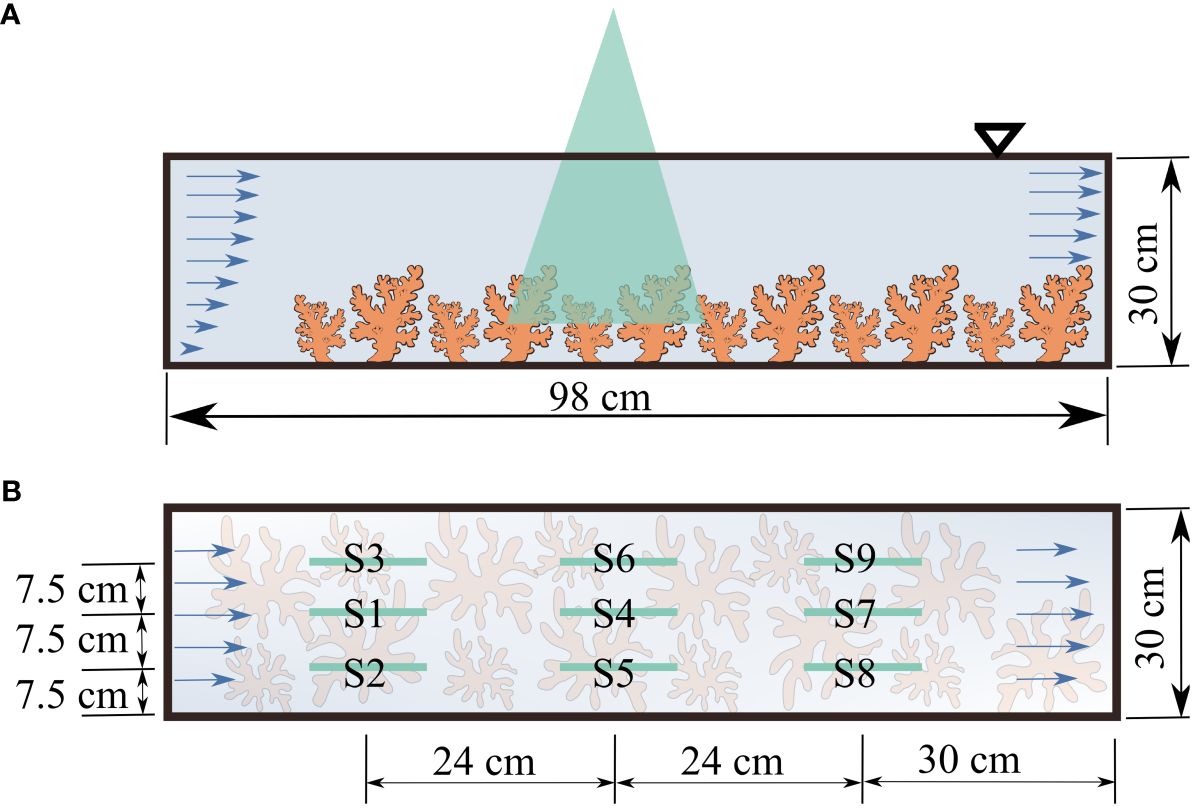
Figure 2 Flow measurement setup (A) side view: with corals placed in the flume; (B) plan view indicating the locations of particle image velocimetry measurements.
Seawater filtered with a sand filter followed by a 10 µm filter to remove larger plankton was used in the trials. The total amount of water in each trial was 406 L. Water temperature was maintained at 25°C. The salinity of the natural seawater varied slightly, but it was 34.4–35.6‰ during our experiments.
Each trial lasted 24 h, starting at 18:00 h in the dark and ending at 18:00 h the next day. Within two h prior to the start of each trial, the flume was rinsed with filtered seawater for 10 minutes and filled with filtered seawater. Immediately prior to each trial, coral colonies were transferred from the outdoor open tank, submerged and gently rinsed with filtered seawater to remove any visible organisms attached to them. After the filtered seawater wash, colonies were placed in the flume (Figure 2A; Supplementary Figure S1). Water samples were collected immediately after starting the water flow at 0, 5, 10, or 30 cm/s. Three water samples were collected to allow three replicates for TEP and bacterial concentration analyses. Water samples were 300 mL for TEPs and 5 mL for bacterial concentration evaluation. At the end of trials, coral colonies were removed from the test section and returned to the outdoor holding tank. Water in the flume was homogenized by running unidirectional flows at 80 cm/s for 15 minutes before sampling the water for TEP and bacterial quantification to avoid potential biased spatial distribution of TEP and bacteria.
To ensure that changes in TEP concentration and bacterial growth resulted from the presence of coral colonies, we conducted control experiments following the same procedure, but without corals in the flume. Control experiments for each flow condition were conducted within 24 h after each trial to account for potential fluctuation in natural seawater quality.
Following the procedures above, we conducted trials under four mean flow speeds (0, 5, 10, 30 cm/s) with the same set of coral colonies used repeatedly for all four flow speeds. The seawater was replaced for each trial. The absence of water flows was expected to have strong negative effects on the corals. To avoid re-using visually abnormal coral colonies (such as tissue loss) in the trials, the stagnant flow trials were conducted last, and trials for the other flow speeds were carried out in a random order. Experiments for different flow speeds were conducted at least one week apart. Coral colony placement in the flume was kept as similar as possible among flow conditions to minimize variability arising from changes in flow pattern due to different coral canopy geometry. Experiments were repeated on two sets of Acropora colonies (set A and set B) to ensure repeatability.
2.2 Quantification of TEP concentration and bacterial abundance
TEP concentration was quantified colorimetrically at the beginning and the end of incubation. Water samples were filtered with 47-mm, 0.4-µm polycarbonate filters under a vacuum of 0.02 MPa. Immediately after filtration, filters were stained with 1 mL of 0.02% alcian blue solution in 0.06% acetic acid for 30 s, rinsed with 1 mL of MilliQ (Merck, Darmstadt, Germany) water to remove excess dye and then stored at –20°C for later analysis (see Figure 3 for a sample image of TEP stained with alcian blue) (Passow and Alldredge, 1995). Each filter was then placed in a glass vial filled with 80% sulfuric acid and shaken at 200 rpm for 2 h. After extracting dye from the filters, 300 µL of the solution was transferred onto a 96-well plate and absorbance was measured at 787 nm with a Multiskan GO microplate reader (Thermo Fisher Scientific, Massachusetts, USA). Absorbances were converted to TEP concentrations using a calibration curve generated using Gum Xanthan (XG) (MP Biomedicals, LLC, California, USA) standard solution. TEP concentration was standardized with acidic polysaccharide Gum Xanthan and the TEP concentration was expressed as µg XG equivalent per liter following the procedures proposed by Passow and Alldredge (1995), a widely used method to measure TEP (see our calibration curve in Supplementary Figure S2). The TEP concentration change in the water column due to the presence of corals (net TEP release), was defined as
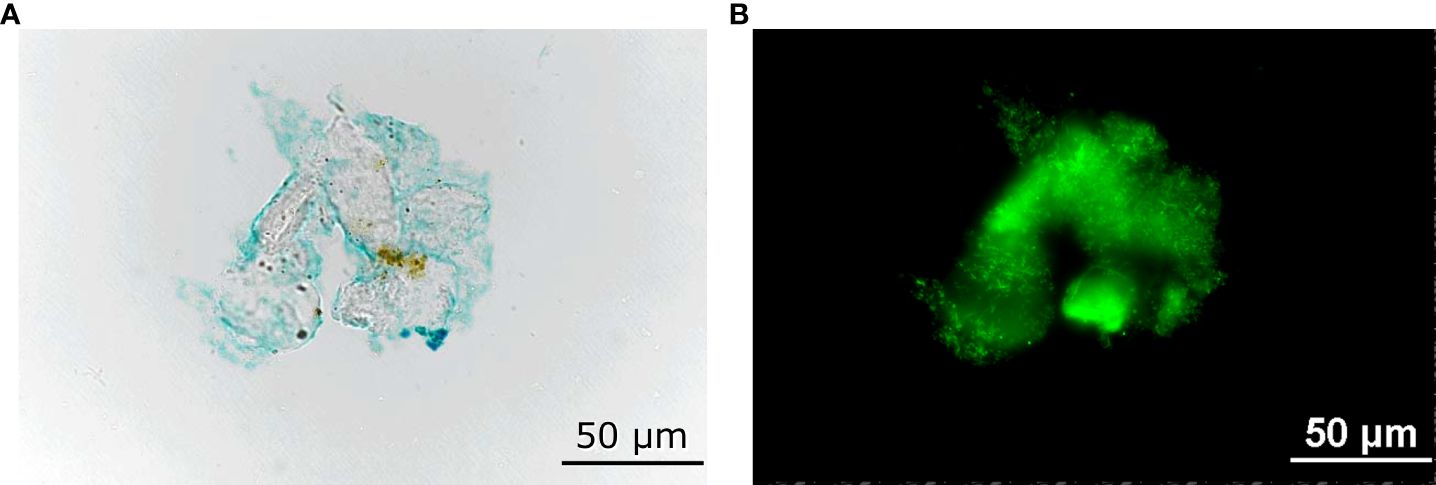
Figure 3 Sample images of a transparent exopolymer particle (A) stained with alcian blue dye, and (B) bacteria attached to it.
Where
is the increase in TEP concentration in control experiments for each flow speed. Values of are shown in Supplementary Figure S3A. The TEP concentration of each water sample was denoted as TEP, the t00 and t24 under-script indicates that water samples were collected at the beginning and end of the incubation, respectively. The under-script c denotes data in control experiments. The over bar denotes the average TEP concentration of triplicate water samples.
To estimate bacterial abundance, for each trial, triplicate 5-mL water samples were fixed, filtered, and stained immediately after sampling. The final concentration of formaldehyde in the fixed solution was 5%. The fixed solution was filtered using 25-mm, 0.2 µm polycarbonate filters with low vacuum of 0.02 MPa and then stained with DAPI (Porter and Feig, 1980). Ten pictures were taken at random locations on each filter with an epifluorescence microscope and bacterial cells were counted using ImageJ software to estimate bacterial abundance (see Supplementary Figure S4 for a sample picture used in counting bacterial cells). As in TEP release, bacterial growth was defined as the difference between bacterial growth, ΔN, in the trial and control experiments for each flows condition,
where
is the increase in bacterial concentration in control experiments for each flow speed. Values of for each flow condition are shown in Supplementary Figure S3B. The bacterial concentration of each water sample is denoted as N, the over bar denotes the average bacterial concentration of triplicate water samples.
2.3 Statistical analysis
Mean values and standard deviations (SDs) were computed for ΔTEP and ΔN for each set of corals at each flow speed using three replicates. The correlation between net TEP release and bacterial growth were examined using the Kendall rank correlation coefficient for its accuracy for small data sets. The correlation coefficient was computed with all ΔTEP and ΔN from both coral sets pooled together.
2.4 Flow measurements
To estimate efficiency of vertical material exchange near the interface between free stream flow and coral colonies, we conducted detailed flow measurements using standard two-dimensional, two-component particle image velocimetry (PIV) with the same sets of corals placed in the flume in the same configuration as the TEP and bacterial concentration experiments. Flow measurements were conducted separately for TEP and bacteria experiments so that the biological response of corals was not affected by stimulation of the laser or seeding particles.
A PIV system was implemented to measure streamwise (u) and wall-normal (v) velocities. The PIV system consisted of an 8-W continuous green laser (532 nm) (Omicron-laserage Laserprodukte GmbH, Rodgau, Germany), a camera to capture images (Kato Koken, Kanagawa, Japan) 1024 × 1024 pixel with a field of view of approximately 20 cm × 20 cm. Flow was seeded with silver-coated hollow-glass spheres with a mean diameter of 10 µm and an average specific gravity of 1.4 (Dantec, Skovlunde, Denmark). The laser beam exited the laser head, oriented downward, perpendicular to the bottom of the test section of the flume and spread into a thin laser sheet with series of cylindrical lenses (Thorlabs, New Jersey, USA). Laser light scattered by seeded particles was captured by the high-speed camera at a frequency from 50–200 Hz, depending on experimental conditions to obtain a crisp image of seeded particles. Captured images were processed with the PIVlab tool in MatLab (Thielicke, 2014; Thielicke and Stamhuis, 2014; Thielicke and Sonntag, 2021) with a recursive grid of 64 × 64 pixel to 32 × 32 pixel and maximum displacement of 0.49. Particles in each grid were correlated between images in each image pair with an FFT correlator to estimate flow velocity in each grid in pixel units. Image units were converted to cm/s with the time separation between image pairs and a calibration image that was a picture of a ruler.
Flow fields were measured at nine locations across the test section to account for the complex, heterogeneous geometry of coral colonies and to provide an average description of flow properties. Measurements were taken at three streamwise locations, each with three lateral slices (Figure 2B). For each trial, 8000 images were acquired to ensure convergence in mean and second order turbulence properties (the Reynolds shear stress).
The streamwise velocity, u, at each grid point, following Reynolds decomposition, was decomposed into a temporal mean, U, and fluctuation components, ,
The same operation was also applied to decompose the vertical velocity, v, into mean vertical velocity, V, and vertical fluctuation, .
To visualize flow development, mean velocity profiles were represented by those at the center of the flume to minimize wall effects. Representative mean velocity profiles were computed from measurements at S1, S4, and S7 (Figure 2B). The streamwise velocities averaged over three lateral slices at three streamwise locations were also computed. Mean velocity profiles were computed by taking a spatial average in the streamwise direction of the temporal mean streamwise velocity, U (Equation 5), for each trial. To highlight flow development, spatio-temporally averaged velocity profiles at S1, S4, and S7 were further normalized by the maximum velocity in each profile.
Material exchange strongly depends on shear at the interface between coral colonies and the ambient water. We estimated the shear strength with the peak Reynolds shear stress. Reynolds shear stress, τ, at each grid point was computed as
where ρ is the density of seawater estimated from water temperature and salinity. The overbar denotes temporal averaging. As with procedures for mean velocity profiles, we took the spatio-temporal average of the Reynolds shear stress (Equation 6) to obtain a profile for upstream, mid-stream, and downstream locations to illustrate development of Reynolds shear stress. Each Reynolds shear stress profile was normalized with the peak value in the profile and the vertical coordinate was normalized with the total water depth. Reynolds stress profiles averaged over three lateral slices were also computed.
The vertical exchange coefficient, is proportional to the shear velocity (Ghisalberti and Nepf, 2005). Here we use the shear velocity as a proxy for the material exchange efficiency. The shear velocity is approximated with the peak of the Reynolds shear stress profile, . The shear velocity estimated at S4 (Figure 2B), which was at the center of the flume, was used as a representative material exchange efficiency.
3 Results
3.1 TEP and bacteria
Incubation experiments with Acropora colonies showed an increase in TEP concentration for both sets of corals. At no flow, some colonies experienced “whitening” in some branches. Polyps were not observable in the whitened branches and tissue debris was found beneath colonies, suggesting tissue loss in these colonies under no flow condition. Even after recovering in the outdoor holding tank for weeks, the whitened branches were not able to recover their colors.
Differences in ΔTEP at 5, 10, and 30 cm/s flows were minor for both sets of corals (Figure 4A). The net TEP release, ΔTEP computed with Equations (1) and (2), was 6.2–9.3 times higher under no-flow, compared to the average ΔTEP under 5–30 cm/s flows.
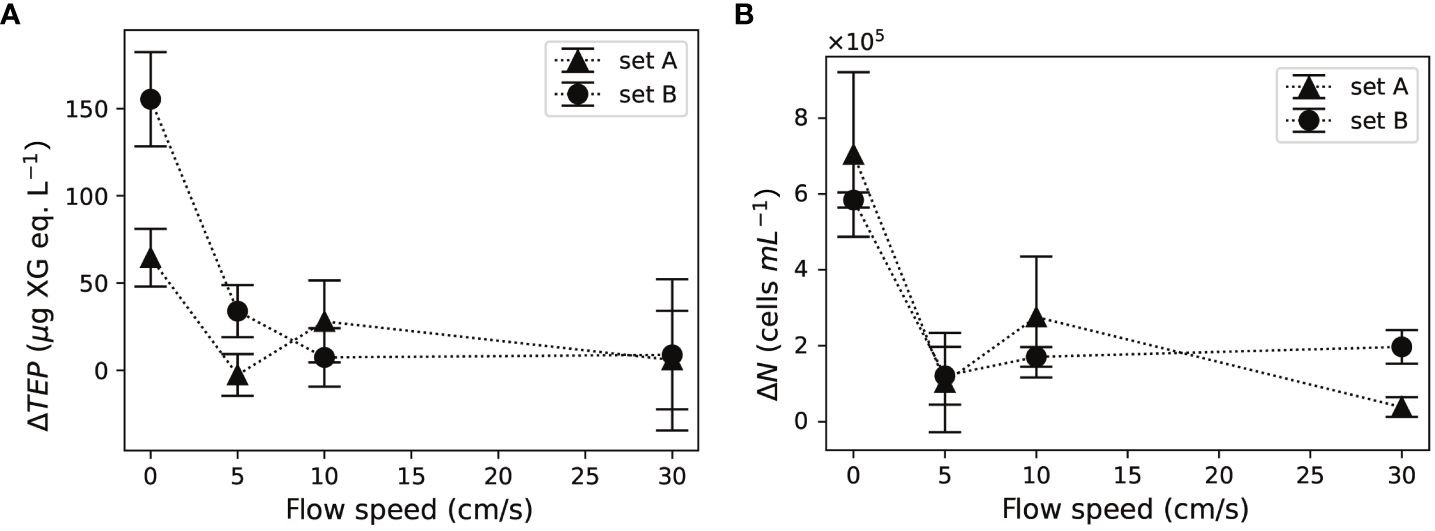
Figure 4 Both (A) net TEP release, ΔTEP and (B) bacterial growth, ΔN, increased in the absence of flow. Error bars indicate the standard deviation of three water samples in each set of corals.
Bacterial concentrations, computed with Equations (3) and (4), increased at all flow speeds after the 24-h incubation. Bacterial growth showed minor differences among 5, 10, and 30 cm/s (Figure 4B). Bacterial growth at no-flow was 3.6–5.1 times higher than that under 5, 10, and 30 cm/s flows for both sets of corals.
Net TEP release and bacterial growth were positively correlated (Kendall rank correlation coefficient τ=0.71, p=0.014).
3.2 Flow characteristics
Particle image velocimetry measurements provided instantaneous two-dimensional, two-component velocity fields.
Normalized spatio-temporally averaged streamwise velocity profiles of coral set A and B through the center-line of the test section S1, S4, and S7 in Figure 2 are shown in Figures 5A, C. (The streamwise velocity averaged over three lateral slices at three streamwise locations were shown in Supplementary Figures S5A, C for coral sets A and B, respectively.) Mean streamwise velocity profiles of various flow rates collapsed onto each other when normalized with the maximum velocity and the distance to the wall normalized with the total water depth. Mean velocity profiles were more uniform when entering the test section and a turbulent boundary layer developed as the water flowed downstream (Figure 5). The lower part of the velocity profile was slowed by drag imposed by the complex geometry of the coral canopy. The inflection point in the velocity profile, where strong shear usually occurs, was located in close proximity to the top of the canopy. As the flow developed, the inflection point moved upward, away from the wall.
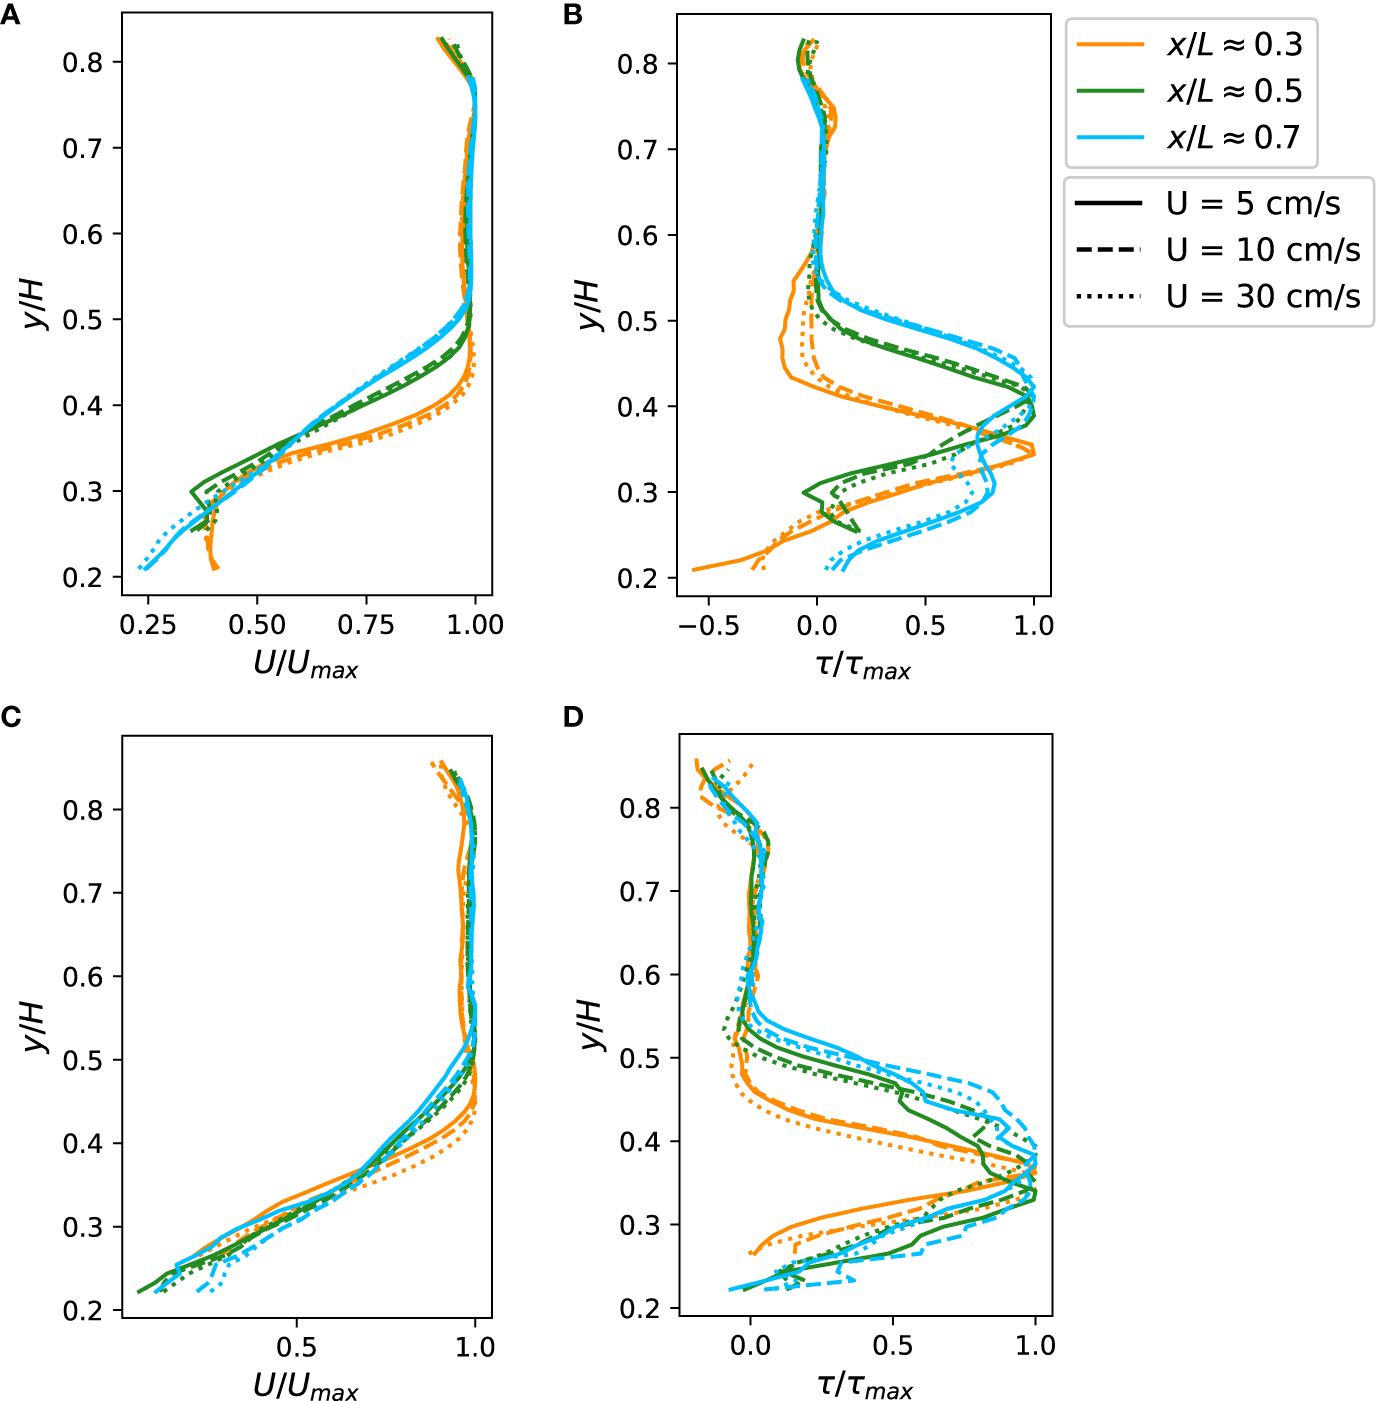
Figure 5 (A, C) Normalized mean streamwise velocity profiles for (A) coral set A and (C) coral set B. (B, D) Reynolds shear stress profiles for (B) coral set A and (D) coral set (B) The profiles were measured at three streamwise locations in the flume. The vertical distance from the bottom of the test section, y, was normalized with water depth, H. The streamwise location, x, was normalized with the length of the test section, L. Mean velocity profiles were normalized with the maximum velocity. Reynolds shear stress profiles were normalized with the maximum value in the profile.
Similarly, Reynolds shear stress profiles of coral set A and B through the center-line of the test section is shown in Figures 5B, D. (The Reynolds shear stress profiles averaged over three lateral slices were also computed and presented in Supplementary Figures S5B, D for coral sets A and B, respectively.) Normalized Reynolds shear stress profiles for different flow rates, when normalized with the peak value in the profile, collapsed onto each other, while developing as the water moved downstream. These profiles all showed a peak near the top of the coral canopy, indicating the location with the strongest turbulent mixing (Figures 5B, D). The location with strong shearing coincides with the location of a kink in the mean velocity profile, which indicates a strong velocity gradient and shear. Reynolds shear stress profiles, similar to mean velocities, develop as the water flowed downstream and the location of the peak moved away from the bottom of the test section. The most downstream Reynolds shear stress profile showed a secondary peak beneath the primary peak, which was likely a result of shear layer vortices generated by upstream branches being advected downstream (Koken and Constantinescu, 2021). The peak of Reynolds shear stress was strongest at the upstream leading edge. Stronger turbulent mixing in the upstream region was also consistent with the fact that a pressure gradient is more important than turbulent stress at the leading edge of the developing boundary layer above coral canopies.
As a proxy of the vertical material exchange efficiency, the shear velocity increased linearly with mean flow speed, with values of 0.999 for both sets of corals (Figure 6). The two sets of corals showed slightly different slopes, suggesting that they have different friction coefficients (see Discussion for more details).
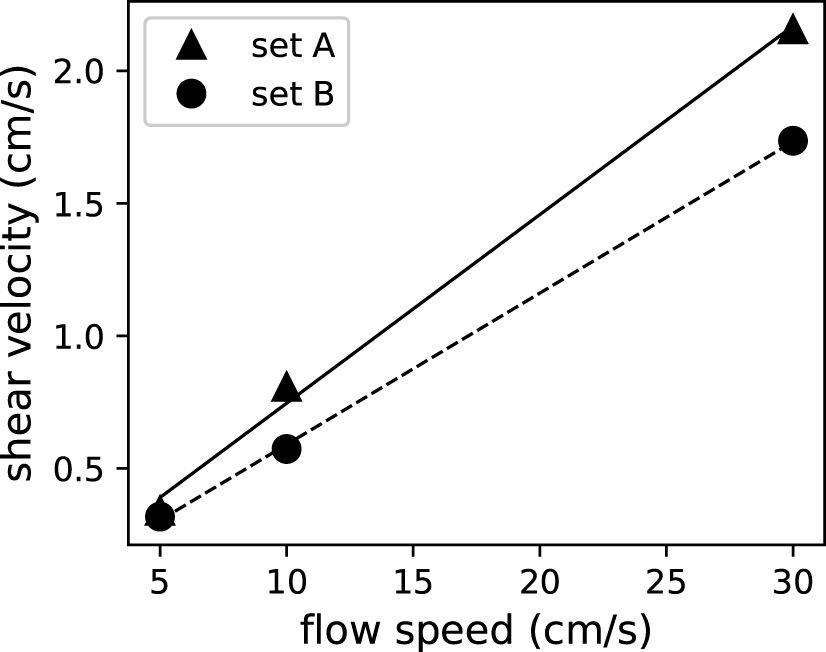
Figure 6 Shear velocity as a proxy of material exchange increased linearly with mean flow speeds for both sets of corals.
As many biological responses of corals stem from material exchange, we estimated vertical material exchange efficiency using shear velocity. In cases without flows, material exchange between the coral canopy and the environment can only occur via molecular diffusion. Molecular diffusivities depend solely on the substance being exchanged and the medium in which it happens. Estimated shear velocity increases with mean flow speed, which is consistent with the expectation of stronger turbulent mixing in faster flows (Figure 6). Estimated shear velocity varied at different locations in the test section with a coefficient of variation between 0.105 and 0.205. With variations at different locations in the test section, shear velocity, however, did not show any trend as the boundary layer developed in the flume. Figure 7 showed that net TEP release decreased with shear velocity.
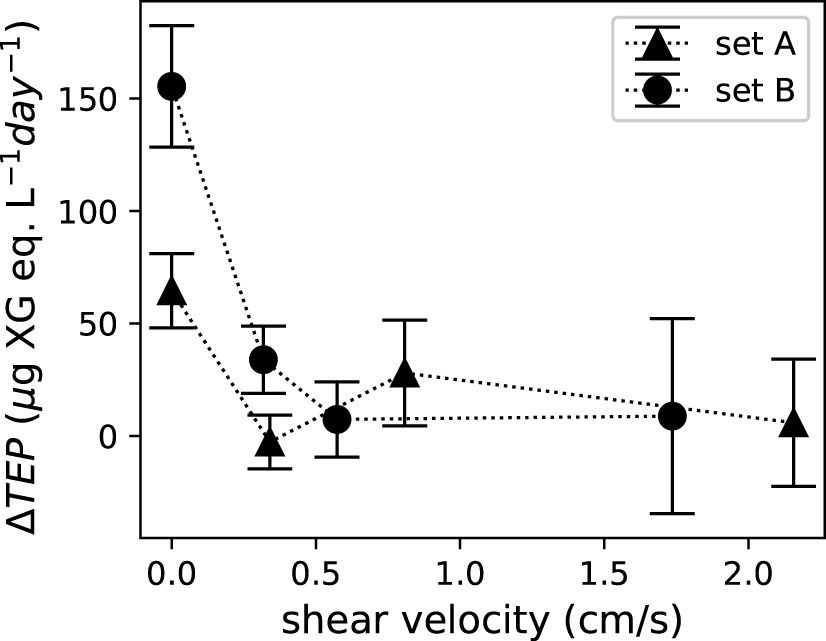
Figure 7 Net TEP release, , was a function of shear velocity. Error bars indicate the standard deviation of the three water samples for each set of corals.
4 Discussion
4.1 Coral TEP release
We suspect that the reason for increased net TEP release in the no-flow condition could be inefficient material exchange. This explanation is consistent with enhanced diffusivity (hence better material exchange efficiency) in high flows from our detailed flow measurements and previous studies, suggesting amplified material exchange across tops of coral canopies in turbulent flows (Atkinson and Bilger, 1992; Bilger and Atkinson, 1992; Chang et al., 2013). Some coral colonies bleached and lost some tissue during incubation at no-flow, which is consistent with a previous study relating coral mortality to low flow rates (Nakamura and van Woesik, 2001) and findings of Finelli et al. (2006) that water flows mitigate oxidative stress in corals and help them resist bleaching. Niggl et al. (2008) found that Acropora corals released large amounts of organic matter during early stage bleaching induced by heat stress. The spike in net TEP release at no flow in our experiment could be because some colonies underwent early stage bleaching due to the lack of material exchange. Although the shear velocity in faster flows (30 cm/s) was substantially higher than that in low flows (5 cm/s), corals did not release more TEPs in high flows. Minor differences in net TEP release at flows of 5–30 cm/s despite enhanced turbulent mixing at higher flows suggests that even the amount of material exchange induced by a flow of as little as 5 cm/s was sufficient for coral survival. Given the higher TEP production in no-flow than flowing conditions, it can be hypothesized that tide pools formed during low tides might be a dominant factor in the biogeochemical impact of coral colonies in reef ecosystems. During low tides, an inner reef may become a lagoon, creating no-flow conditions for corals to release large amounts of TEP and those releases may be transported to the open ocean during high tides (Mashini et al., 2015). Our findings suggest that corals in inter-tidal area and tide pools may contribute significantly to the TEP pool in the nearshore ocean.
Apart from self-defense, coral mucus also facilitates heterotrophic feeding of corals (Brown and Bythell, 2005). The sticky string or coating of TEP-rich mucus helps to trap food particles, that are delivered to the mouths of polyps using cilia or tentacles. Therefore, secreting more mucus would enhance ciliary-mucoid feeding. Particle uptake is important for corals, especially when recovering from early-stage bleaching (Ferrier-Pages et al., 2003; Houlbreque and Ferrier-Pages, 2009; Hughes and Grottoli, 2013). At the beginning of bleaching, the main energy provider for corals, zooxanthellae, leave the corals. Heterotrophic feeding, as an alternative method to obtain energy, helps corals to survive energy shortages. Under no-flow, corals may experience early-stage bleaching and secrete large amounts of mucus in an attempt to facilitate heterotrophic feeding.
While we observed reduced net TEP release from coral colonies with negligible water flows, using a laboratory flow chamber, Wild et al. (2012) found that particulate organic carbon released from corals increases with water flows (compared to no-flow conditions). They also reported a statistically non-significant decrease in particulate organic carbon from corals in high flows (~15 cm/s) compared to low flows (~5 cm/s). Our results showed a minor decrease of net TEP release with flow speed, but a substantially higher net TEP release at no flow (Figure 4A). One possible reason for the seemingly contradictory results is the number of corals used by Wild et al. (2012), compared to our experiment. While they used small coral fragments, we used a number of colonies (around 17) to cover the whole test section of the flume (Figure 2; Supplementary Figure S1). A recent study showed that the physiology of a larger colony cannot be estimated by linearly scaling up that of a small fragment (Edmunds et al., 2022). The biological response of a small coral fragment to water flows could be very different from that of multiple colonies placed together. The complex geometry formed by single coral colonies and the arrangement of multiple colonies induce complicated flow patterns and turbulent mixing when subjected to water flows. When multiple neighboring colonies are exposed to unidirectional flows, downstream colonies are sheltered by those upstream and the flow cannot penetrate deeply into these colonies, resulting in less efficient material exchange. On the other hand, when a single coral fragment is exposed to water flows without neighboring objects, nutrient uptake and waste removal can be accomplished by advection by water flows rather than turbulent mixing. Under no flow, material exchange is accomplished solely by molecular diffusion. The efficiency of molecular diffusion is determined by molecular diffusivity and the concentration gradient. Molecular diffusivity depends only on the solute and the medium of diffusion; hence, it remains the same for a coral fragment or for multiple colonies. However, the concentration gradient may be greater for a single coral fragment than deep inside closely packed coral colonies. In the latter case, the concentration of materials to sustain coral biological processes may deplete rapidly. In contrast, the time for a single, small, fragmented coral without neighboring colonies to deplete those materials might be much longer than inside closely packed colonies.
4.2 Bacterial growth
Bacterial growth in stagnant water was 3.6–5.1 times greater than the average bacterial growth in 5–30 cm/s flows. The net increase in TEP concentration, ΔTEP measured in the present study reflects the presence of coral communities, including contributions of corals and bacteria on the coral surface as well as in seawater used. Bacterial activity may also differ in the presence and absence of corals. By subtracting in the definition of ΔTEP in (1), we likely could not completely remove TEP changes due to bacterial activities. Promoted bacterial growth (Figure 4B) was mainly an effect of corals and coral-derived TEPs, as bacterial growth estimated with (3) removed the bacterial growth contributed by nutrients and bacteria in the filtered seawater. Bacteria both produce and degrade TEPs and could rapidly reproduce on TEPs (Passow, 2002). Taniguchi et al. (2014) reported doubled bacterial growth in seawater after injecting a very small amount of coral mucus, suggesting that even when the amount is small (~ 300 µL of mucus per liter of seawater), coral mucus has a significant impact on reef biogeochemistry. The strong correlation between bacterial growth and net TEP release that we observed in our experiment is consistent with findings of previous studies (Taniguchi et al., 2014). Detailed mechanisms underlying this correlation, however, require further investigation.
4.3 Flow characteristics and implications for corals
In typical fully developed turbulent boundary layers, the peak of Reynolds shear stress stays very close to the bottom boundary. Our results showed the peak in Reynolds shear stress shifting upward away from the tops of coral canopies as the boundary layer developed downstream (Figures 5B, D). The shift in location of the peak, corresponding to a large gradient in the mean velocity profile, could be due to accelerating flow above the corals (Hamed et al., 2017). In addition to the peak in close proximity to the tops of coral canopies, the Reynolds shear stress profile showed a second peak farther away from the bottom (Figures 5B, D). The secondary peak was also observed in other experimental and numerical studies (White and Nepf, 2007; Koken and Constantinescu, 2021), and was associated with shear-layer vortices advected from upstream. This suggests that the irregular shape of the coral colonies enhances the mass transport rate by generating multiple mixing shear layers at different vertical levels.
The shape of the Reynolds shear stress profile showed a trend as the boundary layer developed. The most downstream Reynolds shear stress profile showed a thicker region with strong shear, while the strong shear in upstream locations concentrated at the top of coral colonies (Figures 5B, D). The strong shear region extended upward into the free stream rather than downward into the coral canopy. For this reason, the benefit of the thicker strong shear region on material exchange between the interior of the canopy and the free stream flow may be limited. However, extension of the strong shear region into the free stream, which corresponds to strong turbulent mixing, may increase heterotrophic feeding of corals by bringing in particles from regions that are not in close proximity to the tops of coral canopies, thereby replenishing the depleted layer adjacent to the top of the canopy.
Shear velocity at different locations in the flume showed a coefficient of variation between 10.5–20.5%, indicating that spatial heterogeneity in geometry strongly influences turbulent mixing at each location. Although Hamed et al. (2017) suggested that turbulent mixing becomes stronger as the boundary layer develops over an artificial canopy, we did not observe an obvious trend in shear velocity as the boundary layer developed, which could occur because the complex geometry overrides that of boundary layer development.
Beside turbulent mixing driven by the turbulent boundary layer formed above coral colonies, waves generated by Kelvin-Helmholtz instability in the region immediately above coral colonies provides stronger mixing than typical turbulent boundary layers (Falter et al., 2007; Asher and Shavit, 2019). Vortices induced by Kelvin-Helmholtz instability push the shear layer deeper into the coral canopy and enhance vertical turbulent mixing. In Figures 5A and C, upstream and mid-stream mean velocity profiles showed an inflection point above the canopy, indicating that vortical motion induced by Kelvin-Helmholtz instability pushed turbulent mixing deeper into the coral canopy.
Estimated shear velocity increased linearly with flow speeds with values of 0.999 (Figure 6). Bottom drag can be expressed as (Schlichting and Gersten, 2016). Hence, the linear fit with a value near unity unity (Figure 6) suggested a constant friction coefficient, cD, in the tested range of flow speeds. In this case, the constant friction coefficient for coral canopies (A and B) can be estimated from the slope of the linear fit in Figure 6 to be 0.0098 and 0.0065, respectively. These values are slightly lower than in previous studies (Lentz et al., 2017). The reduced friction coefficient could be due to the larger submergence ratio (water depth to coral colony height ratio), which is consistent with findings of previous studies indicating that a greater submergence ratio leads to a smaller friction coefficient (Lentz et al., 2017). The Re-independent friction coefficient has also been observed for engineering flows, as in the Moody chart, that for high enough Reynolds numbers, the flow becomes fully rough and the friction coefficient depends only on the roughness height, independent of the Reynolds number. In our studies, due to the extremely rough geometries of the coral canopies, the flow was fully rough even at a mean flow speed as low as 5 cm/s, which corresponds to a bulk Reynolds number, , of 1.5 × 10⁴.
Because the size of coral reefs is finite and the magnitude and direction of oceanic currents are constantly changing, most turbulent boundary layers in reef systems may be under-developed. For this reason, information on spatial variation of turbulent characteristics as a turbulent boundary layer developing over coral reefs is important. While theories for typical fully developed turbulent boundary layer flows can still describe flow characteristics in reefs to a degree, developing turbulent boundary layers could estimate the correction that comes from underdeveloped flows.
Our results may underestimate mixing efficiency compared other studies because Acropora tends to live in shallow waters, where waves are significant. Material exchange in oscillatory flows is more efficient than in unidirectional flows, as the momentum and mass exchange can penetrate deeper into coral colonies (Falter et al., 2004; Lowe et al., 2005; Reidenbach et al., 2006). The effect of oscillatory flows with different combinations of wave period and orbital velocity still requires further investigation.
One limitation of the results stems in incubation in a closed-system. For the coral-derived TEP and bacterial growth to accumulate to a detectable level, incubation within a closed-system was chosen. However, the accumulated TEPs and bacteria could impact the water quality in the system and influence the coral colonies. Despite the potential impacts, based on our field observations in the coral reef where the corals colonies used in this experiments were collected from (unpublished data), the observed range of TEP concentration in the coral reef was twice the highest concentration observed in this study. Although the TEP concentrations increased towards the end of incubation, they remained much lower than the concentration in the corals’ natural habitat. The elevated TEP concentration in the closed recirculating system was unlikely to significantly affect the corals.
Another limitation of the results presented in this study is imposed by the low number of replicates. Our experimental design required a substantial number of coral colonies in a large flume to more nearly approximate the geometry of corals in their natural habitat. Despite the challenges of acquiring many colonies and acclimating them prior to experiments, we conducted experiments on two sets of coral colonies. With low number of replicates, our results may be biased and care needs to be taken when interpreting our findings. However, it is worth noting that both replicates showed similar trends, suggesting that our observation were likely correct.
Data availability statement
The raw data supporting the conclusions of this article will be made available by the authors, without undue reservation.
Ethics statement
The manuscript presents research on animals that do not require ethical approval for their study.
Author contributions
HW: Conceptualization, Data curation, Formal analysis, Funding acquisition, Investigation, Methodology, Software, Visualization, Writing – original draft, Writing – review & editing. YY: Conceptualization, Data curation, Funding acquisition, Investigation, Methodology, Resources, Writing – review & editing. P-SC: Investigation, Methodology, Writing – review & editing. KI: Investigation, Methodology, Writing – review & editing. SM: Conceptualization, Funding acquisition, Methodology, Resources, Supervision, Writing – review & editing.
Funding
The author(s) declare financial support was received for the research, authorship, and/or publication of this article. This study was supported by Marine Biophysics Unit (OIST) of the Okinawa Institute of Science and Technology, JSPS KAKENHI JP20K19960 and JST FOREST Program JPMJFR2070 awarded to YY and JSPS KAKENHI JP23K17033 awarded to HW. KI was supported by JSPS KAKENHI JP23KJ2133.
Acknowledgments
The authors thank Dr. Andreas Andersson and his research group for the design of this research, Dr. Amatzia Genin, Dr. Uri Sahvit and Mr. Yoshikatsu Nakano for valuable discussions, Captain Kazuya Hayashi for help with coral sample collection, Akinori Murata, Kazumi Inoha, and Tomoko Yoshino for administrative support, and Dr. Steven D. Aird for English editing. We are grateful for help and support provided by the Imaging Section and Marine Science Section at Okinawa Institute of Science and Technology Graduate University.
Conflict of interest
The authors declare that the research was conducted in the absence of any commercial or financial relationships that could be construed as a potential conflict of interest.
The author(s) declared that they were an editorial board member of Frontiers, at the time of submission. This had no impact on the peer review process and the final decision.
Publisher’s note
All claims expressed in this article are solely those of the authors and do not necessarily represent those of their affiliated organizations, or those of the publisher, the editors and the reviewers. Any product that may be evaluated in this article, or claim that may be made by its manufacturer, is not guaranteed or endorsed by the publisher.
Supplementary material
The Supplementary Material for this article can be found online at: https://www.frontiersin.org/articles/10.3389/fmars.2024.1404526/full#supplementary-material
References
Asher S., Shavit U. (2019). The effect of water depth and internal geometry on the turbulent flow inside a coral reef. J. Geophysical Research: Oceans 124, 3508–3522. doi: 10.1029/2018JC014331
Atkinson M. J., Bilger R. W. (1992). Effects of water velocity on phosphate uptake in coral reef-hat communities. Limnology Oceanography 37, 273–279. doi: 10.4319/lo.1992.37.2.0273
Bilger R. W., Atkinson M. J. (1992). Anomalous mass transfer of phosphate on coral reef flats. Limnology Oceanography 37, 261–272. doi: 10.4319/lo.1992.37.2.0261
Brown B., Bythell J. (2005). Perspectives on mucus secretion in reef corals. Mar. Ecol. Prog. Ser. 296, 291–309. doi: 10.3354/meps296291
Bythell J. C., Wild C. (2011). Biology and ecology of coral mucus release. J. Exp. Mar. Biol. Ecol. 408, 88–93. doi: 10.1016/j.jembe.2011.07.028
Chang S., Elkins C., Eaton J. K., Monismith S. (2013). Local mass transfer measurements for corals and other complex geometries using gypsum dissolution. Experiments Fluids 54, 1563. doi: 10.1007/s00348-013-1563-x
Chin D. A. (2012). Water-quality engineering in natural systems: fate and transport processes in the water environment (Hoboken, New Jersey, USA: John Wiley & Sons).
Crossland C. J. (1987). In situ release of mucus and DOC-lipid from the corals Acropora variabilis and Stylophora pistillata in different light regimes. Coral Reefs 6, 35–42. doi: 10.1007/BF00302210
Crossland C. J., Barnes D. J., Borowitzka M. A. (1980). Diurnal lipid and mucus production in the staghorn coral Acropora acuminata. Mar. Biol. 60, 81–90. doi: 10.1007/BF00389151
Davies P. S. (1984). The role of zooxanthellae in the nutritional energy requirements of Pocillopora eydouxi. Coral Reefs 2, 181–186. doi: 10.1007/BF00263571
Davis K. A., Pawlak G., Monismith S. G. (2021). Turbulence and coral reefs. Annu. Rev. Mar. Sci. 13, annurev–marine–042120–071823. doi: 10.1146/annurev-marine-042120-071823
Dennison W. C., Barnes D. J. (1988). Effect of water motion on coral photosynthesis and calcification. J. Exp. Mar. Biol. Ecol. 115, 67–77. doi: 10.1016/0022-0981(88)90190-6
Edmunds P. J., Johnson K. W., Burgess S. C. (2022). Branching coral morphology affects physiological performance in the absence of colony integration. Biol. Lett. 18, 20220414. doi: 10.1098/rsbl.2022.0414
Engel A., Passow U. (2001). Carbon and nitrogen content of transparent exopolymer particles (TEP) in relation to their Alcian Blue adsorption. Mar. Ecol. Prog. Ser. 219, 1–10. doi: 10.3354/meps219001
Falter J. L., Atkinson M. J., Lowe R. J., Monismith S. G., Koseff J. R. (2007). Effects of nonlocal turbulence on the mass transfer of dissolved species to reef corals. Limnology Oceanography 52, 274–285. doi: 10.4319/lo.2007.52.1.0274
Falter J. L., Atkinson M. J., Merrifield M. A. (2004). Mass-transfer limitation of nutrient uptake by a wave-dominated reef flat community. Limnology Oceanography 49, 1820–1831. doi: 10.4319/lo.2004.49.5.1820
Ferrier-Pages C., Witting J., Tambutte E., Sebens K. P. (2003). Effect of natural zooplankton feeding on the tissue and skeletal growth of the scleractinian coral Stylophora pistillata. Coral Reefs 22, 229–240. doi: 10.1007/s00338-003-0312-7
Finelli C. M., Helmuth B. S. T., Pentcheff N. D., Wethey D. S. (2006). Water flow influences oxygen transport and photosynthetic efficiency in corals. Coral Reefs 25, 47–57. doi: 10.1007/s00338-005-0055-8
Finelli C., Helmuth B., Pentcheff N., Wethey D. (2007). Intracolony variability in photosynthesis by corals is affected by water flow: Role of oxygen flux. Mar. Ecol. Prog. Ser. 349, 103–110. doi: 10.3354/meps07101
Ghisalberti M., Nepf H. (2005). Mass transport in vegetated shear flows. Environ. Fluid Mechanics 5, 527–551. doi: 10.1007/s10652-005-0419-1
Guizien K., Ghisalberti M. (2016). “Living in the canopy of the animal forest: Physical and biogeochemical aspects,” in Marine Animal Forests. Eds. Rossi S., Bramanti L., Gori A., Orejas Saco del Valle C. (Springer International Publishing, Cham), 1–22. doi: 10.1007/978–3-319–17001-514–1
Hamed A. M., Sadowski M. J., Nepf H. M., Chamorro L. P. (2017). Impact of height heterogeneity on canopy turbulence. J. Fluid Mechanics 813, 1176–1196. doi: 10.1017/jfm.2017.22
Hearn C., Atkinson M., Falter J. (2001). A physical derivation of nutrient-uptake rates in coral reefs: Effects of roughness and waves. Coral Reefs 20, 347–356. doi: 10.1007/s00338-001-0185-6
Houlbreque F., Ferrier-Pages C. (2009). Heterotrophy in tropical scleractinian corals. Biol. Rev. 84, 1–17. doi: 10.1111/j.1469-185X.2008.00058.x
Huettel M., Wild C., Gonelli S. (2006). Mucus trap in coral reefs: Formation and temporal evolution of particle aggregates caused by coral mucus. Mar. Ecol. Prog. Ser. 307, 69–84. doi: 10.3354/meps307069
Hughes A. D., Grottoli A. G. (2013). Heterotrophic compensation: A possible mechanism for resilience of coral reefs to global warming or a sign of prolonged stress? PloS One 8, e81172. doi: 10.1371/journal.pone.0081172
Koken M., Constantinescu G. (2021). Flow structure inside and around a rectangular array of rigid emerged cylinders located at the sidewall of an open channel. J. Fluid Mechanics 910. doi: 10.1017/jfm.2020.900
Lentz S. J., Davis K. A., Churchill J. H., DeCarlo T. M. (2017). Coral reef drag coefficients – water depth dependence. J. Phys. Oceanography 47, 1061–1075. doi: 10.1175/JPO-D-16-0248.1
Lowe R. J., Koseff J. R., Monismith S. G. (2005). Oscillatory flow through submerged canopies: 2. Canopy mass transfer. J. Geophysical Res. 110, C10017. doi: 10.1029/2004JC002789
Lowe R. J., Shavit U., Falter J. L., Koseff J. R., Monismith S. G. (2008). Modeling flow in coral communities with and without waves: A synthesis of porous media and canopy flow approaches. Limnology Oceanography 53, 2668–2680. doi: 10.4319/lo.2008.53.6.2668
Loya Y., Sakai K., Heyward A. (2009). Reproductive patterns of fungiid corals in Okinawa, Japan. Galaxea J. Coral Reef Stud. 11, 119–129. doi: 10.3755/galaxea.11.119
Mari X., Passow U., Migon C., Burd A. B., Legendre L. (2017). Transparent exopolymer particles: Effects on carbon cycling in the ocean. Prog. Oceanography 151, 13–37. doi: 10.1016/j.pocean.2016.11.002
Mashini A. G., Parsa S., Mostafavi P. G. (2015). Comparison of Symbiodinium populations in corals from subtidal region and tidal pools of northern coasts of Hengam Island, Iran. J. Exp. Mar. Biol. Ecol. 473, 202–206. doi: 10.1016/j.jembe.2015.09.007
Nakajima R., Tanaka Y. (2014). The role of coral mucus in the material cycle in reef ecosystems: biogeochemical and ecological perspectives. J. Japanese Coral Reef Soc. 16, 3–27. doi: 10.3755/jcrs.16.3
Nakajima R., Yoshida T., Azman B. A. R., Zaleha K., Othman B. H. R., Toda T. (2009). In situ release of coral mucus by Acropora and its influence on the heterotrophic bacteria. Aquat. Ecol. 43, 815–823. doi: 10.1007/s10452-008-9210-y
Nakamura T. (2010). Importance of water-flow on the physiological responses of reef-building corals. Galaxea J. Coral Reef Stud. 12, 1–14. doi: 10.3755/galaxea.12.1
Nakamura T., van Woesik R. (2001). Water-flow rates and passive diffusion partially explain differential survival of corals during the 1998 bleaching event. Mar. Ecol. Prog. Ser. 212, 301–304. doi: 10.3354/meps212301
Nakamura T., Yamasaki H. (2005). Requirement of water-flow for sustainable growth of Pocilloporid corals during high temperature periods. Mar. pollut. Bull. 50, 1115–1120. doi: 10.1016/j.marpolbul.2005.06.025
Naumann M. S., Haas A., Struck U., Mayr C., el-Zibdah M., Wild C. (2010). Organic matter release by dominant hermatypic corals of the Northern Red Sea. Coral Reefs 29, 649–659. doi: 10.1007/s00338-010-0612-7
Niggl W., Glas M., Laforsch C., Mayr C., Wild C. (2008). “First evidence of coral bleaching stimulating organic matter release by reef corals,” in Proceeding of the 11th International Coral Reef Symposium Ft, Lauderdale, FL, 905–910.
Passow U. (2002). Transparent exopolymer particles (TEP) in aquatic environments. Prog. Oceanography 55, 287–333. doi: 10.1016/S0079-6611(02)00138-6
Passow U., Alldredge A. L. (1995). A dye-binding assay for the spectrophotometric measurement of transparent exopolymer particles (TEP). . Limnology Oceanography 40, 1326–1335. doi: 10.4319/lo.1995.40.7.1326
Passow U., Carlson C. (2012). The biological pump in a high CO2 world. Mar. Ecol. Prog. Ser. 470, 249–271. doi: 10.3354/meps09985
Porter K. G., Feig Y. S. (1980). The use of DAPI for identifying and counting aquatic microflora. Limnology oceanography 25, 943–948. doi: 10.4319/lo.1980.25.5.0943
Reidenbach M. A., Koseff J. R., Monismith S. G., Steinbuckc J. V., Genin A. (2006). The effects of waves and morphology on mass transfer within branched reef corals. Limnology Oceanography 51, 1134–1141. doi: 10.4319/lo.2006.51.2.1134
Rintoul M., Courtney T., Dohner J., Giddings S., Kekuewa S., Mitarai S., et al. (2022). The effects of light intensity and flow speed on biogeochemical variability within a fringing coral reef in onna-son, okinawa, Japan. J. Geophysical Research: Oceans 127, e2021JC018369. doi: 10.1029/2021JC018369
Schlichting H., Gersten K. (2016). Boundary-layer theory (Heidelberg, Germany: springer). doi: 10.1007/978-3-662-52919-5
Sugimoto K., Fukuda H., Baki M., Koike I. (2007). Bacterial contributions to formation of transparent exopolymer particles (TEP) and seasonal trends in coastal waters of Sagami Bay, Japan. Aquat. Microbial Ecol. 46, 31–41. doi: 10.3354/ame046031
Tanaka Y., Miyajima T., Koike I., Hayashibara T., Ogawa H. (2008). Production of dissolved and particulate organic matter by the reef-building corals Porites cylindrica and Acropora pulchra. Bull. Mar. Sci. 82, 9.
Taniguchi A., Yoshida T., Eguchi M. (2014). Bacterial production is enhanced by coral mucus in reef systems. J. Exp. Mar. Biol. Ecol. 461, 331–336. doi: 10.1016/j.jembe.2014.09.004
Thielicke W. (2014). The Flapping Flight of Birds - Analysis and Application. Phd thesis, Rijksuniversiteit Groningen. Available at: http://irs.ub.rug.nl/ppn/382783069
Thielicke W., Sonntag R. (2021). Particle image velocimetry for MATLAB: Accuracy and enhanced algorithms in PIVlab. J. Open Res. Software 9, 12. doi: 10.5334/jors.334
Thielicke W., Stamhuis E. (2014). PIVlab–towards user-friendly, affordable and accurate digital particle image velocimetry in MATLAB. J. Open Res. software 2, e30. doi: 10.5334/jors.bl
Vacelet E., Thomassin B. A. (1991). Microbial utilization of coral mucus in long term in situ incubation over a coral reef. Hydrobiologia 211, 19–32. doi: 10.1007/BF00008613
Veron J., Stafford-Smith M., Turak E., DeVantie L. (2000). Corals of the world. Aust. Institute Mar. Science Townsvill. (Townsville, Australia: Australian Institue of Marine Science)
White B. L., Nepf H. M. (2007). Shear instability and coherent structures in shallow flow adjacent to a porous layer. J. Fluid Mechanics 593, 1–32. doi: 10.1017/S0022112007008415
Wild C., Laforsch C., Mayr C., Fuß R., Niggl W. (2012). Effect of water currents on organic matter release by two scleractinian corals. Aquat. Ecol. 46, 335–341. doi: 10.1007/s10452-012-9404-1
Wild C., Rasheed M., Werner U., Franke U., Johnstone R., Huettel M. (2004). Degradation and mineralization of coral mucus in reef environments. Mar. Ecol. Prog. Ser. 267, 159–171. doi: 10.3354/meps267159
Keywords: flow, transparent exopolymer particle (TEP), particle image velocimetry (PIV), Acropora, coral mucus
Citation: Wu H, Yamada Y, Chuang P-S, Ishikawa K and Mitarai S (2024) Effects of flows on transparent exopolymer particles released from branching Acropora coral colonies. Front. Mar. Sci. 11:1404526. doi: 10.3389/fmars.2024.1404526
Received: 21 March 2024; Accepted: 03 June 2024;
Published: 24 June 2024.
Edited by:
Wei Jiang, Guangxi University, ChinaReviewed by:
Shai Asher, Technion Israel Institute of Technology, IsraelJie Li, Chinese Academy of Sciences (CAS), China
Copyright © 2024 Wu, Yamada, Chuang, Ishikawa and Mitarai. This is an open-access article distributed under the terms of the Creative Commons Attribution License (CC BY). The use, distribution or reproduction in other forums is permitted, provided the original author(s) and the copyright owner(s) are credited and that the original publication in this journal is cited, in accordance with accepted academic practice. No use, distribution or reproduction is permitted which does not comply with these terms.
*Correspondence: Heng Wu, aGVuZ3d1MkBpbGxpbm9pcy5lZHU=
†Present address: Yosuke Yamada, Geomaterials Science Research Group, Kochi Institute for Core Sample Research, Japan Agency for Marine-Earth Science and Technology, Kochi, Japan
Po-Shun Chuang, Biodiversity Research Center, Academia Sinica, Taipei, Taiwan