 Chunlin Li
 Yang Liu
 Zixu Yin
 Zhangqi Si
 Qi Li
Qi Li Sei-Ichi Saitoh
94% of researchers rate our articles as excellent or good
Learn more about the work of our research integrity team to safeguard the quality of each article we publish.
Find out more
ORIGINAL RESEARCH article
Front. Mar. Sci., 07 June 2024
Sec. Marine Fisheries, Aquaculture and Living Resources
Volume 11 - 2024 | https://doi.org/10.3389/fmars.2024.1402528
This article is part of the Research TopicBlue Foods Security and SustainabilityView all 15 articles
The Pacific oyster (Crassostrea gigas) is a marine aquaculture species with rapid production growth in recent years. China accounts for nearly 90% of global production by 2021, especially in Shandong province. Evaluating suitability is crucial for ensuring the sustainable growth of Pacific oyster marine aquaculture and achieving a blue transition. This study developed a suitability evaluation model for Pacific oyster marine aquaculture using a Geographic Information System (GIS), Maximum Entropy (MaxEnt) model, remote sensing, and reanalysis data. A literature review and Analytic Hierarchy Process (AHP) were used to establish an evaluation model encompassing water quality, hydrology, climate and meteorology, and socioeconomic factors. The results showed that within a 20 km range of the Shandong coast, 49% of the area was highly suitable, 51% was moderately suitable, and the overall annual high score proportion (HSP) fluctuated around 50%, with higher suitability observed in the spring and autumn. The inner bays of the coastal areas (Laizhou, Rongcheng, Jimo) exhibited high suitability (HSP over 80%); in contrast, the offshore areas (Changdao, Rushan) farther from the coast had lower suitability and showed significant monthly variations. The result was consistent with the spatial distribution and temporal variation of Shandong’s existing Pacific oyster marine aquaculture areas. The study also found that El Niño significantly impacts Rongcheng, Rushan, and Jimo during summer. We predicted an overall increase of suitability in the Shandong offshore areas under future climate change scenarios, with a more significant increase of suitability in the north. El Niño-Southern Oscillation (ENSO) influenced the concentration of parameters such as chlorophyll-a (Chl-a) and total suspended sediment (TSS) in the coastal waters through its impact on precipitation (Pr), resulting in suitability fluctuations.
The Pacific oyster (Crassostrea gigas) (Thunberg, 1793) in GBIF Secretariat (2023) has been extensively introduced and expanded for marine aquaculture worldwide due to its high commercial value (Barillé et al., 2020). Since the 1990s, it’s production in China has steadily increased, accounting for nearly 90% of the global production by 2021, and reaching 5.8377 million tonnes (FAO, 2022), significantly higher than in other countries. Shandong province is China’s leading producer of Pacific oysters, accounting for 75.20% of the national production in 2018. The primary marine aquaculture method is raft aquaculture (Yu et al., 2008; China Fishery Statistical Yearbook, 2023), characterized by continuous immersion in seawater, rapid growth, high yield, low cost, easy management, and not being restricted by seabed sediment, allowing for mobility, so it is widely applied (Zou et al., 2021).
The continuous increases in Pacific oyster marine aquaculture production have created economic and social benefits but have also caused severe environmental impacts. High-density and repetitive marine aquaculture reduce water exchange capabilities (Wang et al., 2018; Huang et al., 2023), leading to biological sedimentation and nutrient enrichment (Forrest et al., 2009), and reducing ecological carrying capacity (Gao et al., 2020; Brito et al., 2023). This, in turn decreases the sustainability and per-area yield. On the other hand, the growing marine aquaculture industry needs to develop new areas with the potential, which have suitable environmental and socioeconomic conditions. This is essential to ensure the growth potential of Pacific oyster and avoid conflicts with other planned uses and economic benefits (Barillé et al., 2020). Therefore, suitability evaluation is essential for assessing existing marine aquaculture areas and identifying potential areas for sustainable expansion of Pacific oyster marine aquaculture.
Satellite remote sensing provides unrestricted, long-time series data with a high spatial and temporal resolution, capturing continuous changes in marine environments, and was introduced into marine aquaculture research as early as 1987 (Liu, 2021). Numerical models and data assimilation provide reanalysis and forecast data for historical and future periods. Suitability evaluation models based on Geographic Information Systems (GIS) and the Analytic Hierarchy Process (AHP) are practical tools for evaluating suitable areas. After the 1990s, the application of remote sensing and GIS in marine aquaculture site selection and evaluation gradually increased (Bacher et al., 2003; Radiarta et al., 2008, Radiarta et al, 2011; Saitoh et al., 2011; Cho et al., 2012; Liu et al., 2013, Liu et al, 2014; Aura et al., 2016; Snyder et al., 2017; Liu et al., 2020a). The Maximum Entropy (MaxEnt) model is a species distribution model (SDM) based on the principle of maximum entropy, first proposed in 2006 (Phillips et al., 2006; Yang et al., 2023), predicting potential habitable zones for species based on known distribution data and related environmental factors (Wang et al., 2023; Zhang et al., 2023; Wang et al., 2024). Additionally, MaxEnt can incorporate future climate prediction data, such as bioclimatic factors, making it an effective tool for assessing future suitability changes under climate change impacts (Liu et al., 2024a, Liu et al., 2024b).
Marine aquaculture suitability is influenced by climate change, such as single bivalve marine aquaculture systems in shallow coastal waters, being particularly vulnerable to gradual climate changes like El Niño-Southern Oscillation (ENSO). Climate change could cause environmental and meteorological shifts, which may reduce or increase marine aquaculture areas’ in different regions. Choosing areas less affected by climate change is more beneficial for the long-term development of marine aquaculture than vulnerable areas (Saitoh et al., 2011; Liu et al., 2013, Liu et al, 2014; Liu et al., 2020a). Moreover, the intensity and frequency of regional extreme events such as Marine Heatwaves (MHWs), extreme precipitation and droughts, storms, and storm surges have increased, result in more significant impacts (Beniston et al., 2007). Future climate change will also affect marine aquaculture in estuaries (Brito et al., 2023). For example, mass mortality events of Pacific oyster worldwide during summer may be caused by MHWs that promote the proliferation, growth, and pathogenicity of pathogens (Yang et al., 2021), weakening the immune response of Pacific oyster (Green et al., 2019). Global warming is expected to lead to more intense and frequent occurrences of MHWs (Frölicher et al., 2018). Therefore, considering climate factors affecting Pacific oyster marine aquaculture, accurately assessing climate change impacts, adapting to climate change through appropriate management, and setting climate factor indicators tailored to local conditions are increasingly emphasized (FAO, 2022).
This study aims to (1) construct a suitability evaluation model for Pacific oyster marine aquaculture in offshore areas of Shandong, summarizing the spatial and temporal characteristics of suitability; (2) explore the impact of climate events such as ENSO and future climate change on suitability, and investigate the mechanisms of climate change impact; (3) provide management recommendations for Pacific oyster marine aquaculture.
Shandong is bordered by the Bohai Sea and the Yellow Sea (Figure 1). It boasts a coastline spanning 3,345 km and shallow sea areas within a depth of 20 m, covering 29,731 km2. This area accounts for 37% of the total area of the Bohai Sea and the Yellow Sea (Peoples Government of Shandong Province, 2023), making it highly suitable for marine aquaculture and has the most production of Pacific oysters in the world. The rivers in Shandong particularly the Yellow River, transport significant amounts of freshwater and sediment to the Bohai Sea, affecting the salinity, nutrient, and sediment concentration near the estuary (Zheng et al., 2021).
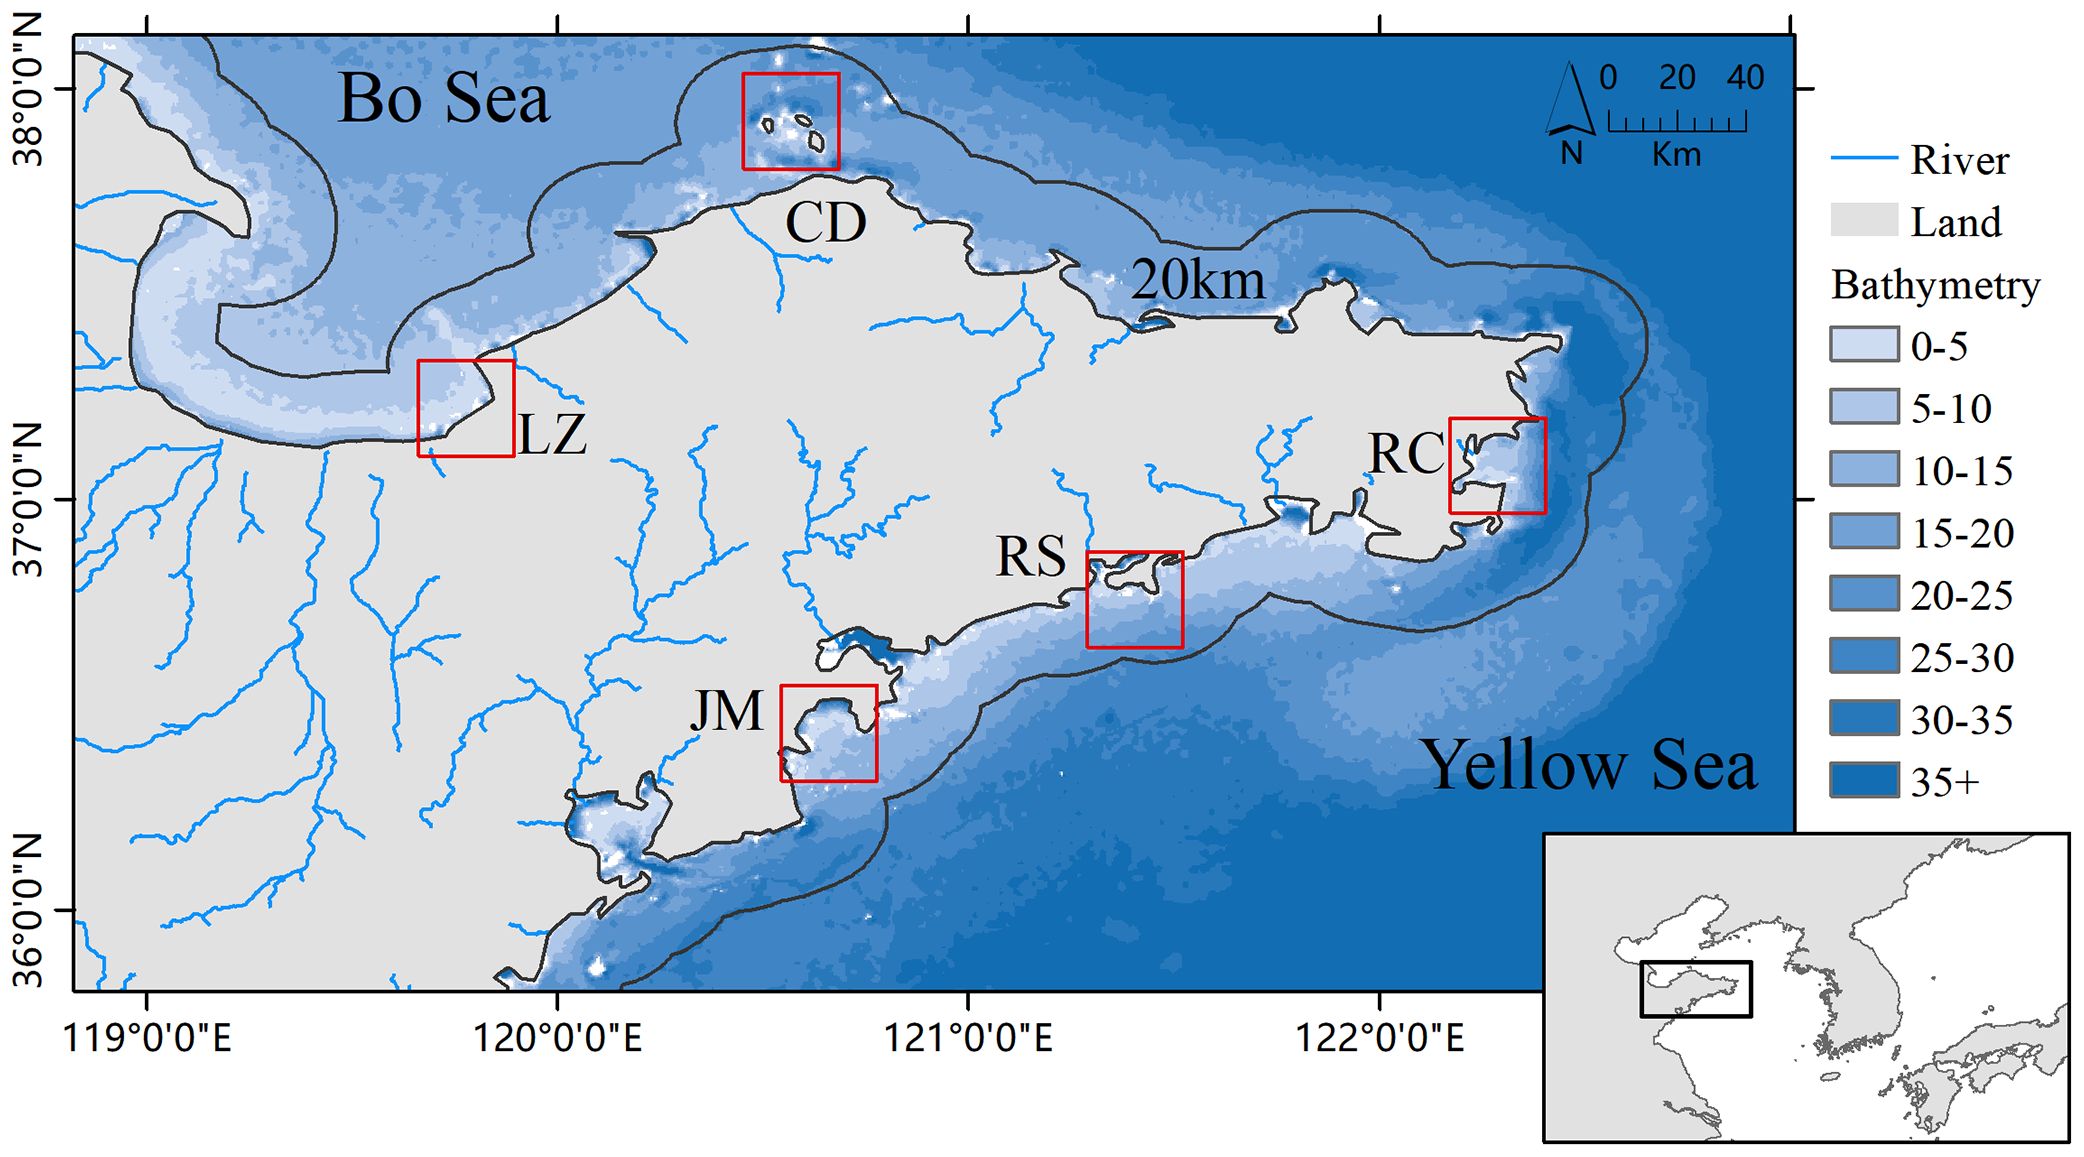
Figure 1 Study area. The 20 km line indicates the study area within 20 km of the Shandong coast as shown; Red box represents the existing main marine aquaculture areas for Pacific oyster, including Laizhou (LZ), Changdao (CD), Rongcheng Sanggou Bay (RC), Rushan (RS), and Jimo Aoshan bay (JM). The classify of blue color as in the legend indicates depth.
The offshore areas of Shandong are primarily influenced by the north Shandong coastal current, which originated from the Bohai Sea and flows eastward to the Yellow Sea eastward. This current runs parallel to the northern coastline of the Shandong peninsula, turning southward along the eastern coast before eventually moving southwestward along the southern coast of the Shandong peninsula. The north Shandong coastal current correlates well with wind speed (Zheng et al., 2021), becoming more pronounced in winter when northerly winds prevail (Zhang et al., 2018), causing sea level rise in LZ Bay (Li et al., 2015), and transporting large amounts of freshwater and sediment from the Yellow River eastward along the northern coast (Yang et al., 2011; Wang et al., 2020), resulting in low salinity and high turbidity in the coastal waters along the north coast of the Shandong Peninsula (Yang et al., 2011).
The climate of Shandong is controlled by the East Asian monsoon (Song et al., 2021). Winter winds are predominantly blow from the north while summer winds are predominantly southerly. This monsoonal climate is characterized by distinct seasons, higher summer temperatures with concentrated precipitation (60%–70%), with the temperature gradients increasing from the southeast coast to the northwest inland and precipitation patterns showing the opposite trend (Peoples Government of Shandong Province, 2023).
The environment, climate, meteorology, and socioeconomic data utilized in this study, along with their sources and resolutions, are listed in Table 1. To assess the spatiotemporal distribution of suitable areas for Pacific oyster marine aquaculture along the Shandong offshore, we acquired and processed monthly average data of factors from May 2011 to December 2022 and correlated these with climate events. The climate data used for future climate impact analysis, including its source, model, scenarios, time series, and resolution, are detailed in Table 1. Among them, 12 factors, including Chl-a, TSS, SST, DO, pH, SO, WW, Res, VO, WS, Tas, and Pr, have time series data from May 2011 to December 2022. Bathymetry, bioclimatic, distance to city, pier, and WWTPs lack time series data. Mean data will be used for both time series and climate scenarios.
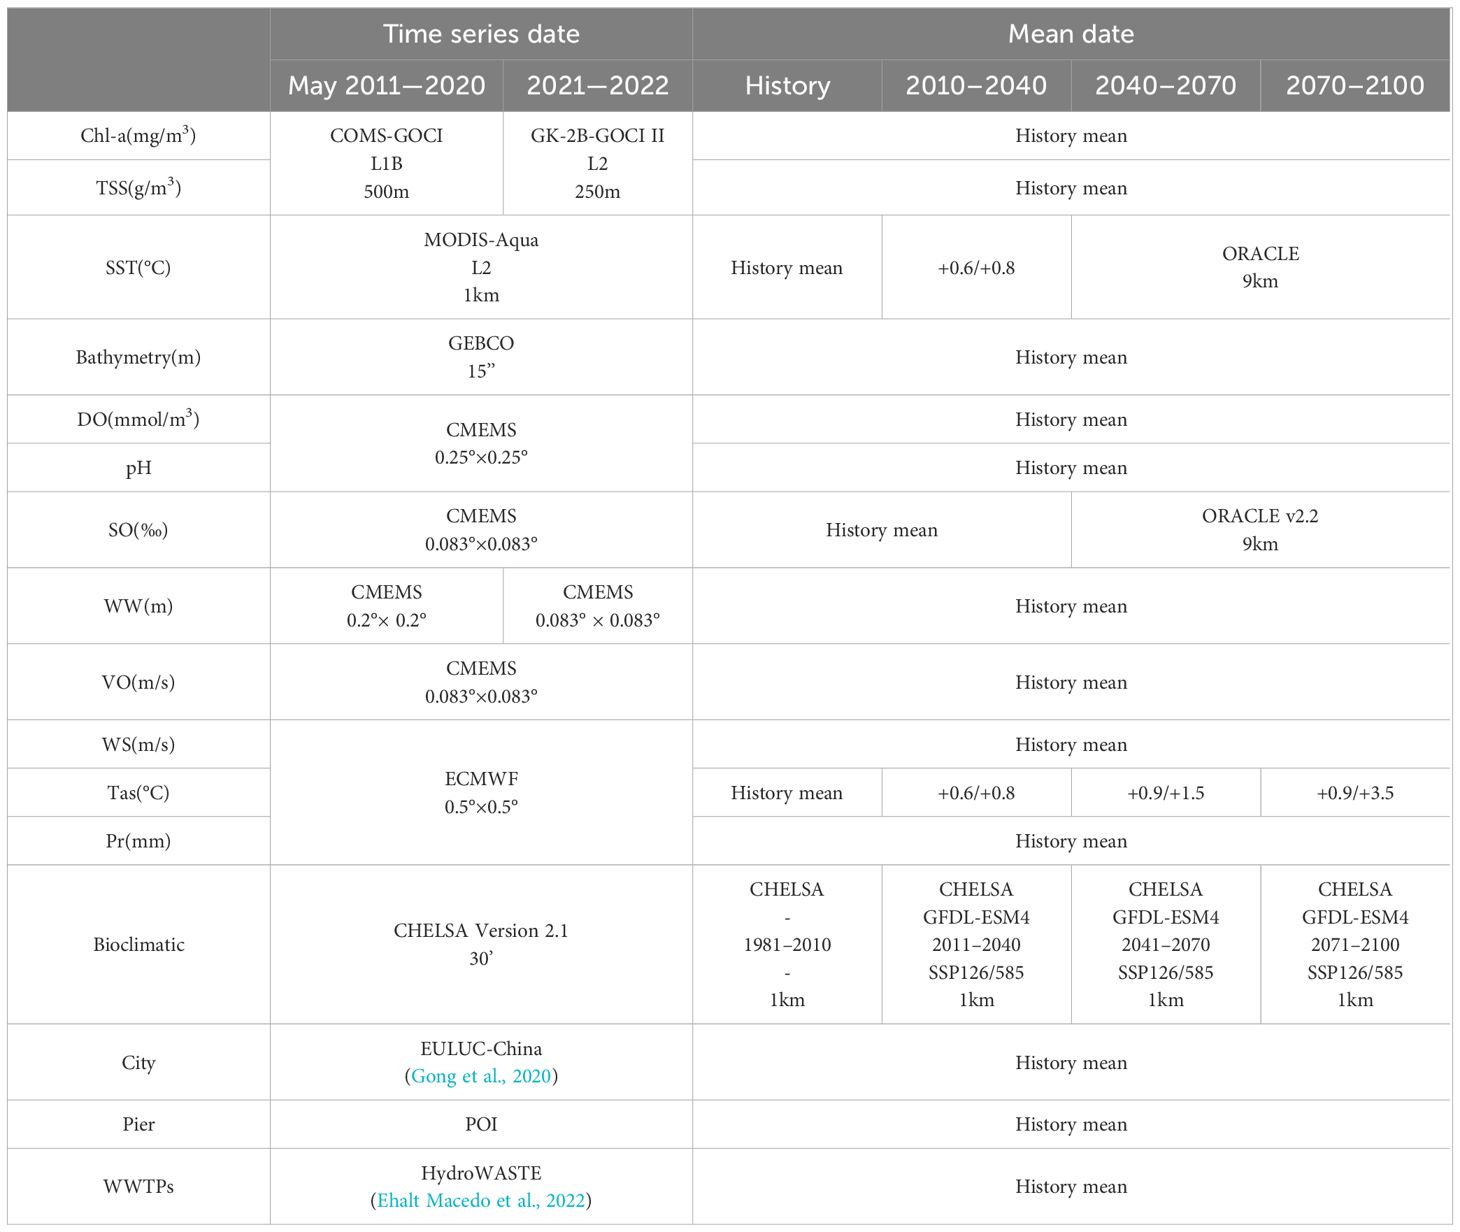
Table 1 Source and resolution of the data.
The water quality factors considered in this study included chlorophyll-a (Chl-a), total suspended sediment (TSS), sea surface temperature (SST), dissolved oxygen concentration in seawater (DO), seawater pH reported on the total scale (pH), seawater salinity (SO). Chl-a and TSS data were obtained from the Geostationary Ocean Color Imager (GOCI) onboard the Korean geostationary orbit satellite. Their data were downloaded from the Korea Ocean Satellite Center (http://kosc.kiost.ac.kr/index.nm) with a resolution of 500 m for Level 1 data. The GOCI Data Processing System 2.0 (GDPS 2.0) software’s Batch Process tool was used to calculate Chl-a and TSS bands. ENVI 5.3 software was used for geometric correction based on the official GLT files. After GOCI concluded its observation mission in March 2021, Chl-a and TSS data from April 2021 to December 2022 were obtained from the second Korean geostationary orbit satellite (GOCI-II). This study used Level 2 data with an initial resolution of 250 m. Monthly average data were computed using SeaDAS 8.0 software by selecting cloud-free data each month. SST data were sourced from the Moderate Resolution Imaging Spectroradiometer (MODIS) aboard NASA’s AQUA sun-synchronous polar-orbiting satellite. Data were obtained from the Ocean Color website (https://oceancolor.gsfc.nasa.gov/) with a resolution of 1 km for Level 2 data. Daily data were filtered to minimize cloud cover impact, atmospheric data was corrected using the OCSSW tool in SeaDAS 8.0, and monthly averages were calculated using ArcGIS 10.7 with interpolation and other processing performed in SeaDAS. SO, DO, and pH were obtained from the E.U. Copernicus Marine Service Information (CMEMS) Marine Data Store (MDS).
Hydrological factors include bathymetry, water velocity (VO), and sea surface wind wave significant height (WW). Bathymetry data were sourced from the General Bathymetric Chart of the Oceans (GEBCO, https://www.gebco.net/), offering a global resolution of approximately 15 arc seconds (500m). VO and WW were obtained from the CMEMS MDS. VO was calculated from the square root of the sum of the squares of the eastward and northward sea water velocities.
Meteorological data include wind speed at 10 m above the surface (WS), total precipitation (Pr), and 2-meter dewpoint temperature (Tas). They were sourced from the European Centre for Medium-Range Weather Forecasts’ ERA5 reanalysis monthly average data, these data were interpolated for missing values using MATLAB.
Climate data, the climate scenario data in 2010–2040 for SST and Tas are based on the projected temperature increases associated with the SSP1–2.6 and SSP5–8.5 mentioned in the sixth assessment reports of the Intergovernmental Panel on Climate Change (IPCC). The climate scenario data in 2040–2070, 2070–2100 for SST, Tas, and the future predictions for VO are sourced from the Biogeographic Oceanic and Regional Seas Environmental Predictive Model (Bio-ORACLE). Nineteen bioclimatic parameters (Karger et al., 2017) were derived from Climatologies at High resolution for the Earth’s Land Surface Areas (CHELSA), which offers high-resolution data (30 arc seconds, ~1 kilometer). We selected the GFDL-ESM4 model, the SSP1–2.6 and SSP5–8.5 scenarios in four periods: 1981–2010, 2011–2040, 2041–2070, and 2071–2100, these two scenarios can produce a more pronounced contrast to the suitability. The Oceanic Niño Index (ONI) and the Multivariate ENSO Index (MEI) (Wolter & Timlin, 2011) were used for climate events. ONI is available from NOAA’s Climate Prediction Center (https://origin.cpc.ncep.noaa.gov/products/analysis_monitoring/ensostuff/ONI_v5.php). The MEI can be obtained from NOAA’s Physical Sciences Laboratory (https://psl.noaa.gov/enso/mei/ ).
Socioeconomic data included the location of cities, piers, and wastewater treatment plants (WWTPs). Cities data were taken from global multi-temporal urban boundary data (Gong et al., 2020), which includes all global cities and surrounding settlements over 1 square kilometer, effectively capturing the contours of urban-rural edge areas. Pier data were extracted from coastal Points of Interest (POI) available in relevant map services. WWTP data came from the global database of HydroWASTE (Ehalt Macedo et al., 2022). Socioeconomic data on suitability distribution were obtained using the Euclidean Distance tool in ArcGIS 10.7.
All data were resampled to 500 m resolution using ArcGIS 10.7. Due to varying data sources, to ensure temporal continuity, 1000 random samples were generated within a 20 km range of the Shandong offshore using the ArcGIS10.7 Create Random Points tool to ensure temporal continuity. The relationship between datasets was quantified through linear fitting to ensure usability (Park et al., 2021) and consistency. Environmental (except Bathymetry) and meteorological data from May 2010 to December 2020 were statistically analyzed for the five Pacific oyster marine aquaculture areas and all offshore areas within 20 km of Shandong Peninsula to understand further the spatiotemporal variation characteristics of environmental and meteorological factors in Shandong.
Figure 2 illustrates the schematic diagram of the suitability evaluation model for Pacific oyster marine aquaculture, which primarily includes four categories of factors: water quality (Chl-a, SST, TSS, SO, pH, DO), hydrology (Bathymetry, VO, WW), climate and meteorology (WS, Tas, Pr, Bioclimatic), and socioeconomic factors (distance to city, pier, WWTPs). Each factor was assigned a score ranging from 1 to 8, with 1 representing the least suitable and 8 representing the most appropriate. The model employed the Analytic Hierarchy Process (AHP), a multi-criteria decision-making method proposed by American operations researcher Saaty in the early 1970s (Saaty, 1977), to determine the weights of each factor and each sub-model. The model utilizes ArcGIS 10.7 for Reclassify, Spatial Analyst, and Model Builder to enable batch processing of time series data, generating spatial distribution maps of suitability for Pacific oyster marine aquaculture. The ArcGIS raster calculator also calculated quarterly averages for all data from May 2011 to December 2022. A comparison was made between the highly suitable areas and the marine aquaculture areas identified through high-resolution satellite imagery (Wang et al., 2018; Liu et al., 2020b) to validate the accuracy of the model.
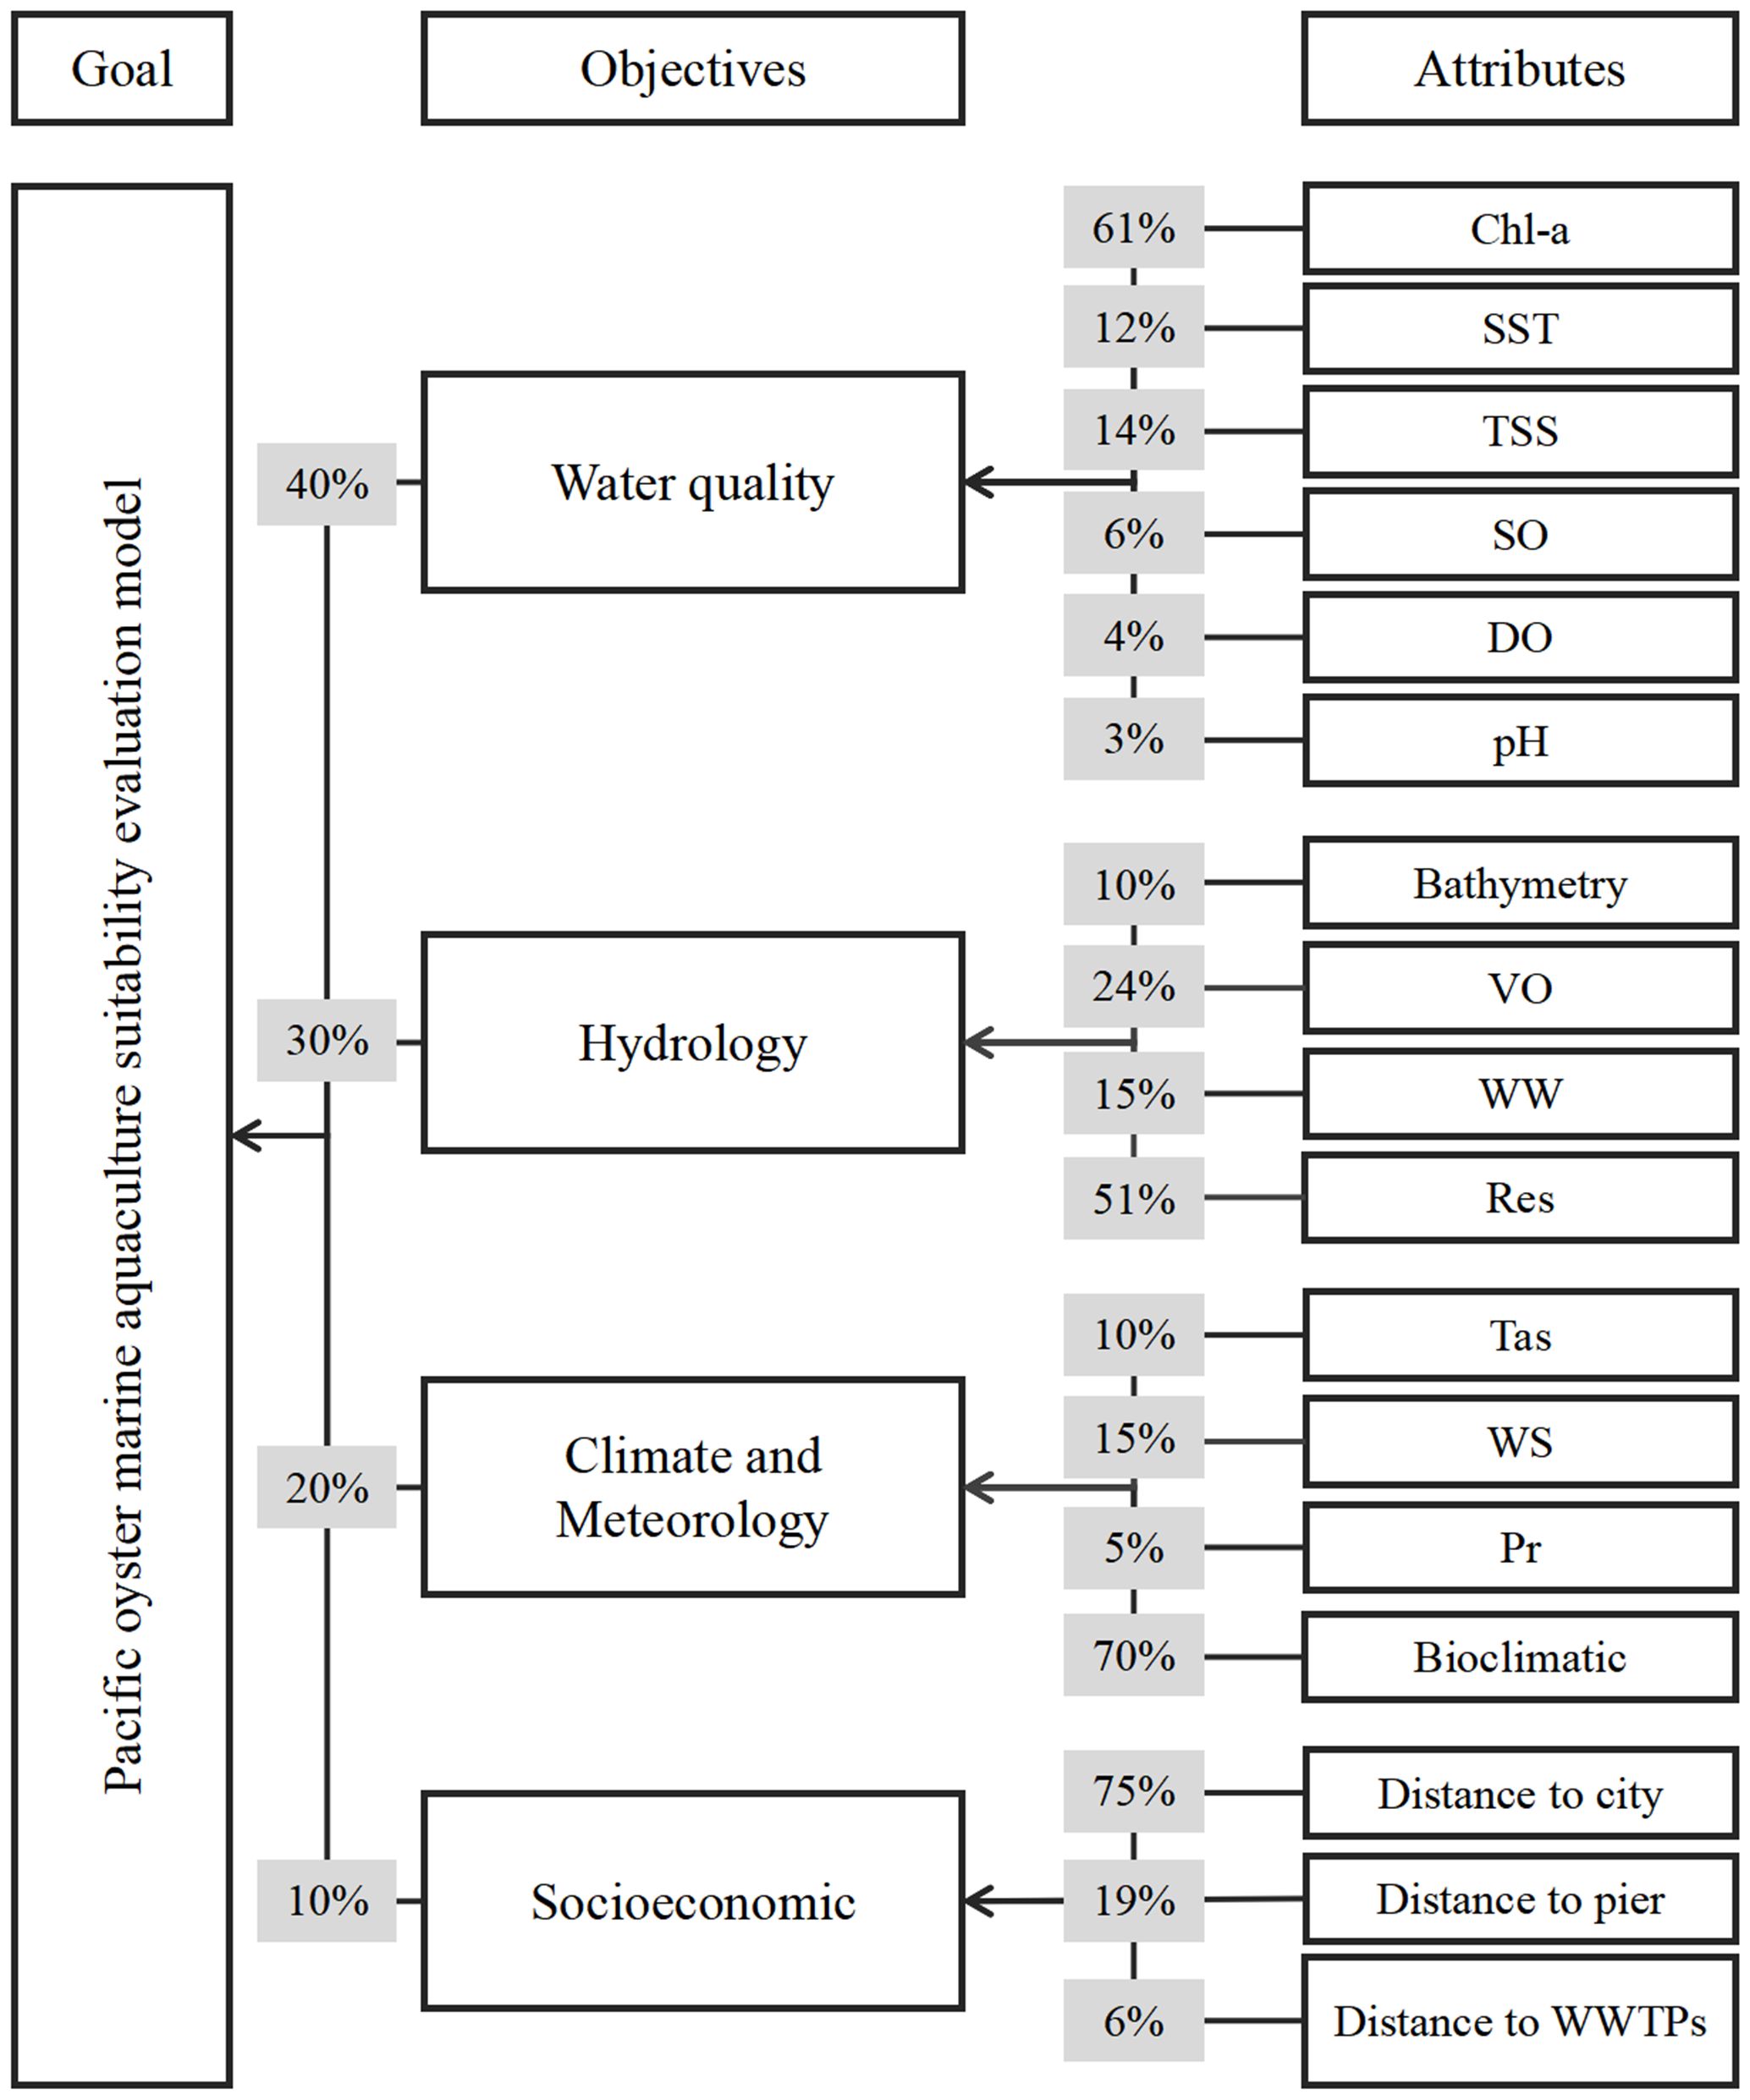
Figure 2 Suitability evaluation model of Pacific oyster marine aquaculture.
This study analyzed the impact of climate change on Pacific oyster marine aquaculture suitability from two aspects: the effects of climate events and the future climate change on suitability. Firstly, when investigating the influence of climate events such as El Niño on the suitability of Pacific oyster marine aquaculture, we compared the suitability of average years with El Niño (2015) and La Niña (2022) and utilized time series data from May 2011 to December 2022. We conducted Pearson correlation analysis and box plot analysis between time series data and the High Suitability Percentage (HSP), ONI, and MEI indices, with significance testing based on a significance level of 0.01 and 0.05 for t-tests. The causes of temporal and spatial variations in suitability were analyzed by combining existing research with correlation analysis results.
Mean data were used to investigate the impact of future climate change on suitability. Except for the predicted values and databases (SST, SO, Tas, Bioclimatic) shown in Table 1, all other data were based on the mean values from May 2011 to December 2022, including mean data, Bathymetry, Bioclimatic, distance to city, pier, WWTPs, as history and future periods date. Bioclimatic factors data were used with the MaxEnt model to predict suitable historical and future suitable zones. Pacific oyster distribution data were sourced from the Global Biodiversity Information Facility (GBIF) (GBIF, 2023). Due to insufficient data in the offshore area of Shandong, distribution data from the northwest Pacific region (117°E-146°E, 30°N-45°N) were used for suitable zone prediction, supplemented with in-situ oyster reef distribution area and wild Pacific oyster population sampling point data (Supplementary Table 1) from literature (Gu et al., 2005; Fang et al., 2007; Quan et al., 2012; Wang et al., 2014; Ran et al., 2018; Zhong et al., 2019; Li et al., 2020; Song et al., 2021; Zhang et al., 2021; Quan et al., 2022; Hong et al., 2023). ENMTools software was used to calculate spatial autocorrelation and exclude highly correlated (>0.8) features with a lower contribution, combining historical data for the MaxEnt model suitable zone prediction. The accuracy of the MaxEnt model was evaluated using the Area Under Curve (AUC) under the Receiver Operating Characteristic (ROC) Curve. The species’ habitable probability obtained was graded to determine suitability distribution.
Figure 3A illustrated the changes in the monthly average and Figure 3B illustrated the quarterly spatial distribution of time series factors across different regions from May 2011 to December 2022. Chl-a and TSS exhibited similar spatial distribution patterns, with concentration gradually decreasing from the coast toward the open sea. In winter, the concentration of Chl-a was highest, while the lowest concentration was observed in summer. LZ had the highest Chl-a concentration, and CD had the lowest, yet all areas have Chl-a concentration above the 20 km average. In contrast, all areas had lower TSS concentrations than the 20 km average, except for JM, which had higher TSS concentrations in summer.
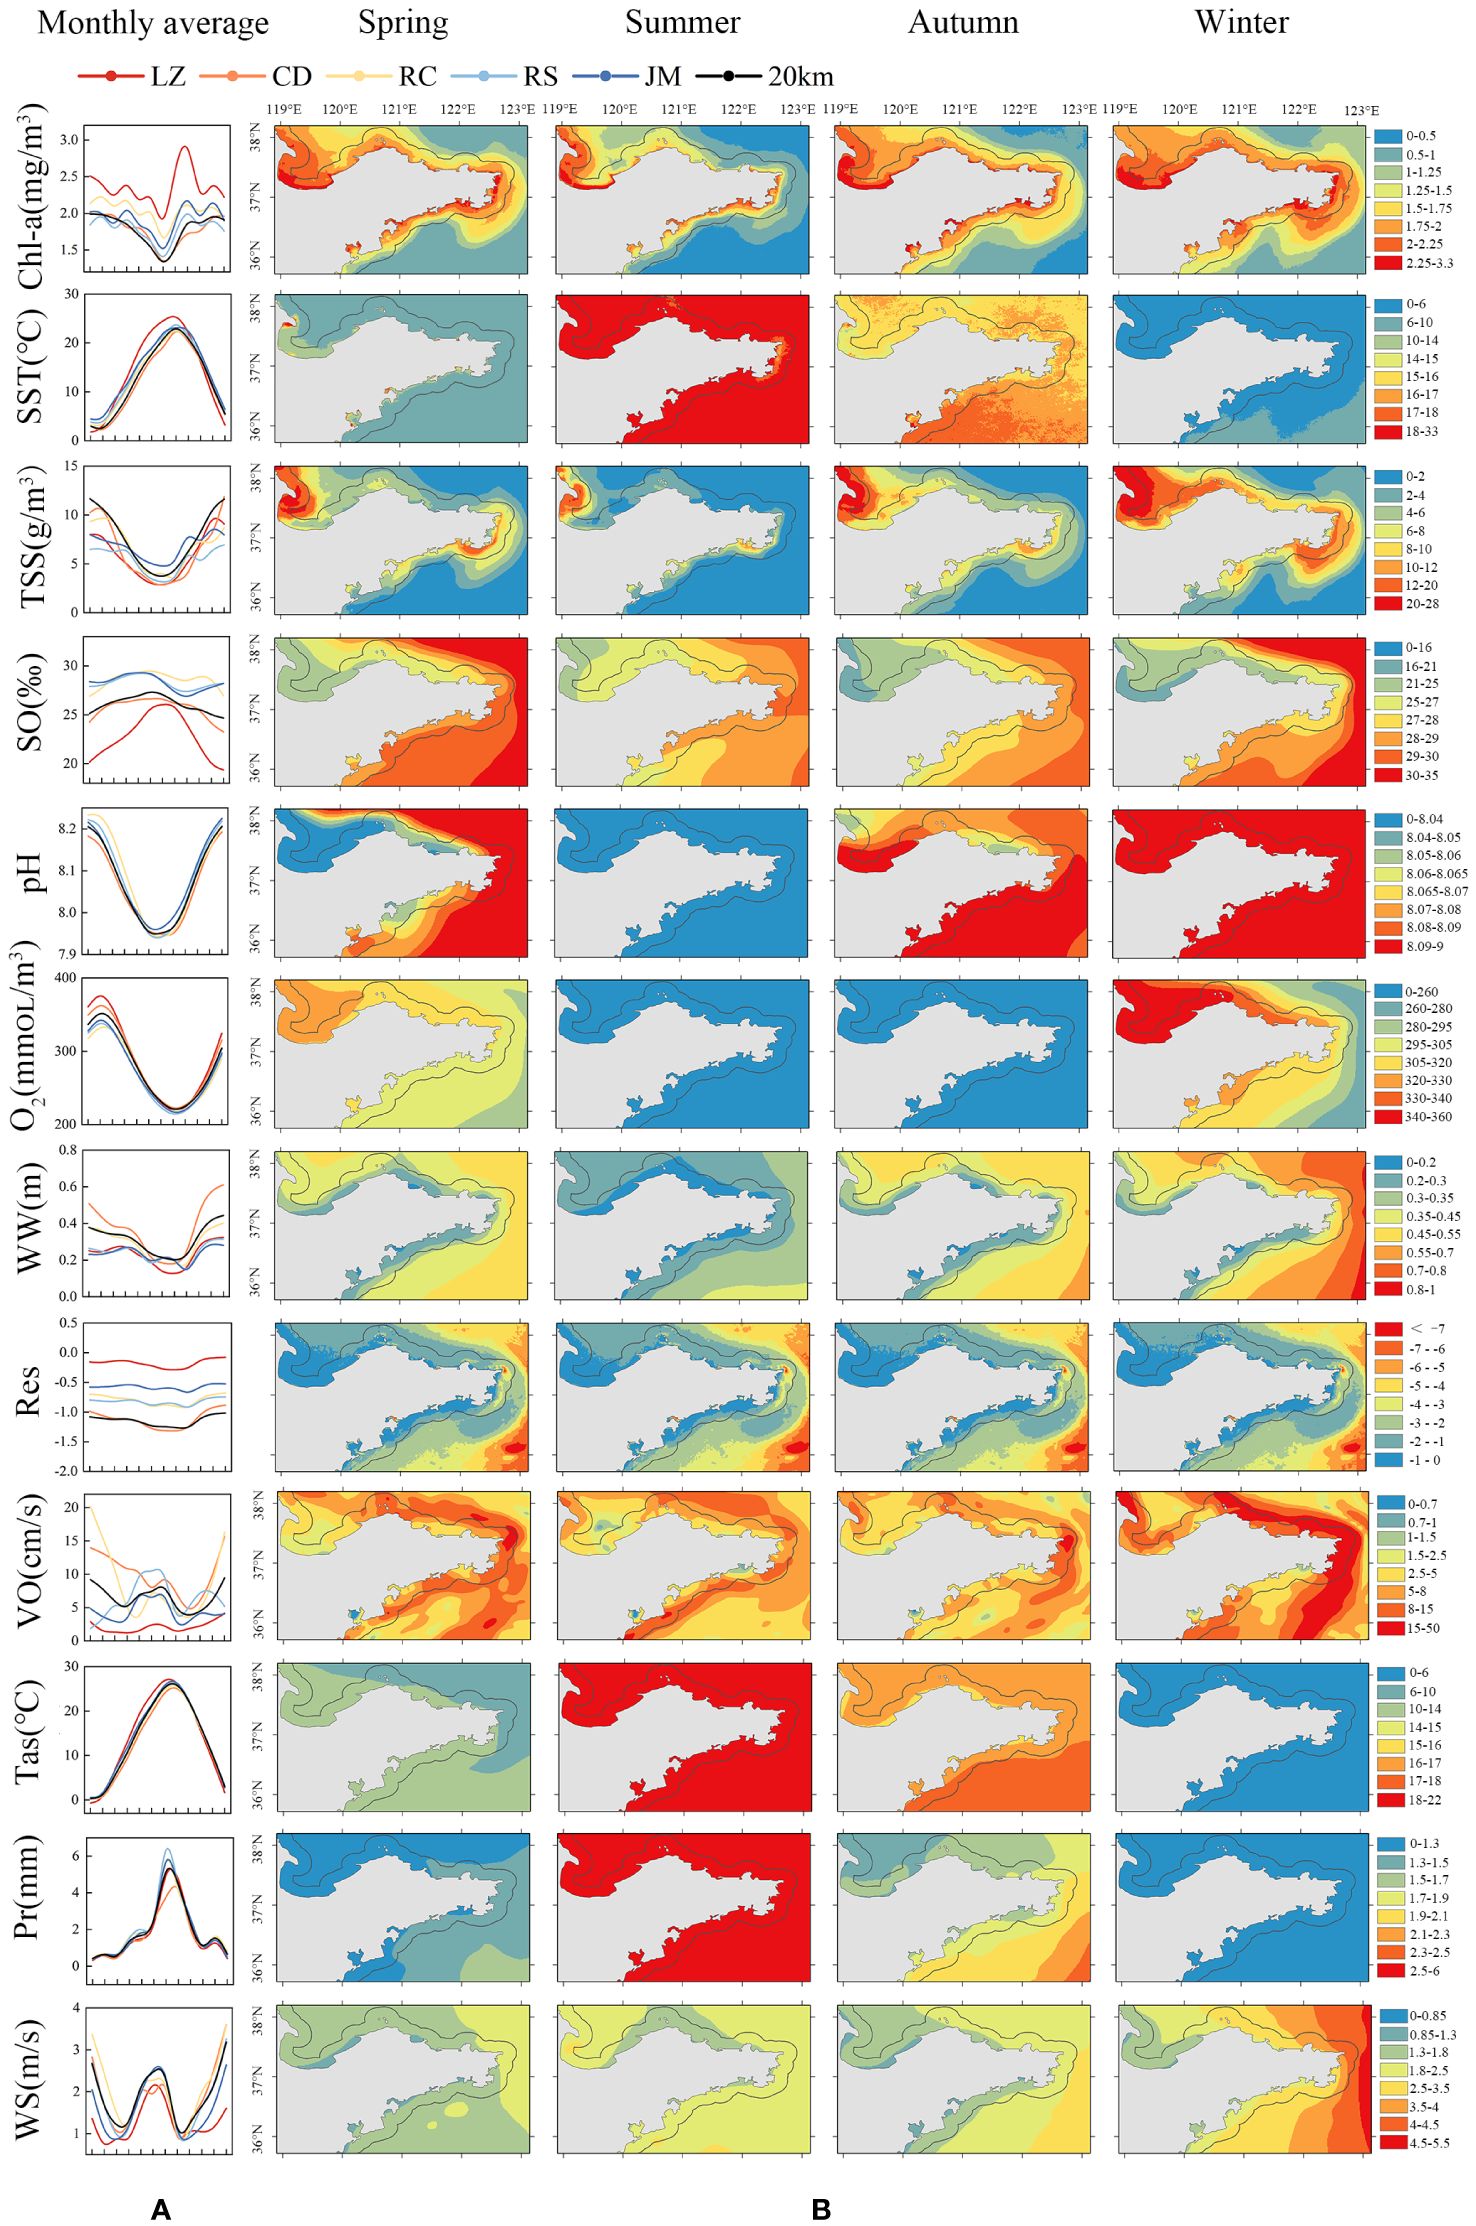
Figure 3 (A) Monthly average change of time series factors in Shandong offshore different areas from May 2011 to December 2022; (B) The quarterly change of spatial distribution for time series factors.
SST was highest in summer and lowest in winter, with minimal spatial variation and almost no inter-regional differences. LZ Bay experienced higher SST in spring, while the area near RC exhibited lower temperatures in summer. SO increased spatially from the coast toward the open sea, with LZ Bay exhibiting the lowest yearly SO but noticeable seasonal fluctuations, being higher in summer and lower in winter. The spatial and temporal pH variation was minimal, with slight differences among regions, and the entire Shandong offshore had a weakly alkaline pH. DO was higher in winter and spring but lower in summer and autumn, with LZ Bay having the highest winter DO concentration.
WW increased from the coast toward the open sea, with the lowest wave heights observed in summer. The CD region exhibited the most significant variation in WW, reflecting its location in the open sea. VO was more robust in winter and spring, with spatial differences in VO, which can identify the coastal currents in the Shandong offshore, and LZ had the lowest water flow across all years.
Pr and Tas followed similar seasonal patterns, with more rainfall in the south than in the north during spring and autumn, though regional differences were not pronounced, and CD had the least rainfall. WS showed minor spatial variation, with higher speed in summer and winter.
Table 2 outlines the final evaluation model, with grading indicators determined based on existing research and the actual conditions of the Shandong offshore. This study set a high Chl-a concentration threshold detrimental to marine aquaculture at more than 5 mg/m3 (Terauchi et al., 2014). However, the Chl-a concentration in the Shandong offshore did not exceed 3.17 mg/m3. Therefore, in the grading indicators, the higher the Chl-a concentration, the higher the score. The grading indicators for TSS were based on the experimental levels: 0, 0.10, 0.25, and 0.5 g/L (Suedel et al., 2015a), with lower TSS concentrations receiving higher scores. SST in the Shandong offshore exhibited seasonal variations, with high summer temperatures causing mass mortalities of marine aquaculture oyster (Yang et al., 2021). The grading indicators for SST were based on the Arrhenius temperature of oyster (Van Der Veer et al., 2006). The grading indicators for SO were based on Wang et al (2023), with 25‰-35‰ representing the highest suitability, decreasing linearly outside this optimal range. The grading indicators for DO were based on the concentration needed for oyster reef restoration (Wang et al., 2023). The seawater pH in Shandong ranges from 7.9–8.2, showing minor seasonal differences. The grading indicators were set that higher pH values indicate higher suitability.
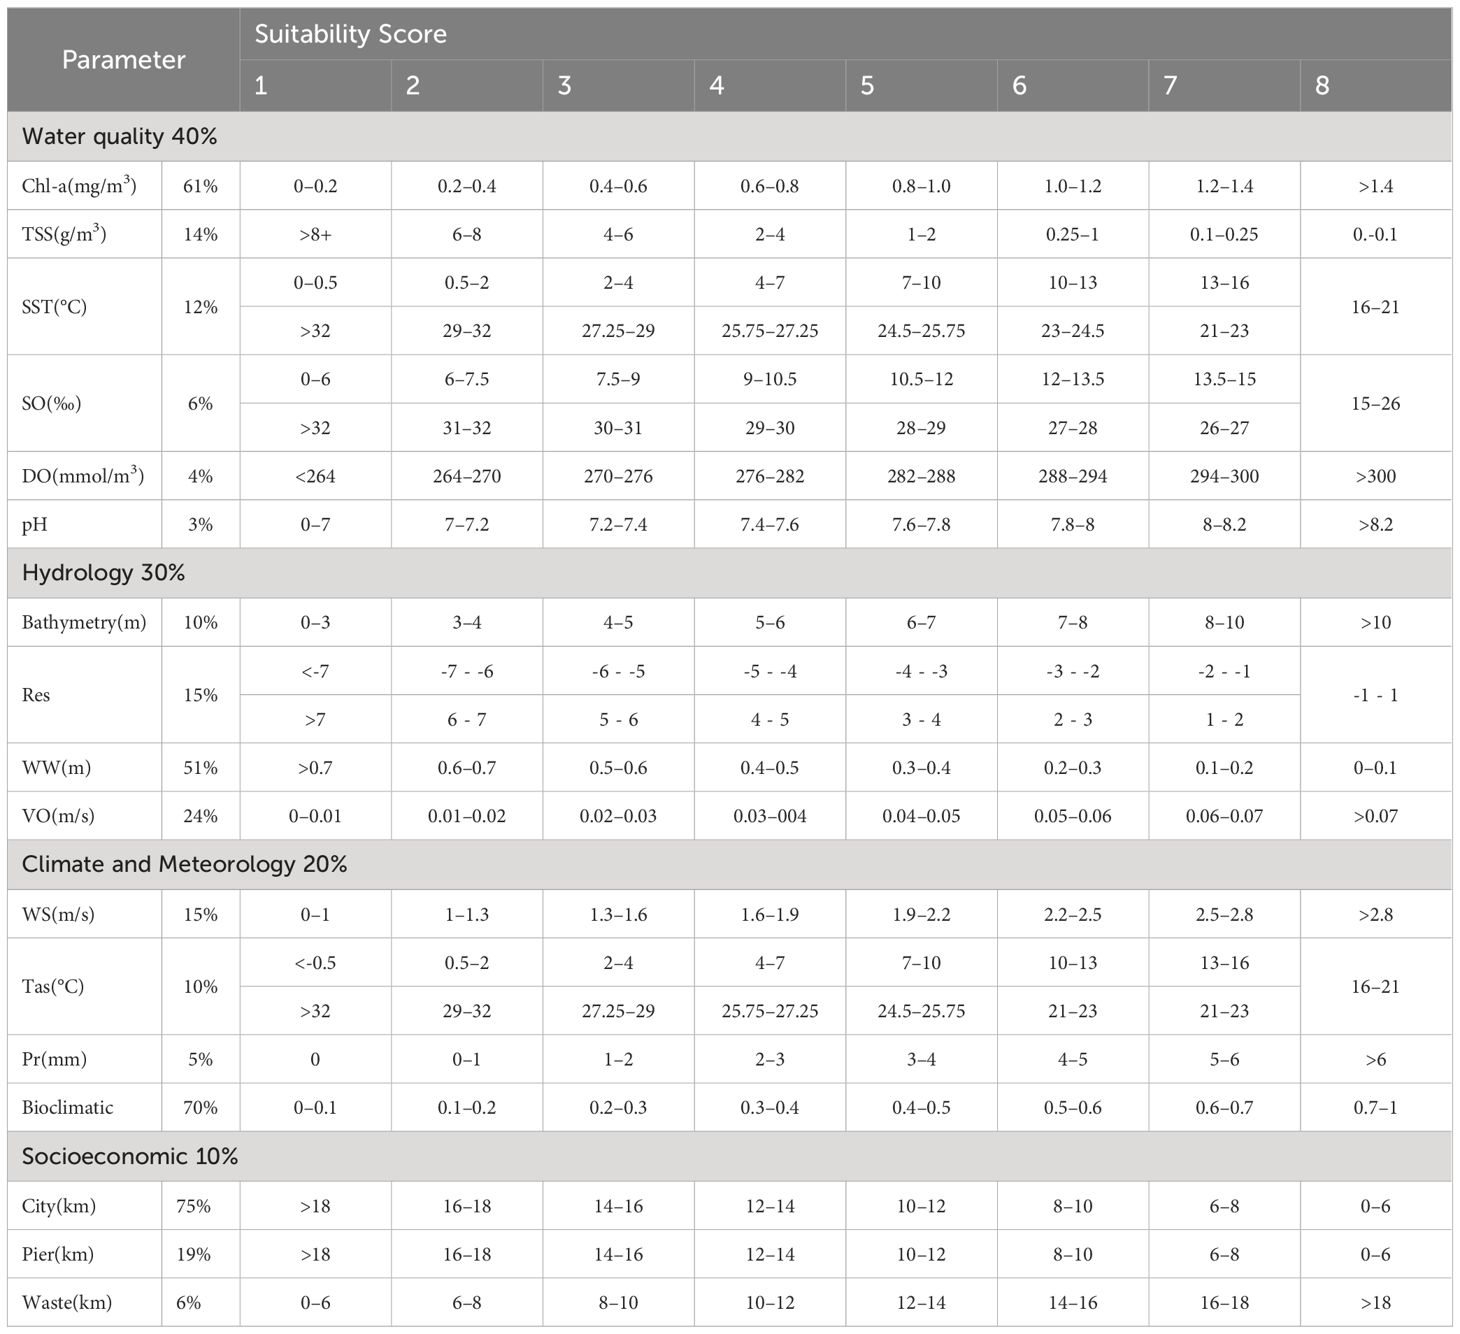
Table 2 Each factor’s weights and grading indicator.
As the depth increased from the coast toward the open sea in the Shandong offshore but did not overall exceed 20m, and VO did not exceed 20 cm/s (except in RC), the grading indicators were set that greater depth and water flow indicated higher suitability. The resuspension of seabed sediments caused by wind waves could also determine the best suitable area. For the resuspension effect, which had a critical depth (h < 10WW), we used WW-h/10 as a grading indicator. If the effects was harmful, it could not cause resuspension; if it was positive, it could cause resuspension and was considered a positive factor, providing more nutrients. However, waves could negatively impact rafts, so a lower WW was considered better for suitability (Ogle et al., 1977; Goseberg et al., 2017).
WS was graded from less suitable to more suitable in an arithmetic sequence, as the average monthly WS in the Shandong offshore did not exceed 5 m/s, making its potential impact on marine aquaculture rafts relatively small. Tas had the same grading indicators as SST, based on the Arrhenius formula (Van Der Veer et al., 2006). Pr was graded from less suitable to more suitable in a linear relationship. After correlation analysis (Supplementary Figure 1) and contribution contrast (Supplementary Table 2), the bioclimatic factors finally selected include bio2 (mean diurnal range), bio5 (max temperature of the warmest month), bio8 (mean temperature of the wettest quarter), bio10 (mean temperature of the warmest quarter), bio14 (precipitation of the driest month), and bio16 (precipitation of the wettest quarter). The training and test set values for both historical and future periods were above 0.9 (Supplementary Figures 2, 6, 10, 14, 18, 22, 26), indicating good prediction results and high reliability. Response curves (Supplementary Figures 3, 7, 11, 15, 19, 23, 27), Variable contributions (Supplementary Tables 3, 4, 5, 6, 7, 8, 9) and jackknife test of variable importance (Supplementary Figures 4, 8, 12, 16, 20, 24, 28) of historical and future periods were in the Supplementary Material. The bioclimatic factors graded the habitability probability (Supplementary Figures 5, 9, 13, 17, 21, 25, 29) obtained from the MaxEnt model.
In practical production, factors related to oyster harvesting, such as storage, transportation, waste disposal, and maintaining a certain distance to piers equipped with specific equipment (marine aquaculture equipment and vessels), are necessary to ensure profitability; otherwise, costs become significantly higher (Liu et al., 2014). This is particularly challenging for individual farmers and small enterprises (Barillé et al., 2020). Proximity to cities facilitates oyster transportation, processing, and sales. Our model incorporates socioeconomic factors that could quantify the specific impact of distance, such as distance to piers and cities. It also considers the negative impact of WWTPs, quantifying their impact on marine aquaculture activities using distance metrics. In socioeconomic factors, proximity to cities and piers indicated higher suitability, while proximity to WWTPs indicated lower suitability scores.
The weight value for each factor was obtained through a literature review and experts’ opinions (Radiarta et al., 2008, Radiarta et al, 2011; Saitoh et al., 2011; Cho et al., 2012; Liu et al., 2013, 2014; Aura et al., 2016; Snyder et al., 2017; Barillé et al., 2020; Liu et al., 2020a; Jiang et al., 2022). Environmental factors such as SST, Chl-a, TSS, SO, DO, and Bathymetry were commonly considered. Socioeconomic factors, including distance to the city, piers, land-based facilities, and constraints like harbors, townships, industrial areas, and river mouths, were also considered in the evaluation model.
Compared to socioeconomic factors, environmental factors hold a higher weight. Among the environmental factors, water quality, such as SST, Chl-a, and TSS, carries a significant weight of 40%. Chl-a concentration reflects the biomass and productivity of phytoplankton in seawater and can indicate food availability (Xing et al., 2017). Furthermore, it has been found to have a significant positive correlation with oyster growth (Mizuta et al., 2012). Oysters tend to increase their feeding activity to a maximum level and stabilize, increasing Chl-a concentration within a specific range (Tenore and Dunstan, 1973). TSS can negatively impact oyster pumping and clearance rates (Loosanoff and Tommers, 1948; Suedel et al., 2015). SST is a crucial parameter influencing biological processes, and high summer temperatures can lead to mass mortality in oyster marine aquaculture (Yang et al., 2021). While Pacific oyster are euryhaline species, SO does not significantly affect their growth (Nell and Holliday, 1988). However, increased freshwater influx can result in rapid, short-term salinity reduction, limiting oyster growth (Swam et al., 2022). In the Shandong offshore area, the maximum SO does not exceed 30‰, and the LZ Bay exhibits the lowest SO due to extensive river inputs, necessitating consideration of SO variations. DO in coastal ecosystems is experiencing more significant fluctuations than other environmental variables, and seasonal hypoxia events are rising (Diaz, 2001). Considering the decrease in DO with increasing marine aquaculture density, this factor needs consideration, albeit with a lower weight (Brito et al., 2023). pH reduction can impede the growth of early life stages of oyster (Ko et al., 2014). The pH value of seawater in Shandong ranges from 7.9 to 8.2, with minimal seasonal variation, warranting a lower weight.
Hydrological factors are also crucial in influencing the growth and marine aquaculture of Pacific oyster, and they hold a weight of 30% in this model, relatively lower than water quality factors. Suspended particles influenced by WS and WW, such as Chl-a and TSS, exhibit good temporal consistency with the mass concentration and diffusion intensity. Wind and waves play a significant role in the spatial and temporal distribution and diffusion of suspended particles, including Chl-a and TSS (Liu and Wang, 2019). Hence, the weight assigned to Res is relatively higher. Deeper waters contribute to higher VO (10–20 cm/s), resulting in faster water renewal and more favorable nutrient conditions. These conditions affect the feeding physiology of oyster, leading to higher growth rates (Lee et al., 2017). Offshore wind and wave conditions, persistent wave action, and strong ocean currents can impact marine aquaculture facilities (Ogle et al., 1977).
Meteorological factors such as WS, Pr, and Tas are less commonly considered in suitability site selection studies for oyster marine aquaculture. These climate and meteorological factors do not directly impact marine aquaculture and carry a lower weight of 20%. However, they exhibit strong correlations with environmental factors. For example, Tas is related to SST, and the Res is caused by wind and waves, leading to changes in TSS concentration. Pr affects river flow rates, influencing factors such as SO and river nutrient inputs, which can impact Pacific oyster marine aquaculture.
Furthermore, meteorological factors directly reflect variations in these factors that can characterize climate changes and extreme weather events. Due to the lack of relevant data, this study considers fewer socioeconomic factors, weighing only 10%. Among the socioeconomic factors, city areas and piers with established infrastructure often carry a higher weight.
The quarterly variations in the spatial distribution of suitability for each sub-model in the Shandong offshore are shown in Figure 4. The results indicated that water quality and hydrology suitability in the Shandong offshore are suitable, with scores of 6 or above within the range. Water quality suitability decreases in the summer, while hydrological conditions are best in winter and spring. Compared to other areas, the water quality and hydrological conditions in LZ were relatively poorer. Climate suitability in Shandong is relatively low, exhibiting higher suitability only near the coast, which may be attributed to the limited availability of distribution data for wild Pacific oyster in the Shandong offshore.
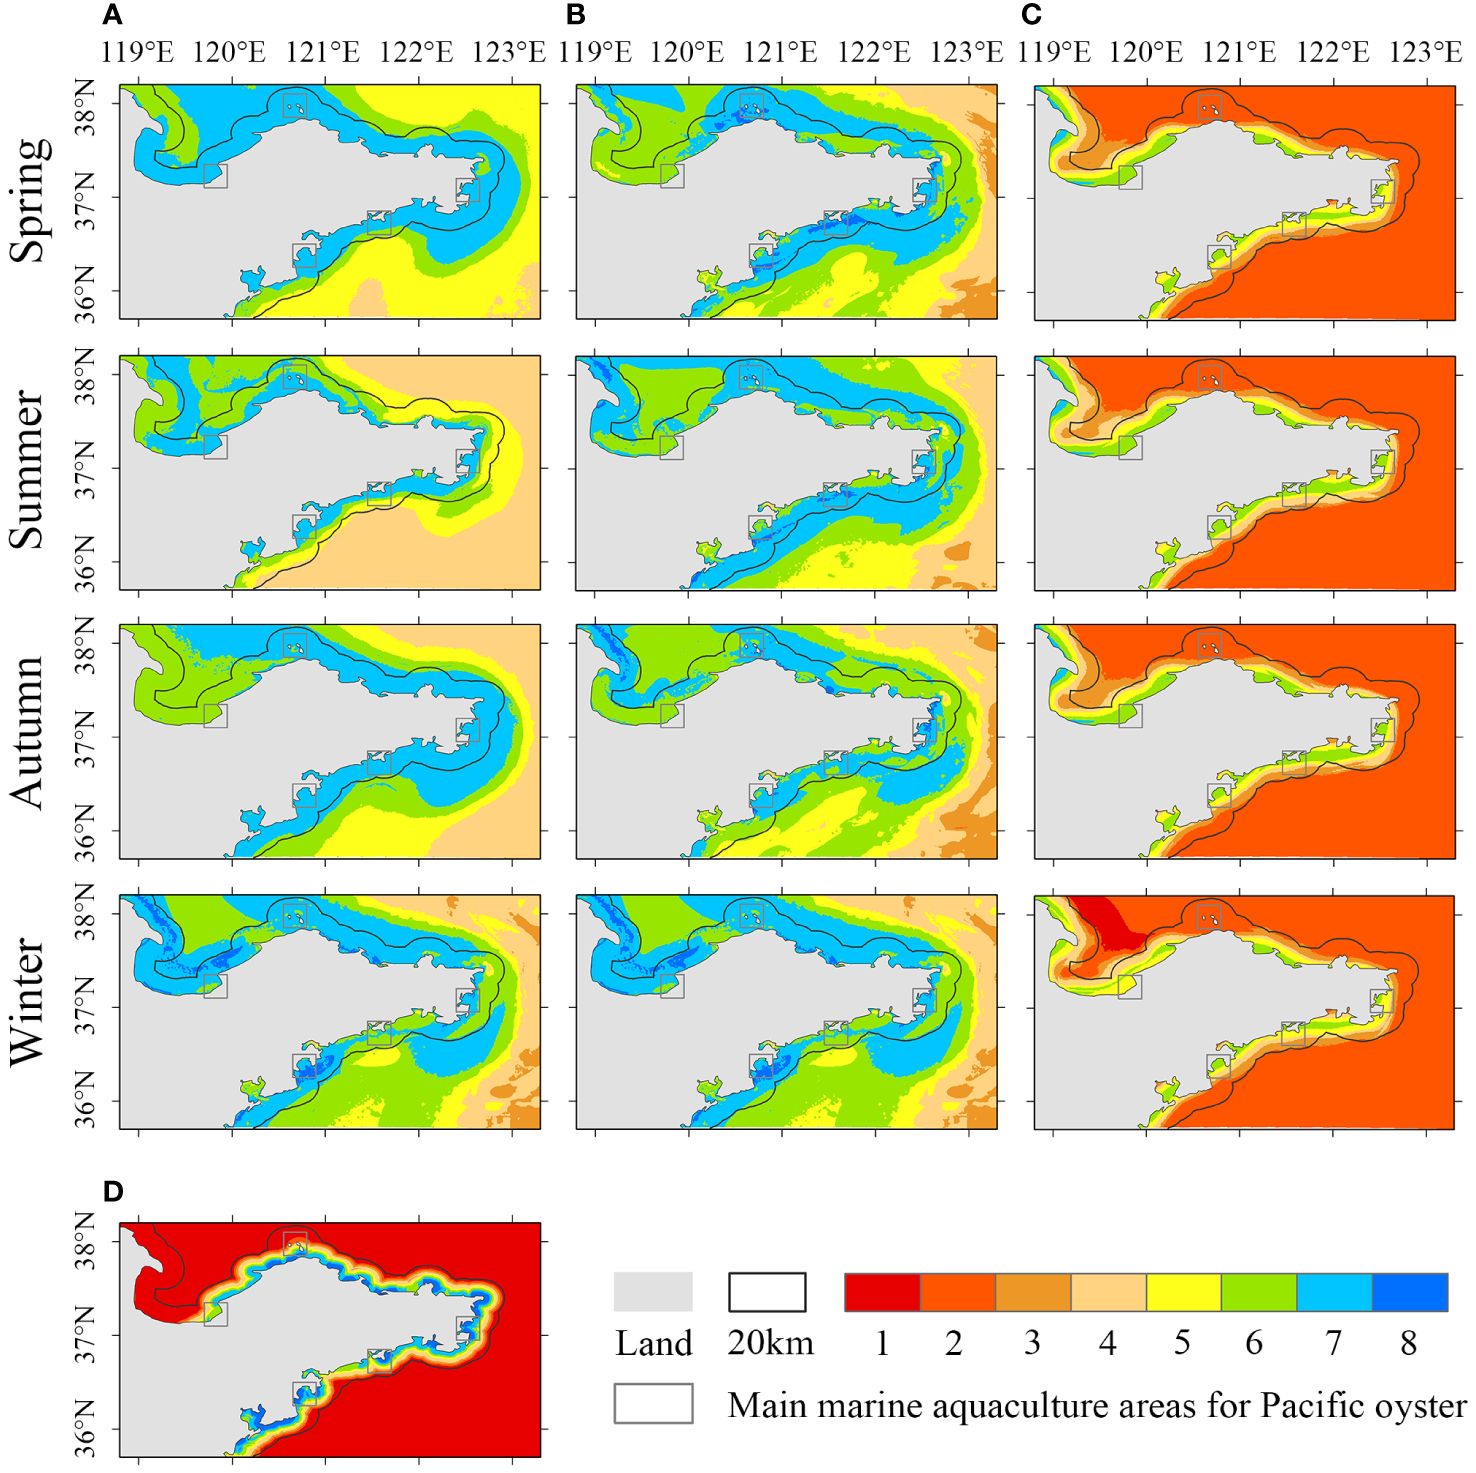
Figure 4 Quarterly variation of the spatial distribution of the suitability of each sub-model in Shandong coastal area: (A) Water quality; (B) Hydrology; (C) Climate and Meteorology; (D) Socioeconomic.
Averaging 140 suitability distribution maps from May 2011 to December 2022, we obtained the final spatial suitability distribution (Figure 5A). The suitability scores were categorized into three levels: high suitability (scores of 6–8), medium suitability (scores of 4, 5), and low suitability (scores of 1–3). The HSP was 48% in 20 km, with all areas except CD (19%) having higher HSP than the overall 20 km level, including LZ (100%), RC (92%), RS (72%), and JM (100%). High scores in LZ all being score of 6.
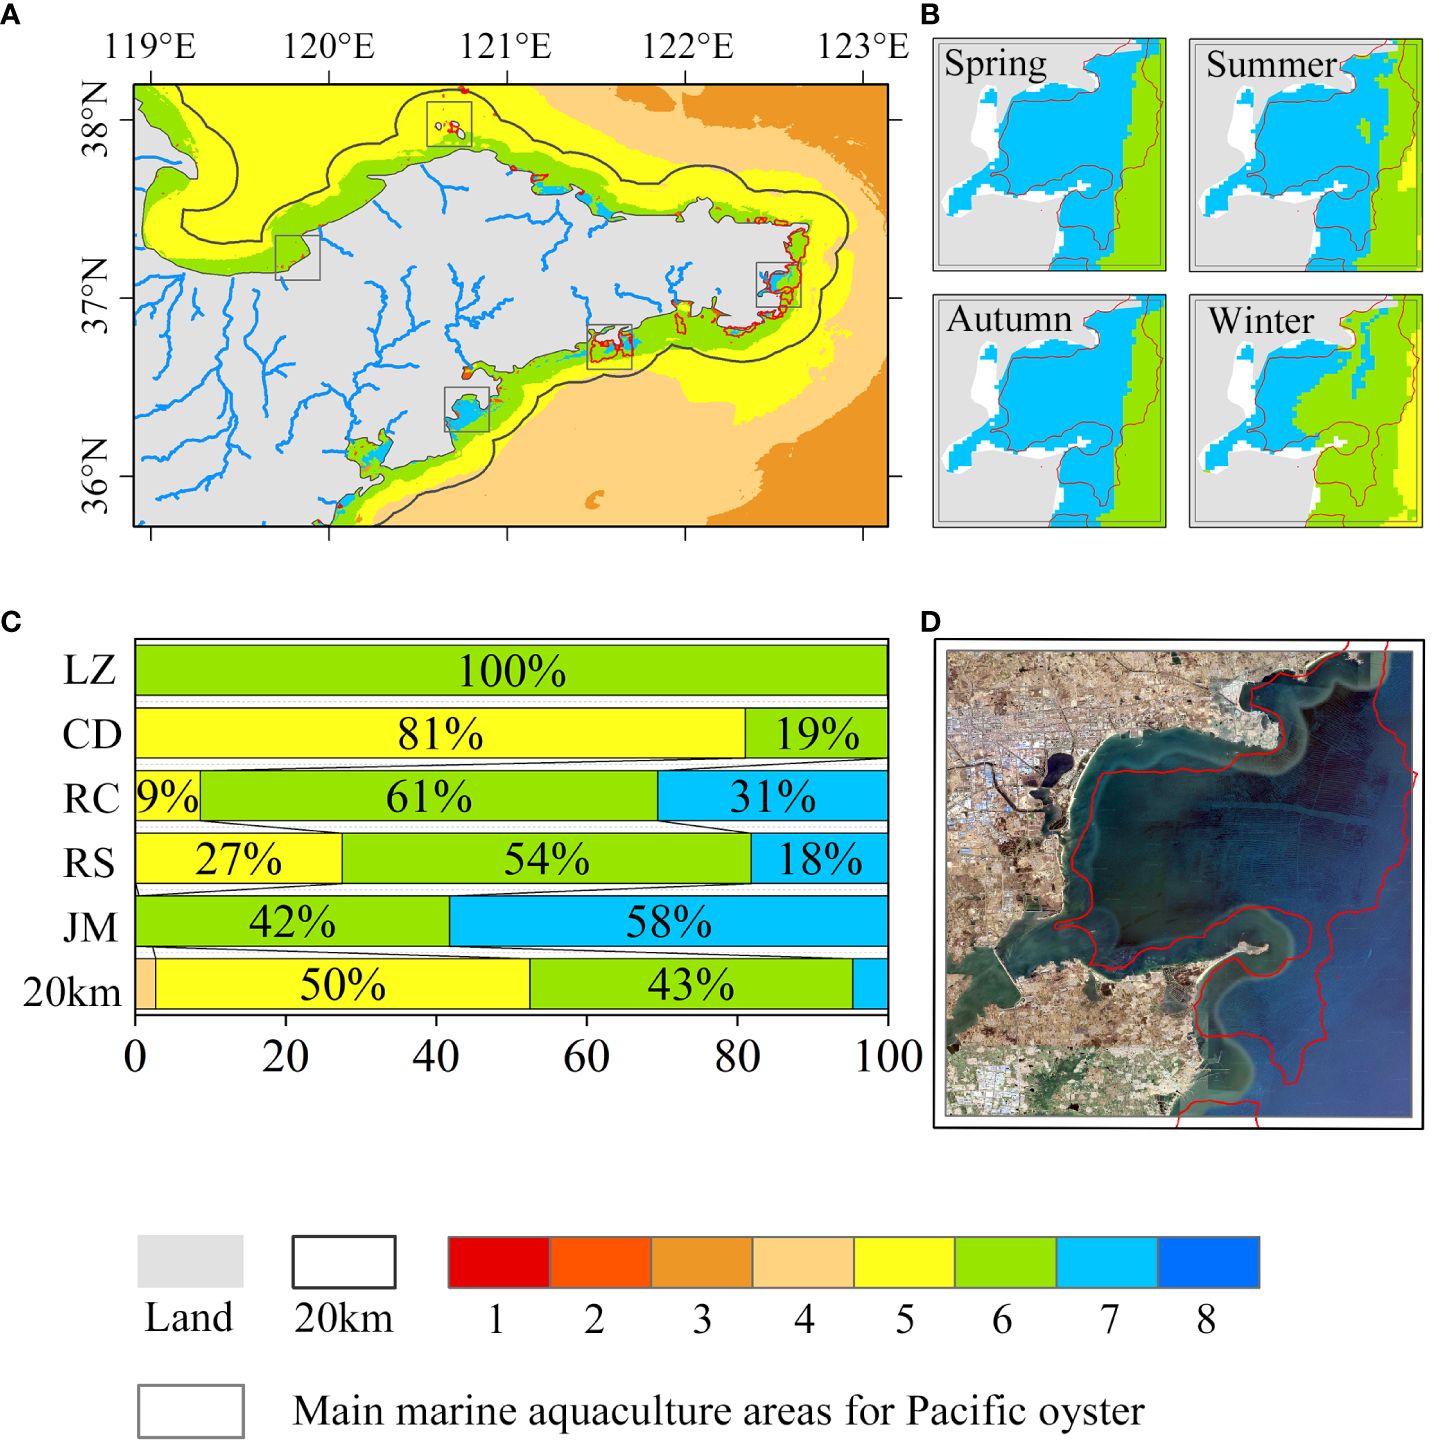
Figure 5 (A) Spatial distribution of final suitability; (B) Quarterly change of suitability spatial distribution in RC Sanggou Bay and comparison with the actual aquaculture area of offshore aquaculture database; (C) Proportion of suitability scores in each region; (D) High-resolution satellite imagery and the offshore marine aquaculture database (red area) obtained by Liu et al (Wang et al., 2018; Liu et al., 2020a).
The suitability distribution in RC Sanggou Bay (Figure 5B) was compared with high-resolution satellite imagery and the offshore marine aquaculture database obtained by Liu et al (Liu et al., 2020b) (Figure 5D). This database is based on Landsat 8 remote sensing images and object-oriented NDWI and edge feature extraction (Wang et al., 2018), along with manual interpretation methods, providing the spatial distribution of marine aquaculture within a 100 km range of China’s offshore areas. The red areas in Figure 5C represented actual offshore marine aquaculture areas. In RC, the high suitability areas in spring, summer, and autumn matched the locations of rafts in this database, proving the accuracy of the evaluation model.
The monthly average change in the HSP (Figure 6B) showed that LZ (85.1%—100%), RC (87.16%—100%), and JM (80.39%—100%) maintained high suitability throughout the year (above 80%). The CD was more suitable in spring (March-May) but was lower than 20 km in other seasons. RS had lower suitability in summer (June-August), consistent with actual conditions, with minimal seasonal variation and HSP above 80% in other seasons. CD and RS exhibited more considerable monthly variation in suitability. Overall, the offshore areas within 20 km of Shandong had higher suitability in spring and autumn, with the annual HSP fluctuating around 50%. Spatially, the northern part of Shandong had higher suitability (Figure 6A).
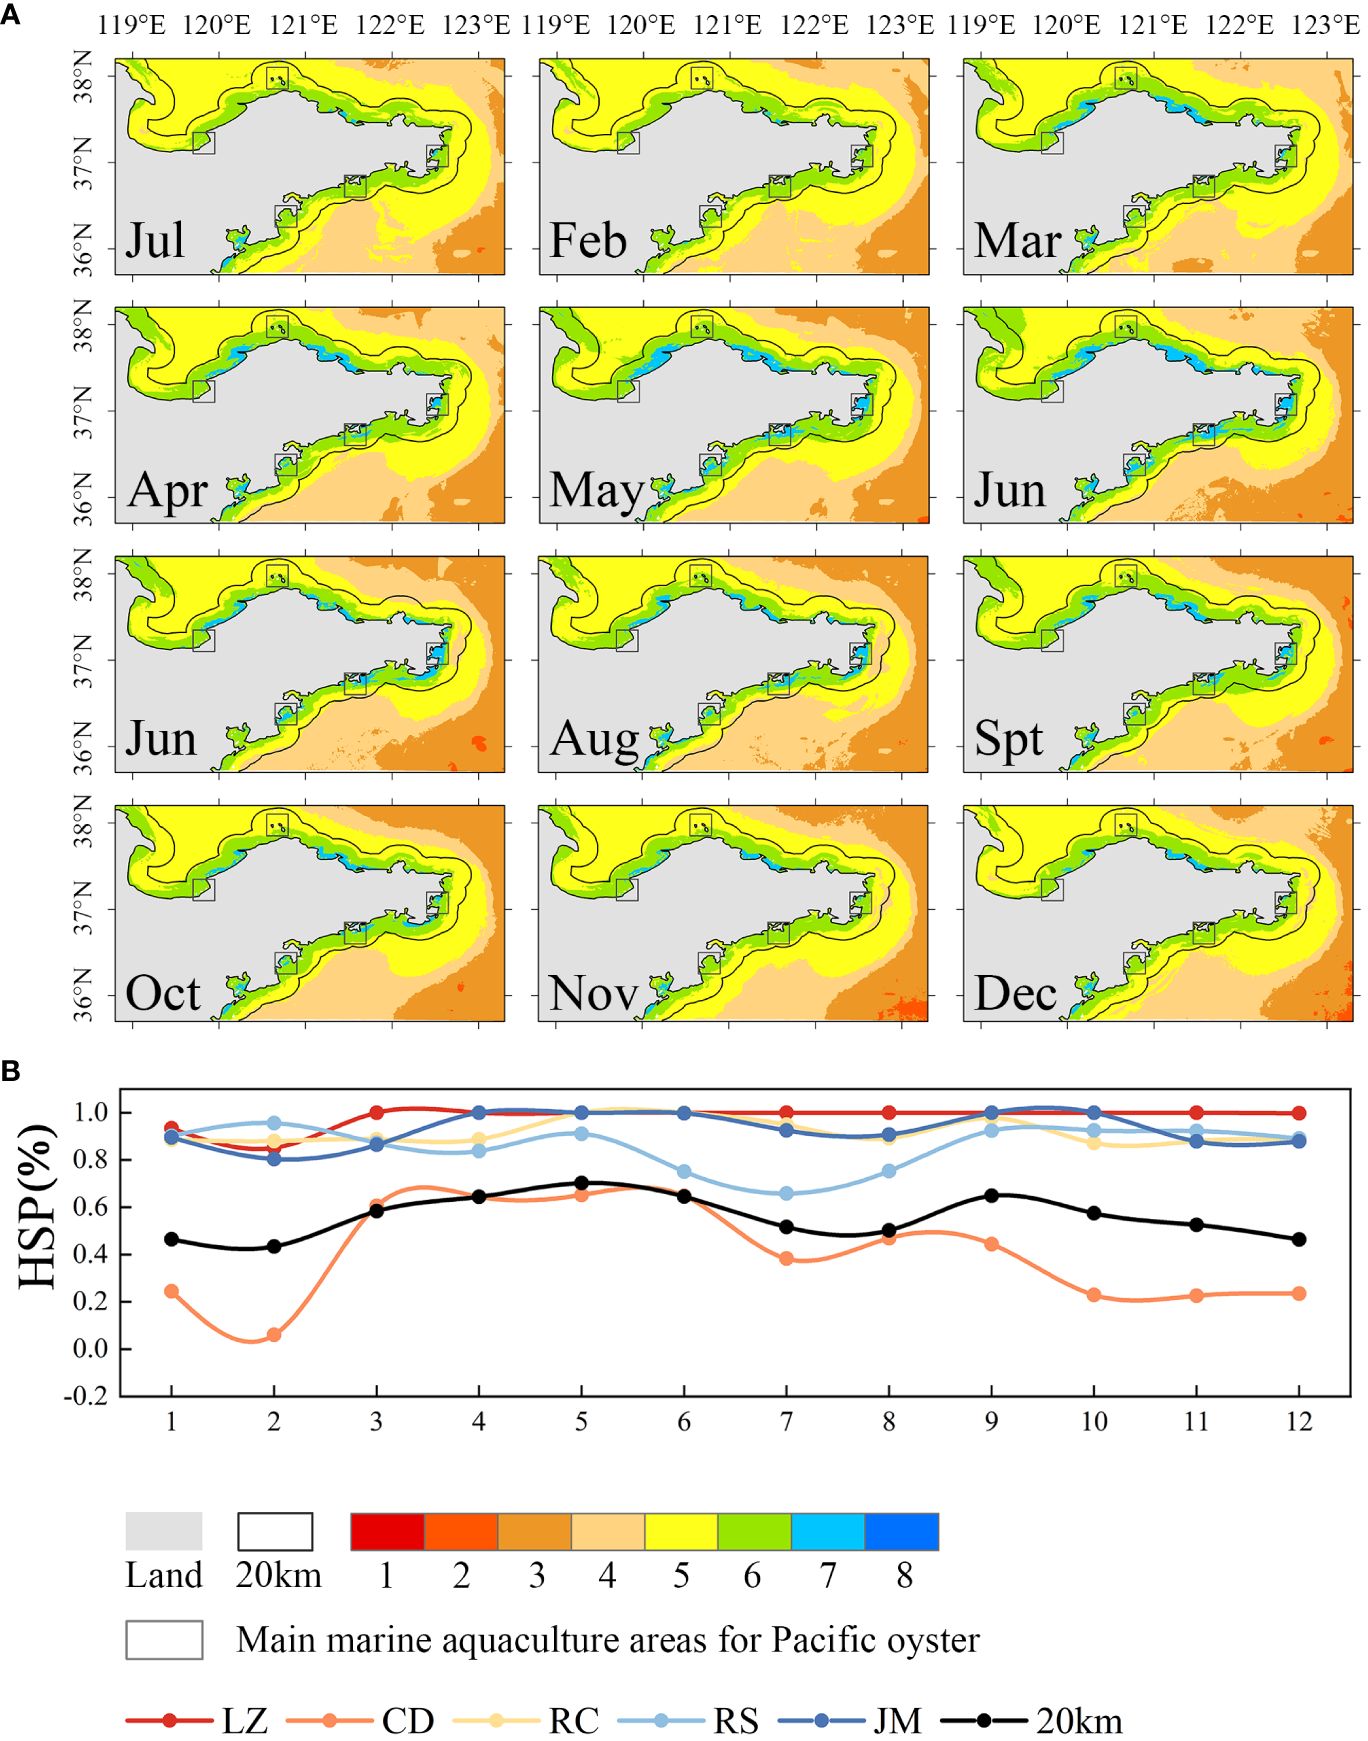
Figure 6 (A) Monthly change of the spatial distribution of suitability; (B) Monthly change of the HSP.
The time series of HSP from May 2011 to December 2022 (Figure 7A) indicated that summer (June-August) was the most susceptible to climate events. Comparing the spatial distribution of suitability in July of average years with El Niño and La Niña years (Figure 7B), the results showed a general decrease in suitability during El Niño years and an increase during La Niña years. LZ and CD were less affected by climate events. In contrast, RC, RS, and JM were more susceptible to climate events in summer, with a noticeable decrease in suitability (scores of 7) during El Niño years, and high HSP (scores 6–8) area expanded within the 20 km range during La Niña periods. The increase in suitability during La Niña could be related to positive anomalies of Chl-a forced by winds (Herrera-Cervantes et al., 2020).
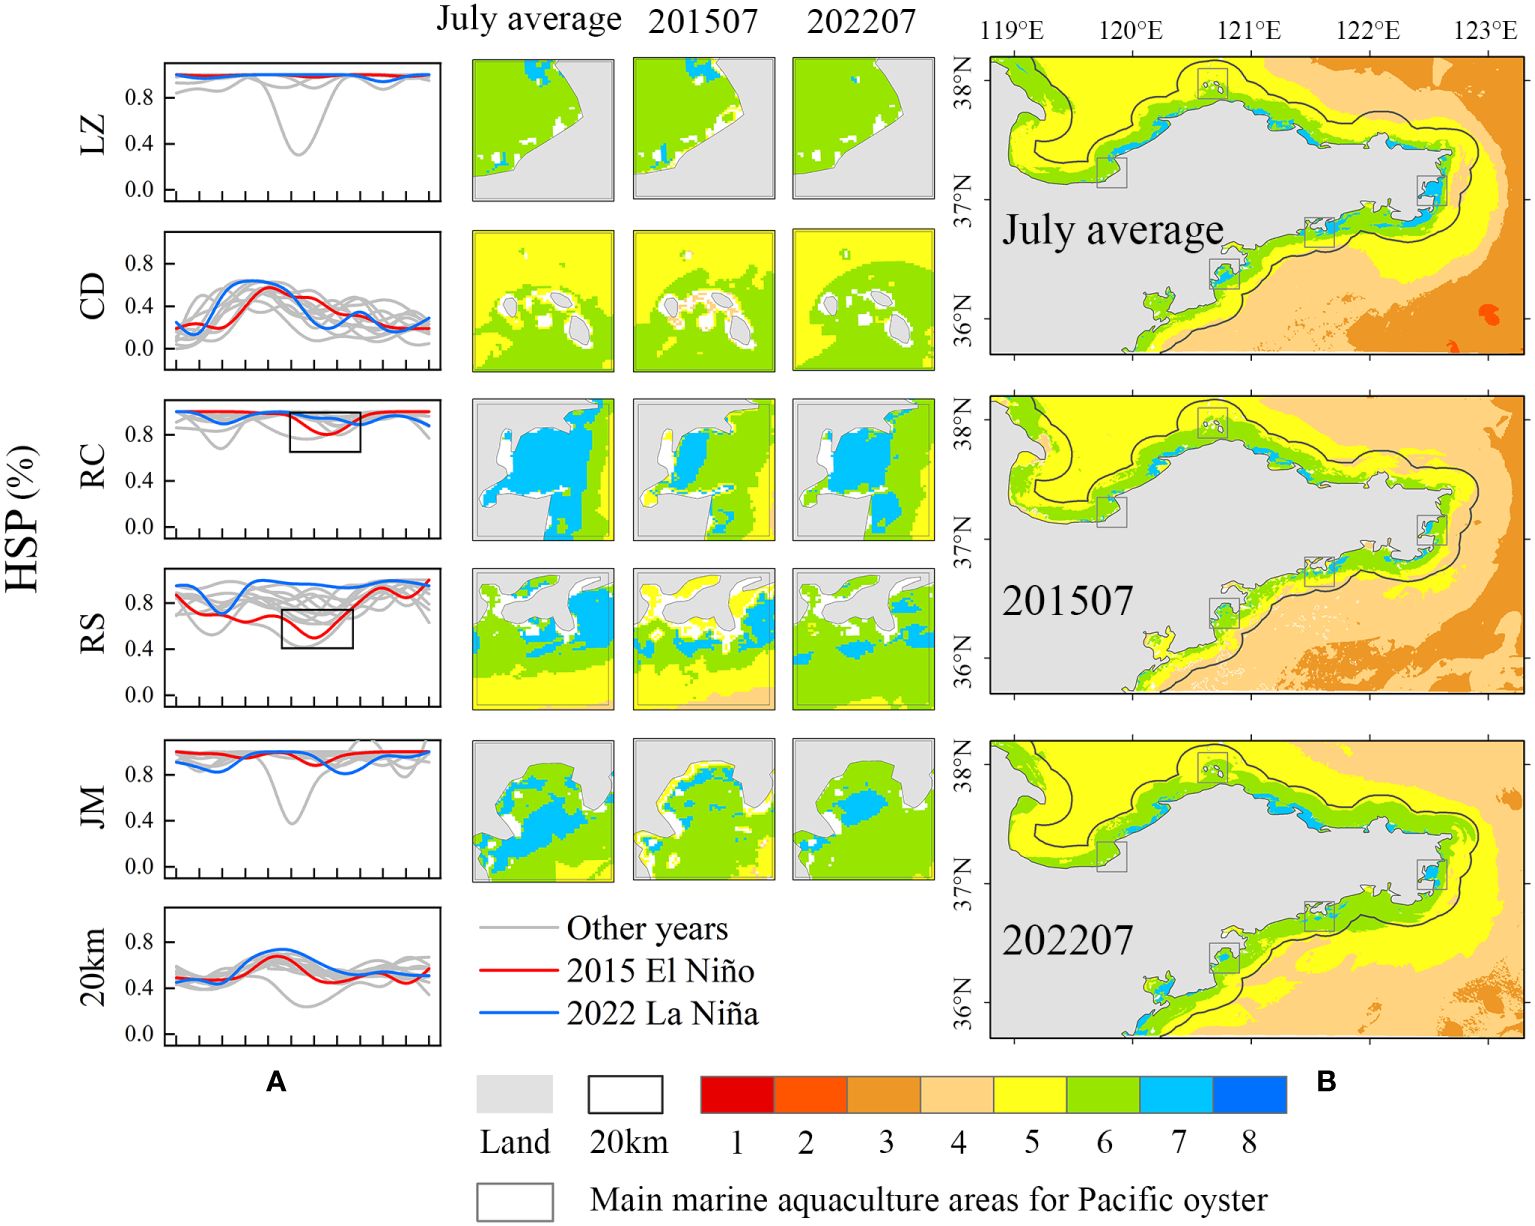
Figure 7 (A)The annual comparison of the HSP in each region, the red line represents the El Niño year, the blue line represents the La Nina year, the gray line indicates the other years; (B) The July average of each region, the comparison of the suitability spatial distribution of July in El Niño year (2015) and La Nina year (2022).
Figure 8 showed that under the SSP1–2.6 scenario, overall suitability in the Shandong offshore gradually increases in all future periods compared to the historical period. Under the SSP5–8.5 scenario, suitability initially increases and then decreases. However, the HSP (scores of 6–8) remains higher than the historical average, with a sharp decline in the proportion of the score of 7.
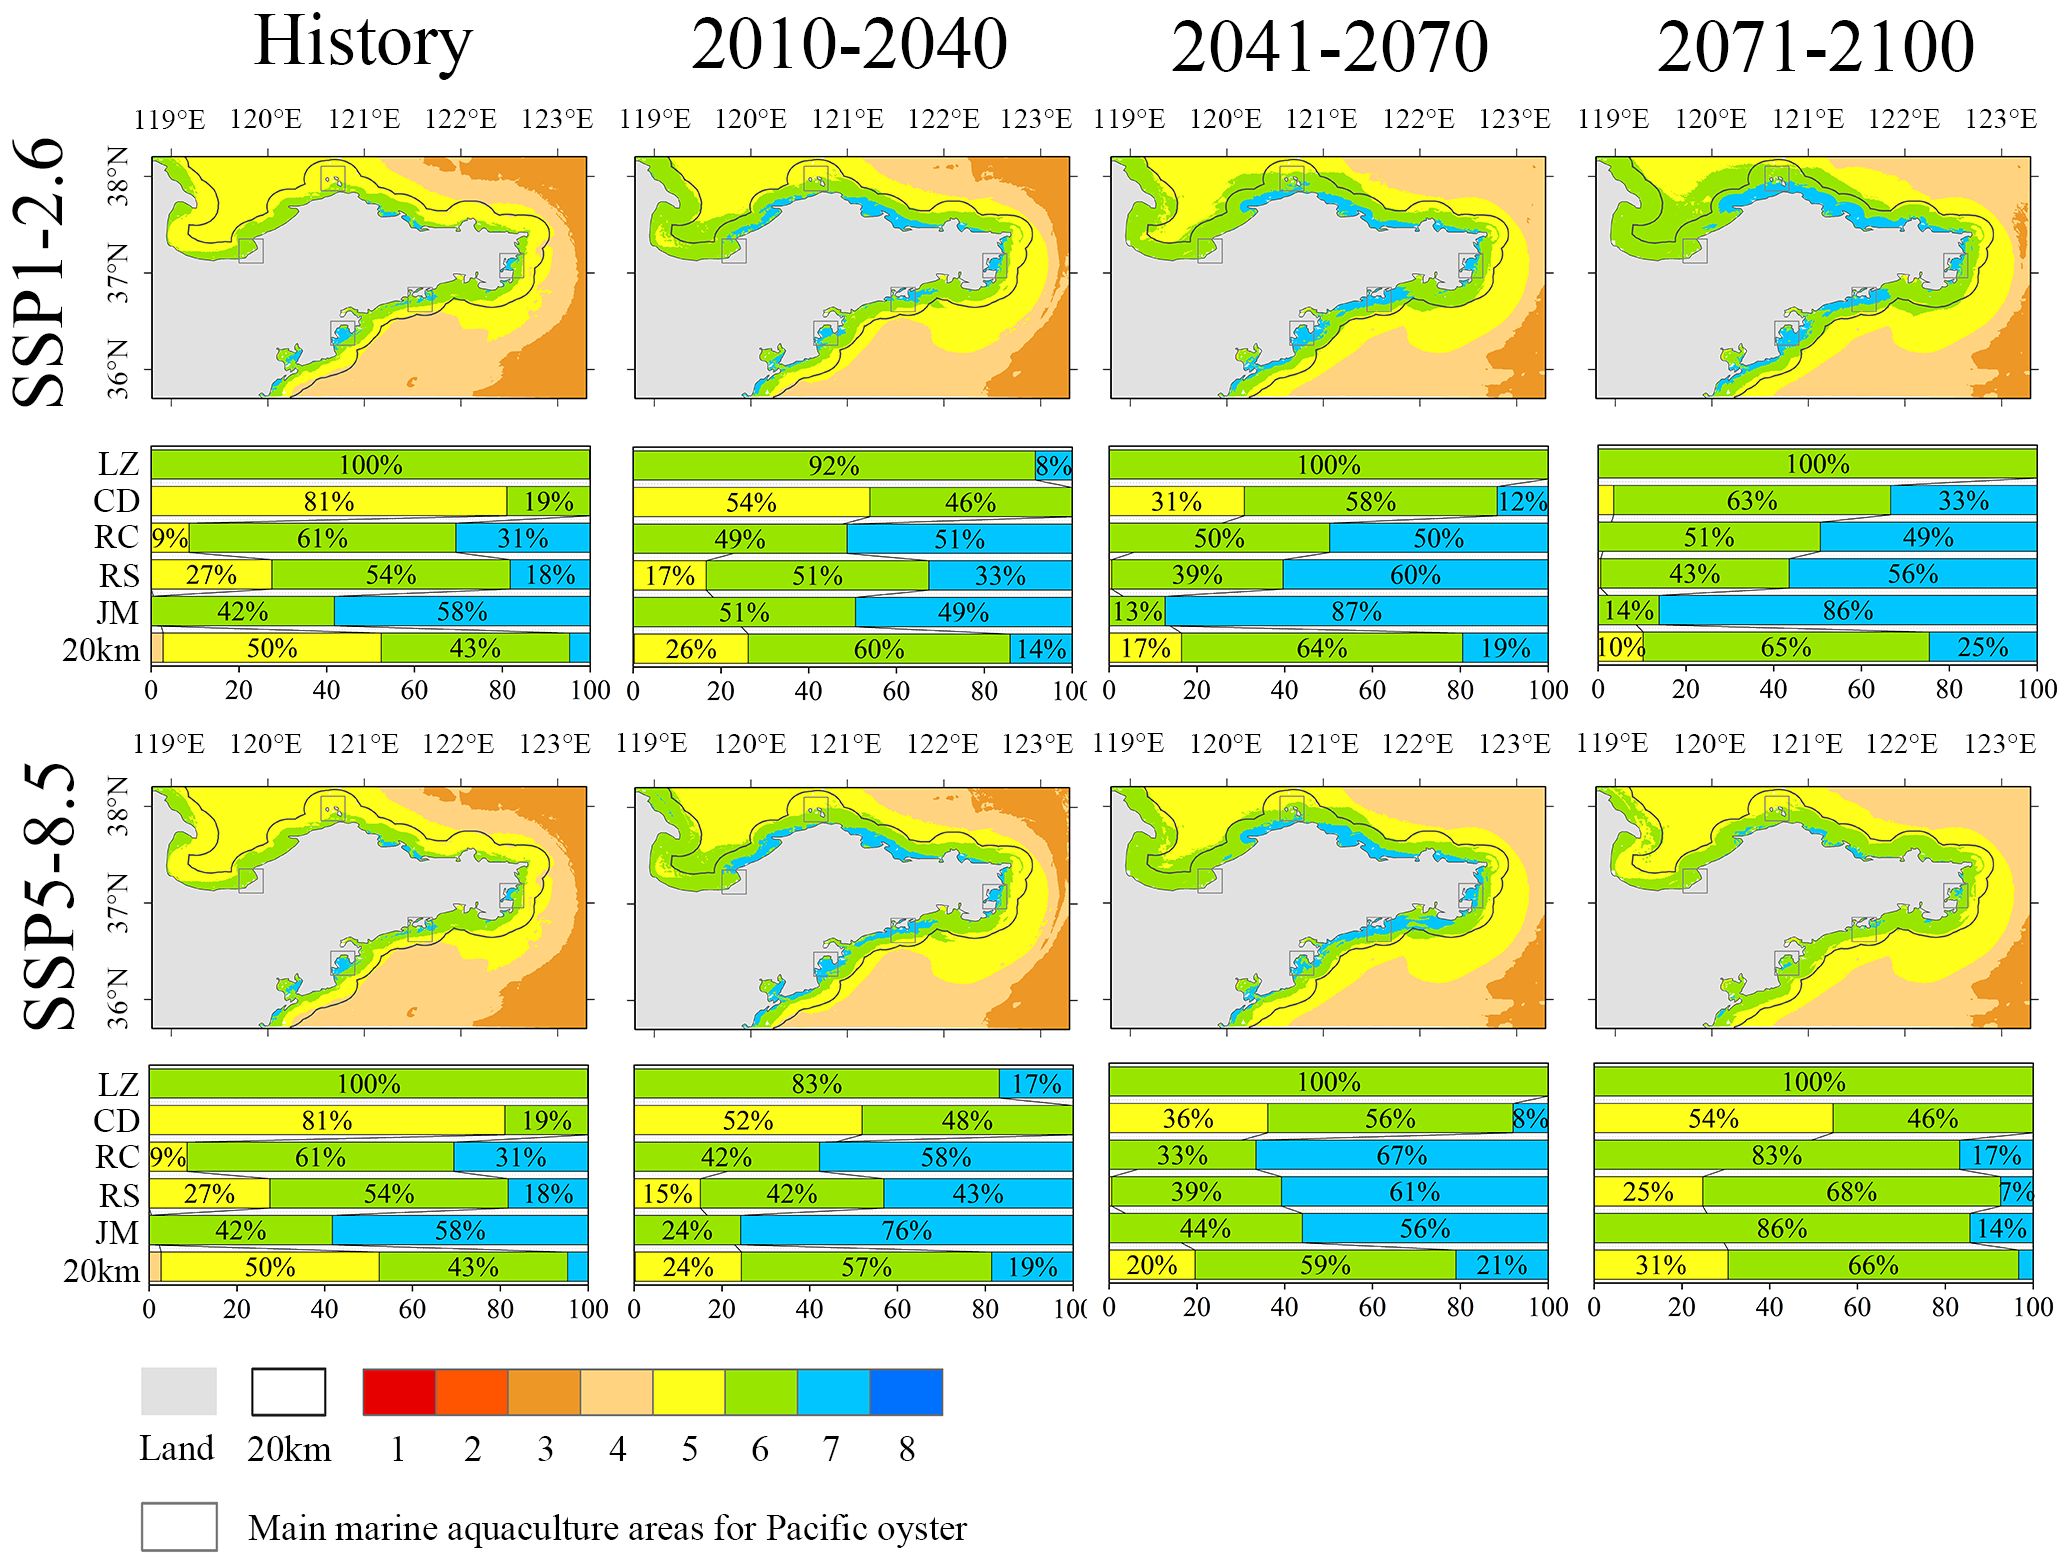
Figure 8 Percentage difference in the spatial distribution of suitability in the historical period between the SSP1–2.6 and the SSP5–8.5 scenario.
Our research indicated that future climate change impacts would increase suitability in the northern offshore of Shandong. Importantly, high suitability had remained stable at 100% in LZ, primarily with a score of 6. Furthermore, a suitability score of 7 increased under the SSP1–2.6 scenario and maintained the highest in the near term under the SSP5–8.5 scenario, later being surpassed by RC and RS in 2041–2070. This stability and high suitability would provide some reassurance in the face of potential climate change impacts.
The suitability evaluation model for Pacific oyster marine aquaculture develop in this study is applicable for assessing operations in the Shandong offshore area and can be adapted to suit the specific conditions of other regions as well. However, it is essential to note that there is still scope for further development of this model. Due to data limitations, this study considered a limited number of socioeconomic factors. When conducting suitability assessments, it is essential to take into account areas where marine aquaculture is prohibited or conflicts with existing activities, such as protected areas, net fishing, touristic traffic, commercial traffic, etc (Brigolin et al., 2017; Barillé et al., 2020; Porporato et al., 2020). Additionally, it is necessary to consider the infrastructure that can be integrated with marine aquaculture activities, such as offshore wind farms (Buck et al., 2008; Benassai et al., 2014; Di Tullio et al., 2018) and oil drilling platforms (Ogle et al., 1977), which has been piloted and studied worldwide and may serve as potential areas for Pacific oyster marine aquaculture.
The MaxEnt model used in this study has demonstrated superior predictive accuracy compared to other species’ geographic distribution models (Phillips et al., 2006; Wang et al., 2007). It has shown promising results even dealing with limited species distribution data (Hernandez et al., 2006), addressing the challenge of predicting species distributions with small sample sizes in marine environments. The application of MaxEnt in marine studies has witnessed rapid development (Hu et al., 2021; Hughes and King, 2024; Yang et al., 2024; Yati et al., 2024). In this study, due to the scarcity of wild Pacific oyster distribution data in the Shandong offshore area, we utilized available data (Supplementary Table 1) from the entire northwest Pacific region (117°E-146°E, 30°N-45°N) for prediction. However, this approach may lead to an expanded study scope and imbalanced species distribution data, potentially affecting the accuracy of the predictions (Soley-Guardia et al., 2024). Obtaining more species distribution data in future research will enhance the accuracy of MaxEnt predictions. Additionally, utilizing surrogate species with easily accessible data, can be employed to predict suitable habitats for species with insufficient survey data (Barata et al., 2024).
Pearson correlation analysis of the time series data for each factor (Figure 9) explored their interactions and impact on suitability, categorizing the Pearson correlation coefficients into five levels: very strong (0.8–1.0), strong (0.6–0.8), moderate (0.4–0.6), weak (0.2–0.4), and very weak (0–0.2), and analyzed the correlation between HSP, ONI, and MEI with time series factor.
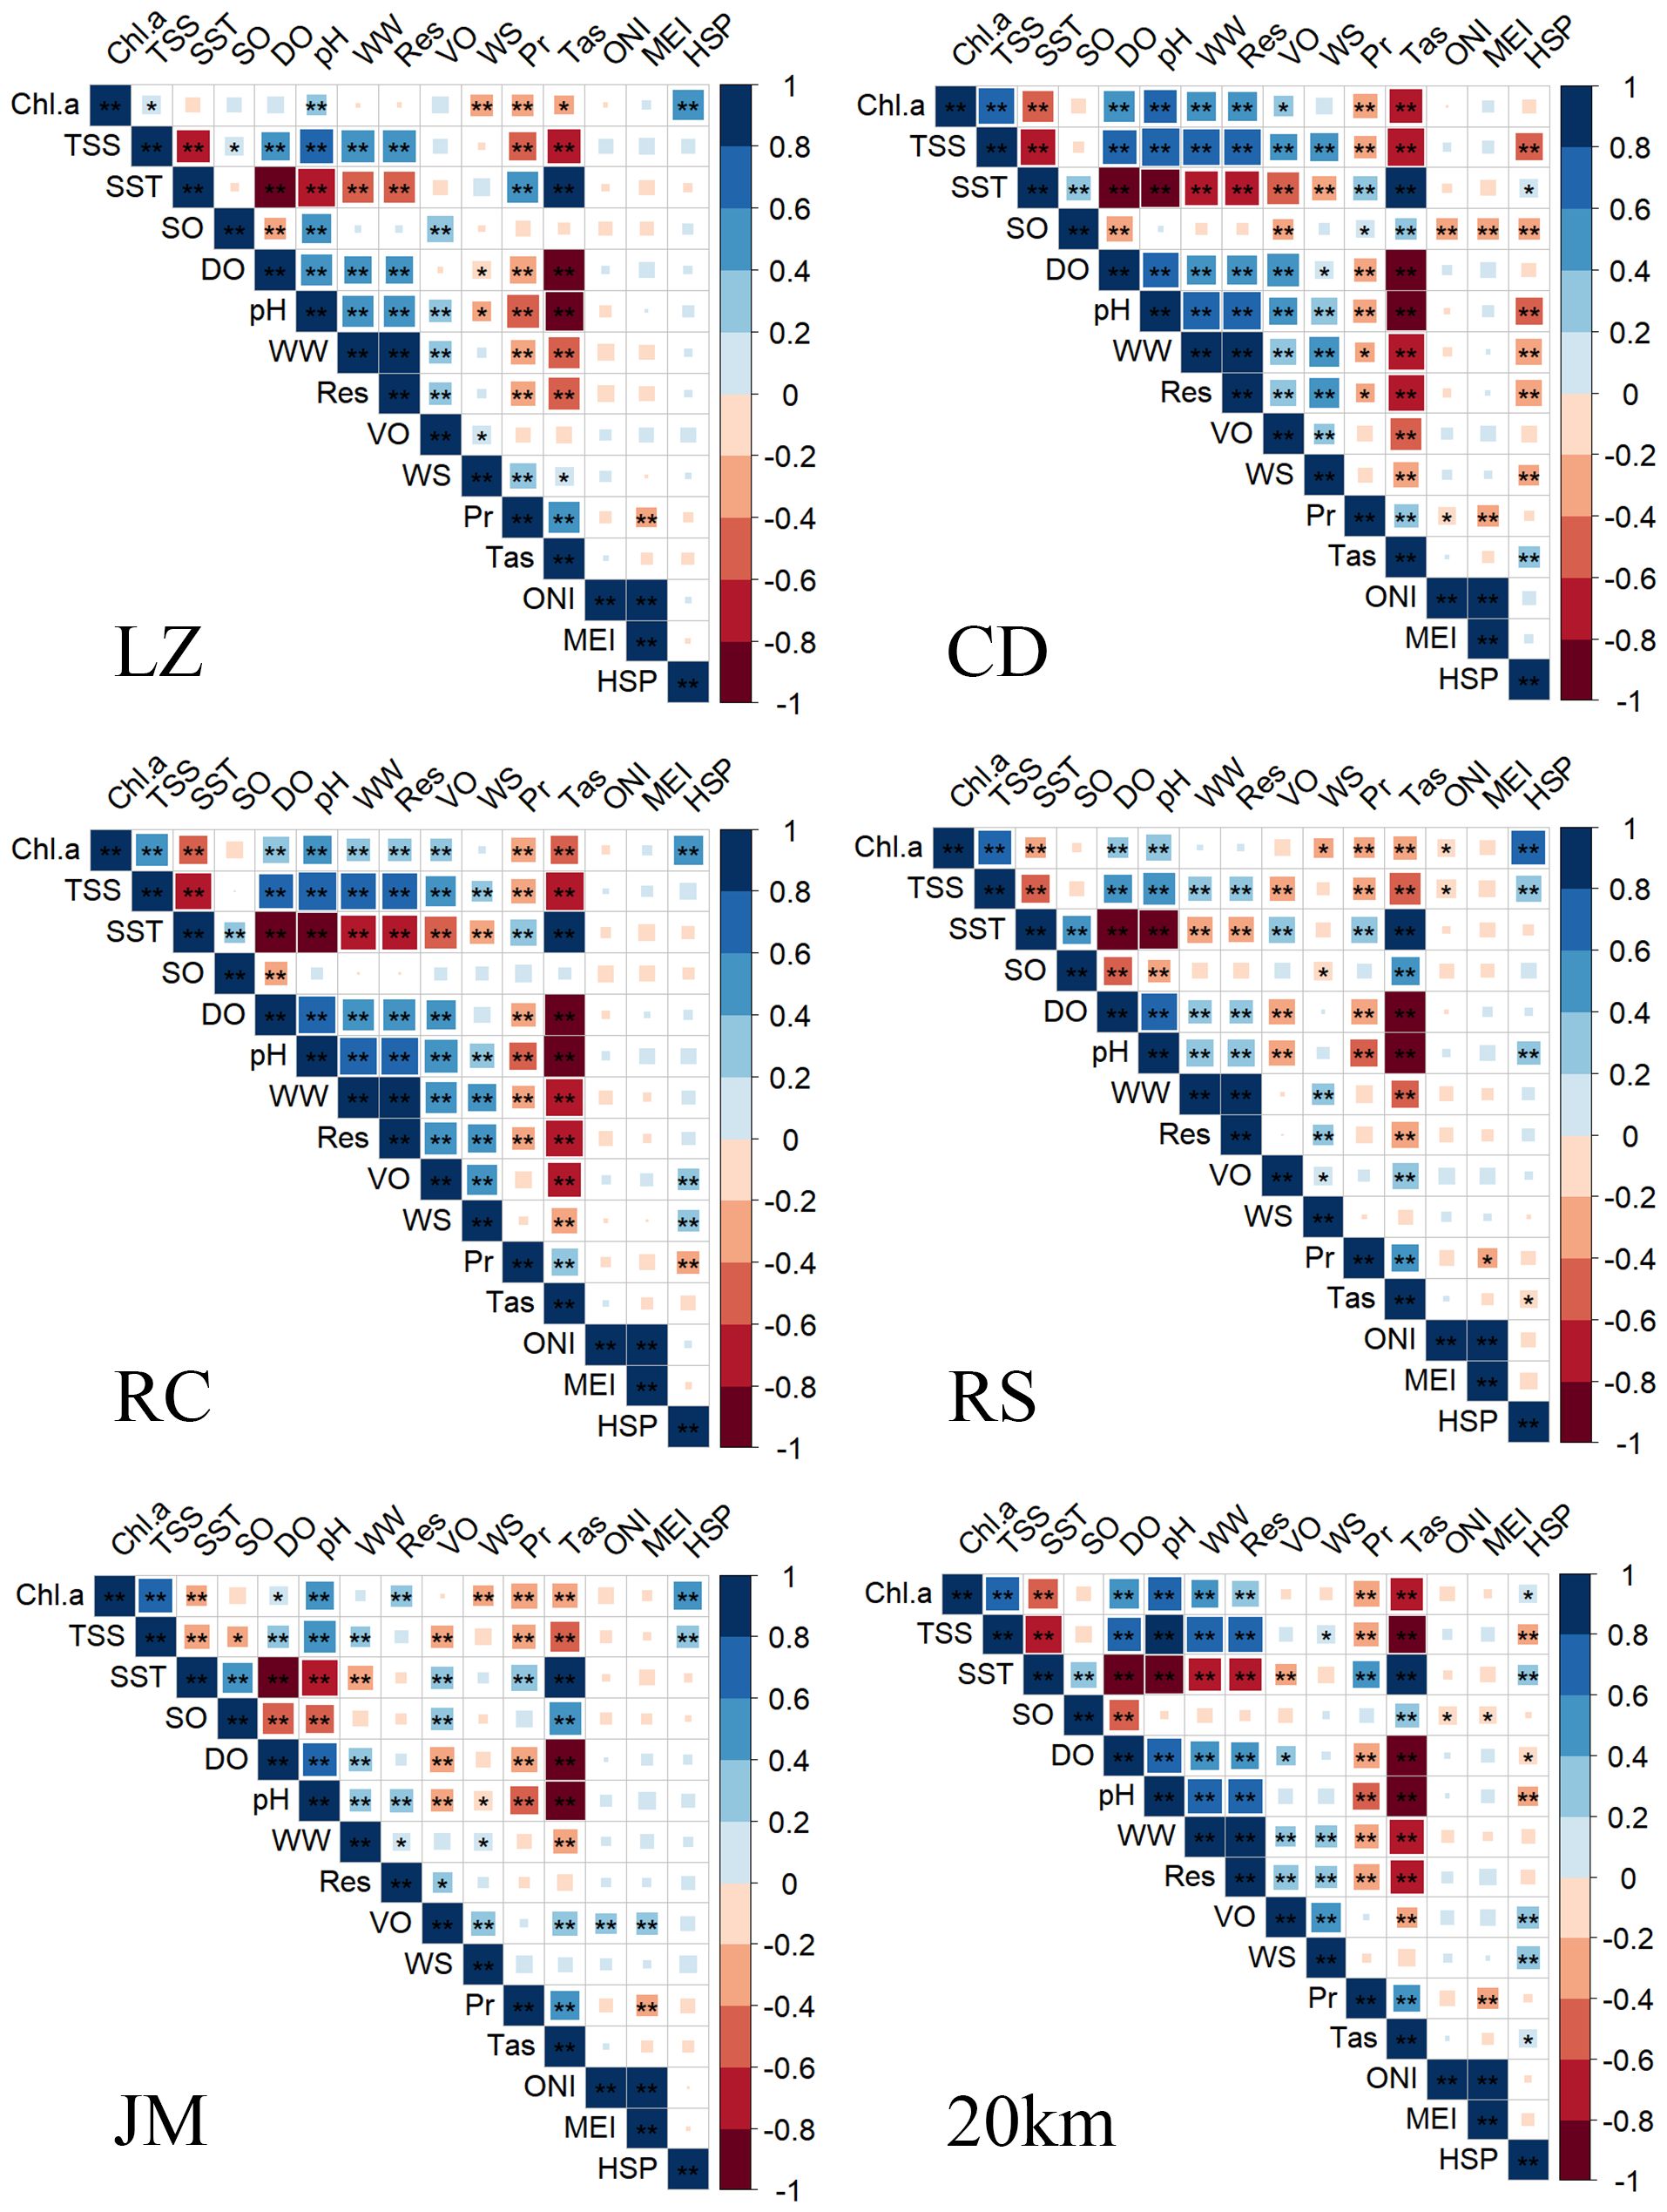
Figure 9 Pearson correlation analysis of time series factors and ONI, MEI, HSP in each regions. * Correlation is significant at the 0.05 level. ** Correlation is significant at the 0.01 level.
According to Pearson’s correlation analysis, HSP is moderately positively correlated with Chl-a, TSS, and pH, weakly negatively correlated with WW, Res, WS, and SO, weakly positively correlated with Tas, and very weakly correlated with SST. The result indicated that suitability was mainly affected by Chl-a, TSS, and pH.
Although the analysis showed no direct correlation between HSP and climate indices, research indicated that climate events could impact suitability through factors like SST, wind speed (Liu et al., 2014), Pr, and Chl-a (Liu et al., 2014; Liu et al., 2020a). In this study, the MEI index was weakly negatively correlated with SO and Pr, only weakly negatively correlated with Pr in LZ. The ONI index was weakly negatively correlated with SO and showed a weaker negative correlation with Pr. The MEI index had a stronger correlation with each factor than the ONI index. It could serve as a better standard for determining whether suitability was affected by climate events.
Based on the above correlation analysis, the ENSO could cause more extreme changes in Pr. ENSO typically matures in winter and effects on subsequent summer precipitation in eastern China (Liu, 2021; Liu et al., 2024c). The difference between the suitability of Shandong marine aquaculture in El Niño and La Niña years (Figure 6B) reflects the asymmetry of their effects on precipitation (Liu et al., 2024c). Compared with La Niña, El Niño had a more noticeable impact on precipitation in Shandong (Guo et al., 2017).
Pr was weakly or more associated with all water quality factors except SO. The study showed that the increase in precipitation would increase the dissolved inorganic nitrogen and inorganic phosphorus of semi-enclosed bay seawater through the way of atmospheric settlement and runoff input, thereby causing an increase in Chl-a (Han et al., 2023; Xiao et al., 2024) and TSS (Meng et al., 2022; Ma et al., 2024), the Pr negatively associated with Chl-a and TSS concentration, which may result from more summer precipitation diluting Chl-a and TSS in seawater.
Additionally, the increase in freshwater flow caused by precipitation may lead to a rapid decrease in seawater salinity in the short term (Swam et al., 2022); precipitation changes may further lead to other factors affecting the suitability. For example, the correlation between Pr and water quality factors in LZ was small, and the suitability was mainly affected by the Chl-a concentration. The Chl-a concentration remained high and changed less in a year, which was less affected by ENSO and had high stability.
According to the correlation analysis, Figure 10 showed a boxplot analysis of time series factors and the HSP The graph visually showed the distribution of outliers of time series factors; among them, SST, DO, Res, and pH, Tas had no outliers. SO, WW, VO, and WS had fewer outliers and differences across regions, and ENSO was less likely to cause outlier changes by larger spatiotemporal scales. Chl-a, TSS, and Pr had more outliers in all regions, and they strongly correlate with the HSP and the climate index. This suggested that the appearance of outliers may be due to ENSO, Chl-a had many low values, TSS had many high values, Pr had many high values, and HSP declining more, which was consistent with the above correlation.
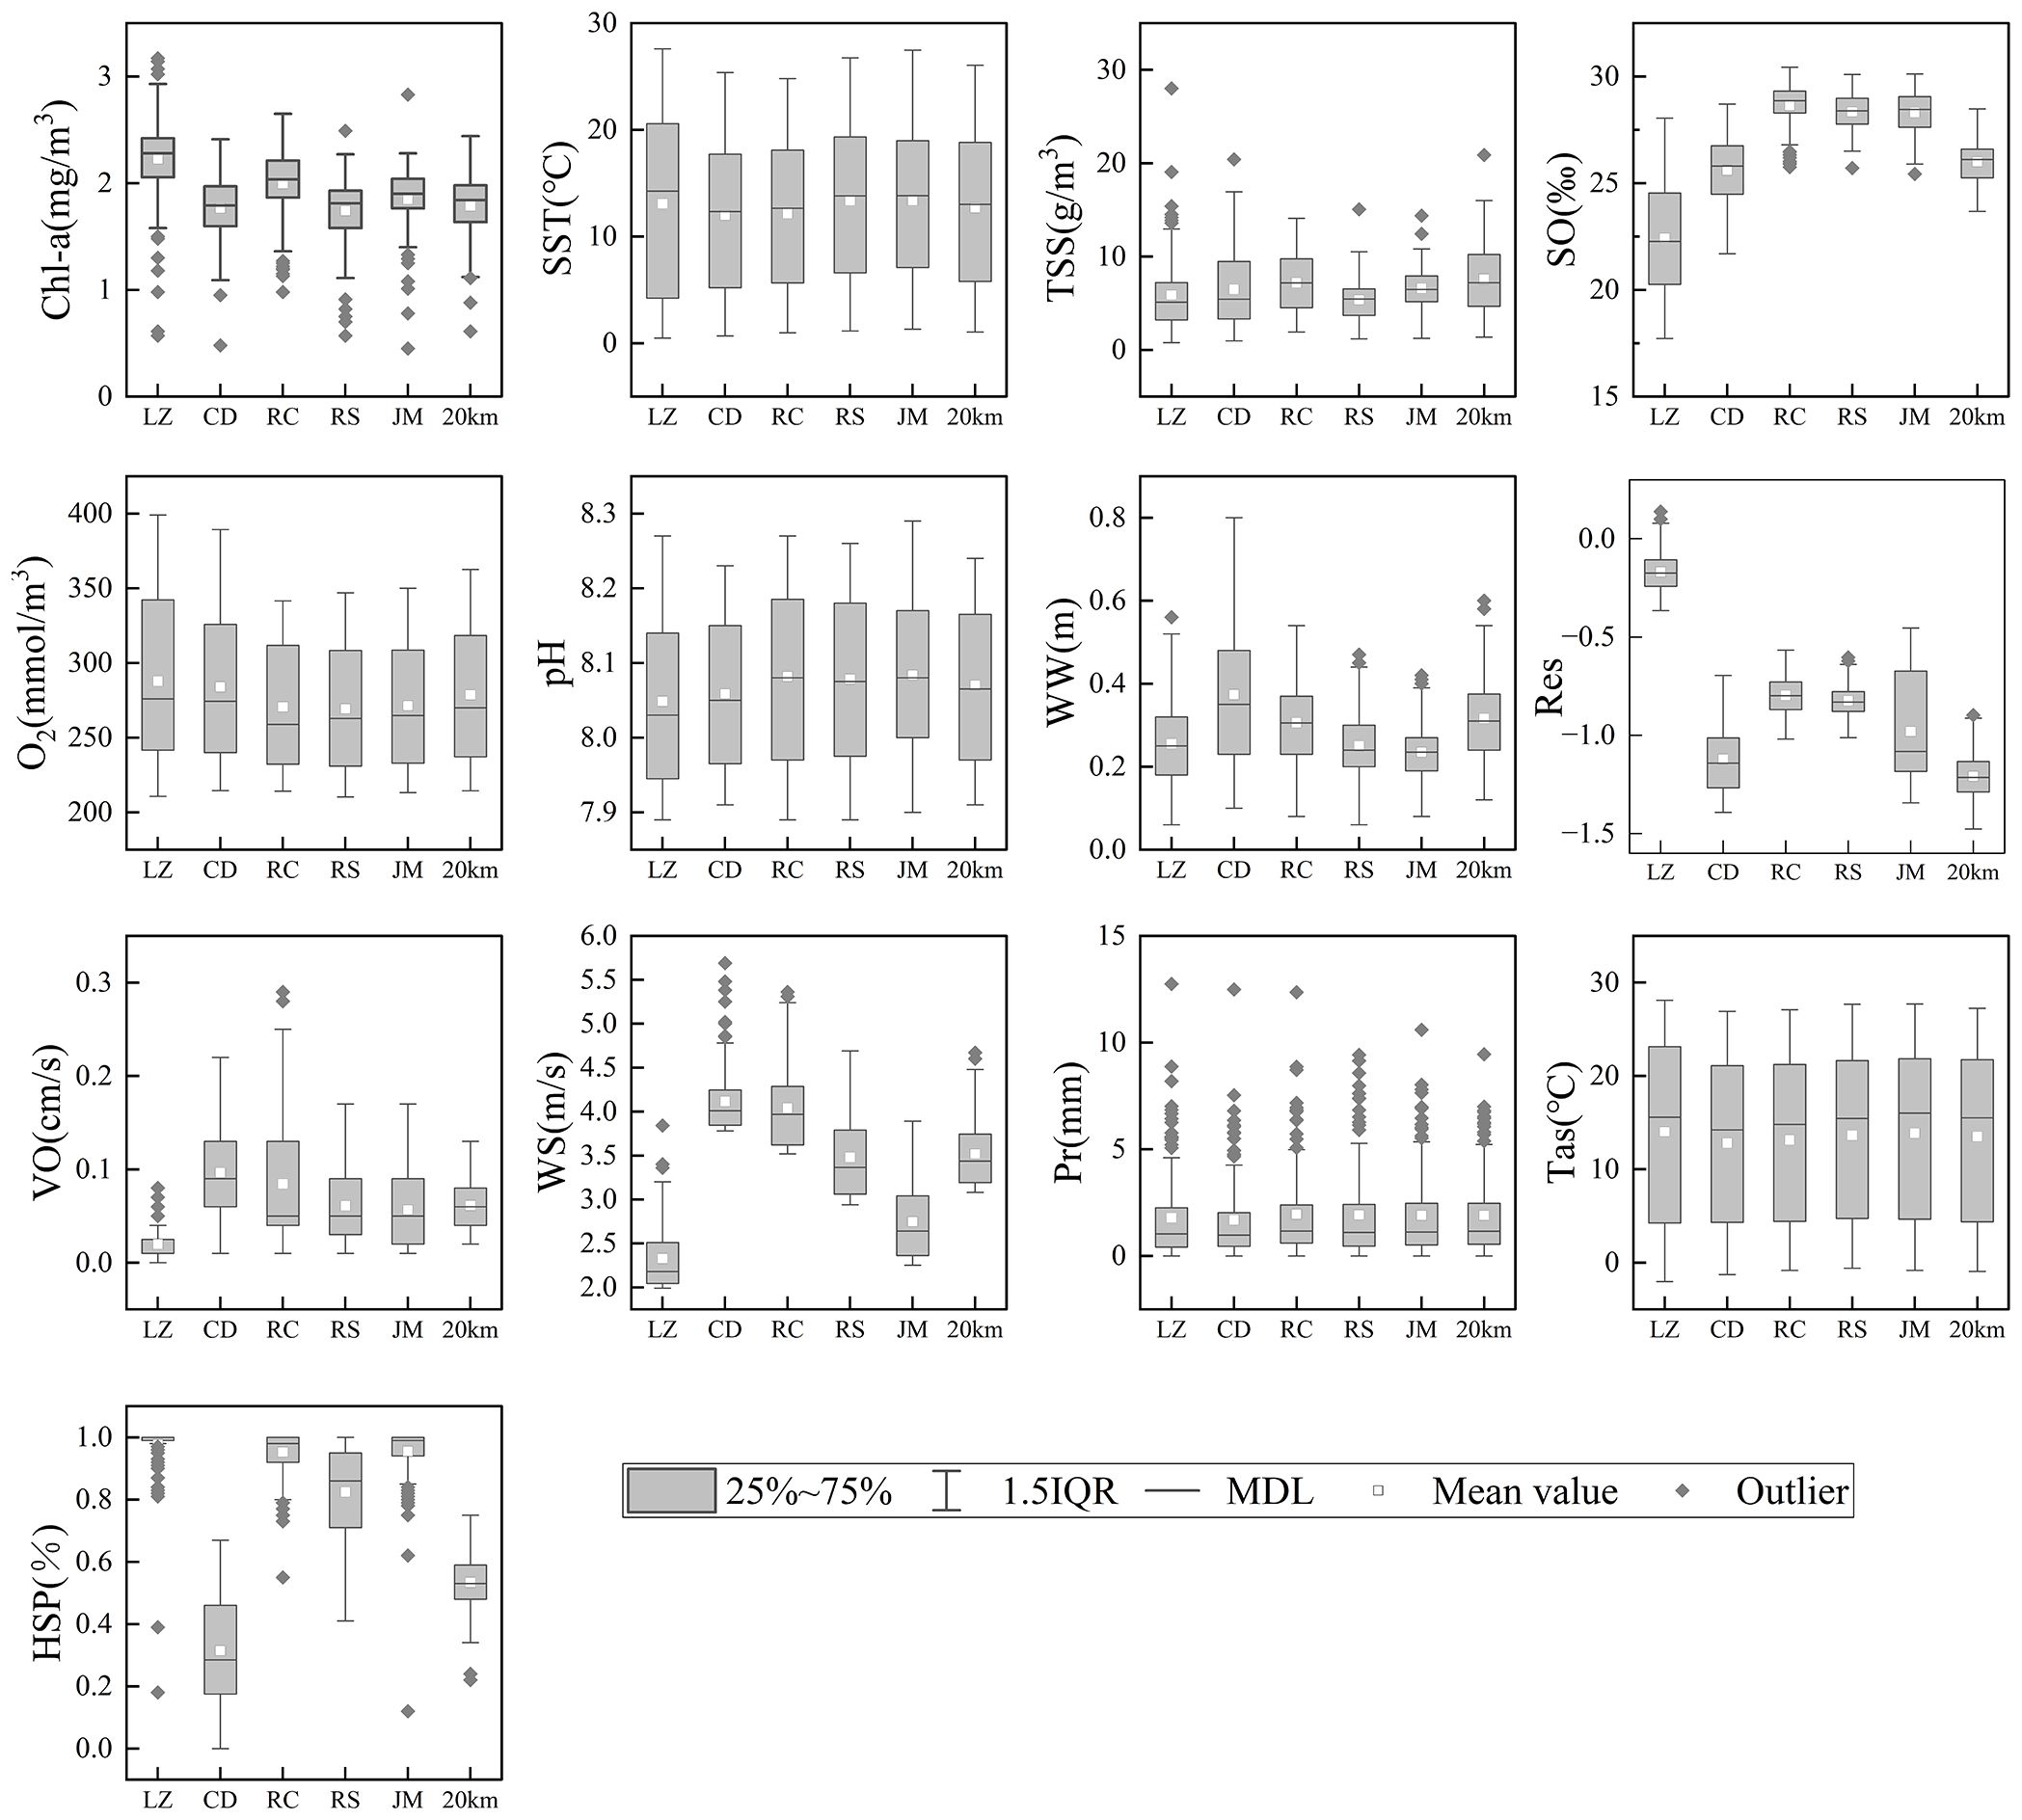
Figure 10 Boxplot of the time series factors and the HSP from May 2011 to December 2022.
El Niño was classified based on the Oceanic Niño Index (ONI) values: weak (+0.5°C to +0.9°C), moderate (+1.0°C to +1.8°C), and high (greater than +1.8°C), represented by shades of red from light to deep. La Niña classifications were similarly based on ONI values: weak (-0.5°C to -0.9°C), moderate (-1.0°C to -1.8°C), and high (less than -1.8°C), represented by shades of blue from light to deep in Figure 11.
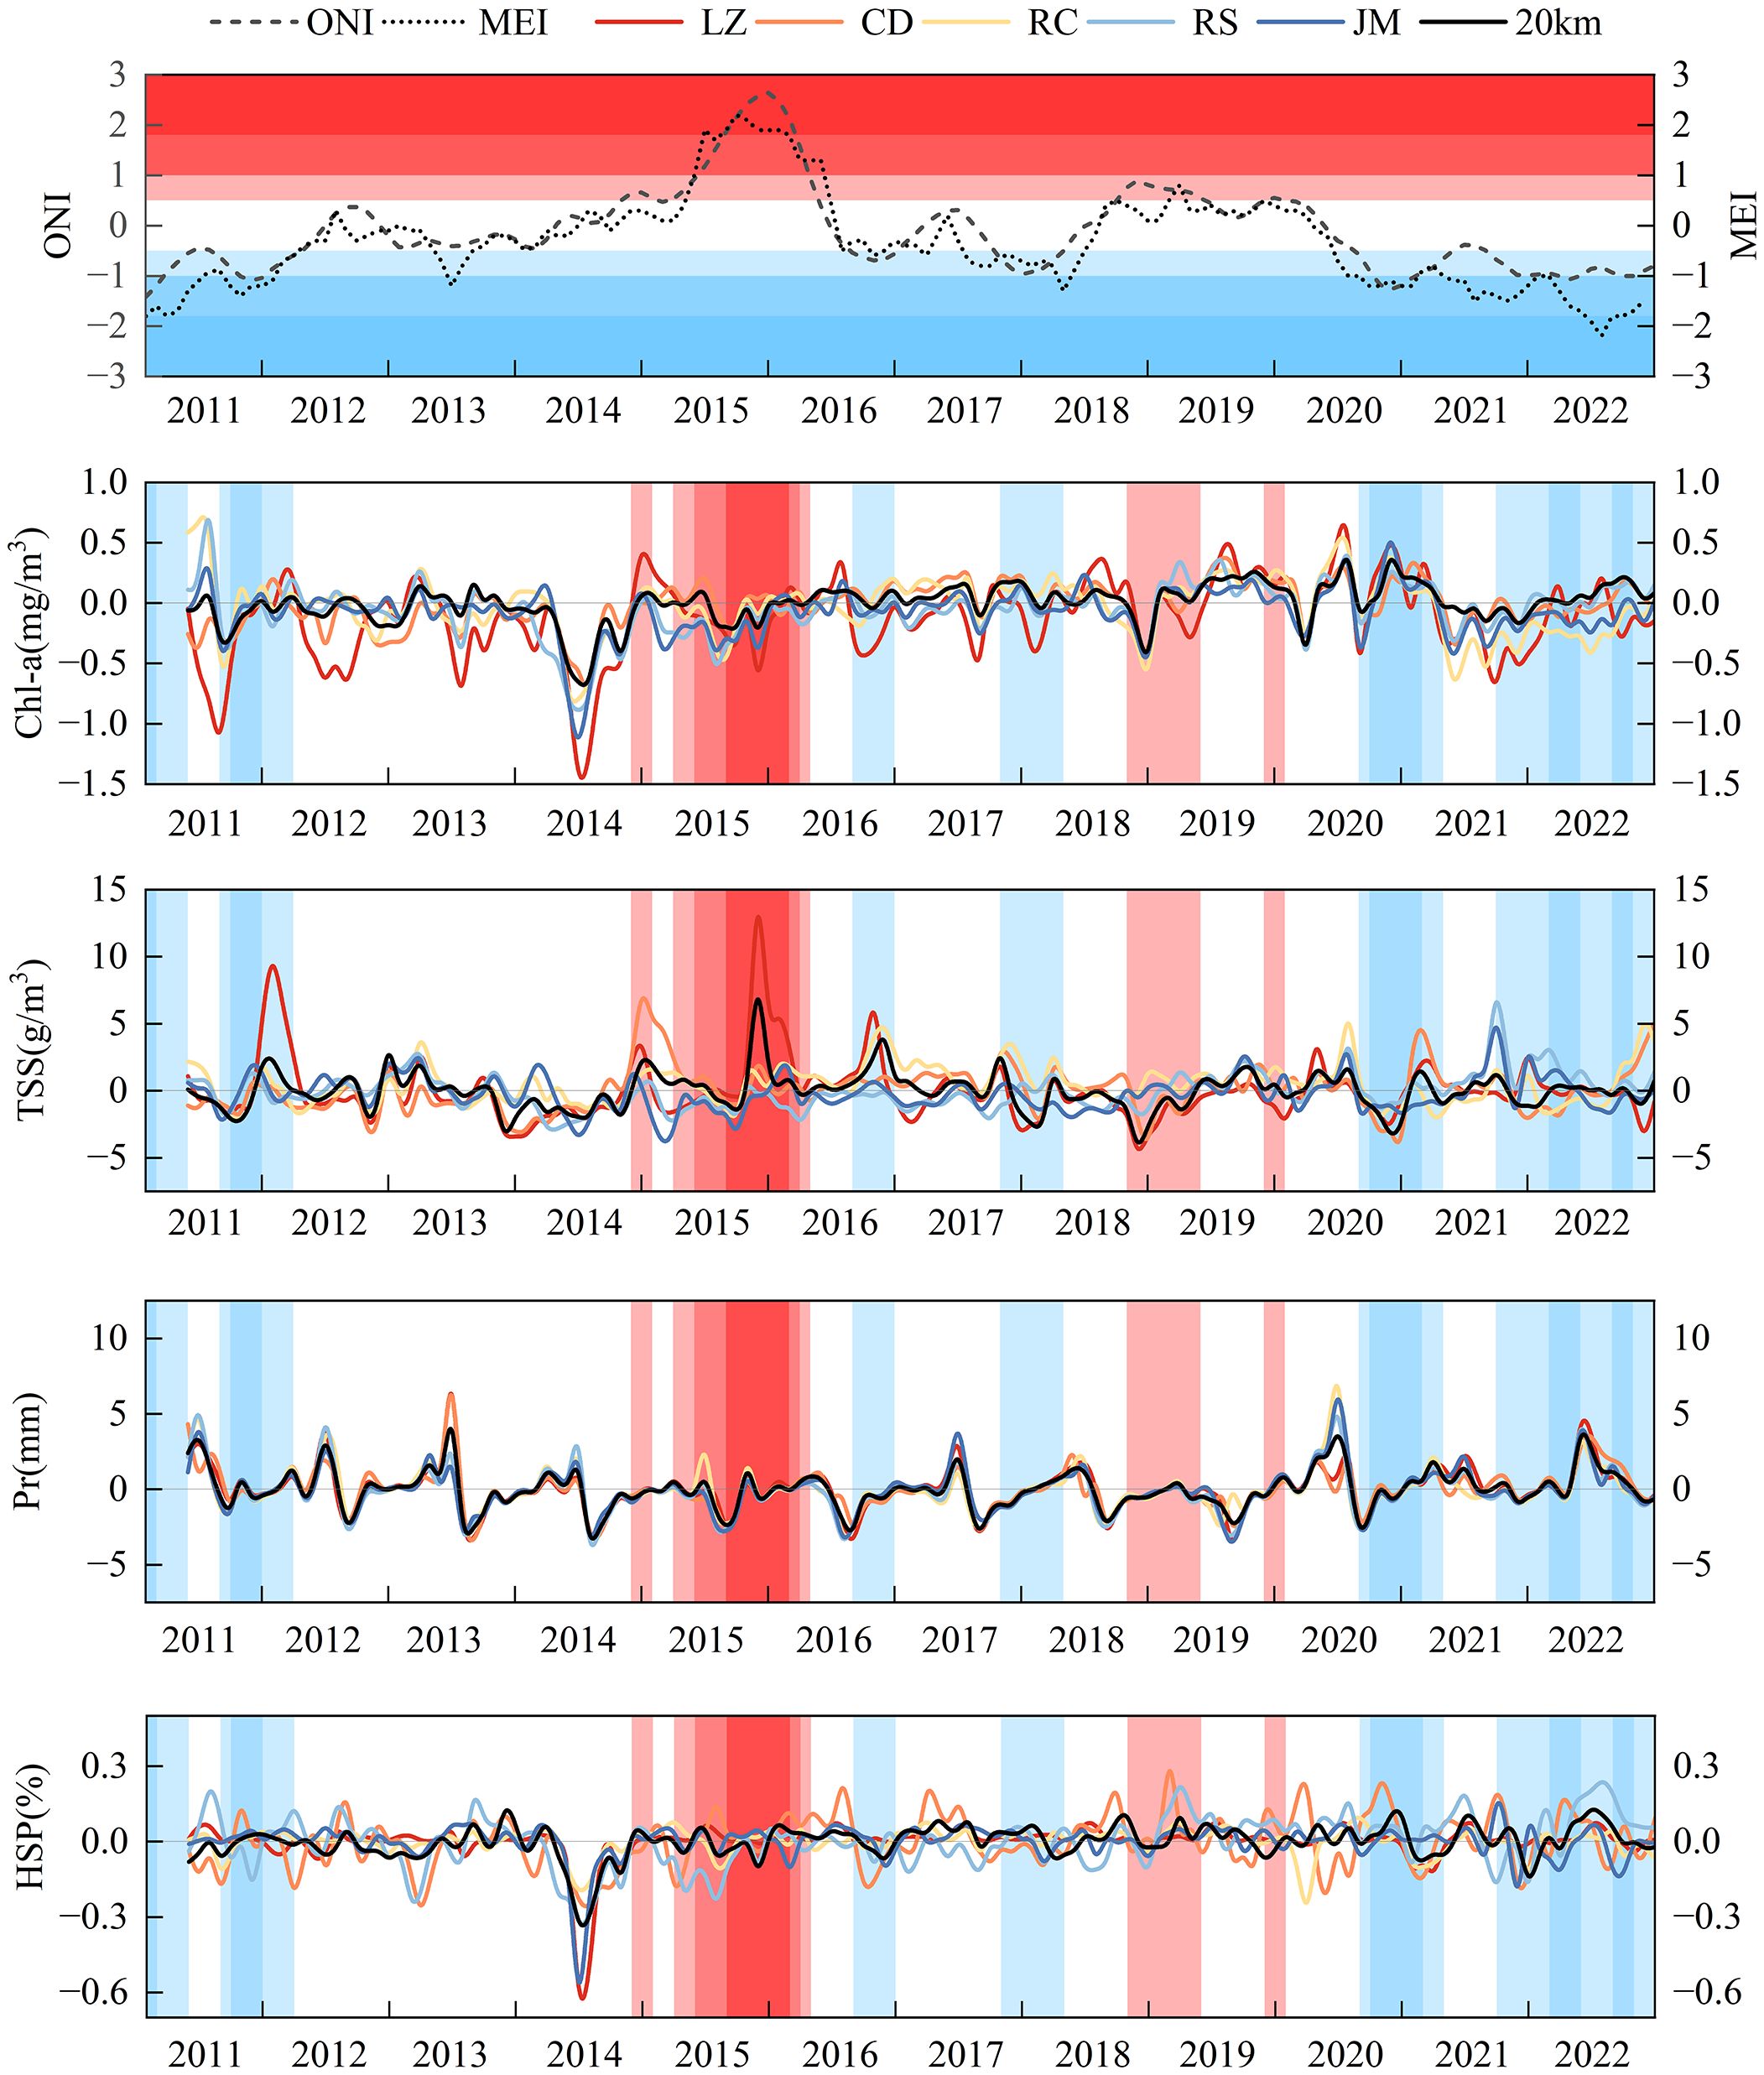
Figure 11 Time series of Chl-a, TSS, Pr, and HSP in different regions between May 2011 and December 2022.
Combining the correlation analysis and the boxplot analysis, we calculated the difference of Chl-a, TSS, Pr, and HSP between the monthly average from May 2011 to December 2022 to contrast the occurrence of outliers with the occurrence ENSO. We observed that the abnormal increase in Pr generally occurred in the summer of the second year following the La Niña event (Wang et al., 2000) in 2011, 2012, 2017, 2020, and 2022. However, Pr did not increase significantly during El Niño events. During the development period of El Niño, Pr decreased in East Asia, whereas Pr increased during the decline period of El Niño (Cao et al., 2017).
Chl-a consistently showed low values in the summer, It had declined in the summer following La Niña events in 2011, 2012, 2018, and 2021, consistent with Pr being affected by climate events. In addition, El Niño also had an impact on Chl-a. During the strong El Niño year of 2015, RS and JM showed low values, with an overall decline in December 2018. The reduction in Chl-a concentration during that period may be due to the resuspension caused by wind and waves (Liu and Wang, 2019) rather than precipitation; During the strong El Niño of 2015, East Asian summer winds weakened (Liren et al., 1997), result in weak resuspension and thus low Chl-a concentration, these two factor have weakly positively correlation.
TSS exhibited outliers during the autumn and winter seasons of the ENSO events, for example, an unusual increase in LZ in 2011 and in different areas in 2016, 2020, and 2022. The mature phase of ENSO typically occurs during the northern winter and is accompanied by the weaker-than-average winter winds along the East Asian coast (Liren et al., 1997). Consequently, the weakened resuspension did not result in an increased TSS concentration, and the Pr did not decrease significantly during this time. Although there was no correlation between the SST and the climate index in this study, SST in the Shandong offshore was strongly negatively associated with TSS and had a moderate negative correlation with Chl-a. The results indicated that the changes of SST will also affect the concentration of Chl-a and TSS, but the specific mechanism still requires further study. We found a sizeable abnormal decrease in Chl-a concentration in the summer of 2014, which led to the reduction of HSP, this phenomenon may be due to data processing and still needs further research.
Due to the favorable water quality and hydrological conditions, the Shandong offshore maintained a high suitability in approximately 50% of the region throughout the year. LZ, RC, and JM exhibit exceptionally high suitability (over 80%), making them ideal for developing Pacific oyster marine aquaculture. It was recommended to increase the aquaculture scale in high-suitability areas (LZ, RC, and JM) while reducing it in low-suitability areas (CD, RS) to avoid issues such as the declining sustainability of existing marine aquaculture environments (Forrest et al., 2009; Wang et al., 2018; Gao et al., 2020; Brito et al., 2023; Huang et al., 2023). Simultaneously, it is crucial to closely monitoring factors related to suitability, such as Chl-a, TSS, and pH. Furthermore, based on the results of a suitability evaluation and monthly variations, it was possible to relocate aquaculture operations across multiple marine regions. For instance, Pacific oyster marine aquaculture could be conducted in CD during spring, while RS can be avoided during summer.
The existing RC, RS, and JM marine aquaculture areas are susceptible to ENSO. Therefore, during the summer following El Niño and La Niña events, it is necessary to monitor abnormal weather conditions, especially abnormal rainfall, and develop appropriate response measures, such as reducing the density and scale of Pacific oyster marine aquaculture. Moreover, in JM and RC, which have high suitability but are susceptible to climate events, Pacific oyster could be integrated into an Integrated Multi-Trophic Aquaculture (IMTA) system (Shpigel and Blaylock, 1991; Jiang et al., 2013). This approach could enhance the carrying capacity and stability of the marine aquaculture ecosystem while also adapting to climate change (Ahmed and Glaser, 2016) and ensuring system sustainability (Khanjani et al., 2022).
Future climate change may increase the suitability in open sea, providing opportunities for the Pacific oyster marine aquaculture. Specifically, the spring in CD exhibits higher suitability, with hydrological conditions similar to those in winter (Figure 4B), which may contribute to higher growth rates (Lee et al., 2021). In the future, marine aquaculture in open sea areas with increased suitability could help mitigate the impacts of climate change on bivalve aquaculture systems (Walker et al., 2006; Froehlich et al., 2018). One of the challenges open sea areas faces is their susceptibility to meteorological conditions, which can impact marine aquaculture infrastructure. Pacific oyster’s marine aquaculture can be integrated with future offshore structures and platforms, such as offshore wind farms (Buck et al., 2008; Benassai et al., 2014; Di Tullio et al., 2018) and oil drilling platforms (Ogle et al., 1977). These developments have created new opportunities for Pacific oyster marine aquaculture. Some research is underway to explore integrating physical and biological conditions for the site selection of these co-located systems.
Furthermore, from 2070 to 2100 under the SSP5–8.5 scenario, except for LZ, the suitability for aquaculture significantly decreased, indicating that suitability did not exhibit a continuous upward trend and necessitates ongoing assessment. LZ maintained a stable suitability throughout the ENSO and future climate change scenarios, making it suitable for long-term marine aquaculture of Pacific oyster.
This study employed the Analytic Hierarchy Process (AHP) in conjunction with Geographic Information Systems (GIS) and the Maximum Entropy Model (MaxEnt) to construct an evaluation model for assessing the suitability of Pacific oyster marine aquaculture. The model incorporated various factors, including water quality (Chl-a, TSS, SST, SO, DO, pH), hydrology (bathymetry, VO, WW), climate and meteorology (WS, Pr, Tas, Bioclimatic), and socioeconomic factors (distance to city, pier, WWTPs). The resulting suitability distribution map revealed that 49% of the area was highly suitable (scores of 6–8), while 51% was moderately suitable (scores of 4–5), with higher suitability observed during the spring and autumn seasons. In the offshore areas, the inner bays (LZ, RC, JM) exhibited exceptionally high suitability (over 80%), while the open sea (CD, RS) farther from the coast showed lower suitability with noticeable monthly variations. The spatial and temporal distribution of suitability aligned with the actual Pacific oyster marine aquaculture areas in the coastal waters of Shandong Province, and the high suitability regions correspond to the actual distribution areas of marine aquaculture rafts, validating the accuracy of the evaluation model.
This study revealed that El Niño-Southern Oscillation (ENSO) decreases suitability during the summer in the southern part of Shandong, including RC, RS, and JM. Correlation analysis indicated that Chl-a, TSS, and pH are the primary factors influencing the suitability of marine aquaculture in the coastal waters of Shandong Province, while Pr and SO exhibit strong correlations with climate indices. ENSO affected Pr in Shandong, subsequently influencing water quality factors such as Chl-a and TSS offshore and altering the suitability of Pacific oyster marine aquaculture. Overall, the suitability for Pacific oyster marine aquaculture in the Shandong offshore is projected to increase with future climate change, but the increase is more pronounced in the northern regions. Finally, considering the temporal and spatial variations in the suitability of Pacific oyster marine aquaculture in Shandong offshore and their susceptibility to climate influences, management recommendations were proposed for current and future Pacific oyster marine aquaculture development.
The original contributions presented in the study are included in the article/Supplementary Material. Further inquiries can be directed to the corresponding author.
CL: Data curation, Formal analysis, Validation, Visualization, Methodology, Writing – original draft. YL: Conceptualization, Data curation, Supervision, Funding acquisition, Validation, Investigation, Visualization, Methodology, Project administration, Writing – review & editing. ZY: Data curation, Writing – review & editing. ZS: Data curation, Writing – review & editing. LQ: Writing – review & editing. S-IS: Writing – review & editing, Methodology.
The author(s) declare financial support was received for the research, authorship, and/or publication of this article. This work was financially supported by the Natural Science Foundation of China (No. 41976210).
The authors declare that the research was conducted in the absence of any commercial or financial relationships that could be construed as a potential conflict of interest.
The author(s) declared that they were an editorial board member of Frontiers, at the time of submission. This had no impact on the peer review process and the final decision.
All claims expressed in this article are solely those of the authors and do not necessarily represent those of their affiliated organizations, or those of the publisher, the editors and the reviewers. Any product that may be evaluated in this article, or claim that may be made by its manufacturer, is not guaranteed or endorsed by the publisher.
The Supplementary Material for this article can be found online at: https://www.frontiersin.org/articles/10.3389/fmars.2024.1402528/full#supplementary-material
Ahmed N., Glaser M. (2016). Can “Integrated Multi-Trophic Aquaculture (IMTA)” adapt to climate change in coastal Bangladesh? Ocean Coast. Manage. 132, 120–131. doi: 10.1016/j.ocecoaman.2016.08.017
Aura C. M., Saitoh S.-I., Liu Y., Hirawake T., Baba K., Yoshida T. (2016). Implications of marine environment change on Japanese scallop (Mizuhopecten yessoensis) aquaculture suitability: a comparative study in Funka and Mutsu Bays, Japan. Aquaculture Res. 47, 2164–2182. doi: 10.1111/are.12670
Bacher C., Grant J., Hawkins A. J. S., Fang J., Zhu M., Besnard M. (2003). Modelling the effect of food depletion on scallop growth in Sungo Bay (China). Aquat. Living Resour. 16, 10–24. doi: 10.1016/S0990–7440(03)00003–2
Barata I. M., Uhlig V. M., Cortês L. G., Fath F., Griffiths R. A. (2024). Overcoming the lack of distribution data for range-restricted habitat specialist frogs. Austral Ecol. 49, e13522. doi: 10.1111/aec.13522
Barillé L., Le Bris A., Goulletquer P., Thomas Y., Glize P., Kane F., et al. (2020). Biological, socio-economic, and administrative opportunities and challenges to moving aquaculture offshore for small French oyster-farming companies. Aquaculture 521, 735045. doi: 10.1016/j.aquaculture.2020.735045
Benassai G., Mariani P., Stenberg C., Christoffersen M. (2014). A Sustainability Index of potential co-location of offshore wind farms and open water aquaculture. Ocean Coast. Manage. 95, 213–218. doi: 10.1016/j.ocecoaman.2014.04.007
Beniston M., Stephenson D. B., Christensen O. B., Ferro C. A. T., Frei C., Goyette S., et al. (2007). Future extreme events in European climate: an exploration of regional climate model projections. Climatic Change 81, 71–95. doi: 10.1007/s10584–006-9226-z
Brigolin D., Porporato E. M. D., Prioli G., Pastres R. (2017). Making space for shellfish farming along the Adriatic coast. ICES J. Mar. Sci. 74, 1540–1551. doi: 10.1093/icesjms/fsx018
Brito A. C., Pereira H., Picado A., Cruz J., Cereja R., Biguino B., et al. (2023). Increased oyster aquaculture in the Sado Estuary (Portugal): How to ensure ecosystem sustainability? Sci. Total Environ. 855, 158898. doi: 10.1016/j.scitotenv.2022.158898
Buck B. H., Krause G., Michler-Cieluch T., Brenner M., Buchholz C. M., Busch J. A., et al. (2008). Meeting the quest for spatial efficiency: progress and prospects of extensive aquaculture within offshore wind farms. Helgol Mar. Res. 62, 269–281. doi: 10.1007/s10152–008-0115-x
Cao Q., Hao Z., Yuan F., Su Z., Berndtsson R., Hao J., et al. (2017). Impact of ENSO regimes on developing- and decaying-phase precipitation during rainy season in China. Hydrology Earth System Sci. 21, 5415–5426. doi: 10.5194/hess-21–5415-2017
China Fishery Statistical Yearbook (2023). Bureau of fisheries (Beijing: Chinese Ministry of Agriculture).
Cho Y., Lee W.-C., Hong S., Kim H.-C., Kim J. B. (2012). GIS-based suitable site selection using habitat suitability index for oyster farms in Geoje-Hansan Bay, Korea. Ocean Coast. Manage. 56, 10–16. doi: 10.1016/j.ocecoaman.2011.10.009
Crassostrea gigas (Thunberg, 1793) in GBIF Secretariat (2023) GBIF backbone taxonomy. Available online at: https://doi.org/10.15468/39omei (Accessed May 5, 2024).
Di Tullio G. R., Mariani P., Benassai G., Di Luccio D., Grieco L. (2018). Sustainable use of marine resources through offshore wind and mussel farm co-location. Ecol. Model. 367, 34–41. doi: 10.1016/j.ecolmodel.2017.10.012
Diaz R. J. (2001). Overview of hypoxia around the world. J. Environ. Quality. 30, 275–281. doi: 10.2134/jeq2001.302275x
Ehalt Macedo H., Lehner B., Nicell J., Grill G., Li J., Limtong A., et al. (2022). Distribution and characteristics of wastewater treatment plants within the global river network. Earth System Sci. Data 14, 559–577. doi: 10.5194/essd-14–559-2022
Fang E., Li W., Yu J. (2007). Sustainable use of live oyster reef in bohai gulf. Modern Fishery Inf. 11), 12–14. doi: 10.3969/j.issn.1004–8340.2007.11.003
FAO (2022). “The state of world fisheries and aquaculture 2022,” in Towards blue transformation (FAO, Rome). doi: 10.4060/cc046len
Forrest B. M., Keeley N. B., Hopkins G. A., Webb S. C., Clement D. M. (2009). Bivalve aquaculture in estuaries: Review and synthesis of oyster cultivation effects. Aquaculture 298, 1–15. doi: 10.1016/j.aquaculture.2009.09.032
Froehlich H. E., Gentry R. R., Halpern B. S. (2018). Global change in marine aquaculture production potential under climate change. Nat. Ecol. Evol. 2, 1745–1750. doi: 10.1038/s41559–018-0669–1
Frölicher T. L., Fischer E. M., Gruber N. (2018). Marine heatwaves under global warming. Nature 560, 360–364. doi: 10.1038/s41586–018-0383–9
Gao Y., Fang J., Lin F., Li F., Li W., Wang X., et al. (2020). Simulation of oyster ecological carrying capacity in Sanggou Bay in the ecosystem context. Aquacult Int. 28, 2059–2079. doi: 10.1007/s10499–020-00576–3
Gong P., Chen B., Li X., Liu H., Wang J., Bai Y., et al. (2020). Mapping essential urban land use categories in China (EULUC-China): preliminary results for 2018. Sci. Bull. 65, 182–187. doi: 10.1016/j.scib.2019.12.007
Goseberg N., Chambers M. D., Heasman K., Fredriksson D., Fredheim A., Schlurmann T. (2017). ““Technological approaches to longline- and cage-based aquaculture in open ocean environments,”,” in Aquaculture perspective of multi-use sites in the open ocean. Eds. Buck B. H., Langan R. (Springer International Publishing, Cham), 71–95. doi: 10.1007/978–3-319–51159-7_3
Green T. J., Siboni N., King W. L., Labbate M., Seymour J. R., Raftos D. (2019). Simulated marine heat wave alters abundance and structure of vibrio populations associated with the pacific oyster resulting in a mass mortality event. Microb. Ecol. 77, 736–747. doi: 10.1007/s00248–018-1242–9
Gu Y., Qi D., Ge Y., Yu R., Zhang R. (2005). Ecological evaluation and conservation of oyster reefs in Xiaomiaohong tidal channel in Jiangsu Coast. Mar. Sci. 03), 42–47. doi: 10.3969/j.issn.1000–3096.2005.03.010
Guo F., Bi W., Guo F., Wang J. (2017). Interannual climate variabillity in shandong and its relationship with ENSO. Oceanologia Limnologia Sin. 48, 465–474. doi: 10.11693/hyhz20161100266
Han H., Xiao R., Gao G., Yin B., Liang S., lv X. (2023). Influence of a heavy rainfall event on nutrients and phytoplankton dynamics in a well-mixed semi-enclosed bay. J. Hydrology 617, 128932. doi: 10.1016/j.jhydrol.2022.128932
Hernandez P. A., Graham C. H., Master L. L., Albert D. L. (2006). The effect of sample size and species characteristics on performance of different species distribution modeling methods. Ecography 29, 773–785. doi: 10.1111/j.0906–7590.2006.04700.x
Herrera-Cervantes H., Lluch-Cota S. E., Cortés-Ramos J., Farfán L., Morales-Aspeitia R. (2020). Interannual variability of surface satellite-derived chlorophyll concentration in the bay of La Paz, Mexico, during 2003–2018 period: The ENSO signature. Cont. Shelf Res. 209, 104254. doi: 10.1016/j.csr.2020.104254
Hong X., Cheng J., Li Q., Wu S., Yan J., Shi H. (2023). An experimental study on dissipating effect of double-layer oyster reefs in Binzhou coastal seawater. Trans. Oceanology Limnology 45, 106–111. doi: 10.13984/j.cnki.cn37–1141.2023.04.014
Hu W., Zhang D., Chen B., Liu X., Ye X., Jiang Q., et al. (2021). Mapping the seagrass conservation and restoration priorities: Coupling habitat suitability and anthropogenic pressures. Ecol. Indicators. 129, 107960. doi: 10.1016/j.ecolind.2021.107960
Huang Y., Li Z., Sun C., Feng Z., Li J., Wei D., et al. (2023). Using the roughness height and manning number in hydrodynamic model to estimate the impact of intensive oyster aquaculture by floating & fixed rafts on water exchange with an application in Qinzhou Bay, China. Ecol. Model. 476, 110230. doi: 10.1016/j.ecolmodel.2022.110230
Hughes C., King J. W. (2024). Maximum entropy modelling to identify optimal locations for an IMTA system comprising Sparus aurata, Mytilus galloprovincialis and Ulva rigida on Europe’s Atlantic coastline. Aquat. Living Resour. 37, 4. doi: 10.1051/alr/2024002
Jiang B., Boss E., Kiffney T., Hesketh G., Bourdin G., Fan D., et al. (2022). Oyster aquaculture site selection using high-resolution remote sensing: A case study in the gulf of maine, United States. Front. Mar. Sci. 9. doi: 10.3389/fmars.2022.802438
Jiang Z., Wang G., Fang J., Mao Y. (2013). Growth and food sources of Pacific oyster Crassostrea gigas integrated culture with Sea bass Lateolabrax japonicus in Ailian Bay, China. Aquacult Int. 21, 45–52. doi: 10.1007/s10499–012-9531–7
Karger D. N., Conrad O., Böhner J., Kawohl T., Kreft H., Soria-Auza R. W., et al. (2017). Climatologies at high resolution for the earth’s land surface areas. Sci. Data. 4, 170122. doi: 10.1038/sdata.2017.122
Khanjani M. H., Zahedi S., Mohammadi A. (2022). Integrated multitrophic aquaculture (IMTA) as an environmentally friendly system for sustainable aquaculture: functionality, species, and application of biofloc technology (BFT). Environ. Sci. pollut. Res. 29, 67513–67531. doi: 10.1007/s11356–022-22371–8
Ko G. W. K., Dineshram R., Campanati C., Chan V. B. S., Havenhand J., Thiyagarajan V. (2014). Interactive effects of ocean acidification, elevated temperature, and reduced salinity on early-life stages of the pacific oyster. Environ. Sci. Technol. 48, 10079–10088. doi: 10.1021/es501611u
Lee Y.-J., Kang H. Y., Lee W. C., Kang C.-K. (2017). Hydrodynamic effects on growth performance of the pacific oyster crassostrea gigas cultured in suspension in a temperate bay on the coast of korea. Estuaries Coasts 40, 1551–1565. doi: 10.1007/s12237–017-0252-z
Lee J.-Y., Marotzke J., Bala G., Long C., Corti S., Dunne J. P., et al. (2021)Future global climate: scenario-based projections and near-term informationin Climate change 2021: the physical science basis. Contribution of working group I to the sixth assessment report of the intergovernmental panel on climate change (Cambridge University Press, Cambridge).
Li J., Shang Z., Chen Y., Tian L., Jiang X., Wang F., et al. (2020). Research status and protection suggestions on oyster reef in Bohai Bay. Geological survey Res. 43, 317–333. doi: 10.3969/j.issn.1672–4135.2020.04.003
Li Y., Wolanski E., Zhang H. (2015). What processes control the net currents through shallow straits? A review with application to the Bohai Strait, China. Estuarine Coast. Shelf Sci. 158, 1–11. doi: 10.1016/j.ecss.2015.03.013
Liren J., Sun S., Arpe K., Bengtsson L. (1997). Model study on the interannual variability of Asian winter monsoon and its influence. Adv. Atmos. Sci. 14, 1–22. doi: 10.1007/s00376–997-0039–4
Liu Y. (2021). Application and progress of remote sensing technology in the suitability research of mariculture. J. Fujian Polytechnic Normal Univ. 39, 101–111.
Liu Y., Hu Z.-Z., Wu R., Ding Y., Jha B. (2024c). Evolution of ENSO-related seasonal precipitation anomalies in East Asia: A robustness revisit. Int. J. Climatology 44, 269–285. doi: 10.1002/joc.8327
Liu B., Liu Z., Chen Y., Lu R., Li C., Ma P., et al. (2024a). Potential distribution of Crassostrea sikamea (Amemiy) along coastal China under global climate change. Global Ecol. Conserv. 50, e02843. doi: 10.1016/j.gecco.2024.e02843
Liu B., Liu Z., Li C., Yu H., Wang H. (2024b). Geographical distribution and ecological niche dynamics of Crassostrea sikamea (Amemiy) in China’s coastal regions under climate change. Sci. Total Environ. 920, 171061. doi: 10.1016/j.scitotenv.2024.171061
Liu Y., Saitoh S.-I., Radiarta I. N., Igarashi H., Hirawake T. (2014). Spatiotemporal variations in suitable areas for Japanese scallop aquaculture in the Dalian coastal area from 2003 to 2012. Aquaculture 422–423, 172–183. doi: 10.1016/j.aquaculture.2013.11.033
Liu Y., Saitoh S.-I., Radiarta I. N., Isada T., Hirawake T., Mizuta H., et al. (2013). Improvement of an aquaculture site-selection model for Japanese kelp (Saccharinajaponica) in southern Hokkaido, Japan: an application for the impacts of climate events. ICES J. Mar. Sci. 70, 1460–1470. doi: 10.1093/icesjms/fst108
Liu Y., Tian Y., Saitoh S.-I., Alabia I. D., Mochizuki K.-I. (2020a). Impact of climate Extremes on suitability dynamics for Japanese scallop aquaculture in shandong, China and funka bay, Japan. Sustainability 12, 833. doi: 10.3390/su12030833
Liu L., Wang Z. (2019). Temporal and spatial distributions and formation mechanism of suspended sediment in the coastal area of the Shandong Peninsula. Mar. Sci. 43, 55–65. doi: 10.11759/hykx20190312004
Liu Y., Wang Z., Yang X., Zhang Y., Yang F., Liu B., et al. (2020b). Satellite-based monitoring and statistics for raft and cage aquaculture in China’s offshore waters. Int. J. Appl. Earth Observation Geoinformation 91, 102118. doi: 10.1016/j.jag.2020.102118
Loosanoff V. L., Tommers F. D. (1948). Effect of suspended silt and other substances on rate of feeding of oysters. Science 107, 69–70. doi: 10.1126/science.107.2768.69
Ma Z., Zhao Y., Zhao W., Feng J., Liu Y., Tsou J. Y., et al. (2024). Estimating Total Suspended Matter and Analyzing Influencing Factors in the Pearl River Estuary (China). Journal of Marine Science and Engineering 12, 167. doi: 10.3390/jmse12010167
Meng L., Xing Q., Gao X., Ji D., Qu F., Wang X., et al. (2022). Effects of an episodic storm-induced flooding event on the biogeochemistry of a shallow, highly turbid, semi-enclosed embayment (Laizhou bay, bohai sea). Sustainability 15, 563. doi: 10.3390/su15010563
Mizuta D. D., Silveira N., Fischer C. E., Lemos D. (2012). Interannual variation in commercial oyster (Crassostrea gigas) farming in the sea (Florianópolis, Brazil, 27°44′ S; 48°33′ W) in relation to temperature, chlorophyll a and associated oceanographic conditions. Aquaculture 366–367, 105–114. doi: 10.1016/j.aquaculture.2012.09.011
Nell J. A., Holliday J. E. (1988). Effects of salinity on the growth and survival of Sydney rock oyster (Saccostrea commercialis) and Pacific oyster (Crassostrea gigas) larvae and spat. Aquaculture 68, 39–44. doi: 10.1016/0044–8486(88)90289-X
Ogle J., Ray S. M., Wardle W. J. (1977). The effect of depth on survival and growth of oysters in suspension culture from a petroleum platform off the texas coast. GCR. 6, 31–37. doi: 10.18785/grr.0601.04
Park M.-S., Jung H. C., Lee S., Ahn J.-H., Bae S., Choi J.-K. (2021). The GOCI-II early mission ocean color products in comparison with the GOCI toward the continuity of chollian multi-satellite ocean color data. Korean J. Remote Sens. 37, 1281–1293. doi: 10.7780/kjrs.2021.37.5.2.6
Peoples Government of Shandong Province (2023) Geographical resources. Available online at: http://www.shandong.gov.cn/art/2024/2/18/art_98093_206404.html (Accessed March 14, 2024).
Phillips S. J., Anderson R. P., Schapire R. E. (2006). Maximum entropy modeling of species geographic distributions. Ecol. Modelling. 190, 231–259. doi: 10.1016/j.ecolmodel.2005.03.026
Porporato E. M. D., Pastres R., Brigolin D. (2020). Site suitability for finfish marine aquaculture in the central mediterranean sea. Front. Mar. Sci. 6. doi: 10.3389/fmars.2019.00772
Quan W., An C., Ma C., Huang H., Cheng W., Wang Y., et al. (2012). Biodiversity and community structure of benthic macroinvertebrates on the Xiaomiaohong oyster reef in Jiangsu province, China. Oceanologia Limnologia Sinica. 43, 992–1000. doi: 10.11693/hyhz201205017017
Quan W., Zhang Y., Qi Z., Xu M., Fan R., Wang T., et al. (2022). Distribution and ecological status of natural oyster reefs on the coast of Caofeidian-Leting,Tangshan,Hebei Province. Acta Ecologica Sin. 42, 1142–1152. doi: 10.5846/stxb202005101172
Radiarta I. N., Saitoh S.-I., Miyazono A. (2008). GIS-based multi-criteria evaluation models for identifying suitable sites for Japanese scallop (Mizuhopecten yessoensis) aquaculture in Funka Bay, southwestern Hokkaido, Japan. Aquaculture 284, 127–135. doi: 10.1016/j.aquaculture.2008.07.048
Radiarta I. N., Saitoh S.-I., Yasui H. (2011). Aquaculture site selection for Japanese kelp (Laminaria japonica) in southern Hokkaido, Japan, using satellite remote sensing and GIS-based models. ICES J. Mar. Sci. 68, 773–780. doi: 10.1093/icesjms/fsq163
Ran W., Teng J., Liu Y., Wu D., Hou C., Wang Q., et al. (2018). Microplastic ingestion characteristics in the Pacific oysters collected from the intertidal zone of the Bohai Rim. Mar. Sci. Bull. 37, 583–590. doi: 10.11840/j.issn.1001–6392.2018.05.012
Saaty T. L. (1977). A scaling method for priorities in hierarchical structures. Journal of Mathematical Psychology 15, 234–281. doi: 10.1016/0022-2496(77)90033-5
Saitoh S.-I., Mugo R., Radiarta I. N., Asaga S., Takahashi F., Hirawake T., et al. (2011). Some operational uses of satellite remote sensing and marine GIS for sustainable fisheries and aquaculture. ICES J. Mar. Sci. 68, 687–695. doi: 10.1093/icesjms/fsq190
Shpigel M., Blaylock R. A. (1991). The Pacific oyster, Crassostrea gigas, as a biological filter for a marine fish aquaculture pond. Aquaculture 92, 187–197. doi: 10.1016/0044–8486(91)90020–8
Snyder J., Boss E., Weatherbee R., Thomas A. C., Brady D., Newell C. (2017). Oyster aquaculture site selection using landsat 8-derived sea surface temperature, turbidity, and chlorophyll a. Front. Mar. Sci. 4. doi: 10.3389/fmars.2017.00190
Soley-Guardia M., Alvarado-Serrano D. F., Anderson R. P. (2024). Top ten hazards to avoid when modeling species distributions: a didactic guide of assumptions, problems, and recommendations. Ecography 2024, e06852. doi: 10.1111/ecog.06852
Song X., Gu Y., Zhai F., Li P., Liu P., Liu Z., et al. (2021). Climatology and seasonal variability of satellite-derived chlorophyll a around the Shandong Peninsula. J. Ocean. Limnol. 39, 1222–1244. doi: 10.1007/s00343–020-0249–5
Suedel B. C., Clarke J. U., Wilkens J., Lutz C. H., Clarke D. G. (2015). The effects of a simulated suspended sediment plume on eastern oyster (Crassostrea virginica) survival, growth, and condition. Estuaries Coasts 38, 578–589. doi: 10.1007/s12237–014-9835–0
Swam L. M., Couvillion B., Callam B., La Peyre J. F., La Peyre M. K. (2022). Defining oyster resource zones across coastal Louisiana for restoration and aquaculture. Ocean Coast. Manage. 225, 106178. doi: 10.1016/j.ocecoaman.2022.106178
Tenore K. R., Dunstan W. M. (1973). Comparison of feeding and biodeposition of three bivalves at different food levels. Mar. Biol. 21, 190–195. doi: 10.1007/BF00355249
Terauchi G., Tsujimoto R., Ishizaka J., Nakata H. (2014). Preliminary assessment of eutrophication by remotely sensed chlorophyll-a in Toyama Bay, the Sea of Japan. J. Oceanogr. 70, 175–184. doi: 10.1007/s10872–014-0222-z
Van Der Veer H. W., Cardoso J. F. M. F., van der Meer J. (2006). The estimation of DEB parameters for various Northeast Atlantic bivalve species. J. Sea Res. 56, 107–124. doi: 10.1016/j.seares.2006.03.005
Walker B., Salt D., Reid W. (2006). Resilience thinking: sustaining ecosystems and people in A changing world. Bibliovault OAI repository, the university of chicago press.
Wang B., Cao L., Micheli F., Naylor R. L., Fringer O. B. (2018). The effects of intensive aquaculture on nutrient residence time and transport in a coastal embayment. Environ. Fluid Mech. 18, 1321–1349. doi: 10.1007/s10652–018-9595–7
Wang C., Liu Z., Harris C. K., Wu X., Wang H., Bian C., et al. (2020). The impact of winter storms on sediment transport through a narrow strait, bohai, China. JGR Oceans. 125 (6), e2020JC016069. doi: 10.1029/2020JC016069
Wang Z., Ma Q., Liang S., Liu Y.-A., Liu L., Huang C., et al. (2024). Study on the distribution and habitat suitability of seagrass in the Northern Chinese Seas. Front. Mar. 10. doi: 10.3389/fmars.2023.1297137
Wang T., Wang Q., Shang X., Wang Y., Song W. (2014). The water quality environment analysis of the National special Marine reserve in Tianjin Dashentang oyster reef. Fishery Modernization 41, 47–50. doi: 10.3969/j.issn.1007–9580.2014.06.010
Wang B., Wu R., Fu X. (2000). Pacific–east asian teleconnection: how does ENSO affect east asian climate? J. Climate 13, 1517–1536. doi: 10.1175/1520–0442(2000)013<1517:PEATHD>2.0.CO;2
Wang Y., Xie B., Wan F., Xiao Q., Dai L. (2007). Application of ROC curve analysis in evaluating the performance of alien species’ potential distribution models. Biodiversity Sci. 15, 365. doi: 10.1360/biodiv.060280
Wang Z., Yang X., Liu Y., Lu C. (2018). Extraction of coastal raft cultivation area with heterogeneous water background by thresholding object-based visually salient NDVI from high spatial resolution imagery. Remote Sens. Lett. 9, 839–846. doi: 10.1080/2150704x.2018.1468103
Wang X., Zhang J., Zhong Y., Liu Y., Wu W. (2023). GIS-based spatial suitability assessment for pacific oyster Crassostrea gigas reef restoration: A case study of Laizhou Bay, China. Mar. pollut. Bull. 186, 114416. doi: 10.1016/j.marpolbul.2022.114416
Wolter K., Timlin M. S. (2011). El Niño/Southern Oscillation behaviour since 1871 as diagnosed in an extended multivariate ENSO index (MEI.ext): EL NIÑO/SOUTHERN OSCILLATION BEHAVIOUR SINCE 1871. Int. J. Climatol. 31, 1074–1087. doi: 10.1002/joc.2336
Xiao R., Gao G., Yang D., Su Y., Ding Y., Bi R., et al. (2024). The impact of extreme precipitation on physical and biogeochemical processes regarding with nutrient dynamics in a semi-closed bay. Sci. Total Environ. 906, 167599. doi: 10.1016/j.scitotenv.2023.167599
Xing X., Claustre H., Boss E., Roesler C., Organelli E., Poteau A., et al. (2017). Correction of profiles of in-situ chlorophyll fluorometry for the contribution of fluorescence originating from non-algal matter. Limnology Oceanography: Methods 15, 80–93. doi: 10.1002/lom3.10144
Yang Z., Chen W., Wang X., Liu B., Dong J., Deng Y. (2024). Suitable habitat of the scad fish (Decanters spp.) in Northern South China Sea predicted by MaxEnt model. Regional Stud. Mar. Sci. 69, 103315. doi: 10.1016/j.rsma.2023.103315
Yang J., Dong M., Zhong Y., Xu Q. (2023). Application of maximum entropy model in the prediction of marine biological suitable areas. J. Appl. Oceanography 42, 698–707. doi: 10.3969/J.ISSN.2095–4972.20220801001
Yang Z., Ji Y., Bi N., Lei K., Wang H. (2011). Sediment transport off the Huanghe (Yellow River) delta and in the adjacent Bohai Sea in winter and seasonal comparison. Estuarine Coast. Shelf Sci. 93, 173–181. doi: 10.1016/j.ecss.2010.06.005
Yang B., Zhai S., Li X., Tian J., Li Q., Shan H., et al. (2021). Identification of Vibrio alginolyticus as a causative pathogen associated with mass summer mortality of the Pacific Oyster (Crassostrea gigas) in China. Aquaculture 535, 736363. doi: 10.1016/j.aquaculture.2021.736363
Yati E., Sadiyah L., Satria F., Alabia I. D., Sulma S., Prayogo T., et al. (2024). Spatial distribution models for the four commercial tuna in the sea of maritime continent using multi-sensor remote sensing and maximum entropy. Mar. Environ. Res. 198, 106540. doi: 10.1016/j.marenvres.2024.106540
Yu R., Li Q., Kong L. (2008). Current situation of Pacific oyster seedling cultivation and breeding in northern China. Sci. Fish Farming 6, 3–5. doi: 10.14184/j.cnki.issn1004–843x.2008.06.002
Zhang X., Fan C., Huo Z., Ma P., Li Y., Li J., et al. (2021). A comparative analysis of shell traits among different populations of Crassostrea gigas. Periodical Ocean Uinversity China 51, 1–9. doi: 10.16441/j.cnki.hdxb.20200305
Zhang Z., Qiao F., Guo J., Guo B. (2018). Seasonal changes and driving forces of inflow and outflow through the Bohai Strait. Continental Shelf Res. 154, 1–8. doi: 10.1016/j.csr.2017.12.012
Zhang M., Shi W., Gui F., Zeng X., Xu K., Zhang S. (2023). Study of suitable habitats for Sepiella maindroni in Zhoushan sea areas based on MaxEnt model. South China Fisheries Sci. 19, 22–31. doi: 10.12131/20230080
Zheng X., Zhang H., Li Y., Zou T., Liu X., Xing Q. (2021). The features and mechanisms of the North Shandong Coastal Current: a case study in 2014. J. Oceanogr. 77, 631–646. doi: 10.1007/s10872–021-00597–3
Zhong J., Li Q., Wang T. (2019). Comparison of feeding and metabolism between black-shell strain and wild population of the Pacific oyster (Crassostrea gigas). J. Fisheries China 43, 1038–1047. doi: 10.11964/jfc.20180411248
Keywords: pacific oyster, marine raft aquaculture, suitability evaluation, GIS, remote sensing, ENSO, climate change
Citation: Li C, Liu Y, Yin Z, Si Z, Li Q and Saitoh S-I (2024) Evaluation of the Pacific oyster marine aquaculture suitability in Shandong, China based on GIS and remote sensing. Front. Mar. Sci. 11:1402528. doi: 10.3389/fmars.2024.1402528
Received: 17 March 2024; Accepted: 27 May 2024;
Published: 07 June 2024.
Edited by:
Jingzhen Wang, Beibu Gulf University, ChinaReviewed by:
Daniele Brigolin, Università Iuav di Venezia, ItalyCopyright © 2024 Li, Liu, Yin, Si, Li and Saitoh. This is an open-access article distributed under the terms of the Creative Commons Attribution License (CC BY). The use, distribution or reproduction in other forums is permitted, provided the original author(s) and the copyright owner(s) are credited and that the original publication in this journal is cited, in accordance with accepted academic practice. No use, distribution or reproduction is permitted which does not comply with these terms.
*Correspondence: Yang Liu, WWFuZ2xpdTMxNUBvdWMuZWR1LmNu
Disclaimer: All claims expressed in this article are solely those of the authors and do not necessarily represent those of their affiliated organizations, or those of the publisher, the editors and the reviewers. Any product that may be evaluated in this article or claim that may be made by its manufacturer is not guaranteed or endorsed by the publisher.
Research integrity at Frontiers
Learn more about the work of our research integrity team to safeguard the quality of each article we publish.