
95% of researchers rate our articles as excellent or good
Learn more about the work of our research integrity team to safeguard the quality of each article we publish.
Find out more
METHODS article
Front. Mar. Sci. , 18 June 2024
Sec. Ocean Observation
Volume 11 - 2024 | https://doi.org/10.3389/fmars.2024.1400511
 Steve Stanic1*
 Jerry D. Wiggert1
 Landry Bernard1Jason McKenna1
 Vishwamithra Sunkara1James Braud2
 Arne Diercks1
The University of Southern Mississippi has developed the coastal CUBEnet environment. Coastal CUBEnet is a high-resolution, coastal ocean sensor, modeling, and data sharing web-based network that provides the environmental intelligence needed to support the complex modeling of the interlinked processes in the northern Gulf of Mexico. With near-real time data delivery via a common infrastructure, CUBEnet uses state of the art sensors to provide a set of networked measurements systems, visualization tools, and model developments to gain an understanding of the Gulf of Mexico’s marine environments. CUBEnet is also a mechanism for improved human engagement with Gulf of Mexico resources and provides stake holders with the data needed to make informed coastal, environmental, and economic decisions. The Coastal CUBEnet’s data environment utilizes both stationary and uncrewed mobile systems and high-resolution distributed sensors to create a networked platform across the northern coastal Gulf of Mexico. CUBEnet’s modeling environment has developed an implementation of The Coupled Ocean Atmosphere Wave Sediment Transport (COAWST) Model for the Mississippi Bight region that has been applied to investigate shore to shelf advective exchange processes, and their influence on coastal water quality conditions that support the region’s prolific marine ecosystem. CUBEnet’s modeling environment provides prototype modeling applications that are supported by real-time observations of key coastal environmental variables. CUBEnet’s Web accessible visualization tools provide parameter fields and vertical profiles from hydrodynamic models and field observations. Nowcasts and forecast results are available for the Eastern LA coastline, MS coastline, Mobile Bay, and the West coast of Florida.
The major research questions and the supporting infrastructure investments for ocean research into 2030 are identified by the National Academy of Science (NAS) (National Research Council, Washington, DC, 2011). Many of the science research drivers focus on the need to understand the spatial and temporal resolutions and variabilities for a wide range of oceanographic and atmospheric parameters. These temporal scales can range from years to seconds. There is a continuing critical need for the development of advanced high-resolution sensors and systems to measure the variabilities of these important physical properties. NAS has outlined the critical development of new infrastructure assets that must include both fixed and mobile platforms, new high resolution in situ sensors, satellite remote sensing technologies, new modeling, and computational environments (National Research Council, Washington, DC, 2011). This data is also used to assist with resource stewardship and environmental management decisions that have wide social and economic impacts.
Currently fixed mooring arrays are the dominant nodes of today’s ocean measurement networks. They have provided data on atmosphere and ocean interactions and the critical data needed for global warming studies. Fixed moorings are unique in that while they have subsurface sampling systems, they also provide observations of the complex surface wave and atmospheric environment. Many transmit this data to data fusion centers for use in ocean model forecast verifications. These fixed moorings will continue to be the major ocean measurement systems well into 2030 (Delory and Pearlman, 2018: Subcommittee on Ocean Science and Technology Committee, 2018).
In response to the critical need for high resolution fixed and mobile measurement systems in the northern Gulf of Mexico (GOM), the University of Southern Mississippi (USM) has developed the coastal CUBEnet environment shown in Figure 1
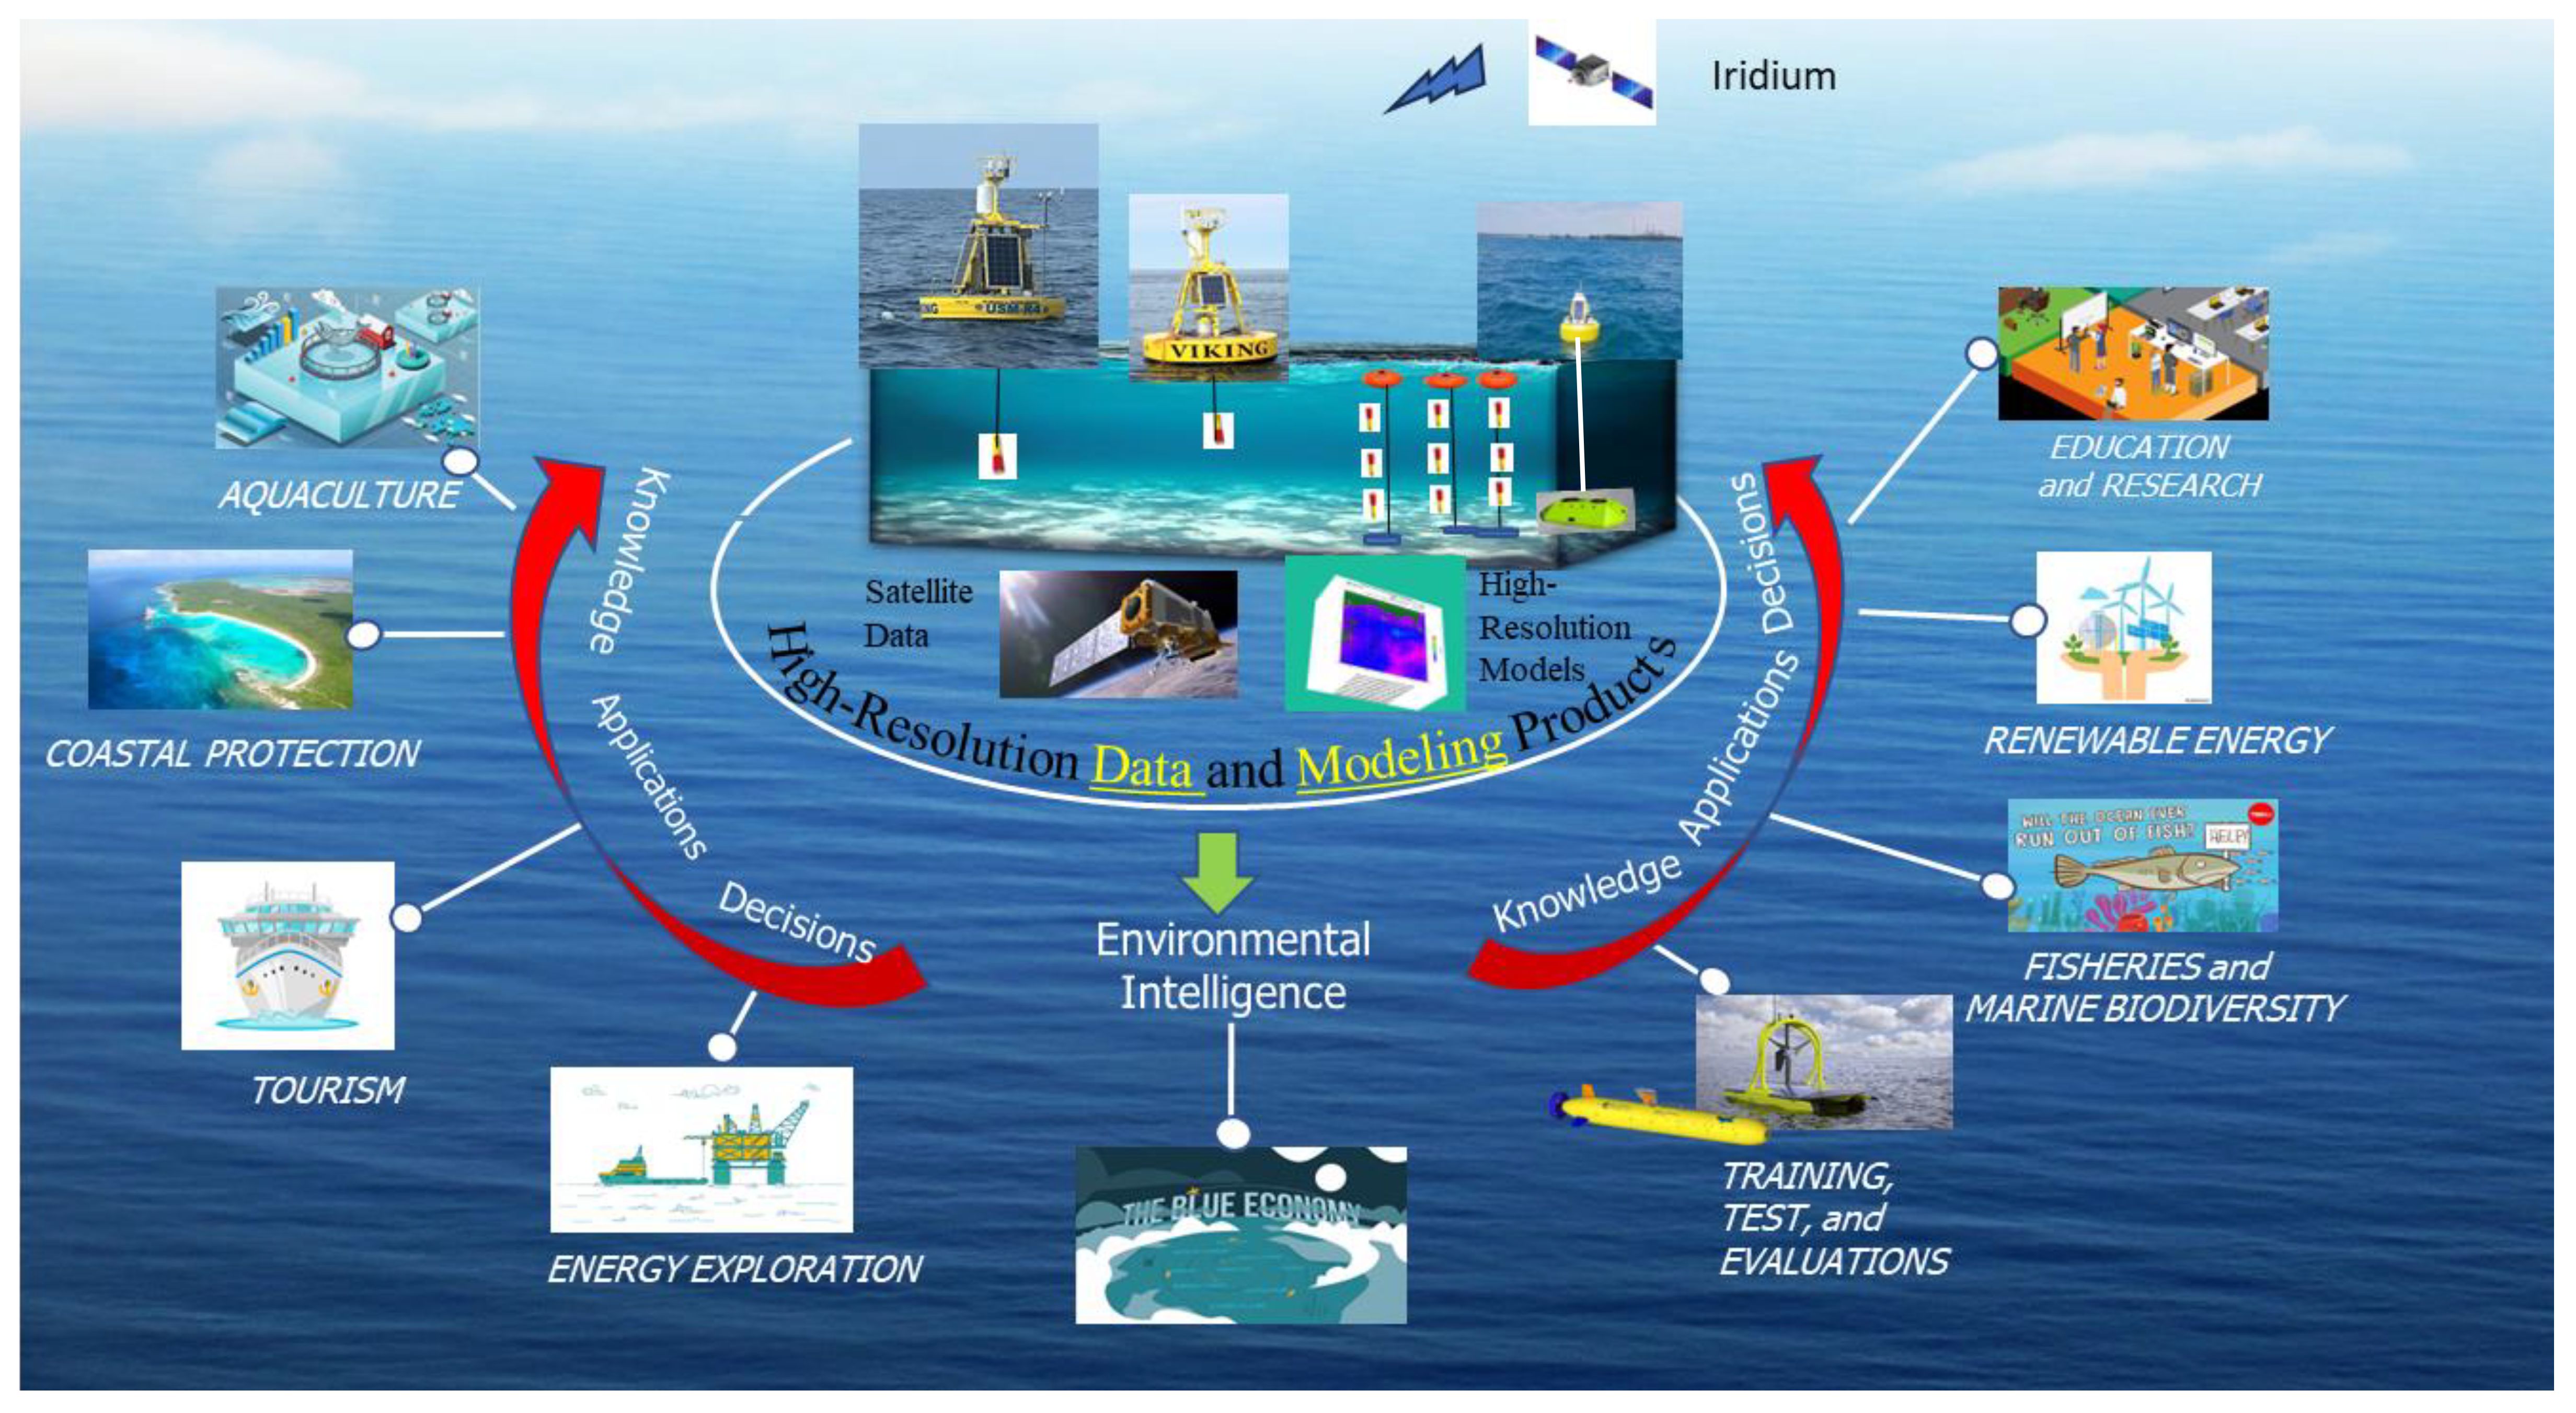
Figure 1 Coastal CUBEnet environment.
The Coastal CUBEnet is a high-resolution, coastal ocean sensor, modeling, and data sharing web-based network that provides the environmental intelligence (EI) needed to support the complex modeling of the interlinked physical, biological, chemical, geological, and oceanographic processes in the northern GOM. With near-real time data delivery via a common infrastructure, CUBEnet uses state of the art sensors to provide a set of networked measurement systems, visualization tools, and model developments to gain an understanding of the northern
GOM’s marine environment. CUBEnet is also a mechanism for improved human engagement with GOM resources and provides stake holders with the data needed to make informed coastal, environmental, and economic policy decisions.
Currently, CUBEnet provides model forecasts and surface and subsurface data for National Oceanic and Atmospheric Administration (NOAA), U.S. Army Corps of Engineers (USACE), United States Coast Guard (USCG), The Naval Research Laboratory (NRL), Commander Naval Meteorology and Oceanography Command (CNMOC), Naval Oceanographic Office (NAVOCEANO), and over a dozen unmanned maritime system (UMS), buoy and industry partners. CUBEnet provides EI for applications and decisions aids for aquaculture, tourism, energy exploration, fisheries and marine diversity, education and research, the blue economy, and currently is a test area for uncrewed maritime system training, testing, and evaluations.
This paper will discuss USM’s Coastal CUBEnet environment. The current Coastal CUBNet focus area is along the northern GOM and the Mississippi (MS) Gulf coast. The MS coast is characterized by a unique shallow-water shelf that extends offshore for approximately 150km. A set barrier of islands approximately 19km offshore separates the offshore waters from the coast and creates high current areas between the islands. There are large river run off currents that influence these near shore and coastal areas. These currents help generate a highly variable oceanographic environment north and south of the barrier islands.
The offshore GOM waters are controlled by the dynamic loop current with warm core rings that impact the local weather and bring episodic fluxes of salt water across the shelf and into the Mississippi Sound enhancing the variabilities of these environments.
The Coastal CUBNet is designed to provide high resolution data and interactions with the northern GOM modeling environment to provide the understanding of the processes that control the northern GOM’s coastal ecosystem on both local and regional scales. These processes include ocean atmosphere exchanges, coastal ocean temporal dynamics, riverine outflows, episodic freshwater diversions, understanding the seasonal forcing functions dynamics, the estuarine to shelf (to open ocean) exchange process of the northern GOM water masses, the high nutrient shallow coastal areas, and any parameter variabilities that occur over multiple temporal and spatial scales. These spatial scales can range from a few meters to kilometers and include the effects of extreme events such as summer hurricanes and strong seasonal storms that drive the transfer of deep-water heat, salt, and nutrients between the deep and shallow water coastal areas.
To resolve the spectrum of spatial and temporal scales encompassed by the research drivers, USM has developed the Ocean Enterprise Coastal Environmental Array (OECEA). The OECEA uses a combination of fixed, mobile, and satellite platforms to provide high resolution EI for the northern GOM.
The Coastal CUBEnet data environment utilizes both stationary and uncrewed mobile systems, high-resolution distributed sensors to create a networked platform across the northern coastal GOM. These sensor systems shown in Figure 2, provide continuous data on (1) meteorological parameters such as wind speed and direction, air temperature, and relative humidity; (2) oceanographic profiles such as water temperature, salinity, currents, dissolved oxygen, and chlorophyll-fluorescence. Wave heights and wave spectra are measured and calculated, and (3) parameters such as ambient noise, and acoustic backscatter are also measured. These data are transmitted to USM’s data fusion center where they are archived and analyzed using unique data visualization tools that are part of the CUBEnet’s data environment. These data products are openly accessible to the research community via the CUBEnet access protocols.
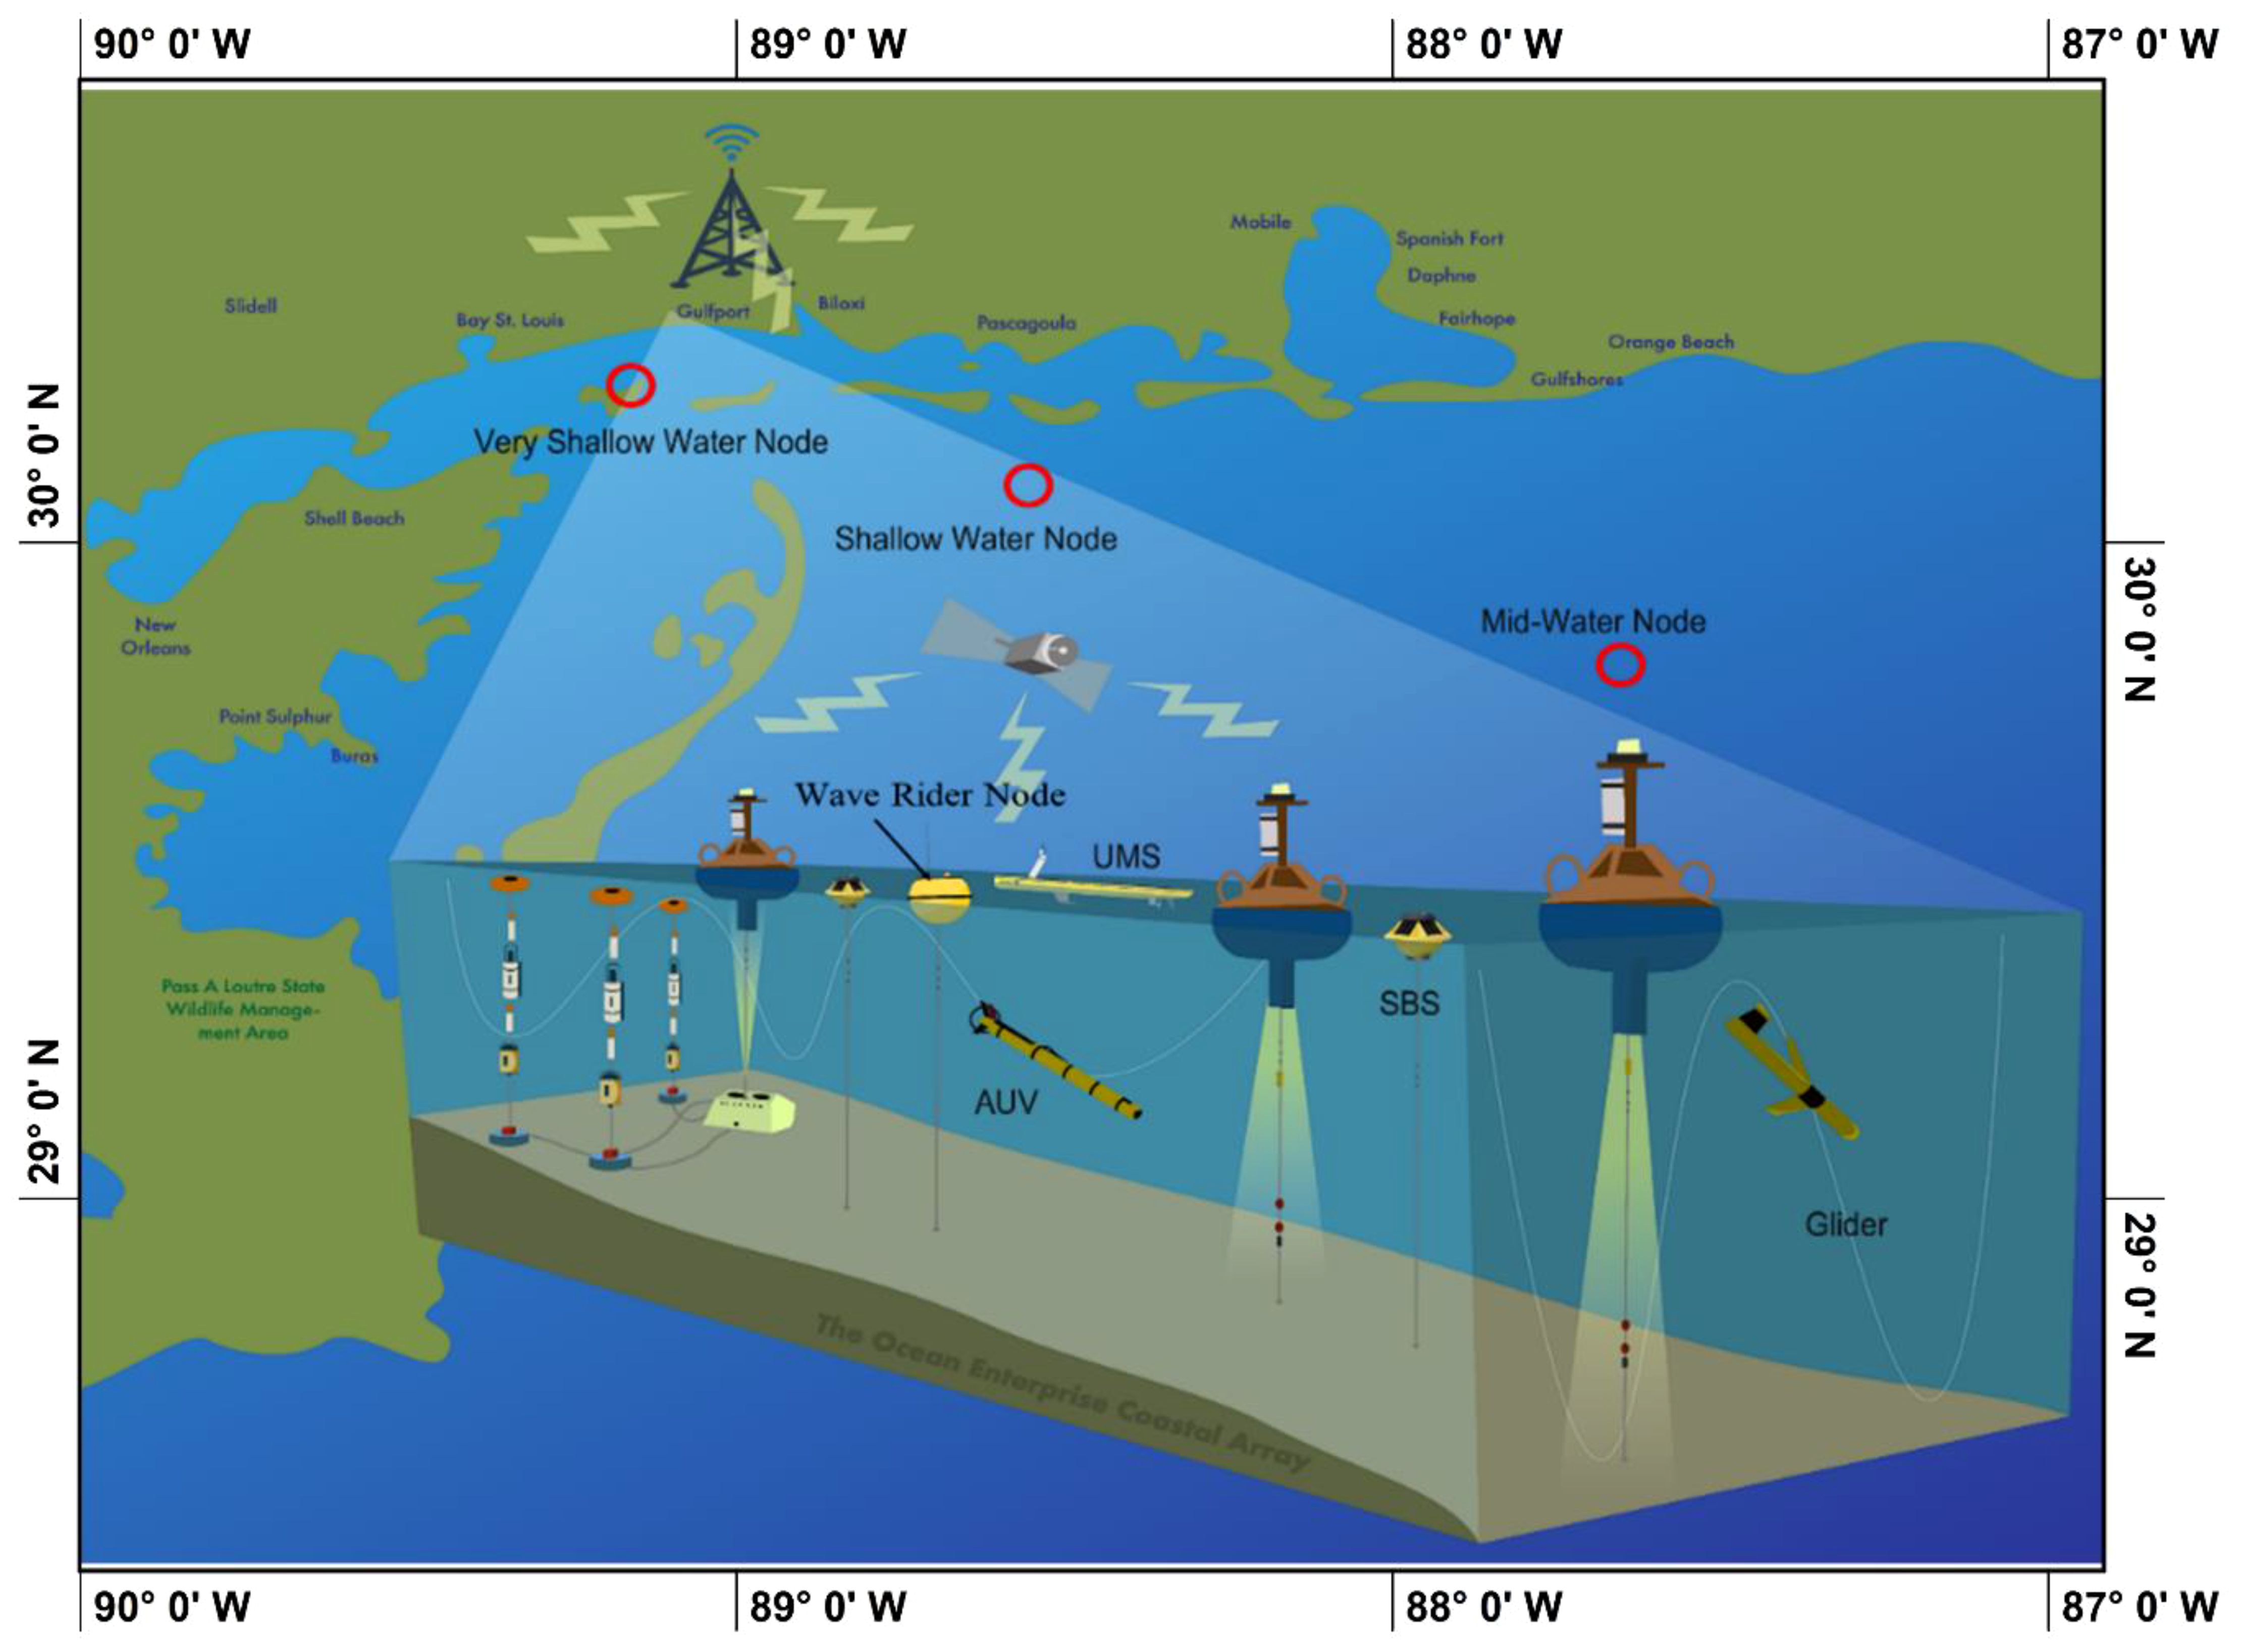
Figure 2 Ocean Enterprise Coastal Environmental Array (OECEA).
Data aggregation is time consuming involving visits to multiple endpoints containing the information of interest with separate downloads to associate data correctly with other available environmental information. This limits the ability of all stakeholders to make quick and informed decisions, and more importantly, to understand what kinds of information are available across sensor types and domains (e.g., atmospheric, aquatic, etc.). CUBEnet seamlessly provides this integration in real time through development of an ecoinformatics engine that can seamlessly retrieve and store data from multiple sensor systems and servers hosting the products of ocean numerical modeling systems.
Currently, the OECEA has three fixed array nodes and a wave rider node deployed in water depths ranging from 3m to ~50m. Data from each of these moored systems is transmitted to USM’s data fusion center using satellite and cellular connections. A fourth high resolution wave measurement node is deployed in 12m of water west of the main array. Each of these moored nodes include real time control and is designed to measure the temporal and spatial time series variabilities of the local meteorological, oceanographic, and biological parameters. A fourth 200m deep water node is in the planning stages. Data fusion and processing is discussed in detail in the Data Fusion and Processing Design Document, and Toolkit for Importing Nearshore Ocean Data into the Cube (Bernard et al, 2021).
The following three fixed Ocean Meteorological Buoy Systems (OMBS) and Waverider moored node have customizable payload sections and carry buoy controller systems that interface with the data transmission systems. These systems provide full control of all buoy functions, profiling measurements, and sensor data in near real time. These also include measurement system configurations, measurement parameters, data processing, data transmission, and scheduling.
The first array node is a very shallow water high-resolution sensor network (HRSN) shown in Figure 3. The HRSN has both surface and subsurface sensor systems and is deployed 9.5km south of the MS coastline in ~ 3m of water. The HRSN subsurface system controls six subsurface moorings (Figure 3A) that measure temperature as a function of time and depth along the spatial grid also shown Figure 3C.
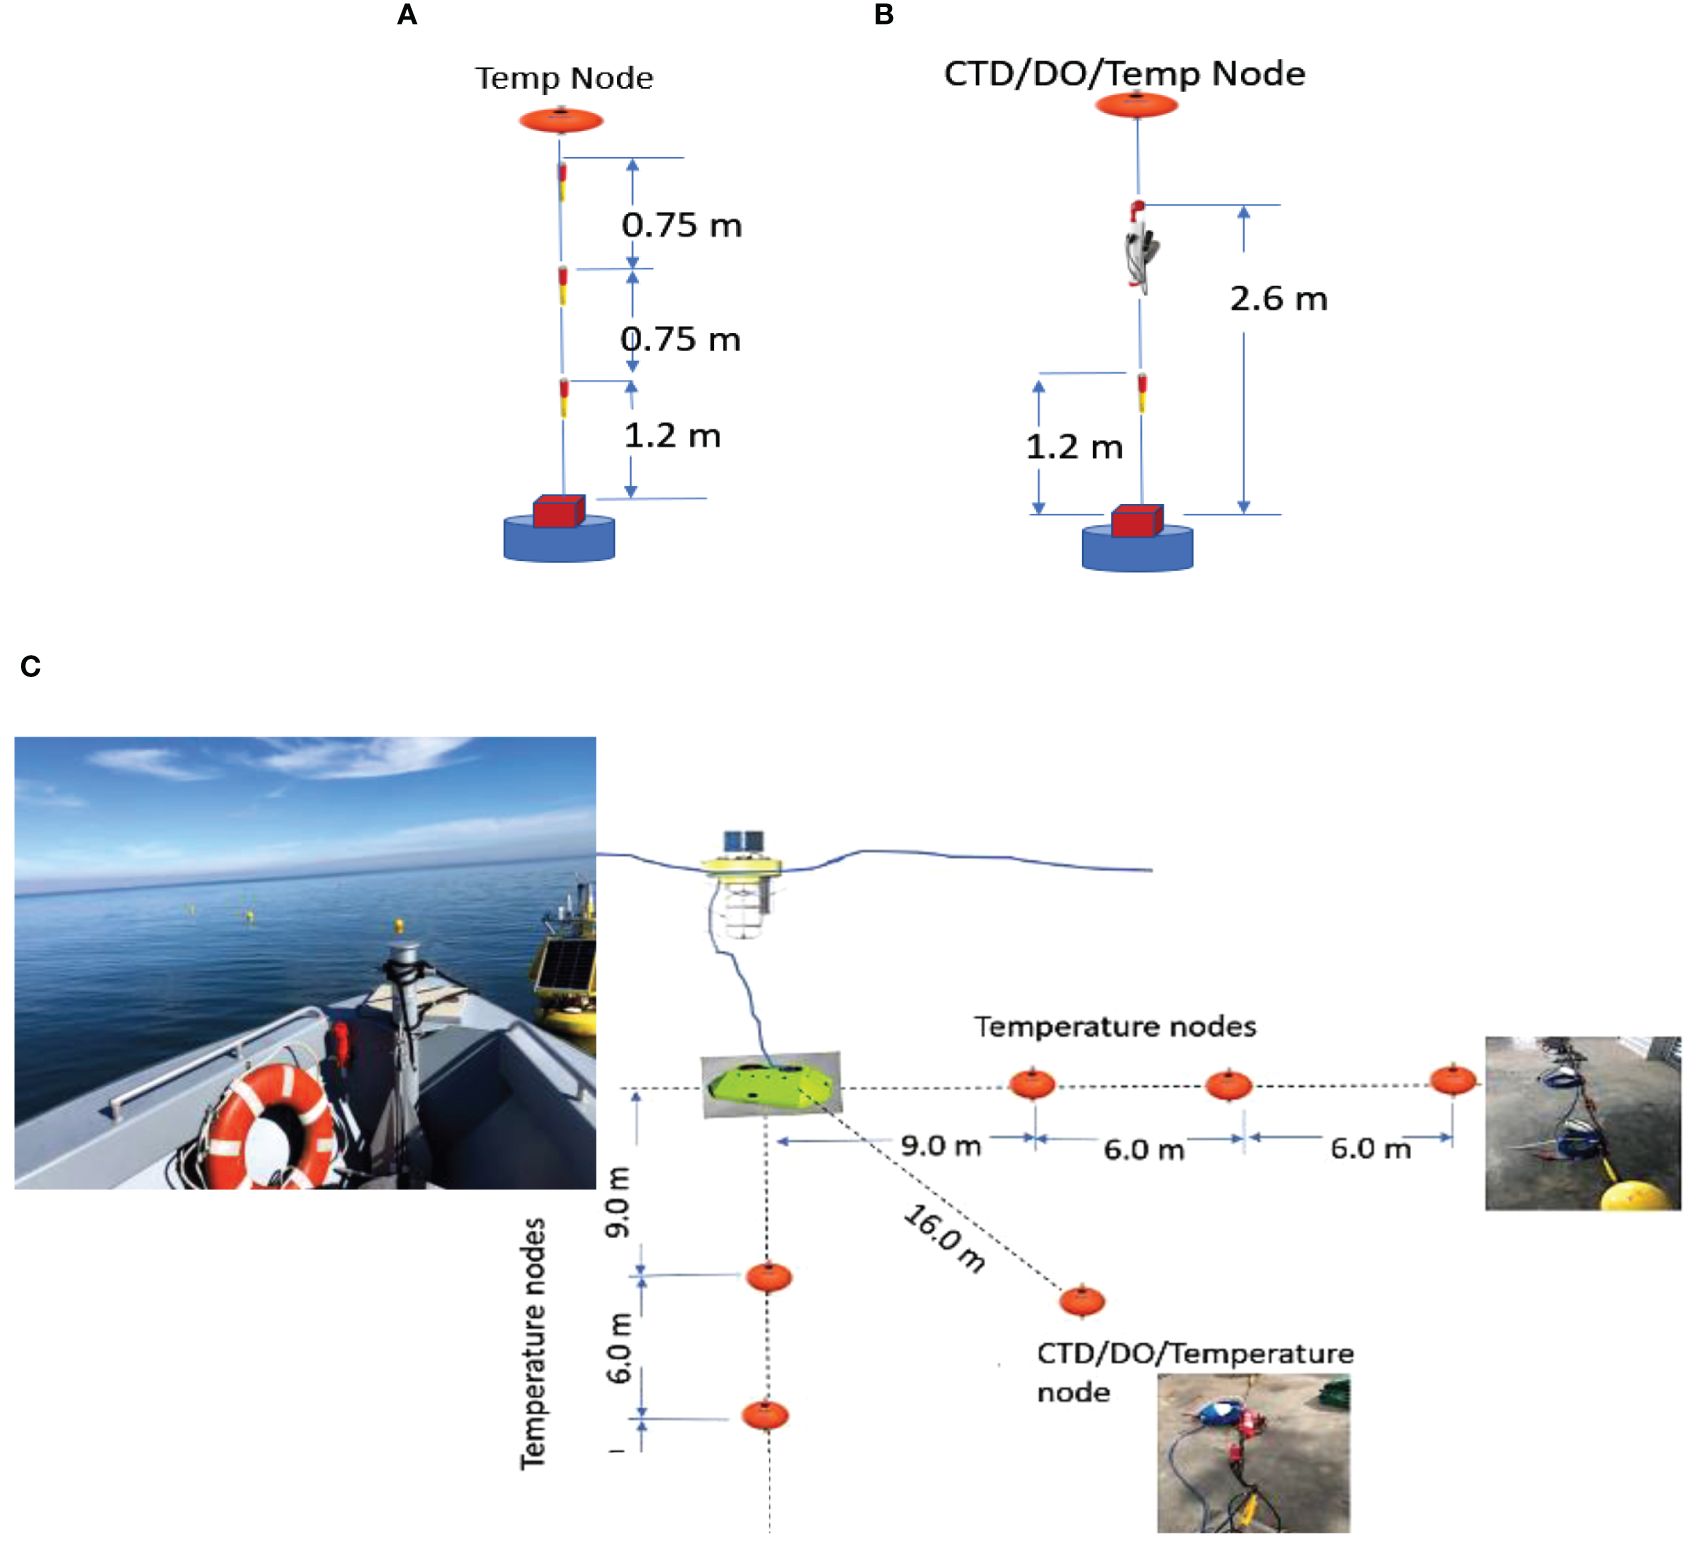
Figure 3 Subsurface network sensors. (A) Temperature sensors. (B) CTD/DO/Temperature sensors. (C) Mooring configuration.
A seventh subsurface mooring has a CTD, additional temperature sensor, and a dissolved oxygen (DO) sensor system and is shown in Figure 3B. This sensor network can sample at frequencies that range from minutes to hours. The major data types collected by this very shallow system are shown in Table 1A. A full list of all the data collected can be found in (Coastal CUBEnet User and Data Guide, 2012).
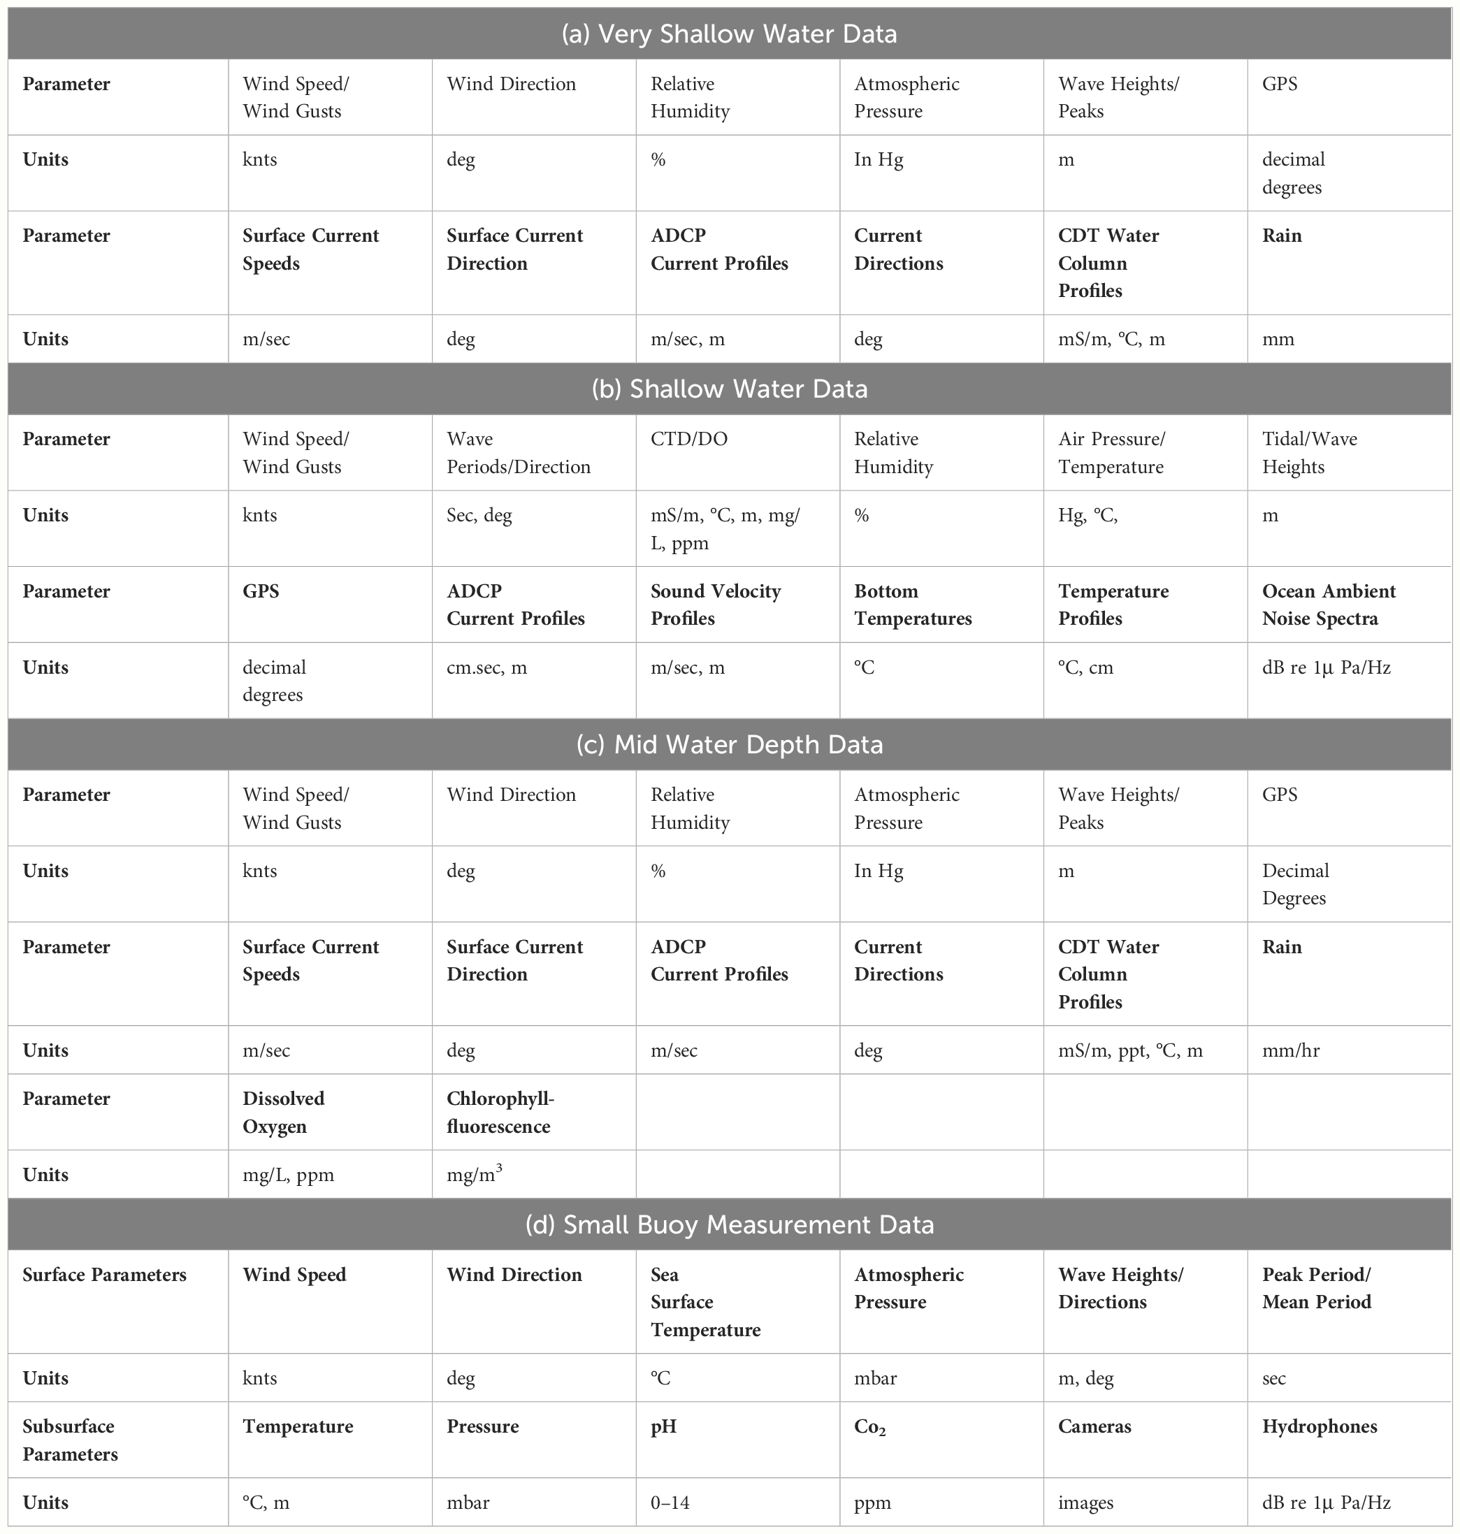
Table 1 Data Fields.
The HRSN subsurface unit also controls a high frequency (1MHz) upward looking ADCP that provides current profile averages every 15 minutes with 1m bin resolution. A temperature sensor mounted on the ADCP measures temperatures 0.5m above the ocean bottom and a wave tide pressure sensor mounted on the HRSN provides continuous measurements of water pressures and wave heights. Figure 4 shows examples of the wind, surface wave height, and tidal sensor data.
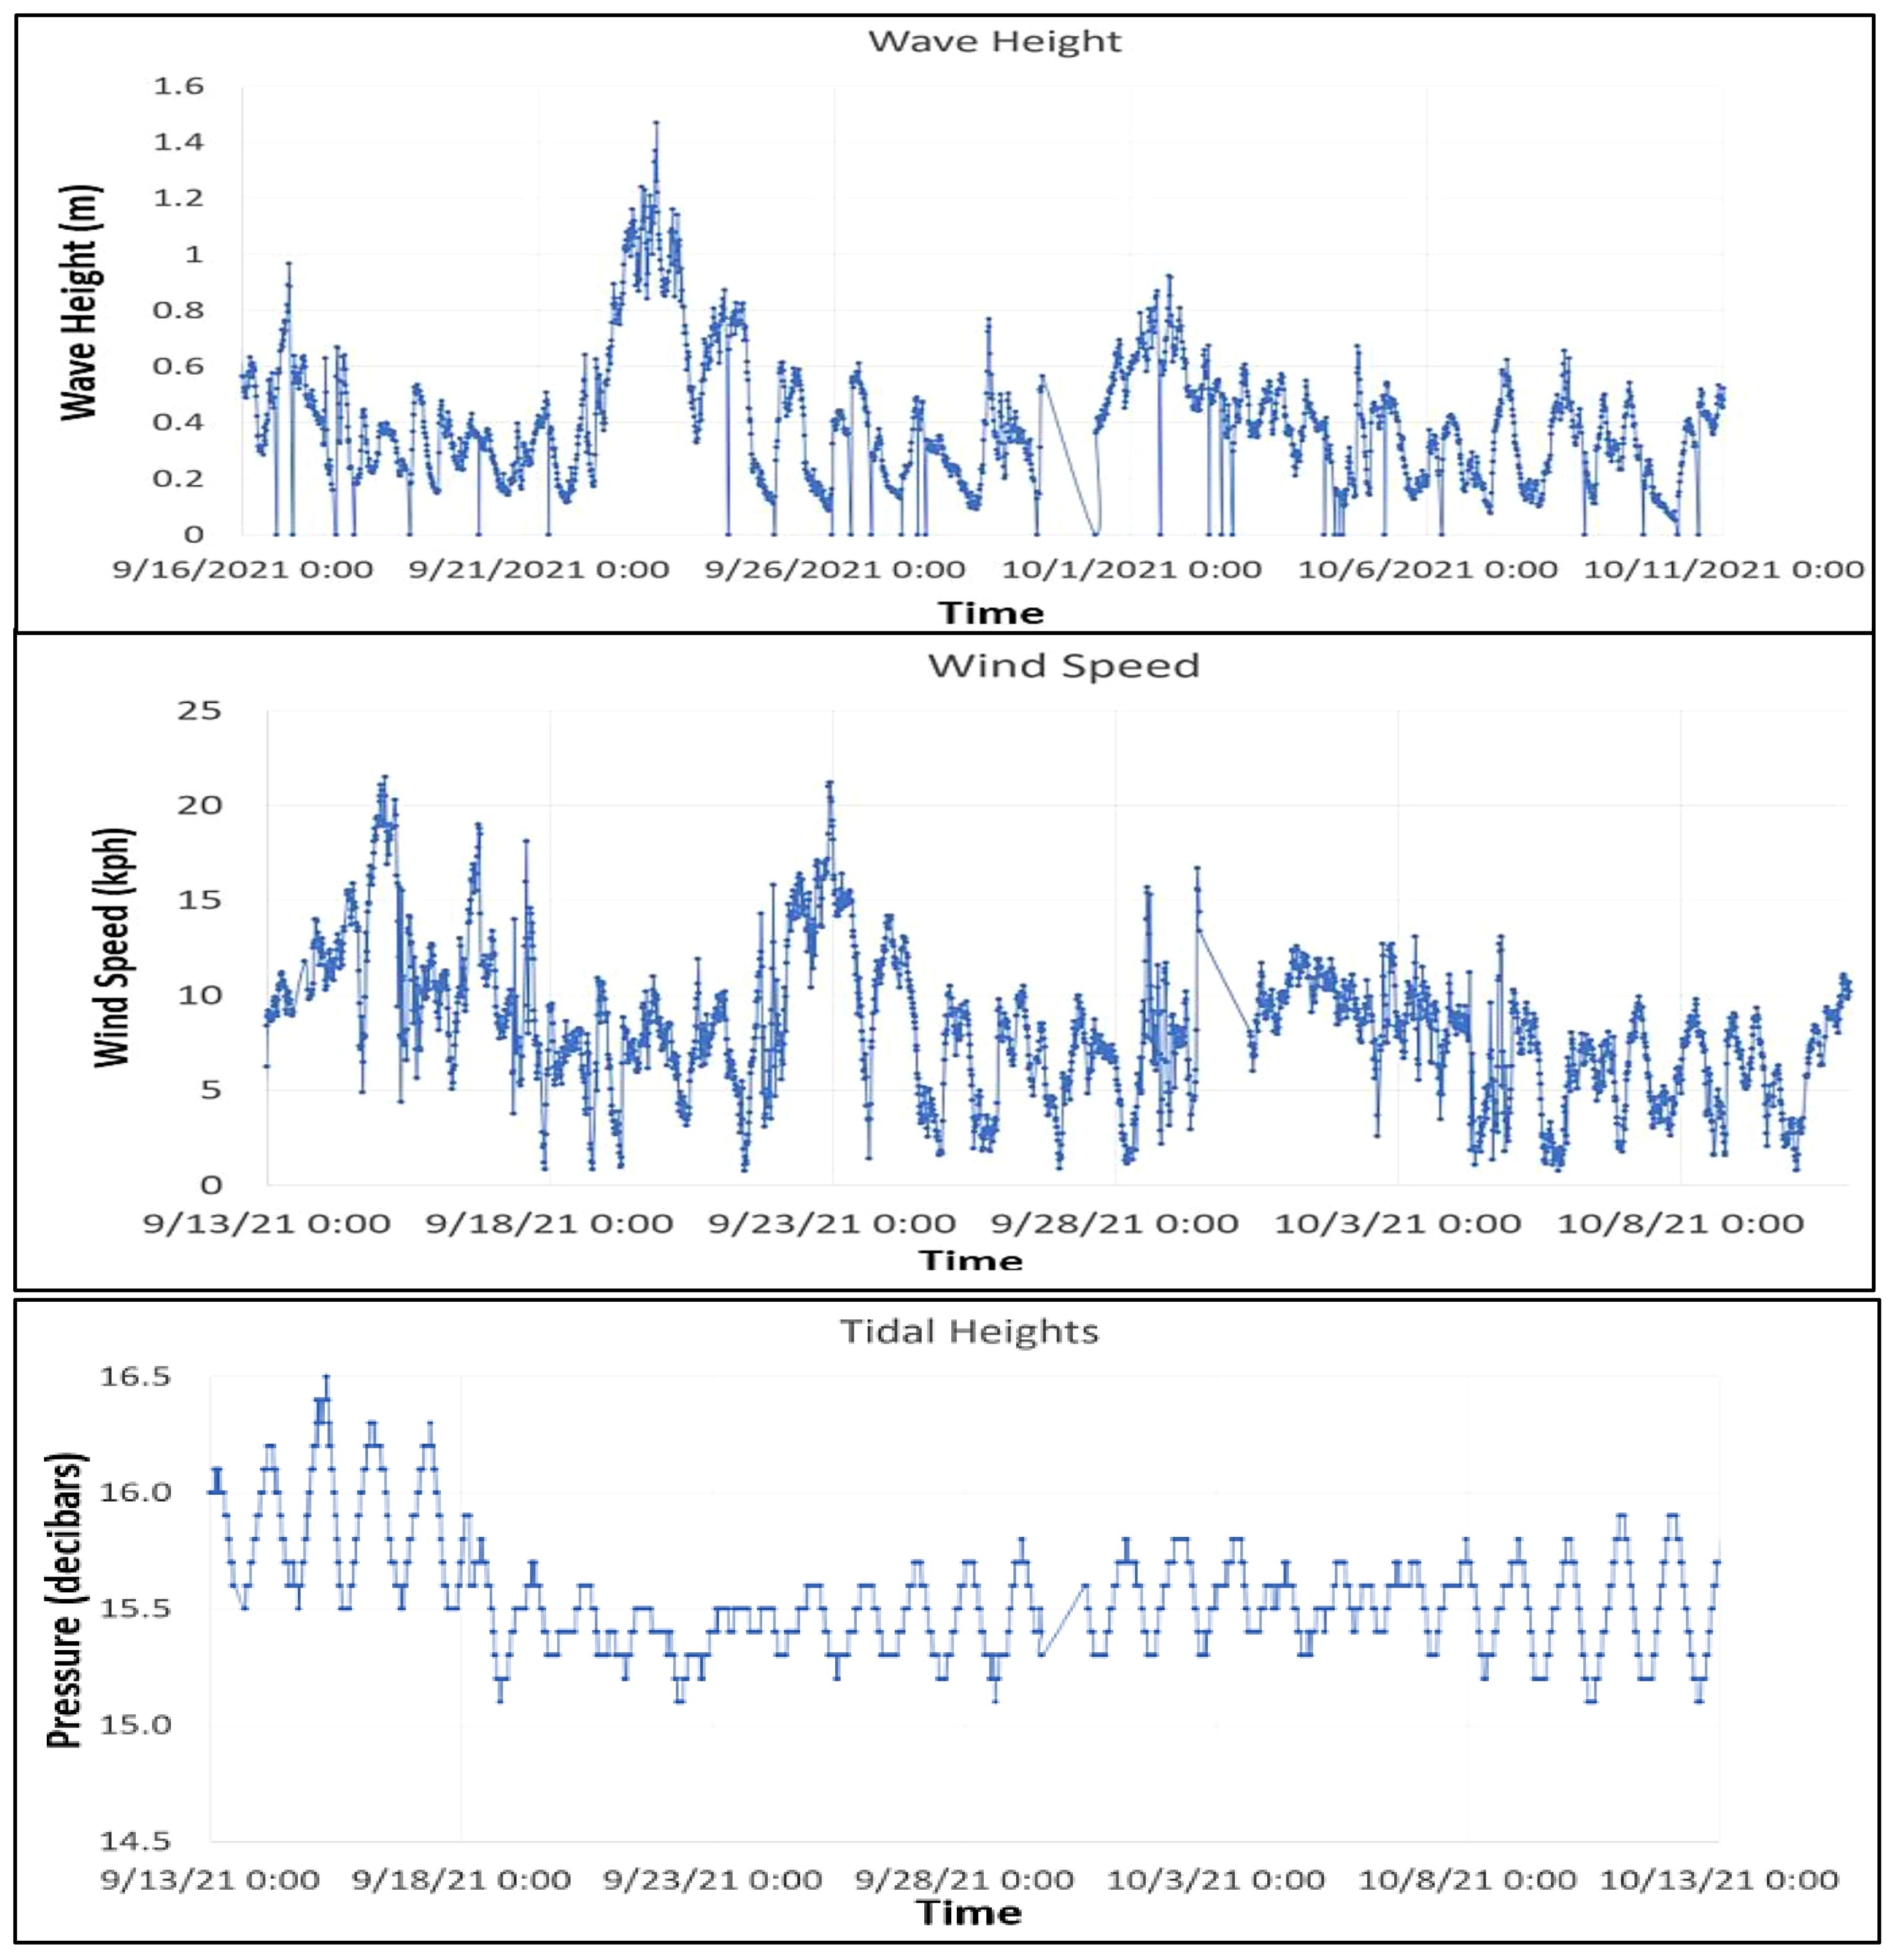
Figure 4 Wind, surface wave height, and tidal data.
This subsurface unit is cabled to an instrumented surface control buoy allowing all in situ subsurface data to stream up to the surface buoy. Sensors on this surface buoy provide measurements of surface wave and wind properties. All surface and subsurface and data are continuously transmitted to USM’s data fusion center using a cellular connection.
Shown in Figure 5A is the second OMBS array node in the OECEA. This system is one of USM’s 2m OMBS that is moored in a water depth of 22m. This OMBS includes both surface and subsurface measurement systems, all of which can be remotely programmed.
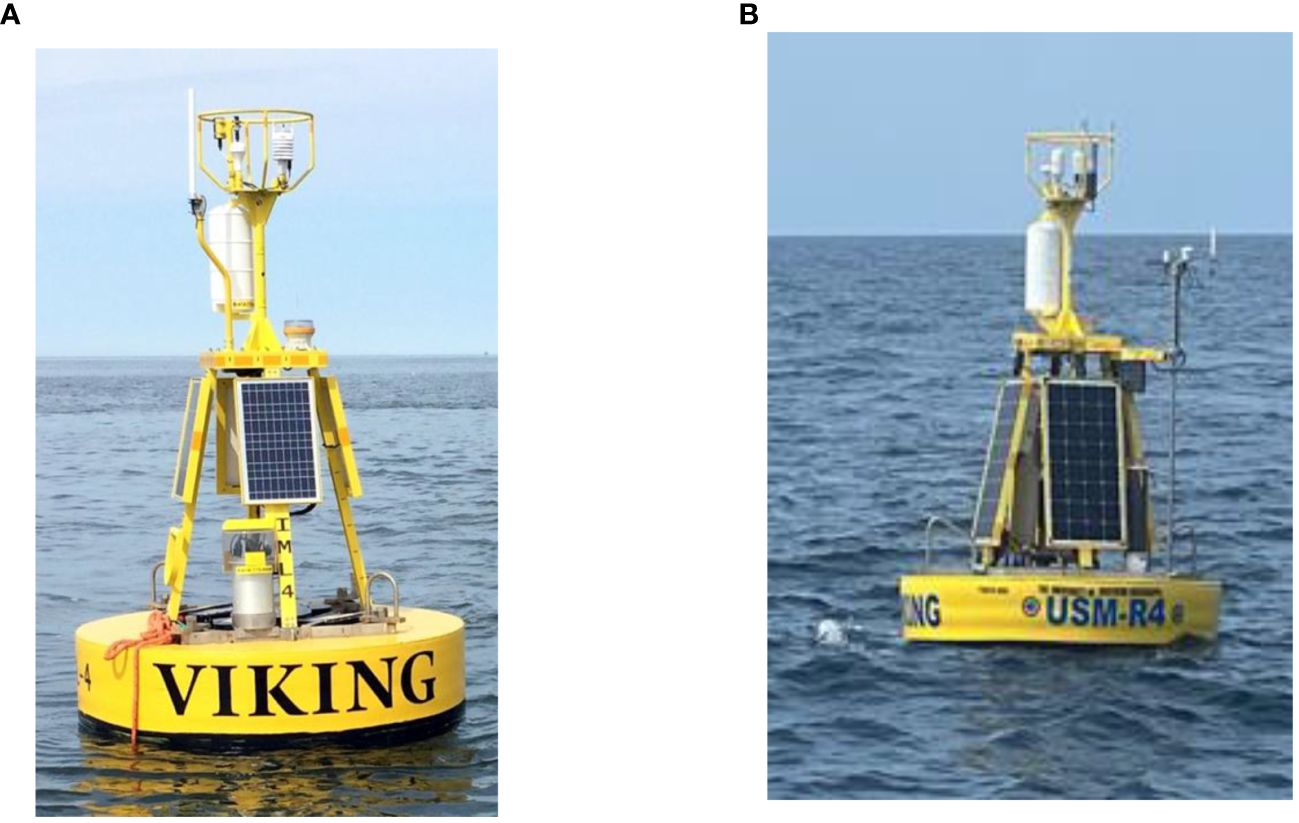
Figure 5 (A) USM’s 2m shallow water OMBS. (B) USM’s 2m mid water depth OMBS.
This OMBS has a downward looking 300 kHz ADCP that can measure current profiles in 1m bins to a depth of 200m. During this deployment, the profiling depth was 20m and fifteen-minute current averages were transmitted to USM’s data center through an Iridium satellite connection.
This system also has a unique adaptive cable winch system that lowers a CDT to collect profiles as a function of depth and time from 1 m below the surface to a depth of 200m. An example of the measured variability of the temperature and salinity as a function of time (every 6 hrs.) and depth (20m) is shown in Figure 6. The profiling is dependent on the wave and current conditions and is suspended if conditions become unfavorable for continued profiling. The major data types collected by the shallow water node are shown in Table 1B. A full listing of the data collected can be found in (Coastal CUBEnet User and Data Guide, 2012).
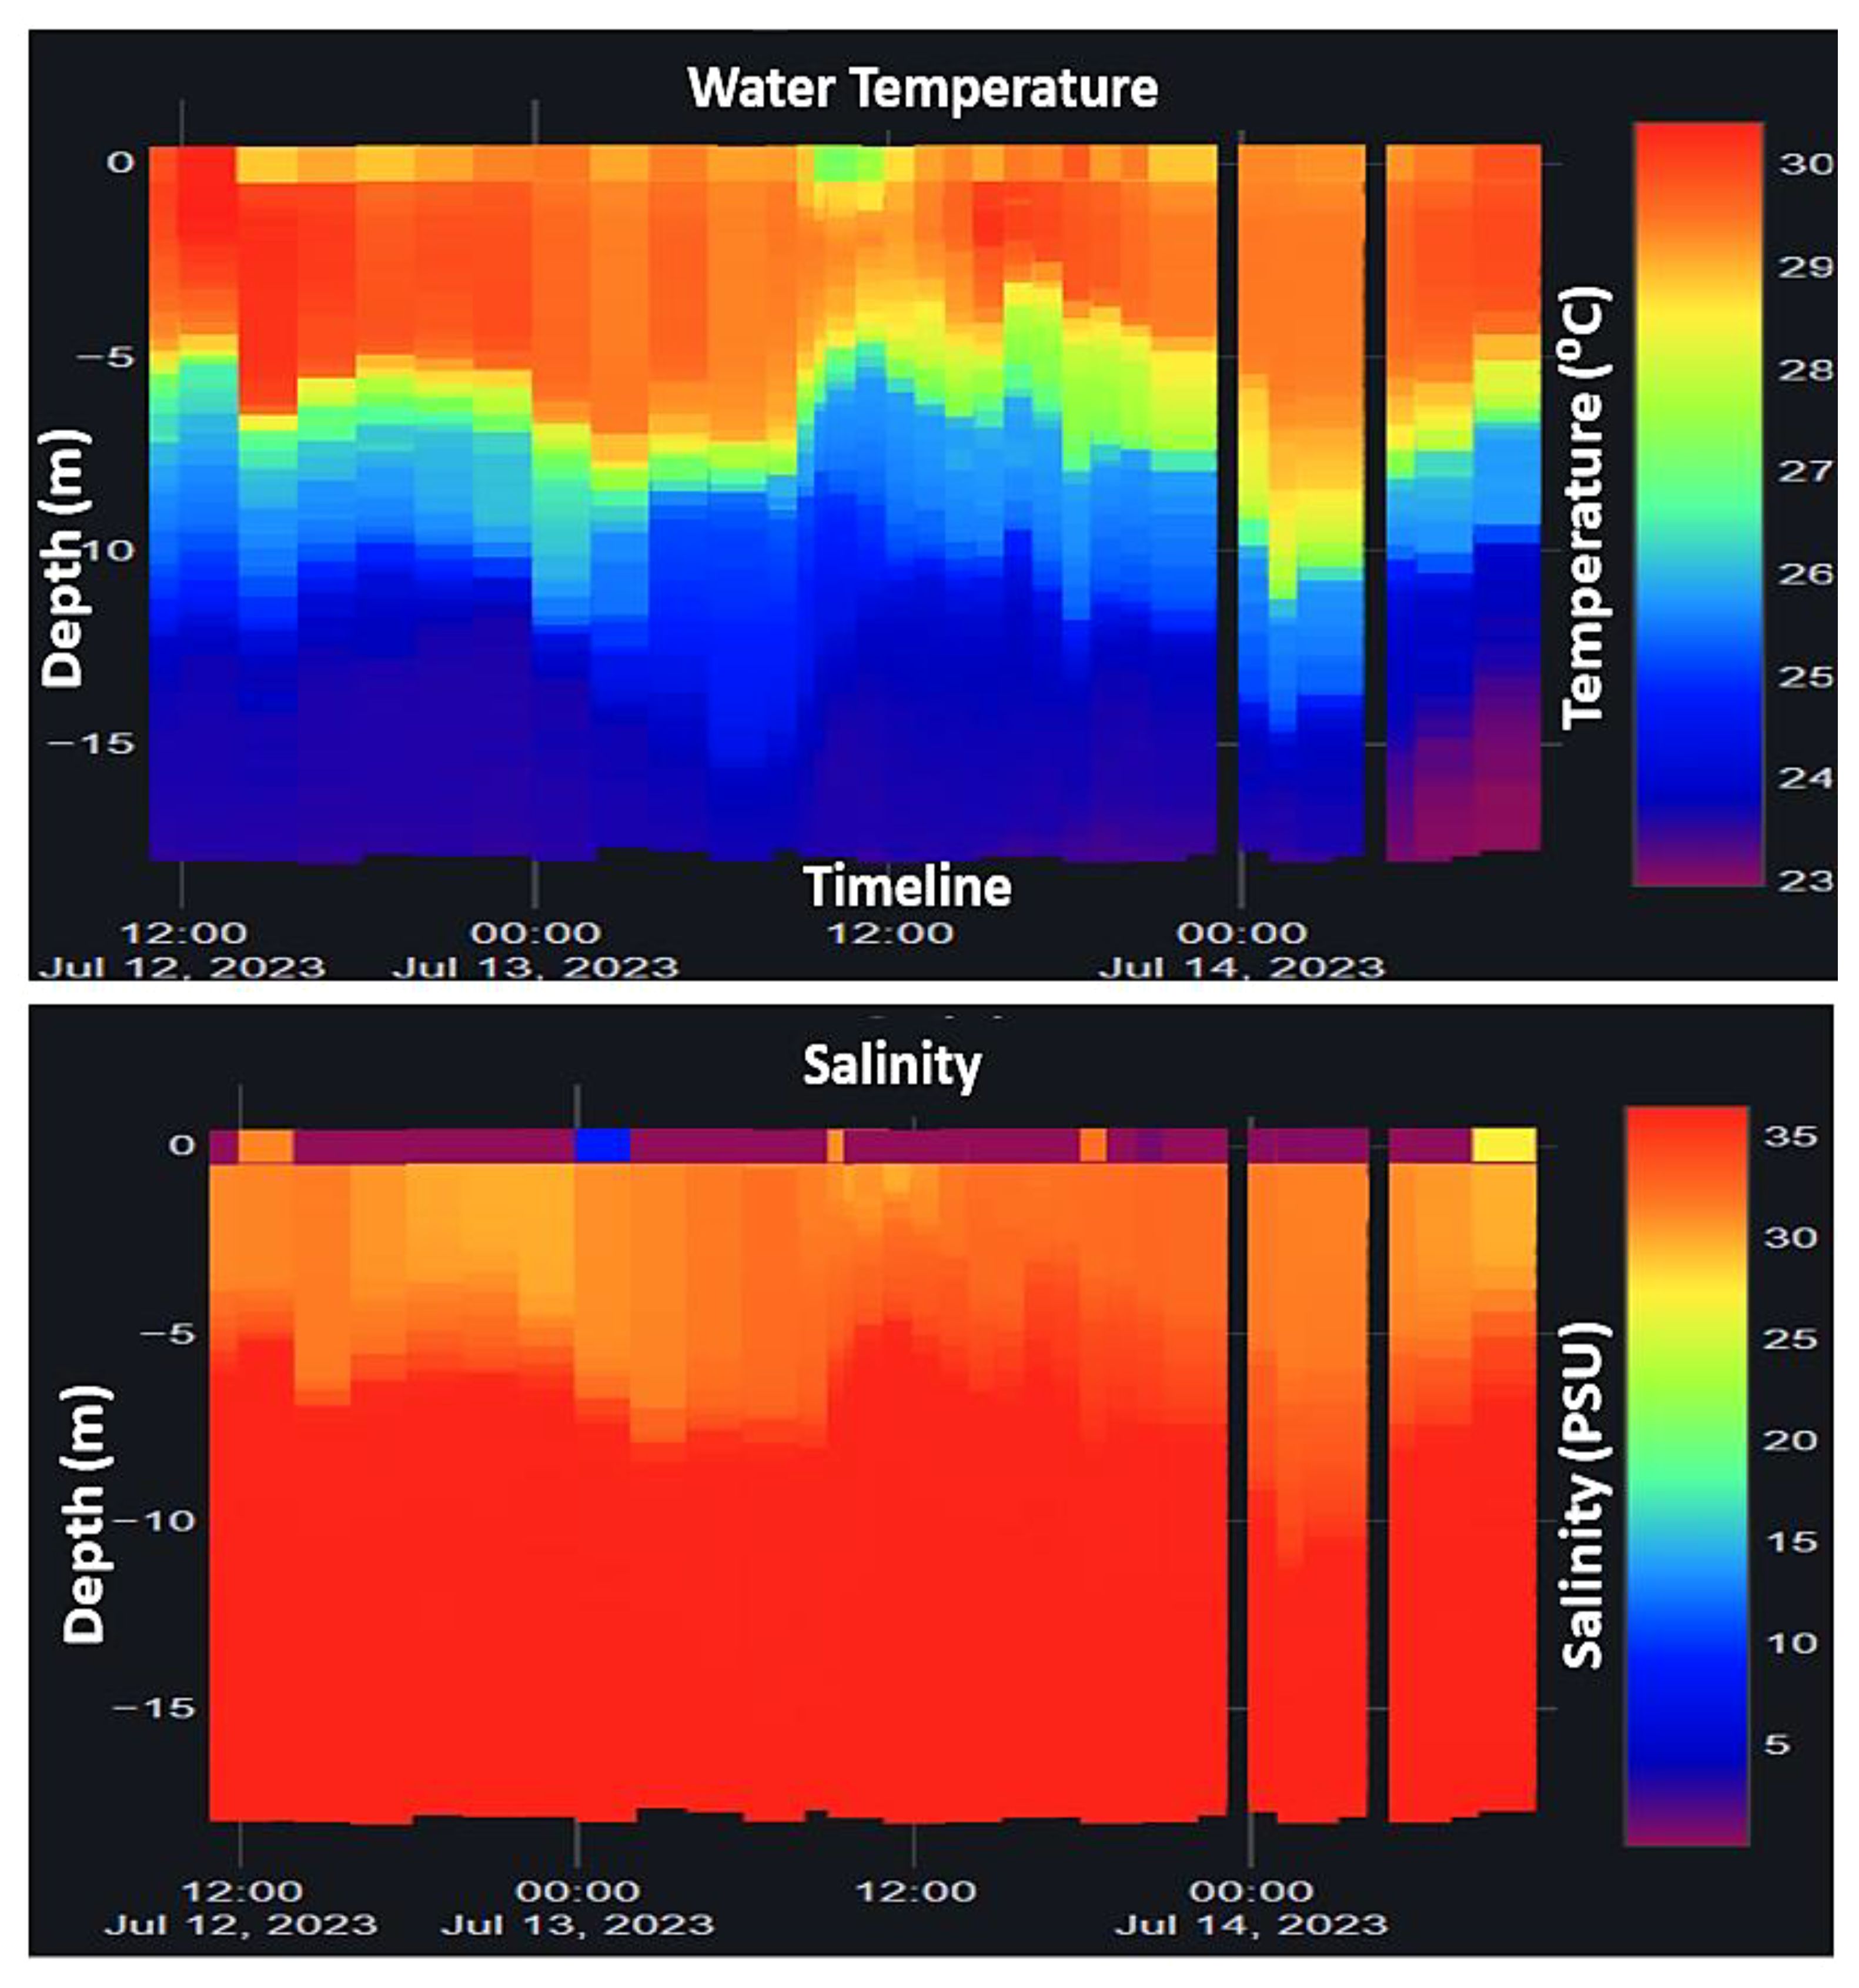
Figure 6 Temperature and salinity profiles as a function of time.
The third node of the OECEA is a second OMBS deployed in 42m of water. This OMBS shown in Figure 5B collects data from both the atmosphere and underwater environments in the deeper offshore waters. These OMBS sensors continuously map these two environments and transmit the data to USM’s data fusion center using an Iridium satellite connection. A listing of the data transmitted from this buoy is given in Table 1C. A more complete list is given in (Coastal CUBEnet User and Data Guide, 2012).
This OMBS also has a winch system that lowers a CTD, Dissolved Oxygen, and Chlorophyll-Fluorescence sensor to collect water column profiles as a function of depth and time. These systems can also be programed to acquire data at numerous spatial and temporal time scales (mins – days). The OMBS incorporates a downward looking 600 kHz ADCP to measure current profiles as a function of time and depth. These data are transmitted to USM’s data fusion center using an Iridium satellite connection.
OECEA also uses a dedicated wave measurement system to provide real time measurements of wave height parameters. This system continuously measures wave heights, directions, sea surface temperatures, and surface currents. The system stores the recorded data and has an extensive library of algorithms that calculate wave spectra, wave statistics, wave spectra, and a large number of statistical parameters to describe the sea surface conditions Waves4 Manual, (2019). This buoy transmits small selected chosen data sets through an Iridium satellite link. A full listing of the data collected can be found in (Coastal CUBEnet User and Data Guide, 2012).
Shown in Figure 7 are data examples received via the satellite connection. These include wave heights, directions, periods, and surface water temperatures.
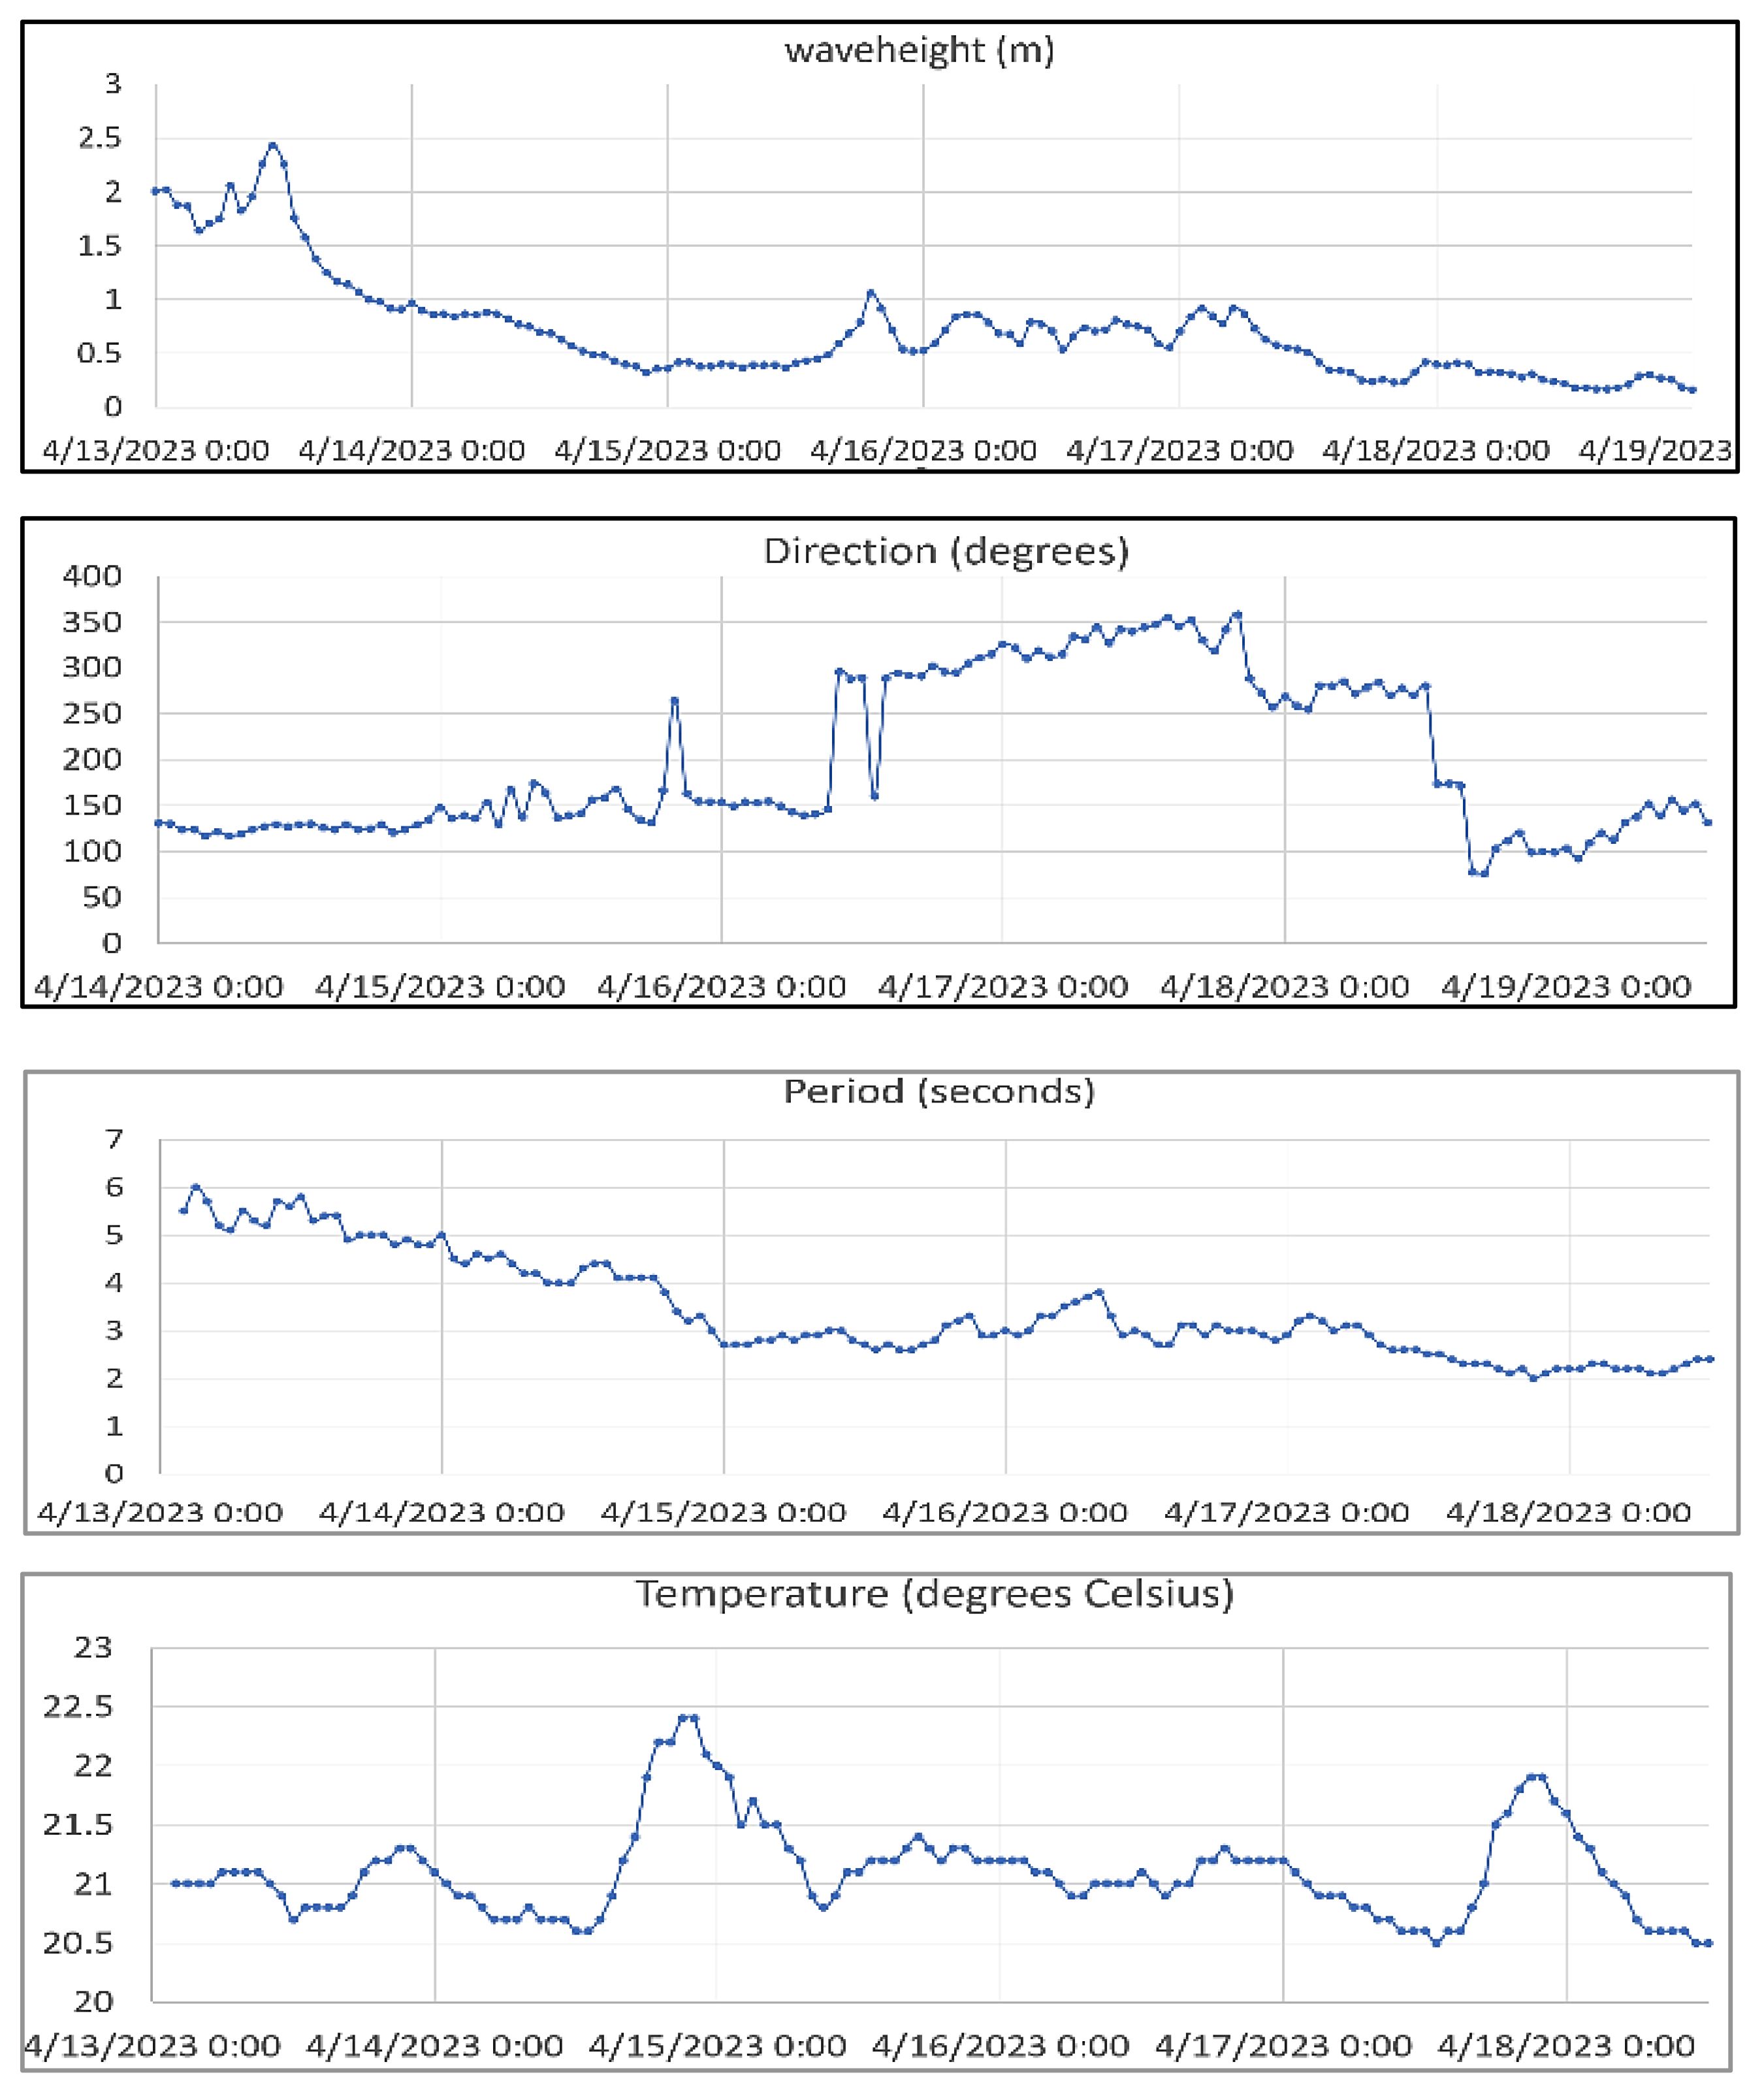
Figure 7 Surface wave heights, directions, periods, and surface water temperatures as a function of time.
The coastal CUBEnet measurement environment also imports data from three 25MHz and two 5MHz USM owned CODAR high frequency radar (HFR) systems located in the northern Gulf of Mexico. High frequency electromagnetic signals are transmitted from each of the individual sites and, using the seawater as a ground plane, are reflected by surface ocean waves from over the horizon transmission. Bragg scattering on deep water waves at one half of the wavelength of the transmitted signal, reflect this electromagnetic signal back to the receiver. Doppler shift in the return signal due to underlying currents transporting these waves laterally, provides radial velocity of the surface currents to and from an individual HFR site due to phase shift in the returned electromagnetic wave. Transmit and receive signals are pulsed at 1Hz (5MHz) and 2Hz (25MHz) by the control electronics in the HFR system. Software provides direction finding and distance to individual range cells within the coverage of a single radar site. These data only present a portion of the actual currents as only a portion of the current movement is captured by a single site. Actual surface current speeds and directions are computed from the radial velocities of two individual sites covering the same area through simple vector addition, providing a total vector of current speed and direction for a specific location/grid cell.
By combining radial vectors of two adjacent sites, total current vectors of speed and direction are calculated in 1km x 1km (25Mhz) or 6km x 6km (5MHz) grid cells where radial vectors from at least two sites are available (Barrick et al., 1977; Barrick and Lipa, 1999; Burnett et al., 2010; Cummings, 2005; Chassignet et al., 2007; National Research Council, Washington, DC, 2011; Coastal CUBEnet User and Data Guide, 2012; Delory and Pearlman, 2018-Emery et al., 2014; National Oceanic and Atmospheric Administration, National Ocean Service, Integrated Ocean Observing System, 2019; Paduan et al., 2006). The 25 MHz HFR systems are located at the Silver Slipper Casino, in the Pass Christian harbor and, the Gulfport MS State Harbor. Figure 8 shows a one-hour data set of 1km grid cell surface currents obtained by the 3- 25MHz HFR systems. From January 1 to June 30, 2022, an average of 1,561 radial vectors per hour were obtained with a maximum distance of 41km offshore. The two long range 5MHz systems, located on Singing River Island in Pascagoula, MS, Orange Beach State Park, Alabama have provided in that same time span an average of 714 hourly vectors spaced at a 6km x 6km resolution out to186 km. CUBEnet also imports HFR data from the National Data Buoy Center (NDBC) (Surface currents via High Frequency Radar).
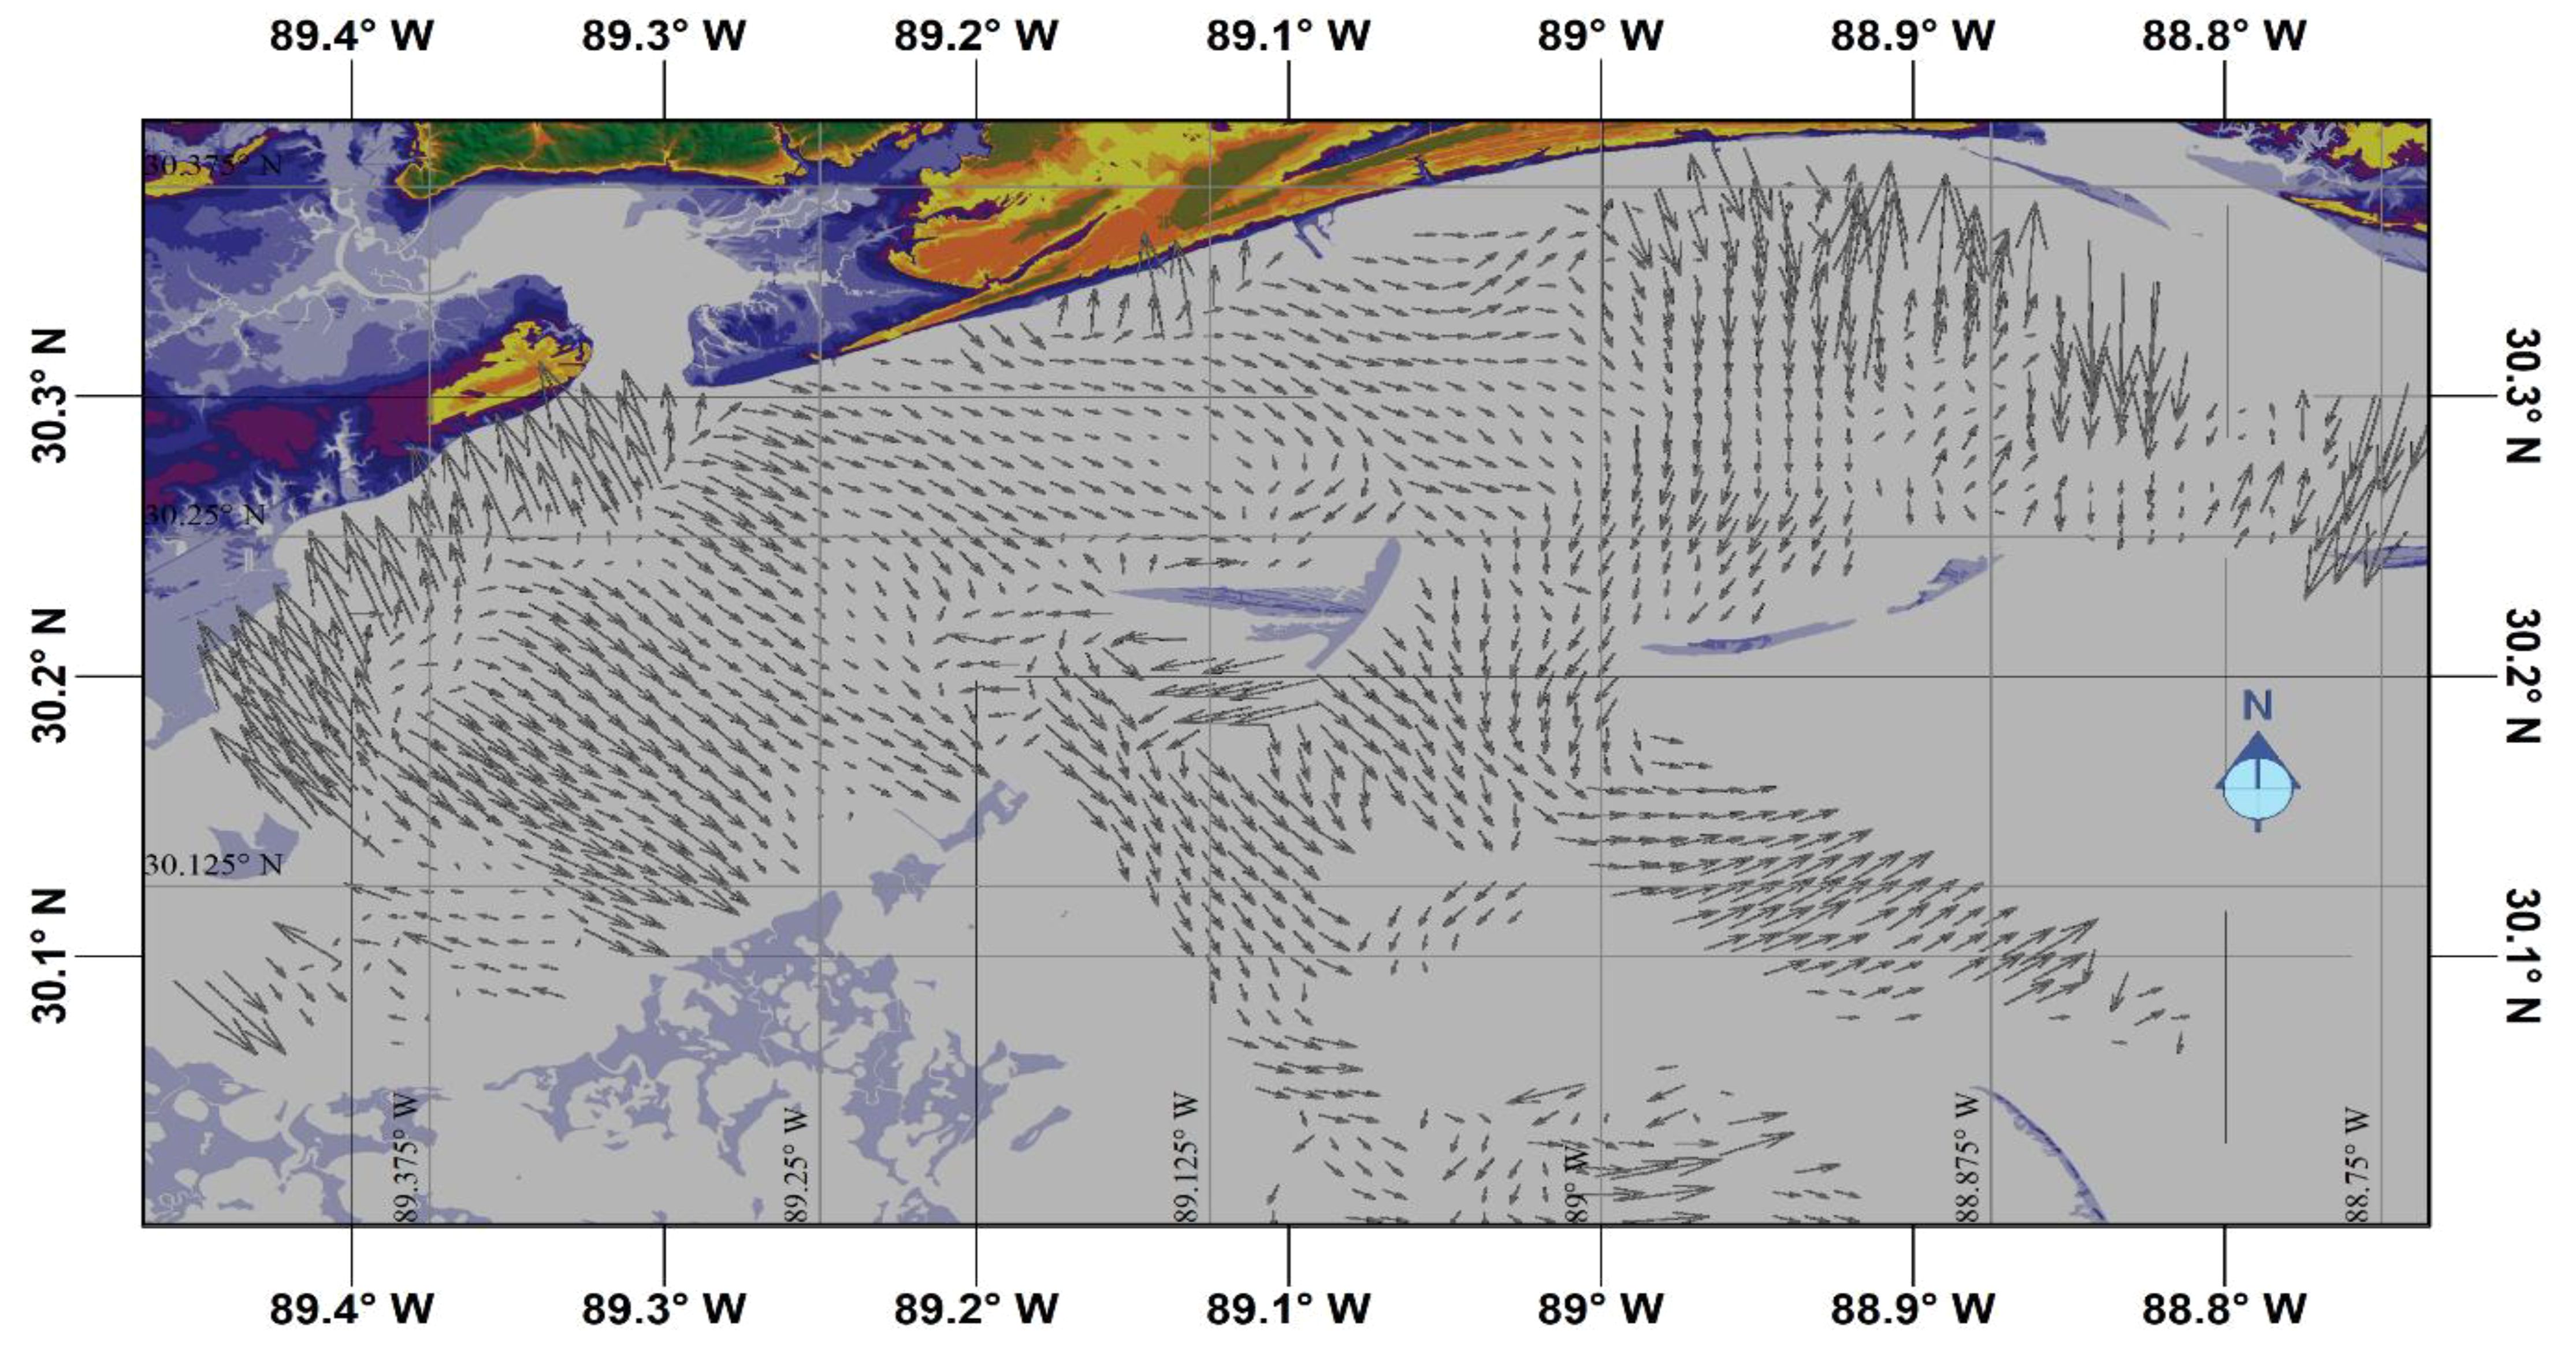
Figure 8 Example of the hourly total vector coverage of the 25MHz HFR systems located at Gulfport and Pass Christian harbors and the Silver Slipper Casino.
Uncrewed surface and subsurface mobile systems are also part of the OECEA and CUBnet’s data environment. These uncrewed systems supplement the fixed mooring measurements by operating in between and around the fixed systems to provide surface and subsurface data outside the measurement ranges of the fixed systems. USM’s Autonomous Underwater Vehicle systems are shown in Figure 9. They are ideal for USM’s coastal applications, general survey work, sub-surface security research, and environmental monitoring. The AUV’s shown in Figure 9 conduct surveys in MS coastal waters in depths ranging from 1 to 100 meters and can be equipped with numerous types of sensors. A complete list of sensor suites is given in (Coastal CUBEnet User and Data Guide, 2012).
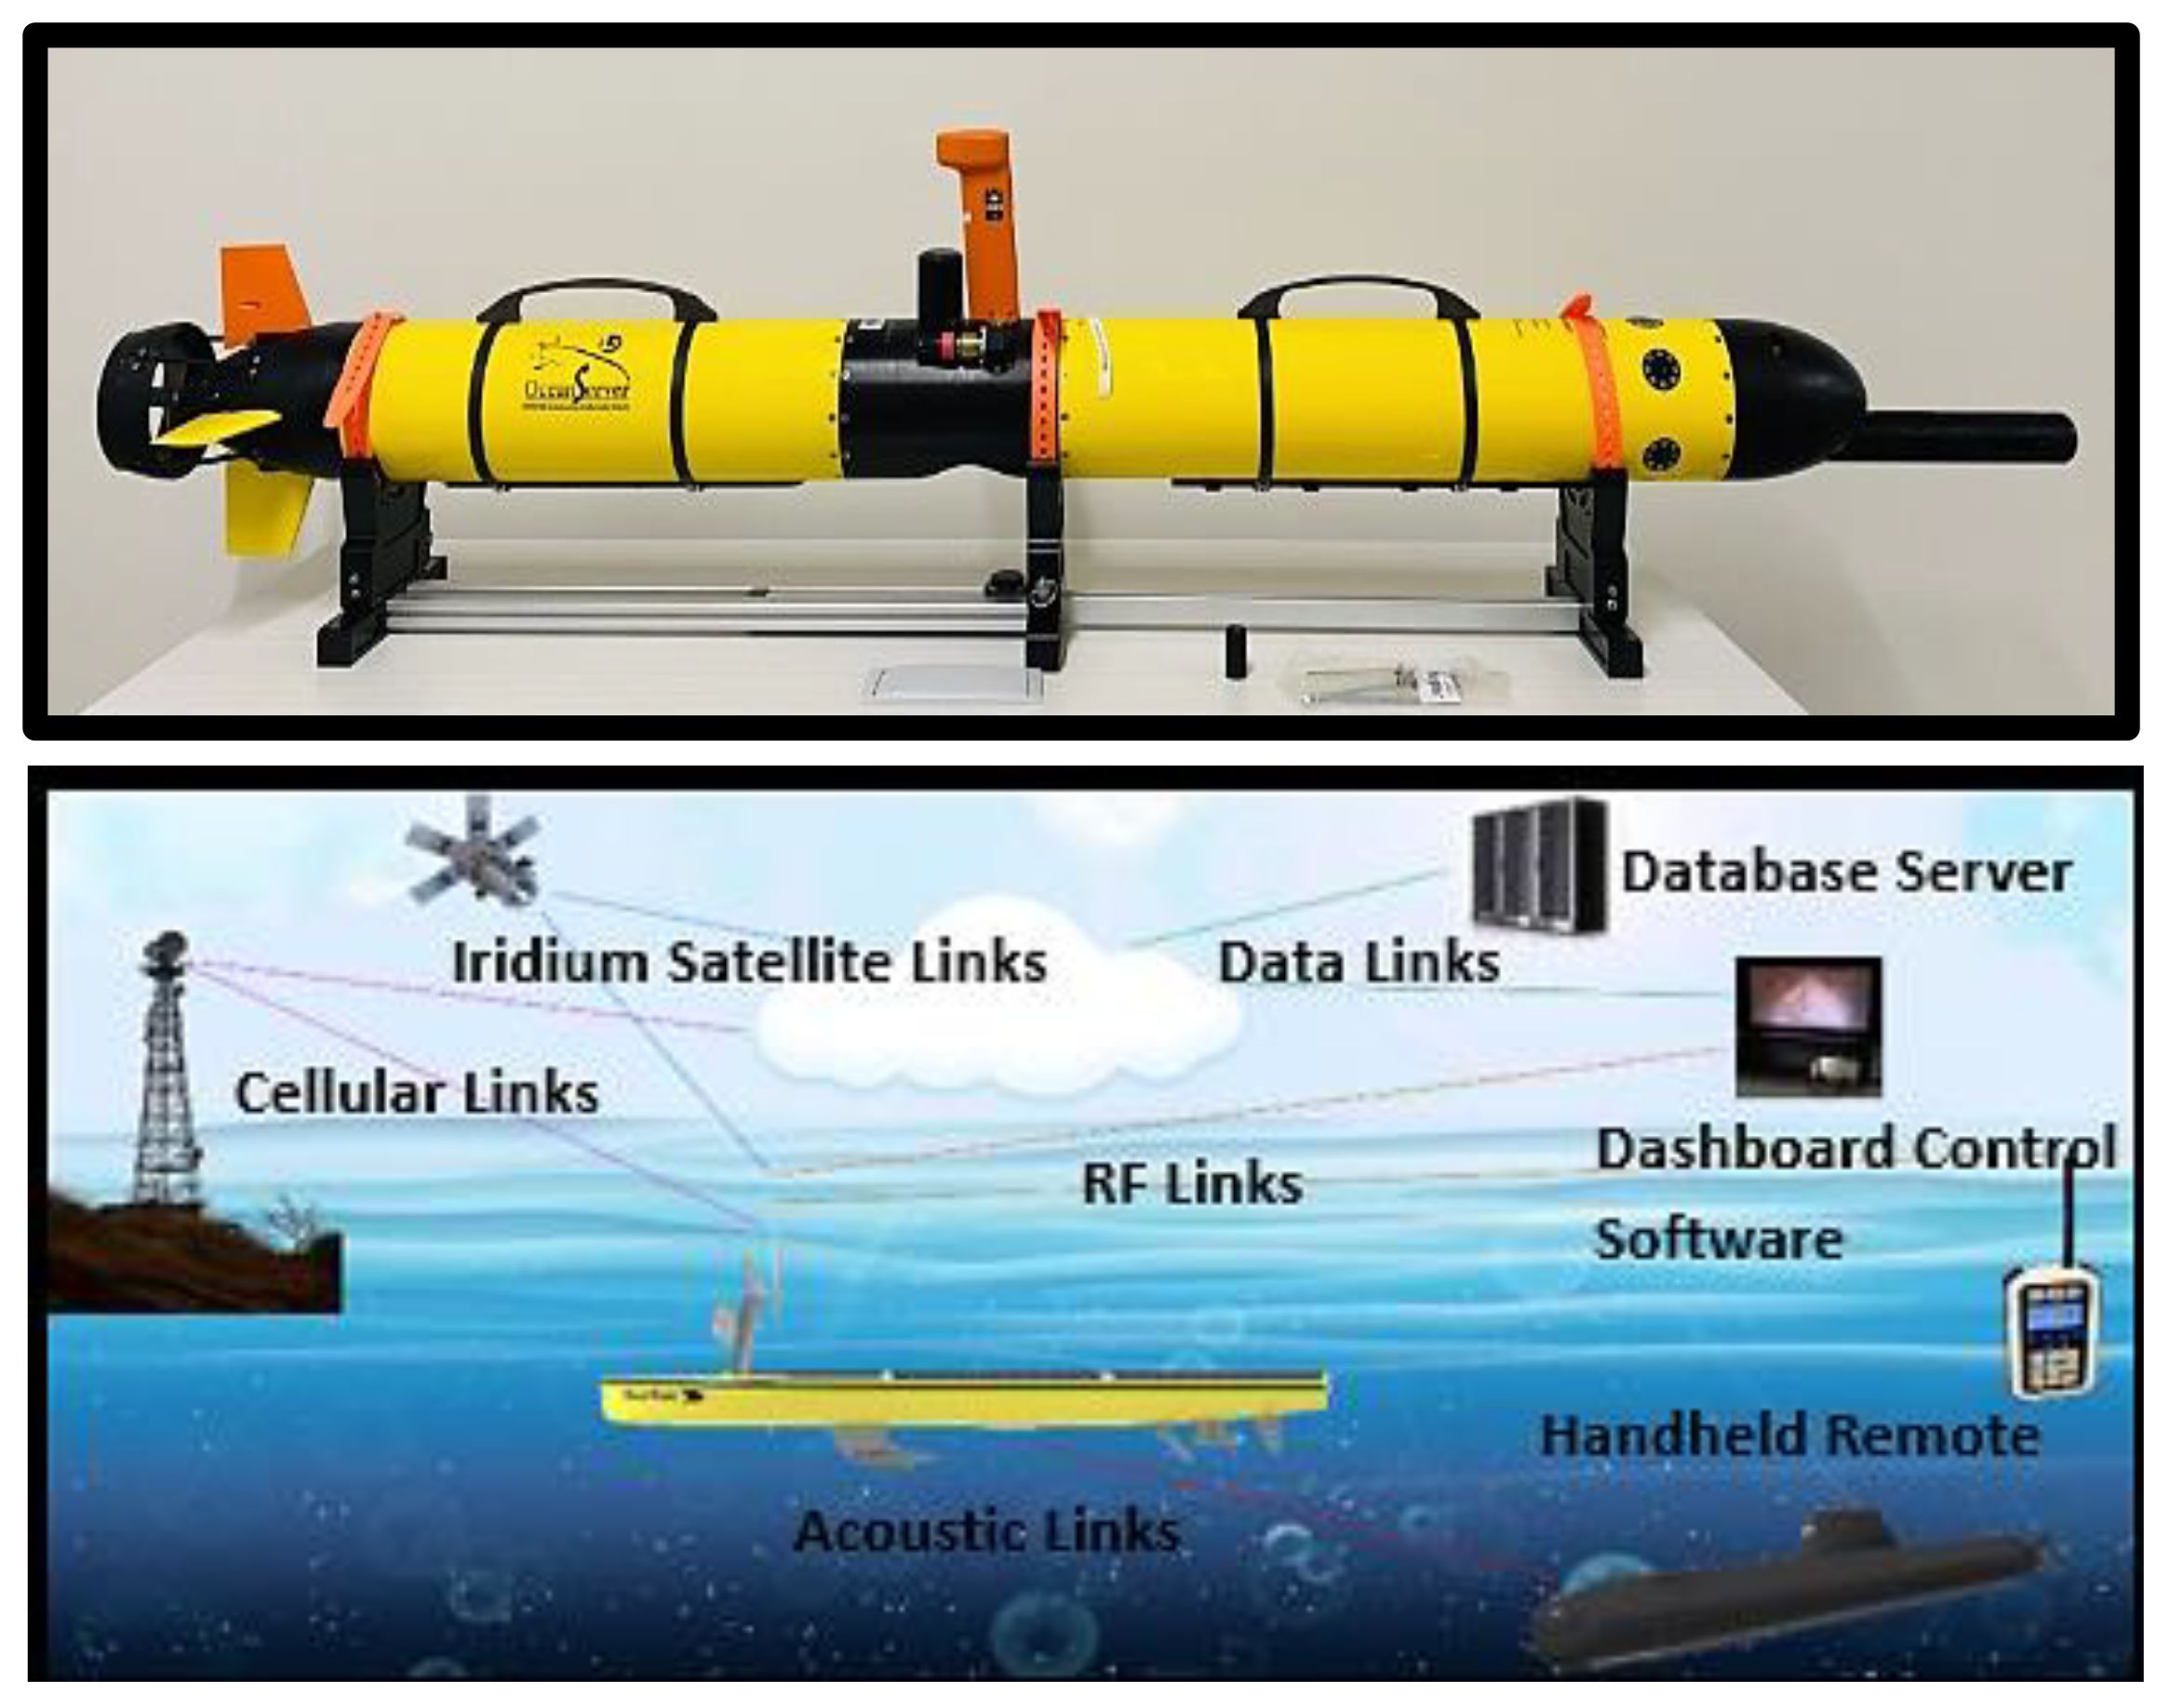
Figure 9 Uncrewed subsurface systems.
These systems are equipped with CTD sensors that measure conductivity, temperature, salinity, wave cameras, currents, pH, dissolved nutrients, crude oil, chlorophyll-fluorescence, dissolved oxygen (DO), and turbidity as a function of depth, surface, and sub-surface tracks. The data is stored in each system’s internal memory. The data files are sent back to USM’s data processing center via Iridium or directly recovered from the vehicles. This sensor data is ingested into CUBEnet’s data environment and CUBEnet’s visualization tools are used to display and make it available in real time on CUBEnet’s servers.
Figure 10 are examples of the data taken by one of USM’s uncrewed systems. This includes wind speed, directions, air temperature, surface currents, current heading, temperature, salinity, and sound velocity profiles.
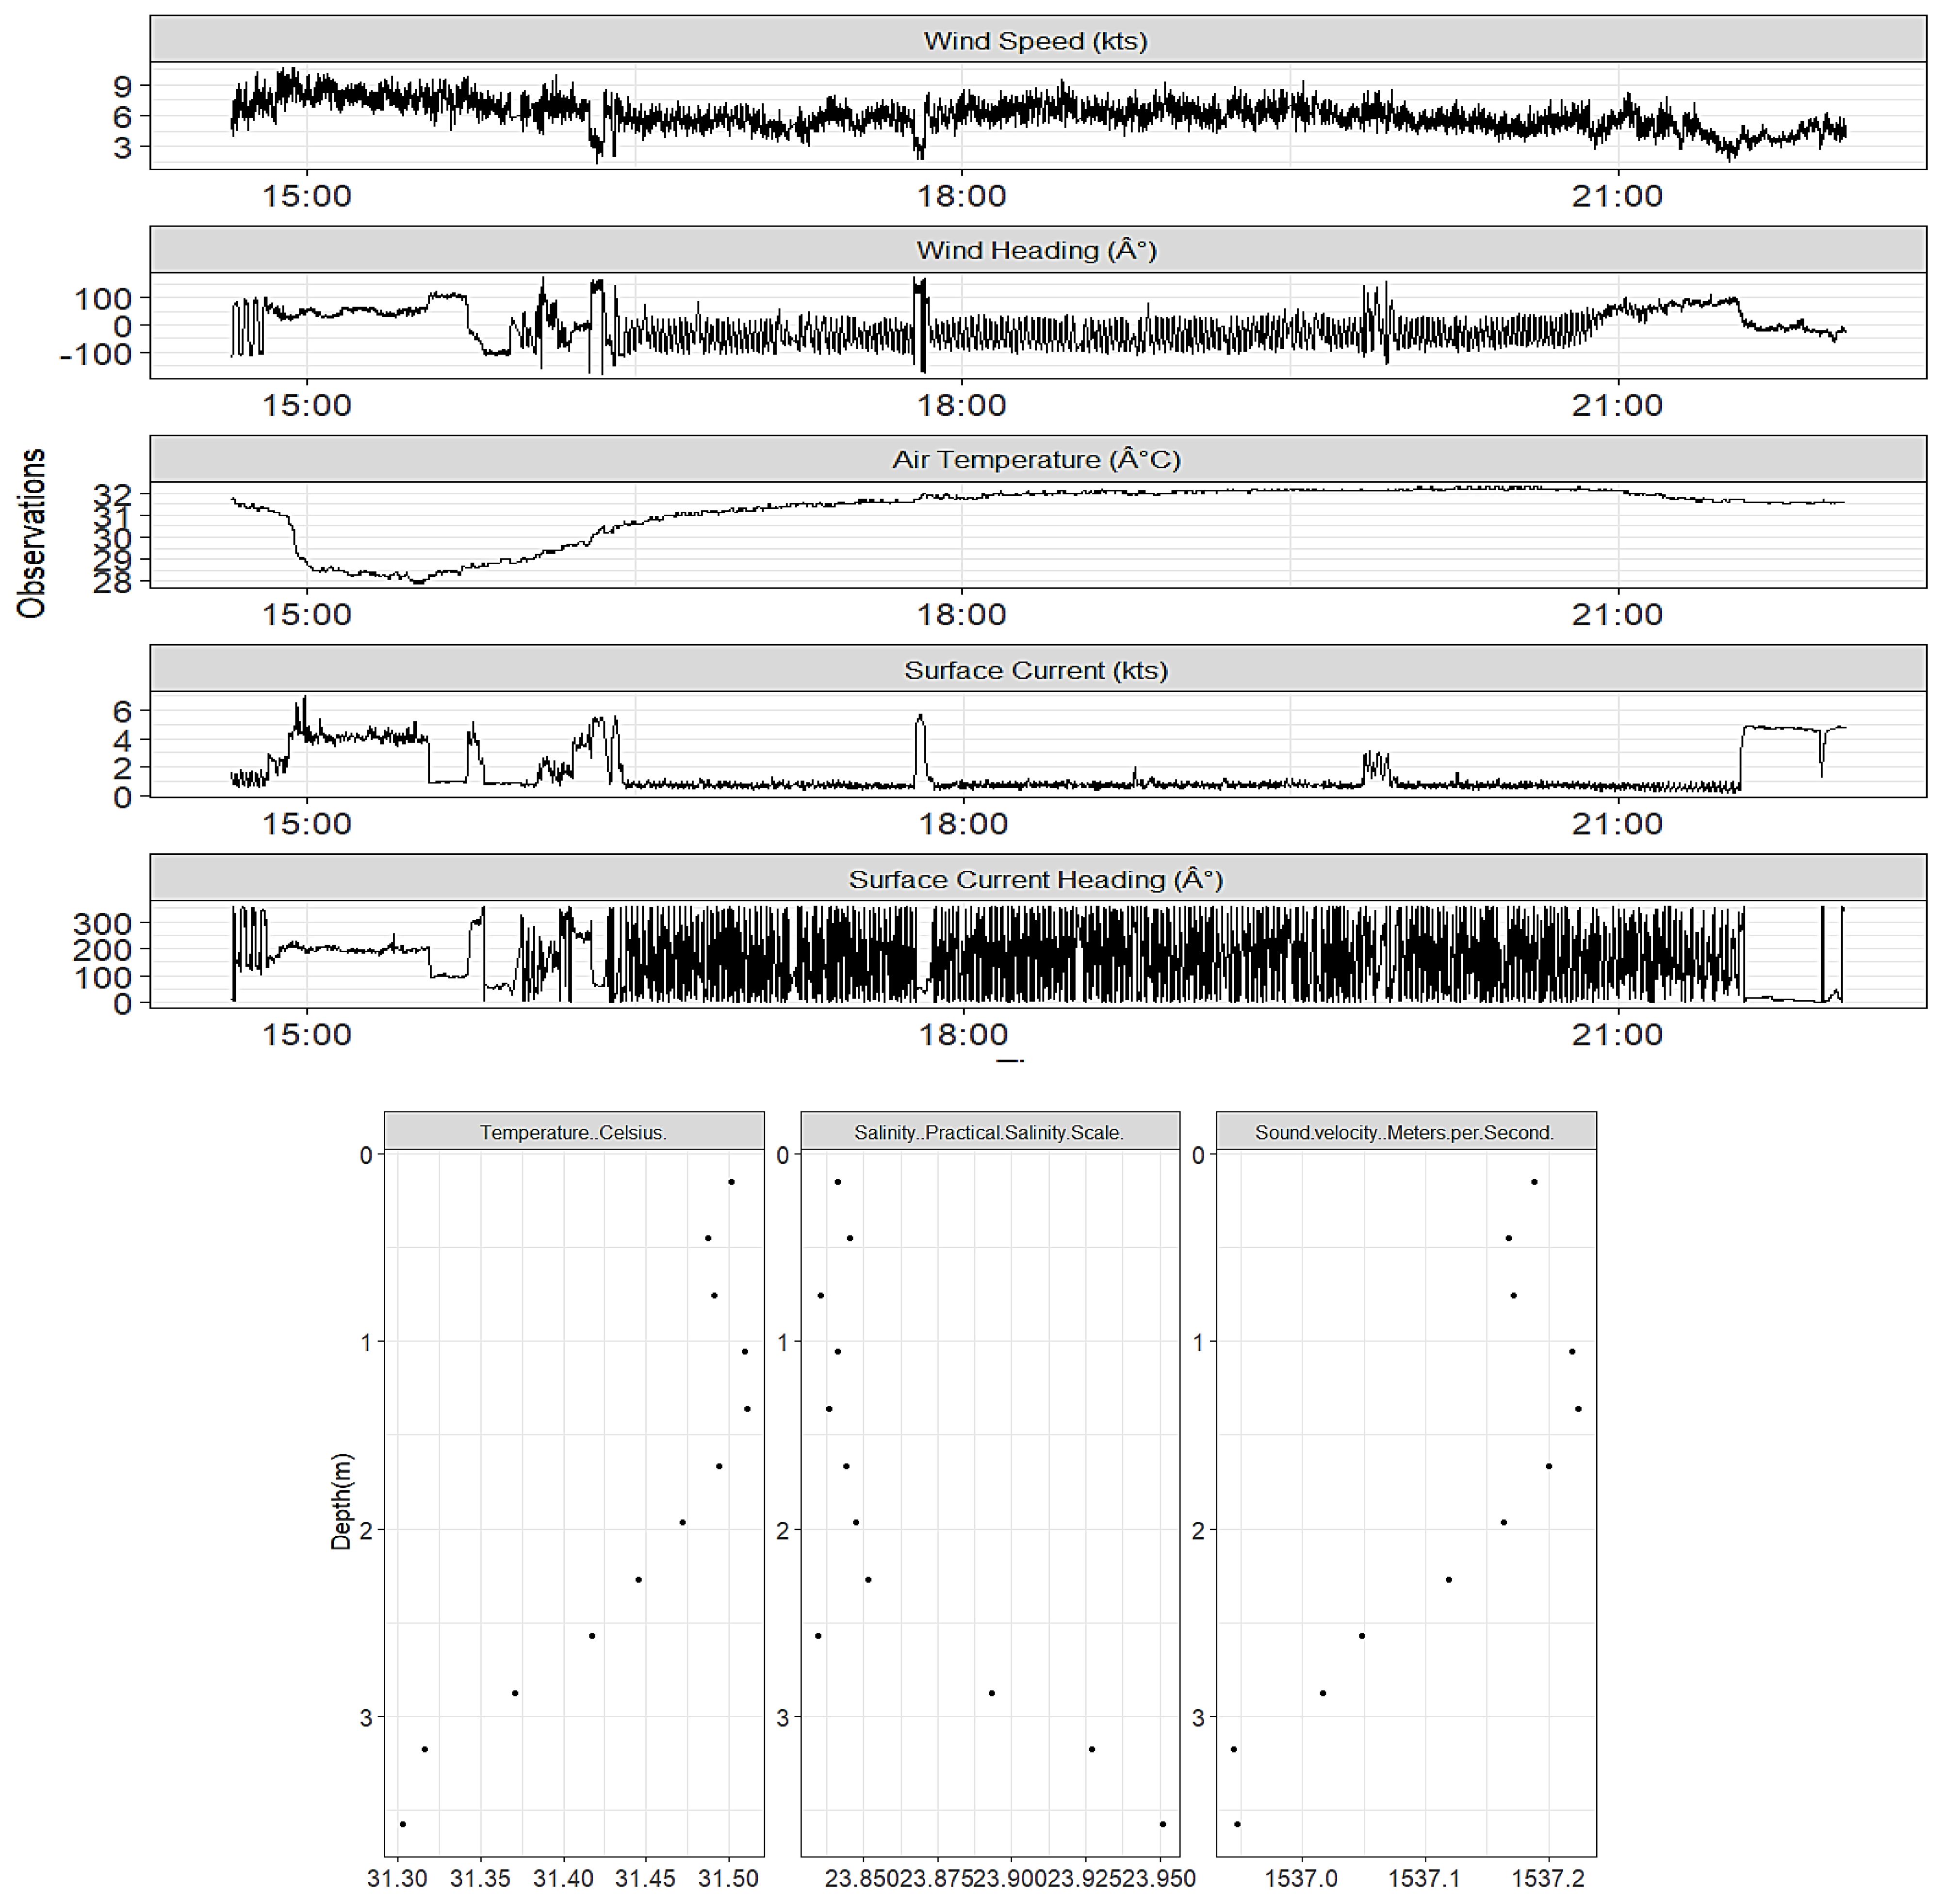
Figure 10 Wind speed, heading. air temperature, surface currents, current heading, temperature, salinity, and sound velocity profiles in the test space.
USM has a number of small buoy systems (SBS) that provide long duration autonomous operations in between the larger moored systems. These systems are also deployed in the CUBEnet data environment when the large moored systems are offline for maintenance. These SBS feature a rugged compact portable solar powered 7.45kg surface buoy. The surface buoy with its onboard sensors provides the surface measurements outlined in Table 1D. Additional subsurface sensors can be added, and those measured parameters are outlined in Table 1D.
A more complete list is given in (Coastal CUBEnet User and Data Guide, 2012). These systems are also used to collect environmental data at remote locations during unmanned vehicle or sensor platform development testing.
CUBEnets’s data environment also includes data from several satellite systems (Coastal CUBEnet User and Data Guide, 2012). This includes surface chlorophyll data derived from CoastWatch and displayed when atmospheric conditions allow at least 10% coverage in the CUBEnet’s data region. The chlorophyll fluorescence estimates are made via the OC3 algorithm to calculate chlorophyll fluorescence concentrations from water leaving radiance (O’Reilly and Werdell, 2019). An example of this chlorophyll fluorescence data for coastal MS is shown in Figure 11.
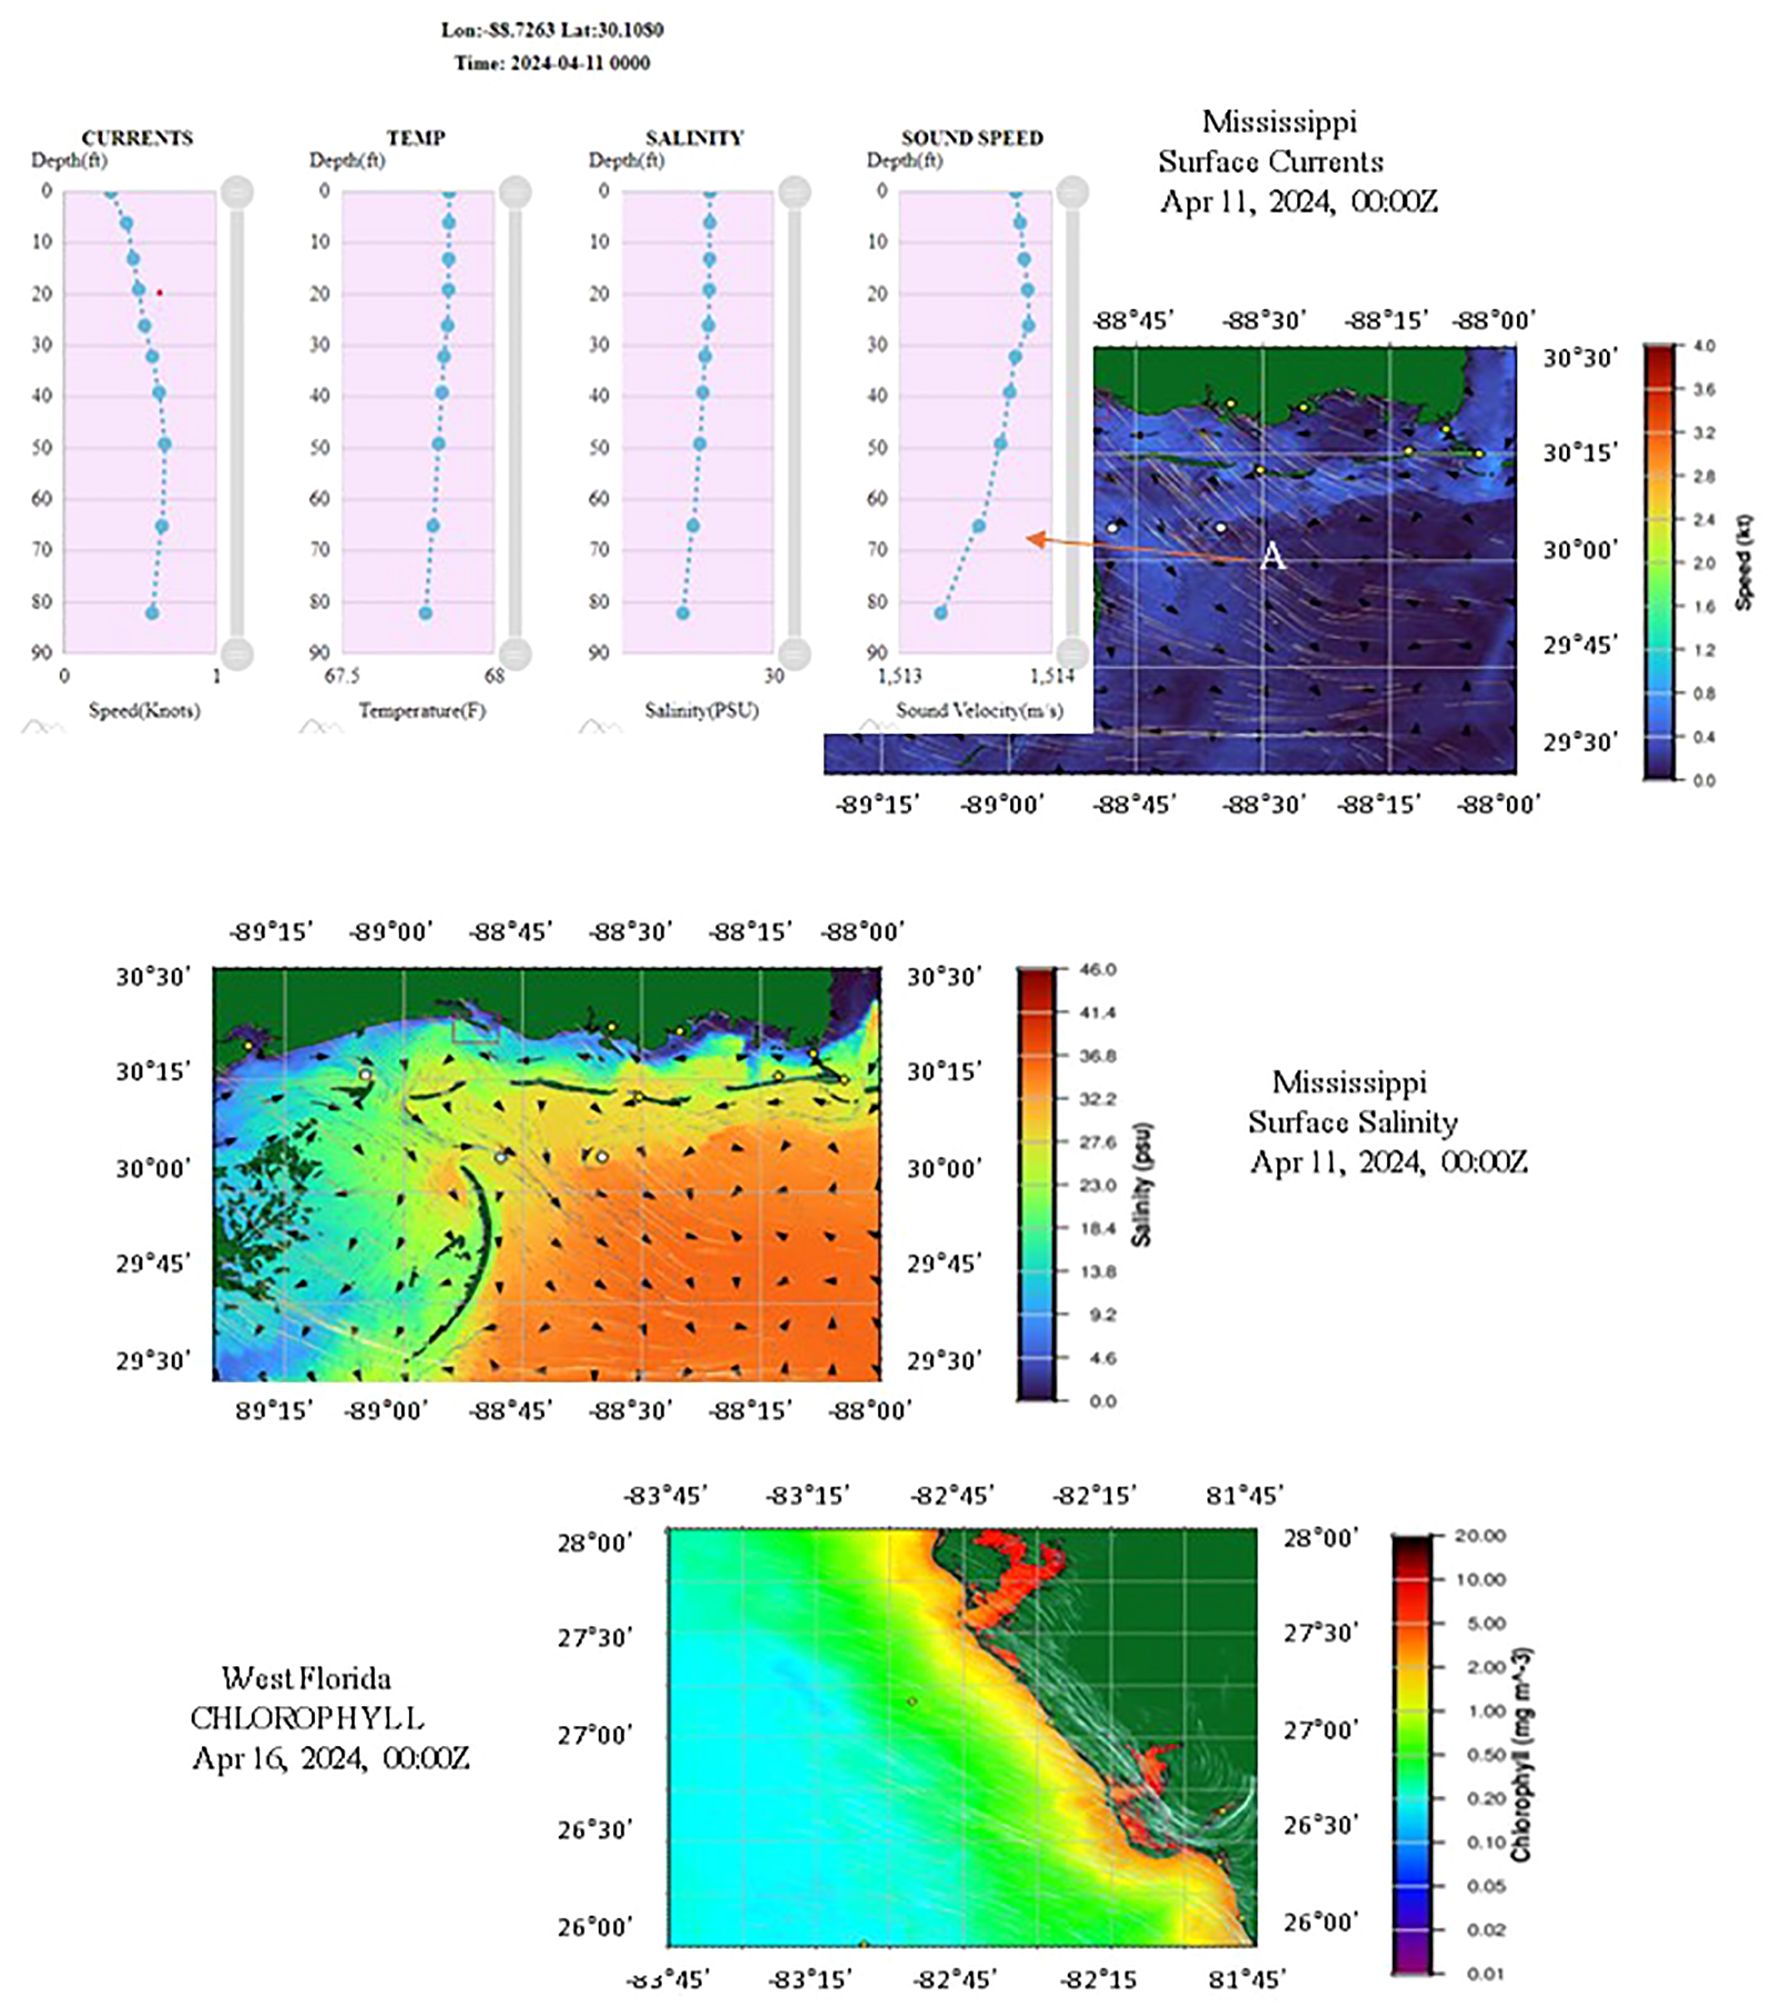
Figure 11 Examples of the interactive display of the currents and temperatures calculated from the high resolution CAWST model for the Mississippi Gulf Coast. An example of VIIRS surface Chlorophyll concentrations for Florida's Gulf Coast is also shown.
Ocean Color Level 3 VIIRS multi-sensor, daily, global, merge is produced through NOAA MultiSensor Level 1 to Level 2 processing system (MSL12). Parameters from this product suite include forty-two chlorophyll-a concentration and diffuse attenuation coefficients Kd (490) and Kd (PAR). Ocean Color satellite sensors measure visible light at specific wavelengths which leaves the surface of the ocean and arrives at the top of the atmosphere where the sensor is located. From these visible spectral measurements, along with simultaneous measurements in the near (NIR) and the shortwave infrared wavelengths, the color of the ocean, or normalized water leaving radiances (nLw), can be calculated. Then, the nLws are used to derive other ocean properties such as the concentration of chlorophyll-a (chlor-a or sometimes chl, which is the green pigment responsible for photosynthesis and therefore an indicator of the amount of phytoplankton biomass in the ocean water) and the coefficient of extinction for downwelling irradiance Kd (PAR) and Kd (490) which are related to water clarity). The surface chlorophyll data is derived from measurements made by the Visible Infrared Imaging Radiometer Suite (VIIRS) on board the Suomi National Polar Orbiting Partnership (S-NPP) satellite (NOAA Coastal Watch).
Satellite derived wind speed and Sea Surface Temperature (SST) are obtained from the CoastWatch ERDDAP server and displayed similar to the HFR observations with hourly data (TAUs) collected over the previous 48 hours. The data resolution is 0.02 degrees or about 2.2 kilometers. Data is available hourly with about a 6-hour delay from the actual observation (GHRSST NOAA/STAR GOES-16 ABI L3C America Region SST v2.70 dataset in GDS2, 2019).
CUBNet’s web accessible interactive marine modeling tools provide an understanding and accurate forecasting of the near-shore coastal environment for the GOM and MS coastal waters. CUBEnet’s modeling environment provides prototype modeling applications that are supported by real-time observations of key coastal environmental variables. These visualization tools provide parameter fields and vertical profiles from hydrodynamic models and field observations. Nowcasts and forecast results are available for the Eastern La coastline, Mobile Bay, and the West Coast of Florida. Table 2 lists the ocean models that are accessed for output products and are included within the modeling resources served by CUBEnet.
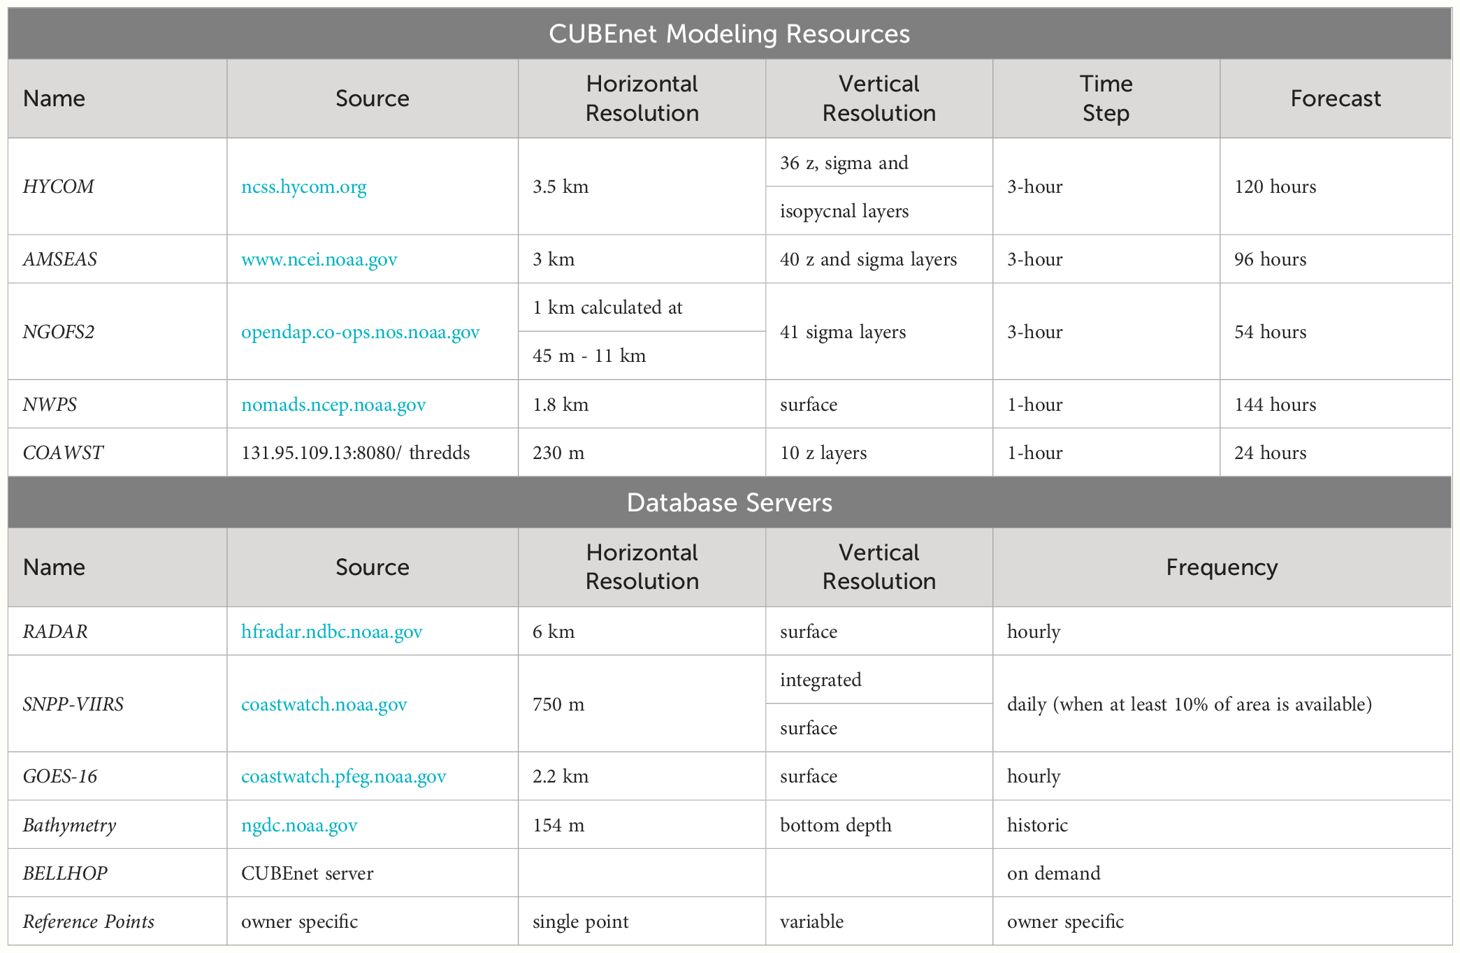
Table 2 Information about the CUBEnet’s model environments is given in the CUBEnet User and Data Guide.
Outputs from these widely used ocean models are extracted and displayed. Differences in model output stem from algorithm differences between models, varying horizontal grid spacing, utilization of differing depth coordinate systems to solve the models, temporal resolution and discrepancies in boundary conditions and inputs. A brief description of each model is provided as well as source websites in Table 2 for more details. All available observed, nowcast and forecast time steps are obtained from each model. A detailed description of the models, their implementations, and operationalization is given and discussed in the Coastal CUBEnet’s User and Data Guide, and Data Fusion and Processing Design Document (Bernard et al., 2021).
HYCOM is the Naval Oceanographic Office’s operational basin-scale and global ocean model (Chassignet et al., 2007; National Centers for Environmental Information FNMOC navy global hybrid coordinate ocean model.). HYCOM is named after its hybrid vertical coordinate system that uses the layered continuity equation to transition between sigma, isopycnal, and z depth layers. The solution is calculated with forcing from the Navy Global Environmental Model (NAVGEM) (Hogan et al., 2014) and tidal forcing for thirty-six vertical layers. Satellite and in situ observations are assimilated using the Navy Coupled Ocean Data Assimilation system (NCODA) (Cummings et al., 2005). Each nowcast and forecast is interpolated to a 1/25-degree horizontal and forty standard zlevel grid for distribution (HYCOM User’s Manual and Guide).
AMSEAS is a regional NCOM model with a domain that includes the Gulf of Mexico and Caribbean Sea (Zaron et al., 2005). AMSEAS operational model output produces 96-hour forecasts saved with 3-hour resolution and is updated daily at midnight GMT. The AMSEAS model grid has a 1/30 degree (about 3 km) horizontal resolution with forty vertical levels. The AMSEAS output parameters include ocean temperature, salinity, eastward and northward currents, and sea surface elevation. As with HYCOM, in situ observations are assimilated using the Navy Coupled Ocean Data Assimilation system (NCODA). Surface forcing is obtained from the Coupled Ocean/Atmosphere Mesoscale Prediction System (COAMPS) (Hodur, 1997), with lateral boundary conditions drawn from the operational 1/12-degree global HYCOM (FNMOC Navy Global Hybrid Coordinate Ocean Model).
The Northern Gulf of Mexico Operational Forecast System version 2 (NGOFS2) model is run and maintained by NOAA’s Center for Operational Oceanographic Products and Services (The northern Gulf of Mexico operational forecast system (NGOFS2).). The model is run four times daily (0300, 0900, 1500, and 2100) and provides 6-hour nowcasts using already received observations and 48-hour forecasts with saved output at 3-hour temporal increments (TAUs). The model is run on an unstructured grid that allows variable horizontal resolutions of 45m to 10km. NGOFS2 runs on forty-one vertical sigma layers. The model is interpolated to regularly spaced grids (1 km resolution) for distribution. This regularly spaced grid is the version typically used by CUBEnet (Coastal CUBEnet User and Data Guide, 2012).
NWPS is a large set of models developed and maintained by the various Weather Forecast Offices (WFOs) throughout the coastal United States (Nearshore Prediction System National weather service, environmental modeling center.). While not all WFOs support the same data types or horizontal resolutions, all the CUBEnet NWPS data sources provide full 1.8 km resolution coverage. Higher resolution data (five hundred meters) are available from the local area’s WFOs but do not provide the full coverage needed. All the NSPS providers included the following parameters: Winds (Speed and Direction), Wave Height, Wave Direction, Wave Period, Swell Height, and Surface Elevation. The Baton Rouge La WFO provides Surface Currents (Speed and Direction) parameters for its coverage areas. The data are available four times daily at the 00, 06, 1200 and 1800-hour marks. All data are downloaded in “grib” format and are converted to NetCDF to be consistent with the CUBEnet processing software.
The BELLHOP beam tracing model is run on demand by the user to predict acoustic transmission loss along a selected path. A Fortran-based version of the BELLHOP software is housed on a USM server. The input to the software includes bathymetry, estimates of sound speed, source depth, and frequency. Output options include ray coordinates, travel time, amplitude, eigenrays, and acoustic pressure or transmission loss. This data is used to determine the performance limits for uncrewed subsurface and surface acoustic communication ranges, target detections, classification probabilities, and sea floor mapping (Porter and Bucker, 1987).
To responsibly manage our coastal resources requires an understanding of the processes responsible for coastal change and variabilities. To address this need, the USGS has been leading the development of a Coupled Ocean-Atmosphere-Waves-Sediment Transport (COAWST) Modeling System, which provides ocean modelers with the ability to evaluate how different processes such as winds, waves, and sediment transport interact with coastlines and modify them. The elements of the COAWST modeling system are integrated by the Model Coupling Toolkit (MCT) to exchange data fields between each modeling element. Originally these consisted of the ocean model ROMS, the atmosphere model WRF, the wave model SWAN and the Community Sediment Transport Model System (CSTMS) (Warner et al., 2010). Figure 12 illustrates the data fields exchanged between each model. Development of the publicly available COAWST model provides an understanding of ocean circulation and can be applied to provide daily forecasts of water levels, currents, ocean water temperature, salinity, wave heights, and sediment movement within a given coastal region of interest. COAWST-based model applications can also assess the vulnerability of coastal areas to natural hazards such as surge, waves, elevated winds associated with storm fronts or tropical systems, as well as freshwater diversions.
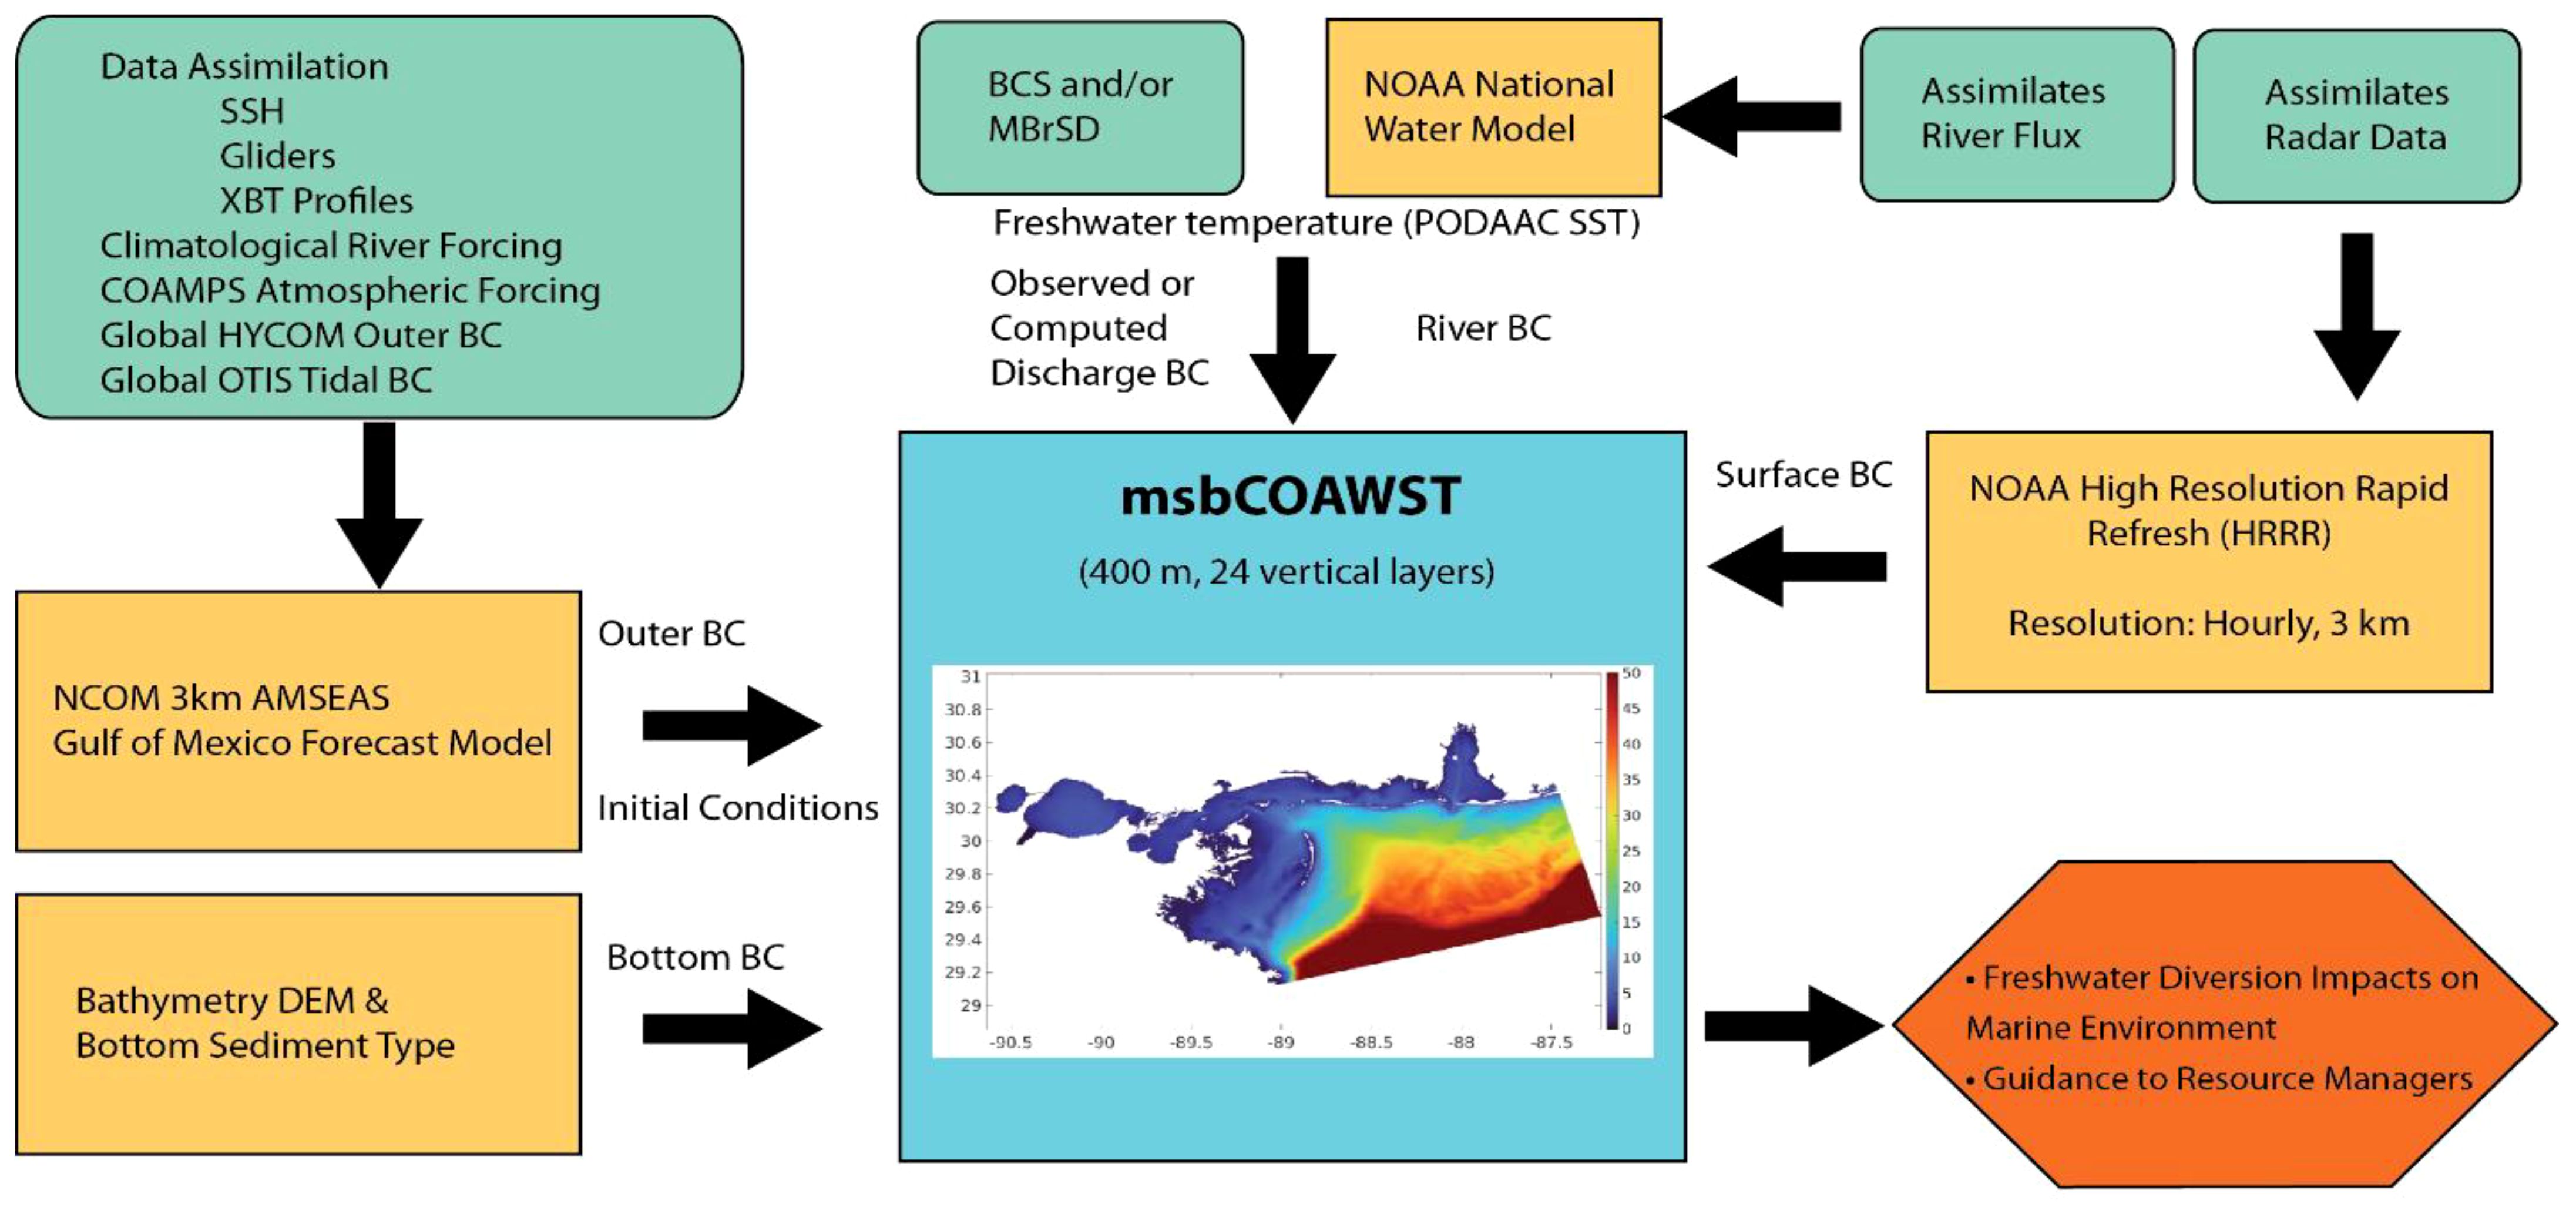
Figure 12 Data fields exchanged between each model.
The USM modeling group in the Division of Marine Science has developed an implementation of COAWST for the Mississippi Bight region (msbCOAWST) that has been used to investigate shore to shelf advective exchange processes and their influence on coastal water quality conditions that support the region’s prolific marine ecosystem (Greer et al., 2018, Greer et al, 2020). The regional advective exchanges and circulation dynamics are governed by the complex coastal circulation system influenced by river discharge patterns, human manipulated freshwater diversions, and meteorological forcing that ranges from diurnal sea breeze influences to intermittent synoptic events such as storm fronts and tropical storm systems.
Much of the research with msbCOAWST has been to perform hindcasts to support interpretation of in situ observations through provision of detailed spatial-temporal characterization of the hydrodynamic environment, and to perform projections of impacts of freshwater diversions
(Parra et al., 2020; Wiggert et al., 2022). More recently, a near real-time daily model has been developed, which is included as a CUBENet modeling resource Table 2. MsbCOAWST employs a 400m resolution structured grid with twenty-four vertical layers. Surface boundary conditions are obtained from the NOAA High Resolution Rapid Refresh (HRRR) model river forcing (Benjamin et al., 2016) is obtained from NOAA National Water Model and outer boundary conditions are obtained from AMSEAS. Results of the previous day’s hindcast are made available as NetCDF files on the USM THREDDS server at about 1500Z. To maintain consistency with the other model resources in CUBENet, the ten vertical depth levels used by HYCOM, AMSEAS and NGOFS2 for the Mississippi Coast area are also interpolated from the msbCOAWST output. Specifically: 0, 2, 4, 6, 8, 10, 12, 15, 20, 25 meters. The available parameters are vector currents, temperature, salinity, and surface elevation produced by msbCOAWST, as well as the HRRR surface winds applied as boundary conditions.
The Coastal CUBEnet data is available to external users at oceancube.usm.edu (131.95.7.148). The 4-D Cube home page can be launched from this site by accessing the “Modeling” link in the home page graphic or in the text above the graphic. Similarly, the “Data” link in the graphic or the text immediately above the graphic can be used to link to oceancube.usm.edu:3001 which provides a series of graphic displays of instrumentation data using a software package. Additional features such as access to model data, external web sites and documentation are provided using the links along the top banner. These links are available from all 4-D Cube web pages. Except for acoustic transmission loss, all data displayed on the Cube is obtained from external sources chosen to provide trusted and reliable comprehensive coverage of the region. Once received, data/output are geographically extracted and then the [Generic Mapping Tool software (GMT)] from the University of Hawaii’s School of Earth Science and Technology is used to generate data graphics (Wessel et al., 2019). The visualization tools and their application are also extensively described in detail in the Coastal CUBEnet’s User and Data Guide. Outputs from these widely used ocean models are displayed using CUBEnet’s Web Accessible Visualization Tools.
Figure 11 are examples of the interactive display of the salinity, and temperatures calculated from the high resolution msbCOAWST model in the MS coastal area. The black arrows show the surface current directions and the white lines the surface wind directions. An example of the model generated salinity, current, temperatures, and sound speed profiles at point A are shown in Figure 11. Also shown in Figure 11 is an example of surface Chlorophyll concentrations for the coast of MS derived from the VIIRS satellite.
There is also the capability of displaying track data from sensor vehicles that can be updated with near real-time data. When hovering over the track line, the option to download the position data for the vehicle is displayed. A click on these track lines will generate a download of the vehicle position data for that track line as a Comma Separated Values (.csv) file.
Figure 13 displays the top-level wiring diagram showing the data flow into the CUBEnet. The CUBEnet’s open infrastructure is designed to ingest data from multiple sources. CUBEnet dynamically acquires data from several sources, processes these data, and makes these data sets available to users through various web-based interfaces. The first step in the generation of the CUBEnet model web interface is in the gathering of the modeling and environmental data sets. These include moored and mobile systems, satellites, other web servers, shipping vessels, unmanned maritime systems, and high-resolution model runs.

Figure 13 CUBEnet wiring.
The first step in generation of the CUBEnet web interface is in the gathering of the data. There are three types of data that are displayed, each has slightly differentprocessing requirements. The most frequent data is the model forecasts which predict the expected future conditions starting at the timeof the model run. The other major typedata is observational data from the fixed, mobile, surface, and subsurface systems. Examples of these are the GOES-16 satellite and HF radar data. There third data format includes the bathymetric data layer which is fixed and unchanging and the chlorophyll data graphic which is single graphic derived daily from VIIRS satellite data if sufficient coverage exists. After the data is downloaded, manipulation is normally needed to prepare the data for common downstream processing. If the data can be obtained through a site that supports netcdf subsetting, a single netcdf file containing all the oceanographic parameters for an area can be downloaded with a single call. This is the case for the HYCOM and GOES-16 model data. If the data is distributed through a DOD server, this data can be downloaded with a single call but must be re-written into a netcdf file for processing (AMSEAS model).
In the case of the NGOFS2 data, each TAU (time increment) of a model run is stored as a separate file and must be downloaded individually. Once all the TAUs are downloaded, they are combined into a single netcdf file. Other format conversions must be made for HF radar data which is an ascii data file and NWPS which is obtained in a GRIB format. If the data is unstructured, such as obtained from the NGOFS2 and USM’s COAWST model, higher resolution grids can be created by gridding the denser points available in the shallow water and producing netcdf formatted files.
The model processing path produces individual netcdf files that are used for each graphic image. A single netcdf file is created for each parameter type (salinity, temperature, etc.), at each depth, and for each TAU. During this step, unit conversions are also performed. Degrees Centigrade are converted to degrees Fahrenheit, meters of are converted to feet, and meters per second are converted to knots. For vector data such as wind and currents, two forms of netcdf files representing the data are produced. The first form consists of netcdf files that contain the ‘u’ and ‘v’ components of the velocity vectors, and the second form are files for the speed and direction of the vectors. Once the individual netcdf files are created, graphic images for each parameter at each depth and for each TAU are created using the Generic Mapping Toolkit (GMT).
Finally, an HTML page containing all the JavaScript functionality of the web-based interface is created and combined with all the graphic images and supporting gridded data into a single package that is copied to the web server into the appropriate directory to replace the previous model version.
Oceanographic data collected by sensors on unmanned vehicles and moored buoys are transmitted to shore-based stations in near real-time. These data are loaded into a CUBEnet backend database and are immediately available in the form of viewable graphs or downloadable datasets via a web-based interface. There are two separate web-based interfaces available for accessing the data. In addition to offering data query and downloads of instrumentation data, CUBEnet’s software plots the data using dynamic sophisticated graphing. The second interface is provided by a RESTful API that allows for a more traditional method of querying the database from parameters provided in a URL request. Data from the backend database is then downloaded in JSON format.
The high-frequency RADAR data, GOES-16 satellite data, VIIRS chlorophyll, bathymetry and other data are acquired from the database servers shown in Table 2.
Current and future work involves the assimilation of these real time data sets into msbCOAST for short term forecasts. These high-resolution data sets will also be used for future ecosystem modeling efforts. Currently the model and data are being used in the testing and evaluations of uncrewed maritime systems. The data and model outputs provide mission planning and post mission analysis. Knowing the water column characteristics along a selected track is critical for successful uncrewed underwater vehicle mission performance. The CUBEnet system does provide this critical data along any pre-selected mission course. The water temperature, salinity, and density along the selected course can assist in estimating the required ballasting needed for a particular vehicle payload and mission.
CUBEnet also allows for the ongoing development of real-time model analytics, machine learning, and other artificial intelligence models. These models, as products themselves, can be used as additional inputs to spur development of new analytical and predictive methods to inform stakeholders of ocean processes and their variabilities more fully. As more data is added to the system, the system will become more knowledgeable and precise in the outputs.
Currently a prototype generative AI called SeaWatch AI is being trained with CUBEnet data. A user can ask questions of selected CUBEnet data as well as implement their own ML algorithms using the loaded data. We are exploring ways to be able to offer this functionality to users without incurring extreme costs to our programs (Kar et al., 2023). has used CUBnet’s vertical current profile data to demonstrate that with limited training data, 80% of the variation in the current speed profiles across the forecast period and the depth levels can be explained.
Studies to develop accurate short-term forecast of wave heights and extreme events prediction from buoy data using a deep learning approach has been proposed by (Kar et al., 2024).
The datasets presented in this study can be found in online repositories. The names of the repository/repositories and accession number(s) can be found below: http://oceancube.usm.edu/.
SS: Writing – original draft, Writing – review & editing, Conceptualization, Investigation, Supervision, Formal analysis, Methodology, Funding acquisition, Validation. JW: Data curation, Funding acquisition, Investigation, Methodology, Writing – original draft, Writing – review & editing. LB: Conceptualization, Methodology, Project administration, Resources, Supervision, Writing – original draft, Writing – review & editing. JM: Funding acquisition, Methodology, Resources, Supervision, Writing – review & editing. VS: Data curation, Formal analysis, Methodology, Software, Validation, Visualization, Writing – review & editing, Investigation. JB: Methodology, Resources, Software, Validation, Visualization, Writing – review & editing. AD: Data curation, Formal analysis, Investigation, Visualization, Writing – review & editing.
The author(s) declare that no financial support was received for the research, authorship, and/or publication of this article.
The authors express their appreciation for the support received from: (1) the U.S. Army Engineer Research and Development Center (ERDC) under Grant - ERDC-MECI-PLA-0002, Title: High-Resolution Coastal Test Area and Estuarine Model Development; (2) the Department of Homeland Security (DHS) Maritime Domain Awareness, Border Security Technology Consortium (BSTC) under Grant - BSTC Base Agreement: 2021–450 and BSTC Project Agreement: 20–05-007, Title: Using Networked Unmanned Systems with Integrated High-Resolution Sensors; and (3) the Naval Research Laboratory under BAA-N00173–19-S-BA01, Title: Parallel Research in Oceanography, Numerical Modeling, Ocean Bio-Optics, and Physical Processes. The authors also acknowledge HPC at The University of Southern Mississippi supported by the National Science Foundation under the Major Research Instrumentation (MRI) program via Grant # ACI 1626217.
The authors declare that the research was conducted in the absence of any commercial or financial relationships that could be construed as a potential conflict of interest.
All claims expressed in this article are solely those of the authors and do not necessarily represent those of their affiliated organizations, or those of the publisher, the editors and the reviewers. Any product that may be evaluated in this article, or claim that may be made by its manufacturer, is not guaranteed or endorsed by the publisher.
(2019) GHRSST NOAA/STAR GOES-16 ABI L3C America Region SST, v2.70 dataset in GDS2. PO. DAAC/JPL/NASA. Available online at: https://podaac.jpl.nasa.gov/dataset/ABI_G16-STAR-L3C- v2.70.
Barrick D. E., Evans W., Weber B. L. (1977). Ocean surface currents mapped by radar. Science 198, 138–144. doi: 10.1126/science.198.4313.138
Barrick D. E., Lipa B. J. (1999). Using antenna patterns to improve the quality of SeaSonde HF radar surface Current Maps. Proc. IEEE Sixth Working Conf. Curr. 58, 5–9. doi: 10.1109/CCM.1999.755204
Benjamin S. G., Weygandt S., Brown L. M., Hu M., Alexander C. R., Smirnova T. G., et al. (2016). A north american hourly assimilation and model forecast cycle: the rapid refresh. Monthly Weather Rev. 144 4, 1669–1694. doi: 10.1175/MWR-D-15-0242.1
Bernard L., Stanic S., Braud J., Sunkara V. (2021) Data Fusion and Processing Design Document, and Toolkit for Importing the Nearshore Ocean Data into the Cube. Available online at: http://oceancube.usm.edu/docs/Data_Fusion.pdf.
Burnett W., Crout R., Bushnell J., Thomas J., Fredricks J., Bosch J., et al. (2010). Quality assurance of real time ocean data: evolving infrastructure and increasing data management to monitor the world’s environment. Eur. Space Agency 12. doi: 10.5270/OceanObs09.cwp
Chassignet E. P., Hurlburt H. E., Smedstad O. M., Halliwell G. R., Hogan P. J., Wallcraft A. J., et al. (2007). (HYbrid coordinate ocean model) data assimilative system. J. Mar. Syst. 65, 60–83. doi: 10.1016/j.jmarsys.2005.09.016
Coastal CUBEnet User and Data Guide (2012) USM division of marine science. Available online at: http://oceancube.usm.edu/.
Cummings J. A. (2005). Operational multivariate ocean data assimilation. Q. J. R. Meteorological Soc. 131, 3583–3604. doi: 10.1256/qj.05.105
Delory E., Pearlman J. (2018). “Challenges and innovations in ocean in situ sensors,” in Measuring inner ocean processes and health in the digital age (Amsterdam: Elsevier).
Emery B. M., Washburn L., Whelan C., Barrick D., Harlan J. (2014). Measuring antenna patterns for ocean surface. J. Atmospheric Oceanic Technol. 31, 1564–1582. doi: 10.1175/JTECH-D-13-00181.1
Greer A. G., Boyette A., Cruz V. J., Cambazoglu M. K., Dzwonkowski B., Chiaverano L. M., et al. (2020). Contrasting fine scale distributional patterns of zooplankton driven by the formation of a diatom-dominated thin layer. Limnology Oceanography 65, 2236–2258. doi: 10.1002/lno.11450
Greer A. T., Shiller A. M., Hofmann E. E., Wiggert J. D., Warner S. J., Parra S. M., et al. (2018). Functioning of coastal river- dominated ecosystems and implications for oil spill response: From observations to mechanisms and models. Oceanography 31, 90–103. doi: 10.5670/oceanog.2018.302
Hodur R.M. (1997). The naval research laboratory’s coupled ocean/atmosphere mesoscale prediction system (COAMPS). Monthly Weather Rev. 125, 1414–1430. doi: 10.1175/1520-0493(1997)125<1414:TNRLSC>2.0.CO;2
Hogan T. F., Liu M. A., Ridout J. A., Peng M. S., Whitcomb T. R., Ruston B. C., et al. (2014). The navy global environmental model. Oceanography. 27, 116–125. doi: 10.5670/oceanog.2014.73
HYCOM user’s manual and guide. Available online at: https://www.hycom.org/hycom/documentation.
Kar S., McKenna J. R., Anglada G., Sunkara V., Coniglione R., Stanic S., et al. (2023). Forecasting vertical profiles of ocean currents from surface characteristics: A multivariate multi-head convolutional neural network–long short-term memory approach. J. Mar. Sci. Eng. 11, 1964. doi: 10.3390/jmse11101964
Kar S., McKenna J. R., Vishwamithra S., Coniglione R., Stanic S., Bernard L. (2024). XWaveNet: enabling uncertainty quantification in short-term ocean wave height forecasts and extreme event prediction. Appl. Ocean Res. 148, 103994. doi: 10.1016/j.apor.2024.103994
National Centers for Environmental Information FNMOC navy global hybrid coordinate ocean model. Available online at: https://www.ncei.noaa.gov/products/weather-climate-models/frnmoc-navy-global-hybrid-ocean.
National Oceanic and Atmospheric Administration, National Ocean Service, Integrated Ocean Observing System (2019). Manual for real-time quality control of in-situ current observations: A guide to quality control and quality assurance of acoustic doppler current profiler observations, version 2.1 (U.S. Department of Commerce). doi: 10.25923/sqe9-e310
National Research Council, Washington, DC (2011) (The National Academies Press). doi: 10.17226/13081
Nearshore Prediction System National weather service, environmental modeling center. Available online at: https://polar.ncep.noaa.gov/nwps/.
NOAA NDBC, “NOAA HF Radar National Sever,” Available at: https://hfradar.ndbc.noaa.gov/.
NOAA Coastal Watch. Available online at: https://coastwatch.noaa.gov/cwn/products/noaa-msl12-ocean-color-near-real-time-viirs-multi-sensor-snpp-noaa-20-daily-merge.html.
O’Reilly J. E., Werdell P. J. (2019). Chlorophyll algorithms for ocean color sensors - OC4, OC5 & OC6. Rem. Sens. Env. 229, 32–47. doi: 10.1016/j.rse.2019.04.021
Paduan J. D., Kim K. C., Cook M. S., Chavez F. P. (2006). Calibration and validation of direction finding high frequency radar ocean surface current observations. IEEE J. Ocean Eng. 31, 862–875. doi: 10.1109/JOE.2006.886195
Parra S. M., Sanial V., Boyette A., Cambazoglu M. K., Soto I. M., Greer A. T., et al. (2020). MS. 2020, Bonnet Carré Spillway freshwater transport andcorresponding biochemical properties in the Mississippi Bight. Continental Shelf Res. 199, 104–114. doi: 10.1016/j.csr.2020.104114
Porter M. B., Bucker H. ,. P. (1987). Gaussian beam tracing for computing ocean acoustic fields. J. Acoust. Soc America 82, 1349–1359. doi: 10.1121/1.395269
Subcommittee on Ocean Science and Technology Committee (2018). “Science and technology for america’s oceans: A decadal vision,” in A report by the subcommittee on ocean science and technology committee on environment of the national science & Technology council, 1–55. Available at: https://trumpwhitehouse.archives.gov/wp-content/uploads/2018/11/Science-and-Technology-for-Americas-Oceans-A-Decadal-Vision.
The northern gulf of Mexico operational forecast system (NGOFS2). Available online at: https://tidesandcurrents.noaa.gov/ofs/ngofs2/ngofs_info.html.
Waves4 Manual. (2019). Datawell BV oceanographic instrumentsZomerluststraat, 2012 LM Haarlem. Nethertlands. Available at: https://datawell.nl/support/manuals/.
Wessel P., Luis J. F., Uieda L., Scharroo R., Wobbe F., Smith W. H. F., et al. (2019). Generic Mapping Tools version 6. Geochemistry, Geophysics, Geosystems. 20, 5556–5564. Available at: https://www.generic-mapping-tools.org/.
Warner J. C., Armstrong B., He. R. Y., Zambon J. B. (2010). Development of a coupled ocean-atmosphere-wave-sediment transport (COAWST) modeling system. Ocean Model. 35, 230–244. doi: 10.1016/j.ocemod.2010.07.010
Wiggert J. D., Armstrong B. N., Cambazoglu M. K., Sandeep K. K. (2022). Mid-Breton sediment diversion (MBrSD) assessment - final report (The University of Southern Mississippi), 1–96. doi: 10.18785/sose.001\
Keywords: oceanography, moored and uncrewed systems, radar, ocean models, oceanographic models
Citation: Stanic S, Wiggert JD, Bernard L, McKenna J, Sunkara V, Braud J and Diercks A (2024) Coastal CUBEnet: an integrated observation and modeling system for sustainable Northern Gulf of Mexico coastal areas. Front. Mar. Sci. 11:1400511. doi: 10.3389/fmars.2024.1400511
Received: 13 March 2024; Accepted: 30 May 2024;
Published: 18 June 2024.
Edited by:
Joanna Staneva, Institute of Coastal Systems Helmholtz Centre Hereon, GermanyReviewed by:
Zhixuan Feng, East China Normal University, ChinaCopyright © 2024 Stanic, Wiggert, Bernard, McKenna, Sunkara, Braud and Diercks. This is an open-access article distributed under the terms of the Creative Commons Attribution License (CC BY). The use, distribution or reproduction in other forums is permitted, provided the original author(s) and the copyright owner(s) are credited and that the original publication in this journal is cited, in accordance with accepted academic practice. No use, distribution or reproduction is permitted which does not comply with these terms.
*Correspondence: Steve Stanic, c3RldmUuc3RhbmljQG91dGxvb2suY29t
Disclaimer: All claims expressed in this article are solely those of the authors and do not necessarily represent those of their affiliated organizations, or those of the publisher, the editors and the reviewers. Any product that may be evaluated in this article or claim that may be made by its manufacturer is not guaranteed or endorsed by the publisher.
Research integrity at Frontiers
Learn more about the work of our research integrity team to safeguard the quality of each article we publish.