 Dong Liu1
 Zhenyu Huang2*
- 1School of Marxism, Harbin Institute of Technology, Harbin, China
- 2College of Humanities and Social Sciences, Harbin Engineering University, Harbin, China
Introduction: The marine economy has played an important role in stabilizing national economic growth and ensuring economic security. Achieving high-quality and sustainable development of the marine economy is a strategic task for China to build a maritime power. Confronting various risk factors such as financial crises, natural disasters, geopolitical conflicts, industrial transformation, and public health security, etc., marine economic resilience (MER) has received widespread attention in recent years and is considered to be crucial for high-quality and sustainable development of the marine economy.
Methods: This study takes 11 coastal provinces in China as cases, integrates 6 condition variables by building a Resistance capability-Recovery capability-Renewal capability (3R) configuration model, and uses the fuzzy-set qualitative comparative analysis (fsQCA) approach to empirically explore the configuration effect between multiple land factors and MER.
Results and discussion: (1) None of the 6 conditions in the three dimensions of resistance capability, recovery capability, and renewal capability alone constitute the necessary conditions for strong or weak MER, indicating that a single condition has weak explanatory power for MER; (2) There are two configurations for strong MER: Strong Resistance-Recovery Type and Comprehensive Strong Type. Industrial structure, governmental capability, and digital economy are the core conditions for strong MER configurations; (3) There are four weak MER configurations: Comprehensive Weak Type, Weak Recovery-Renewal Type, Weak Resistance-Recovery Type I, and Weak Resistance-Recovery Type II. This study may expand the research scope of MER influencing factors and enriching the research perspective of land-sea integration, as well as providing decision-makers with practical policy implications.
1 Introduction
The development and utilization of the ocean has become one of the important activities of human beings, and the marine economy has also become an important growth point of the global economy (Sarwar, 2022; Wang et al., 2023). China is a maritime power with 11 coastal provinces and dozens of port cities located along a coastline of over 18,000 kilometers. From 2012 to 2022, the total output of China’s marine economy increased from 5 trillion yuan to 9.5 trillion-yuan, accounting for about 9% of the gross domestic product (GDP) and playing an important role in stabilizing national economic growth and ensuring economic security (Wang, 2023a). Therefore, achieving high-quality and sustainable development of the marine economy is a strategic task for China.
Research on sustainable development of marine economy mostly focuses on resource carrying capacity (Sun et al., 2022; Ren et al., 2024), economic efficiency (Xu et al., 2023; Zhou et al., 2023), and industrial structure (Li, 2023; Zhang et al., 2024), etc., with a focus on strengthening the system’s capability to eliminate the impact of uncertain factors. However, the capability of marine economy to cope with external shocks still need to be further studied. The marine economy is a highly outward oriented economic form that is more open and complex than the land economy, making it more susceptible to risk factors such as financial crises, natural disasters, geopolitical conflicts, industrial transformation, and public health security (Mele et al., 2019; Sun et al., 2020; Pablo et al., 2022; Yan et al., 2022). For example, in 2020, under the impact of the COVID-19, China’s gross ocean product (GOP) decreased by 5.3% compared with 2019. Confronting various risk factors, the marine economic resilience (MER) has received widespread attention in recent years, and it is considered the key to promoting sustainable and high-quality development of the marine economy (Wang Y., 2023).
The concept of MER originates from economic resilience. Resilience was first applied in the fields of engineering and ecology, representing the system’s capability to resist and recover from external shocks (Holling, 1973). Reggiani et al. (2002) firstly introduced the concept of resilience into the field of economics to describe the capability of an economic system to recover to its original equilibrium state after being subjected to external shocks. Martin’s definition of the concept of economic resilience is one of the widely used mainstream views. He believes that economic resilience includes the capabilities of resistance, recovery, renewal, and reorientation (Martin, 2012). On the basis of economic resilience research, MER has been proposed. Although there is no unified definition, received literature have mainly understood MER from Martin’s definition, believing that it is the capability of marine economic systems to resist disasters, recover from shocks, and renewal development models from various shocks or disturbances (Hu et al., 2022; Guo and Gong, 2023; Yu et al., 2023). The current MER research mainly focuses on the following two aspects:
(1) MER evaluation or specific marine economic industry resilience evaluation. Overall, whether it is MER evaluation or specific marine economic industry resilience evaluation, researchers mainly construct an indicator system based on adjusting Martin’s economic resilience framework for resilience evaluation and analysis (Liu and Shen, 2022; Wang Y. et al., 2022; Han et al., 2022). For example, Guan et al. (2024) calculated the comprehensive evaluation index based on the CRITIC combination weight model, determined the weights of each indicator using the coefficient of variation method and entropy weight method, and explored the spatio-temporal differentiation characteristics of the resilience of marine fishery economy using GIS spatial analysis technology. Chen and Wang (2023) built a comprehensive evaluation index system from the dimensions of resistance, recovery, and renewal, and used the entropy TOPSIS model to evaluate the economic resilience of coastal tourism industry from 2010 to 2019. Wang Z. et al. (2022) used a dynamic evaluation model based on virtual worst solution TOPSIS and grey correlation degree to measure resilience of the marine shipbuilding industry chain, and explored the spatio-temporal differentiation characteristics of the resilience using kernel density estimation and GIS spatial analysis techniques.
(2) The coupling relationship between MER and one specific ocean or land factor. The received literature mainly explores the coupling relationship between MER and marine technological innovation capability or economic efficiency (Doloreux and Shearmur, 2018; Xu and Yang, 2018; Liu et al., 2023). For example, Liu and Chen (2023a) used a grey correlation model and geographic detector to analyze the overall marine innovation capability of 11 coastal provinces in China, as well as the impact of various marine innovation driving factors on MER, finding that the correlation coefficient between marine innovation capability and MER showed an inverted U-shaped trend. Zhao L. et al. (2021) explored the relationship between MER and marine economic efficiency and found that the growth trend of marine economic efficiency is positively correlated with MER. In recent years, the coupling relationship between MER and one specific land factor, such as regional innovation capability or digital economy, has also received attention (Nham et al., 2023). Liu and Chen (2023b) used a convergence model to test the convergence of MER in coastal areas of China, as well as the impact of regional in-novation capability on its convergence, finding that regional innovation capability accelerated the convergence of MER. Li and Yu (2023) used a fixed effects model to empirically analyze the impact of digital finance development on MER, and found that digital finance development can enhance MER. Shen and Guo (2024) conducted an empirical analysis using panel models and found that digital inclusive finance has a significant enhancing effect on the economic resilience of marine cities, and financial regulation has a positive moderating effect on enhancing the economic resilience of marine cities through digital inclusive finance. Liu and Zhang (2024) analyzed the relationship between institutional innovation in China’s coastal areas and the MER, revealing that institutional innovation can enhance the local MER.
However, there are two issues worth further exploration in existing research:
(1) MER evaluation is currently mainstream research, which is difficulty to explain the synergistic effect among multiple factors. By building an indicator system to score MER, it is possible to form an intuitive understanding of the strength of MER in different regions. However, MER is the result of multiple factors in a complex synergistic process, and the comprehensive scoring method fails to explain which combination of factors that make up the indicator system will lead to the emergence of strong or weak resilience.
(2) The impact of land factors on MER has not been fully studied. On the one hand, received literature mainly considers marine factors (such as marine industry structure, marine economic scale, marine innovation capability, marine resources, etc.) when building MER evaluation indicators. However, as a holistic system, land and sea have a profound impact on the ecological and economic environment of the ocean (Tang et al., 2020; Gai et al., 2022), which makes the impact of land factors on MER cannot be ignored. On the other hand, received literature mainly explores the coupling relationship between MER and some specific land factors. However, related research is not only limited, but also mostly analyzes the impact of one single land factor (such as regional innovation capability or digital finance) on MER. However, MER is the result of a complex combination of multiple factors, which can be either ocean or land factors.
This study attempts to apply theoretical insights from the perspective of configuration and use fuzzy-set qualitative comparative analysis (fsQCA) approach to address the two issues. On the one hand, the configuration perspective is widely used to understand the causal complexity of the outcomes, which points out that multiple influencing factors are interdependent and can achieve a common goal of influencing outcomes through differentiated permutations and combinations (Du and Jia, 2017). In this regard, this study will use the multidimensional MER framework from received literature to build a configuration model, and incorporate multiple land factors into the model for analysis. On the other hand, the fsQCA approach adopts a systematic analysis approach, focusing on configuration issues, and can directly analyze the interdependence relationships among variables (Fiss, 2007), being able to explain complex systemic problems. Thus, this study uses the fsQCA approach to empirically analyze the configuration relationship between multiple land factors and MER. We attempt to answer the following research questions: In China, what are the specific configurations of the synergistic effects of multiple land factors on MER? What are the core and peripheral conditions that constitute strong MER configurations? What implications can the findings bring to improvement of China’s MER? The possible contributions of this study are: (1) building a Resistance Capability-Recovery Capability-Renewal Capability (3R) configuration model of MER, and incorporating multiple land factors into the model, expanding the research scope of MER influencing factors; (2) By using the fsQCA approach, the study investigates the configuration of land factors that are beneficial for strengthening MER, providing decision-makers with beneficial implications.
The remainder of this study is organized as follows: Section 2 is an introduction to methods and materials, as well as the building of configuration model; Section 3 presents the results of fsQCA analysis; Section 4 further discusses the results, and bring out the implications; Section 5 is the conclusions.
2 Materials and methods
2.1 The fsQCA approach
This study uses the fsQCA approach to analyze the causal complexity mechanism of land factors affecting MER. The QCA approach was developed in the 1980s, which has been widely applied in research fields such as sociology, political science, management, corporate governance, and corporate strategy (Du et al., 2021). The QCA approach combines the advantages of two mainstream research methods, quantitative and qualitative, and achieves cross case comparative analysis through Boolean algebra and set relationships. The QCA approach considers that the case is a whole composed of causal conditions, and therefore focuses on the complex causal relationship and causal asymmetry between conditions and outcomes (Zhang and Du, 2019). In addition, based on the characteristics of variable types, QCA approaches can be divided into three basic categories: clear-set qualitative comparative analysis (csQCA), multivalve-set qualitative comparative analysis (mvQCA), and fuzzy-set qualitative comparative analysis (fsQCA). The csQCA and mvQCA are only suitable for handling categorical data, while fsQCA can further address the problem of continuous data (Du and Jia, 2017). The fsQCA approach is not only suitable for large sample exceeding 100 cases, but also for small sample with cases less than 15 (Fiss, 2011).
The fsQCA approach is applicable to this study, because the relationship between multiple land factors and MER that this study focuses on is a configuration issue. On the one hand, the received literature shows that MER is influenced by multiple factors. However, different regions have their own characteristics in factor composition and utilization, and focusing only on one factor is difficult to explain the differences in MER in different regions; On the other hand, the 3R configuration model reveals that the three dimensions of resistance, recovery, and renewal, as well as the land factors involved, are interdependent and mutually influential, and may act on specific outcomes through differentiated configuration matching. In addition, fsQCA has flexible requirements for data sample, and the 11 coastal provinces analyzed in this study meet the small-scale sample requirements (Fiss, 2011).
2.2 3R configuration model
The fsQCA approach requires a balance between the number of conditions and the number of cases (Zhang and Du, 2019). According to references (Feng et al., 2022; Huang et al., 2023), for sample of less than 50 cases, the number of conditions is generally around 6. Based on the literature review and research objectives, this study builds a 3R configuration model with six condition variables and MER as the outcome variable (see Figure 1).
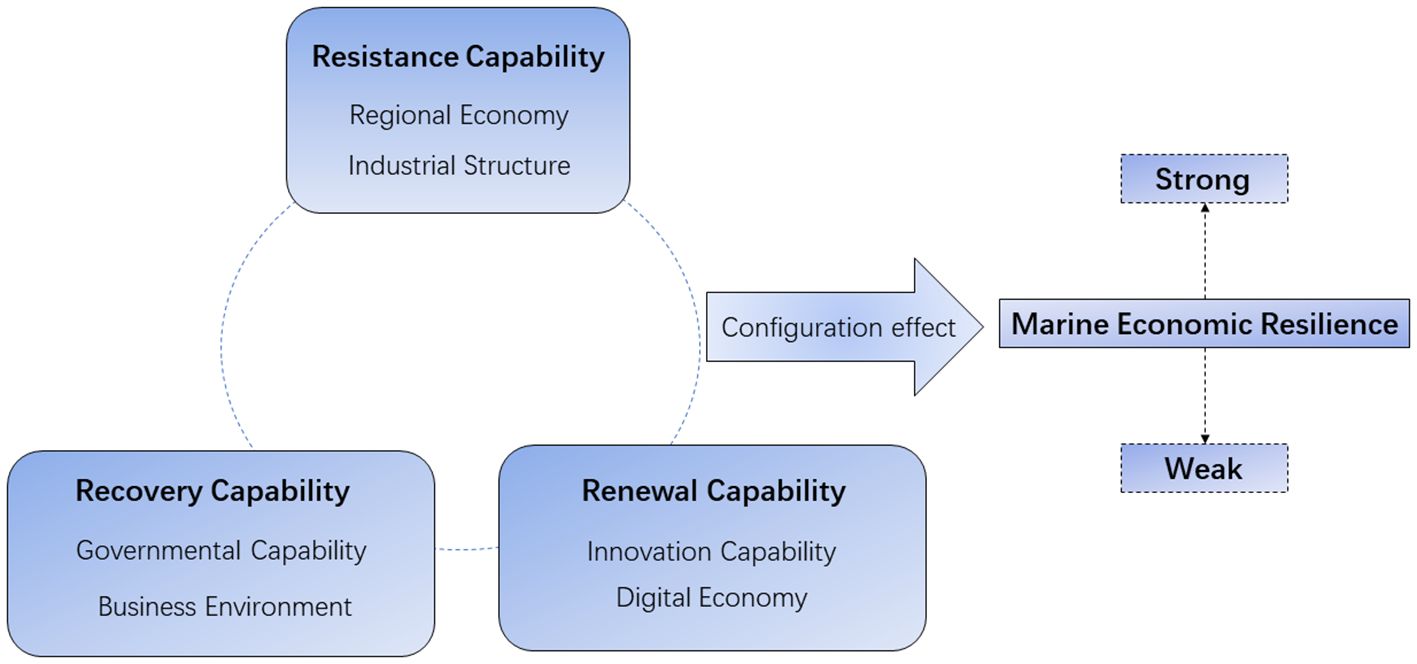
Figure 1 3R Configuration model.
The 3R Configuration Model is a three-dimensional configuration model, building on the MER evaluation index system in received literature, composed of resistance capability, recovery capability, and renewal capability (Guo and Gong, 2023; Liu and Chen, 2023b; Li et al., 2024): Resistance capability refers to the capability of the marine economic system to cope with internal and external changes before being impacted and maintain normal functioning and structure; Recovery capability refers to the capability of the marine economic system to recover to its original state or reach a new equilibrium state when impacted; Renewal capability refers to the evolutionary capability of the marine economic system to learn from past shocks, to actively adapt and readjust its internal structure and functions to develop new growth paths.
(1) Resistance capability includes two condition variables: regional economy and industrial structure. In resilience research literature that only considers ocean factors, the GOP reflecting the overall strength of the ocean economy is considered an important factor affecting the strength of resistance capability (Song et al., 2022; Zhai et al., 2023). We extend this logic to land factors and believe that regional economic scale has a similar function, that is, the larger the regional economic scale, the stronger the resilience of the marine economic system. Received literature suggest that industrial structure is closely related to regional economic resilience, which can be promoted and improved by upgrading the industrial structure (Li and Qu, 2023; Yin et al., 2023). In the research literature of MER, the structure of the marine industry is an important indicator of resistance capability (Jiang and Wen, 2022). When there is a risk of impact in the marine economic system, the more advance of the regional industrial structure, the more quickly the region can adjust its industrial structure to resist the impact risks brought by internal and external changes.
(2) Recovery capability includes two condition variables: governmental capability and business environment. In China, governmental capability has a profound impact on regional economic development, and the government participation in competition reflects the governmental capability (Tang, 2016). When facing the pressure brought by common superior tasks, there will be competitive behavior among governments at the same administrative level, and the winners will receive additional incentives, thereby promoting local governments to improve their work performance on corresponding tasks (Yu et al., 2016; Zhao C. et al., 2021). Therefore, driven by China’s implementation of the strategy of becoming a maritime power, the 11 coastal provinces will inevitably compete around the high-quality development of the marine economy. When the marine economic system is impacted, local governments will strive to restore the marine areas under their jurisdiction to their original state or reach a new equilibrium state under competitive pressure. At this point, the governmental capability is closely related to the recovery capability of the marine economic system. The business environment reflects the operational level of market mechanisms, and a good business environment can achieve efficient allocation of various resources and effectively remove institutional obstacles that affect innovation driven development (Xu, 2018; Du et al., 2022). Thus, for the marine economy, a high-quality business environment can not only attract domestic and foreign maritime enterprises to settle in, but also facilitate the cultivation, development, and growth of local maritime enterprises, thereby strengthening the recovery capability of the marine economic system.
(3) Renewal capability includes two condition variables: innovation capability and digital economy. Regional innovation capability is the key to achieving competitive advantage, which affects regional economic resilience through factors such as strengthening ecological environment protection, promoting industrial structure upgrading, and optimizing factor allocation efficiency (Muštra et al., 2020; Chen and Ye, 2021; Cheng and Jin, 2022). For the marine economy, innovation capability can support the efficient development and transformation of the marine industry (Ji et al., 2021; Sun et al., 2024). More importantly, innovation capability can promote the development of the marine economy to break through path dependence constraints (Wang et al., 2021). Therefore, regional innovation capability is closely related to the renewal capability of the marine economic system. In the wave of a new global technological revolution, the digital economy with data as the core element has become the leading force driving economic development, promoting the transformation and upgrading of traditional industries, and giving birth to a series of new technologies, products, and models such as e-commerce, big data platforms, and cloud computing (Li et al., 2022; Liu and Lu, 2023). The digital economy has also brought new opportunities for the development of the marine economy, such as driving the transformation and development of the marine industry, and optimizing the green efficiency of the marine economy (Wang and Chang, 2023; Yang et al., 2023). Thus, the development of the digital economy is believed to be able to enhance MER by providing support for the search for new growth paths (Mabon and Kawabe, 2023).
2.3 Variables and data source
2.3.1 Research area
This study selected 11 coastal provinces (not including Hong Kong, Macao and Taiwan) in China Mainland as the research area, including Liaoning, Hebei, Tianjin, Shandong, Jiangsu, Shanghai, Zhejiang, Fujian, Guangdong, Guangxi and Hainan, as well as Bohai, Yellow Sea, East China Sea and South China Sea (see Figure 2).
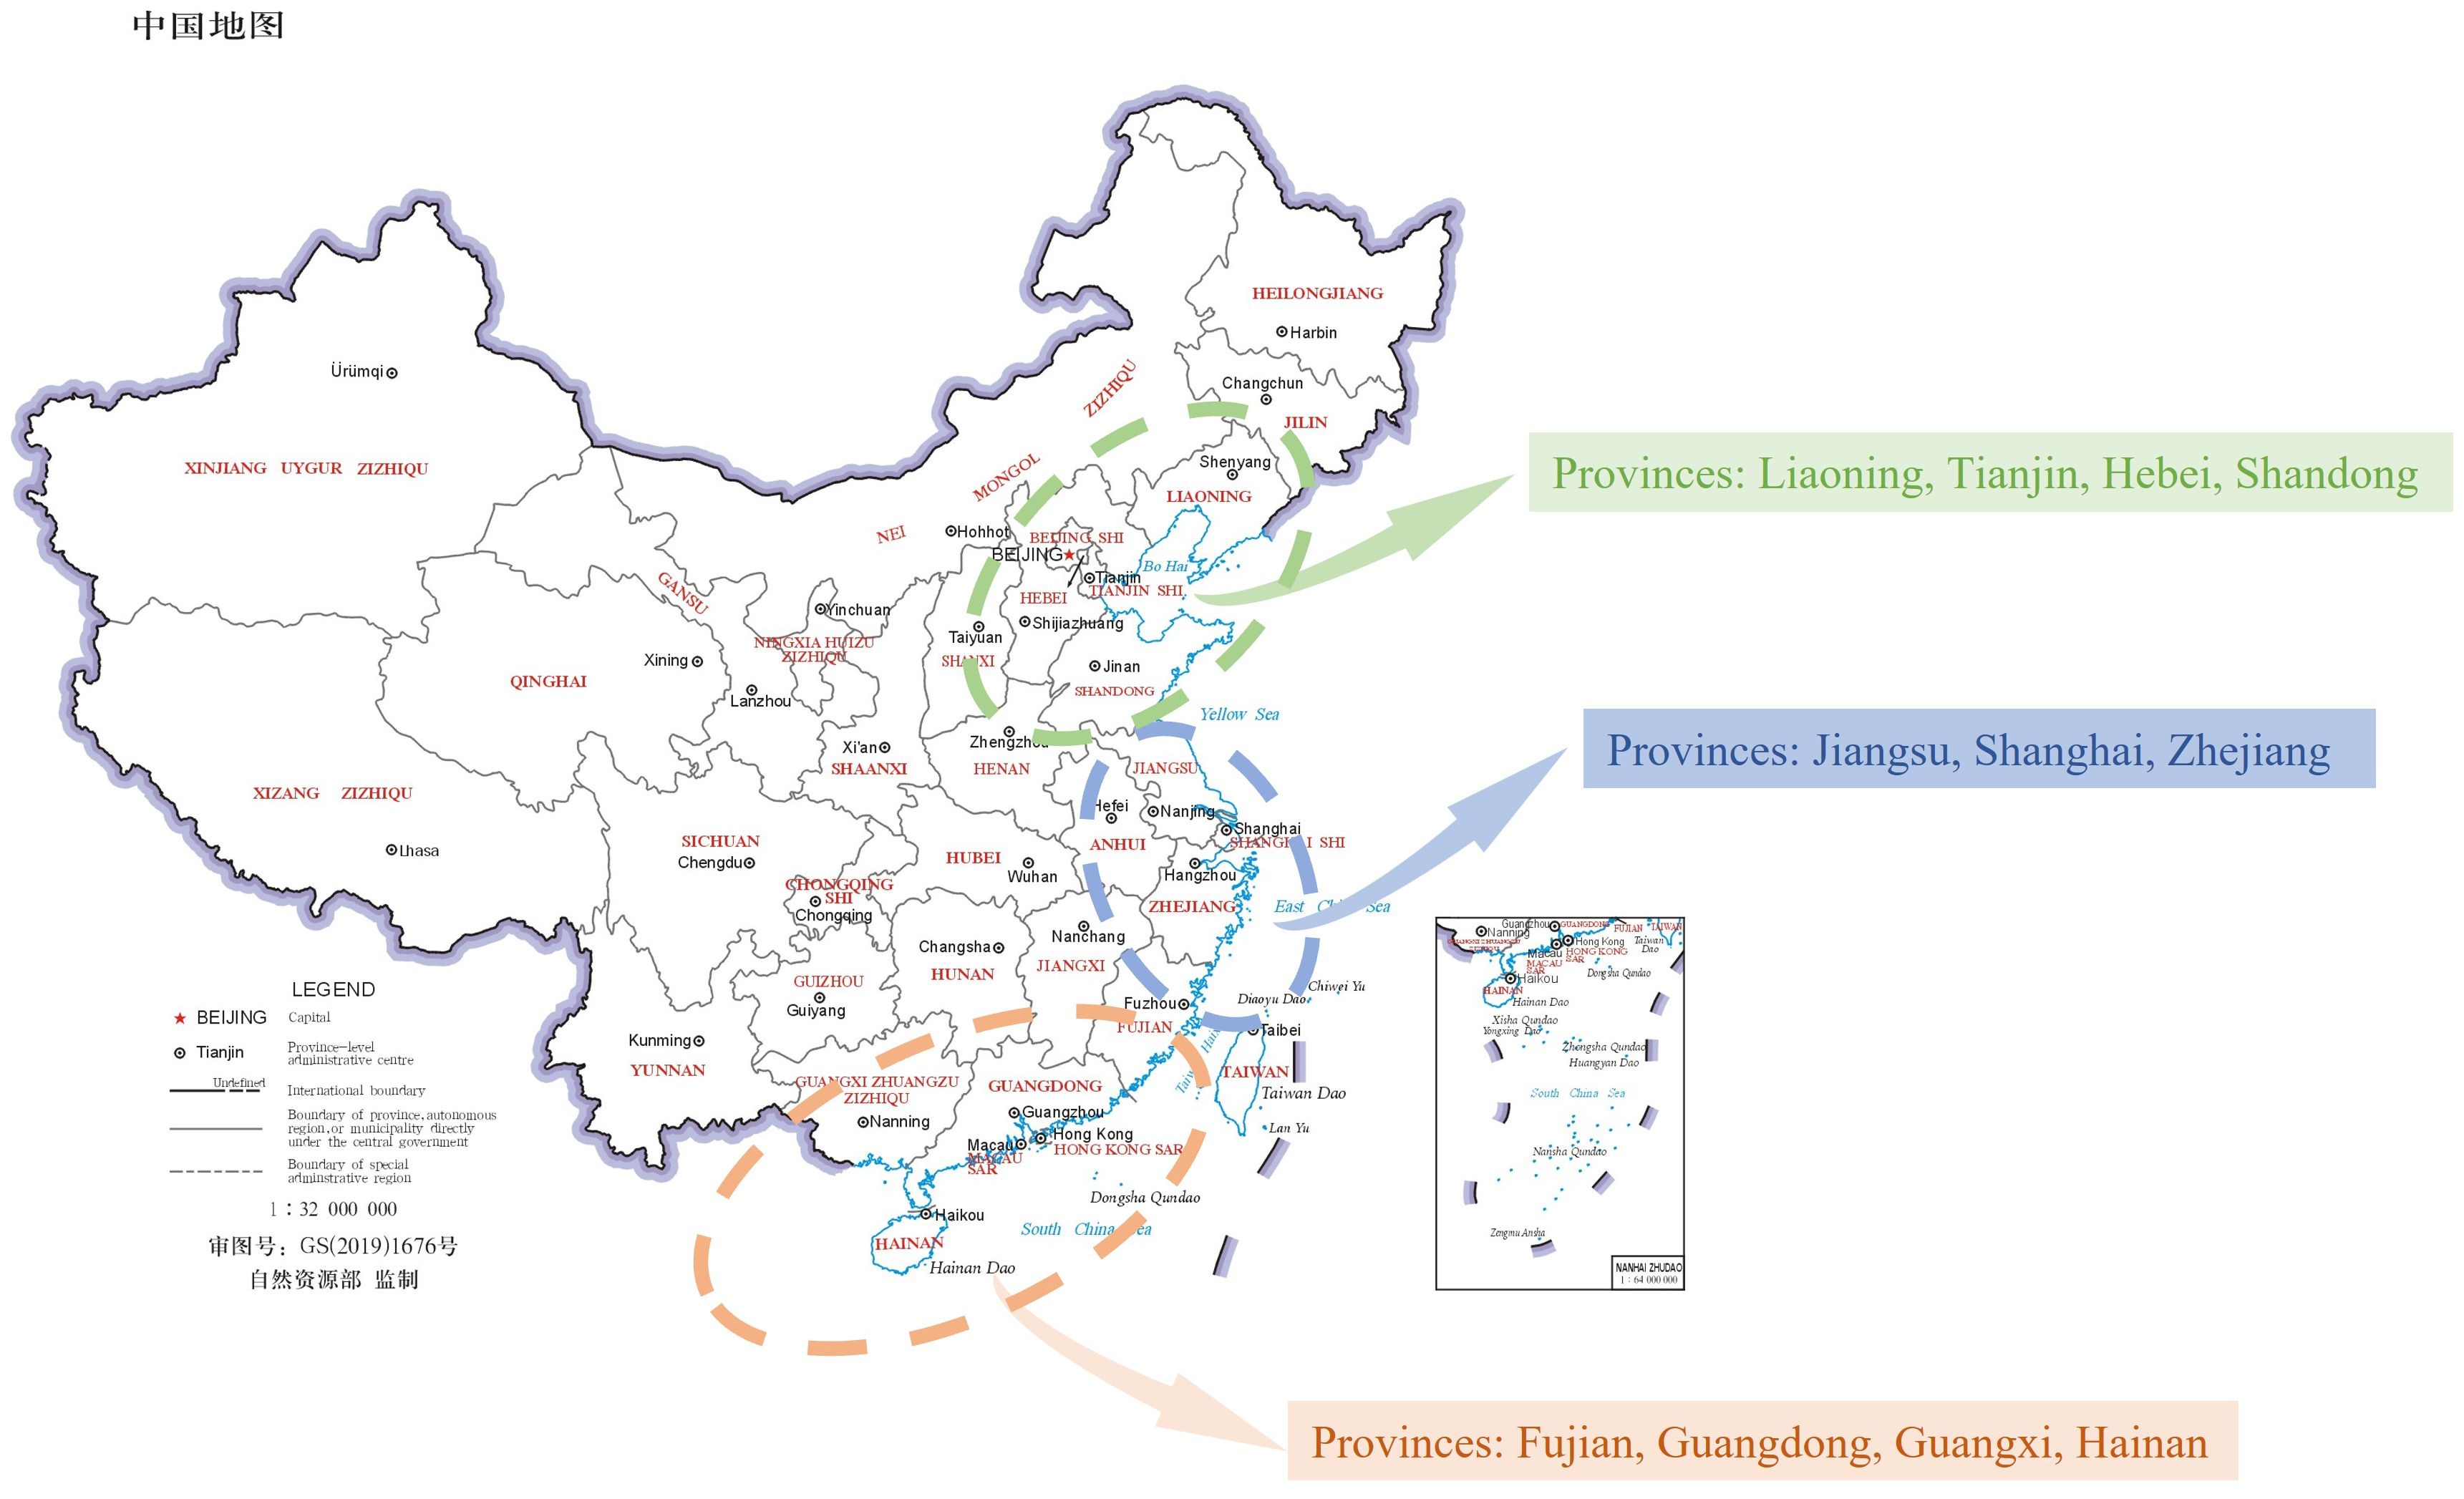
Figure 2 11 coastal provinces in China Mainland.
2.3.2 Outcome and conditions
The data of 2019 are used in this study for the following reasons: (1) From 2020 to 2022, in order to deal with the COVID-19, governments all over China have adopted extremely strict prevention and control measures, and the data generated during this period is too particular to study. (2) Up to the completion of this manuscript, the China Marine Economic Statistical Yearbook has only been updated until 2020, and the 2023 statistical report for other types of data has not been released yet. The variable settings, measurement, and data sources of this study are shown in Table 1.
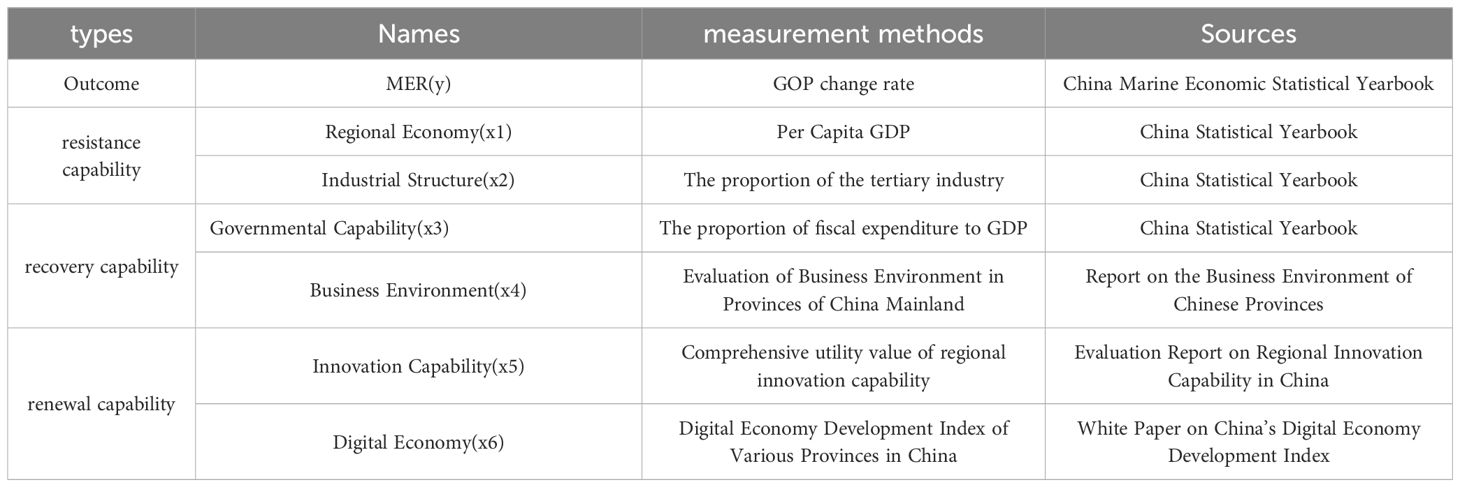
Table 1 Outcome and condition variables with measurement methods and data sources.
(1) Outcome. According to Martin and Sunley (2015) and Hua and Chen (2022), this study used the GOP change rate to measure MER (y), which can be measured by Equation 1.
GOPi, t is the GOP of region i in year t, GOPi, t-1 is the GOP of region i in year t-1, GOPt is China’s GOP in year t, and GOPt-1 is China’s GOP in year t-1. The data is sourced from the China Marine Economic Statistical Yearbook (See Table 2).
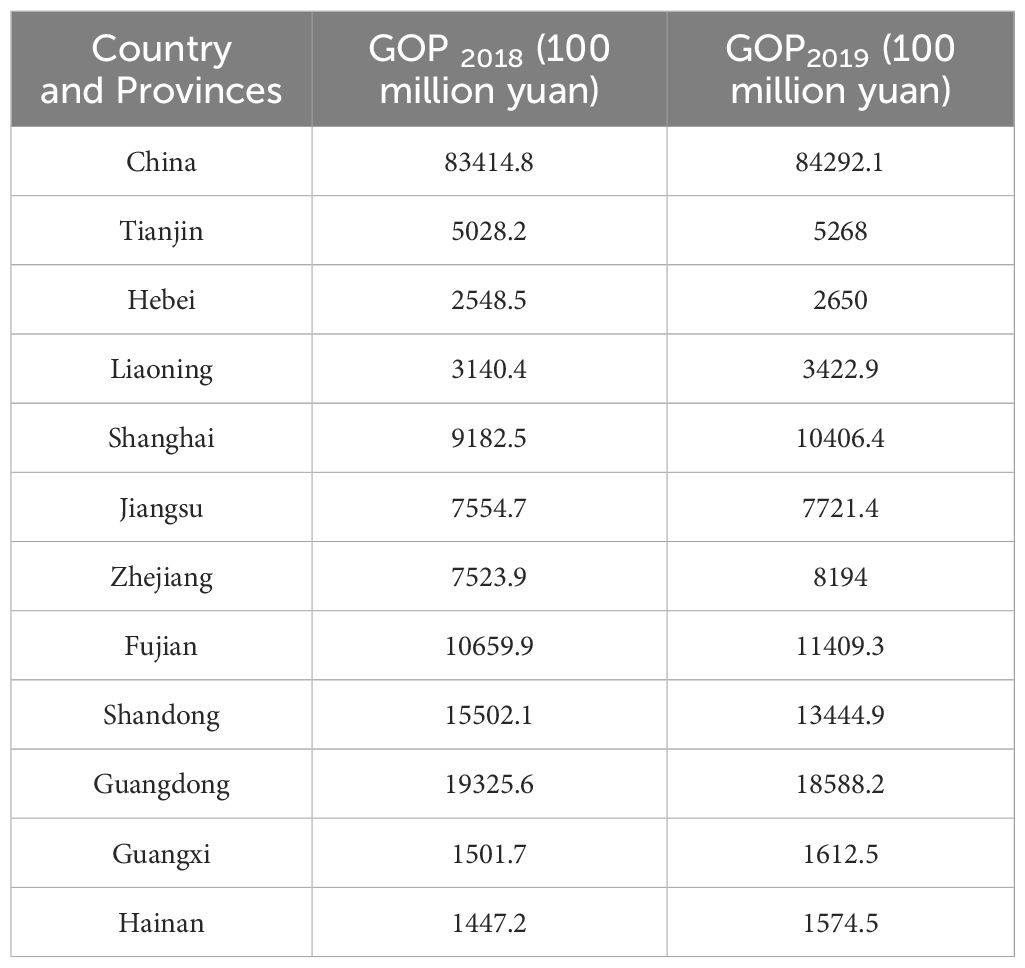
Table 2 Raw data of GOP in the years 2018 and 2019.
For example, in order to obtain MER of Tianjin, we substitute the corresponding data from Table 2 into Equation 1 as follows:
(2) Resistance capability. According to Wang Y. et al. (2022), regional economy (x1) is measured by per capita GDP, and industrial structure (x2) is measured by the proportion of added value of the tertiary industry to GDP. The data is sourced from the China Statistical Yearbook (See Table 3).
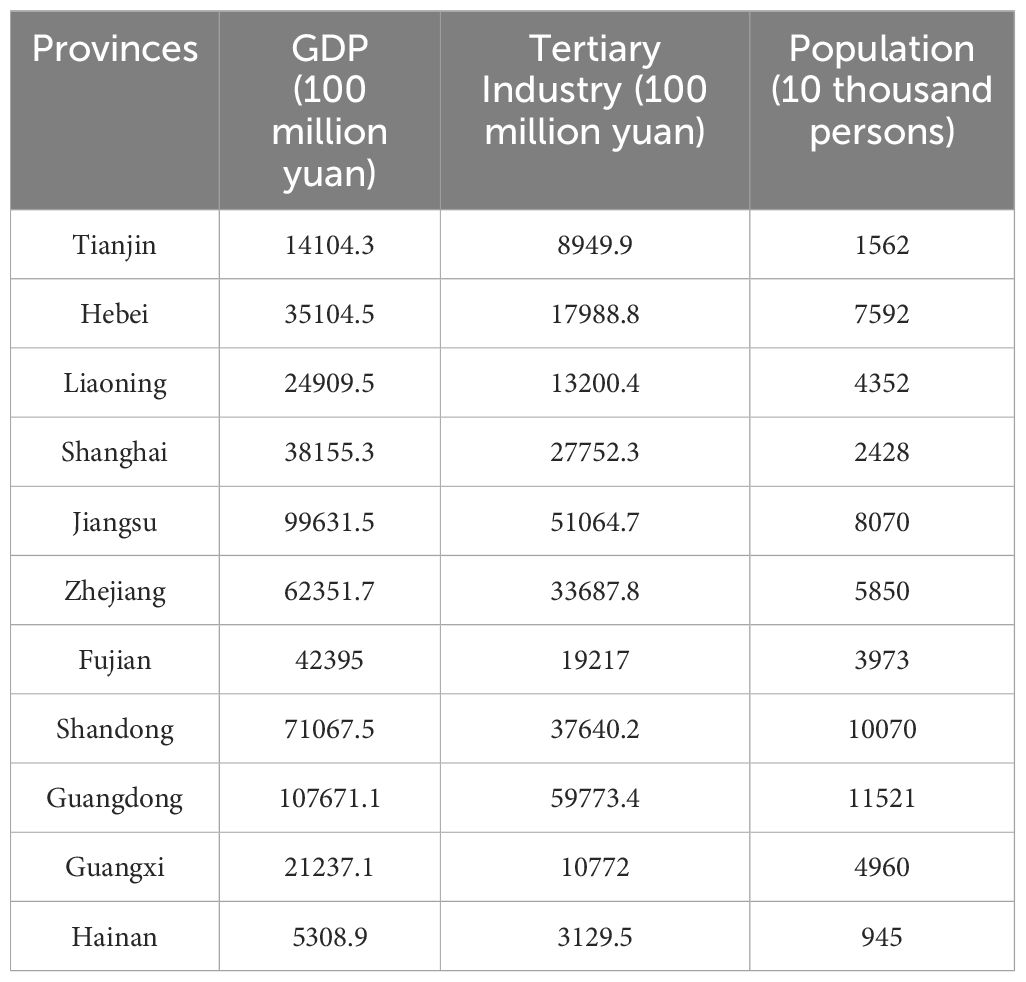
Table 3 Raw data of GDP, tertiary industry and population.
Taking Tianjin as an example: regional economy (x1) =14104.3/1562 ≈ 9.03, industrial structure (x2) = 8949.9/14104.3 ≈ 0.64.
(3) Recovery capability. According to Yin and Yang (2022) and Yang and Yuan (2023), governmental capability (x3) can be measured by Equation 2.
FEj and GDPj represent the fiscal expenditure and regional GDP of region j in 2019, while FE and GDP represent the total national fiscal expenditure and GDP of China in 2019. The data is sourced from the China Statistical Yearbook (See Table 4).
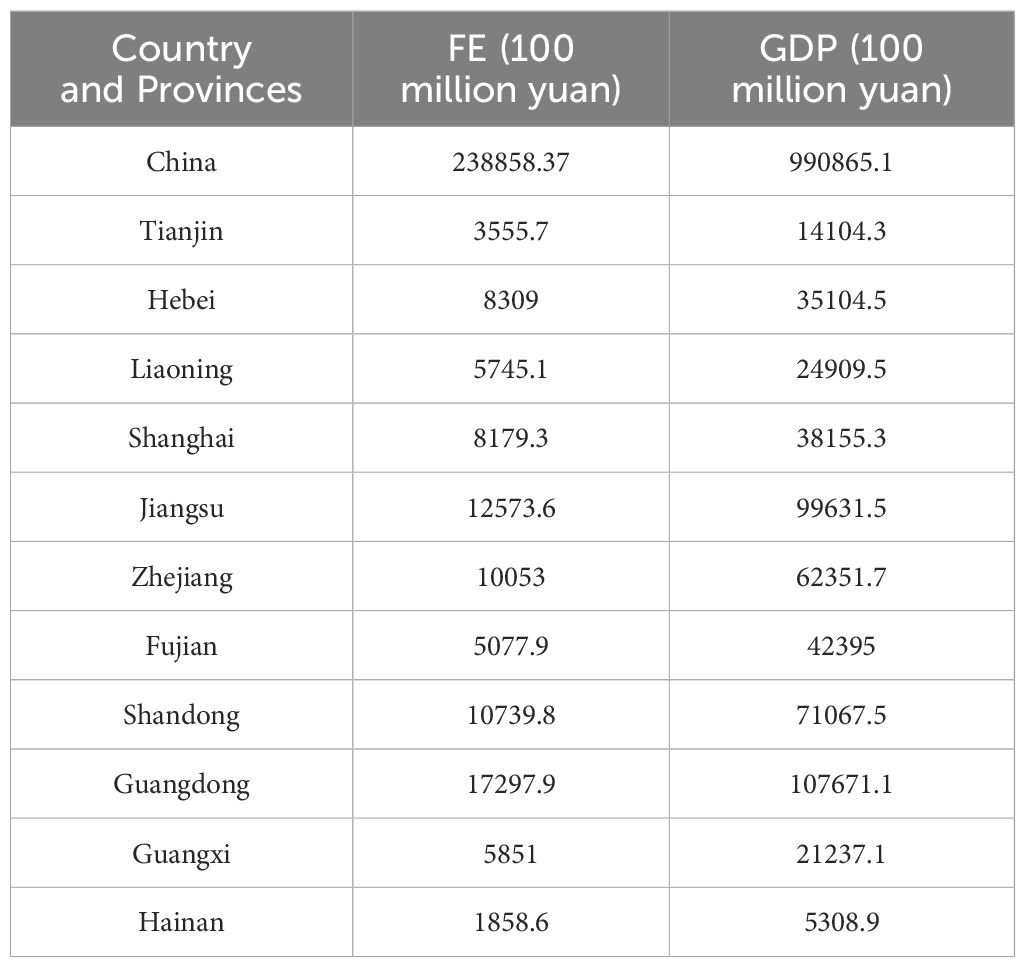
Table 4 Raw data of FE and GDP.
Let’s still take Tianjin as an example:
The business environment (x4) directly used the evaluation scores of the business environment in provinces of China Mainland in reference (Zhang et al., 2020). This study, which has had a relatively broad social impact, has built an evaluation index system for the business environment in Chinese provinces, and calculated the business environment scores of each province.
(4) Renewal capability. The innovation capability (x5) was measured by using the comprehensive utility value of regional innovation capability, which is sourced from the Evaluation Report on Regional Innovation Capability in China directly, and has been released for 23 consecutive years as an authoritative evaluation report on regional development in China. As a series of reports on the national innovation investigation system, this report was prepared by the China Science and Technology Development Strategy Research Group and the China Innovation and Entrepreneurship Management Research Center of the University of Chinese Academy of Sciences with the support of the Ministry of Science and Technology.
The digital economy (x6) is measured by using the digital economy development index of various provinces in China, which is sourced from the White Paper on China’s Digital Economy Development Index directly. This report is released by the China Institute of Electronic Information Industry Development, which is an affiliated institution of the Ministry of Industry and Information Technology of China. Up to the completion of this manuscript, the index report has been continuously released for 9 years and has important reference value for China’s digital economy.
We have integrated the scores of x4, x5, and x6 that can be directly obtained from existing authoritative reports, and presented them in Table 5.
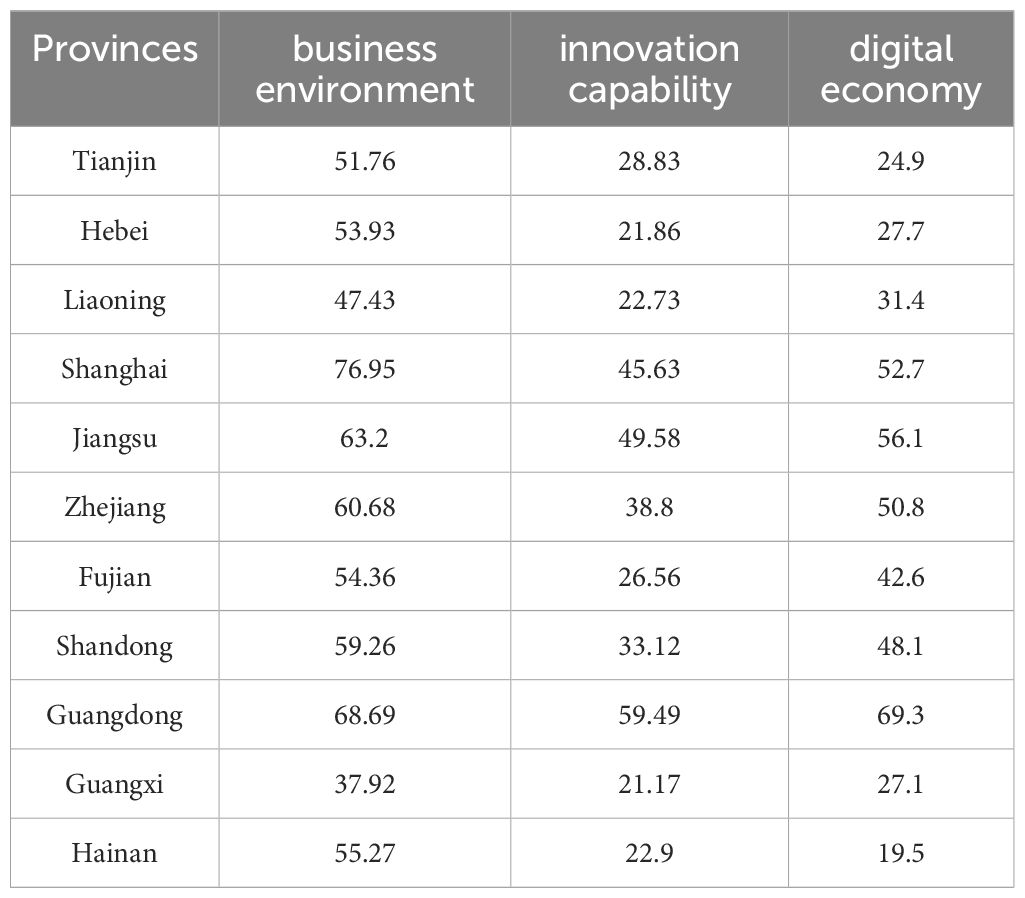
Table 5 Raw data of x4, x5 and x6.
2.4 Calibration
By processing the raw data, we obtained the initial data for this study (see Table 6).
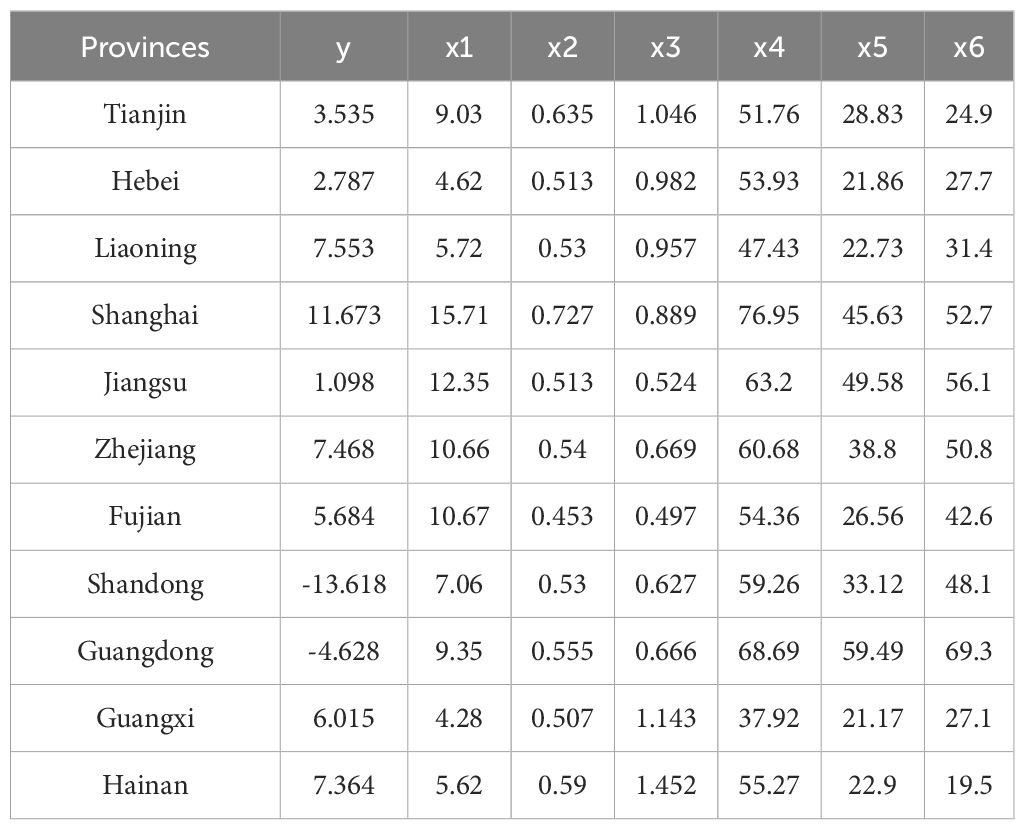
Table 6 Initial data for calibration.
The initial conditions and outcome data in Table 6 are sourced from authoritative reports, which have high reliability and wide applicability. However, the data is lack of external basis and theoretical standards for calibration. In order to determine the set membership of the cases, according to Zhang et al. (2020), the direct calibration method is used to calibrate the initial data. The calibration points of Fully-in, Crossover, and Fully-out of the variables were set to 95%, 50%, and 5% of the descriptive statistical values, respectively. The initial data was then transformed into set membership values ranging from 0 to 1. The software Microsoft Excel is used to calculate calibration points using the function PERCENTILE.INC (array, k). For example, we select the array where y is located in Microsoft Excel and substitute k=0.95, k=0.50, and k=0.05 respectively into the function to calculating the calibration points for y. The calibration points for each variable are shown in Table 7.
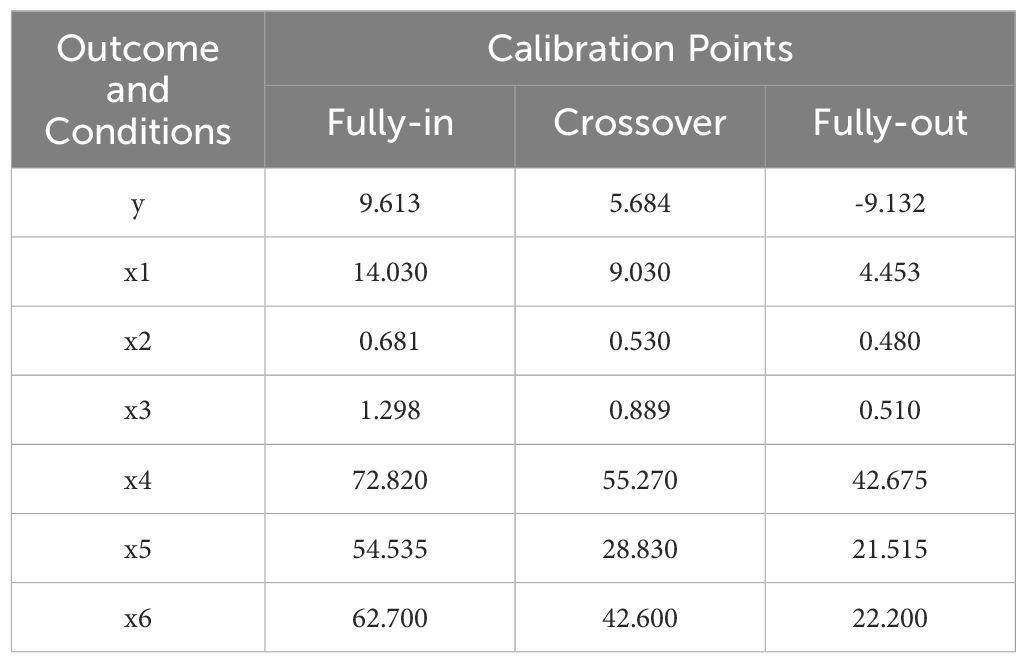
Table 7 Calibration points.
Based on the calibration points in Table 7, this study used software fsQCA4.0 to process the data in Table 6, and used the software’s compute function module’s function Calibrate (x, n1, n2, n3) to calibrate the variables. Due to the existence of a situation where the value of the Crossover is exactly 0.5 after calibration, this study adjusts 0.5 to 0.501 by plus 0.001 (Xie et al., 2021). Take Fujian as an example, if the calibrated y is sorted from largest to smallest and it is found that the value of Fujian is more biased towards larger numbers, then 0.5 is adjusted to 0.501 to avoid being unable to classify due to the value being centered in the final calculation. Table 8 shows the results of calibration.
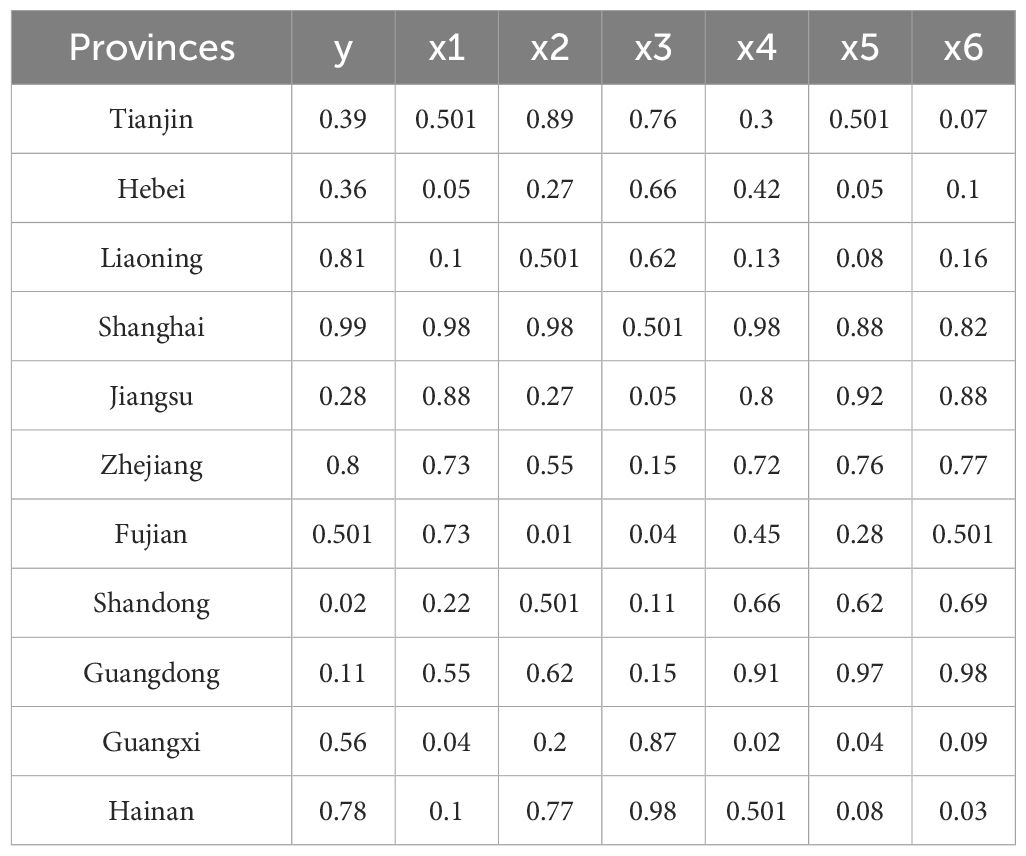
Table 8 Results of calibration.
3 Results
3.1 Necessity analysis
According to the analysis steps of fsQCA, before conducting sufficiency analysis, it is necessary to first test whether a single condition variable constitutes a necessary condition for strong or weak MER. The consistency is an important indicator for testing whether a single condition variable is a necessary condition. When the consistency is less than 0.9, it can be considered that the condition variable is not a necessary condition of the outcome (Zhang and Du, 2019). As shown in Table 9, the consistency of all conditions of the strong MER (y) and weak MER (~y) is less than 0.9, indicating that none of the conditions can be a necessary condition. The results of necessity analysis indicates that the synergistic effects of resistance capability, recovery capability, and renewal capability on MER require comprehensive consideration.
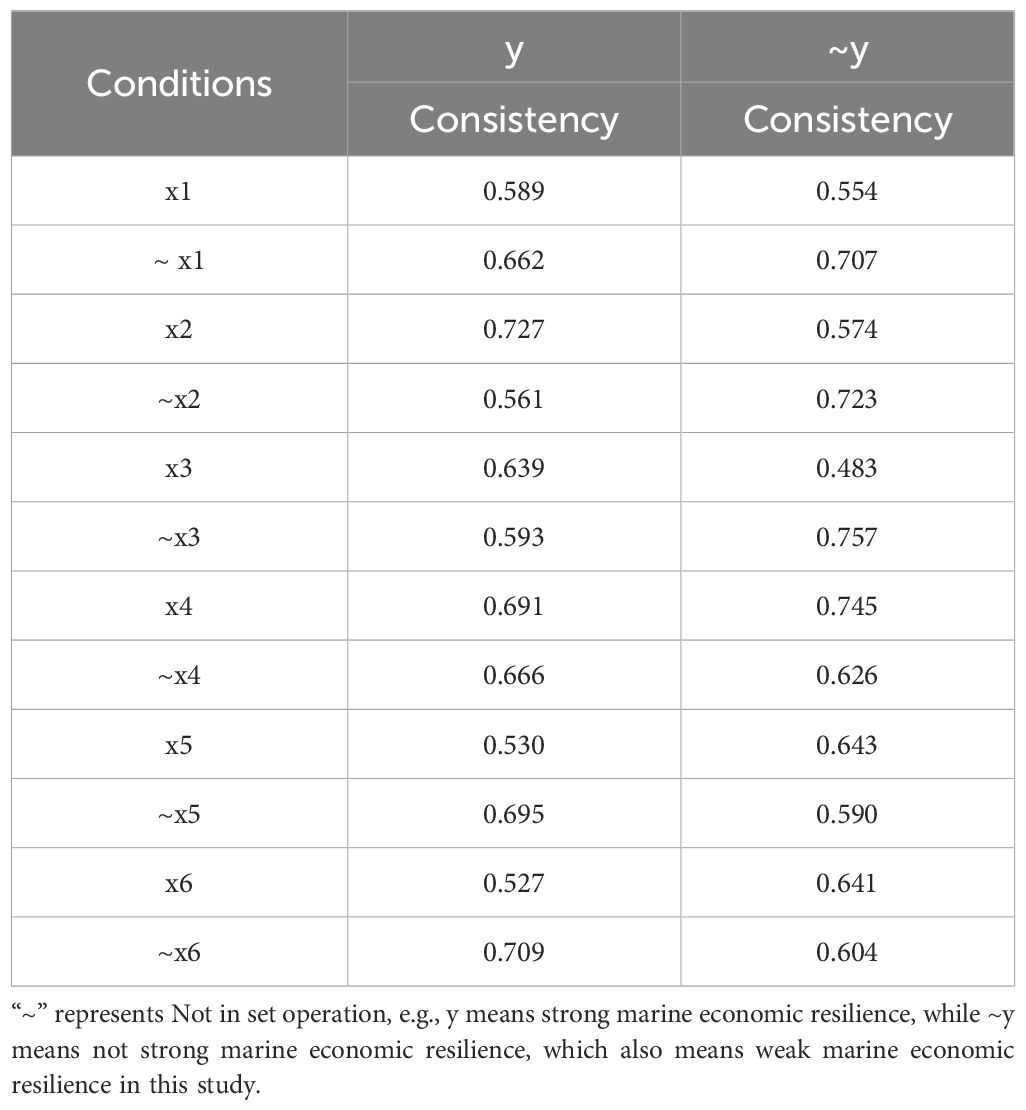
Table 9 Results of necessity analysis.
3.2 Sufficiency analysis
3.2.1 Standard analyses
Sufficiency analysis, also known as configuration analysis, aims to obtain different configurations composed of multiple conditions that lead to the outcome. In software fsQCA4.0, the sufficiency analysis is conducted by standard analyses programs. According to the related references (Du and Jia, 2017; Zhang and Du, 2019; Du et al., 2021), the standard analyses are operated as follows:
(1) Parameter settings. To distinguish whether the configuration has passed the consistency test of fuzzy set theory, the consistency threshold is set to 0.8. Considering that the total number of cases in this study is 11, the frequency threshold is set to 1. To reduce potential conflicting configurations, the value of PRI (proportional reduction in inconsistency) is set to 0.75. Then, we obtained the truth table for y (see Figure 3) and the truth table for ~y (see Figure 4), respectively.
(2) Option settings for standard analyses of y. When conducting the standard analyses of y, as shown in Figure 5, on the one hand, the program generated 3 prime implicants. Considering that the digital economy and governmental capability are two important variables of this study, one prime implicants “x2~x5” was selected; On the other hand, according to the results of necessity analysis, the “present or absent” option is selected in the intermediate solution program.
(3) Option settings for standard analyses of ~y. When conducting the standard analyses of ~y, as shown in Figure 6, on the one hand, the program generated 6 prime implicants. Similarly, considering that the digital economy and governmental capability are two important variables of this study, two prime implicants “~x2 ~x3” and “~x1 ~x3” were selected for this study; On the other hand, according to the results of necessity analysis, the “present or absent” option is selected in the intermediate solution program.
(4) Complex solutions, parsimonious solutions, and intermediate solutions for y and ~y. According to the solutions shown in Table 10, the condition that appears simultaneously in the intermediate solution and the parsimonious solution is the core condition, and the condition that only appears in the intermediate solution but does not appear in the parsimonious solution is the peripheral condition.
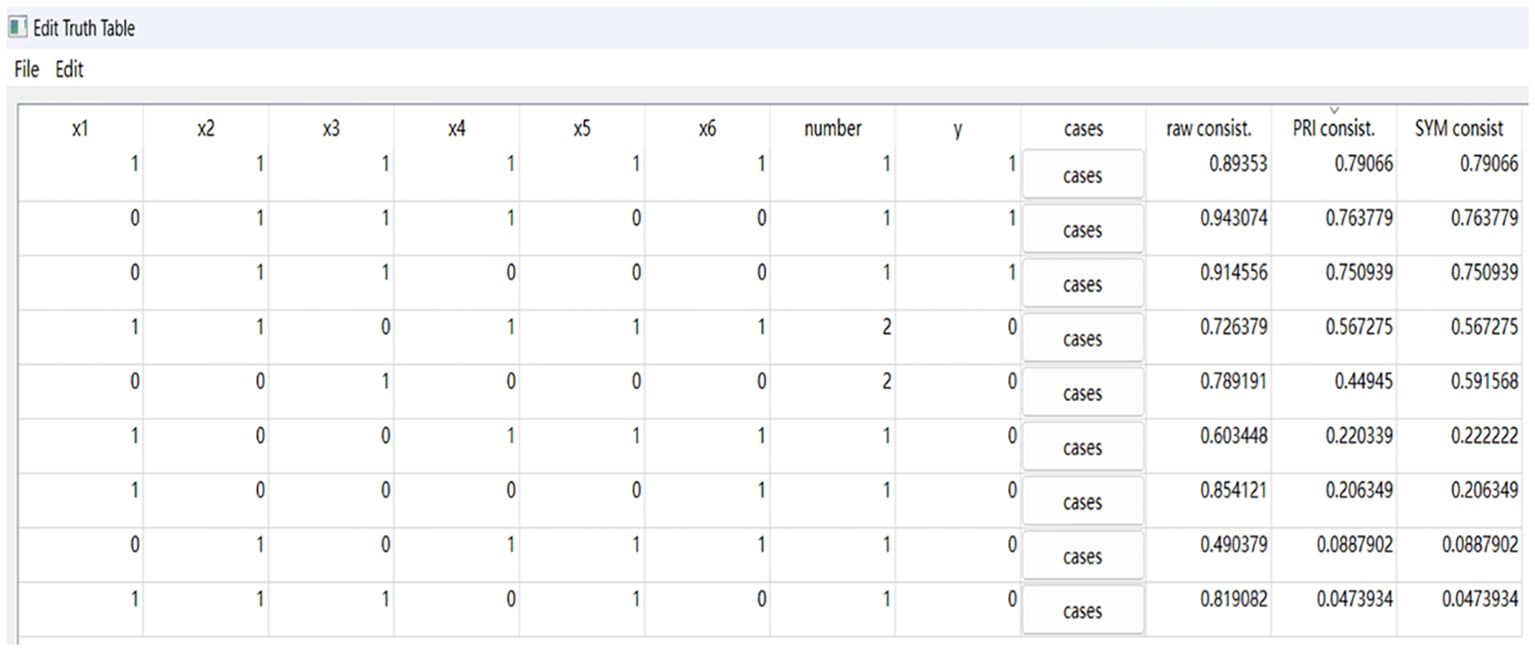
Figure 3 Truth table for y.
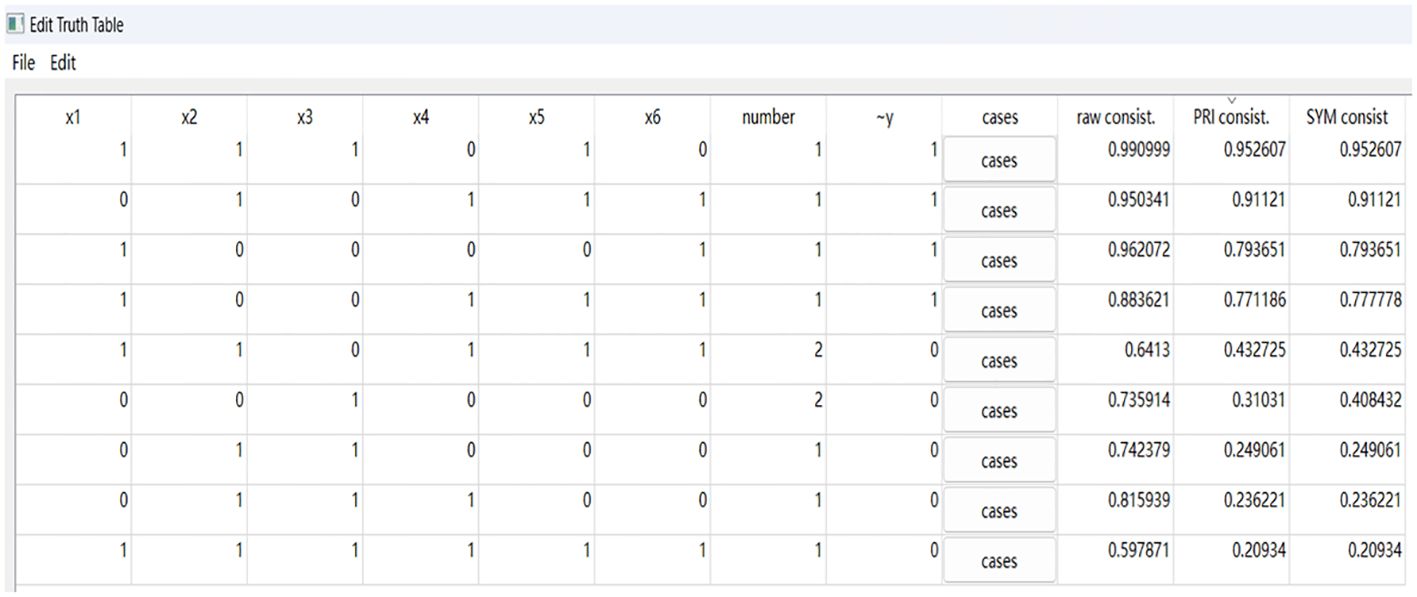
Figure 4 Truth table for ~y.
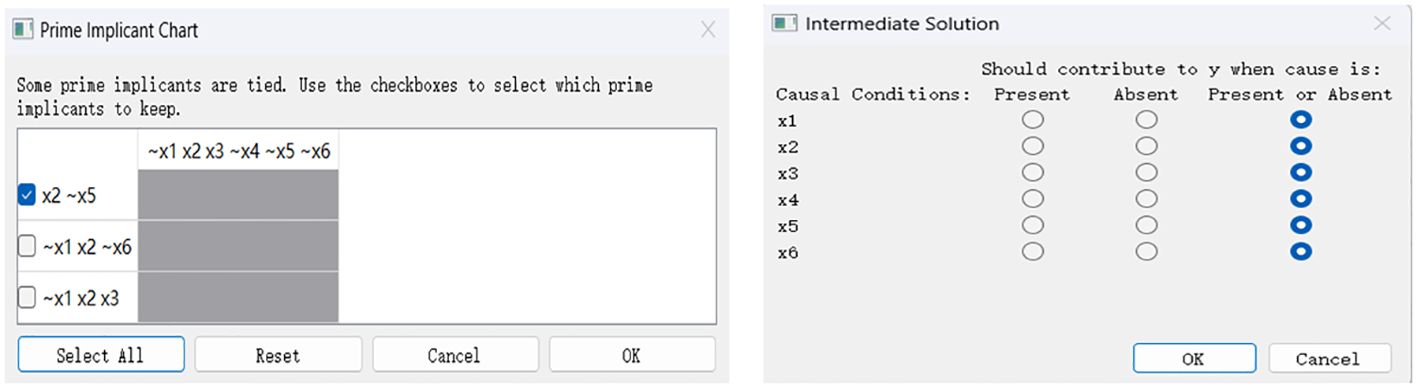
Figure 5 Prime implicant and intermediate solution for y.

Figure 6 Prime implicant and intermediate solution for ~y.
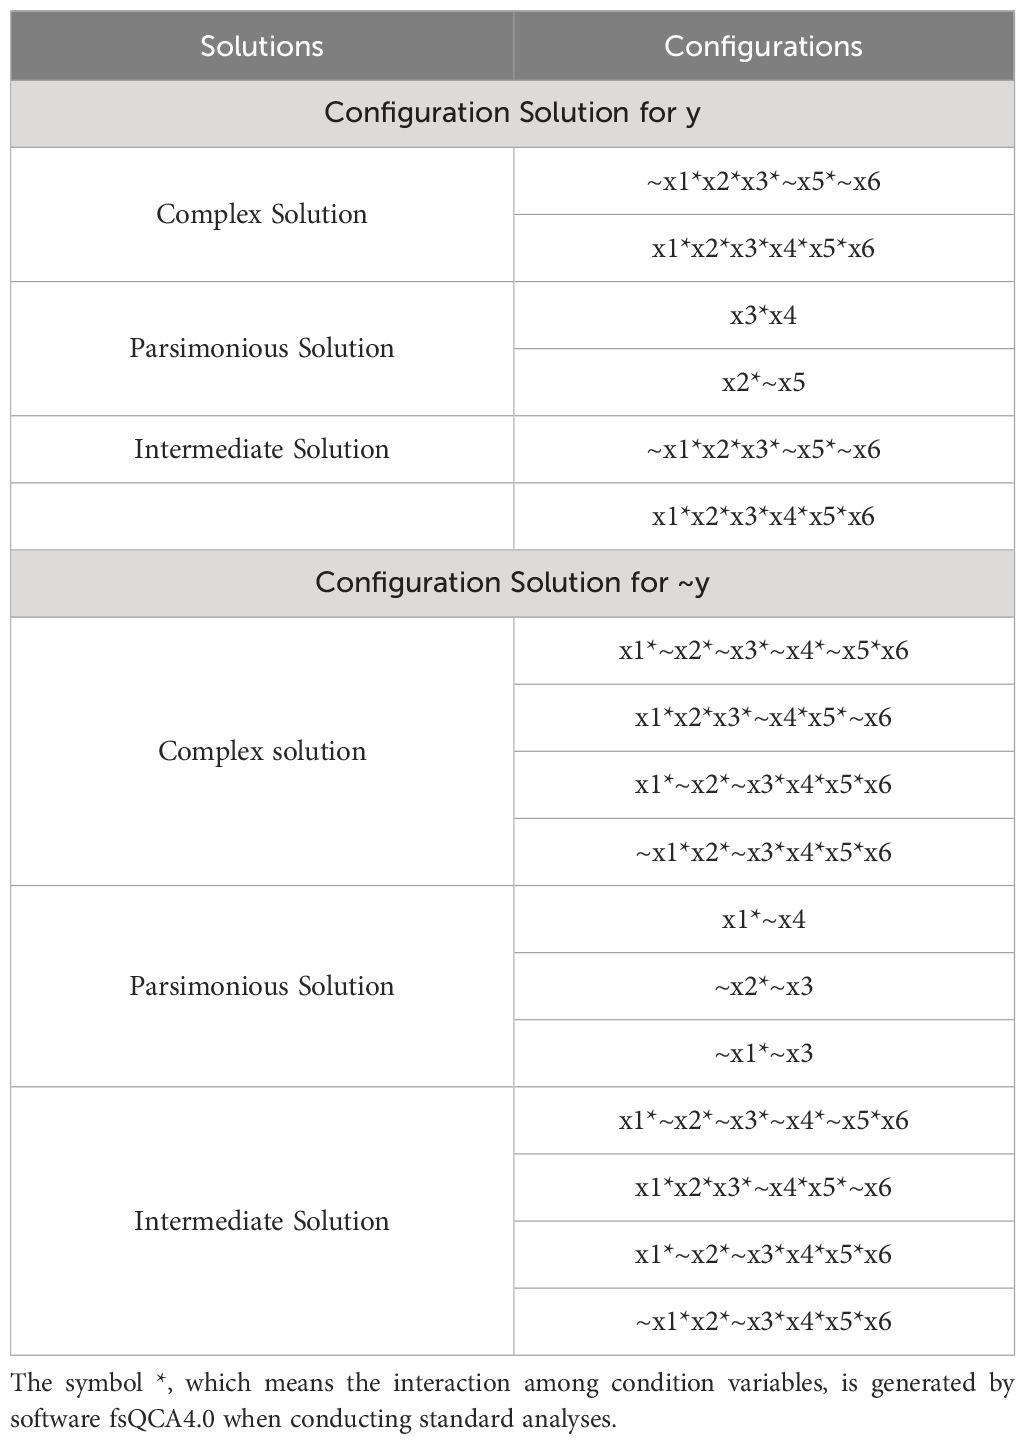
Table 10 Results of sufficiency analysis.
The interpretation of the sufficiency analysis results mainly depends on the parsimonious solution and the intermediate solution (Zhang and Du, 2019). As a convention, this study presented the results in the form invented by Ragin and Fiss (2008) (see Table 11).
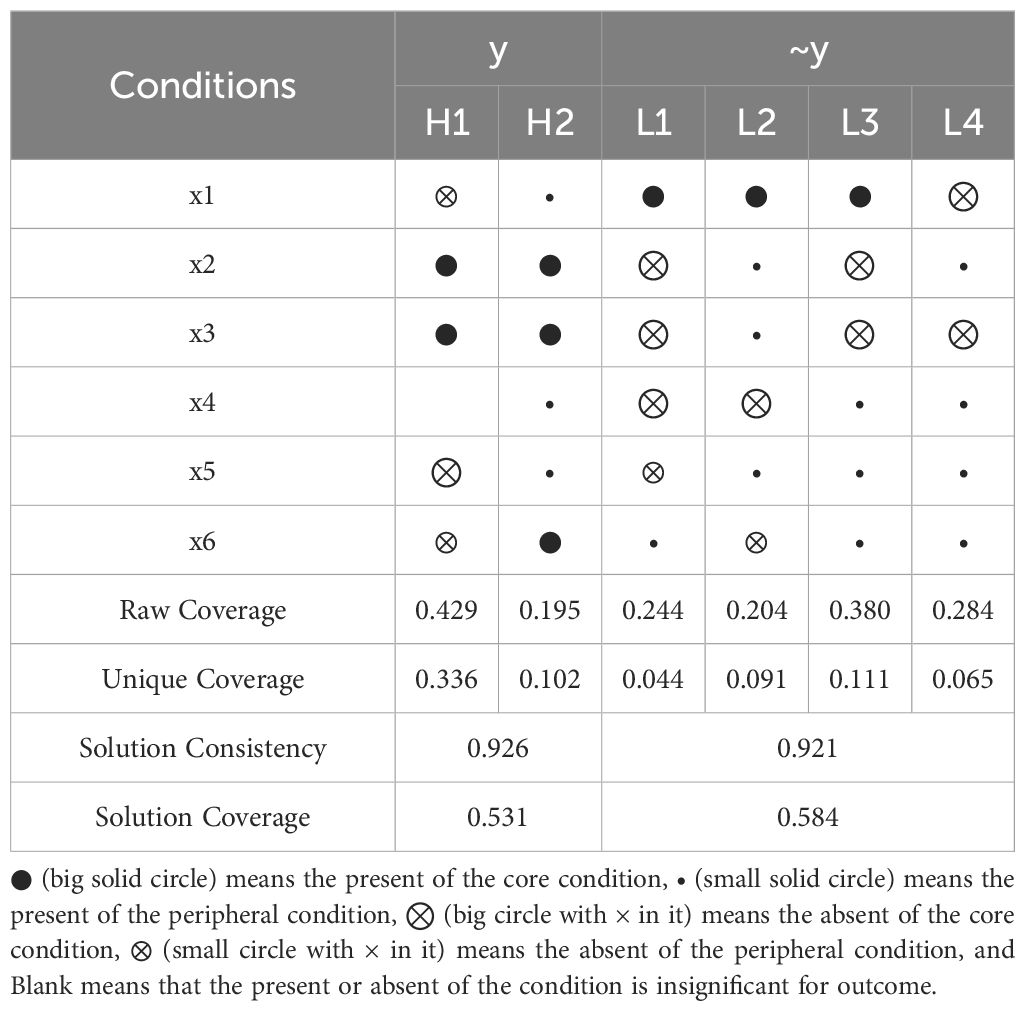
Table 11 Results of sufficiency analysis.
3.2.2 Configurations of y
Table 7 showcases two configurations of strong MER (y). The Solution Consistency is 0.926, meaning that among all sample cases meeting these two configurations, 92.6% of provinces have strong MER. The Solution Coverage is 0.531, meaning that the two configurations can explain 53.1% of the cases of strong MER.
(1) Configuration H1: Strong Resistance - Recovery Type. Configuration H1 indicates that strong industrial structure (x2), strong governmental capability (x3), and weak innovation capability (~x5) are the core conditions, while weak regional economy (~x1) and weak digital economy (~x6) are the peripheral conditions. The combination of these conditions can generate strong MER (y). According to the combination features, configuration H1 can be named as “Strong Resistance - Recovery Type” (see Figure 7). H1 can explain about 42.9% of strong MER cases, of which about 33.6% can only be explained by this configuration. A typical case explained by this configuration is Hainan and Liaoning.
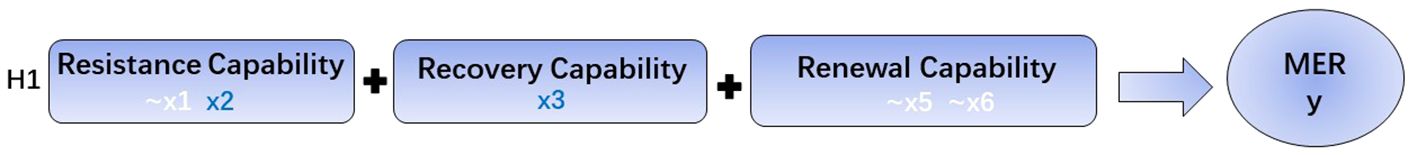
Figure 7 Strong Resistance - Recovery Type. In the box, color blue indicates the existence of conditions (strong), for example, x2 indicates the existence of a strong industrial structure; Color white indicates weak or non-existent conditions, such as~x1 indicating weak regional economy.
(2) Configuration H2: Comprehensive Strong Type. Configuration H2 indicates that strong industrial structure (x2), strong governmental capability (x3), and strong digital economy (x6) are the core conditions, while strong regional economy (x1), strong business environment (x4), and strong innovation capability (x5) are the peripheral conditions. The combination of these conditions can generate strong MER (y). According to the combination features, configuration H2 can be named as “Comprehensive Strong Type” (see Figure 8). H2 can explain about 19.5% of strong MER cases, of which about 10.2% can only be explained by this configuration. A typical case explained by this configuration is Shanghai.
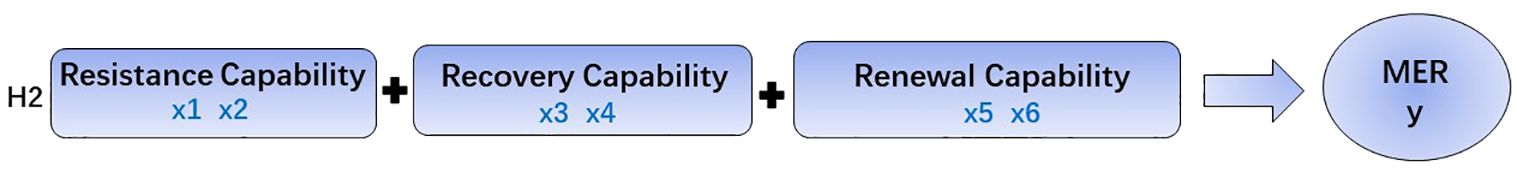
Figure 8 Comprehensive Strong Type.
3.2.3 Configurations of ~y
Table 7 showcases four configurations of weak MER (~y). The Solution Consistency is 0.921, meaning that among all sample cases meeting these four configurations, 92.1% of provinces have weak MER. The Solution Coverage is 0.584, meaning that the two configurations can explain 58.4% of the cases of weak MER.
(1) Configuration L1: Comprehensive Weak Type. Configuration L1 indicates that strong regional economy (x1), weak industrial structure (~x2), weak governmental capability (~x3), and weak business environment (~x4) are core conditions, while weak innovation capability (~x5) and strong digital economy (x6) are peripheral conditions. The combination of these conditions can lead to weak MER (~y). According to the combination features, configuration L1 can be named as “Comprehensive Weak Type” (see Figure 9). L1 can explain about 24.4% of weak MER cases, of which about 4.4% can only be explained by this configuration. Fujian is a typical case explained by con-figuration L1.
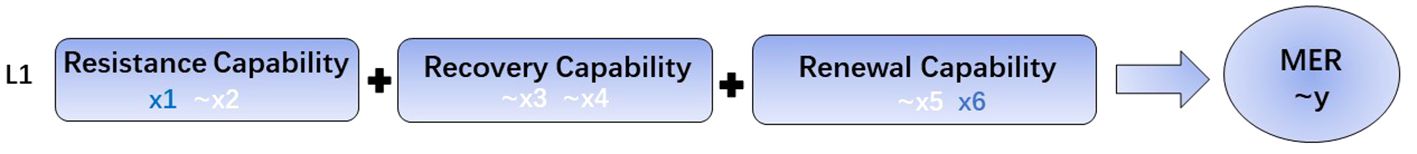
Figure 9 Comprehensive Weak Type.
(2) Configuration L2: Weak Recovery-Renewal Type. Configuration L2 indicates that strong regional economy (x1) and weak business environment (~x4) are core conditions, while strong industrial structure (x2), strong governmental capability (x3), strong innovation capability (x5), and weak digital economy (~x6) are peripheral conditions. The combination of these conditions can lead to weak MER (~y). According to the combination features, configuration L2 can be named as “Weak Recovery-Renewal Type” (see Figure 10). L2 can explain about 20.4% of weak MER cases, of which about 9.1% can only be explained by this configuration. Tianjin is a typical case of configuring L2.
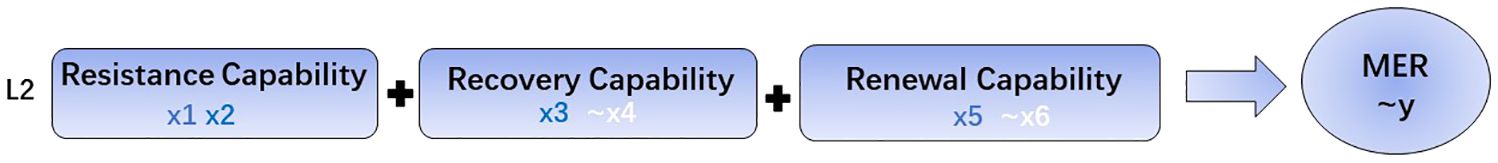
Figure 10 Weak Recovery-Renewal Type.
(3) Configuration L3: Weak Resistance-Recovery Type I. Configuration L3 indicates that strong regional economy (x1), weak industrial structure (~x2), and weak governmental capability (~x3) are core conditions, while strong business environment (x4), strong innovation capability (x5), and strong digital economy (~x6) are peripheral conditions. The combination of these conditions can lead to weak MER (~y). According to the combination features, configuration L3 can be named as “Weak Resistance-Recovery Type I” (see Figure 11). L3 can explain about 38.0% of weak MER cases, of which about 11.1% can only be explained by this configuration. Jiangsu is a typical case of configuration L3.
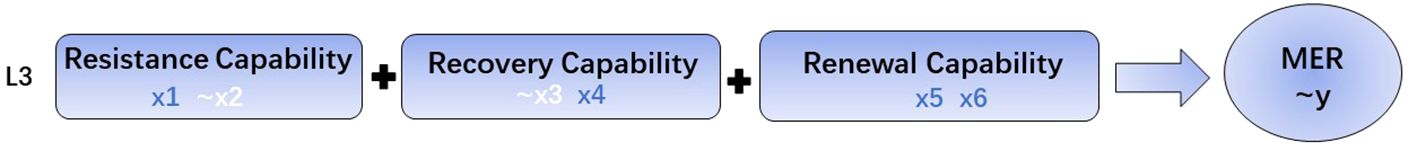
Figure 11 Weak Resistance-Recovery Type I.
(4) Configuration L4: Weak Resistance-Recovery Type II. Configuration L4 indicates that weak regional economy (~x1) and weak governmental capability (~x3) are core conditions, while strong industrial structure (x2), strong business environment (x4), strong innovation capability (x5), and strong digital economy (x6) are peripheral conditions. The combination of these conditions can lead to weak MER (~y). According to the combination features, the difference between configurations L4 and L3 lies in their resistance capability. To demonstrate the connection between the two configurations, configuration L4 can be named as “Weak Resistance-Recovery Type II” (see Figure 12). L4 can explain about 28.4% of low MER cases, of which about 6.5% can only be explained by this configuration. Shandong is a typical case of configuring L4.
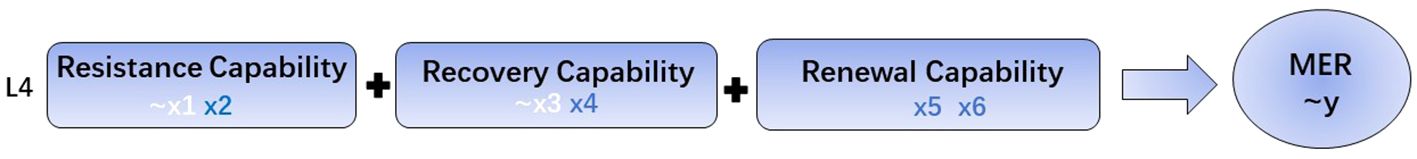
Figure 12 Weak Resistance-Recovery Type II.
3.3 Robustness Test
According to Fiss (2007), this study uses the method of increasing the consistency threshold for robustness testing. Specifically, increasing the consistency threshold from 0.8 to 0.9 resulted in the configuration shown in Table 12. Comparing Tables 11, 12, it can be found that the core conditions of both have not undergone substantial changes, and the configurations in Table 12 are a subset of the configurations in Table 11, indicating that the results have passed the robustness test.
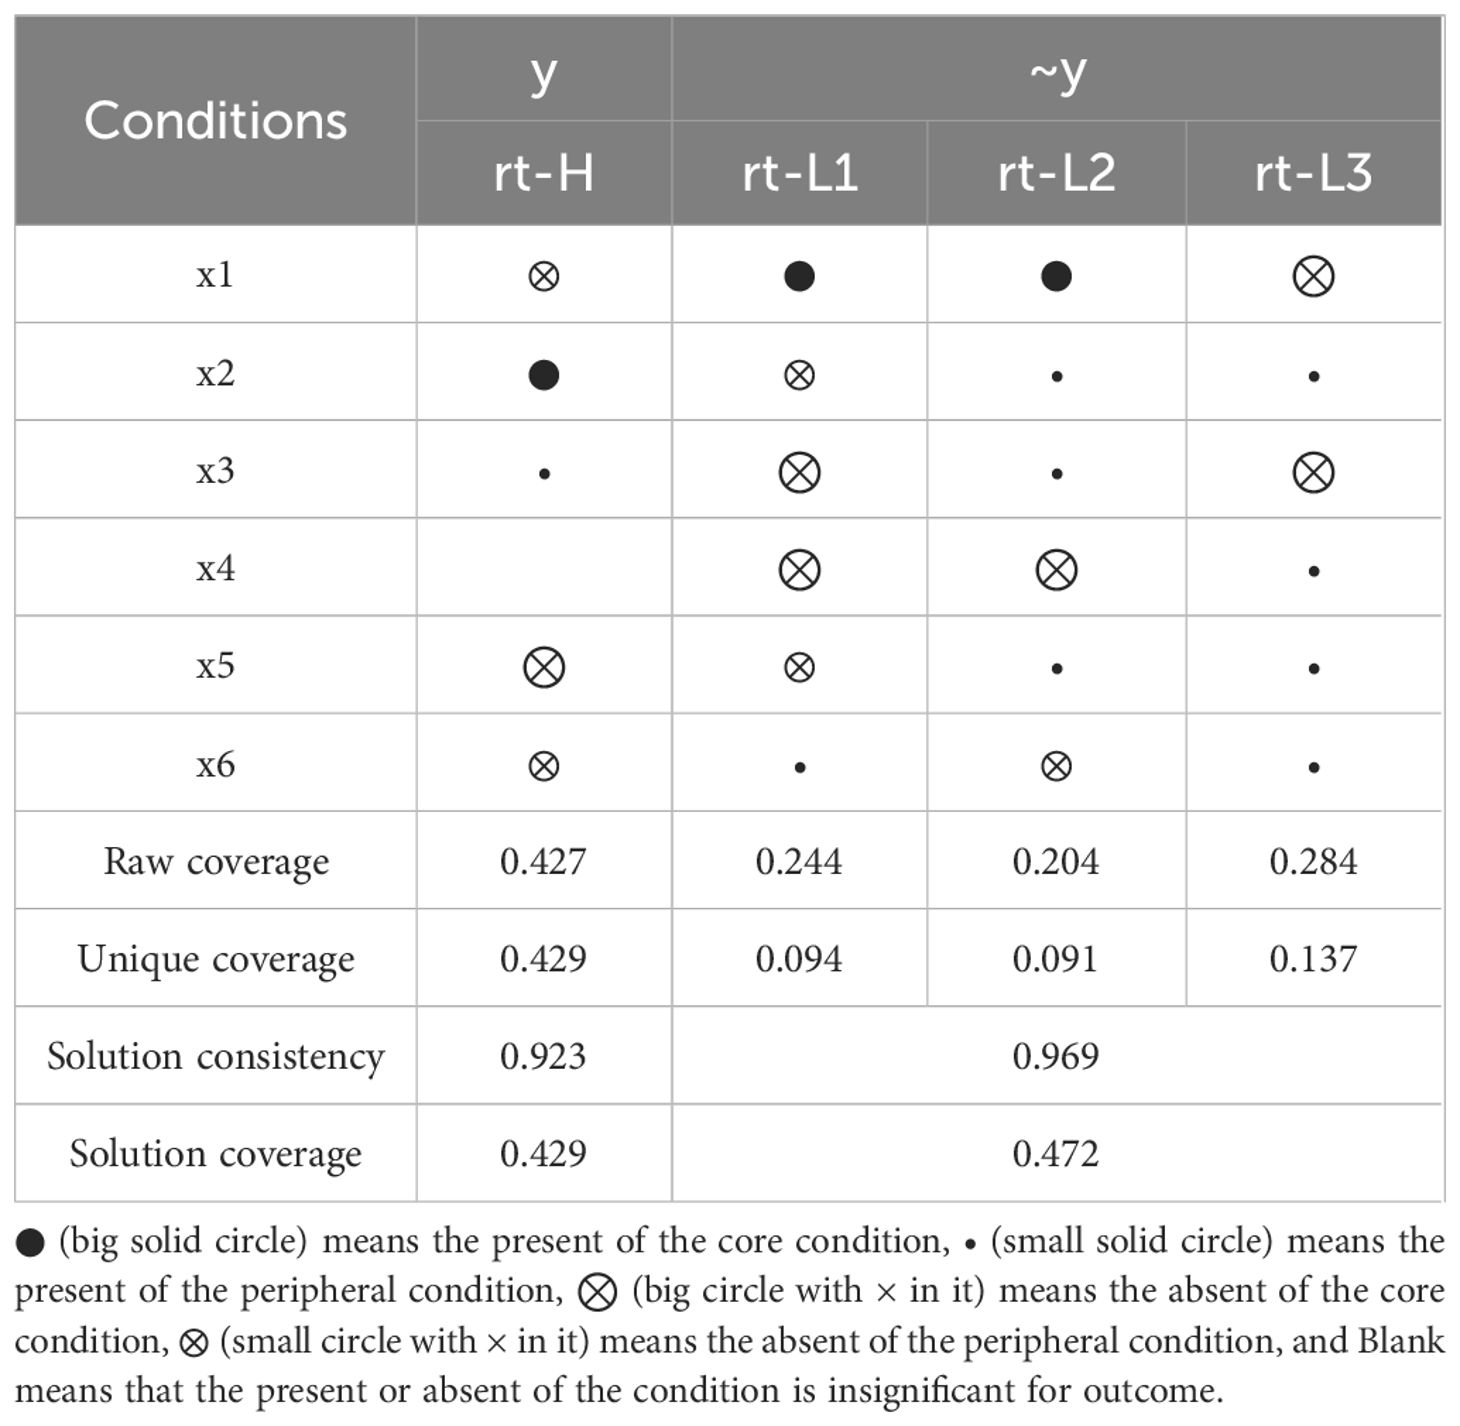
Table 12 Results of robustness test.
4 Discussions
4.1 The core and peripheral conditions of strong MER configurations
The results of sufficiency analysis indicate that from the overall perspective of strong MER configurations, strong industrial structure, strong governmental capability, and strong digital economy are the core conditions, while strong regional economy, strong business environment, and strong innovation capability are the peripheral conditions. Therefore, from a univariate perspective, the results of sufficiency analysis are consistent with the received literature, that is, each variable can have a positive effect on MER to a certain extent.
For core conditions: (1) Same as the function of the marine industrial structure (Li and Qu, 2023; Yin et al., 2023), the more advanced of land industrial structure, the stronger the resistance capability of the marine economic system; (2) In the policy context of China, the stronger the governmental capability, the more capable it is to implement effective intervention and improve the recovery capability of the marine economic system; (3) The digital economy not only brings new opportunities for the development of the marine economy (Wang and Chang, 2023; Yang et al., 2023), but also supports the transformation of the development model and path of the marine economy (Li and Yu, 2023), thereby strengthening the renewal capability of the marine economic system.
For peripheral conditions: (1) similar to that of GOP (Zhai et al., 2023), the larger the regional economic scale, the stronger the resistance capability of the marine economic system; (2) A good business environment can achieve efficient allocation of various resources and overcome development barriers (Xu, 2018; Du et al., 2022), which is conducive to the entry and development of regional maritime enterprises and strengthens the recovery capability of the marine economic system; (3) Strengthening regional innovation capability is not only beneficial for strengthening regional economic resilience, but also for strengthening the renewal capability of the marine economic system, thereby strengthening MER (Liu and Chen, 2023b).
In addition, the weak MER configurations to some extent support the importance of three core conditions, such as the weak industrial structure and weak governmental capability in L1, L3, and L4 acting as the condition variables of weak MER configuration, and the weak digital economy in L2 also acting as the condition variables of weak MER configuration. However, according to the logic of received literature, it is difficult to explain why the same variable in different configurations (such as digital economy) can simultaneously act as a condition variable for strong MER and act as a condition variable for weak MER? Why are the combination forms of condition variables vastly different for the same strong (or weak) MER configurations? This requires further discussions.
4.2 The configuration mechanism of MER
For the relationship between land factors and MER, received literature has mostly conducted research under the premise of linear hypothesis, focusing on the net effects of one specific variable (such as industrial structure (Yin et al., 2023), innovation capability (Liu and Chen, 2023b), digital economy (Li and Yu, 2023), etc.) on MER, which leads to a lack of in-depth analysis of the synergistic effects among different land factors. The fsQCA approach is suitable for configuration problems and can directly analyze the interdependence among variables (Du and Jia, 2017; Zhang and Du, 2019), thereby helping researchers identify the causal complexity between different combinations of condition variables and the outcome, as well as the equivalent substitution effects among variables. With the perspective of configuration, this study found that different combinations of land factors impact differently on MER.
(1) Horizontal comparison and causal asymmetry. By comparing the six configurations horizontally, it can be found that, unlike linear hypothesis studies, the land factors that lead to strong MER (y) or weak MER (~y) are not necessarily the same variable. For example, in configurations H1 and H2, the upgrading of industrial structure (x2) is beneficial for strengthening MER; In configurations L2 and L4, the upgrading of industrial structure (x2) may possibly weaken MER. Similarly, in configuration H1, the presence of the digital economy (x6) does not result in strong MER; However, in configuration H2, the digital economy (x6) is the core condition for strong MER. This situation is called causal asymmetry (Armenia et al., 2023; Gao et al., 2023), and Figure 13 shows the causal asymmetry relationship between multiple land factors and MER. In the perspective of set theory, causal asymmetry is considered to be the normal state, as the interdependence and synergistic effects among different factors are commonly present in reality (Fiss, 2011), which leads to the complexity of causal relationships. In other words, how one specific factor impact on MER depends on its configuration relationship with other factors.
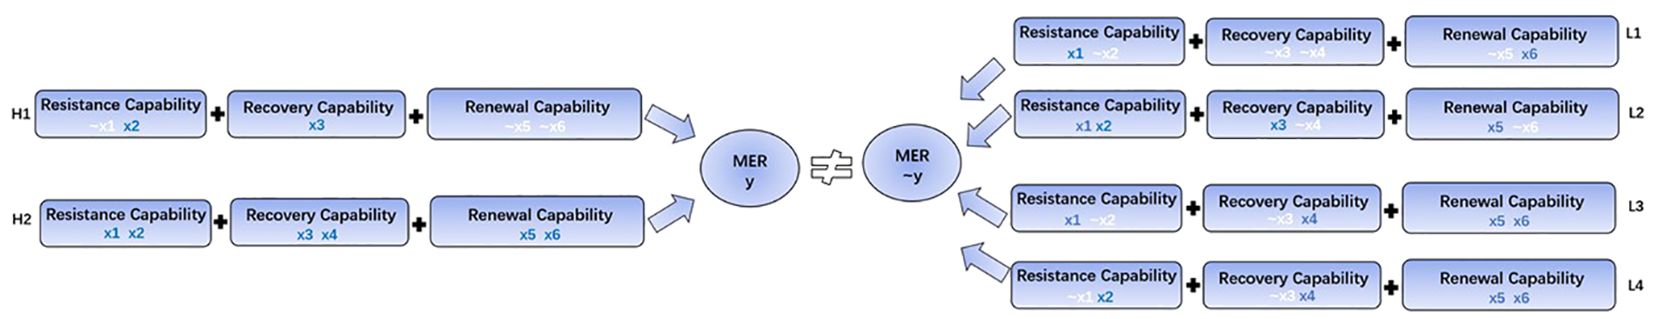
Figure 13 The causal asymmetry relationship between multiple land factors and MER.
(2) Vertical comparison and equivalent substitution effects. By comparing the six configurations vertically, it can be found that different combinations of the six condition variables constitute two strong MER configurations and four weak MER configurations, which reveals the existence of equivalent substitution effects between different configurations (see Figure 14). On the one hand, comparing the similarities and differences between equivalent configurations H1 and H2, it can be found that, given the same condition combination “x2 * x3”, “~x1 *~x4 *~x5 *~x6” and “x1 * x4 * x5 * x6” can be substituted by each other (the symbol *, generated from the software fsQCA 4.0, means the interdependence and synergistic effect among variables). On the other hand, comparing the similarities and differences of equivalent configurations L1, L2, L3, and L4, it can be found that for L1 and L2, given the same condition combination “x1 *~x4”, “~x2 *~x3 *~x5 * x6” and “x2 * x3 * x5 *~x6” can be substituted by each other; For L3 and L4, given the same condition combination of “~x3 * x4 * x5 * x6”, “x1 *~x2” and “~x1 * x2” can be substituted by each other. The existence of equivalent configurations and substitution effects indicates that the combination of conditions that lead to strong (or weak) MER is not unique, which may provide practical policy implications for the regions with weak MER.
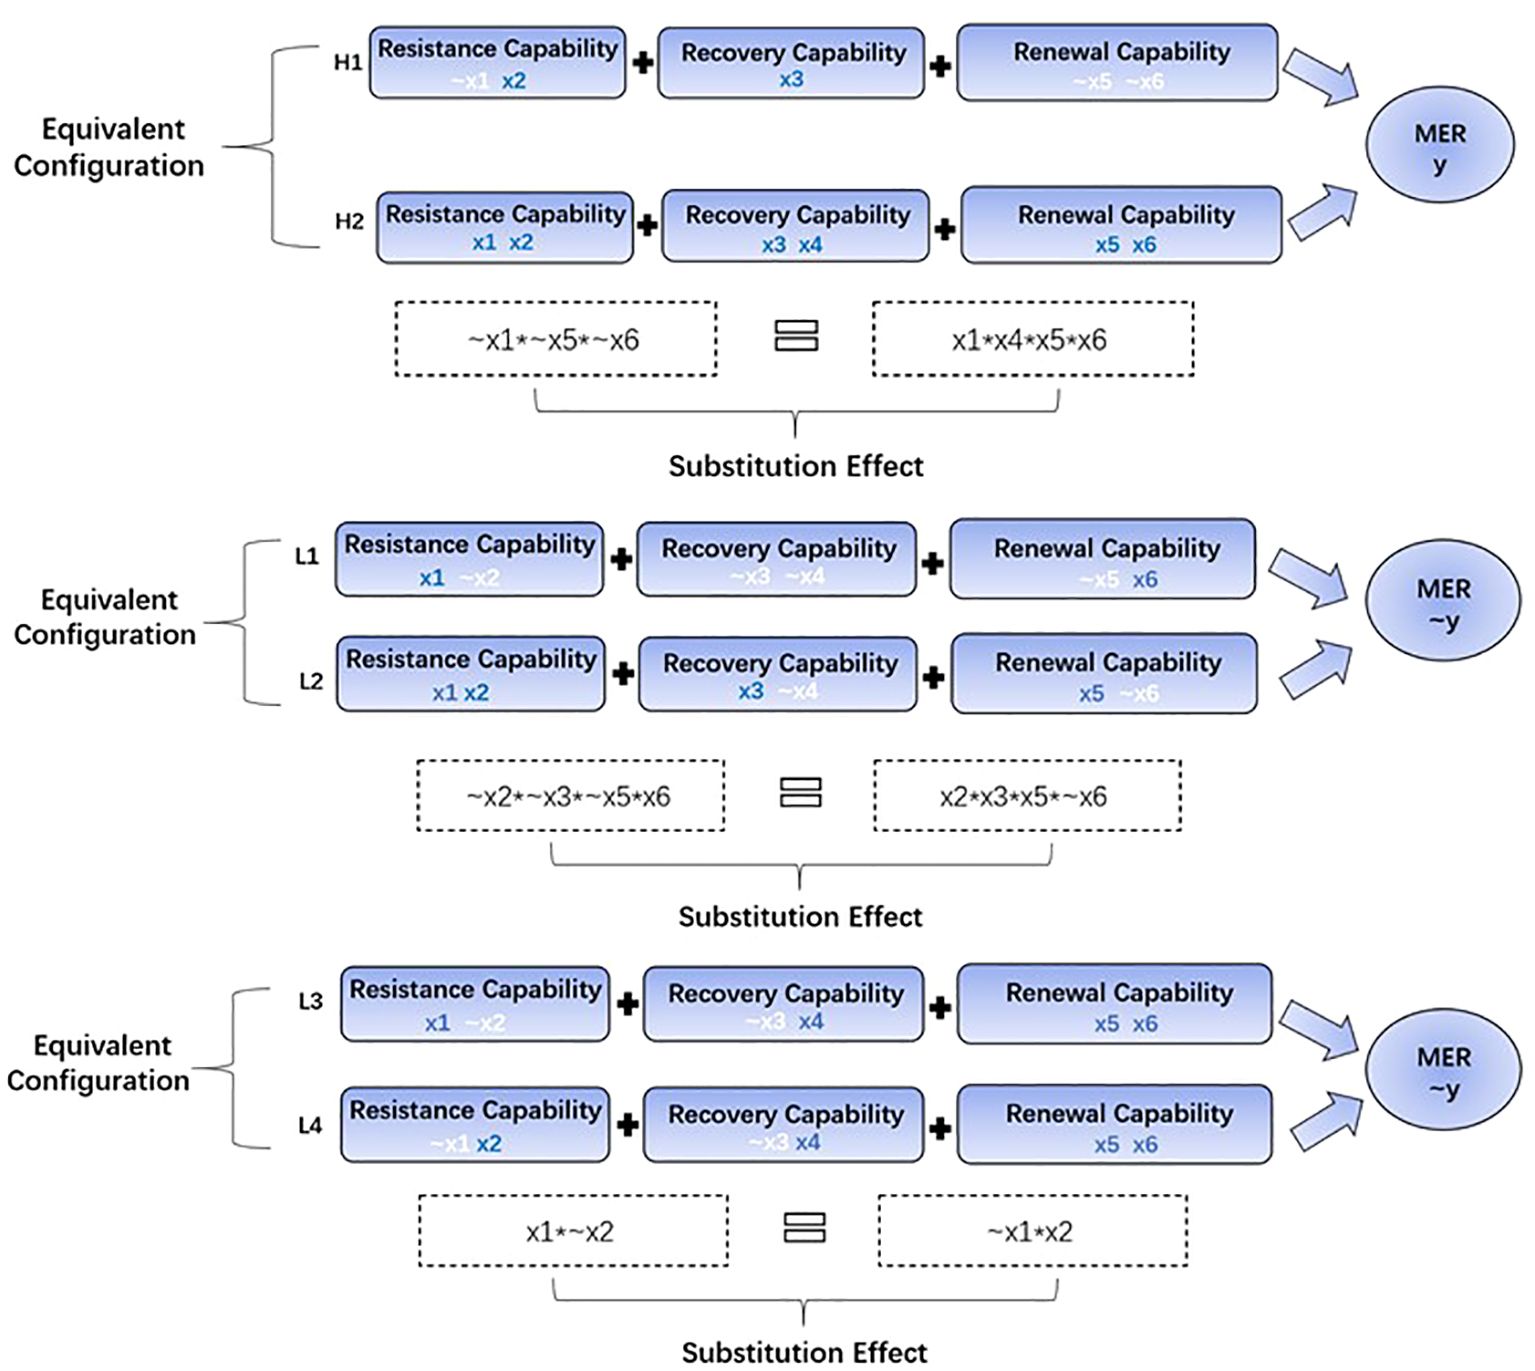
Figure 14 Equivalent substitution effect of land factors.
4.3 Policy implications
As the development of the marine economy penetrating into various fields such as economy, society, culture, etc., the marine economy is closely related to the rise and fall of a country or region. As a maritime power, the marine economy is crucial to the overall stability and development for China. Confronting various risk and unstable factors, strengthening MER is an important way for China to achieve sustainable and high-quality development of its marine economy. The main policy implications of this study are as follows:
(1) The upgrading of industrial structure, the enhancement of governmental capabilities, and the prosperity of the digital economy are the core conditions for strengthening MER, while the increasing of regional economy, the optimization of business environment, and the enhancement of innovation capability are peripheral conditions. However, it is worth noting that government decision-makers cannot simply allocate attention to one specific condition, but must strategically enhance the synergy among different conditions to form configurational effect that is conducive to strengthening MER.
(2) For regions with weak MER, government decision-makers need to evaluate the local conditions and shape strong MER configurations that are suitable for this region. For instance, to the regions similar to Hainan or Liaoning, efforts should be made to shape a Strong Resistance-Recovery Type configuration by upgrading the industrial structure and enhance the governmental capability; as to the regions similar to Shanghai, efforts should be made to shape a Comprehensive Strong Type configuration by filling in the missing conditions on the one hand, and formulate land-sea integration policies that are conducive to the comprehensive improvement of various conditions on the other hand.
(3) The decision-makers related to these conditions come from different government departments, and the essence of achieving conditional synergy is to achieve decision-making collaboration among different departments. That is to say, the overall effect of strengthening MER at the system level is achieved through decision-making collaboration. Therefore, it is necessary to introduce the logic of collaborative governance into the decision-making process, which requires decision-makers from various regulatory departments to participate in discussions, jointly identify problems, and develop collaborative action, supervision, and evaluation plans.
5 Conclusions
This study takes 11 coastal provinces of China as cases, integrates 6 condition variables by building a 3R configuration model, and uses the fsQCA approach to empirically explore the configuration effect of multiple land factors on MER. The main findings are as follows:
(1) None of the 6 conditions in the three dimensions of resistance capability, recovery capability, and renewal capability alone constitute the necessary conditions for strong or weak MER, indicating that a single condition has weak explanatory power for MER.
(2) There are two configurations for strong MER: Strong Resistance-Recovery Type and Comprehensive Strong Type. Industrial structure, governmental capability, and digital economy are the core conditions for strong MER configurations.
(3) There are four weak MER configurations: Comprehensive Weak Type, Weak Recovery-Renewal Type, Weak Resistance-Recovery Type I, and Weak Resistance-Recovery Type II.
The main contributions of this study may be as follows:
(1) Incorporating land factors into the 3R configuration model, expanding the research scope of MER influencing factors and enriching the research perspective of land-sea integration.
(2) By shifting from studying the relationship between certain specific variable and MER to studying the configuration mechanisms between land factors and MER, this study showcases the strong MER configurations and weak MER configurations, and provides decision-makers with practical policy implications.
There are still some research limitations in this study: On the one hand, considering the number of cases and characteristics of the QCA approach, the configuration model built in this study mainly includes 6 condition variables in three dimensions. Our future research will try to expand the number of cases by conducting a comparative study of global coastal countries, and increase the information capacity of individual condition variables through methods such as principal component analysis and TOPSIS to enrich the understanding of MER. On the other hand, this study mainly used the fsQCA approach for static analysis. Currently, there is an increasing number of studies combining the dynamic fsQCA approach (He et al., 2024) and other statistical analysis methods (e.g., NCA, PLS-SEM, DID) (Wang, 2023b; Acquah, 2024; Navarro-García et al., 2024). We plan to adopt appropriate combination methods in future research to enhance the predictive and explanatory power of the study.
Data availability statement
The original contributions presented in the study are included in the article/Supplementary Material. Further inquiries can be directed to the corresponding author.
Author contributions
ZH: Conceptualization, Data curation, Formal analysis, Methodology, Project administration, Software, Supervision, Validation, Writing – original draft, Writing – review & editing. DL: Conceptualization, Methodology, Software, Writing – original draft, Writing – review & editing.
Funding
The author(s) declare financial support was received for the research, authorship, and/or publication of this article. This research was funded by Fundamental Research Funds for the Central Universities of China, Grand No. 3072024XJS1301, Integrated Education Program for Cultural and Management Disciplines of HEU, Grand No.2072024RHY1308, General Project of the National Social Science Fund of China in 2019, grant No. 19BSH041, and Sub project of Guangzhou Ship and Marine Engineering Equipment Industry Development Planning Research Project, Grand No. KY61700230112.
Conflict of interest
The authors declare that the research was conducted in the absence of any commercial or financial relationships that could be construed as a potential conflict of interest.
Publisher’s note
All claims expressed in this article are solely those of the authors and do not necessarily represent those of their affiliated organizations, or those of the publisher, the editors and the reviewers. Any product that may be evaluated in this article, or claim that may be made by its manufacturer, is not guaranteed or endorsed by the publisher.
Supplementary material
The Supplementary Material for this article can be found online at: https://www.frontiersin.org/articles/10.3389/fmars.2024.1398899/full#supplementary-material
References
Acquah I. S. K. (2024). Unravelling the asymmetric effects of procurement practices on firm performance: A complexity theory approach to complementing fsQCA with NCA. Heliyon 10, e25230. doi: 10.1016/j.heliyon.2024.e25230
Armenia S., Barnabe F., Franco E., Iandolo F., Pompei A., Tsaples G. (2023). Identifying policy options and responses to water management issues through system dynamics and fsQCA. Technological Forecasting Soc. Change 194, 122737. doi: 10.1016/j.techfore.2023.122737
Cheng G., Jin Y. (2022). Can strengthening innovation capability enhance urban economic resilience? Modern Economic Res. 2, 1–11. doi: 10.13891/j.cnki.mer.2022.02.015
Chen Z., Wang Q. (2023). Economic resilience measurement and spatial characteristics analysis of coastal tourism industry: Based on data from 11 coastal provinces. Ocean Dev. Management 40, 108–119. doi: 10.20016/j.cnki.hykfygl.20230607.005
Chen C., Ye A. (2021). Digital economy, innovation capacity and regional economic resilience. Stat Decision 37, 10–15. doi: 10.13546/j.cnki.tjyjc.2021.17.002
Doloreux D., Shearmur R. (2018). Moving maritime clusters to the next level: Canada's Ocean Supercluster initiative. Mar. Policy 98, 33–36. doi: 10.1016/j.marpol.2018.09.008
Du Y., Jia L. (2017). Configuration perspective and qualitative comparative analysis: A new way of management research. J. Manage. World 6, 155–167. doi: 10.19744/j.cnki.11-1235/f.2017.06.012
Du Y., Li J., Liu Q., Zhao S., Chen K. (2021). Configurational theory and QCA method from a complex dynamic perspective: Research progress and future directions. J. Manage. World 37, 180–197. doi: 10.19744/j.cnki.11-1235/f.2021.0042
Du Y., Liu Q., Chen K., Xiao R., Li S. (2022). Ecosystem of doing business, total factor productivity and multiple patterns of high-quality development of Chinese cities: A configuration analysis based on complex systems view. J. Manage. World 38, 127–145. doi: 10.19744/j.cnki.11-1235/f.2022.0123
Feng L., Min Q., Wang J., Zhang K. (2022). The collaborative driving path of innovation performance factors in Chinese context. Sci. Technol. Prog. Policy 39, 93–102. doi: 10.6049/kjjbydc.2021040699
Fiss P. C. (2007). A set-theoretic approach to organizational configurations. Acad. Manage. Review 32, 1180–1198. doi: 10.5465/amr.2007.26586092
Fiss P. C. (2011). Building better causal theories: A fuzzy set approach to typologies in organization research. Acad. Manage. J. 54, 393–420. doi: 10.5465/amj.2011.60263120
Gai M., He Y., Ke L. (2022). Research on the development quality of China’s marine economy. J. Natural Resources 37, 942–965. doi: 10.31497/zrzyxb.20220408
Gao Q., Li Z., Sun M. (2023). Study on the influence path of public participation in marine ecotourism under the perspective of conspicuous consumption - Analysis of fsQCA based on VBN theory. Mar. pollut. Bulletin 194, 115279. doi: 10.1016/j.marpolbul.2023.115279
Guan M., Chen X., Li C. (2024). Study on the resilience evaluation and spatiotemporal evolution characteristics of China's marine fisheries economy. Ocean Dev. Manage. doi: 10.20016/j.cnki.hykfygl.20240017.001
Guo Q., Gong X. (2023). Spatial differentiation and driving mechanism of the marine economic resilience in China. Regional Stud. Mar. Sci. 68, 103244. doi: 10.1016/j.rsma.2023.103244
Han Z., Zhu W., Li B. (2022). Synergistic analysis of economic resilience and efficiency of marine fishery in China. Geographical Res. 41, 406–419. doi: 10.11821/dlyj020210088
He H., Zhang Z., Ding R., Shi Y. (2024). Multi-driving paths for the coupling coordinated development of agricultural carbon emission reduction and sequestration and food security: A configurational analysis based on dynamic fsQCA. Ecol. Indicators 160, 11875. doi: 10.1016/j.ecolind.2024.111875
Holling C. S. (1973). Resilience and stability of ecological systems. Annu. Rev. Ecol. Systematics 4, 1–23. doi: 10.1146/annurev.es.04.110173.000245
Hu Y., Zhou H., Jin X., Shen Y., Yan Y. (2022). Assessing the resilience of the marine economy: A case study of southern China’s marine economy circle. Front. Mar. Sci. 9. doi: 10.3389/fmars.2022.912462
Hua G., Chen Y. (2022). Financial agglomeration, technological innovation, and urban economic resilience. East China Economic Management 36, 48–56. doi: 10.19629/j.cnki.34-1014/f.210902018
Huang Y., Li K., Li P. (2023). Innovation ecosystems and national talent competitiveness: A country-based comparison using fsQCA. Technological Forecasting Soc. Change 194, 122733. doi: 10.1016/j.techfore.2023.122733
Ji J., Tang R., Sun X. (2021). Marine scientific and technological innovation, marine industrial structure upgrade and marine total factor productivity: Empirical research based on threshold effect of 11 coastal provinces in China. Sci. Technol. Manage. Res. 41, 73–80. doi: 10.3969/j.issn.1000-7695.2021.16.009
Jiang H., Wen Y. (2022). Temporal and spatial characteristics of China’s marine economic resilience and its obstacle diagnosis. Chin. Fisheries Economics 40, 79–88. doi: 10.3969/j.issn.1009-590X.2022.05.010
Li D. (2023). The impact of marine industrial structure rationalization on marine economic growth. J. Sea Res. 196, 102455. doi: 10.1016/j.seares.2023.102455
Li B., Qu Y. (2023). Influence of industrial evolution path dependence and path creation on regional economic resilience: Taking the coastal areas of China as an example. Acta Geographica Sinica 78, 824–839. doi: 10.11821/dlxb202304004
Li X., Wu W., Gu G. (2022). Does the development of digital economy improve regional economic resilience? A research based on intermediary effect, threshold effect and spatial spillover effect. J. Zhejiang Univ. (Humanities Soc. Sciences) 52, 21–39. doi: 10.3785/j.issn.1008-942X.CN33-6000/C.2022.07.214
Li J., Yu W. (2023). The impact of digital finance development on the resilience of marine economy in coastal areas. Ocean Dev. Management 40, 54–62. doi: 10.20016/j.cnki.hykfygl.2023.10.006
Li X., Zhou S., Zhao Y., Wan G. (2024). A CRITIC-TOPSIS and optimized nonlinear grey prediction model: A comparative convergence analysis of marine economic resilience. Expert Syst. Applications 236, 121356. doi: 10.1016/j.eswa.2023.121356
Liu G., Chen K. (2023a). The impact and spatial-temporal differences of China’s marine innovation capability on marine economic resilience. Resource Dev. Market 39, 1135–1143. doi: 10.3969/j.issn.1005-8141.2023.09.006
Liu G., Chen K. (2023b). The impact of China's coastal region innovation capability on the convergence of marine economic resilience. Productivity Res. 11, 59–66. doi: 10.19374/j.cnki.14-1145/f.2023.11.002
Liu Y., Han L., Pei Z., Jiang Y. (2023). Evolution of the coupling coordination between the marine economy and urban resilience of major coastal cities in China. Mar. Policy 148, 105456. doi: 10.1016/j.marpol.2022.105456
Liu L., Lu S. (2023). Digital economy, financial development and economic resilience. Finance Trade Res. 34, 67–83. doi: 10.19337/j.cnki.34-1093/f.2023.07.006
Liu S., Shen J. (2022). Evaluation of marine economy resilience in the Bohai Rim. J. Green Sci. Technol. 24, 223–229. doi: 10.16663/j.cnki.lskj.2022.07.009
Liu G., Zhang W. (2024). Spillover effects of institutional innovation on marine economic resilience in China’s coastal areas. Sci. Technol. Industry 24, 80–90. doi: 10.3969/j.issn.1671-1807.2024.10.013
Mabon L., Kawabe M. (2023). Social media within digitalisation for coastal resilience: The case of coastal fisheries in Minamisoma, Fukushima Prefecture, Japan. Ocean Coast. Management 232, 106440. doi: 10.1016/j.ocecoaman.2022.106440
Martin R. (2012). Regional economic resilience, hysteresis and recessionary shocks. Narnia 12, 1–32. doi: 10.1093/jeg/lbr019
Martin R., Sunley P. (2015). On the notion of regional economic resilience: conceptualization and explanation. J. Economic Geogr. 15, 1–42. doi: 10.1093/jeg/lbu015
Mele B. H., Russo L., D’Alelio D. (2019). Combining marine ecology and economy to roadmap the integrated coastal man-agement: A systematic literature review. Sustainability 11, 4393. doi: 10.3390/su11164393
Muštra V., Šimundić B., Kuliš Z. (2020). Does innovation matter for regional labour resilience? Case EU regions Regional Sci. Policy Practice 12, 955–971. doi: 10.1111/rsp3.12348
Navarro-García A., Ledesma-Chaves P., Gil-Cordero E., De-Juan-Vigaray M. D. (2024). Intangible resources, static and dynamic capabilities and perceived competitive advantage in exporting firms. A PLS-SEM/fsQCA approach. Technological Forecasting Soc. Change 198, 123001. doi: 10.1016/j.techfore.2023.123001
Nham N. T. H., Hoa T. T. M., Ha L. T. (2023). Influences of digitalization on sustaining marine minerals: A path toward sustainable blue economy. Ocean Coast. Management 239, 106589. doi: 10.1016/j.ocecoaman.2023.106589
Pablo S. J., Babarro J. M. F., Padin X. A., Angeles L. P., Silvia M. L., David B. B. J., et al. (2022). Cumulative climatic stressors strangles marine aquaculture: Ancillary effects of COVID 19 on Spanish mariculture. Aquaculture 549, 737749. doi: 10.1016/j.aquaculture.2021.737749
Ragin C. C., Fiss P. C. (2008). “Net Effects Analysis versus Configurational Analysis: An Empirical Demonstration,” in Redesining Social Inquiry: Fuzzy Set and Beyond. Ed. Ragin C. C. (University of Chicago Press, IL, USA), 190–212.
Reggiani A., Graaff T. D., Nijkamp P. (2002). Resilience: An evolutionary approach to spatial economic systems. Networks Spatial Economics 2, 211–229. doi: 10.1023/A:1015377515690
Ren W., Xu Y., Ni J. (2024). Evolution of marine ecology-industry symbiosis patterns and ecological security assessment: New evidence from coastal areas of China. Ocean Coast. Management 247, 106939. doi: 10.1016/j.ocecoaman.2023.106939
Sarwar S. (2022). Impact of energy intensity, green economy and blue economy to achieve sustainable economic growth in GCC countries: does Saudi vision 2030 matters to GCC counties? Renewable Energy 191, 30–46. doi: 10.1016/j.renene.2022.03.122
Shen J., Guo H. (2024). Whether digital financial inclusion enhances the economic resilience of ocean cities: research on the regulatory effect based on financial supervision. Ocean Dev. and Management 41, 15–27. doi: 10.20016/j.cnki.hykfygl.20240304.006
Song L., Zhao M., Tang Y. (2022). Spatial-temporal differentiation and influencing factors of marine economic resilience in China’s coastal provinces and regions. J. Liaoning Normal Univ. (Natural Sci. Edition) 45, 377–387. doi: 10.11679/lsxblk2022030377
Sun C., Cao Q., Zhou W. (2020). Assessment of marine economy resilience of coastal cities in Bohai Sea Ring area based on entropy efficiency model. J. Ningbo Univ. (Natural Sci. Eng. Edition) 33, 10–18. doi: 10.3969/j.issn.1001-5132.2020.01.002
Sun Y., Chen D., Geng Z. (2024). The coordination of technological and financial innovation concepts on the marine economy and its ecological development. J. Sea Res. 197, 102468. doi: 10.1016/j.seares.2024.102468
Sun J., Miao J., Mu H., Xu J., Zhai N. (2022). Sustainable development in marine economy: Assessing carrying capacity of Shandong province in China. Ocean Coast. Management 216, 105981. doi: 10.1016/j.ocecoaman.2021.105981
Tang F. (2016). Local fiscal competition, governance capability and enterprise migration. J. World Economy 39, 53–77. doi: 10.19985/j.cnki.cassjwe.2016.10.004
Tang H., Zhang X., Wang L. (2020). Research on temporal-spatial evolutional mechanism of integration of marine and terrestrial economy in China. China Soft Sci. 12, 130–144. doi: 10.3969/j.issn.1002-9753.2020.12.013
Wang H. (2023a). Promote Chinese path to modernization with the new action of building a maritime power. Study Times 9, 22. doi: 10.38216/n.cnki.nxxsb.2023.000908
Wang H. (2023b). The construction and assessment of local planning rights: an empirical study based on DID and Dynamic QCA. Sociological Stud. 38, 153–176.
Wang Y. (2023). Development and spatial structure of China’s marine economic resilience. Areal Res. Dev. 42, 7–12.
Wang J., Chang J. (2023). Study on the coupling measurement of digital economy and marine economy in China. Chin. Fisheries Economics 41, 73–81. doi: 10.3969/j.issn.1009-590X.2023.06.009
Wang Y., Li Y., Wang W. (2022). Spatial and temporal changes and obstacle factors of marine ecological-economic resilience in China. Ecol. Economy 38, 53–59.
Wang L., Niu W., Ding L., Zhao Z. (2023). A bibliometric review on marine economy: Current status, development and future directions. Mar. Policy 155, 105705. doi: 10.1016/j.marpol.2023.105705
Wang J., Shi X., Du Y. (2021). Exploring the relationship among marine science and technology innovation, marine finance, and marine higher education using a coupling analysis: A case study of China's coastal areas. Mar. Policy 132, 104706. doi: 10.1016/j.marpol.2021.104706
Wang Z., Tang Y., Han Z., Wang Y. (2022). Resilience measurement and influencing factors of the marine ship industry chain in China’s coastal areas. Economic Geogr. 42, 117–125. doi: 10.15957/j.cnki.jjdl.2022.07.012
Xie Z., Wang X., Xie L., Duan K. (2021). Entrepreneurial ecosystem and the quality and quantity of regional entrepreneurship: A configurational approach. J. Business Res. 128, 499–509. doi: 10.1016/j.jbusres.2021.02.015
Xu H. (2018). Typical mechanism of institutional environment affects technological innovation: Theoretical interpretation and spatial test. Nankai Economic Stud. 5, 133–154. doi: 10.14116/j.nkes.2018.05.008
Xu T., Dong J., Qiao D. (2023). China’s marine economic efficiency: A meta-analysis. Ocean Coast. Management Ocean Coast. Management 239, 106633. doi: 10.1016/j.ocecoaman.2023.106633
Xu S., Yang X. (2018). A study on the synergistic development between innovation-driven strategy and marine industry ag-glomeration: A gray correlation analysis based on the data of China’s coastal provincial-level administrative areas. East China Economic Management 32, 109–116. doi: 10.19629/j.cnki.34-1014/f.170509029
Yan X., Shi X., Fang X. (2022). The internal dynamics and regional differences of China's marine economic evolution based on comprehensive evaluation. Alexandria Eng. J. 61, 7571–7583. doi: 10.1016/j.aej.2022.01.016
Yang Q., Yuan C. (2023). Government competition, R&D capital aggregation and innovation performance. Sci. Technol. Prog. Policy 40, 14–24. doi: 10.6049/kjjbydc.2022080747
Yang W., Zhou D., Zhao D. (2023). Coupling and coordination analysis of high-quality development of Chinese digital economy and marine economy. Ocean Dev. Management 40, 98–106. doi: 10.20016/j.cnki.hykfygl.20230816.010
Yin Y., Su X., Xie X. (2023). The spatial effect of industrial structure upgrading on urban economic resilience. Economic Geogr. 43, 86–92. doi: 10.15957/j.cnki.jjdl.2023.08.009
Yin S., Yang X. (2022). Local government competition, resource endowment and total factor productivity of cultural and creative industries. Inq. into Economic Issues 4, 79–99.
Yu H., Wang Y., Li D. (2023). Using the AHP-entropy weight method to study regional marine economy resilience in China. J. Coast. Res. 39, 960–969. doi: 10.2112/JCOASTRES-D-22-00102.1
Yu J., Zhou L., Zhu G. (2016). Strategic interaction in political competition: Evidence from spatial effects across Chinese cities. Regional Sci. Urban Economics 57, 23–37. doi: 10.1016/j.regsciurbeco.2015.12.003
Zhai X., Sun C., Zou W., Hao S. (2023). Spatiotemporal characteristic and evolution of China's marine economic resilience. Ocean Coast. Management 238, 106562. doi: 10.1016/j.ocecoaman.2023.106562
Zhang M., Du Y. (2019). Qualitative comparative analysis in management and organization research: Position, tactics and directions. Chin. J. Management 9, 1312–1323. doi: 10.3969/j.issn.1672-884x.2019.09.005
Zhang R., Gao Q., Gao K. (2024). Impact of marine industrial agglomeration on the high-quality development of the marine economy——A case study of China's coastal areas. Ecol. Indicators 158, 111410. doi: 10.1016/j.ecolind.2023.111410
Zhang S., Kang B., Zhang Z. (2020). Evaluation of doing business in Chinese provinces: Indicator system and quantitative analysis. Business Manage. J. 42, 5–19. doi: 10.19616/j.cnki.bmj.2020.04.001
Zhao C., Feng F., Chen Y., Li X. (2021). Local government competition and regional innovation efficiency: From the perspective of China-style fiscal federalism. Sci. Public Policy 48, 488–489. doi: 10.1093/scipol/scab023
Zhao L., Hu R., Sun C. (2021). Research on the coordination relationship between China’s marine economic resilience and marine economic efficiency. Mar. Economy 11, 90–99. doi: 10.1093/scipol/scab023
Keywords: marine economic resilience, industrial structure, governmental capability, digital economy, fuzzy-set qualitative comparative analysis, configuration effect
Citation: Liu D and Huang Z (2024) Configuration analysis of marine economic resilience based on 11 coastal provinces of China: an fsQCA approach. Front. Mar. Sci. 11:1398899. doi: 10.3389/fmars.2024.1398899
Received: 11 March 2024; Accepted: 04 July 2024;
Published: 22 July 2024.
Edited by:
Yen-Chiang Chang, Dalian Maritime University, ChinaCopyright © 2024 Liu and Huang. This is an open-access article distributed under the terms of the Creative Commons Attribution License (CC BY). The use, distribution or reproduction in other forums is permitted, provided the original author(s) and the copyright owner(s) are credited and that the original publication in this journal is cited, in accordance with accepted academic practice. No use, distribution or reproduction is permitted which does not comply with these terms.
*Correspondence: Zhenyu Huang, aHVhbmd6eUBocmJldS5lZHUuY24=