 Lauren J. Barrett
 Penny Vlahos
 Mary A. McGuinness
 Michael M. Whitney
- Department of Marine Sciences, University of Connecticut, Groton, CT, United States
Long Island Sound (LIS) is a highly urbanized estuary that receives high inputs of nitrogen pollution leading to summertime hypoxia in the bottom waters of its western region. Though LIS hypoxia has been well-studied for decades, there is a paucity of information regarding eutrophication-induced acidification due to the challenges of obtaining high-precision observations of the marine carbonate system. In this work, we established a time-series of carbon dioxide (CO2) system observations in LIS through measurements of dissolved inorganic carbon (DIC) and total alkalinity (TA) during thirteen sampling events between March 2020 and August 2022. This time span captured both seasonal and interannual variation, including the contrast between two historic drought years (2020 and 2022) and one high-freshwater flow year with significant tropical storm activity (2021). Observations revealed reduced acidification in western LIS (WLIS) (minimum aragonite saturation state, Ωar > 1.5) during the high-river discharge summer of 2021, corresponding to a decrease in the DIC/TA ratio of the Housatonic River. By contrast, LIS bottom water DIC and DIC/TA were higher during the drought summers of 2020 and 2022 (bottom DIC/TA = 0.9-1.0 and 0.85-0.9 in 2020 and 2021, respectively), leading to more acidified conditions and persistent aragonite undersaturation (minimum Ωar <1.0 and 1.1 in 2020 and 2022, respectively). Increased river discharge mitigated respiration-induced acidification in WLIS, likely due to a combination of decreased estuarine residence time and reduced riverine DIC/TA. These results motivate future studies of the carbonate chemistry of LIS and its freshwater endmembers in relation to hypoxia dynamics, with consideration of climate related shifts in physical and biological dynamics of the estuary with time.
1 Introduction
The global ocean has absorbed ~25% of anthropogenic carbon dioxide (CO2) emissions over the past ~200 years (Friedlingstein et al., 2022), leading to a long-term decrease in marine pH, or “ocean acidification” (Doney et al., 2009). While this problem is observable and well-documented in the open ocean (Feely et al., 2009; Orr, 2011), in coastal systems there are additional processes that can either exacerbate or relieve acidification resulting from atmospheric CO2 (Cai et al., 2011; Duarte et al., 2013; Wallace et al., 2014). In many estuaries with substantial anthropogenic influence, nutrient pollution stimulating algal growth and microbial respiration leads to the co-occurrence of low-oxygen conditions (hypoxia, dissolved oxygen concentration < 3 mg L-1 or 94 μmol L-1) and enhanced acidification (Laurent et al., 2017; Brodeur et al., 2019; Xiong et al., 2020).
The temperate estuary Long Island Sound (LIS) borders the New York City metropolitan area, the Connecticut coast, and Long Island’s north shore. Nitrogen enters LIS from point sources such as wastewater discharge and from nonpoint sources such as atmospheric deposition and fertilizer use. Nitrogen pollution leads to surface water eutrophication in LIS, stimulating intense spring and summertime primary productivity (Goebel et al., 2006; Vaudrey, 2017). As the water column becomes density stratified in the summer and phytoplankton biomass sinks, microbial respiration depletes oxygen in bottom waters (Anderson and Taylor, 2001). As a result, hypoxic conditions of varying extent and duration have consistently been observed in the bottom waters of Long Island Sound during the summertime since the late 1980’s (Wilson et al., 2008; Duvall et al., 2023). Implementation of nitrogen total maximum daily loads (TMDL) in 2000 (NY DEC and CT DEEP, 2000) included substantial efforts to upgrade wastewater treatment systems. The primary goal of reducing nitrogen input to LIS by 58.5% relative to pre-TMDL values was achieved in 2016. The reduction of nitrogen pollution to LIS has led to a marked decrease in hypoxic area of up to 60% of the pre-TMDL value (Long Island Sound Study, 2022). However, hypoxia remains a persistent issue in LIS and is regularly monitored by the Connecticut Department of Energy and Environmental Protection (CT DEEP) and the Environmental Protection Agency (EPA) Long Island Sound Study (LISS).
Though acidification co-occurs with hypoxia in LIS (Wallace et al., 2014), inorganic carbon dynamics have received much less attention than dissolved oxygen. This is despite the knowledge that estuarine acidification imposes ecological and economic concerns (Ekstrom et al., 2015) and contributes to a multi-stressor environment for marine organisms (Gobler and Baumann, 2016). The paucity of carbonate system information in LIS is in part due to the historical practical and financial barriers to obtaining high-quality data. Potentiometric pH measurements were added to monthly routine monitoring of LIS by CT DEEP in 2011. However, pH alone is not sufficient to define the ocean carbonate system, which has two degrees of freedom, meaning two of four measurable parameters (total alkalinity, dissolved inorganic carbon, pH, and partial pressure of CO2) are required to compute all variables in the system (Dickson et al., 2007). Additionally, potentiometric pH observations, though more accessible than high-precision measurements, are subject to large uncertainties (McLaughlin et al., 2017).
In this study, we established a time-series of carbonate system observations in LIS in collaboration with routine water quality monitoring by CT DEEP and LISS. We aimed to address the knowledge gap of baseline carbonate chemistry characteristics to achieve a more complete understanding of LIS biogeochemical cycles, the degree of aragonite undersaturation during seasonal hypoxia, and the confounding stressors to the LIS ecosystem. With these insights we can improve our predictions of how LIS and other temperate estuaries may be impacted by anticipated climate changes to inform strategies for sustainable ecosystem management. Carbonate chemistry trends were evaluated in relation to hydrodynamics and other seasonal influences via endmember sampling and comprehensive seasonal and interannual surveys. Surface and bottom water total alkalinity (TA), dissolved inorganic carbon (DIC), and hydrographic data were collected across the estuary during thirteen sampling events between March 2020 and August 2022, capturing seasonal and interannual variations and refining the understanding of the relationship between acidification and hypoxia in LIS. This information is placed in context with similar northwestern Atlantic estuaries to examine the ways in which LIS does and does not align with biogeochemical dynamics in other regions.
2 Methods
2.1 Study area and sampling approach
LIS is an urbanized, seasonally eutrophic estuary on the east coast of the United States (Figure 1). The macrotidal estuary is bordered by Connecticut to the north, by Long Island, NY to the south, and by New York City to the west. Most of the seawater exchange occurs through the mouth of the estuary in eastern LIS (ELIS) where it is connected to the Mid Atlantic Bight (O’Donnell et al., 2014; Whitney et al., 2016). A much smaller exchange also occurs in WLIS where the head of the estuary is connected to the East River, a tidal strait connected to the Hudson River estuary (Gay et al., 2004). The Connecticut River is the largest freshwater source, accounting for 75% of annual freshwater delivery, and enters near the estuary mouth. The next largest freshwater source is the Housatonic River in western LIS, accounting for 10% of annual river discharge to the estuary (Gay et al., 2004). Due to the circulation patterns in LIS, the Connecticut River comprises >50% and >70% of the freshwater in western and eastern LIS, respectively, while the Housatonic River comprises >25% and >10% of the freshwater in western and eastern LIS, respectively (Deignan-Schmidt and Whitney, 2018). The residence time of freshwater in LIS ranges from 3-6 months, depending on river discharge (Deignan-Schmidt and Whitney, 2018).
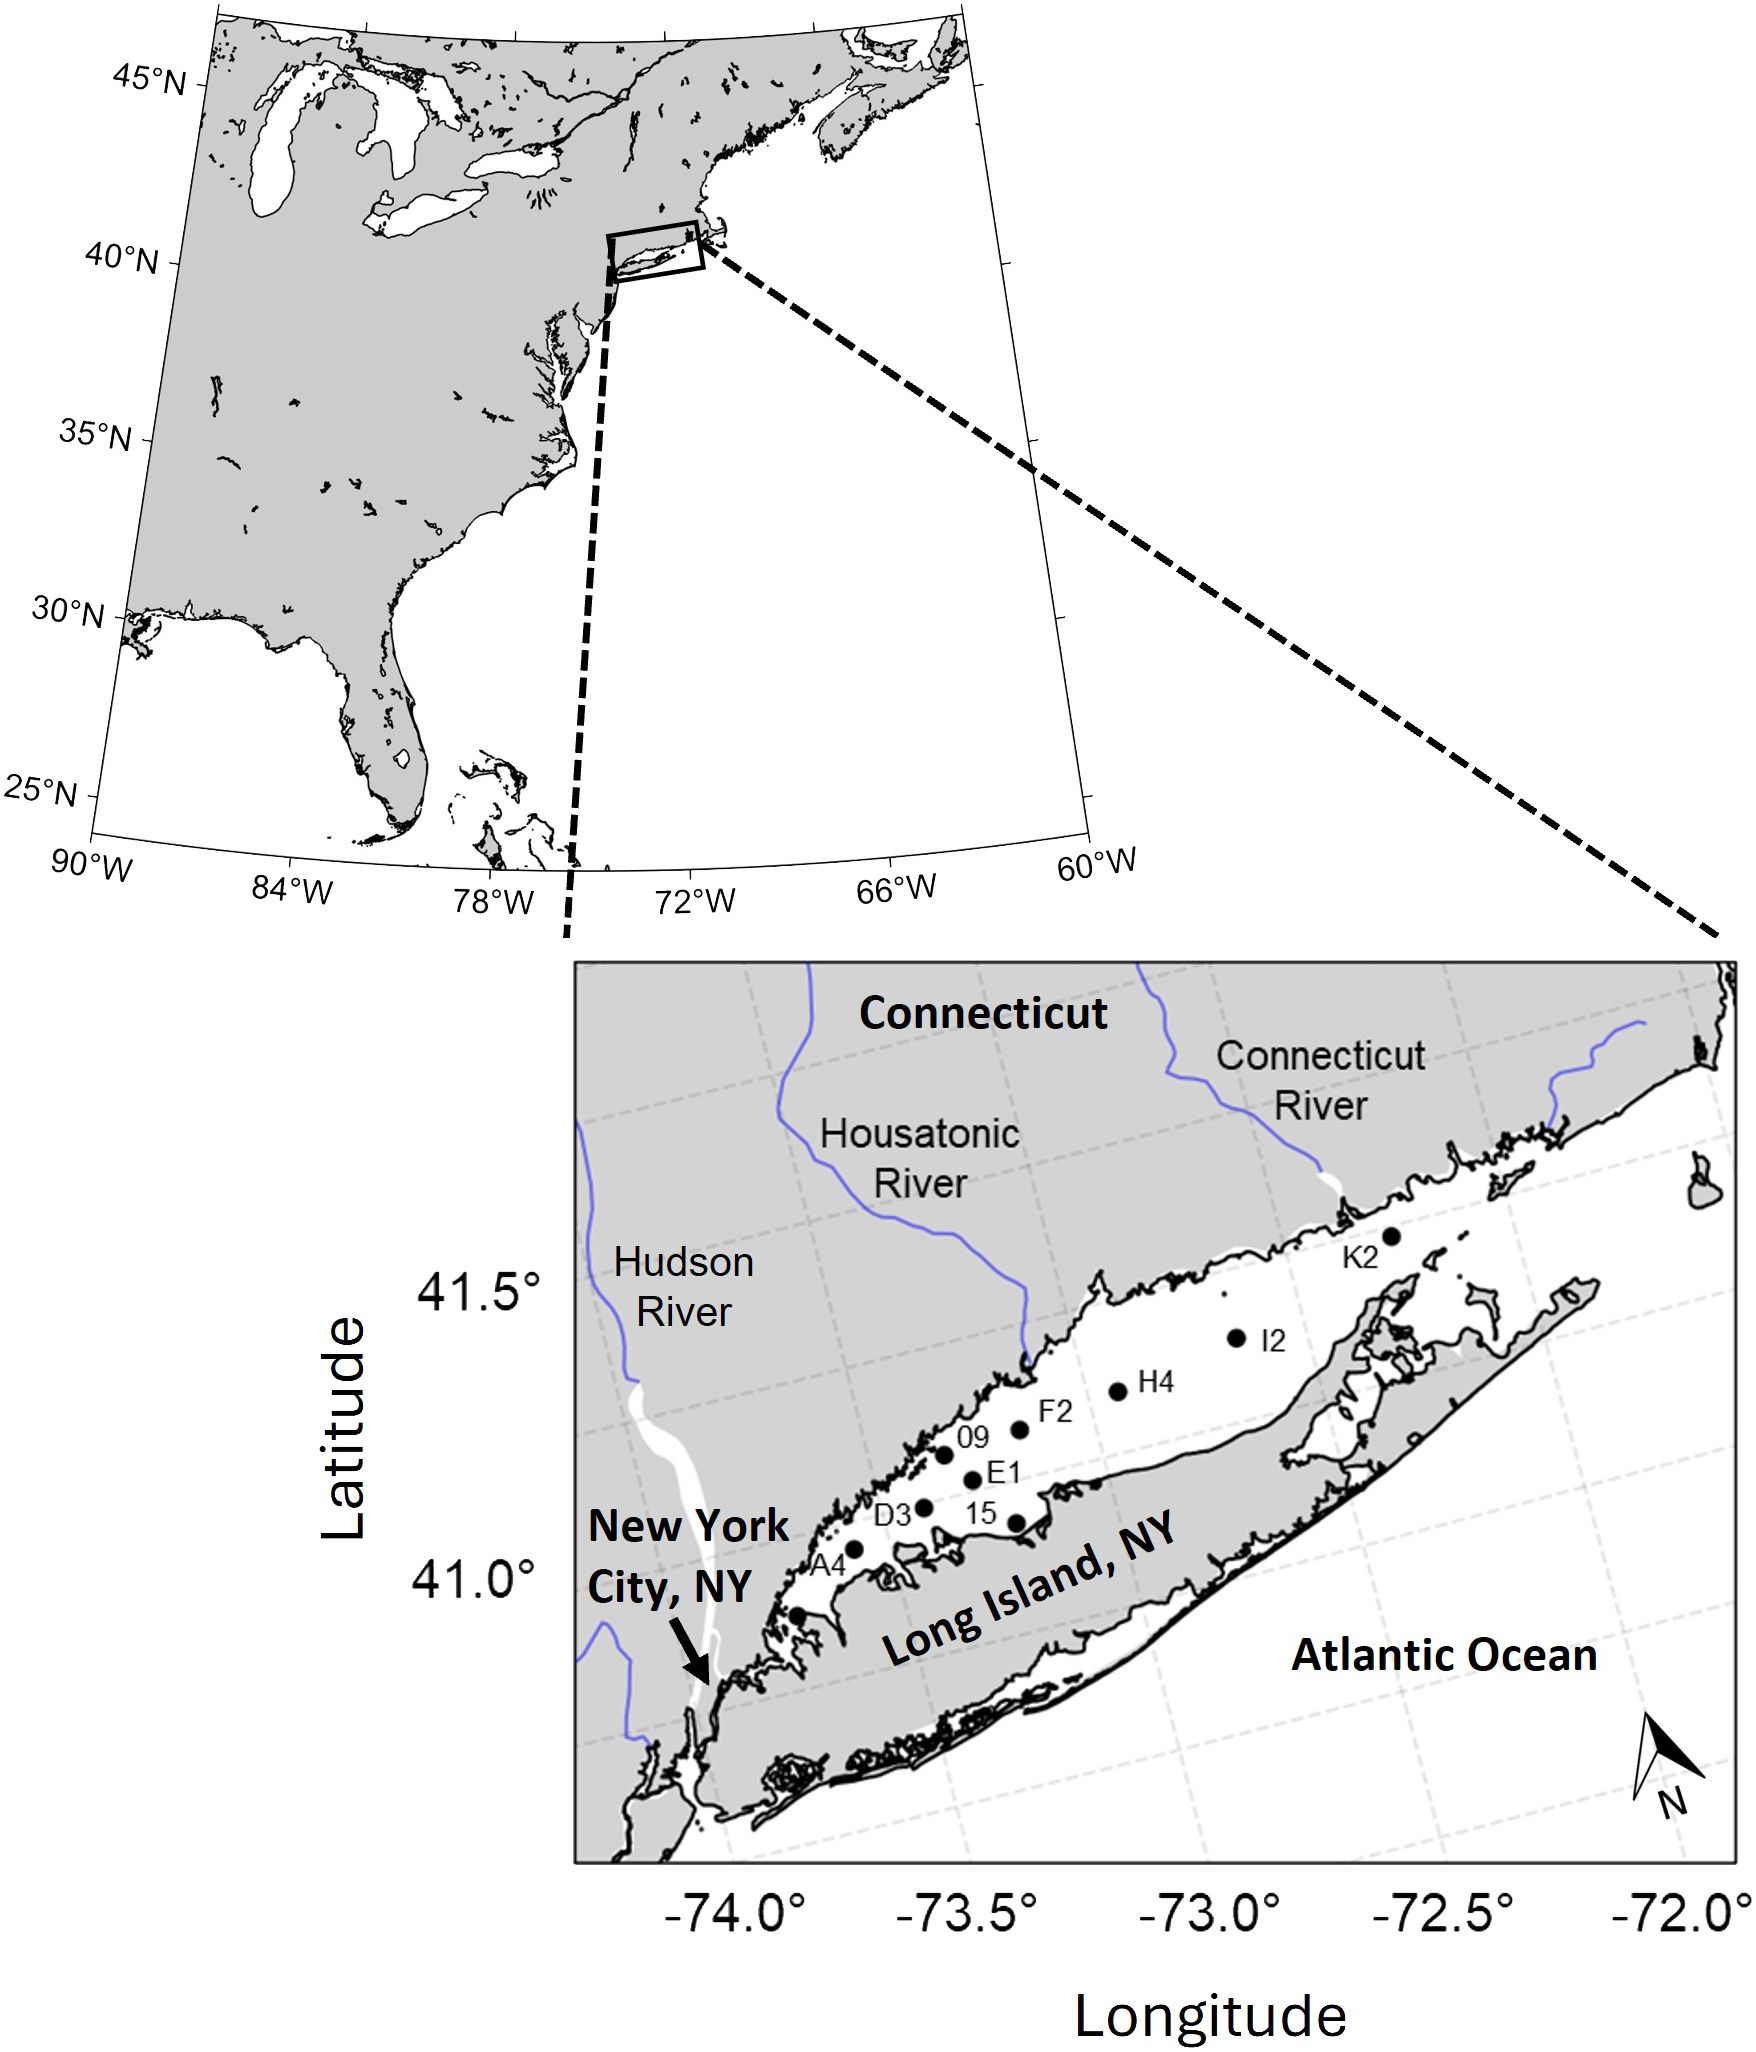
Figure 1 Location of Long Island Sound on the USA east coast and locations of surface and bottom water sample collection for the thirteen sampling events in this study. Station labels are consistent with those utilized by CT DEEP and LISS over thirty years of monitoring.
Carbonate system, nutrient, and hydrographic parameters were observed at ten stations across thirteen sampling events between March 2020 and August 2022 aboard the R/V John Dempsey (Supplementary Table S1). Each sampling event spanned at least three days, with one day each dedicated to the eastern, western, and central Sound, normally in that order. The sampling frequency is always greatest in the summer (typically biweekly) to allow CT DEEP to better assess patterns of hypoxia, with monthly sampling occurring year-round. Thus, a full seasonal comparison between spring, summer, and autumn was captured for 2020 and 2021.
2.2 Discrete water column samples
Discrete samples for TA and DIC were collected at each station in Figure 1 for both surface (2 m depth) and deep waters (~2 m above bottom). DIC samples were collected in triplicate from 10L Niskin bottles into 20 mL borosilicate vials with polytetrafluoroethylene (PTFE) and aluminum crimp tops and preserved with 10μL saturated mercuric chloride to a final concentration of 0.05% (v/v). DIC was measured using a Shimadzu TOC-L analyzer (USGS, 2019) calibrated using CO2 certified reference materials (CRMs) (Dickson et al., 2003) with an average precision of 4.76 μmol kg-1 (< 0.3%). TA samples were collected in 250 mL high density polyethylene (HDPE) bottles and preserved with 100 μL of saturated mercuric chloride. TA was analyzed using a Contros HYDROFIA TA Analyzer (Seelmann et al., 2019) calibrated with CO2 CRMs with an average precision of 2.5 μmol kg-1 (< 0.2%). Orthophosphate and silicate samples were collected and analyzed by CT DEEP following EPA methods 365.1 and 370.1, respectively (EPA, 1978, 1993).
2.3 Continuous surface water observations
Temperature (± 0.01°C), salinity (practical salinity scale, ± 0.1), dissolved oxygen (DO) (± 3.1 μmol kg-1), pH (NBS scale, ± 0.1), and partial pressure of CO2 (pCO2) (± 2-5 ppm) were measured across LIS surface waters. These parameters were measured continuously in seawater pumped onto the ship from a ~2-m depth intake. Temperature, salinity, and pH were measured once per minute using a YSI Exo2 multiparameter sonde. A three-point pH calibration (4.01, 7.00, and 10.01, all ± 0.01) and one-point salinity calibration (50 mS cm-1 conductivity, Ricca) were performed at 25°C before each cruise. pCO2 was measured once per second in the flow-through surface water using a Turner C-Sense pCO2 probe and then averaged across 5-minute intervals. The probe was calibrated annually by the manufacturer and displayed no drift over the study period.
2.4 Computations
Carbonate system computations including error propagations were carried out in Python using the PyCO2SYS package (Humphreys et al., 2022) with inputs of TA and DIC along with salinity, temperature, and pressure. The empirical constants used were those of Lueker et al. (2000), Dickson (1990), Dickson and Riley (1979), and Lee et al. (2010). For all cruises labelled “WQ” (water quality, Supplementary Table S1), nutrient data were available from CT DEEP and phosphate and silicate were included in calculations. However, nutrient observations were not available for “HY” (hypoxia, Supplementary Table S1) cruises, so concentrations were assumed to be 0. This assumption was made based on high rates of surface nutrient uptake in the summer, as well as the relatively low error associated with omitting the alkalinity contribution from nutrients (0.5 to 1.5 μmol kg-1), which was propagated into the calculations of the carbonate system.
Apparent oxygen utilization (AOU) was calculated in Python using the Gibbs Seawater package (McDougall and Barker, 2011). In-situ salinity, temperature, and depth data were used to calculate potential temperature, from which the oxygen solubility was calculated via the equations of Garcia and Gordon (1993).
3 Results
3.1 Precipitation and river discharge
The precipitation conditions in Connecticut, and more broadly the northeast US, are highly relevant to the hydrological dynamics of LIS, as > 85% of freshwater input to the estuary occurs from rivers traversing the state. Figure 2 shows the 2020 – 2022 monthly average discharge of the two major tributaries to LIS, the Housatonic River in the center/west (accounting for 10% of total freshwater input to LIS), and the Connecticut River in the east (accounting for 75% of total freshwater input to LIS, Gay et al., 2004). The monthly river discharge climatology shows that in summer 2021, the discharge of both rivers exceeded that of 2020 and 2022 by 3-4 times. This was reflected in the salinity of WLIS, as summertime (August) salinity was ~1 unit lower in 2021 than in 2020 and 2022 (Supplementary Figure 1).
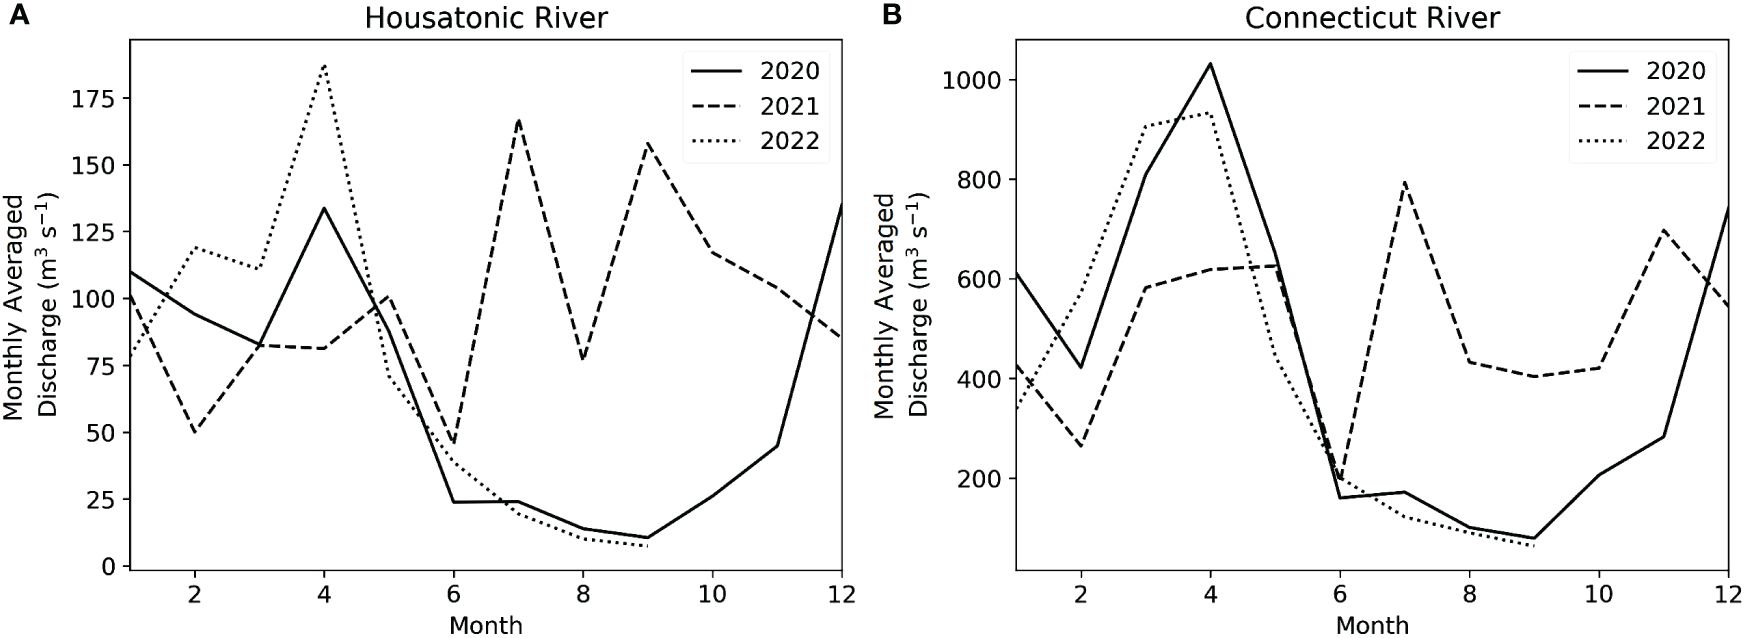
Figure 2 Monthly-averaged discharge for the (A) Housatonic and (B) Connecticut Rivers. The Housatonic River discharges into WLIS in Bridgeport, CT, and accounts for ~10% of freshwater input to LIS (Gay et al., 2004). Discharge data shown here are from Stevenson, CT, 30 km inland (USGS, 2022a). The Connecticut River discharges into ELIS in Old Lyme, CT, and accounts for ~75% of freshwater input to LIS (Gay et al., 2004). Discharge data shown here are from Thompsonville, CT, 100 km inland (USGS, 2022b). Note the different y-axis scales for the two subplots.
This study captured the contrast between two historic drought seasons (summer and fall of 2020 and 2022) and one high-precipitation season (summer 2021). In August and September 2020, up to 60% of the state of Connecticut experienced a standardized precipitation index (SPI) < -1.6, indicating extreme drought conditions relative to the climatological mean for the region (NIDIS, 2023). SPI remained < -0.5 for much of the state from July 2020 through April 2021. During May 2021 – February 2022, exceptionally wet conditions prevailed, with ~40% of Connecticut experiencing an SPI > 2 (NIDIS, 2023). Four tropical storm systems made landfall in Connecticut between July and September of 2021 (Elsa, Fred, Henri, and Ida), accounting for much of the excess rainfall. The wet conditions of 2021 were followed by an even more extreme drought in 2022, where from April to August 60% of the state had an SPI < -1.6, and 20% < -2.0 (NIDIS, 2023).
3.2 Water column carbonate chemistry
For all sampling events, TA was generally highest in ELIS at the estuary mouth and decreased westward to the estuary head (Supplementary Figure 2), consistent with salinity trends (p < 10-35, R2 = 0.59, n = 178, Figure 3A) and seawater exchange. Throughout the study period, surface and bottom water TA ranged from 1862 – 2113 and 1840 – 2133 μmol kg-1, respectively. For all three sampling years, the highest TA values tended to occur in the fall (late August – October). Summer and autumn TA values were lower in 2021 as compared to 2020 and 2022, especially in surface waters. The maximum surface TA value in August/September 2021 was 2017 μmol kg-1, as compared to 2070 and 2069 μmol kg-1 in 2020 and 2022, respectively. In eastern LIS (ELIS), the influence of increased Connecticut River discharge in September 2021 is clear, as the region near the river mouth was locally depleted in TA, with a value of ~1875 μmol kg-1 as compared to surrounding values 50-100 μmol kg-1 higher.
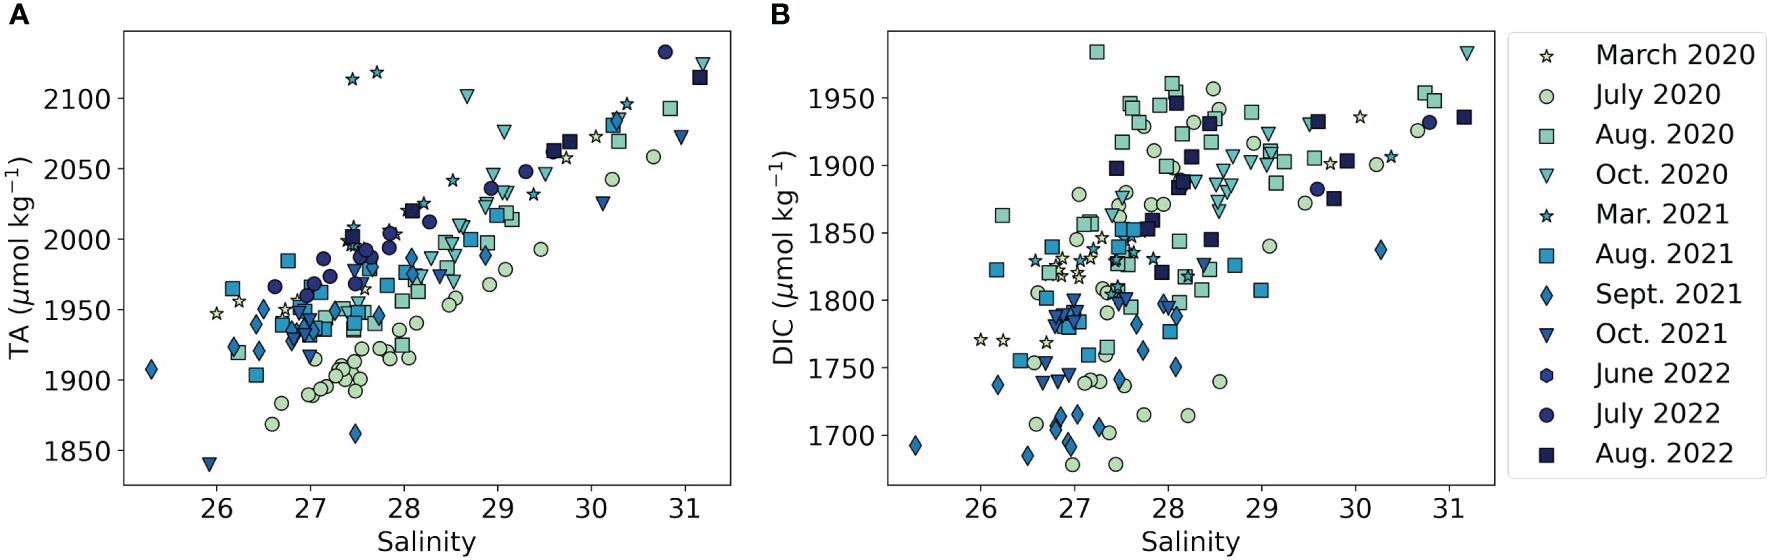
Figure 3 The relationship between salinity and (A) total alkalinity (R2 = 0.59, p < 10-35, n = 178) and (B) dissolved inorganic carbon (R2 = 0.38, p < 10-21, n = 200) across the study period. The marker color represents different sampling events, and marker shape represents the month of sampling. Note the different y-axis scales for each subplot.
Because DIC includes the concentration of CO2, it is more strongly affected by biological activity than TA. WLIS is highly productive in the summer, so DIC displayed more spatial and seasonal variation than TA, but still correlated strongly with salinity (p < 10-21, R2 = 0.38, n = 200, Figure 3B). During the study period, DIC in surface and bottom waters ranged from 1678 – 1908 and 1704 -1984 μmol kg-1, respectively, generally increasing with depth and towards the estuary mouth. The vertical gradient in DIC had a strong seasonal variation, with the largest gradient occurring in the stratified summer months and the smallest gradient in the fall (Supplementary Figure 3). In the summer, high productivity in the surface waters depressed DIC, while comparatively, DIC was elevated in deeper waters, consistent with intense stratification and subsurface respiration of organic matter. As with TA, the interannual variation of DIC was dominated by autumn minima in 2021 as compared to 2020 and 2022. In October 2020 and August 2022, surface DIC values were ~1850-1900 μmol kg-1. By contrast, in September and October of 2021, DIC was always less than 1800 μmol kg-1 and was as low as 1680 μmol kg-1 in WLIS.
Aragonite saturation state (Ωar) was calculated from TA and DIC measurements, yielding a mean propagated error of 0.04 units. Ωar is an important acidification metric to consider for calcifying organisms sensitive to carbonate ion concentrations (Waldbusser et al., 2015), though species-specific thresholds are not well-defined in this region. In general, Ωar < 1 (aragonite undersaturation) is considered deleterious to calcifying organisms, as aragonite dissolution is thermodynamically favored. However, Ωar < 1.5 or higher can still be a detrimental condition depending on the organism and its life stage (Ekstrom et al., 2015). The trend in Ωar (Supplementary Figure 4) closely followed that of DIC, with a strong summertime along-estuary gradient in surface waters. Ωar ranged from 0.87 – 3.01 and 0.59 – 2.77 in surface and bottom waters, respectively. Notably, the lowest Ωar values were observed during summer 2020, during which much of WLIS bottom waters were aragonite undersaturated for at least three sampling events spanning six weeks in July and August. Ωar was low, but exceeded 1, in WLIS during summer 2022. In summer 2021, a year with anomalously high precipitation rates, bottom water Ωar always exceeded 1.3. Despite lower summertime estuary-wide TA due to increased freshwater discharge, Ωar remained oversaturated in bottom waters due to concurrent low DIC, and thus a low ratio of DIC to TA.
Assuming that Ωar is primarily biologically mediated (via photosynthesis/respiration and calcification/dissolution), we expect a strong relationship with apparent oxygen utilization (AOU), especially during the stratified summer season. AOU describes the difference between the observed dissolved oxygen (DO) concentration and that at saturation. Positive and negative AOU values indicate DO under- and over-saturation, respectively. The use of AOU as a proxy for photosynthesis and respiration has the limitation that oxygen equilibrates rapidly in the surface mixed layer and can be advected from adjacent water parcels, so the AOU of a given water parcel does not solely reflect oxygen production or utilization in that location. However, AOU is still useful for a coarse estimate of biological oxygen consumption and production. Figure 4 shows the relationship between Ωar and AOU during this study period. While the two parameters showed strong correlation in 2020 (R2 = 0.70, p < 10-16, n = 68) and 2022 (R2 = 0.51, p < 0.001, n = 23), the relationship was less significant during 2021 (R2 = 0.07, p < 0.10, n = 48). Longer estuarine residence times enhance subsurface oxygen depletion and CO2 accumulation (e.g., Vlahos and Whitney, 2017; Zeldis et al., 2022), which likely explains the reduced correlation between AOU and Ωar during high-discharge conditions leading to shorter residence time. For the entire dataset, the relationship between Ωar and AOU was significant (R2 = 0.26, p < 10-9, n = 139).
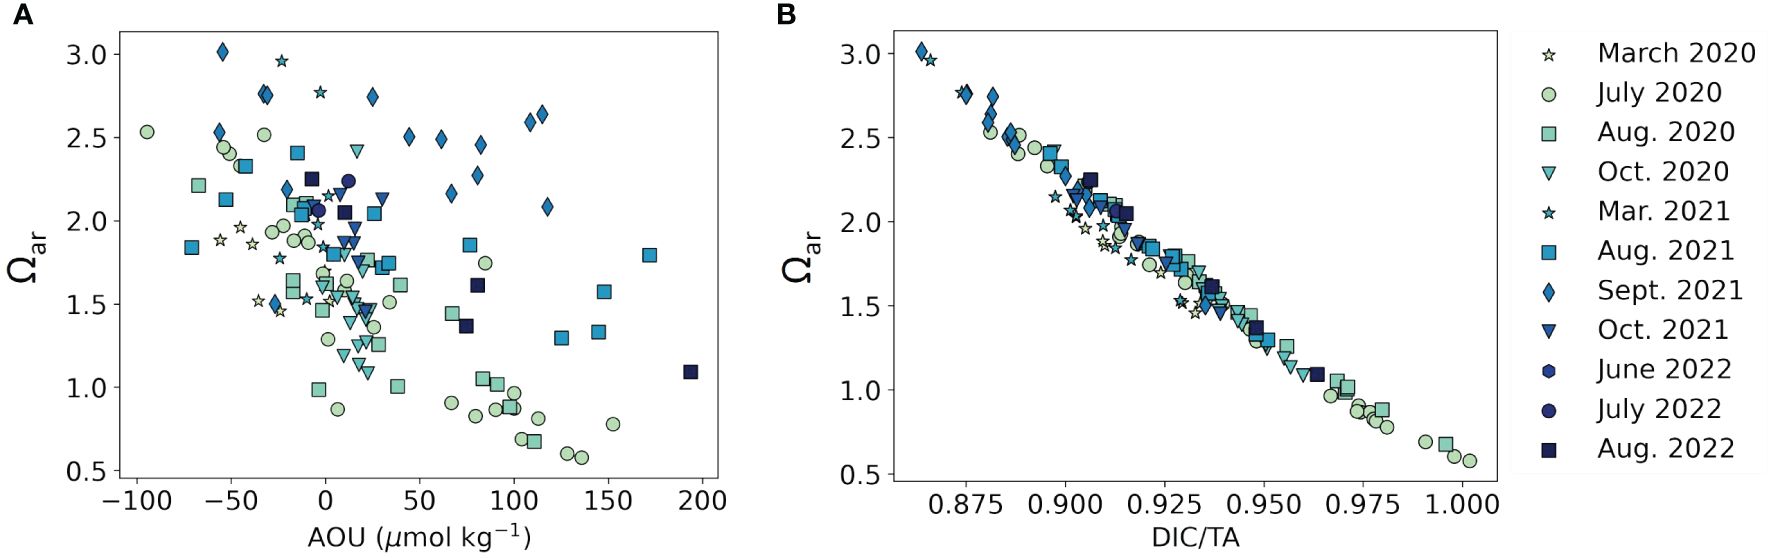
Figure 4 The relationship between aragonite saturation state (Ωar) calculated from TA and DIC and (A) apparent oxygen utilization (AOU) (R2 = 0.26, p < 10-9, n = 139), (B) DIC/TA (R2 = 0.98, p < 10-100, n = 139) from March 2020 – August 2022. Marker color represents different sampling events, and marker shape represents the month of sampling.
The ratio of DIC to TA (DIC/TA) is another proxy for acidification that is more straightforward and precise than Ωar, as it relies on simple division of two measured parameters rather than calculations using empirical constants. DIC consists of CO2, bicarbonate, and carbonate, while TA consists of carbonate (contributing twice as much to TA as to DIC), bicarbonate, and other proton acceptors. Thus, higher DIC/TA indicates a greater proportion of CO2 and thus more acidified waters, while lower DIC/TA indicates a more buffered water mass. For context, the seawater endmember of DIC/TA is ~0.87 (Cai et al., 2020). In this study, DIC/TA ranged from 0.86 (WLIS surface, September 2021) to 1.00 (ELIS bottom, July 2020). The highest DIC/TA values (most acidified) were generally observed during 2020 (0.88 – 1.00, median 0.94, n = 69) and the lowest values (least acidified) during 2021 (0.86 – 0.95, median 0.91, n = 48), with 2022 falling in the middle (0.90 – 0.96, median 0.92, n = 23), indicating that LIS was overall better buffered during the high-precipitation summer (2021) than in the drought summers (2020 and 2022). DIC/TA and Ωar were strongly negatively correlated for the entire study period (Figure 4B, R2 = 0.98, p < 10-100, n = 139).
3.3 Interactions with hypoxia
Hypoxia (defined as DO < 3 mg L-1 or ~94 μmol kg-1 in LIS) has decreased in duration and extent due to mandated reductions in nitrogen emissions to the estuary (Whitney and Vlahos, 2021; Long Island Sound Study, 2022). The hypoxic duration and extent in 2020 (43 d and 163 km2, respectively) were among the lowest observed in LIS since the implementation of the nitrogen TMDL in 2000. In 2021, hypoxic duration and extent were 47 d and 368 km2, respectively, while in 2022, hypoxic duration and extent were 57 d and 225 km2, respectively. The hypoxic area of LIS during all three years represented in this study was below the 539 km2 average for the entire time series from 1991-2021. Table 1 summarizes these trends.
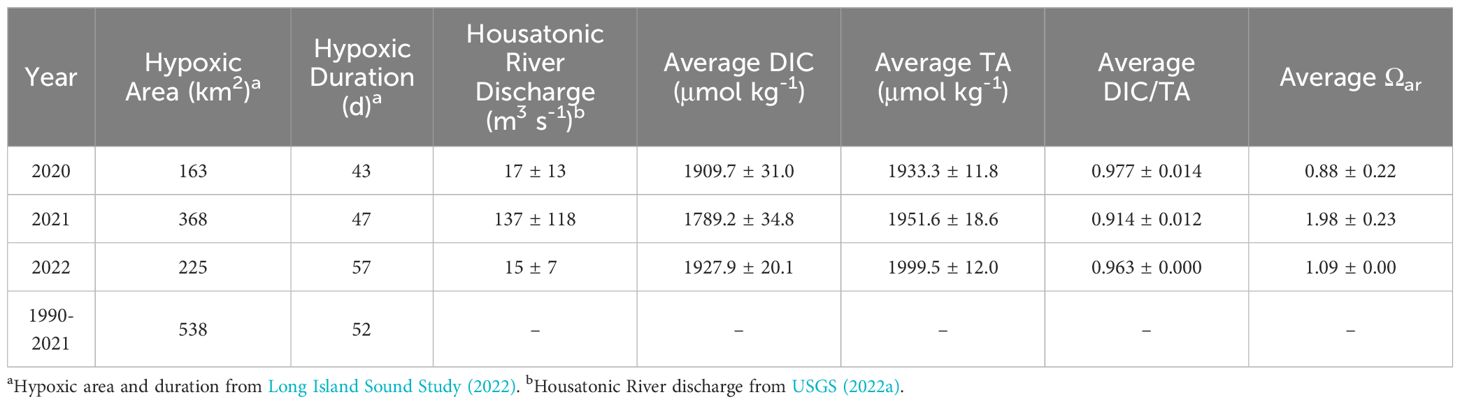
Table 1 Western LIS (west of longitude -73.0) summertime (July – September) average bottom water hypoxic area, Housatonic River discharge, DIC, TA, DIC/TA, and Ωar by year.
In many cases, estuarine eutrophication leads to concurrent low-DO and high-CO2 conditions (Cai et al., 2011; Wallace et al., 2014; Shen et al., 2022), though these conditions may be temporally and spatially decoupled (Shen et al., 2023). While the most intense hypoxia was consistently observed at WLIS station A4 in August for the three study years, the co-occurring acidification trends were more variable. In 2020, a drought summer, though TA and thus Ωar data were not available for bottom waters during August, the lowest DO observed (55.3 μmol L-1, station A4, WQAug20) was concurrent with a bottom-water DIC maximum (1984.2 μmol kg-1) and pHnbs minimum (7.6). In 2021, the high-precipitation summer, the lowest observed DO (58.1 μmol L-1, station A4, HYAug21) was similar to the concentration observed in 2020, but DIC was much lower (1839.7 μmol kg-1) while Ωar was 1.79, well above saturation conditions. Finally, in 2022, the lowest observed DO (44.7 μmol L-1, station A4, WQAug22) occurred with low Ωar (1.09) and elevated DIC (1946.2 μmol kg-1). Supplementary Figure 5 shows the cross-sectional distribution of DO for each sampling event. In summary, the co-occurrence of hypoxia and acidification was clear for times of drought in 2020 and 2022, but not for the summer with high precipitation (2021).
4 Discussion
4.1 Freshwater endmember variability
Though the spatial extent of this study captured both western and eastern LIS, this discussion primarily focuses on western LIS (WLIS), as that is the region where the most severe hypoxia and acidification have been observed.
Of the three study years, the carbonate system dynamics of 2020 and 2022 were comparable, while 2021 showed a divergent pattern. 2020 and 2022 were both drought years, with especially low freshwater discharge during the summer, while in 2021 there was increased freshwater input, primarily due to tropical storms. In some estuaries, lower river discharge is associated with reduced hypoxia, as reduced freshwater flow leads to less nutrient loading, lower primary productivity, and less organic material fueling microbial respiration (Zheng et al., 2016; Shen et al., 2022). By contrast, in LIS low-flow years have been shown to be net heterotrophic, as longer estuarine residence time leads to DO depletion, despite the reduced source of allochthonous organic material (Vlahos and Whitney, 2017). Despite the slightly greater hypoxic area observed in 2021 (368 km2) relative to 2020 and 2022 (163 and 225 km2, respectively), the entire study period had hypoxic conditions well below the mean area (538 km2) for the monitoring period 1991-2021 (see Table 1). However, the westernmost sampling station A4 still displayed hypoxic conditions in bottom waters for several weeks of monitoring during each sampling year. Thus, freshwater discharge conditions did not appear to substantially impact summertime hypoxia in LIS during the study period.
During the timing of minimum DO concentration (July-August), hypoxic conditions were relatively similar in the bottom waters of WLIS (Supplementary Figure 5) for all three years, but DIC was nearly 100 μmol kg-1 higher in the drought summers 2020 and 2022 as compared to the wet summer in 2021 (Table 1; Supplementary Figure 3). Ωar was also substantially higher in 2021 than in 2020 and 2022 (Table 1; Supplementary Figure 4). This indicates that the variation in freshwater discharge had more influence on bottom-water acidification than on hypoxia. We propose that these differences are due to differences in the chemistry of the freshwater endmember, variable proportions of fresh- and seawater endmembers, the differing equilibration times for oxygen and CO2, and variability in estuarine residence time.
DIC and TA data are available for freshwater endmembers in the Connecticut and Housatonic Rivers during 2020 and 2021 (McGuinness, 2022), overlapping with two of the three years in this study. These two rivers account on average for ~55 and 25% of the freshwater content in WLIS, respectively (Deignan-Schmidt and Whitney, 2018). The Housatonic River, which discharges near the eastern boundary of WLIS, has relatively higher TA (averaging 1578 ± 236 μmol L-1 during 2020-2021) than the Connecticut River, likely due to the presence of carbonate rock formations in the watershed (Robinson and Kapo, 2003). However, the main geologic formation of the Housatonic watershed is composed of slates and pelitic metasedimentary rocks. By contrast, the Connecticut River has relatively lower TA (averaging 531 ± 110 μmol L-1 during 2020-2021) as it primarily flows through granite and gneiss bedrocks, though there are some carbonate-containing formations in central Connecticut (Robinson and Kapo, 2003). WLIS may have a more substantial source of freshwater alkalinity, especially under high-flow conditions, as it contains a greater proportion of Housatonic River outflow than ELIS.
While river TA was variable among sampling events, there was no statistically significant relationship with discharge (Connecticut: R2 = 0.06, p = 0.52, n = 8, Housatonic: R2 = 0.05, p = 0.59, n = 8). However, river DIC was negatively correlated with discharge for 2020-2021 (Connecticut: R2 = 0.72, p = 0.004, n = 9, Housatonic: R2 = 0.64, p = 0.02, n = 8), and thus DIC/TA was also negatively correlated with discharge (Connecticut: R2 = 0.45, p = 0.07, n = 8, Housatonic: R2 = 0.81, p = 0.01, n = 6). River DIC likely decreased under elevated river discharge because of a shorter residence time for organic matter respiration and CO2 accumulation.
The increased buffering capacity of the Housatonic and Connecticut Rivers under high discharge conditions, as indicated by decreased DIC/TA, influenced the acid-base chemistry of WLIS during summer/fall 2021 (Figure 5). Though bottom-water TA was relatively consistent in WLIS during the study period, DIC and thus DIC/TA were much lower in 2021 than in 2020 and 2022. This explains the relatively higher Ωar (> 1.5) in WLIS bottom waters during peak hypoxia in 2021, relative to the undersaturated (Ωar < 1) and near saturated (Ωar < 1.1) conditions in the drought summers of 2020 and 2022, respectively. In 2012, Wallace et al. (2014) also showed summertime aragonite undersaturation in the bottom waters of WLIS co-occurring with hypoxic conditions. Hypoxic extent was relatively high (747 km2) in 2012 relative to the 1991-2021 average of 538 km2. 2012 was also a historic drought year in Connecticut, on par with the conditions of 2020 and 2022. Though river chemistry data is not available for the 2012 study, it is likely that low river discharge increased the DIC/TA value of the freshwater endmember, reducing the buffering capacity of WLIS. The increased water residence time associated with drought likely also contributed to the depletion of O2 and the accumulation of CO2. Our observations during a high-flow year (2021) indicate that the conditions leading to hypoxic conditions in LIS do not always simultaneously induce acidification. The buffering capacity of the incoming freshwater appears to play a role in mitigating or exacerbating summertime acidification.
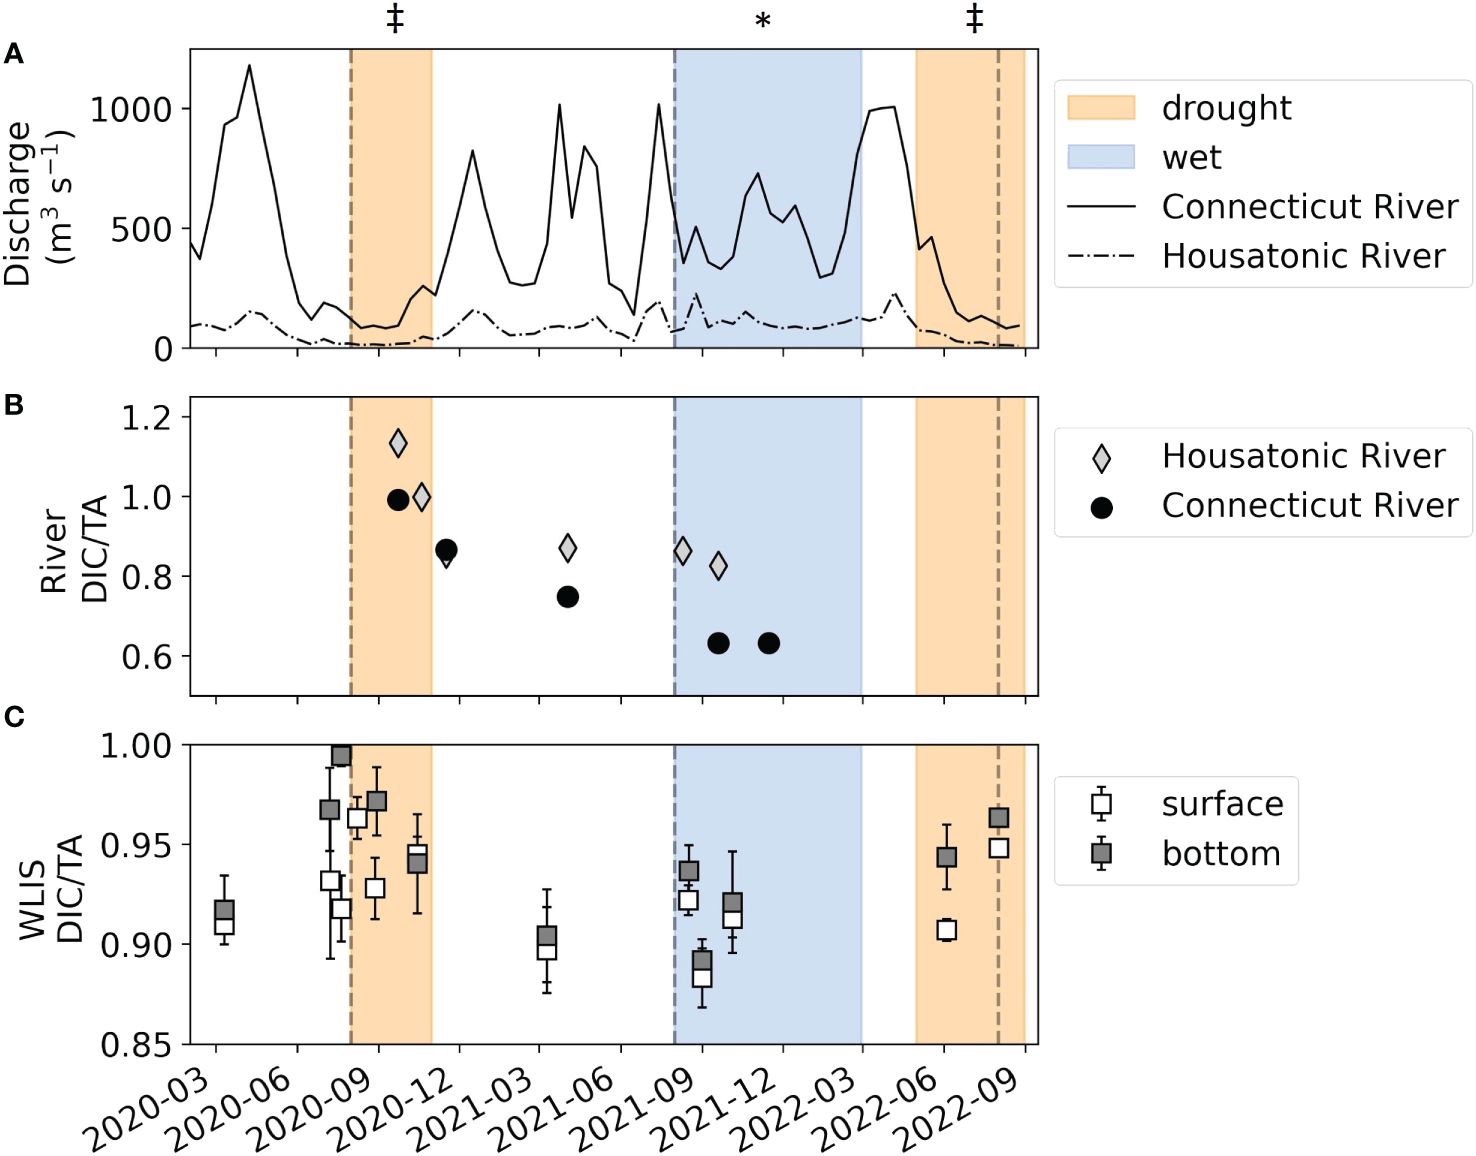
Figure 5 Time series of (A) Connecticut (solid line) and Housatonic (dash-dotted line) River discharge, (B) Connecticut (black circles) and Housatonic (gray diamonds) River DIC/TA ratios, and (C) area-averaged DIC/TA ratios for and WLIS surface (white squares) and bottom (gray squares) DIC/TA ratios during the study period. Here, E and WLIS are separated at the -73° meridian. Surface waters samples were collected ~2 m from the surface, while bottom water samples were collected ~2 m from the bottom, which is variable from ~15-45 m across LIS. The orange and blue shaded boxes indicate periods of drought (SPI < -1.6 for at least 50% of Connecticut land) and wet (SPI > 1.6 for at least 50% of Connecticut) conditions (NIDIS, 2023). For readers in greyscale, refer to the symbols above each banded section (‡ = drought, * = wet).
Though precipitation in the northeast US is expected to increase under climate change, most of this increase is predicted to occur in the winter and spring, with little change in the summer (USGCRP, 2018). By contrast, late summer and fall streamflow are expected to decrease due to a greater chance for summertime drought (Demaria et al., 2016). If these regional projections hold true for the LIS watershed, a decrease in alkalinity loading from the Housatonic River and an increase in freshwater DIC may exacerbate late summer acidification in WLIS.
4.2 Comparison to other major US estuaries
The unique hydrodynamics of LIS can complicate comparisons to other estuaries. While most US east coast estuaries have deltaic features, with the main freshwater source at the head mixing gradually with seawater towards the mouth, LIS was formed through the glacial deposition of Long Island, and the largest freshwater source (Connecticut River) is near its mouth. Despite these unique physical characteristics, valuable comparisons can be made regarding the summertime stratification, hypoxia, and acidification displayed in other major US estuaries including the Delaware Bay and Gulf of Mexico. These estuaries are discussed due to their data availability and comparable dynamics to LIS.
Delaware Bay is a drowned river valley or coastal plain estuary which is a tributary of the mid-Atlantic Bight and receives its largest freshwater input from the Delaware River at the estuary head. Delaware Bay has a similar seasonal weather pattern as LIS, and the chemistry of both the fresh- and seawater endmembers are relatively similar, though TA is higher in the Housatonic River (1578 ± 236 μmol kg-1) than in the Delaware River (~750-1000 μmol kg-1, Joesoef et al., 2017). An analysis of the relationship between seasonal discharge and the resulting acidification of Delaware Bay showed that high discharge decreased both DIC and TA and increased the DIC/TA ratio (Joesoef et al., 2017). This directly contrasts with observations in LIS, wherein the DIC/TA ratio was lower under high-discharge conditions due to a decrease in DIC, but no significant change in TA. Joesoef et al. (2017) suggested that DIC/TA increased under high-flow conditions in Delaware Bay because of enhanced uptake of soil organic matter and reduced CO2 outgassing. This contrast points to differing hydrodynamic and biogeochemical processes in LIS than those observed for Delaware Bay, which should be investigated in a pan-watershed approach to further understanding of LIS acidification dynamics.
The Louisiana Shelf of the Gulf of Mexico undergoes seasonal hypoxia due to agricultural nutrient pollution in the Mississippi River watershed (Rabalais and Turner, 2019). While subsurface acidification is prevalent in these coastal waters (Wang et al., 2020), the high alkalinity of the Mississippi River (~2400 μmol kg-1, Savoie et al., 2022) provides resilience against acidification. Despite similar eutrophic and low-oxygen conditions in the Gulf of Mexico as in LIS, the associated changes to pH and Ωar are less dramatic than in LIS due to alkaline river water input and warmer waters that hold less CO2 (Cai et al., 2020). Due to the high alkalinity of the Mississippi River, Savoie et al. (2022) observed that under high-flow conditions (opening of a spillway), surface water TA and Ωar increased in the Mississippi Sound, while subsurface Ωar decreased in association with stratification and hypoxia. In our observations in WLIS associated with increased Housatonic River discharge, we observed similar surface water dynamics. However, TA and Ωar were higher throughout the water column in WLIS. This divergence may be attributed to the greater depth of LIS (~40m compared to 4m in the Mississippi Sound) and its partially well-mixed characteristics, especially during the multiple storm events of summer 2021 which brought both increased precipitation and winds.
Comparisons of LIS to Delaware Bay and the Gulf of Mexico provide context to inform future studies, despite clear differences between the estuaries. For example, the decrease in bottom water DIC/TA under conditions of high freshwater input appears unique to western LIS among these estuaries.
4.3 Conclusions and recommendations for future work
In this study, we demonstrated seasonal and interannual variations in carbonate chemistry dynamics through observations of TA and DIC across LIS from 2020-2022 on monthly to seasonal intervals. Both TA and DIC were highly correlated to salinity and increased from the head to the mouth of LIS. Seasonal trends were dependent on river discharge conditions. Generally, TA was highest in the fall and winter and decreased to a minimum during spring and early summer. DIC was high and well-mixed during winter but had a strong vertical gradient in the summer due to surface productivity and subsurface respiration.
The sampling frequency employed here captured the contrast between two drought years with low river discharge (2020 and 2022) and one year with anomalously high precipitation and river discharge (2021). While late summer hypoxia dynamics in WLIS were relatively similar among all three sampling years, coincident acidification was greatest under low-flow conditions. During high-flow conditions, the DIC/TA ratio of the Housatonic River was lower, estuarine residence time decreased, and WLIS was better buffered against pH and Ωar decreases related to microbial respiration.
Late summer and autumn river discharge in the northeast US is expected to decrease in the coming decades, which may decrease the summertime buffering capacity of WLIS and increase estuarine residence time, leaving the estuary more vulnerable to acidification. It is unclear why a higher river discharge rate decreased riverine DIC but not TA. This motivates more detailed studies of the carbonate chemistry of the open LIS and its freshwater endmembers in relation to hypoxia dynamics as the physical and biological dynamics of the estuary change with time.
Data availability statement
The raw data supporting the conclusions of this article will be made available by the authors, without undue reservation.
Author contributions
LB: Conceptualization, Data curation, Formal analysis, Investigation, Methodology, Validation, Visualization, Writing – original draft, Writing – review & editing. PV: Conceptualization, Funding acquisition, Project administration, Resources, Supervision, Writing – review & editing. MM: Data curation, Investigation, Methodology, Writing – review & editing. MW: Conceptualization, Funding acquisition, Project administration, Resources, Supervision, Writing – review & editing. JV: Conceptualization, Funding acquisition, Project administration, Resources, Supervision, Writing – review & editing.
Funding
The author(s) declare financial support was received for the research, authorship, and/or publication of this article. This work was supported by EPA-LISS grant LISS01719 (PV, JV, and MW). The first author LB was also supported by NSF Grants #2049991 and 2227313 (PV) and the University of Connecticut Marine Sciences Department.
Acknowledgments
The authors would like to express immense gratitude to the CT-DEEP water quality crew: Matthew Lyman, Katie O’Brien-Clayton, Tommy Seda, and seasonal employees for collecting samples during COVID-restricted surveys and for support during surveys that the authors attended. We also thank Dr. Claudia Koerting of the UConn SMALER facility for assistance with analyzing nutrient and DIC samples.
Conflict of interest
The authors declare that the research was conducted in the absence of any commercial or financial relationships that could be construed as a potential conflict of interest.
Publisher’s note
All claims expressed in this article are solely those of the authors and do not necessarily represent those of their affiliated organizations, or those of the publisher, the editors and the reviewers. Any product that may be evaluated in this article, or claim that may be made by its manufacturer, is not guaranteed or endorsed by the publisher.
Supplementary material
The Supplementary Material for this article can be found online at: https://www.frontiersin.org/articles/10.3389/fmars.2024.1398087/full#supplementary-material
References
Anderson T. H., Taylor G. T. (2001). Nutrient pulses, plankton blooms, and seasonal hypoxia in western Long Island Sound. Estuaries 24, 228–243. doi: 10.2307/1352947
Brodeur J. R., Chen B., Su J., Xu Y. Y., Hussain N., Scaboo K. M., et al. (2019). Chesapeake Bay inorganic carbon: Spatial distribution and seasonal variability. Front. Mar. Sci. 6. doi: 10.3389/fmars.2019.00099
Cai W.-J., Hu X., Huang W. J., Murrell M. C., Lehrter J. C., Lohrenz S. E., et al. (2011). Acidification of subsurface coastal waters enhanced by eutrophication. Nat. Geosci. 4, 766–771. doi: 10.1038/ngeo1297
Cai W.-J., Xu Y.-Y., Feely R. A., Wanninkhof R., Jonsson B., Alin S. R., et al. (2020). Controls on surface water carbonate chemistry along North American ocean margins. Nat. Commun. 11, 2691. doi: 10.1038/s41467-020-16530-z
Deignan-Schmidt S. R., Whitney M. M. (2018). A model study on the summertime distribution of river waters in Long Island Sound. Estuar. Coasts 41, 1002–1020. doi: 10.1007/s12237-017-0348-5
Demaria E. M., Palmer R. N., Roundy J. K. (2016). Regional climate change projections of streamflow characteristics in the Northeast and Midwest U.S. J.Hydrol. Reg. Stud. 5, 309–323. doi: 10.1016/j.ejrh.2015.11.007
Dickson A. G. (1990). Standard potential of the reaction: AgCl(s) + ½ H2 (g) = Ag(s) + HCl (aq) and the standard acidity constant of the ion HSO4- in synthetic seawater from 273.15 to 318.15 K. J. Chem. Thermodyn. 22, 113–127. doi: 10.1016/0021-9614(90)90074-Z
Dickson A. G., Afghan J. D., Anderson G. C. (2003). Reference materials for oceanic CO2 analysis: a method for the certification of total alkalinity. Mar. Chem. 80, 185–197. doi: 10.1016/S0304-4203(02)00133-0
Dickson A. G., Riley J. P. (1979). The estimation of acid dissociation constants in seawater media from potentiometric titrations with strong base: I. The ionic product of water-KW. Mar. Chem. 7, 89–99. doi: 10.1016/0304-4203(79)90002-1
Dickson A. G., Sabine C. L., Christian J. R. Eds. (2007). Guide to best practices for ocean CO2 measurements. PICES Special Publication 3, 191 pp.
Doney S. C., Fabry V. J., Feely R. A., Kleypas J. A. (2009). Ocean acidification: The other CO2 problem. Annu. Rev. Mar. Sci. 1, 169–192. doi: 10.1146/annurev.marine.010908.163834
Duarte C. M., Hendriks I. E., Moore T. S., Olsen Y. S., Steckbauer A., Ramajo L., et al. (2013). Is ocean acidification an open-ocean syndrome? Understanding anthropogenic impacts on seawater pH. Estuaries Coast. 36, 221–236. doi: 10.1007/s12237-013-9594-3
Duvall M. S., Hagy J. D. III, Ammerman J. W., Tedesco M. A. (2023). High-frequency dissolved oxygen dynamics in an urban estuary, the Long Island Sound. Estuaries Coast 47, 415–430. doi: 10.1007/s12237-023-01278-8
Ekstrom J. A., Suatoni L., Cooley S. R., Pendleton L. H., Waldbusser G. G., Cinner J. E., et al. (2015). Vulnerability and adaptation of US shellfisheries to ocean acidification. Nat. Clim. Change 5, 207–214. doi: 10.1038/nclimate2508
EPA Method 365.1 (1993). Determination of Phosphorus by Semi-Automated Colorimetry Revision 2.0 (Cincinnati, Ohio: Environmental Monitoring Systems Laboratory, Office of Research and Development, U.S. Environmental Protection Agency).
EPA Method 370.1 (1978). Silica, Dissolved (Colorimetric) (Cincinnati, Ohio: Environmental Monitoring Systems Laboratory, Microbial and U.S. Environmental Protection Agency).
Feely R. A., Doney S. C., Cooley S. R. (2009). Ocean acidification: Present conditions and future changes in a high-CO2 world. Oceanography 22, 36–47. doi: 10.5670/oceanog.2009.95
Friedlingstein P., O’Sullivan M., Jones M. W., Andrew R. M., Gregor L., Hauck J., et al. (2022). Global carbon budget 2022. Earth Syst. Sci. Data 14, 4811–4900. doi: 10.5194/essd-14-4811-2022
Garcia H. E., Gordon L. I. (1993). Erratum: Oxygen solubility in seawater: Better fitting equations. Limnol. Oceanogr. 38, 656. doi: 10.4319/lo.1992.37.6.1307
Gay P. S., O’Donnell J., Edwards C. A. (2004). Exchange between Long Island Sound and adjacent waters. J. Geophys. Res. 109, C06017. doi: 10.1029/2004JC002319
Gobler C. J., Baumann H. (2016). Hypoxia and acidification in ocean ecosystems: coupled dynamics and effects on marine life. Biol. Lett. 12, 20150976. doi: 10.1098/rsbl.2015.0976
Goebel N. L., Kremer J. N., Edwards C. A. (2006). Primary production in long island sound. Estuaries Coast. 29, 232–245. doi: 10.1007/BF02781992
Humphreys M. P., Lewis E. R., Sharp J. D., Pierrot D. (2022). PyCO2SYS v1.8: marine carbonate system calculations in Python. Geosci. Model. Dev. 15, 15–43. doi: 10.5194/gmd-15-15-2022
Joesoef A., Kirchman D. L., Sommerfield C. K., Cai W.-J. (2017). Seasonal variability of the inorganic carbon system in a large coastal plain estuary. Biogeosciences 14, 4949–4963. doi: 10.5194/bg-14-4949-2017
Laurent A., Fennel K., Cai W.-J., Huang W.-J., Barbero L., Wanninkhof R. (2017). Eutrophication-induced acidification of coastal waters in the northern Gulf of Mexico: Insights into origin and processes from a coupled physical-biogeochemical model. Geophys. Res. Lett. 44, 946–956. doi: 10.1002/2016GL071881
Lee K., Kim T. W., Byrne R. H., Millero F. J., Feely R. A., Liu Y. M. (2010). The universal ratio of boron to chlorinity for the North Pacific and North Atlantic oceans. Geochim. Cosmochim. Ac. 74, 1801–1811. doi: 10.1016/j.gca.2009.12.027
Long Island Sound Study (2022). 2021 Long Island Sound Hypoxia Season Review. Available online at: https://portal.ct.gov/-/media/DEEP/water/lis_water_quality/monitoring/2021/2021-Combined-Report_final.pdf.
Lueker T. J., Dickson A. G., Keeling C. D. (2000). Ocean pCO2 calculated from dissolved inorganic carbon, alkalinity, and equations for K1 and K2: validation based on laboratory measurements of CO2 in gas and seawater at equilibrium. Mar. Chem. 70, 105–119. doi: 10.1016/S0304-4203(00)00022-0
McDougall T. J., Barker P. M. (2011). Getting started with TEOS-10 and the Gibbs Seawater (GSW) Oceanographic Toolbox. 28pp. SCOR/IAPSO WG127, ISBN 978-0-646-55621-5.
McGuinness M. (2022). Examination of controlling parameters for total alkalinity in Long Island Sound rivers (Master’s Thesis). University of Connecticut, Storrs, CT, USA.
McLaughlin K., Nezlin N. P., Weisberg S. B., Dickson A. G., Booth J. A., Cash C. L., et al. (2017). An evaluation of potentiometric pH sensors in coastal monitoring applications. Limnol. Oceanogr.: Methods 15, 679–689. doi: 10.1002/lom3.10191
New York State Department of Environmental Conservation, Connecticut Department of Environmental Protection (2000). Total Maximum Daily Load Analysis to Achieve Water Quality Standards for Dissolved Oxygen in Long Island Sound. Available online at: https://longislandsoundstudy.net/wp-content/uploads/2010/03/Tmdl.pdf.
NOAA National Integrated Drought Information System (2023). Connecticut. Available online at: https://www.drought.gov/states/connecticut (Accessed 23 Oct. 2023).
O’Donnell J., Wilson R. E., Lwiza K., Whitney M. M., Bohlen W. F., Codiga D., et al. (2014). “The physical oceanography of Long Island Sound,” in Latimer J. S., Tedesco M. A., Swanson R. L., Yarish C., Stacey P. E., et al eds. Long Island Sound: Prospects for the Urban Sea. Springer New York, New York, NY, pp. 125–167. doi: 10.1007/978-1-4614-6126-5_3
Orr J. C. (2011). “Recent and future changes in ocean carbonate chemistry,” in Ocean Acidification. Eds. Gattuso J.-P., Hansson L. (Oxford: Oxford Academic). doi: 10.1093/oso/9780199591091.003.0008
Rabalais N. N., Turner R. E. (2019). Gulf of Mexico hypoxia: Past, present, and future. L&O Bull. 28, 117–124. doi: 10.1002/lob.10351
Robinson G. R. Jr., Kapo K. E. (2003). Generalized lithology and lithogeochemical character of near-surface bedrock in the New England region (United States Geological Survey Digital Open-file Report 03-225). doi: 10.3133/ofr03225
Savoie A. M., Moody A., Gilbert M., Dillon K. S., Howden S. D., Shiller A. M., et al. (2022). Impact of local rivers on coastal acidification. Limnol. Oceanogr. 67 (12), 2779–2795. doi: 10.1002/lno.12237
Seelmann K., Aβmann S., Kortzinger A. (2019). Characterization of a novel autonomous analyzer for seawater total alkalinity: Results from laboratory and field tests. Limnol. Oceanogr. Methods 17, 515–532. doi: 10.1002/lom3.10329
Shen X., Cai Y., Su M., Wan H., Shen Y., Yang Z. (2022). High discharge intensified low net ecosystem productivity, hypoxia, and acidification at three outlets of the Pearl River Estuary, China. Water Res. 214, 118171. doi: 10.1016/j.watres.2022.118171
Shen C., Testa J. M., Herrmann M., Najjar R. G. (2023). Decoupling of estuarine hypoxia and acidification as revealed by historical water quality data. Environ. Sci. Technol. 57, 780–789. doi: 10.1021/acs.est.2c05949
U.S. Geological Survey (2019). New instrument validation of Shimadzu TOC-L carbon analyzer using acidification with NDIR method for analysis of dissolved inorganic carbon (DIC) in water samples. National Water Quality Laboratory Technical Memorandum 2019.02. 17pp. https://d9-wret.s3.us-west-2.amazonaws.com/assets/palladium/production/s3fs-public/media/files/DIC-TechMemo-508.pdf.
USGCRP (2018). Impacts, Risks, and Adaptation in the United States: Fourth National Climate Assessment. Volume II. Reidmiller D. R., Avery C. W., Easterling D. R., Kunkel K. E., Lewis K. L. M., Maycock T. K., et al(eds.)]. U.S. Global Change Research Program, Washington, DC, USA, 1515 pp. doi: 10.7930/NCA4.2018
U.S. Geological Survey (2022a). National Water Information System data available on the World Wide Web (USGS Water Data for the Nation). Available online at: https://waterdata.usgs.gov/nwis/uv?site_no=01200500 (Accessed 20 Jan. 2022).
U.S. Geological Survey (2022b). National Water Information System data available on the World Wide Web (USGS Water Data for the Nation). Available online at: https://waterdata.usgs.gov/ct/nwis/uv/?site_no=01184000 (Accessed 20 Jan. 2022).
Vaudrey J. (2017). New York City’s impact on Long Island Sound water quality technical report. 30p. Available at: https://vaudrey.lab.uconn.edu/wp-content/uploads/sites/1663/2018/07/2017-11-16-Vaudrey-NYC-N.pdf.
Vlahos P., Whitney M. M. (2017). Organic carbon patterns and budgets in the Long Island Sound estuary. Limn. Oceanogr. 62, 546–557. doi: 10.1002/lno.10638
Waldbusser G. G., Hales B., Langdon C. J., Haley B. A., Schrader P., Brunner E. L., et al. (2015). Saturation-state sensitivity of marine bivalve larvae to ocean acidification. Nat. Clim. Change 5, 273–280. doi: 10.1038/nclimate2479
Wallace R. B., Baumann H., Grear J. S., Aller R. C., Gobler C. J. (2014). Coastal ocean acidification: The other eutrophication problem. Estuar. Coast. Shelf Sci. 148, 1–13. doi: 10.1016/j.ecss.2014.05.027
Wang H., Lehrter J., Maiti K., Fennel K., Laurent A., Rabalais N. (2020). Benthic respiration in hypoxic waters enhances bottom water acidification in the northern Gulf of Mexico. J. Geophys. Res. Oceans 125, e2020JC016152. doi: 10.1029/2020JC016152
Whitney M. M., Ullman D. S., Codiga D. L. (2016). Subtidal exchange in eastern long island sound. J. Phys. Oceanogr. 46, 2351–2371. doi: 10.1175/JPO-D-15-0107.1
Whitney M. M., Vlahos P. (2021). Reducing hypoxia in an urban estuary despite climate warming. Environ. Sci. Tech. 55, 941–951. doi: 10.1021/acs.est.0c03964
Wilson R. E., Swanson R. L., Crowley H. A. (2008). Perspectives on long-term variations in hypoxic conditions in western Long Island Sound. J. Geophys. Res. Oceans 113, C12. doi: 10.1029/2007JC004693
Xiong T.-Q., Wei Q.-S., Zhai W.-D., Li C.-L., Wang S.-Y., Zhang Y.-X., et al. (2020). Comparing subsurface seasonal deoxygenation and acidification in the Yellow Sea and Northern East China Sea along the north-to-south latitude gradient. Front. Mar. Sci. 7. doi: 10.3389/fmars.2020.00686
Zeldis J. R., Currie K. I., Graham S. L., Gall M. P. (2022). Attributing controlling factors of acidification and hypoxia in a deep, nutrient-enriched estuarine embayment. Front. Mar. Sci. 8. doi: 10.3389/fmars.2021.803439+
Keywords: eutrophication, acidification, river chemistry, estuarine chemistry, hypoxia
Citation: Barrett LJ, Vlahos P, McGuinness MA, Whitney MM and Vaudrey JMP (2024) Droughts and deluges: changes in river discharge and the carbonate chemistry of an urbanized temperate estuary. Front. Mar. Sci. 11:1398087. doi: 10.3389/fmars.2024.1398087
Received: 08 March 2024; Accepted: 20 June 2024;
Published: 05 July 2024.
Edited by:
Michele Giani, National Institute of Oceanography and Applied Geophysics, ItalyReviewed by:
Solomon Dan, Beibu Gulf University, ChinaChristopher Knightes, United States Environmental Protection Agency (EPA), United States
Copyright © 2024 Barrett, Vlahos, McGuinness, Whitney and Vaudrey. This is an open-access article distributed under the terms of the Creative Commons Attribution License (CC BY). The use, distribution or reproduction in other forums is permitted, provided the original author(s) and the copyright owner(s) are credited and that the original publication in this journal is cited, in accordance with accepted academic practice. No use, distribution or reproduction is permitted which does not comply with these terms.
*Correspondence: Lauren J. Barrett, bGF1cmVuLmpvLmJhcnJldHRAZ21haWwuY29t; Penny Vlahos, cGVubnkudmxhaG9zQHVjb25uLmVkdQ==