
95% of researchers rate our articles as excellent or good
Learn more about the work of our research integrity team to safeguard the quality of each article we publish.
Find out more
ORIGINAL RESEARCH article
Front. Mar. Sci. , 04 June 2024
Sec. Marine Molecular Biology and Ecology
Volume 11 - 2024 | https://doi.org/10.3389/fmars.2024.1396016
 Monal M. Lal1,2*†
 Deo A. S. Macahig3Marie A. Juinio-Meñez3Jon P. Altamirano4
 Roselyn Noran-Baylon4Margarita de la Torre-de la Cruz5
 Janine L. Villamor5Jonh Rey L. Gacura5Wilfredo H. Uy6Hanzel Mira-Honghong6
 Paul C. Southgate1,2
 Rachel Ravago-Gotanco3†
The sandfish Holothuria (Metriatyla) scabra, is a high-value tropical sea cucumber harvested from wild stocks for over four centuries in multi-species fisheries across its Indo-Pacific distribution, for the global bêche-de-mer (BDM) trade. Within Southeast Asia, the Philippines is an important centre of the BDM trade, however overharvesting and largely open fishery management have resulted in declining catch volumes. Sandfish mariculture has been developed to supplement BDM supply and assist restocking efforts; however, it is heavily reliant on wild populations for broodstock supply. Consequently, to inform fishery, mariculture, germplasm and translocation management policies for both wild and captive resources, a high-resolution genomic audit of 16 wild sandfish populations was conducted, employing a proven genotyping-by-sequencing approach for this species (DArTseq). Genomic data (8,266 selectively-neutral and 117 putatively-adaptive SNPs) were used to assess fine-scale genetic structure, diversity, relatedness, population connectivity and local adaptation at both broad (biogeographic region) and local (within-biogeographic region) scales. An independent hydrodynamic particle dispersal model was also used to assess population connectivity. The overall pattern of population differentiation at the country level for H. scabra in the Philippines is complex, with nine genetic stocks and respective management units delineated across 5 biogeographic regions: (1) Celebes Sea, (2) North and (3) South Philippine Seas, (4) South China and Internal Seas and (5) Sulu Sea. Genetic connectivity is highest within proximate marine biogeographic regions (mean Fst=0.016), with greater separation evident between geographically distant sites (Fst range=0.041–0.045). Signatures of local adaptation were detected among six biogeographic regions, with genetic bottlenecks at 5 sites, particularly within historically heavily-exploited locations in the western and central Philippines. Genetic structure is influenced by geographic distance, larval dispersal capacity, species-specific larval development and settlement attributes, variable ocean current-mediated gene flow, source and sink location geography and habitat heterogeneity across the archipelago. Data reported here will inform accurate and sustainable fishery regulation, conservation of genetic diversity, direct broodstock sourcing for mariculture and guide restocking interventions across the Philippines.
Resolution of stock structure and delineating population boundaries remains a long-standing challenge facing sustainable fisheries management and marine conservation efforts. Against a backdrop of overfishing, climate change and marine pollution, global marine resources today are more vulnerable than ever, with the vast majority of the world’s fish stocks either having collapsed, being fully- or overexploited, or requiring recovery (Pauly and Zeller, 2016; Worm, 2016). Elucidation of conservation and management units is a fundamental goal of fishery management (Waples et al., 2008; Waples and Naish, 2009; Funk et al., 2012), as it directly informs stock assessment, fishing quota allocation, determination of sustainable catch limits, stock monitoring, and recovery efforts (Ward, 2000; Palsbøll et al., 2007).
Marine systems present a number of challenges for delineation of biologically meaningful conservation and management units, as many taxa, including >70% of invertebrate species, have large population sizes, high fecundity and widespread larval dispersal (Waples and Gaggiotti, 2006; Limborg et al., 2012; Lal et al., 2017); which give rise to shallow genetic differentiation between populations. Marine invertebrates which are partially or completely sessile, or have limited motility as adults, maintain genetic connectivity between populations primarily via larval dispersal and recruitment. As larvae are transported in the plankton, and undergo differential survival rates and selection pressures pre- and post-settlement, these factors influence the genetic composition of populations they recruit into (Addison and Hart, 2005; Reitzel et al., 2013; Liggins et al., 2014).
The spatial distribution of a population may be limited to isolated biodiversity hotspots (e.g. single bivalve beds), or an entire reef system (Gosling, 2015; Lal et al., 2017). Genomic methods offer the capability to resolve population structure and demography, making them a powerful tool to incorporate into stock assessments. Given the complexities of the biological and environmental influences at play, it is also important to consider multiple sources of information (e.g. demographic, genetic and oceanographic data) for investigations of population structure and connectivity in the marine environment (Lal et al., 2016b; Deauna et al., 2021; Brown et al., 2022), particularly when taxa of interest are extensively distributed across heterogenous habitats. The emerging field of “fisheries genomics” which utilises molecular methods to investigate similarities and differences in the DNA of individuals (Valenzuela-Quiñonez, 2016), offers valuable insights into how marine populations are organised and interconnected across geographic, temporal and political regions. Genomic analyses allow a greater understanding of the demographic and adaptive histories of fisheries taxa, allowing stock delineation to match biological population boundaries, conservation of genetic diversity through identification of populations which may be sustainably exploited and informs effective, accurate and sustainable fishery management policies (Benestan, 2020).
The sandfish Holothuria (Metriatyla) scabra is one of the highest-value sea cucumbers among the more than 30 tropical Indo-Pacific species exploited within the global bêche-de-mer (BDM) trade, fetching an average of US$369/kg (but up to US$1,898/Kg) when dried and processed (Purcell et al., 2012a, 2018). This species has been harvested from wild populations for over four centuries in multi-species fisheries (Choo, 2008b; Schwerdtner Máñez and Ferse, 2010), with sustained overexploitation occurring over the last four decades (Purcell et al., 2012b; Hair et al., 2016b; Altamirano, 2017; Juinio-Meñez et al., 2017; Hamel et al., 2022). Sandfish, like other sea cucumbers, are slow-moving as adults, and occupy shallow intertidal regions near mangrove beds and in seagrass meadows (Mercier et al., 2000a, b). These attributes render them particularly easy to collect, and therefore vulnerable to overexploitation and ultimately extirpation. With market demand placing high fishing pressure on wild stocks, many regions have seen their sea cucumber resources become depleted and/or extirpated. These include Indonesia, Thailand, Vietnam and Malaysia (Choo, 2008b); the Philippines (Choo, 2008a); Papua New Guinea, Palau, the Federated States of Micronesia, Marshall Islands, Solomon Islands, Tuvalu, Tokelau and French Polynesia (Pakoa and Bertram, 2013); Fiji (Brown et al., 2022); India and New Caledonia (Hamel et al., 2001). Sandfish have also been listed as endangered on the IUCN Red List of Threatened Species since 2010 (Hamel et al., 2013).
National sea cucumber fisheries in the South East Asian region and western Pacific have historically supported large volume BDM exports (Choo, 2008b), and the continued high fishing pressure experienced by stocks in these areas has prompted fishery assessments, development of management plans, investigation of conservation measures and fishery regulation among other measures, to arrest stock declines and permit recovery (Anderson et al., 2011; Pakoa and Bertram, 2013; Hair et al., 2016a; Hamel et al., 2022). The Philippines combined with Indonesia between 2000–2005 produced an annual average of 47% of all Holothuroid landings (Choo, 2008b). Within the Philippines, wild sea cucumber harvest volumes have declined substantially, with ~4,000 tonnes recorded in 1990 to <1000 tonnes by the early 2000s (Choo, 2008a; Labe, 2009; Hamel et al., 2022), however these figures are reported to be grossly underestimated (Choo, 2008b). The first nationwide stock and fishery survey of shallow-water sea cucumbers by Labe et al. (2007) confirmed overexploitation of stocks, with a steady rise in the number of species harvested commercially, from high-value, low-volume species such as H. scabra, to lower value, high volume species (Choo, 2008a). In the 1900s, 5 species were exploited, increasing to 24 in the 1980s and the present 33 species (Choo, 2008a). Currently, at least 84 species are exploited around the world (Purcell et al., 2023).
The Philippines has a number of regulatory measures (Bureau of Fisheries and Aquatic Resources (BFAR) Administrative Circular No.248 and New Fisheries Code (Republic Act 8550)) for harvest size limits and numbers of collectors permitted to trade in sea cucumbers (Choo, 2008a; Bureau of Fisheries and Aquatic Resources, 2013; Ravago-Gotanco and Kim, 2019), however, these alone are unlikely to be sufficient to facilitate stock recovery. An important first step using a population genetic approach to elucidate stock structure and complement existing demographic stock assessments for sandfish in the country has been carried out by Ravago-Gotanco and Kim (2019), and prior to this investigation, no data on genetic structure was available. This study examined 15 populations across the Philippine archipelago utilising 11 microsatellite markers, and identified 6 genetic groups divided among marine biogeographic regions in the country, establishing a baseline for stock structure and genetic diversity in these regions.
Sandfish mariculture has been developed in the Philippines since 2001 following pilot testing at the University of the Philippines Marine Science Institute (UPMSI) (Gamboa and Juinio-Meñez, 2003; Gamboa et al., 2004; Southgate et al., 2020). Recent research has focussed on developing and optimising culture methods for sandfish (Hair et al., 2016b; Juinio-Meñez et al., 2017; Altamirano and Noran-Baylon, 2020; Altamirano et al., 2021; Hamel et al., 2022; de la Torre-de la Cruz et al., 2023). Sandfish mariculture offers the promises of catering to trade demand, assisting restocking efforts, generating sustainable livelihoods for fishers and conservation of wild populations (Duy, 2010; Juinio-Meñez et al., 2017; Militz et al., 2018; Hair et al., 2022). Fundamental culture methods have been developed (Battaglene et al., 1999; Duy, 2012; Mills et al., 2012; Militz et al., 2018), with production established in a number of countries including India, the Maldives, Solomon Islands, New Caledonia, Madagascar, Vietnam and the Philippines (Battaglene, 1999; Pitt, 2001; Ramofafia et al., 2003; Duy, 2010; Duy et al., 2015).
Today, hatchery, and ocean-based nursery and grow-out systems are established at and in connection with several centres in the Philippines, including facilities in the BFAR network, the Bolinao Marine Laboratory of UPMSI, Aquaculture Department of the Southeast Asian Fisheries Development Centre (SEAFDEC/AQD), the Guiuan Development Foundation International (GDFI) and the Mindanao State University at Naawan (MSUN) (Juinio-Meñez et al., 2017; Altamirano and Noran-Baylon, 2020; Altamirano et al., 2021; Altamirano and Rodriguez, 2022). These production centres are vital for supplying current and future demands of the BDM trade, restocking and stock enhancement efforts, and expansion of sandfish production in the country (Ravago-Gotanco and Kim, 2019; Ordoñez et al., 2021). Building upon baseline data on broader genetic structure and diversity reported by Ravago-Gotanco and Kim (2019), further information on fine-scale genomic variability, local adaptation, relatedness, stock structure and population connectivity is required to inform mariculture and fishery management. These data will provide additional insights into genetic structure within the major biogeographic regions identified by Ravago-Gotanco and Kim (2019), inform broodstock sourcing guidelines, permit development of germplasm translocation protocols and guide restocking efforts.
Consequently, a high-resolution genomic audit of wild Philippine sandfish was conducted, employing a proven genotyping-by-sequencing approach (DArTseq) and genome-wide SNP markers for this species (Lal et al., 2021; Brown et al., 2022, 2024). Genomic data were used to examine fine-scale genetic structure, genomic diversity, relatedness population connectivity and local adaptation at both broad (biogeographic region) and local (within-biogeographic region) scales. A hydrodynamic particle dispersal model was used to assess population connectivity independently of genomic data, and collectively characterise patterns of genetic structure, diversity and gene flow across the Philippine archipelago. Results reported here will inform conservation, fishery and mariculture initiatives for sandfish in the country.
Adult Holothuria scabra (n=644) were sampled from natural populations at sixteen locations in the Philippine archipelago, spanning all six marine biogeographic regions (Aliño and Gomez, 1994), three island groups and fifteen Provinces (Figure 1A; Supplementary Table 1). Sites were sampled within the biogeographic regions of (1) the South China Sea: Currimao, Ilocos Norte (CUR); Anda, Pangasinan (AND); Masinloc, Zambales (MAS); Morong, Bataan (MOR); (2) Sulu Sea: Mindoro: Magsaysay (MIN); (3) Internal Seas: San Lorenzo, Guimaras (SLO); Sagay, Negros Occidental (SAG); Macrohon, Southern Leyte Gulf (SLE); Plaridel, Misamis Occidental (PLA); Tubajon, Laguindingan (TBJ); Camiguin, Misamis Oriental (CAM); (4) Celebes Sea: Olutanga, Zamboanga Sibugay (OZS); (5) North Philippine Sea: Santa Ana (STA); Laoang, Northern Samar (NSM); (6) South Philippine Sea: Guiuan, Eastern Samar (GUI) and Bislig, Surigao del Sur (SDS).
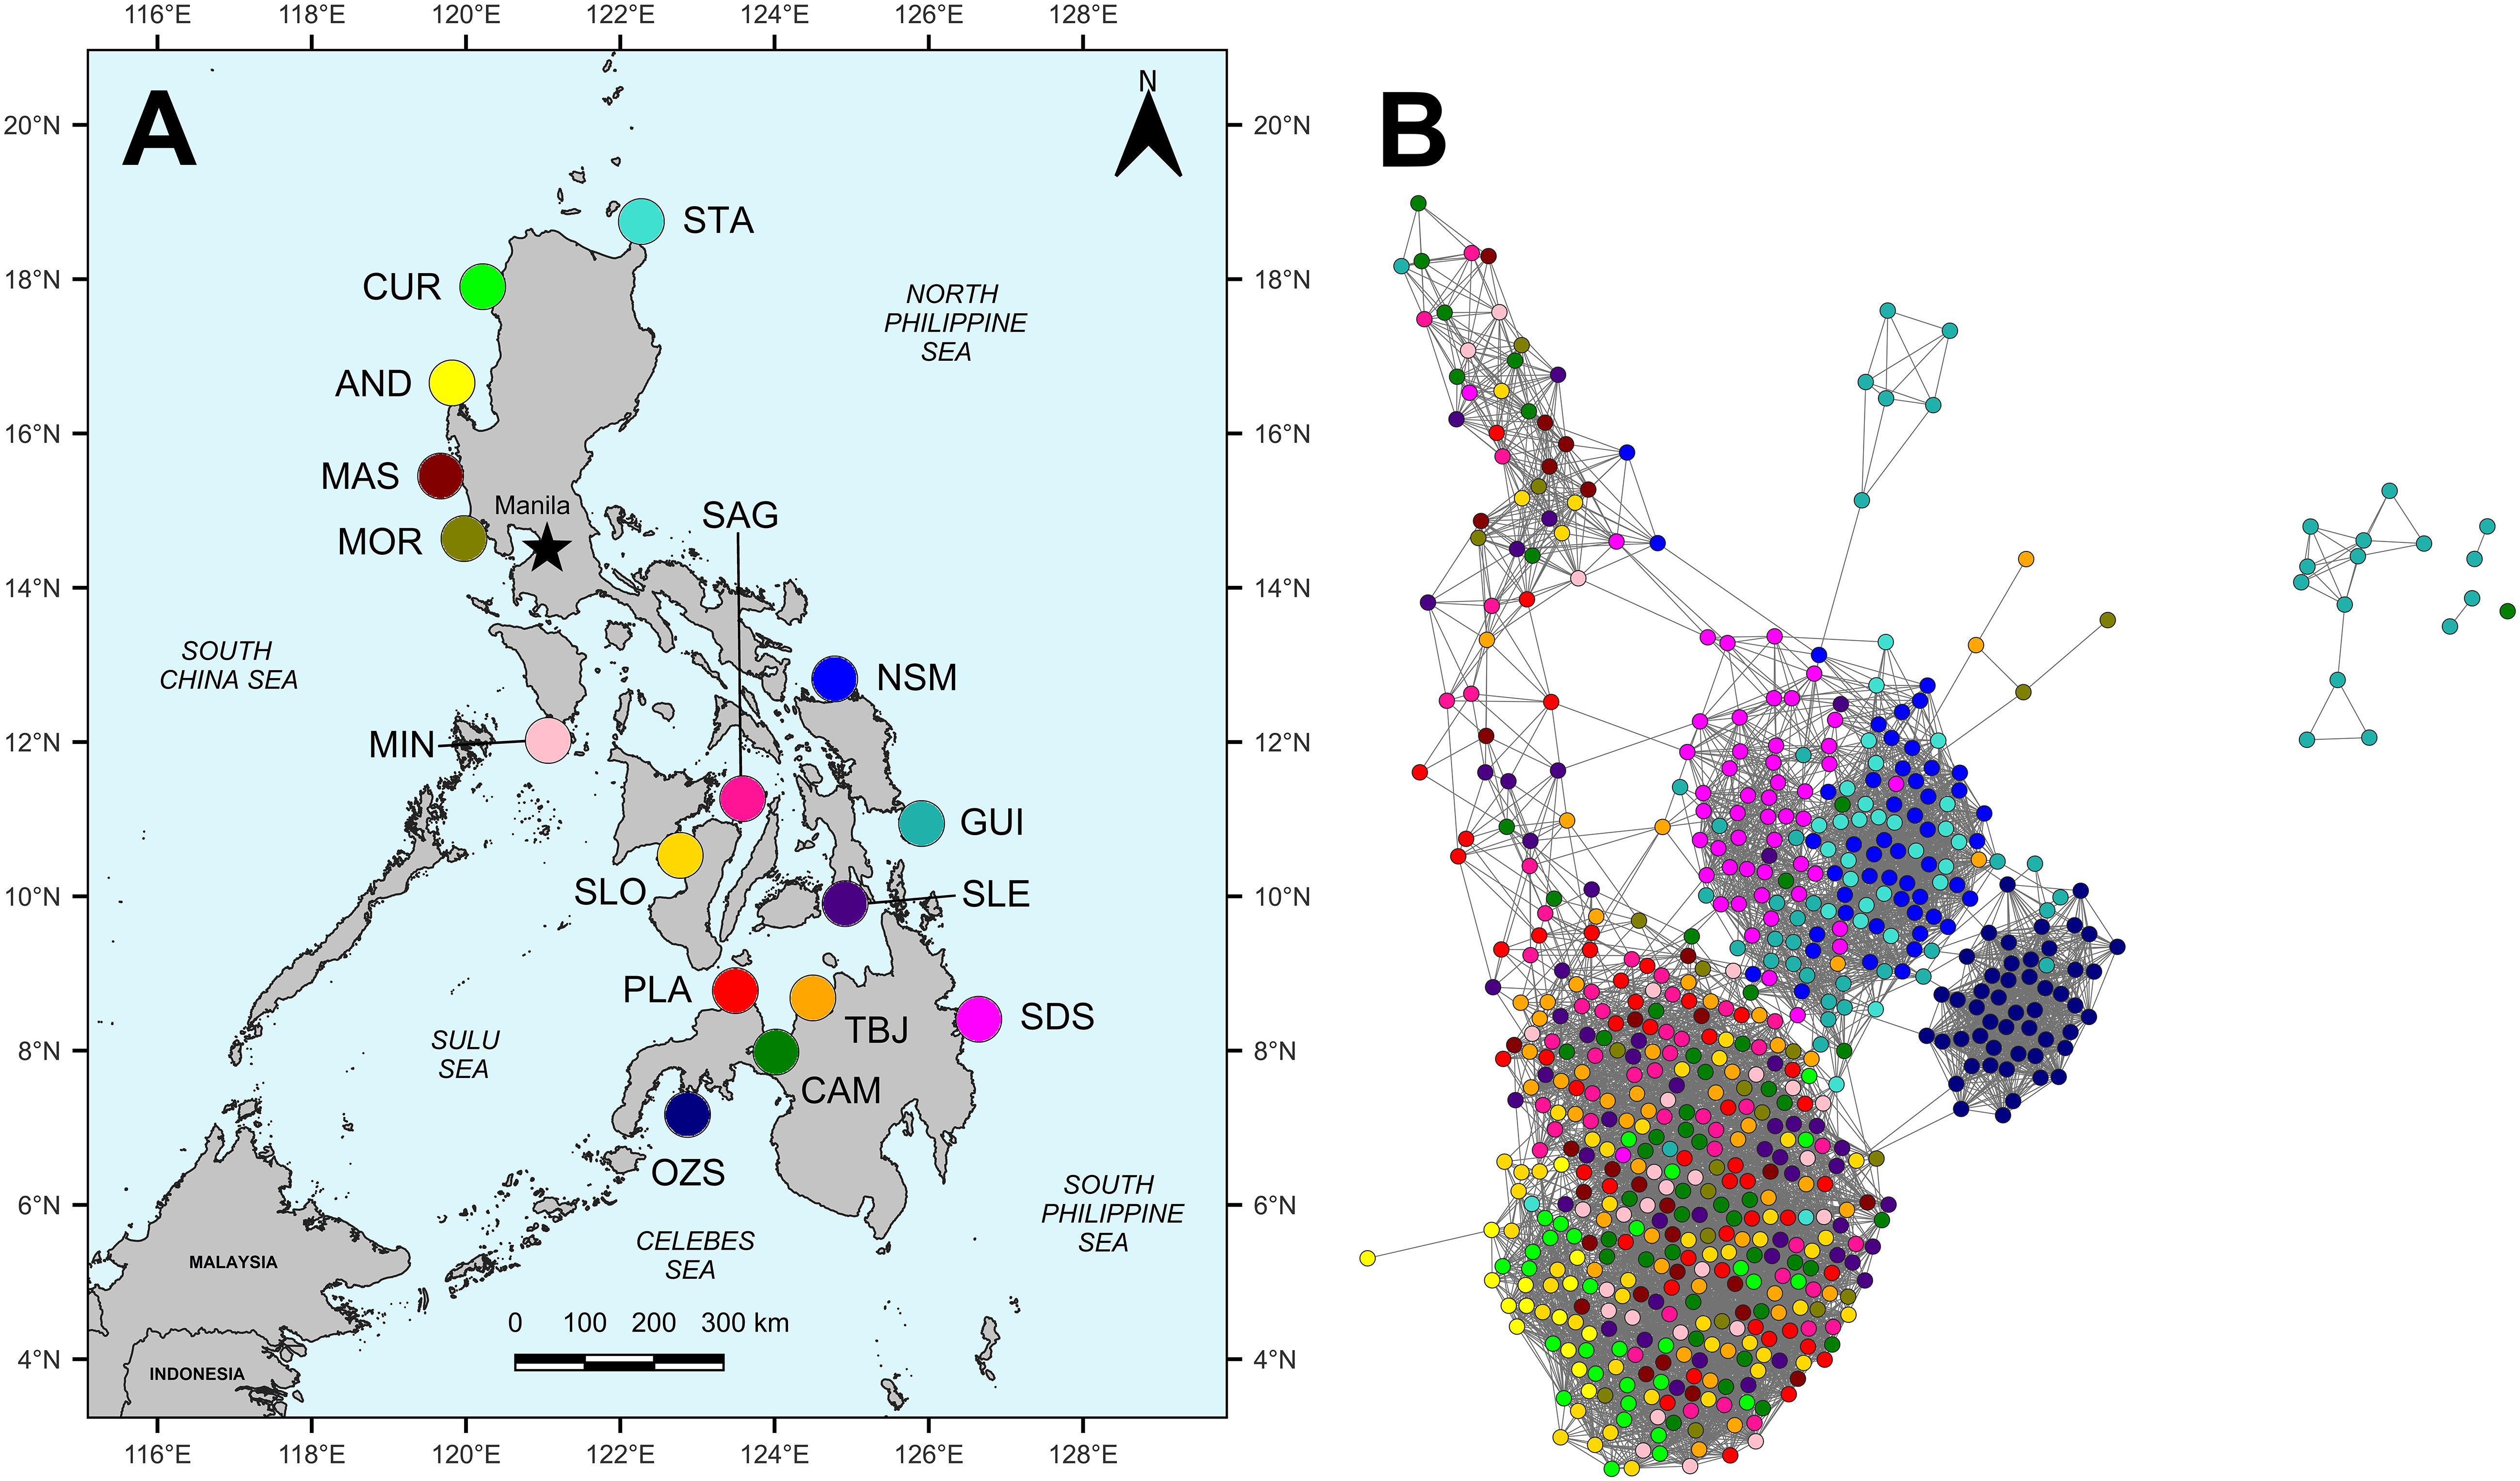
Figure 1 (A) Map of locations in the Philippines where H. scabra were sampled for tissue collection and (B) high resolution population network generated using Netview R (Steinig et al., 2016). Site codes in 1A are as follows: STA, Santa Ana, Cagayan; CUR, Currimao, Ilocos Norte; AND, Anda, Pangasinan; MAS, Masinloc, Zambales; MOR, Morong, Bataan; MIN, Magsaysay, Mindoro; SLO, San Lorenzo, Guimaras; SAG, Sagay, Negros Occidental; NSM, Laoang, Northern Samar; GUI, Guiuan, Eastern Samar; SLE, Macrohon, Southern Leyte; PLA, Plaridel, Misamis Oriental; OZS, Olutanga, Zamboanga Sibugay; CAM, Binuni, Camiguin; TBJ, Tubajon, Misamis Oriental and SDS, Bislig, Surigao del Sur. The map was produced using QGIS v 3.14.16-Pi and open-source geographical data obtained from the SPC Pacific data hub (https://pacificdata.org/). The network in 1B has been generated at a maximum number of nearest neighbour (mk-NN) threshold of 40, using 8,266 selectively-neutral SNPs and 644 individuals. Each dot represents a single individual, and population colours correspond with sampling sites in (1A).
Permission to collect wild individuals, sample their tissues and transport their derivatives (DNA) was obtained by coordination with respective local governments at sites through prior informed consent, memoranda of agreements, letters of intent, or through collection and transport permits from the Philippines’ Department of Agriculture, Bureau of Fisheries and Aquatic Resources (DA-BFAR: ECC No. 2020–0094). Specimens were collected by hand from intertidal habitats and handled as outlined by Altamirano and Rodriguez (2022), being maintained in plastic storage tubs with seawater while awaiting tissue sampling. Tissue samples measuring approximately 2.0 cm × 1.0 cm were collected non-destructively, by removing a strip of skin and body wall tissue from the ventrolateral anterior flanks of specimens using a sanitized scalpel blade. Specimens were maintained out of water for no more than 2–3 minutes and returned to their collection locations following tissue sample collection, excluding individuals collected by fishers for trade. Tissues were preserved in 96% ethanol or salt-saturated DMSO buffer and maintained under refrigeration (4°C) until DNA extraction at the Marine Science Institute, University of the Philippines at Diliman, Manila, the Philippines. Total genomic DNA was extracted using a Qiagen DNEasy Blood and Tissue kit (Qiagen, Valencia, California, USA) as per Ordoñez and Ravago-Gotanco (2024), quality-checked and quantified using agarose gel electrophoresis and Qubit 2.0 Fluorometer (ThermoFisher Scientific, Wilmington, USA), respectively, before being submitted for DArTseq™ genotyping to Diversity Arrays Technology Ltd (DArT PL), in Canberra, Australia.
Diversity Arrays Technology (DArT PL) proprietary genotyping by sequencing (DArTseq™) reduced-representation libraries were prepared as described by Kilian et al. (2012) and Sansaloni et al. (2011), with a number of modifications optimised for the sandfish genome as described by Lal et al. (2021). Briefly, genome complexity reduction was achieved with a double restriction enzyme (RE) digestion, using a PstI and SphI methylation-sensitive RE combination. Custom proprietary barcoded adapters (6–9 bp) were ligated to RE cut-site overhangs as per Kilian et al. (2012), with the adapters designed to modify RE cut sites following ligation. Target “mixed” fragments (Ren et al., 2015) were selectively amplified using custom designed primers for each sample, under the following PCR conditions: initial denaturation at 94°C for 1 min, then 30 cycles of 94°C for 20 s, 58°C for 30 s and 72°C for 45 s, followed by a final extension step at 72°C for 7 min. Amplified samples were subsequently cleaned using a GenElute PCR Clean-up Kit (Sigma-Aldrich, cat.# NA1020–1KT). All samples were each normalised and pooled using an automated liquid handler (TECAN, Freedom EVO150), at equimolar ratios for sequencing on the Illumina HiSeq 2500 platform. After cluster generation and amplification (HiSeq SR Cluster Kit V4 cBOT, cat.# GD-401–4001), 77 bp single-end sequencing was performed at the DArT PL facility in Canberra, Australia.
Illumina CASAVA v.1.8.2 software was used for initial assessment of read quality, sequence representation and generation of FASTQ files from raw reads. Filtered FASTQ files were subsequently used for further filtering, variant calling and calling of final genotypes using the DArT PL proprietary software pipeline DArTtoolbox (Cruz et al., 2013). Within DArTtoolbox, the package DArTsoft14 was first used to prune reads with a quality score <25 from further processing. Individual samples were then de-multiplexed by barcode, and subsequently aligned and matched to catalogued sequences in both NCBI GenBank and DArTdb custom databases to check for viral and bacterial contamination. Any matches for viral or bacterial sequences were subsequently removed. SNP and reference allele loci were identified in reduced-representation loci (RRL) clusters and assigned scores of: “0”=reference allele homozygote, “1”=SNP allele homozygote and “2”=heterozygote. To ensure accurate variant calling, all monomorphic clusters were removed and SNP loci had to be present in both allelic states (homozygous and heterozygous). A genetic similarity matrix was produced using the first 10,000 SNPs called to assess technical replication error (Robasky et al., 2014), and furthermore clusters containing tri-allelic SNPs, aberrant SNPs and overrepresented sequences were pruned from the dataset.
Following SNP calling, each SNP was assessed for homozygote and heterozygote call rate, frequency, polymorphic information content (PIC), average SNP count, read depth and repeatability using DArT PL’s KD Compute package. These metrics were included in the raw genotype dataset supplied by DArT PL. The raw genotype dataset was further filtered to retain only a single, highly informative SNP at each genomic locus for population genomic analyses. A nested criteria of call rate and average polymorphic information content (PIC, highest to lowest rankings for both criteria) removed duplicated loci with identical Clone IDs. The dataset was further filtered for global call rate (95%), read depth (>8), average PIC (1%) MAF (2% per population) and average repeatability (95%). All loci were assessed for departure from Hardy-Weinberg Equilibrium (HWE) using Arlequin v.3.5.1.3 (Excoffier et al., 2005), using an exact test with 10,000 steps in the Markov Chain and 100,000 dememorisations. Identification of loci under potential selection was achieved using two software packages, BayeScan v.2.1 (Foll and Gaggiotti, 2008; Foll, 2012) and HacDivSel (Carvajal-Rodríguez, 2017), independently.
Bayescan computations were carried out at 0.01, 0.05, 0.1, 0.2 and 0.5 False Discovery Rate (FDR) thresholds as per Lal et al. (2021). The extreme-outlier (EOS) test in HacDivSel was used, where an algorithm searches for outlier clusters and performs a conditional LK test where more than one cluster is found based on the magnitude of Fst values. Putative FST outlier loci jointly-identified by both methods were removed and segregated into a separate outlier marker dataset, and all remaining SNPs tested for departure from Hardy-Weinberg Equilibrium (HWE) in Arlequin v.3.5.1.3 (Excoffier et al., 2005), using an exact test with 10,000 steps in the Markov Chain and 100,000 dememorisations. These steps collectively produced a final dataset containing selectively neutral loci.
To examine genetic relationships among populations, pairwise Fst estimates for each sample group were calculated using Arlequin v.3.5.1.3 with 10,000 permutations (Excoffier et al., 2005) and Nei’s standard genetic distances (DS, 1978) in Genetix v.4.05.2 (Belkhir et al., 1996). A heatmap of pairwise Fst values with an associated dendrogram showing hierarchical clustering of samples was also generated using the heatmap.2 function in the R package gplot v3.1.3.1 (Warnes et al., 2020). For assessment of an isolation-by-distance (IBD) pattern of genetic structure (Wright, 1943), Mantel Tests were performed in the R package vegan (Oksanen et al., 2022), using the ‘mantel’ function which calculates a Mantel statistic based on Pearson’s product-moment correlation with 999 permutations. A parallel evaluation was carried out in the R package adegenet (Jombart and Ahmed, 2011; Jombart and Collins, 2015), using the ‘mantel.randtest’ function to compare values. Population pairwise genetic distances were computed in the R packages hierfstat (Goudet, 2005) and mmod (Winter, 2012), for Fst (Nei, 1987) and Jost’s D (Jost, 2008) measures, respectively. Geographic distances between tissue sampling sites were estimated using the path tool in Google Earth Pro v. 7.3.6.9345 (Keyhole Incorporated, 2022) and outputs of the DisperGPU particle model for dispersal pathways mediated by major surface circulation patterns (refer to section on hydrodynamic particle dispersal modelling). Correlograms of genetic vs. geographic distances were generated using the R function plot, and fitted with a LOESS-smoothed local mean line to assess relationship linearity (Figueira, 2019; Alpaydin, 2020). For Jost’s D computations, it was necessary to log-transform genetic and geographic distances to improve linearity (Wick, 2018). Local density values were generated using the 2-dimensional kernel estimation function ‘kde2d’ in the MASS R package (Venables and Ripley, 2002), and superimposed through a colour palette on correlograms to better visualise relationships.
A Discriminant Analysis of Principal Components (DAPC) was employed to investigate genetic structure using the R package adegenet 1.4.2 (Jombart, 2008; Jombart et al., 2010; Jombart and Ahmed, 2011), at country-wide (all 16 sites) and regional levels (eastern and southern vs. western coastline site subsets), utilising both selectively neutral and putatively adaptive datasets. The DAPC used an α-score optimisation to inform the number of principal components to retain and the ‘find.clusters’ function of adegenet determined the optimal number of clusters using a Bayesian Information Criterion (BIC) method (k-means clustering). As group memberships of a DAPC may be subject to overfitting the discriminant functions when too many principal components are retained, an alternative method of visualising clusters not reliant on k-means clustering was utilised (see Jombart and Collins, 2015). This permitted an additional visualisation of biologically-defined group memberships relying on retained discriminant functions only, using the ‘assignplot’ and ‘compoplot’ functions of adegenet, with the latter generating a STRUCTURE-like barplot of group membership probability.
For estimation of proportional ancestral contributions and population stratification among sample groups, the ADMIXTURE package was used (Alexander et al., 2009; Zhou et al., 2011). ADMIXTURE employs the likelihood model utilised in the STRUCTURE analysis package (Pritchard et al., 2000); however, instead of adopting a Bayesian approach and a Markov chain Monte Carlo (MCMC) algorithm to sample posterior likelihood distributions, it applies a Maximum Likelihood method to estimate parameters (Alexander et al., 2009). The optimal number of groups (K) was selected based on the K value (ranging from 2 to 18) with the lowest cross-validation error estimated across 10 independent runs (–cv=10). Individual ancestry coefficients were then calculated at the optimal k and 100 independent runs. ADMIXTURE barplots were generated using the R package pophelper v2.3.1 (Francis, 2017).
To investigate fine-scale stratification at selectively neutral loci, network analyses were also carried out using the Netview R package (Neuditschko et al., 2012; Steinig et al., 2016). Netview R population networks were generated based on a shared allele 1-identity-by-state (IBS) distance matrix created in the PLINK v.1.07 toolset (Purcell et al., 2007). Each network was constructed following computation of the maximum number of nearest neighbours for each individual (Tsafrir et al., 2005; Neuditschko et al., 2012; Steinig et al., 2016). Individual networks were then visualised and edited in the Cytoscape v.2.8.3 network construction package (Smoot et al., 2011). The IBS matrices and corresponding networks were constructed at various thresholds of the maximum number of nearest neighbour (mk-NN) values between 1 and 50, after which the optimal network for representation was selected based on cluster stability (Steinig et al., 2016).
To evaluate partitioning of genetic structure among and within populations, we carried out an analysis of molecular variance (AMOVA) in Arlequin v.3.5.1.3 (Excoffier et al., 2005) using three groupings, after the approach described by Ravago-Gotanco and Kim (2019). Using 10,000 permutations, hierarchical fixation indices and proportions of variance were examined at (1) all sample groups assessed together; (2) groups delineated by marine biogeographic regions according to respective seas and (3) groups determined by Netview R, DAPC and ADMIXTURE analyses of fine-scale genetic structure. Assessment of the direction and magnitude of migration between populations (at selectively neutral SNPs) was carried out using the ‘divMigrate’ function and Nei’s Gst method originally implemented in the now deprecated R package diveRsity (Keenan et al., 2013; Sundqvist et al., 2016). A shiny (Chang et al., 2023) implementation of divMigrate is available online as divMigrate-online at https://popgen.shinyapps.io/divMigrate-online/, and was used for analyses.
Allelic diversity indices for each sample group including the average observed (Ho) and average expected heterozygosity corrected for population sample size (Hn.b.), were computed using GenAlEx v6.502 (Peakall and Smouse, 2006) and validated with Genetix v.4.05.2 (Belkhir et al., 1996). GenAlEx was also used to determine Wright’s inbreeding coefficients (Fis), mean numbers of alleles per locus (A, MAF ≥ 5%), the effective number of alleles (Neff) per population, number of locally common alleles (MAF ≥5%) found in <25% of all populations tested and percentages of polymorphic loci. The number of private alleles per population (Ap, at MAF ≥5%) was computed with HP-RARE v.1.0 using the rarefaction method (Kalinowski, 2004), and verified with the R package PopGenKit (Paquette, 2012).
Mean Internal relatedness (IR) within each population was calculated using the R package Rhh (Alho et al., 2010), as described by Amos et al. (2001). This metric is a modification of the Queller and Goodnight (1989) measure which examines the proportions of shared alleles, with higher weighting assigned to shared rare alleles compared to shared common alleles. Mean IR values centred around zero are suggestive of individuals descended from ‘unrelated’ parents, while negative and highly positive values suggest the presence of relatively ‘outbred’ and possibly ‘inbred’ individuals, respectively (Amos et al., 2001). Effective population sizes for each sample group based on the linkage disequilibrium method (NeLD) were estimated using NeEstimator v.2.01 (Do et al., 2014).
Particle dispersal modelling was used to investigate potential larval transport pathways between and among the 16 sites at which sandfish were sampled, and to evaluate population connectivity. In summary, an approach optimised for H. scabra populations in Fiji as per Brown et al. (2022) was utilised, employing the DisperGPU particle model which simulated dispersal (https://github.com/CyprienBosserelle/DisperGPU); and the HYbrid Coordinate Ocean Model (HYCOM: https://www.hycom.org), which provided hindcast current velocity data and hydrodynamic forcing to drive DisperGPU. Sandfish larvae were simulated as particles seeded into defined polygons (seagrass bed area extents as proxies for sandfish habitat for each sampling site, which were extracted from Allen Coral Atlas data: https://allencoralatlas.org). During simulations, particle positions were tracked over a fixed period of time to emulate the pelagic larval duration (PLD) of H. scabra.
DisperGPU utilises a standard Lagrangian formulation, taking into account particle position (latitude and longitude), displacement during model time steps (set as one day), eddy diffusivity and the surface current speed at the location of the particle (Siegel et al., 2003, 2008). The HYCOM model has a resolution (dx) of 1/12th of a degree and is output every day (Cummings, 2005; Chassignet et al., 2007). Further information on model formulation is described in Markey et al. (2016) and Lal et al. (2020). To generate simulations, gridded hindcast surface current data from the HYCOM model were interpolated into dispersal steps, after which current velocities at each particle position were calculated through bi-linear interpolation. Particle positions during each model time step (1 day) were recorded, with particle ages retained and increased during each time step.
The occurrence and extent of seagrass beds in the Philippines at sample collection sites was obtained from an Allen Coral Atlas benthic cover dataset as a layer file using QGIS v 3.14.16-Pi. Particle seed files for DisperGPU were then assembled as follows; first a seagrass habitat point layer was generated by extracting vertices from the seagrass layer file (Allen Coral Atlas, 2022), and adding coordinate points as a geometry attribute. Vertices were then extracted for each site polygon and imported to DisperGPU as discrete seed files. Sandfish are simultaneous broadcast spawners with a PLD of 25 days and mature females produce 9–17 million eggs depending on their size and age (Agudo, 2006; Duy, 2010). Larvae have limited swimming capability (Agudo, 2006) and disperse via prevailing surface ocean currents, lending themselves to Lagrangian simulations of dispersal. Sandfish in the Philippines spawn year-round, with peak spawning over August-November (Battaglene et al., 2002). Consequently, these biological attributes were used to define the following model parameters over a simulated “spawning” period: simulation duration of 90 days (30 days per event/month considering a PLD of 25 days plus a “settlement and recruitment” window of 5 days); and simulation duration over August to October to account for the peak spawning season in the Philippines. Simulating dispersal over 90 days permitted visualisation of larval transport corridors over the duration of the spawning season.
Particles were seeded every day for the first 10 days; no particle mortality or competency was simulated and a uniform distribution of adult sandfish within seagrass beds was assumed. A fixed number of 256,000 particles uniformly distributed in each seed area polygon was seeded each day over 10 days, making a total of 40,960,000 particles released across all 16 sites. This quantity of particles was selected based on constraints on available computational power, and DisperGPU input requirements (see https://github.com/CyprienBosserelle/DisperGPU for further information). Particle positions were extracted each day from the start of each simulation run and plotted on a map using the GMT software package (Wessel et al., 2013). These plots were annotated with model time step (day) and assembled to produce a single animation incorporating each site simulation (see Supplementary Data 1), which permitted visualisation of particle movement and potential transport pathways.
The raw DArTseq report contained a total of 85,271 SNPs genotyped across 644 individuals, and with the removal of 26,707 duplicate (clone) SNPs at each genomic locus, 58,564 SNPs were retained (31.3% reduction). Read depths ranged from 2.5–133.0 (median read depth=18.3); and further filtering for global call rate (95%), read depth (>7), average PIC (1%) MAF (2% per population) and average repeatability (95%), resulted in 10,642 SNPs remaining in the dataset. Screening for jointly-identified Fst outliers detected 117 SNPs between Bayescan (n=158 at an FDR=0.01) and HacDivSel (extreme outliers, n=122), which were separated into a dataset of putatively-adaptive loci to be used for investigation of selective signatures in genetic structure (Supplementary Data 3). Testing for HWE detected a total of 103 loci deviating from expectation under HWE at p<0.00001, however none were commonly out of HWE across all populations and therefore no loci were removed from the dataset. These steps collectively produced a dataset containing 8,266 filtered selectively-neutral SNPs (Supplementary Data 2), which were used for performing population genomic analyses.
The overall pattern of population differentiation at the country level for H. scabra in the Philippines is complex, with genetic connectivity highest within proximate marine biogeographic regions, and greater separation evident between geographically distant sites. Examination of broad-scale selectively neutral genetic structure among all sites with Netview R revealed separation of sites into four clusters overall (Figure 1B; Supplementary Figure 1). Individuals sampled at OZS segregated into one discrete, compact and relatively isolated cluster, while all remaining sites resolved three more diffuse groups. Two of these clusters included sandfish sampled from the North (STA, NSM) and South Philippine Seas (GUI and SDS), respectively, indicating the presence of restricted gene flow along the Eastern seaboard of the Philippines. The remaining larger cluster comprised all remaining sites from the South China, Sulu and Internal Seas (Sibuyan, Visayan and Bohol Seas) regions; CUR, AND, MAS, MOR, MIN, SLO, SAG, PLA, CAM, TBJ and SLE, suggesting high levels of gene flow and population connectivity within and among these regions. Within this cluster, sandfish sampled at CUR and AND displayed a small degree of segregation, possibly indicative of weak geographical isolation at these peninsular locations.
Examination of sites separately by marine biogeographic region provided further insights into genetic structure, with two additional pairs of DAPCs including only (1) South China, Sulu and Internal Seas sites (with the addition of STA as an outgroup), and (2) North and South Philippine, and Celebes Seas (with the addition of SLE as an outgroup). At selectively-neutral markers along the Northern and Western Philippine seaboard together with the Internal Seas region, divergence of STA in a discrete cluster and segregation of CUR, AND with MAS in a separate cluster was evident (Figure 2D). Concordant patterns of differentiation were apparent when individual group membership probability was examined using a DAPC compoplot (Figure 2H), however, at putatively adaptive SNPs, only STA remained isolated (Figure 2E).
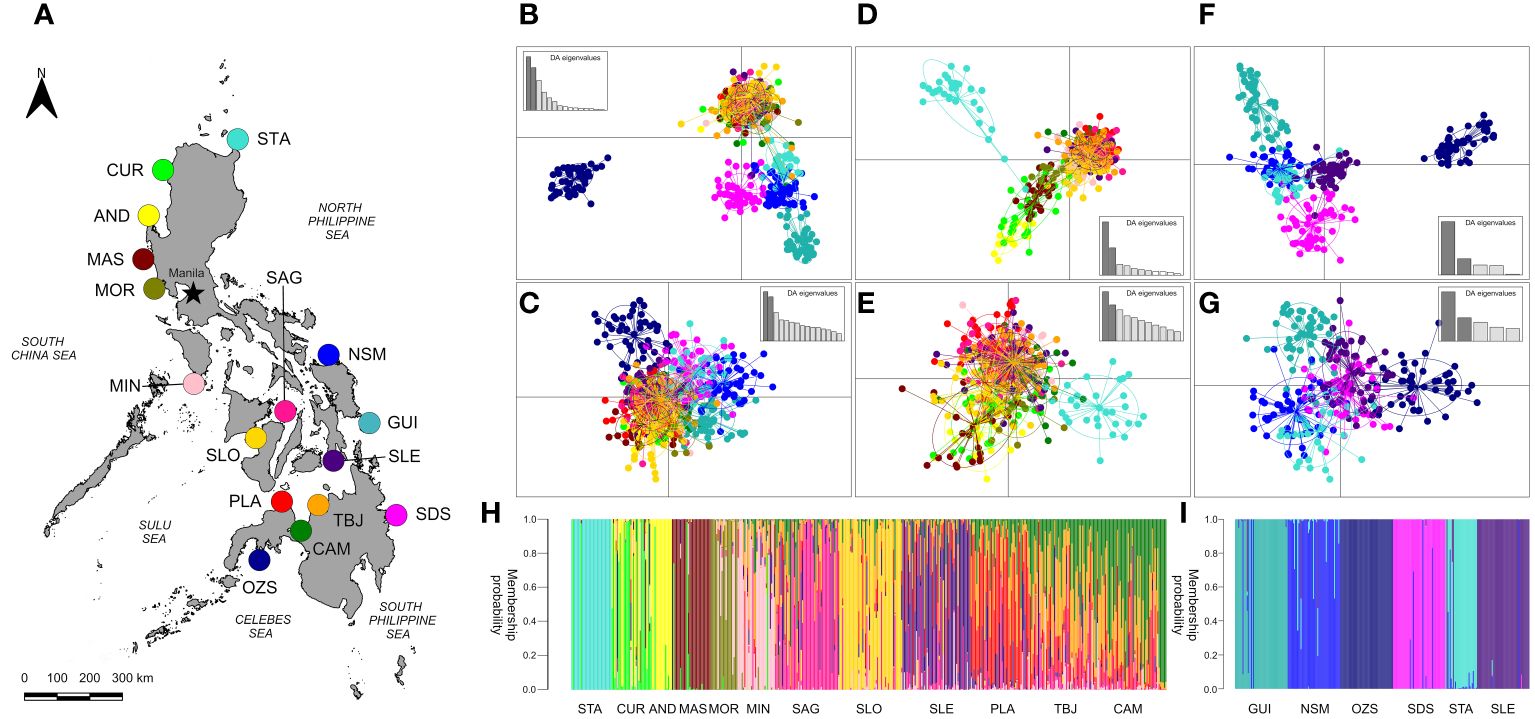
Figure 2 Visualisation of genetic structure in Philippines’ H. scabra using Discriminant Analysis of Principal Components (DAPC) scatterplots (B–G) and individual group membership barplots (H, I) (Jombart and Ahmed, 2011). (A) Map of sample collection sites. Plots (B, D, F, H, I) were generated using 8,266 selectively-neutral SNPs and (C, E, G) using 117 putatively-adaptive SNPs. The numbers of principal components and discriminant factors retained respectively for each DAPC scatterplot were as follows: (B) 215, 7; (C) 215, 15; (D) 148, 7; (E) 148, 11; (F) 14,4 and (G) 94, 5. All DAPCs were generated following α-score optimisation. Plots (B, C) include all sites sampled (n=16); (D, E, H) include South China, Sulu and Internal Seas sites along with the North Philippine Sea (STA only), n=12; (F, G, I) include North and South Philippine Seas, Celebes Sea and one Internal Seas location (SLE), n=6. Sites were sampled within the biogeographic regions of (1) the South China Sea: Currimao, Ilocos Norte (CUR); Anda, Pangasinan (AND); Masinloc, Zambales (MAS); Morong, Bataan (MOR); (2) Sulu Sea: Mindoro: Magsaysay (MIN); (3) Internal Seas: San Lorenzo, Guimaras (SLO); Sagay, Negros Occidental (SAG); Macrohon, Southern Leyte Gulf (SLE); Plaridel, Misamis Occidental (PLA); Tubajon, Laguindingan (TBJ); Camiguin, Misamis Oriental (CAM); (4) Celebes Sea: Olutanga, Zamboanga Sibugay (OZS); (5) North Philippine Sea: Santa Ana (STA); Laoang, Northern Samar (NSM); (6) South Philippine Sea: Guiuan, Eastern Samar (GUI) and Bislig, Surigao del Sur (SDS).
Collectively at 8,266 selectively neutral markers, a total of seven genetic stocks are apparent within the three broader groups: (1) CUR, AND, MAS; (2) MOR, MIN, SLO; (3) SAG, SLE, PLA, CAM, TBJ; (4) STA, NSM; (5) GUI; (6) SDS and (7) OZS (Figures 2B, D, F, H, I). Furthermore, evaluation of proportional ancestral contributions through ADMIXTURE analyses resolved the optimal number of clusters as k=7 (Figure 3).
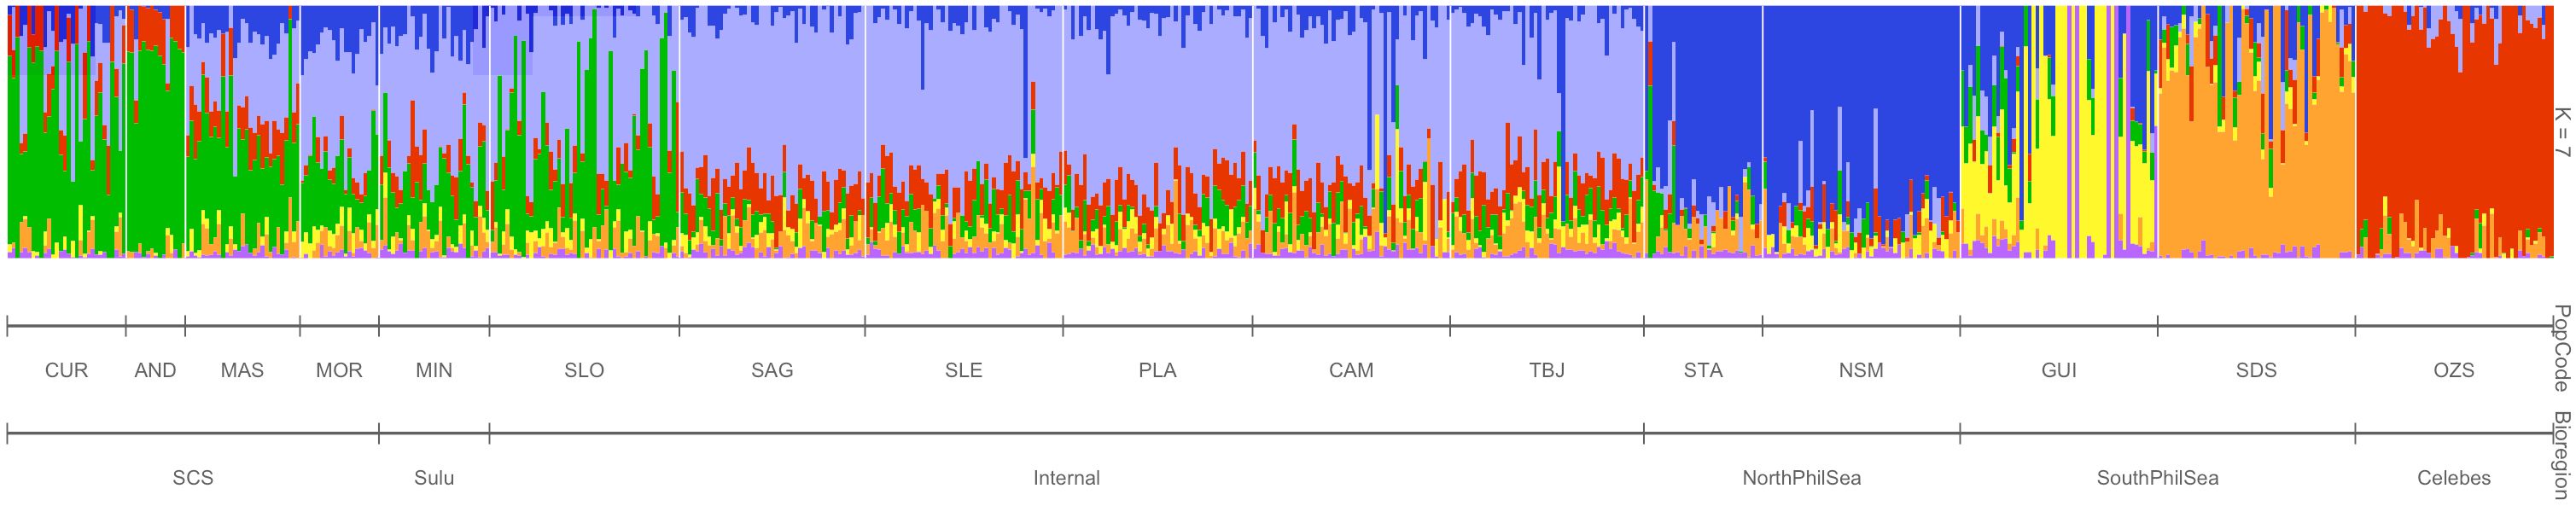
Figure 3 Proportional ancestral contributions for 644 individuals of H. scabra sampled at 16 sites and 6 marine biogeographic regions in the Philippines. Contributions across individuals are visualised with an ADMIXTURE (Alexander et al., 2009) barplot at a k=7 threshold, generated using 8,266 genome-wide SNPs.
Population differentiation estimates were shallow (Fst range =-0.005–0.045, mean=0.016) but significant for all but 14 out of 120 pairwise comparisons (Table 1; Supplementary Figure 1), and were concordant with Netview R clustering patterns. Pairwise Fst estimates were highest between OZS and STA, NSM and GUI, respectively (Fst=0.043, 0.041 and 0.045, respectively); along with GUI and AND (Fst=0.040). Moderate levels of differentiation were evident between similarly geographically isolated locations including AND vs. STA and NSM, respectively (Fst=0.039 for both comparisons), SDS and OZS vs. AND, respectively (Fst=0.033 and 0.036, respectively) and OZS vs. SDS (Fst=0.031). Pairwise Fst estimates between the majority of remaining comparisons (n=68) were shallow (mean Fst=0.008, range=-0.005–0.019), suggesting high gene flow across these sites. Similar patterns of differentiation shown by pairwise Fst data were evident in Nei’s standard genetic distance (DS) estimates between sites (Table 1), with greater genetic distances between geographically distant locations. The highest estimates were again obtained between AND and STA, NSM and GUI, respectively (DS=0.021, 0.020 and 0.020, respectively); followed by OZS against STA, AND and GUI (DS=0.019 for all three pairwise comparisons); together with AND vs. SDS (DS=0.018) and OZS vs. MOR (DS=0.017).
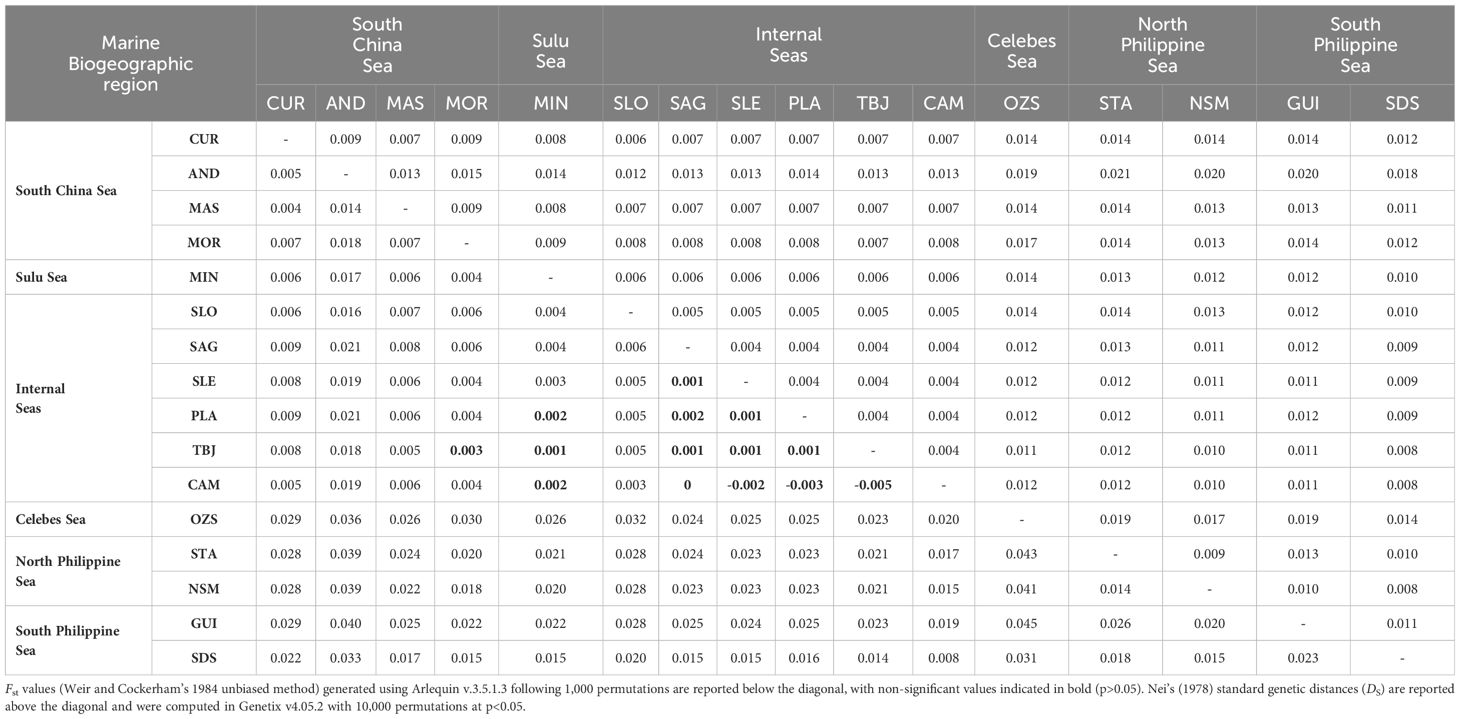
Table 1 Pairwise population differentiation estimates computed for H. scabra sampled at 16 sites and 6 marine biogeographic regions using 8,266 SNPs.
Partitioning of genetic variance by AMOVA showed that when all sampling sites were considered together, variability among sites (Fct) was highest and represented 1.63% of the total genetic variance, with the remainder being distributed among individuals (98.37%, p=0.016 Table 2). Grouping sites into clusters determined by genetic structure analyses revealed a similar degree of partitioning, with 1.53% distributed among clusters (Fct), 0.49% among populations within clusters (Fsc) and 97.99% within populations (Fst); p ≤ 0.02. The lowest proportion of partitioning into groups was evident when sites were distributed into marine biogeographic regions segregated by sea, with just 1.27% of the genetic variance attributed (Fct), 0.49% among populations within biogeographic regions (Fsc) and 98.08% within populations (Fst); p ≤ 0.02.
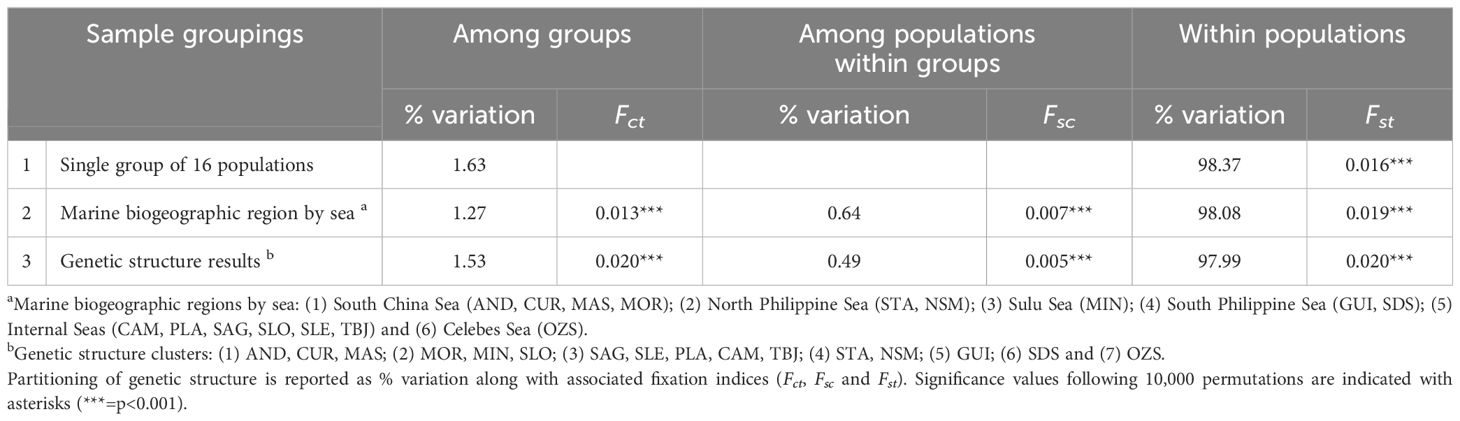
Table 2 Analysis of molecular variance (AMOVA) results for three sample groupings describing population genetic structure in Philippines’ H. scabra.
Population genetic structure at putatively-adaptive markers demonstrated varying degrees of separation at regional levels (Figure 2). Visualisation of genetic structure including all 16 sites in the analysis using a DAPC and 8,266 selectively-neutral SNPs reveals a similar pattern as shown by Netview R (Figure 2B), with strong separation of OZS into a discrete cluster, and STA, NSM, GUI and SDS in a second cluster. All remaining sites comprised a larger and compact third cluster. Visualisation using 117 Fst outlier SNPs and all 16 sites however, reveals a single, diffuse, cluster; with weaker separation of OZS individuals only (Figure 2C).
Along Eastern and Southern seaboard sites at neutral SNPs, OZS expectedly remained strongly differentiated, however sandfish sampled at GUI, SLE and SDS separated into their individual clusters, with NSM and STA grouping together, indicating the presence of gene flow between these two locations (Figure 2F). Evaluation of individual group membership probabilities supported this pattern of genetic differentiation (Figure 2I). Contrastingly, visualisation of genetic structure at putatively-adaptive markers across these six sites revealed separation of OZS and GUI only (Figure 2G). BLAST searches for functional annotations using flanking sequences associated with the Fst outlier SNPs did not return any informative results.
A moderate pattern of isolation by distance was detected by both genetic distance measures used with Mantel Tests considering all 16 populations; Nei’s (1987) Fst (Figure 4A) and Jost’s (2008) D (Figure 4B). Pearson product-moment correlation based on Jost’s D was highest when log transformed (R2 = 0.382, p=0.003, Figure 4B), compared to untransformed distances, R2 = 0.307, p=0.005. Correlations were similar and significant using Fst values (R2 = 0.367, p=0.002, Figure 4A).
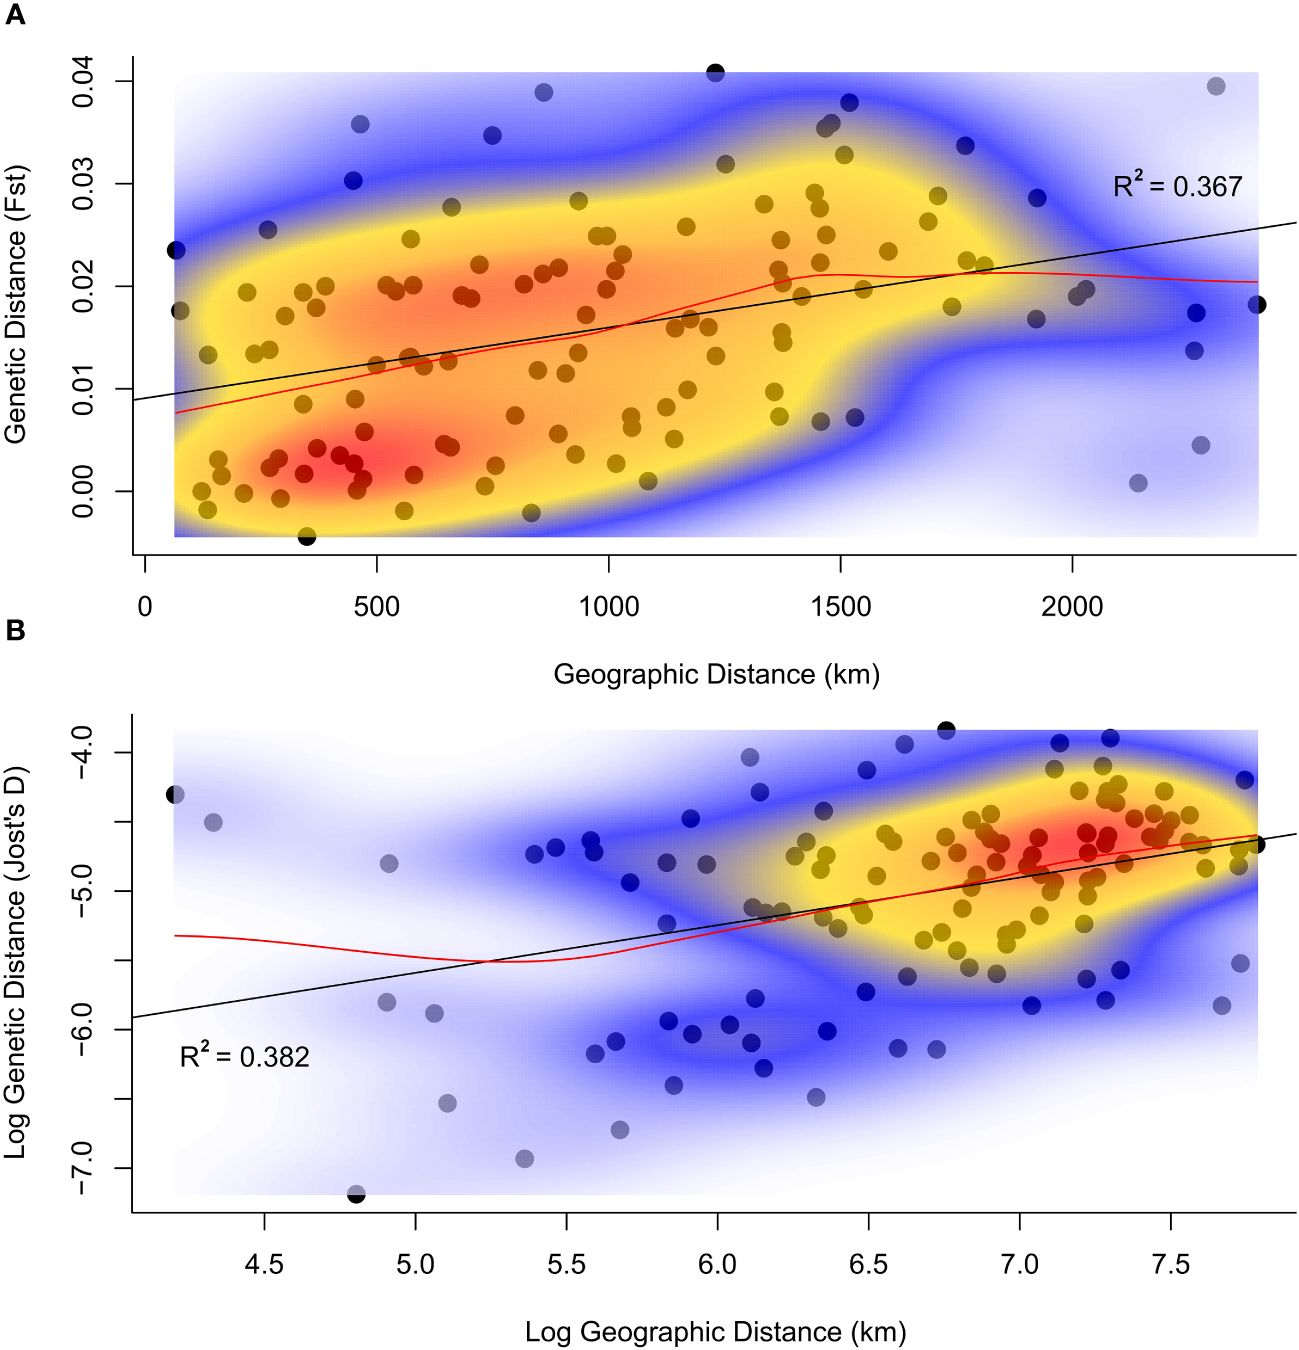
Figure 4 Population genetic versus geographic distances for H. scabra sampled in the Philippines. Genetic distances computed using (Nei, 1987) Fst values (A) and Jost’s D (Jost, 2008) (B) are shown against geographic distances in km in both plots. (4B) displays the log10 of both geographic and genetic distances. Linear regression lines of genetic against geographic distances are represented in black, while red lines represent locally smoothed means using LOESS linear regression (Figueira, 2019; Alpaydin, 2020). Local density estimates generated using the 2-dimensional kernel estimation function ‘kde2d’ in the MASS R package (Venables and Ripley, 2002) are superimposed over each respective plot in shaded colour.
Gene flow patterns between and among sample sites were estimated using relative directional migration rates (m) in the divMigrate function (Figure 5), and examined different hierarchical site groupings obtained from results of genetic structure analyses. Gene flow was greater among four sites along the Eastern seaboard of the Philippines (mean m=0.968 between STA, NSM, SDS and SLE; Figure 5B), whereas analyses were not able to detect connectivity between GUI and OZS within this same grouping. Substantial gene flow was also detected among seven sites in the Internal and Sulu Seas regions (CAM, PLA, TBJ, SLE, SAG, SLO and MIN; mean m=0.780; Figure 5D); however inclusion of four sites from the South China Sea and one site from the North Philippine Sea (STA) in the analysis reduced the degree of detectable gene flow among these twelve locations (mean m=0.562; STA, AND, CUR, MAS, MOR, CAM, MIN, SAG, SLO, TBJ, SLE, PLA; Figure 5A). It is possible the peninsular locations of AND, CUR and MOR function as partial barriers to gene flow between these and other Western seaboard locations. Examination of AND, CUR, MOR and MAS in isolation reinforce this possibility (mean m=0.384, Figure 5C).
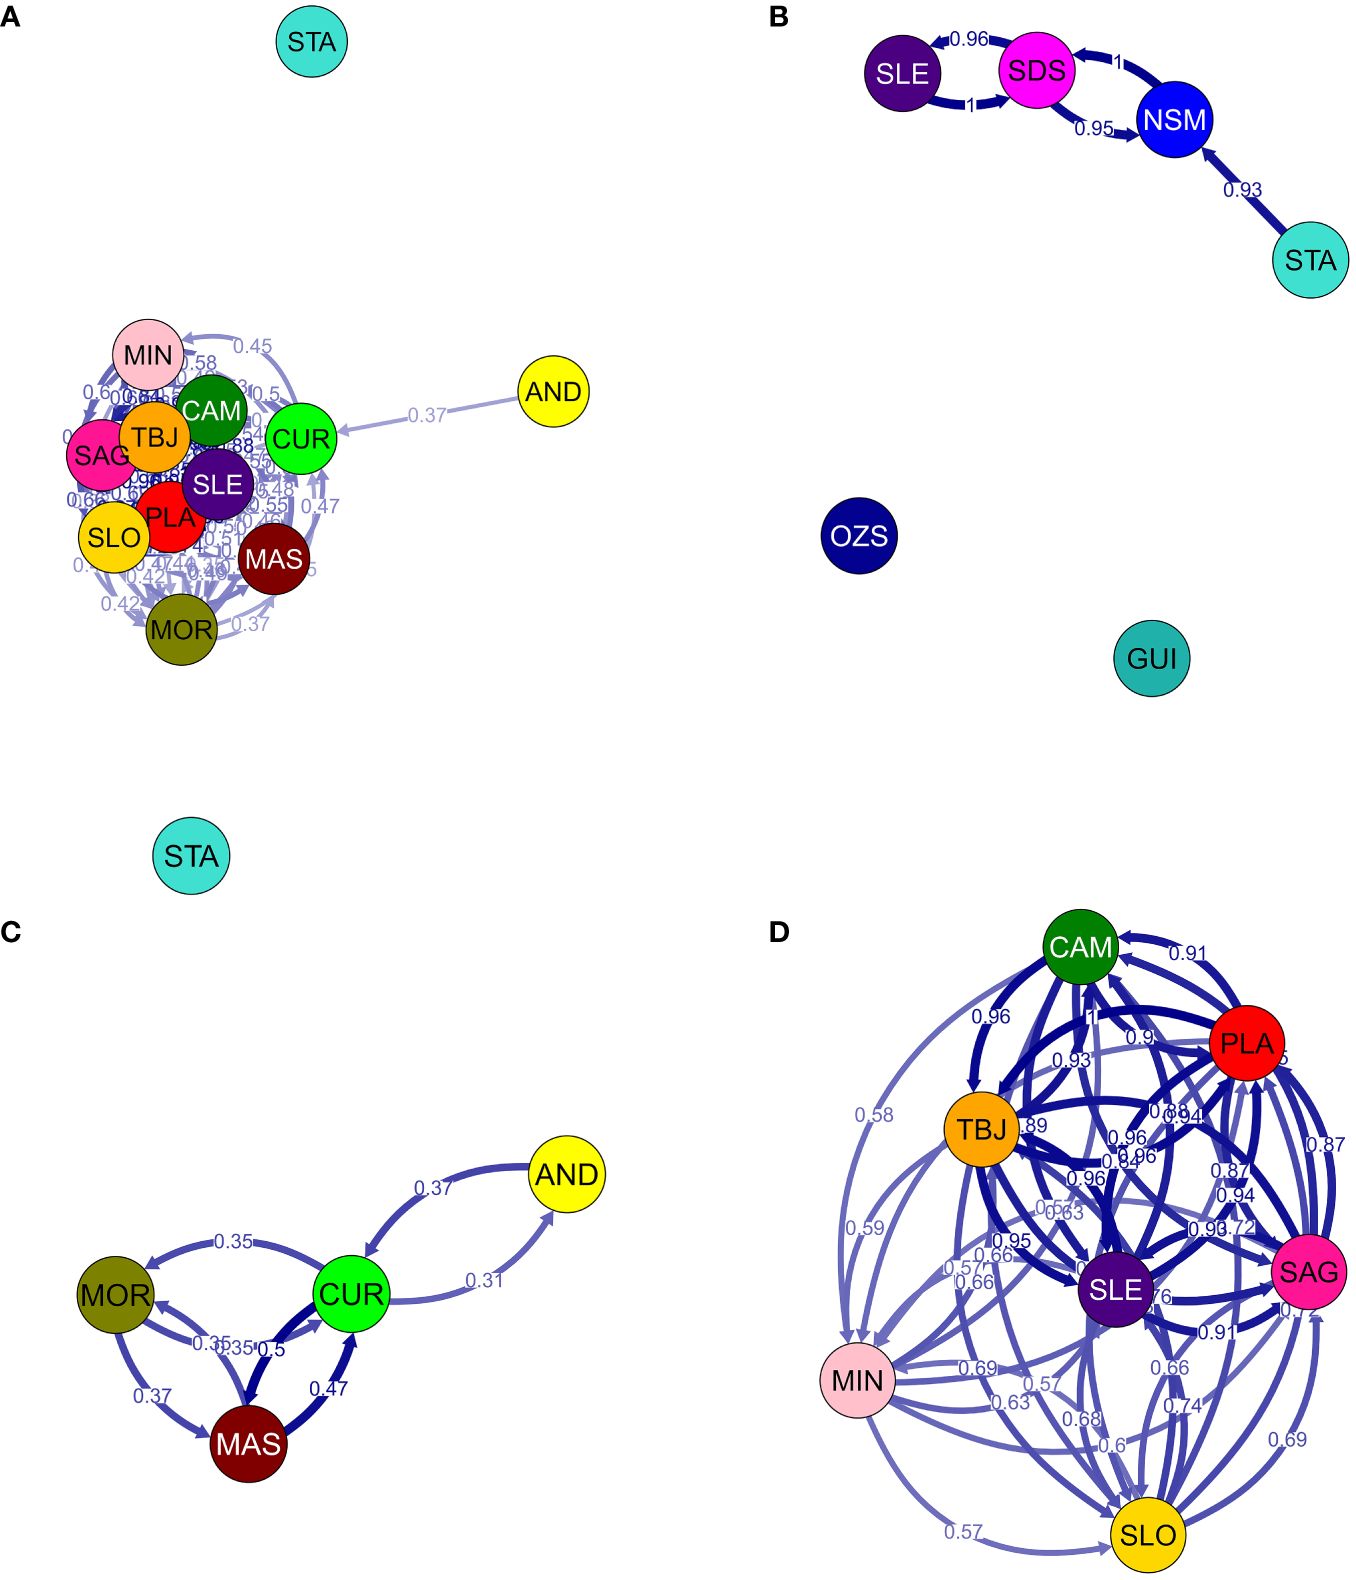
Figure 5 Relative migration networks for sandfish populations generated using divMigrate (Keenan et al., 2013; Sundqvist et al., 2016). Circles represent populations colour coded to sampling locations in Figure 1, while arrows indicate the putative direction and magnitude (arrow edge values) of relative migration levels using Nei’s Gst. Darker arrows indicate stronger gene flow compared to lighter arrows. To better visualise separation by region across the Philippines, several networks have been generated incorporating different sites including (A) 12 sites from the North Philippine, South China Sulu and Internal Seas regions; (B) 6 sites from the North and South Philippine and Celebes Seas regions; (C) 4 sites along the Western Luzon coastline only and (D) 7 sites spanning the Sulu and Internal Seas regions.
Effective population sizes (NeLD) of sandfish varied by marine biogeographic region (Table 3), with the largest variability (MOR: 116.8 [115.0–118.6] to AND: 9,341.7 [3,441.8-∞]) observed in the South China Sea region. The smallest Ne among all sites sampled was exhibited by individuals collected in the South Philippine Sea at GUI (NeLD=23.4 [23.3–23.4]), whereas the remaining site sampled in this region (SDS) recorded an NeLD=2,475.9 [2,254.8–2,744.8]. Continuing along the eastern Philippine seaboard, in the North Philippine Sea, the sites of STA (1,412.3 [1,276.8–1,579.6]) and NSM (3,249.4 [2,871.6–3,740.2]) generated more uniform effective population sizes, despite the relative geographic isolation of the former. Two biogeographic regions were sampled in only a single location, which were MIN in the Sulu Sea (NeLD=592.9 [563.5–625.6]) and OZS in the Celebes Sea (NeLD=1,514.9 [1,427.3–1,613.9]). Effective population sizes at six sites within the Internal Seas region were more uniform, ranging from SLO (983.5 [942.3–1,028.5]) to PLA (3,171.8 [2,800.7–3,655.8]).
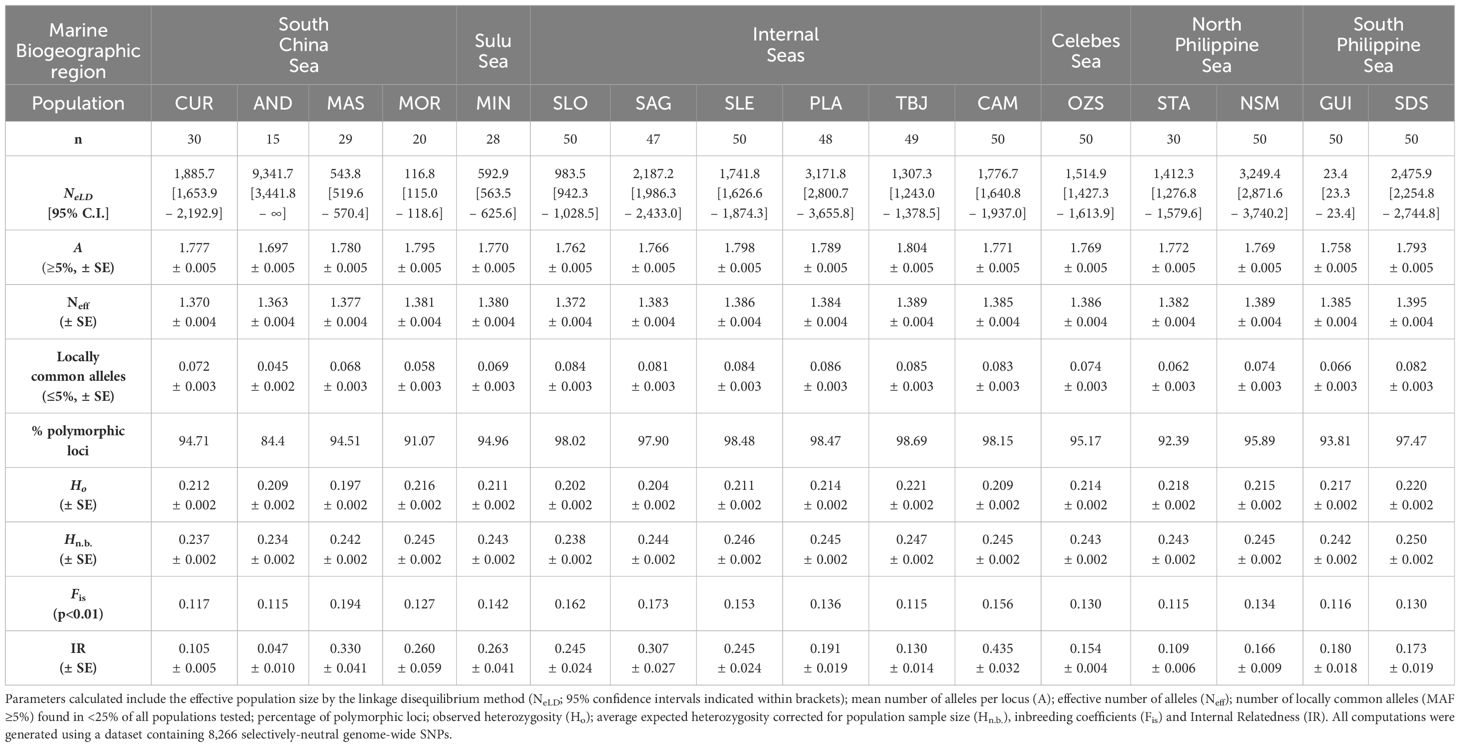
Table 3 Genetic diversity indices computed for the H. scabra populations sampled from each region in the Philippines.
Estimates of mean numbers of alleles per locus (A) were largely uniform among all sixteen sites, ranging from A=1.758 at GUI to A=1.804 at TBJ, with the exception of AND, which recorded the lowest value of A=1.697. Similar patterns were evident in the mean effective number of alleles per population (Neff=1.370–1.389), again with the exception of AND where Neff=1.363. Numbers of locally common alleles (<25% of all populations) varied by region, with a range of 0.074–0.086 detected at nine populations sampled from central regions (Eastern Visayas, Western Visayas) and Mindanao, with the exception of GUI (0.066). The lowest numbers of locally common alleles were detected in populations from Luzon and Mindoro (range=0.045–0.072), with the lowest values recorded at AND (0.045), MOR (0.058) and STA (0.062). Percentages of polymorphic loci remained above 94.5% at all sites (range=94.5–98.7% across thirteen locations) with the exception of three Luzon region sites; where values of 84.4, 91.1 and 92.4% were observed at AND, MOR and STA, respectively. No private alleles were detected in any populations.
Patterns in observed and expected heterozygosity were largely uniform (range of Ho=0.211–0.221) across all except for five sites; MAS, AND, SLO, SAG, and CAM. The lowest observed cf. expected heterozygosity was recorded at MAS (Ho=0.197, Hnb=0.242), followed by the two Western Visayan sites (SLO: Ho=0.202, Hnb=0.238 and SAG: Ho=0.204, Hnb=0.244). Values obtained for AND (Ho=0.209, Hnb=0.234) and CAM (Ho=0.209, Hnb=0.245) were identical for Ho. All values computed for Ho were lower than expectation, suggesting that heterozygote excess was not detected at any site. Inbreeding coefficient (Fis) values at the majority of sites (n=11) ranged from 0.115–0.142, with five sites exhibiting the highest values. These sites included MAS (Fis=0.194), SLO (Fis=0.162), SAG (Fis=0.173), SLE (Fis=0.153) and CAM (Fis=0.156). Mean internal relatedness (IR) values with the exception of AND (IR=0.047) were all highly positive (IR range=0.105–0.435, n=15), suggesting higher levels of relatedness among individuals at these locations. The comparatively low IR detected at AND is suggestive of the presence of individuals descended from unrelated parents, perhaps due to the influence of sea ranching activities from hatchery-produced juvenile releases. The highest levels of IR were detected at CAM, MAS and SAG (IR=0.435, 0.330 and 0.307, respectively), followed by intermediate levels at MIN, MOR, SLE and SLO (IR=0.263, 0.260, 0.245, 0.245, respectively).
Considered together, these data highlight small but measurable reductions in allelic diversity with higher levels of internal relatedness at insular sites (e.g. CAM, SLE, SLO, SAG, MIN, MAS and MOR).
Simulations of hydrodynamic particle dispersal revealed directional patterns of surface current movement patterns, which were primarily region-specific (Figure 6; Supplementary Data 1). Along the eastern seaboard of the Philippines, the North Equatorial Current bifurcates into northern and southern arms, generating the Kurushio Current which travels north along the eastern Luzon coastline up towards the Babuyan Islands and Taiwan; and the Mindanao Current which turns south past Samar Island and flows along the eastern and southern coastlines of Mindanao into the Celebes Sea. Simulations demonstrate the northern bifurcation transported particles from NSM towards STA, supporting connectivity detected in genetic data between these sites. An anticlockwise gyre south of Catanduanes Island and north of the northern Samar coastline advected particles dispersed from NSM westward through the San Bernadino Strait.
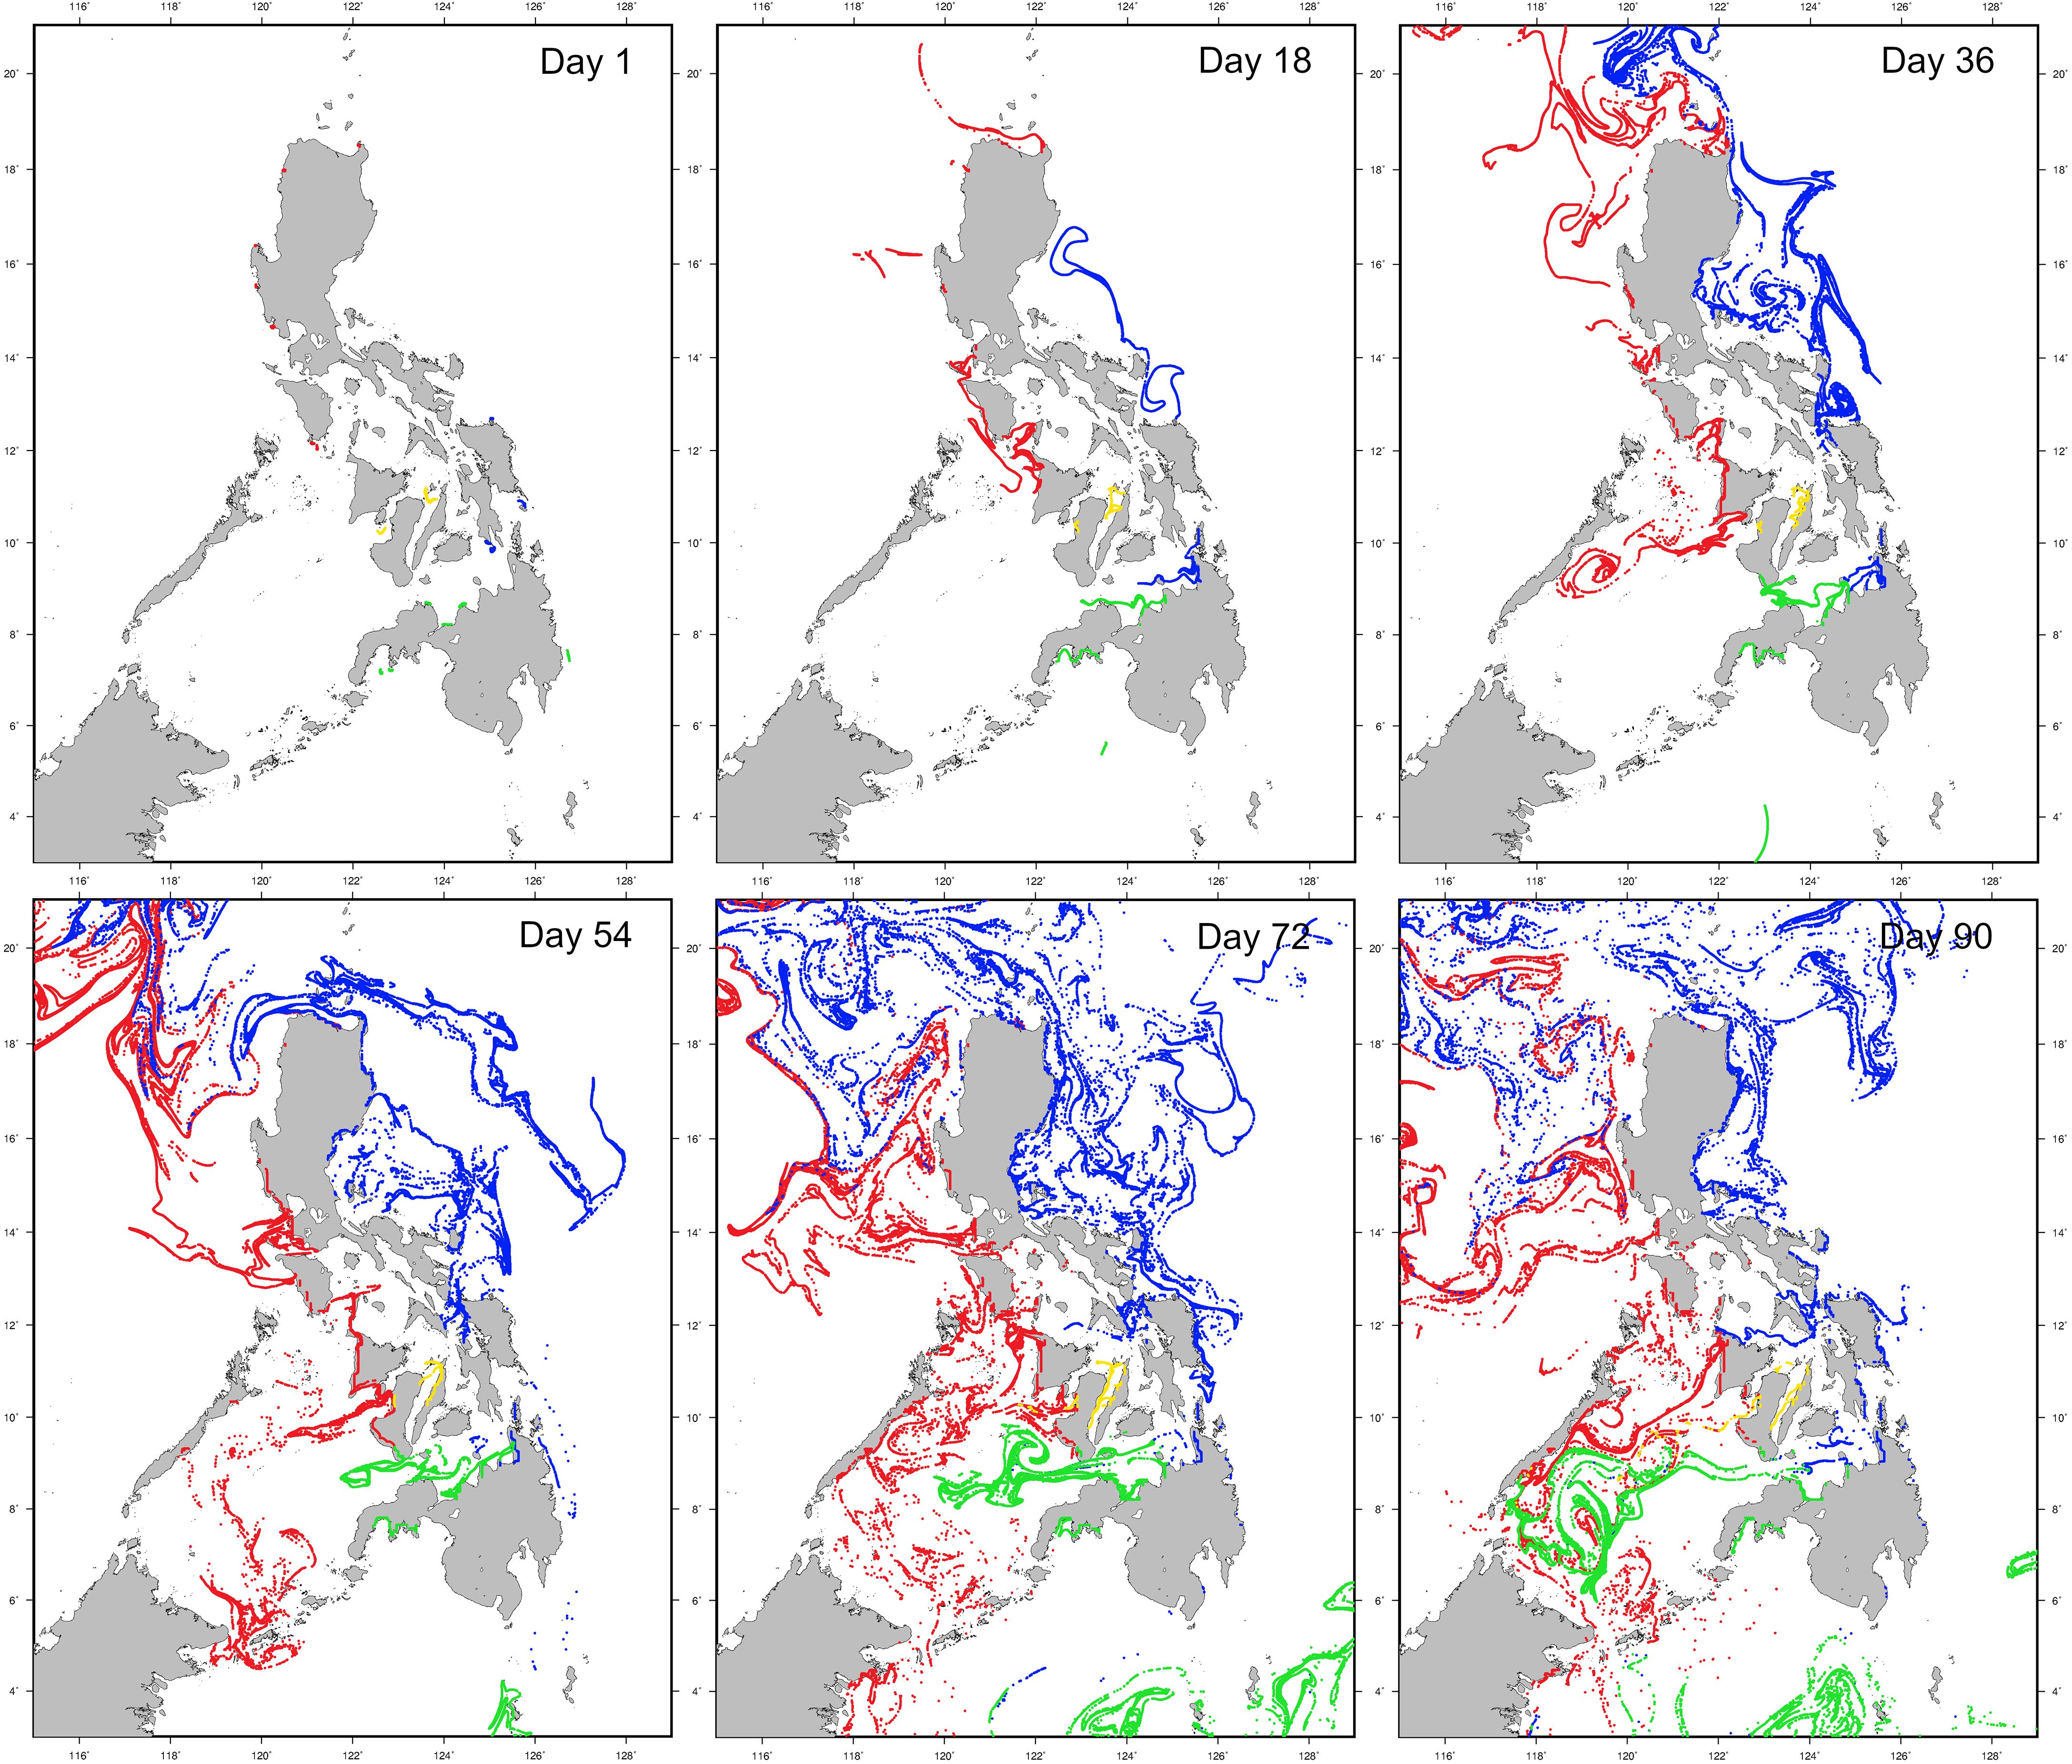
Figure 6 Hydrodynamic particle dispersal simulation results over the peak spawning period (August-November) for H. scabra in the Philippines. Dispersal simulation progressions are shown for days 1, 18, 36, 54, 72 and 90 respectively for each site. Regional colour codes for particle seed sites are as follows; red: North Philippine Sea (STA only) and South China Sea sites (CUR, AND, MAS, MOR and MIN); blue: North and South Philippine Seas (NSM, GUI, and SLE); yellow: Internal Seas (SLO and SAG) and green: Bohol, South Philippine and Celebes Seas (PLA, CAM, TBJ, SDS, and OZS). An animation of this simulation is available in Supplementary Data 1.
Dispersal from GUI occurred in a southerly direction through the Leyte Gulf and into the Surigao Strait, supporting limited genetic connectivity with SLE. A small proportion of particles dispersed from NSM travelled southward, supporting connectivity with GUI, and to a lesser extent SDS. Particles seeded at SDS were transported southwards by the Mindanao Current past the Davao Gulf into the Celebes Sea, where they circulated in a clockwise gyre. Particle dispersal from OZS was restricted, with transportation occurring locally along coastlines, rather than into open water westwards towards Sibugay Bay and eastwards towards Igat Bay. Dispersal from the northern Mindanao sites of TBJ, CAM and PLA occurred in a westward direction into the Sulu Sea, with high levels of admixture among these locations in the Bohol Sea, while particles seeded at SAG and SLO dispersed in a south-westerly direction, via the Tañon and Guimaras Straits respectively, with only the latter advecting into the Panay Gulf and ultimately the Sulu Sea.
In the Luzon region, particles seeded at STA were transported north towards the Babuyan Islands in the Luzon Strait and further into the South China Sea by the Kuroshio Current, preventing admixture with western Luzon sites. Dispersal from CUR, AND, MAS and MOR followed a similar pattern, with advection of the majority of particles westwards into the South China Sea in several turbulent eddies. Limited connectivity was evident however, particularly between MAS and MOR, but to a lesser degree between CUR and AND, perhaps given their more peninsular locations and smaller-scale circulation patterns along the northern Luzon coastal which may limit dispersal along an otherwise contiguous coastline. Particles released at MOR and MIN were transported southward by the South China Sea throughflow current into the Sulu Sea, with admixture in an anticlockwise gyre with northern Mindanao particles was evident. Collectively, particle dispersal simulations between South China, Sulu and Internal Seas sites are concordant with levels of connectivity discovered in the genetic data, along with connectivity between the eastern seaboard sites of STA, NSM, GUI and SDS.
Results of an archipelago-wide, high-resolution, population genomic audit of wild Philippine sandfish are reported here, which resolve fine-scale genetic structure and population connectivity of this valuable echinoderm across the archipelago. Patterns of putatively adaptive genetic structure are also outlined for the first time, along with data on genomic diversity, relatedness, demographic history and gene flow. These data provide an important update to and complement an earlier baseline study by Ravago-Gotanco and Kim (2019), which collectively will be vital for guiding fishery management of wild stocks, direct conservation measures and inform mariculture initiatives for both restocking and the BDM trade.
Shallow but significant genetic structure at neutral markers was identified across the 16 sites at which H. scabra were sampled, with populations segregating into four broad groups overall. Concordant with the findings of Ravago-Gotanco and Kim (2019), sandfish in the Philippines do not constitute a single genetic stock, but are separated by biogeographic region along the coastlines of: (1) the Celebes Sea, (2) North and (3) South Philippine Seas, (4) Sulu Sea and (5) South China Sea together with Internal Seas. While these larger groups were consistently resolved across all methods employed to examine genetic structure (Figures 1, 2), fine-scale within-biogeographic region genetic structuring was also evident at both selectively-neutral and putatively adaptive loci.
At neutral markers (8,266 SNPs), while the 16 sites sampled resolved four broad groups (Figure 1B), a total of seven genetic stocks are apparent within these divisions (Figures 2B, D, F, 5): (1) CUR, AND, MAS; (2) MOR, MIN, SLO; (3) SAG, SLE, PLA, CAM, TBJ; (4) STA, NSM; (5) GUI; (6) SDS and (7) OZS. At putatively adaptive loci (117 SNPs), these groups coalesce into six units (Figures 2C, E, G): (1) CUR, AND, MAS; (2) MOR, MIN, SLO, SAG, PLA, CAM, TBJ; (3) STA, NSM; (4) GUI; (5) SLE, SDS and (6) OZS. Adaptive divergence between populations arises due to selective forces operating on a subset of outlier loci which increases mean fitness in their local environment, compared to other environments. Adaptive variation is also influenced by the microevolutionary forces of genetic drift, migration and mutation (Benestan, 2020). The sole discrepancy between the number of genetic units detected here at selectively-neutral (n=7) vs. putatively adaptive (n=6) loci is between SLE and SDS, and may be attributed to the close proximity of these sites, and a corresponding lack of habitat heterogeneity. At locations where adaptive divergence is evident, those sites are separated by large expanses of open ocean (e.g. OZS vs. all other sites) or are mutually geographically isolated e.g. STA vs. South China Sea sites.
Benestan (2020) proposes the definition of a fishery stock as a “demographically cohesive group of individuals of one species exploited in a specific area”, and a population as a “group of individuals that have similar demographic or genetic characteristics and thus will respond uniquely and independently to fishing”. Consideration of both selectively-neutral and putatively adaptive genetic structure is vital for delineation of conservation and management units (Nosil et al., 2009; Funk et al., 2012), to ensure accurate fishery assessment and administration (Waples and Gaggiotti, 2006; Reiss et al., 2009). Taking into account these guidelines and combining data reported here with the findings of Ravago-Gotanco and Kim (2019), who sampled additional sites in the Sulu Sea (Tawi Tawi, General Santos and the Davao Gulf) and Palawan archipelago (El Nido and Coron); it is likely that at least nine genetic stocks are present in the Philippines. The two Palawan sites of El Nido and Coron which resolved independently (Ravago-Gotanco and Kim, 2019), may be considered discrete genetic units in addition to the seven delineated in the current study.
The presence of population genetic structure in H. scabra has been established by previous studies. Nowland et al. (2017) utilised 8–10 microsatellite loci to examine wild sandfish sampled from 10 sites in Papua New Guinea (PNG) and 2 sites in Northern Australia, and detected differentiation between both Australian and all PNG sites (≥1,000 km apart), as well as between the two Australian locations (~1000 km apart). Other genetic marker types including allozymes (Uthicke and Benzie, 2001; Uthicke and Purcell, 2004), the mitochondrial CO1 gene (Uthicke et al., 2010) and simple sequence repeats (Sembiring et al., 2022) have also been used to investigate sandfish genetic structure at various Indo-Pacific sites (Brown et al., 2022). Uthicke and Benzie (2001) reported the presence of discrete genetic units between northern Australia and the Solomon Islands (~1,600 km apart), while Uthicke and Purcell (2004) also detected genetic structure between populations in Bali, Indonesia; 2 sites in northern Australia (Knocker Bay and Torres Strait); 2 sites in eastern Australia (Upstart and Hervey Bays); 9 sites in New Caledonia and 1 site in the Solomon Islands (located 500 to >4,200 km apart).
Contrastingly, Riquet et al. (2022) found no genetic structure among 4 sites (≤80 km apart) along the northwestern New Caledonian coastline at 9 microsatellite loci. In Fiji, Brown et al. (2022) reported the presence of three genetic stocks at 6,896 selectively-neutral and 186 putatively-adaptive SNPs across ~600 km, and Lal et al. (2021) at 8,725 selectively neutral SNPs reported substantial differentiation between Fiji and San Esteban, the Philippines (pairwise Fst=0.325, ~7,500 km apart). This variability in genetic structure may be explained by potential vs. realised dispersal of H. scabra larvae, as its 14–21 day pelagic larval duration (PLD) permits widespread dispersal over large distances (Altamirano and Rodriguez, 2022; Brown et al., 2024). However, complex geomorphology (as in the Philippines), habitat heterogeneity, ocean current pathways and the availability of suitable habitat for settlement all influence the degree of connectivity, and consequently population divergence and fragmentation (Ravago-Gotanco and Kim, 2019; Brown et al., 2022). Sandfish also have a biphasic settlement process, recruiting from plankton to seagrass leaves first upon completing larval development, and thereafter to sandy substrates where they become deposit feeders (Mercier et al., 2000b; Sinsona and Juinio-Meñez, 2019; Brown et al., 2024). This biological attribute is likely to contribute to the generation and maintenance of genetic structure in this species, as habitats without seagrass may not support recruitment of sandfish larvae, while population expansion may not be possible in areas with poor seagrass coverage.
The overall pattern of genetic structure for sandfish in the Philippines is influenced by geographic distance, variable ocean current-mediated gene flow, source and sink location geography and habitat heterogeneity across the archipelago. A moderate isolation by distance pattern was detected by Mantel Tests (Figure 4), however gene flow among natural populations is directed by the strength and magnitude of larval dispersal via persistent surface ocean currents across coastal peninsular locations with varying rugosity (e.g. small islands and promontories). Population differentiation estimates were expectedly highest between geographically distant sites, e.g. OZS and STA, NSM, GUI (Fst range=0.041–0.045), whereas the majority of remaining pairwise comparisons e.g. Internal Seas sites reflected high levels of admixture (mean Fst=0.008, Table 1). Examination of gene flow patterns (Figure 5) and independent hydrodynamic particle dispersal analyses (Figure 6) support divisions evident in determinations of genetic structure, with high levels of admixture among Internal and Sulu Seas sites (CAM, PLA, TBJ, SLE, SAG, SLO and MIN) and between NSM and STA. Restrictions in dispersal are also apparent between the western Luzon locations of CUR, AND and MAS vs. Internal and Sulu Seas sites.
Studies of genetic structure in other marine organisms occurring in the Philippines have also reported segregation of populations according to marine biogeographic region. Two seagrasses (Cymodocea rotundata and Syringodium isoetifolium) were found to resolve three regional groups: (1) South China Sea, (2) North Philippine Sea and (3) central Philippines (Arriesgado et al., 2016; Kurokochi et al., 2016); and populations of a seagrass-associated rabbitfish (Siganus fuscescens) are segregated into four genetic units in (1) the South China Sea, (2) North Philippine Sea, (3) South Philippine Sea and (4) Sulu with Internal Seas (Ravago-Gotanco and Juinio-Meñez, 2010; Ravago-Gotanco and Kim, 2019). Within-region studies in the Philippines are few, however Mendiola and Ravago-Gotanco (2021) examined Sulu Sea populations of the mud crab Scylla olivacea and discovered weak yet significant genetic structure across 8 sites. These findings differ from results of other studies on marine broadcast spawners which report higher levels of panmixia among populations, including pearl oysters (Lal et al., 2016a), spiny lobster (Al-Breiki et al., 2018) and skipjack tuna (Anderson et al., 2020).
It is noteworthy that Ravago-Gotanco and Kim (2019) detected a pattern of isolation by distance (IBD) in their study considering 13 sites, and this investigation discovered a similar, moderate IBD trend in H. scabra across 16 sites. Ravago-Gotanco and Kim (2019) report strong population differentiation along both east-west and north-south clines, and particularly between Sulu Sea samples (El Nido and Coron) compared against other sites in the Philippines. East-west divergence in genetic structure has been detected in other marine taxa in the Philippines as summarised by Ravago-Gotanco and Kim (2019), which include the damselfish Dascyllus aruanus (Raynal et al., 2014), the giant clams Tridacna crocea, T. maxima and T. squamosa (DeBoer et al., 2014a, b), as well as the seahorse Hippocampus spinosissimus (Lourie et al., 2005). North-south divergence has also been observed in the giant clams T. crocea (Ravago-Gotanco et al., 2007), T. squamosa and T. maxima (DeBoer et al., 2014a, b), and the mottled spinefoot rabbitfish Siganus fuscescens (Ravago-Gotanco and Juinio-Meñez, 2010).
This arrangement of population genetic structure has arisen as a consequence of oceanic circulation patterns, marine basin boundaries, ecological factors and large landmasses in the Philippine archipelago which function as barriers to dispersal. As an example, the island of Luzon and opposing current directions along east vs. west coastlines account for east-west divergence between the South China and North Philippine Seas. Similarly, the presence of the Internal Seas region and bifurcating North Equatorial Current are barriers to dispersal between the eastern coastlines of the major landmasses of Mindanao and Luzon. Ravago-Gotanco and Kim (2019) mention the presence of strong genetic differentiation at a small spatial scale (Fst=0.210, ~120 km distance) between El Nido and Coron in the Palawan archipelago (Sulu Sea), which is attributed to fine-scale oceanic circulation within embayments promoting local larval retention rather than export. Similar separation (Figures 2F, G) was observed between several sites in this study, including NSM and GUI (Fst=0.02, ~215 km apart) which lie on opposing sides of the North Equatorial Current bifurcation at ~12–14° N latitude; and GUI and SLE (Fst=0.024, ~140 km apart) with similar influences maintaining genetic divergence.
Independent hydrodynamic particle dispersal simulation supported patterns of connectivity and larval transport pathways evident in genetic structure across the Philippines. Concordant with genetic analyses, higher levels of connectivity are apparent among central populations (e.g. Internal Seas region) relative to peripheral locations (e.g. North and South Philippine Seas). While areas of suitable contiguous habitat for sandfish (i.e., seagrass beds and sandy/muddy substrates) are widespread across the Philippine archipelago, they are separated by stretches of deep water, particularly towards island archipelagos, such as in the Sulu and Celebes Seas. The particle model utilised here (DisperGPU) is relatively rudimentary in comparison to newer toolsets such as the Connectivity Modelling System (Paris et al., 2013) and InfoMap (Bohlin et al., 2014) utilised by Deauna et al. (2021), which modelled larval retention, self-recruitment, settlement success and sink diversity in two valuable sea cucumbers (H. scabra and Stichopus cf. horrens) in the western central Philippines. While DisperGPU is useful for verification and comparison of connectivity detected in genomic data, a primary limitation is that larval competency behaviour such as homing behaviour and “survival” cannot be simulated. It is recommended that future fine-scale regional studies examining site selection for sea ranches or broodstock collection locations, utilise models incorporating competency behaviour for evaluating potential larval admixture between captive and wild populations.
Estimates of genomic diversity were largely consistent among 15 sites surveyed, with the exception of AND which exhibited a slightly lower mean number of alleles per locus (A=1.697) compared to other sites (range A=1.758–1.804, Table 3). This latter observation may be a result of extensive sea ranching activities in and around AND, which utilise hatchery-produced juveniles (Juinio-Meñez et al., 2017) that are now known to be less genetically diverse compared to wild conspecifics (Riquet et al., 2022; Brown et al., 2024). Within biogeographic regions, sites sampled along eastern coastlines (Eastern Visayas and Mindanao) were slightly more genetically diverse (observed heterozygosity, mean numbers of alleles, locally common alleles and percentages of polymorphic loci) compared to western sites (Luzon and Mindoro). This trend is consistent with expectations under the core-periphery hypothesis (CPH), which predicts that populations present in the core region of a species’ distribution maintain higher genetic diversity relative to peripheral locations where suitable habitat is less available, selection pressures are more intense, population fragmentation is greater and population connectivity weaker (Brussard, 1984; Eckert et al., 2008). Similar observations are reported for H. scabra by Ravago-Gotanco and Kim (2019) in their earlier study in the Philippines and Brown et al. (2022) at six sites in Fiji.
Ravago-Gotanco and Kim (2019) mention that Philippine samples exhibited substantially higher allelic richness and heterozygosity relative to sandfish sampled in northern Australia and PNG by Nowland et al. (2017), assessed using a common suite of 8 microsatellite loci. PNG and northern Australia are located at the southern limits of the known species distribution of H. scabra, relative to the central region of the coral triangle in the Pacific basin, and an overall decrease in genetic diversity along this north-south cline is consistent with CPH predictions. Erosion of genetic diversity between central vs. peripheral populations has been recorded for other marine broadcast spawners, including the black-lip pearl oyster Pinctada margaritifera (Lal et al., 2017), silver-lip pearl oyster Pinctada maxima (Lind et al., 2007), three seagrasses (Thalassia hemprichii, Enhalus acoroides and Cymodocea serrulata: Nakajima et al. (2014); Arriesgado et al. (2016); Hernawan et al. (2017)), Pacific cod Gadus macrocephalus (Fisher et al., 2022) and neon damselfish Pomacentrus coelestis (Liggins et al., 2015).
Higher levels of genetic diversity among reef-dwelling species in the coral triangle region occupying core habitats such as the Philippines and Indonesia, relative to peripheral areas (e.g. southern, northern and eastern Pacific basin margins), has been attributed to core regions functioning as stronger larval sinks, while marginal areas act as sources (Ravago-Gotanco and Kim, 2019). These dynamics have been supported with biophysical dispersal model simulations of larval transport (Kool et al., 2011; Lal et al., 2017; Baetscher et al., 2019; Deauna et al., 2021), however there is a need for distribution-wide information from future investigations to better understand both historical and contemporary genomic and demographic drivers of genetic structure and diversity. This is particularly important for H. scabra, given its potential vs. realised dispersal limits and adult habitat preferences. Ravago-Gotanco and Kim (2019) mention that trends in genetic diversity observed in their study were consistent with CPH predictions, with a non-significant gradient of decreasing genetic diversity from central to peripheral populations, coupled with increased genetic differentiation and restricted gene flow. These observations are concordant with results presented here, with genetic diversity metrics highest in the central regions of the Internal Seas, and lowest in the peripheral regions of the South China Sea, Mindoro and Philippine Seas (Table 3).
Effective population sizes (NeLD) remained >1,000 for the majority of sites sampled (with the exception of five locations), suggesting these populations are less likely to become extirpated in the immediate future as a result of inbreeding depression, as their Ne values remain above the critical threshold of Ne > 100; however an Ne ≥ 1000 is required for retention of evolutionary potential (Frankham et al., 2014; Frankham, 2015). For the five sites which recorded lower values: GUI, MOR, MIN, MAS and SLO (NeLD=23.4, 116.8, 592.9, 543.8 and 983.5, respectively), data suggest the presence of contemporary genetic bottlenecks at these locations, in particular GUI and MOR, which will require conservation measures to arrest further Ne declines. A summary of historical collection and processing locations in the Philippines summarised by Choo (2008a) since the late 1970s outline the key locations in the South China, Sulu and Internal Seas regions. These centres of the BDM trade include sites in Pangasinan, La Union, Cagayan, Zambales, Quezon, Batangas, Cebu, Negros Occidental, Surigao del Norte, South Cotabato, Sulu, southern Palawan, Misamis Occidental, West Central Visayas, northern and southern Mindanao and the Leyte Gulf.
The development and application of genome-wide SNPs for examination of genomic diversity and structure in H. scabra has been relatively recent, however the few studies reported thus far have offered valuable insights. Assessment of a suitable next-generation sequencing approach (DArTseq) for sandfish was reported by Lal et al. (2021), and used to investigate population genomic diversity and structure in Fiji (Brown et al., 2022) and the Philippines (this study). Genome-wide SNPs were also employed to examine loss of genetic diversity in hatchery-produced sandfish (Brown et al., 2024), examine growth rate variability (Ordoñez et al., 2021) and assign populations of origin for traceability studies (Ordoñez and Ravago-Gotanco, 2024).
The incorporation of genomic data into fishery resource management plans provides vital information on stock health, but particularly the number and spatial extent of stocks, the amount of genetic diversity present in populations, connectivity between neighbouring stocks, and the presence of local adaptation (Sweijd et al., 2000; Baetscher et al., 2019; Benestan, 2020). For heavily exploited taxa (such as sea cucumbers), genetic information can guide restocking efforts to recover depleted populations, and inform mariculture efforts for hatchery production (Brown et al., 2024).
Population genomic analyses reported here, along with the earlier findings of Ravago-Gotanco and Kim (2019) resolved a total of nine genetic stocks across the Philippine archipelago. These divisions include: (1) CUR, AND, MAS; (2) MOR, MIN, SLO, SAG, PLA, CAM, TBJ; (3) STA, NSM; (4) GUI; (5) SLE; (6) SDS; (7) OZS (this study), along with (8) El Nido and (9) Coron in the Palawan region (Ravago-Gotanco and Kim, 2019). This pattern of genetic structure is consistent with biogeographic region divisions: (1) Celebes Sea, (2) North and South Philippine Seas and (3) South China Sea together with Internal Seas and (4) Sulu Sea (the Palawan populations of El Nido and Coron). The presence of significant genetic structure in H. scabra discovered here is noteworthy, given that it persists in the presence of high gene flow, particularly in the Internal Seas region. Evidence of IBD structuring is also present, along with decreasing genetic diversity among peripheral populations compared to central sites. Considering these data, the nine genetic stocks reported here (delineated on the basis of both selectively-neutral and putatively adaptive markers and oceanographic dispersal modelling), may be considered as independent management units.
Delineation of management units for H. scabra in the Philippines that accurately reflect stock structure is a foundational step for accurate management of individual stocks, conservation of depleted or at-risk populations and implementation of sustainable exploitation measures. Given the broad geographic expanse of the Philippine archipelago, a regional approach to sandfish stock management is required. Management units identified here and by Ravago-Gotanco and Kim (2019) provide a foundation on which stock monitoring, harvest limits and fishery regulation can be based within the major biogeographic regions of the Philippines. These findings notwithstanding, further within-region investigations of stock structure and genetic diversity are required, particularly within areas that were not able to be sampled during this study. The southern Mindanao coastline, eastern Luzon and the Palawan archipelago are examples of locations which require further fine-scale geographical sampling, to elucidate regions where strong differentiation may persist across relatively small spatial scales, such as El Nido and Coron as outlined by Ravago-Gotanco and Kim (2019).
Preservation of genetic diversity by limiting exploitation of already bottlenecked populations is necessary, along with maintaining genetic diversity in natural populations which are broodstock source locations for mariculture. Genetic pollution of wild populations is also an important consideration, as community-based sea ranching constitutes a large proportion of grow-out operations in the Philippines, and will substantially expand in the future (Juinio-Meñez et al., 2012, 2017). Sea ranching utilises a “put, grow, and take” approach, where hatchery produced juveniles are released into unenclosed marine environments for harvest at a larger size (Lorenzen et al., 2010; Juinio-Meñez et al., 2013), and thereby potentially become admixed with wild individuals. It has been established that viable spawning populations may become established within sea ranches (Juinio-Meñez et al., 2013), and consequent impacts on natural populations over successive generations may occur. Deleterious effects of admixture with wild individuals are more likely under circumstances where natural stocks have reduced genetic diversity and are undergoing depensation, are strongly genetically differentiated from neighbouring demes and/or locally adapted (Lorenzen et al., 2012; Ravago-Gotanco and Kim, 2019). It is therefore important to ensure hatchery produced juveniles are as genetically diverse as possible, and ideally produced from locally-sourced broodstock.
A large proportion of sandfish for the BDM trade in the Philippines currently originates from capture production (Choo, 2008a), however given present sustained exploitation levels, the wild resource is likely to become increasingly scarce in the future. Culture-based production offers the capacity to supplement and/or increase the supply of premium-grade BDM for trade, and generate seedstock for the replenishment and recovery of wild populations. Following pilot research to develop hatchery systems in 2001 (Gamboa and Juinio-Meñez, 2003; Gamboa et al., 2004), more recent developments in the Philippines have been geared towards development of low-cost ocean nursery systems for rearing hatchery-produced juveniles under coastal community management (Juinio-Meñez et al., 2012, 2017; Altamirano and Noran-Baylon, 2020; Altamirano et al., 2021; de la Torre-de la Cruz et al., 2023), community-based sea-ranching operations and multi-stakeholder production clusters (Juinio-Meñez et al., 2013, 2017; Villamor et al., 2021).
While artificial propagation of sandfish offers several advantages for supplementing the BDM trade, caution must be exercised when hatchery production is considered for recovery of depleted and/or extirpated populations, during site selection for sourcing wild broodstock and the proximity of juvenile release sites to habitats supporting wild individuals. The accumulation of genetic diversity in wild populations can require up to thousands of years, which unfortunately may be lost over the span of a single generation in captive populations with improper breeding and rearing management (Porta et al., 2007; Brown et al., 2024). Maintenance of genetic diversity is a key goal in culture-based production, as genetically diverse populations have higher fitness (e.g. greater resilience to environmental perturbations and disease outbreaks), and respond positively in selective breeding programmes (Hughes et al., 2019). The majority of aquaculture operations today are still reliant upon wild populations as broodstock sources (Frost et al., 2007), which is the case for sandfish (Purcell et al., 2012b; Hamel et al., 2022), with few exceptions such as operations in Vietnam (Pitt and Duy, 2004).
Recent research has established that substantial loss of genetic diversity occurs during hatchery production, resulting from skewed parental contributions (≤26% of parent pool contributing), variable family sizes (13–16 families resulting from 79 broodstock) and attritive losses throughout larval development (Brown et al., 2024). Similarly, five batches of hatchery-produced cohorts in New Caledonia were found to suffer from reductions in effective population size, with higher levels of relatedness and inbreeding among individuals, as well as signatures of genetic drift apparent over the span of one generation (Riquet et al., 2022). Further work is required to optimise hatchery production, to increase retention of genetic diversity and family sizes among juvenile cohorts. Brown et al. (2024) mention that broodstock sourced from genetically diverse wild populations, pedigree tracking in broodstock management and investigation of batch spawning methods may address these concerns, however these measures require further testing and verification to assess their efficacy.
Given the importance of sea ranching operations for growing sandfish juveniles in the Philippines, the delineation of management units presented here and earlier by Ravago-Gotanco and Kim (2019) will have high utility for guiding site selection and management of sea ranches, as sandfish mariculture expands in the country. Therefore, based on the findings of these two studies, we recommend the following for mariculture and translocation management of sandfish in the Philippines:
1. Hatcheries source wild broodstock from within their local biogeographic region, and from populations which have been assessed to be sufficiently genetically diverse.
2. Broodstock and hatchery-produced juvenile translocations be limited to within biogeographic regions and genetic stocks.
3. Careful consideration of hatchery-produced juvenile releases in areas proximate to wild sandfish habitat subject to fine-scale demographic and population genomic surveys.
4. Restocking of depleted wild populations using hatchery production be contingent upon fine-scale genomic assessments of target populations and source broodstock.
This study presents a country-wide update on the fine-scale genetic structure and diversity of H. scabra across the Philippine archipelago from an initial report by Ravago-Gotanco and Kim (2019), and for the first time additional information on genome-wide local adaptation and population connectivity assessed using an independent hydrodynamic particle dispersal model.
The overall pattern of genetic structure for H. scabra in the Philippines is complex, with high connectivity among central and proximate populations, and greater differentiation and isolation among peripheral locations. This pattern is generated and maintained by geographic distance, realised vs. potential larval dispersal, species-specific larval development and settlement attributes, variable ocean current-mediated gene flow, source and sink location geography and habitat heterogeneity across the archipelago. A total of nine genetic stocks based on both studies are identified along with corresponding management units, and recommendations made for the development of fishery, mariculture, germplasm and translocation management policies for both wild and captive sandfish resources. Data reported here will have high utility for conservation of sandfish stocks which have experienced high fishing pressures, inform restocking of depleted populations and guide expansion of sea ranching operations as sandfish mariculture develops in the country. The implementation of the DArTseq platform for high-resolution population genomic analyses demonstrates potential for application to other sea cucumber taxa, and other regions involved in the global bêche-de-mer trade.
Genotypic data for sandfish sampled and sequenced during this study are available as Supplementary Data files 2, 3 for selectively neutral and putatively adaptive markers, respectively. Data have been deposited in the OSF repository, available at https://doi.org/10.17605/OSF.IO/BZ98K.
The animal study was approved by Philippines’ Department of Agriculture, Bureau of Fisheries and Aquatic Resources (DA-BFAR: ECC No. 2020-0094). The study was conducted in accordance with the local legislation and institutional requirements.
ML: Conceptualization, Data curation, Formal analysis, Investigation, Methodology, Project administration, Resources, Software, Supervision, Validation, Visualization, Writing – original draft, Writing – review & editing. DM: Conceptualization, Data curation, Investigation, Methodology, Project administration, Resources, Supervision, Validation, Writing – original draft, Writing – review & editing. MJ: Conceptualization, Funding acquisition, Methodology, Project administration, Resources, Supervision, Writing – original draft, Writing – review & editing. JA: Funding acquisition, Methodology, Resources, Supervision, Writing – original draft, Writing – review & editing. RN: Methodology, Resources, Writing – original draft, Writing – review & editing. Md: Funding acquisition, Methodology, Resources, Supervision, Writing – original draft, Writing – review & editing. JV: Methodology, Resources, Writing – original draft, Writing – review & editing. JG: Methodology, Resources, Writing – original draft, Writing – review & editing. WU: Funding acquisition, Methodology, Resources, Supervision, Writing – original draft, Writing – review & editing. HM: Methodology, Resources, Writing – original draft, Writing – review & editing. PS: Conceptualization, Funding acquisition, Project administration, Resources, Supervision, Writing – original draft, Writing – review & editing. RR: Conceptualization, Formal analysis, Funding acquisition, Investigation, Methodology, Project administration, Resources, Software, Supervision, Validation, Visualization, Writing – original draft, Writing – review & editing.
The author(s) declare financial support was received for the research, authorship, and/or publication of this article. Australian Centre for International Agriculture Research (ACIAR) project FIS/2016/122: “Increasing technical skills supporting community-based sea cucumber production in Vietnam and the Philippines”. Philippine Council for Agriculture, Aquatic and Natural Resources Research and Development of the Department of Science and Technology (DOST-PCAARRD: Project Numbers QSR-MR-CUC.02.01 and QSR-MR-CUC.02.02).
This study was supported by the Australian Centre for International Agriculture Research (ACIAR) as part of ACIAR project FIS/2016/122: “Increasing technical skills supporting community-based sea cucumber production in Vietnam and the Philippines” led by PCS at UniSC. ACIAR had no direct involvement in the study design, collection, analysis and interpretation of the data, nor the decision to submit this article for publication. Additional support was provided by the Philippine Council for Agriculture, Aquatic and Natural Resources Research and Development of the Department of Science and Technology (DOST-PCAARRD) led by MJ-M and RR-G at UP MSI, particularly for tissue sample collection at Western Luzon sites. We acknowledge the assistance and support provided by the Philippines’ Department of Agriculture – Bureau of Fisheries and Aquatic Resources (DA-BFAR) and University of the Philippines Marine Science Institute (UP MSI) for submission of DNA extracts for sequencing.
The authors declare that the research was conducted in the absence of any commercial or financial relationships that could be construed as a potential conflict of interest.
All claims expressed in this article are solely those of the authors and do not necessarily represent those of their affiliated organizations, or those of the publisher, the editors and the reviewers. Any product that may be evaluated in this article, or claim that may be made by its manufacturer, is not guaranteed or endorsed by the publisher.
The Supplementary Material for this article can be found online at: https://www.frontiersin.org/articles/10.3389/fmars.2024.1396016/full#supplementary-material
Supplementary Figure 1 | Pairwise population differentiation heatmap computed for 644 individuals of H. scabra sampled at 16 sites and 5 regions in the Philippines. Pairwise Fst values (Weir and Cockerham’s 1984 unbiased method) were computed using 8,266 genome wide SNPs, with the heatmap and dendrogram to illustrate hierarchical clustering generated using the heatmap.2 function in the R package gplot v3.1.3.1 (Warnes et al., 2020).
Supplementary Figure 2 | Proportional ancestral contributions for 644 individuals of H. scabra sampled at 16 sites and 5 regions in the Philippines. Contributions across individuals are visualised with an ADMIXTURE (Alexander et al., 2009) barplot at a k=7 threshold, generated using 8,266 genome-wide SNPs.
Supplementary Data Sheet 1 | Hydrodynamic particle dispersal simulation animation over the peak spawning period (August-November) for H. scabra in the Philippines (.gif).
Supplementary Data Sheet 2 | Genotypic data. Genotypes of 644 individuals of H. scabra at 8,266 selectively neutral genome-wide SNPs are included in a standard STRUCTURE format.
Supplementary Data Sheet 3 | Genotypic data. Genotypes of 644 individuals of H. scabra at 117 putatively adaptive genome-wide SNPs are included in a standard STRUCTURE format.
Addison J. A., Hart M. W. (2005). Spawning, copulation and inbreeding coefficients in marine invertebrates. Biol. Lett. 1, 450–453. doi: 10.1098/rsbl.2005.0353
Agudo N. (2006). Sandfish hatchery techniques (Noumea, New Caledonia: Secretariat of the Pacific Community).
Al-Breiki R. D., Kjeldsen S. R., Afzal H., Al Hinai M. S., Zenger K. R., Jerry D. R., et al. (2018). Genome-wide SNP analyses reveal high gene flow and signatures of local adaptation among the scalloped spiny lobster (Panulirus homarus) along the Omani coastline. BMC Genomics 19, 690. doi: 10.1186/s12864-018-5044-8
Alexander D. H., Novembre J., Lange K. (2009). Fast model-based estimation of ancestry in unrelated individuals. Genome Res. 19 (9), 1655–1664. doi: 10.1101/gr.094052.109
Alho J. S., Välimäki K., Merilä J. (2010). Rhh: an R extension for estimating multilocus heterozygosity and heterozygosity–heterozygosity correlation. Mol. Ecol. Resour. 10, 720–722. doi: 10.1111/j.1755-0998.2010.02830.x
Aliño P. M., Gomez E. D. (1994). “Philippine coral reef conservation: its significance to the South China Sea,” in Development and Conservation in the Asia-Pacific Region. Proceedings of the Regional Conference of the East-West Center Association. Eds. Yamamoto K., Ishijima S., Sakihara S., Taira H., Shimabukuro Z., Teruya F., Nishihira F. (East-West Center Association, Honolulu, Hawaii, United States of America).
Allen Coral Atlas (2022). Imagery, maps and monitoring of the world's tropical coral reefs [Online]. (Allen Coral Atlas Partnership and Arizona State University).
Altamirano J. P. (2017). “Issues and challenges in sustainable development of fisheries of the Southeast Asian Region: Marine species under international concern: SEA CUCUMBERS,” in The Southeast Asian State of Fisheries and Aquaculture 2017 (SEAFDEC Secretariat, Thailand). SEAFDEC (ed.).
Altamirano J. P., Noran-Baylon R. D. (2020). Nursery culture of sandfish Holothuria scabra in sea-based floating hapa nets: Effects of initial stocking density, size grading and net replacement frequency. Aquaculture 526, 735379. doi: 10.1016/j.aquaculture.2020.735379
Altamirano J. P., Rodriguez J. J.C. (2022). Hatchery production of sea cucumbers (sandfish Holothuria scabra) (Tigbauan, Iloilo, Philippines: Southeast Asian Fisheries Development Center: Aquaculture Department (SEAFDEC/AQD) and Australian Centre for International Agricultural Research).
Altamirano J. P., Sinsona M. J., Caasi O. J. C., de la Torre-de la Cruz M., Uy W., Noran-Baylon R., et al. (2021). Factors affecting the spatio-temporal variability in the production of sandfish Holothuria scabra juveniles in floating hapa ocean nursery systems. Aquaculture 541, 736743. doi: 10.1016/j.aquaculture.2021.736743
Amos W., Wilmer J. W., Fullard K., Burg T. M., Croxall J. P., Bloch D., et al. (2001). The influence of parental relatedness on reproductive success. Proc. R. Soc. B: Biol. Sci. 268, 2021–2027. doi: 10.1098/rspb.2001.1751
Anderson G., Lal M., Stockwell B., Hampton J., Smith N., Nicol S., et al. (2020). No population genetic structure of skipjack tuna (Katsuwonus pelamis) in the tropical western and central pacific assessed using single nucleotide polymorphisms. Front. Mar. Sci. 7. doi: 10.3389/fmars.2020.570760
Anderson S. C., Flemming J. M., Watson R., Lotze H. K. (2011). Serial exploitation of global sea cucumber fisheries. Fish Fisheries 12, 317–339. doi: 10.1111/j.1467-2979.2010.00397.x
Arriesgado D. M., Kurokochi H., Nakajima Y., Matsuki Y., Uy W. H., Fortes M. D., et al. (2016). Population genetic diversity and structure of a dominant tropical seagrass, Cymodocea rotundata, in the Western Pacific region. Mar. Ecol. 37, 786–800. doi: 10.1111/maec.12350
Baetscher D. S., Anderson E. C., Gilbert-Horvath E. A., Malone D. P., Saarman E. T., Carr M. H., et al. (2019). Dispersal of a nearshore marine fish connects marine reserves and adjacent fished areas along an open coast. Mol. Ecol. 28, 1611–1623. doi: 10.1111/mec.15044
Battaglene S. C. (1999). Culture of tropical sea cucumbers for stock restoration and enhancement. Naga ICLARM Q. 22, 4–11.
Battaglene S. C., Seymour J. E., Ramofafia C. (1999). Survival and growth of cultured juvenile sea cucumbers, Holothuria scabra. Aquaculture 178, 293–322. doi: 10.1016/S0044-8486(99)00130-1
Battaglene S. C., Seymour J. E., Ramofafia C., Lane I. (2002). Spawning induction of three tropical sea cucumbers, Holothuria scabra, H. fuscogilva and Actinopyga mauritiana. Aquaculture 207, 29–47. doi: 10.1016/S0044-8486(01)00725-6
Belkhir K., Borsa P., Chikhi L., Raufaste N., Bonhomme F. (1996) GENETIX 4.05, logiciel sous Windows TM pour la génétique des populations (Montpellier, France: Université de Montpellier II). Available at: http://www.genetix.univ-montp2.fr/genetix/intro.htm (Accessed 1996–2004). Laboratoire Génome, Populations, Interactions, CNRS UMR 5171.
Benestan L. (2020). “Population genomics applied to fishery management and conservation,” in Population Genomics: Marine Organisms. Eds. Oleksiak M. F., Rajora O. P. (Springer International Publishing, Cham).
Bohlin L., Edler D., Lancichinetti A., Rosvall M. (2014). “Community detection and visualization of networks with the map equation framework,” in Measuring Scholarly Impact: Methods and Practice. Eds. Ding Y., Rousseau R., Wolfram D. (Springer International Publishing, Cham).
Brown K. T., Southgate P. C., Hewavitharane C. A., Lal M. M. (2022). Saving the sea cucumbers: Using population genomic tools to inform fishery and conservation management of the Fijian sandfish Holothuria (Metriatyla) scabra. PloS One 17, e0274245. doi: 10.1371/journal.pone.0274245
Brown K. T., Southgate P. C., Loganimoce E. M., Kaure T., Stockwell B., Lal M. M. (2024). Sandfish generations: Loss of genetic diversity due to hatchery practices in the sea cucumber Holothuria (Metriatyla) scabra. Aquaculture 578, 740048. doi: 10.1016/j.aquaculture.2023.740048
Brussard P. F. (1984). Geographic patterns and environmental gradients: the central-marginal model in Drosophila revisited. Annu. Rev. Ecol. Systematics 15, 25–64. doi: 10.1146/annurev.es.15.110184.000325
Bureau of Fisheries and Aquatic Resources (2013). Size Regulation for Sea Cucumber Collection and Trade Administrative Circular No. 248 (Quezon City, Philippines: Bureau of Fisheries and Aquatic Resources).
Carvajal-Rodríguez A. (2017). HacDivSel: Two new methods (haplotype-based and outlier-based) for the detection of divergent selection in pairs of populations. PloS One 12, e0175944. doi: 10.1371/journal.pone.0175944
Chang W., Cheng J., Allaire J., Sievert C., Schloerke B., Xie Y., et al. (2023). shiny: Web Application Framework for R. 1.7.5.9000 ed. [Online]: Github.
Chassignet E. P., Hurlburt H. E., Smedstad O. M., Halliwell G. R., Hogan P. J., Wallcraft A. J., et al. (2007). The HYCOM (HYbrid Coordinate Ocean Model) data assimilative system. J. Mar. Syst. 65, 60–83. doi: 10.1016/j.jmarsys.2005.09.016
Choo P.-S. (2008a). “The Philippines: a hotspot of sea cucumber fisheries in Asia,” in Sea cucumbers. A global review of fisheries and trade. FAO Fisheries and Aquaculture Technical Paper No. 516. Eds. Toral-Granda V., Lovatelli A., Vasconcellos M. (FAO, Rome, Italy).
Choo P.-S. (2008b). “Population status, fisheries and trade of sea cucumbers in Asia,” in Sea cucumbers. A global review of fisheries and trade. FAO Fisheries and Aquaculture Technical Paper No. 516. Eds. Toral-Granda V., Lovatelli A., Vasconcellos M. (FAO, Rome, Italy).
Cruz V. M. V., Kilian A., Dierig D. A. (2013). Development of DArT marker platforms and genetic diversity assessment of the U.S. Collection of the new oilseed crop Lesquerella and related species. PloS One 8, e64062. doi: 10.1371/journal.pone.0064062
Cummings J. A. (2005). Operational multivariate ocean data assimilation. Q. J. R. Meteorological Soc. 131, 3583–3604. doi: 10.1256/qj.05.105
Deauna J. D. L., Yatco K. M. B., Villanoy C. L., Juinio-Meñez M. A. (2021). Identification of priority sites to support management of commercially important sea cucumber species by applying infomap and habitat filters to larval dispersal data. Front. Mar. Sci. 7. doi: 10.3389/fmars.2020.571712
DeBoer T. S., Naguit M. R. A., Erdmann M. V., Ablan-Lagman M. C. A., Ambariyanto (2014a). Concordance between phylogeographic and biogeographic boundaries in the coral triangle: conservation implications based on comparative analyses of multiple giant clam species. Bull. Mar. Sci. 90, 277–300. doi: 10.5343/bms.2013.1003
DeBoer T. S., Naguit M. R. A., Erdmann M. V., Ablan-Lagman M. C. A., Ambariyanto, Carpenter K. E., et al. (2014b). Concordant phylogenetic patterns inferred from mitochondrial and microsatellite DNA in the giant clam Tridacna crocea. Bull. Mar. Sci. 90, 301–329. doi: 10.5343/bms.2013.1002
de la Torre-de la Cruz M., Gacura J. R. L., Rescordado R. R., Villamor J. L. (2023). Can commercially available mosquito nets be used for rearing sandfish (Holothuria scabra) juveniles in floating ocean nursery? Mar. Fishery Sci. (MAFIS) 36, 209–217. doi: 10.47193/mafis.3622023010504
Do C., Waples R. S., Peel D., MacBeth G. M., Tillett B. J., Ovenden J. R. (2014). NeEstimator v2: re-implementation of software for the estimation of contemporary effective population size (Ne) from genetic data. Mol. Ecol. Resour. 14, 209–214. doi: 10.1111/1755-0998.12157
Duy N. D. Q. (2010). Seed production of sandfish (Holothuria scabra) in Vietnam (Tigbauan, Iloilo, Philippines: SEAFDEC Aquaculture Department).
Duy N. D. Q. (2012). “Large-scale sandfish production from pond culture in Vietnam,” in Asia–Pacific Tropical Sea Cucumber Aquaculture - ACIAR Proceedings, vol. 136 . Eds. Hair C., Pickering T., Mills D. J. (ACIAR, Noumea, New Caledonia), 34–39.
Duy N. D. Q., Pirozzi I., Southgate P. C. (2015). Ingestion and digestion of live microalgae and microalgae concentrates by sandfish, Holothuria scabra, larvae. Aquaculture 448, 256–261. doi: 10.1016/j.aquaculture.2015.06.009
Eckert C. G., Samis K. E., Lougheed S. C. (2008). Genetic variation across species’ geographical ranges: the central–marginal hypothesis and beyond. Mol. Ecol. 17, 1170–1188. doi: 10.1111/j.1365-294X.2007.03659.x
Excoffier L., Laval G., Schneider S. (2005). Arlequin (version 3.0): An integrated software package for population genetics data analysis. Evolutionary Bioinf. Online 1, 47–50. doi: 10.1177/117693430500100003
Figueira J. P. (2019)LOESS smoothing data using local regression. In: Towards Data Science. Available at: https://towardsdatascience.com/loess-373d43b03564 (Accessed 28/10/2023).
Fisher M. C., Helser T. E., Kang S., Gwak W., Canino M. F., Hauser L. (2022). Genetic structure and dispersal in peripheral populations of a marine fish (Pacific cod, Gadus macrocephalus) and their importance for adaptation to climate change. Ecol. Evol. 12, e8474. doi: 10.1002/ece3.8474
Foll M., Gaggiotti O. (2008). A Genome-Scan Method to Identify Selected Loci Appropriate for Both Dominant and Codominant Markers: A Bayesian Perspective. Genetics 180 (2), 977–993. doi: 10.1534/genetics.108.092221
Francis R. M. (2017). pophelper: an R package and web app to analyse and visualize population structure. Mol. Ecol. Resour. 17, 27–32. doi: 10.1111/1755-0998.12509
Frankham R. (2015). Genetic rescue of small inbred populations: meta-analysis reveals large and consistent benefits of gene flow. Mol. Ecol. 24, 2610–2618. doi: 10.1111/mec.13139
Frankham R., Bradshaw C. J. A., Brook B. W. (2014). Genetics in conservation management: Revised recommendations for the 50/500 rules, Red List criteria and population viability analyses. Biol. Conserv. 170, 56–63. doi: 10.1016/j.biocon.2013.12.036
Frost L. A., Evans B. S., Jerry D. R. (2007). Loss of genetic diversity due to hatchery culture practices in barramundi (Lates calcarifer). Aquaculture 272, Supplement 1, S272. doi: 10.1016/j.aquaculture.2007.07.096
Funk W. C., McKay J. K., Hohenlohe P. A., Allendorf F. W. (2012). Harnessing genomics for delineating conservation units. Trends Ecol. Evol. 27, 489–496. doi: 10.1016/j.tree.2012.05.012
Gamboa R., Gomez A. L., Nievales M. F. (2004). “The status of sea cucumber fishery and mariculture in the Philippines,” in Advances in sea cucumber aquaculture and management. FAO Fisheries Technical Paper. No. 463. Eds. Lovatelli A., Conand C., Purcell S., Uthicke S., Hamel J. F., Mercier A. (Food and Agriculture Organisation, Rome, Italy).
Gamboa R., Juinio-Meñez M. A. J. (2003). Pilot-testing the laboratory production of the sea cucumber, Holothuria scabra (Jaeger), in the Philippines. Philippine Scientist 40, 111–121.
Gosling E. M. (2015). “Fisheries and management of natural populations,” in Marine Bivalve Molluscs. Ed. Gosling E. M. (Wiley Blackwell, West Sussex, United Kingdom).
Goudet J. (2005). hierfstat, a package for R to compute and test hierarchical F-statistics. Mol. Ecol. Notes 5, 184–186. doi: 10.1111/j.1471-8286.2004.00828.x
Hair C., Foale S., Kinch J., Yaman L., Southgate P. C. (2016a). Beyond boom, bust and ban: The Sandfish (Holothuria scabra) fishery in the Tigak Islands, Papua New Guinea. Regional Stud. Mar. Sci. 5, 69–79. doi: 10.1016/j.rsma.2016.02.001
Hair C., Militz T. A., Daniels N., Southgate P. C. (2022). Performance of a trial sea ranch for the commercial sea cucumber, Holothuria scabra, in Papua New Guinea. Aquaculture 547, 737500. doi: 10.1016/j.aquaculture.2021.737500
Hair C., Mills D. J., McIntyre R., Southgate P. C. (2016b). Optimising methods for community-based sea cucumber ranching: Experimental releases of cultured juvenile Holothuria scabra into seagrass meadows in Papua New Guinea. Aquaculture Rep. 3, 198–208. doi: 10.1016/j.aqrep.2016.03.004
Hamel J.-F., Conand C., Pawson D. L., Mercier A. (2001). “The sea cucumber Holothuria scabra (Holothuroidea: Echinodermata): Its biology and exploitation as Beche-de-mer,” in Advances in Marine Biology (Academic Press). doi: 10.1016/S0065-2881(01)41003-0
Hamel J.-F., Eeckhaut I., Conand C., Sun J., Caulier G., Mercier A. (2022). “Chapter One - Global knowledge on the commercial sea cucumber Holothuria scabra,” in Advances in Marine Biology. Eds. Mercier A., Hamel J.-F. (Academic Press).
Hamel J., Mercier A., Conand C., Purcell S., Toral-Granda T., Gamboa R. (2013) Holothuria scabra. The IUCN Red List of Threatened Species 2013. Available at: https://www.iucnredlist.org/species/180257/1606648 (Accessed 18/12/2023 2023).
Hernawan U. E., van Dijk K.-J., Kendrick G. A., Feng M., Biffin E., Lavery P. S., et al. (2017). Historical processes and contemporary ocean currents drive genetic structure in the seagrass Thalassia hemprichii in the Indo-Australian Archipelago. Mol. Ecol. 26, 1008–1021. doi: 10.1111/mec.13966
Hughes A. R., Hanley T. C., Byers J. E., Grabowski J. H., McCrudden T., Piehler M. F., et al. (2019). Genetic diversity and phenotypic variation within hatchery-produced oyster cohorts predict size and success in the field. Ecol. Appl. 29, e01940. doi: 10.1002/eap.1940
Jombart T. (2008). adegenet: a R package for the multivariate analysis of genetic markers. Bioinformatics 24, 1403–1405. doi: 10.1093/bioinformatics/btn129
Jombart T., Ahmed I. (2011). adegenet 1.3–1: new tools for the analysis of genome-wide SNP data. Bioinformatics 27, 3070–3071. doi: 10.1093/bioinformatics/btr521
Jombart T., Collins C. (2015) A tutorial for Discriminant Analysis of Principal Components (DAPC) using adegenet 2.0.0. Available at: https://adegenet.r-forge.r-project.org/files/tutorial-dapc.pdf.
Jombart T., Devillard S., Balloux F. (2010). Discriminant analysis of principal components: a new method for the analysis of genetically structured populations. BMC Genet. 11, 94. doi: 10.1186/1471-2156-11-94
Jost L. (2008). GST and its relatives do not measure differentiation. Mol. Ecol. 17, 4015–4026. doi: 10.1111/j.1365-294X.2008.03887.x
Juinio-Meñez M. A., de Peralta G. M., Dumalan R., Edullantes C., Catbagan T. (2012). “Ocean nursery systems for scaling up juvenile sandfish (Holothuria scabra) production: ensuring opportunities for small fishers,” in Asia-Pacific Tropical Sea Cucumber Aquaculture. ACIAR Proceedings 136. Eds. Hair C., Pickering T. D., Mills D. J. (ACIAR, Canberra, Australia).
Juinio-Meñez M. A., Evangelio J. C., Olavides R. D., Paña M. A. S., de Peralta G. M., Edullantes C. M. A., et al. (2013). Population dynamics of cultured Holothuria scabra in a sea ranch: implications for stock restoration. Rev. Fisheries Sci. 21, 424–432. doi: 10.1080/10641262.2013.837282
Juinio-Meñez M. A., Tech E. D., Ticao I. P., Gorospe J. R. C., Edullantes C. M. A., Rioja R. A. V. (2017). Adaptive and integrated culture production systems for the tropical sea cucumber Holothuria scabra. Fisheries Res. 186, 502–513. doi: 10.1016/j.fishres.2016.07.017
Kalinowski S. T. (2004). Counting alleles with rarefaction: private alleles and hierarchical sampling designs. Conserv. Genet. 5, 539–543. doi: 10.1023/B:COGE.0000041021.91777.1a
Keenan K., McGinnity P., Cross T. F., Crozier W. W., Prodöhl P. A. (2013). diveRsity: An R package for the estimation and exploration of population genetics parameters and their associated errors. Methods Ecol. Evol. 4, 782–788. doi: 10.1111/2041-210X.12067
Kilian A., Wenzl P., Huttner E., Carling J., Xia L., Blois H., et al. (2012). Diversity arrays technology: A generic genome profiling technology on open platforms. Methods Mol. Biol. (Clifton, N.J.). 888, 67–89. doi: 10.1007/978-1-61779-870-2_5
Kool J. T., Paris C. B., Barber P. H., Cowen R. K. (2011). Connectivity and the development of population genetic structure in Indo-West Pacific coral reef communities. Global Ecol. Biogeography 20, 695–706. doi: 10.1111/geb.2011.20.issue-5
Kurokochi H., Matsuki Y., Nakajima Y., Fortes M. D., Uy W. H., Campos W. L., et al. (2016). A baseline for the genetic conservation of tropical seagrasses in the western North Pacific under the influence of the Kuroshio Current: the case of Syringodium isoetifolium. Conserv. Genet. 17, 103–110. doi: 10.1007/s10592-015-0764-7
Labe L. (2009). “Sea cucumber fisheries, utilization and trade in the Philippines,” in Report of the Regional Study on Sea Cucumber Fisheries, Utilization and Trade in Southeast Asia 2007–2008 (Southeast Asian Fisheries Development Center, Iloilo, Philippines).
Labe L., Acera L. K., Romena N., Manululu V. (2007). “Stock and fishery investigation of commercial Aspidochirotid Holothurians (Holothuriidae and Stichopodidae) in the Philippines,” in 9th National Symposium in Marine Science (Program and Abstracts (Paper Presentation, Iloilo, Philippines).
Lal M. M., Bosserelle C., Kishore P., Southgate P. C. (2020). Understanding marine larval dispersal in a broadcast-spawning invertebrate: A dispersal modelling approach for optimising spat collection of the Fijian black-lip pearl oyster Pinctada margaritifera. PloS One 15, e0234605. doi: 10.1371/journal.pone.0234605
Lal M. M., MacAhig D. A. S., Brown K. T., Juinio-Meñez M. A., Southgate P. C., Ravago-Gotanco R. (2021). Preliminary population genomic study on the sandfish Holothuria (Metriatyla) scabra. Anim. Genet. 52, 775–776. doi: 10.1111/age.13116
Lal M. M., Southgate P. C., Jerry D. R., Bosserelle C., Zenger K. R. (2016a). A parallel population genomic and hydrodynamic approach to fishery management of highly-dispersive marine invertebrates: the case of the Fijian black-lip pearl oyster Pinctada margaritifera. PloS One 11, e0161390. doi: 10.1371/journal.pone.0161390
Lal M. M., Southgate P. C., Jerry D. R., Bosserelle C., Zenger K. R. (2017). Swept away: ocean currents and seascape features influence genetic structure across the 18,000 Km Indo-Pacific distribution of a marine invertebrate, the black-lip pearl oyster Pinctada margaritifera. BMC Genomics 18, 66. doi: 10.1186/s12864-016-3410-y
Lal M. M., Southgate P. C., Jerry D. R., Zenger K. R. (2016b). Fishing for divergence in a sea of connectivity: The utility of ddRADseq genotyping in a marine invertebrate, the black-lip pearl oyster Pinctada margaritifera. Mar. Genomics 25, 57–68. doi: 10.1016/j.margen.2015.10.010
Liggins L., Booth D. J., Figueira W. F., Treml E. A., Tonk L., Ridgway T., et al. (2015). Latitude-wide genetic patterns reveal historical effects and contrasting patterns of turnover and nestedness at the range peripheries of a tropical marine fish. Ecography 38, 1212–1224. doi: 10.1111/ecog.01398
Liggins L., Gleeson L., Riginos C. (2014). Evaluating edge-of-range genetic patterns for tropical echinoderms, Acanthaster planci and Tripneustes gratilla, of the Kermadec Islands, southwest Pacific. Bull. Mar. Sci. 90, 379–397. doi: 10.5343/bms.2013.1015
Limborg M. T., Helyar S. J., de Bruyn M., Taylor M. I., Nielsen E. E., Ogden R. O. B., et al. (2012). Environmental selection on transcriptome-derived SNPs in a high gene flow marine fish, the Atlantic herring (Clupea harengus). Mol. Ecol. 21, 3686–3703. doi: 10.1111/j.1365-294X.2012.05639.x
Lind C. E., Evans B. S., Taylor J. J. U., Jerry D. R. (2007). Population genetics of a marine bivalve, Pinctada maxima, throughout the Indo-Australian Archipelago shows differentiation and decreased diversity at range limits. Mol. Ecol. 16, 5193–5203. doi: 10.1111/j.1365-294X.2007.03598.x
Lorenzen K., Beveridge M. C. M., Mangel M. (2012). Cultured fish: integrative biology and management of domestication and interactions with wild fish. Biol. Rev. 87, 639–660. doi: 10.1111/j.1469-185X.2011.00215.x
Lorenzen K., Leber K. M., Blankenship H. L. (2010). Responsible approach to marine stock enhancement: an update. Rev. Fisheries Sci. 18, 189–210. doi: 10.1080/10641262.2010.491564
Lourie S. A., Green D. M., Vincent A. C. J. (2005). Dispersal, habitat differences, and comparative phylogeography of Southeast Asian seahorses (Syngnathidae: Hippocampus). Mol. Ecol. 14, 1073–1094. doi: 10.1111/j.1365-294X.2005.02464.x
Markey K. L., Abdo D. A., Evans S. N., Bosserelle C. (2016). Keeping it local: dispersal limitations of coral larvae to the high latitude coral reefs of the Houtman Abrolhos islands. PloS One 11, e0147628. doi: 10.1371/journal.pone.0147628
Mendiola M. J. R., Ravago-Gotanco R. (2021). Genetic differentiation and signatures of local adaptation revealed by RADseq for a highly dispersive mud crab Scylla olivacea (Herbst 1796) in the sulu sea. Ecol. Evol. 11, 7951–7969. doi: 10.1002/ece3.7625
Mercier A., Battaglene S. C., Hamel J.-F. (2000a). Periodic movement, recruitment and size-related distribution of the sea cucumber Holothuria scabra in Solomon Islands. Hydrobiologia 440, 81–100. doi: 10.1023/A:1004121818691
Mercier A., Battaglene S. C., Hamel J.-F. (2000b). Settlement preferences and early migration of the tropical sea cucumber Holothuria scabra. J. Exp. Mar. Biol. Ecol. 249, 89–110. doi: 10.1016/S0022-0981(00)00187-8
Militz T. A., Leini E., Duy N. D. Q., Southgate P. C. (2018). Successful large-scale hatchery culture of sandfish (Holothuria scabra) using micro-algae concentrates as a larval food source. Aquaculture Rep. 9, 25–30. doi: 10.1016/j.aqrep.2017.11.005
Mills D., Nguyen Dinh Quang D., Juinio-Meñez M., Meñez M. A., Raison C., Zarate J. (2012). “Overview of sea cucumber aquaculture and sea-ranching research in the South-East Asian region,” in Asia-Pacific Tropical Sea Cucumber Aquaculture. ACIAR Proceedings 136. Eds. Hair C. A., Pickering T. D., Mills D. J. (Australian Centre for International Agricultural Research (ACIAR, Canberra, Australia).
Nakajima Y., Matsuki Y., Lian C., Fortes M. D., Uy W. H., Campos W. L., et al. (2014). The Kuroshio Current influences genetic diversity and population genetic structure of a tropical seagrass, Enhalus acoroides. Mol. Ecol. 23, 6029–6044. doi: 10.1111/mec.12996
Nei M. (1987). “Genetic distance and molecular phylogeny,” in Population Genetics and Fishery Management. Eds. Ryman N., Utter F. (University of Washington Press, Seattle, United States of America).
Neuditschko M., Khatkar M. S., Raadsma H. W. (2012). NETVIEW: A high-definition network-visualization approach to detect fine-scale population structures from genome-wide patterns of variation. PloS One 7, e48375. doi: 10.1371/journal.pone.0048375
Nosil P., Funk D. J., Ortiz-Barrientos D. (2009). Divergent selection and heterogeneous genomic divergence. Mol. Ecol. 18, 375–402. doi: 10.1111/j.1365-294X.2008.03946.x
Nowland S. J., Southgate P. C., Basiita R. K., Jerry D. R. (2017). Elucidation of fine-scale genetic structure of sandfish (Holothuria scabra) populations in Papua New Guinea and northern Australia. Mar. Freshw. Res. 68, 1901–1911. doi: 10.1071/MF16223
Oksanen J., Simpson G. L., Blanchet G., Kindt R., Legendre P., Minchin P. R., et al. (2022). vegan: Community Ecology Package. 2.6.4 ed. [Online]: CRAN.
Ordoñez J. F. F., Galindez G. G. S. T., Gulay K. T., Ravago-Gotanco R. (2021). Transcriptome analysis of growth variation in early juvenile stage sandfish Holothuria scabra. Comp. Biochem. Physiol. Part D: Genomics Proteomics 40, 100904. doi: 10.1016/j.cbd.2021.100904
Ordoñez J. F., Ravago-Gotanco R. (2024). Transcriptome-derived SNP markers for population assignment of sandfish, Holothuria (Metriatyla) scabra. Aquaculture 579, 740261. doi: 10.1016/j.aquaculture.2023.740261
Pakoa K., Bertram I. (2013). Management state of Pacific sea cucumber fisheries. SPC Beche-de-mer Inf. Bull. 33, 49–52.
Palsbøll P. J., Bérubé M., Allendorf F. W. (2007). Identification of management units using population genetic data. Trends Ecol. Evol. 22, 11–16. doi: 10.1016/j.tree.2006.09.003
Paquette S. R. (2012). PopGenKit: Useful functions for (batch) file conversion and data resampling in microsatellite datasets. R package version. [Online]: CRAN.
Paris C. B., Helgers J., van Sebille E., Srinivasan A. (2013). Connectivity Modeling System: A probabilistic modeling tool for the multi-scale tracking of biotic and abiotic variability in the ocean. Environ. Model. Software 42, 47–54. doi: 10.1016/j.envsoft.2012.12.006
Pauly D., Zeller D. (2016). Catch reconstructions reveal that global marine fisheries catches are higher than reported and declining. Nat. Commun. 7, 10244. doi: 10.1038/ncomms10244
Peakall R. O. D., Smouse P. E. (2006). GENEALEX 6: genetic analysis in Excel. Population genetic software for teaching and research. Mol. Ecol. Notes 6, 288–295. doi: 10.1111/j.1471-8286.2005.01155.x
Pitt R. (2001). Review of sandfish breeding and rearing methods. SPC Beche Mer Inf. Bull. 14, 14–21.
Pitt R., Duy N. D. Q. (2004). “Breeding and rearing of the sea cucumber Holothuria scabra in Vietnam,” in AO Fisheries Technical Paper No. 463. Eds. Lovatelli A., Conand C., Purcell S., Uthicke S., Hamel J.-F., Mercier A. (Food and Agriculture Organization of the United Nations, Rome, Italy).
Porta J., Maria Porta J., Cañavate P., Martínez-Rodríguez G., Carmen Alvarez M. (2007). Substantial loss of genetic variation in a single generation of Senegalese sole (Solea Senegalensis) culture: implications in the domestication process. J. Fish Biol. 71, 223–234. doi: 10.1111/j.1095-8649.2007.01576.x
Pritchard J. K., Stephens M., Donnelly P. (2000). Inference of population structure using multilocus genotype data. Genetics 155, 945–959. doi: 10.1093/genetics/155.2.945
Purcell S. W., Hair C. A., Mills D. J. (2012b). Sea cucumber culture, farming and sea ranching in the tropics: Progress, problems and opportunities. Aquaculture 368–369, 68–81. doi: 10.1016/j.aquaculture.2012.08.053
Purcell S. W., Lovatelli A., González-Wangüemert M., Solís-Marín F. A., Samyn Y., Conand C. (2023). Commercially important sea cucumbers of the world (Rome, Italy: FAO).
Purcell S., Neale B., Todd-Brown K., Thomas L., Ferreira M. A., Bender D., et al. (2007). PLINK: a tool set for whole-genome association and population-based linkage analyses. Am. J. Hum. Genet. 81, 559–575. doi: 10.1086/519795
Purcell S., Samyn Y., Conand C. (Eds.) (2012a). Commercially important sea cucumbers of the world (Rome, Italy: Food and Agriculture Organisation (FAO) of the United Nations).
Purcell S. W., Williamson D. H., Ngaluafe P. (2018). Chinese market prices of beche-de-mer: Implications for fisheries and aquaculture. Mar. Policy 91, 58–65. doi: 10.1016/j.marpol.2018.02.005
Queller D. C., Goodnight K. F. (1989). Estimating relatedness using genetic markers. Evolution 43, 258–275. doi: 10.2307/2409206
Ramofafia C., Byrne M., Battaglene C. (2003). Reproduction of the commercial sea cucumber Holothuria scabra (Echinodermata: Holothuroidea) in the Solomon Islands. Mar. Biol. 142, 281–288. doi: 10.1007/s00227-002-0947-x
Ravago-Gotanco R. G., Juinio-Meñez M. A. (2010). Phylogeography of the mottled spinefoot Siganus fuscescens: Pleistocene divergence and limited genetic connectivity across the Philippine archipelago. Mol. Ecol. 19, 4520–4534. doi: 10.1111/mec.2010.19.issue-20
Ravago-Gotanco R., Kim K. M. (2019). Regional genetic structure of sandfish Holothuria (Metriatyla) scabra populations across the Philippine archipelago. Fisheries Res. 209, 143–155. doi: 10.1016/j.fishres.2018.09.021
Ravago-Gotanco R., Magsino R., Juinio-Menez M. A. (2007). Influence of the North Equatorial Current on the population genetic structure of Tridacna crocea (Mollusca: Tridacnidae) along the eastern Philippine seaboard. Mar. Ecol. Prog. Ser. 336, 161–168. doi: 10.3354/meps336161
Raynal J. M., Crandall E. D., Barber P. H., Mahardika G. N., Lagman M. C., Carpenter K. E. (2014). Basin isolation and oceanographic features influencing lineage divergence in the humbug damselfish (Dascyllus aruanus) in the coral triangle. Bull. Mar. Sci. 90, 513–532. doi: 10.5343/bms.2013.1017
Reiss H., Hoarau G., Dickey-Collas M., Wolff W. J. (2009). Genetic population structure of marine fish: mismatch between biological and fisheries management units. Fish Fisheries 10, 361–395. doi: 10.1111/j.1467-2979.2008.00324.x
Reitzel A. M., Herrera S., Layden M. J., Martindale M. Q., Shank T. M. (2013). Going where traditional markers have not gone before: utility of and promise for RAD sequencing in marine invertebrate phylogeography and population genomics. Mol. Ecol. 22, 2953–2970. doi: 10.1111/mec.12228
Ren R., Ray R., Li P., Xu J., Zhang M., Liu G., et al. (2015). Construction of a high-density DArTseq SNP-based genetic map and identification of genomic regions with segregation distortion in a genetic population derived from a cross between feral and cultivated-type watermelon. Mol. Genet. Genomics 290, 1457–1470. doi: 10.1007/s00438-015-0997-7
Riquet F., Fauvelot C., Fey P., Grulois D., Leopold M. (2022). Hatchery-produced sandfish (Holothuria scabra) show altered genetic diversity in New Caledonia. Fisheries Res. 252, 106343. doi: 10.1016/j.fishres.2022.106343
Robasky K., Lewis N. E., Church G. M. (2014). The role of replicates for error mitigation in next-generation sequencing. Nat. Rev. Genet. 15, 56–62. doi: 10.1038/nrg3655
Sansaloni C., Petroli C., Jaccoud D., Carling J., Detering F., Grattapaglia D., et al. (2011). Diversity Arrays Technology (DArT) and next-generation sequencing combined: genome-wide, high throughput, highly informative genotyping for molecular breeding of Eucalyptus. BMC Proc. 5, P54–P54. doi: 10.1186/1753-6561-5-S7-P54
Schwerdtner Máñez K., Ferse S. C. A. (2010). The history of Makassan Trepang fishing and trade. PloS One 5, e11346. doi: 10.1371/journal.pone.0011346
Sembiring S. B. M., Hutapea J. H., Pratiwi R., Haryanti, Hadisusanto S. (2022). “The genetic variation analysis of sandfish (Holothuria scabra) population using simple sequence repeats (SSR),” in IOP Conference Series: Earth and Environmental Science. 2nd International Conference on Tropical Wetland Biodiversity and Conservation. [Online]: IOP Conference Series: Earth and Environmental Science, 976. Available at: https://iopscience.iop.org/article/10.1088/1755-1315/976/1/012003/meta.
Siegel D. A., Kinlan B. P., Gaylord B., Gaines S. D. (2003). Lagrangian descriptions of marine larval dispersion. Mar. Ecol. Prog. Ser. 260, 83–96. doi: 10.3354/meps260083
Siegel D. A., Mitarai S., Costello C. J., Gaines S. D., Kendall B. E., Warner R. R., et al. (2008). The stochastic nature of larval connectivity among nearshore marine populations. Proc. Natl. Acad. Sci. USA 105, 8974–8979. doi: 10.1073/pnas.0802544105
Sinsona M. J., Juinio-Meñez M. A. (2019). Periphyton characteristics influence the growth and survival of Holothuria scabra early juveniles in an ocean nursery system. Aquaculture Res. 50, 2655–2665. doi: 10.1111/are.14223
Smoot M. E., Ono K., Ruscheinski J., Wang P.-L., Ideker T. (2011). Cytoscape 2.8: new features for data integration and network visualization. Bioinformatics 27, 431–432. doi: 10.1093/bioinformatics/btq675
Southgate P. C., Juinio-Meñez M. A., Altamirano J. P., Nowland S. J., Duy N. D. Q., Uy W., et al. (2020). “Expansion and diversification of production and management systems for sea cucumbers in the Philippines, Vietnam and northern Australia (FIS/2010/042),” in ACIAR final Reports, FR2020/029 (Australian Centre for International Agricultural Research (ACIAR, Canberra, Australia).
Steinig E. J., Neuditschko M., Khatkar M. S., Raadsma H. W., Zenger K. R. (2016). NetView P: A network visualization tool to unravel complex population structure using genome-wide SNPs. Mol. Ecol. Resour. 16 (1), 216–227. doi: 10.1111/1755-0998.12442
Sundqvist L., Keenan K., Zackrisson M., Prodöhl P., Kleinhans D. (2016). Directional genetic differentiation and asymmetric migration. Ecol. Evol. 6, 3461–3475. doi: 10.1002/ece3.2096
Sweijd N. A., Bowie R. C. K., Evans B. S., Lopata A. L. (2000). “Molecular genetics and the management and conservation of marine organisms,” in Marine Genetics. Eds. Solé-Cava A. M., Russo C. A. M., Thorpe J. P. (Springer Netherlands, Dordrecht).
Tsafrir D., Tsafrir I., Ein-Dor L., Zuk O., Notterman D. A., DOMANY E. (2005). Sorting points into neighborhoods (SPIN): data analysis and visualization by ordering distance matrices. Bioinformatics 21, 2301–2308. doi: 10.1093/bioinformatics/bti329
Uthicke S., Benzie J. A. H. (2001). Restricted gene flow between Holothuria scabra (Echinodermata: Holothuroidea) populations along the north-east coast of Australia and the Solomon Islands. Mar. Ecol. Prog. Ser. 216, 109–117. doi: 10.3354/meps216109
Uthicke S., Byrne M., Conand C. (2010). Genetic barcoding of commercial Bêche-de-mer species (Echinodermata: Holothuroidea). Mol. Ecol. Resour. 10, 634–646. doi: 10.1111/j.1755-0998.2009.02826.x
Uthicke S., Purcell S. (2004). Preservation of genetic diversity in restocking of the sea cucumber Holothuria scabra investigated by allozyme electrophoresis. Can. J. Fisheries Aquat. Sci. 61, 519–528. doi: 10.1139/f04-013
Valenzuela-Quiñonez F. (2016). How fisheries management can benefit from genomics? Briefings Funct. Genomics 15, 352–357. doi: 10.1093/bfgp/elw006
Villamor J. L., de la Torre-de la Cruz M., Diodoco R. J. P. (2021). Spatial distribution patterns of sandfish juveniles released in a sea ranch area in Maliwaliw Island, Philippines. Aquaculture Res. 52, 6132–6142. doi: 10.1111/are.15475
Waples R. S., Gaggiotti O. (2006). What is a population? An empirical evaluation of some genetic methods for identifying the number of gene pools and their degree of connectivity. Mol. Ecol. 15, 1419–1439. doi: 10.1111/j.1365-294X.2006.02890.x
Waples R. S., Naish K. A. (2009). “Genetic and evolutionary considerations in fishery management: research needs for the future,” in The Future of Fisheries Science in North America. Eds. Beamish R. J., Rothschild B. J. (Springer Netherlands, Dordrecht).
Waples R. S., Punt A. E., Cope J. M. (2008). Integrating genetic data into management of marine resources: how can we do it better? Fish Fisheries 9, 423–449. doi: 10.1111/j.1467-2979.2008.00303.x
Ward R. D. (2000). Genetics in fisheries management. Hydrobiologia 420, 191–201. doi: 10.1023/A:1003928327503
Warnes G. R., Bolker B., Bonebakker L., Gentleman R., Huber W., Liaw A., et al. (2020). gplots: Various R Programming Tools for Plotting Data. R package version 3.0.1.2 ed. [Online]: CRAN.
Wessel P., Smith W. H. F., Scharroo R., Luis J., Wobbe F. (2013). Generic mapping tools: improved version released. Eos Trans. Am. Geophysical Union 94, 409–410. doi: 10.1002/2013EO450001
Winter D. J. (2012). mmod: an R library for the calculation of population differentiation statistics. Mol. Ecol. Resour. 12, 1158–1160. doi: 10.1111/j.1755-0998.2012.03174.x
Worm B. (2016). Averting a global fisheries disaster. PNAS 113, 4895–4897. doi: 10.1073/pnas.1604008113
Keywords: sea cucumber, SNP, genetic structure, fishery management, dispersal, Philippines, conservation, mariculture
Citation: Lal MM, Macahig DAS, Juinio-Meñez MA, Altamirano JP, Noran-Baylon R, de la Torre-de la Cruz M, Villamor JL, Gacura JRL, Uy WH, Mira-Honghong H, Southgate PC and Ravago-Gotanco R (2024) Complex patterns of genetic structure in the sea cucumber Holothuria (Metriatyla) scabra from the Philippines: implications for aquaculture and fishery management. Front. Mar. Sci. 11:1396016. doi: 10.3389/fmars.2024.1396016
Received: 05 March 2024; Accepted: 20 May 2024;
Published: 04 June 2024.
Edited by:
Taewoo Ryu, Okinawa Institute of Science and Technology Graduate University, JapanReviewed by:
Joshua Patterson, University of Florida, United StatesCopyright © 2024 Lal, Macahig, Juinio-Meñez, Altamirano, Noran-Baylon, de la Torre-de la Cruz, Villamor, Gacura, Uy, Mira-Honghong, Southgate and Ravago-Gotanco. This is an open-access article distributed under the terms of the Creative Commons Attribution License (CC BY). The use, distribution or reproduction in other forums is permitted, provided the original author(s) and the copyright owner(s) are credited and that the original publication in this journal is cited, in accordance with accepted academic practice. No use, distribution or reproduction is permitted which does not comply with these terms.
*Correspondence: Monal M. Lal, bWxhbDFAdXNjLmVkdS5hdQ==
†These authors have contributed equally to this work
Disclaimer: All claims expressed in this article are solely those of the authors and do not necessarily represent those of their affiliated organizations, or those of the publisher, the editors and the reviewers. Any product that may be evaluated in this article or claim that may be made by its manufacturer is not guaranteed or endorsed by the publisher.
Research integrity at Frontiers
Learn more about the work of our research integrity team to safeguard the quality of each article we publish.