 Yang Wang
 Yuying Zhang
 Zhe Geng
 Jiangfeng Zhu
94% of researchers rate our articles as excellent or good
Learn more about the work of our research integrity team to safeguard the quality of each article we publish.
Find out more
ORIGINAL RESEARCH article
Front. Mar. Sci., 19 July 2024
Sec. Marine Fisheries, Aquaculture and Living Resources
Volume 11 - 2024 | https://doi.org/10.3389/fmars.2024.1392273
Introduction: A sustainable fishery relies on consistent and substantial recruitment. There is, however, considerably high mortality among fish larvae during their early development. One of the most important factors determining larval survival is foraging success. Bigeye tuna is among the most important commercial species in the Indian Ocean. Despite being routinely researched and assessed, it remains unclear how food availability affects the recruitment success of bigeye tuna.
Methods: In this study, we used phytoplankton size (MD50) as an indicator of prey availability and investigated the connection between MD50 and bigeye tuna recruitment from 2000 to 2018 through the Beverton-Holt stock-recruitment function. The Indian Ocean was divided into four regions to accommodate spatial differences.
Results: As a result, larger MD50 could bring higher recruitment, particularly in the eastern and southern Indian Ocean. Based on the analysis, we inferred that for bigeye tuna, the eastern Indian Ocean is the primary spawning ground, and the peak spawning period falls in Season 2 (April-June).
Discussion: The conclusions provide valuable insights for understanding the recruitment characteristics of bigeye tuna in the Indian Ocean.
The Indian Ocean ranks second after the Pacific Ocean in terms of tuna fishing, accounting for 22% of the global tuna catches in 2020 (ISSF, 2022). Bigeye tuna (Thunnus obesus Lowe, 1839), a vital commercial tuna species in the Indian Ocean, has witnessed a surge in commercial value over the past few decades (Zudaire et al., 2022). In 2020, bigeye tuna catches amounted to 84,388 tonnes (in live weight), representing about 7.5% of the total catches in the Indian Ocean (data from FAO FishStat database, accessible at https://www.fao.org/fishery/statistics-query/en/capture/capture_quantity, retrieved on February 2, 2023). Historically, the major portion of catches came from the longline fleets, but there was a dramatic drop due to piracy activities in 2004 (ISSF, 2022). In the last decade, purse seiners and longliners are the two major fisheries comprising 80% of the catches (Secretariat, 2022). According to the stock assessment of bigeye tuna conducted by the Indian Ocean Tuna Commission (IOTC), the stock was considered to be overfished and had been subject to overfishing (Fu, 2019).
Although bigeye tuna has been regularly assessed in the Indian Ocean, the precise timing and location of recruitment are still uncertain (Fu, 2019). Recruitment, being a critical process in population dynamics, plays a vital role in ensuring the sustainability of fisheries. Despite intensive fishing, fish populations may still persist or even be maintained at sustainable levels due to substantial compensatory and density-dependent mortality (Camp et al., 2020). A better understanding of the recruitment characteristics could enhance the efficiency of fishery management and provide useful information for stock assessment and projection.
The spawning of bigeye tuna exhibits both seasonal and year-round characteristics (Muhling et al., 2017). It occurs in tropical and sub-tropical waters when the surface water temperature exceeds 24°C (Nishikawa and Kenkyūjo, 1985; Schaefer, 2001). Eggs laid typically hatch into larvae (about 3 mm in length) in a few days, develop foraging and swimming organs quickly, and then grow into juveniles within the first month of life (Miyashita et al., 2001; Reglero et al., 2014). It is worth noting that the recruits experience exceedingly high mortality throughout the hatching and early life stages (Anderson, 1988; Russo et al., 2022; Shropshire et al., 2022). The biotic and abiotic conditions (e.g., temperature, zooplankton biomass, and eddies) in the water column, especially the surface layers, could strongly affect fish larval distribution and abundance, thereby impacting the reproduction of the species (Cuttitta et al., 2018; Russo et al., 2022). The feeding success of larvae is one of the most important processes in their survival (Anderson, 1988; Llopiz and Hobday, 2015). In particular, for species such as bigeye tuna, which primarily spawn in tropical regions, prey availability is more relevant than temperature to larvae (Reglero et al., 2014; Shropshire et al., 2022). To meet their metabolic requirements, tuna larvae hinge on the zooplankton availability after the yolk sack absorption (Llopiz and Hobday, 2015; Shropshire et al., 2022). They have a very narrow diet and are highly selective in their consumption of limited species of zooplankton inhabiting the shallow mixed layer (such as appendicularians, cladocerans, and cyclopoid copepods in the genera Farranula and Corycaeus) (Llopiz and Hobday, 2015; Artetxe-Arrate et al., 2021).
After transitioning from endogenous to exogenous nutrition, the larvae are most vulnerable to environmental factors, particularly food availability. High mortality rate often follows the strictly endogenous yolk feeding period as well as the first exogenous feeding phase. This period has been hypothesized as a “critical period” (Hjort, 1914) that determines recruitment success, but the hypothesis remains controversial (Sifa and Mathias, 1987; Robert et al., 2013). As a highly migratory species in the open seas, the recruitment of bigeye tuna is difficult to monitor by fishery-independent methods (Kolody et al., 2019). Thus, only a limited amount of research has been conducted to explore the influence of larval foraging success on the recruitment of bigeye tuna, with most information being related to tuna recruitment and reproduction confined to the Pacific Ocean (Langley et al., 2009; Zhu et al., 2010; Muhling et al., 2018; Woodworth-Jefcoats and Wren, 2020). Owing to this research gap, we developed a new method to explore the validity of the “critical period” hypothesis for bigeye tuna in the Indian Ocean. The median phytoplankton size (MD50) was used as a proxy for the larval food quality (Barnes et al., 2011). A higher MD50 signifies larger phytoplankton and, in turn, more food available for the zooplankton upon which larval bigeye tuna feed. Since it is unclear whether the relationship between food availability and recruitment can be explained by linear or nonlinear regression due to the complexity of the real world, we examined the relationship between MD50 and the environment-related parameter, β, of the Beverton–Holt stock–recruitment function (B–H function) (Beverton and Holt, 1957). If there was a relationship between MD50 and the parameter β, the B–H function could describe the relationship between food availability and recruitment of bigeye tuna. Regional differences in the relationship were also considered based on the spatial stratification of the stock assessment model for bigeye tuna (Fu, 2019). The findings of this study could refine the estimation of bigeye tuna recruitment and elucidate the factors affecting its variation, thereby advancing stock assessment and management practices.
Spatial structures, critical in stock assessments and fisheries management, take into account the differences in exploitation levels and fishery operations (Vincent and Hampton, 2018). The research area of this study spans the entire Indian Ocean and was divided into four regions based on the spatial structure used in the current bigeye tuna stock assessment (Figure 1): the south-western equatorial region (R1S), the north-western equatorial region (R1N), the eastern equatorial region (R2), and the southern region (R3) (Fu, 2019).
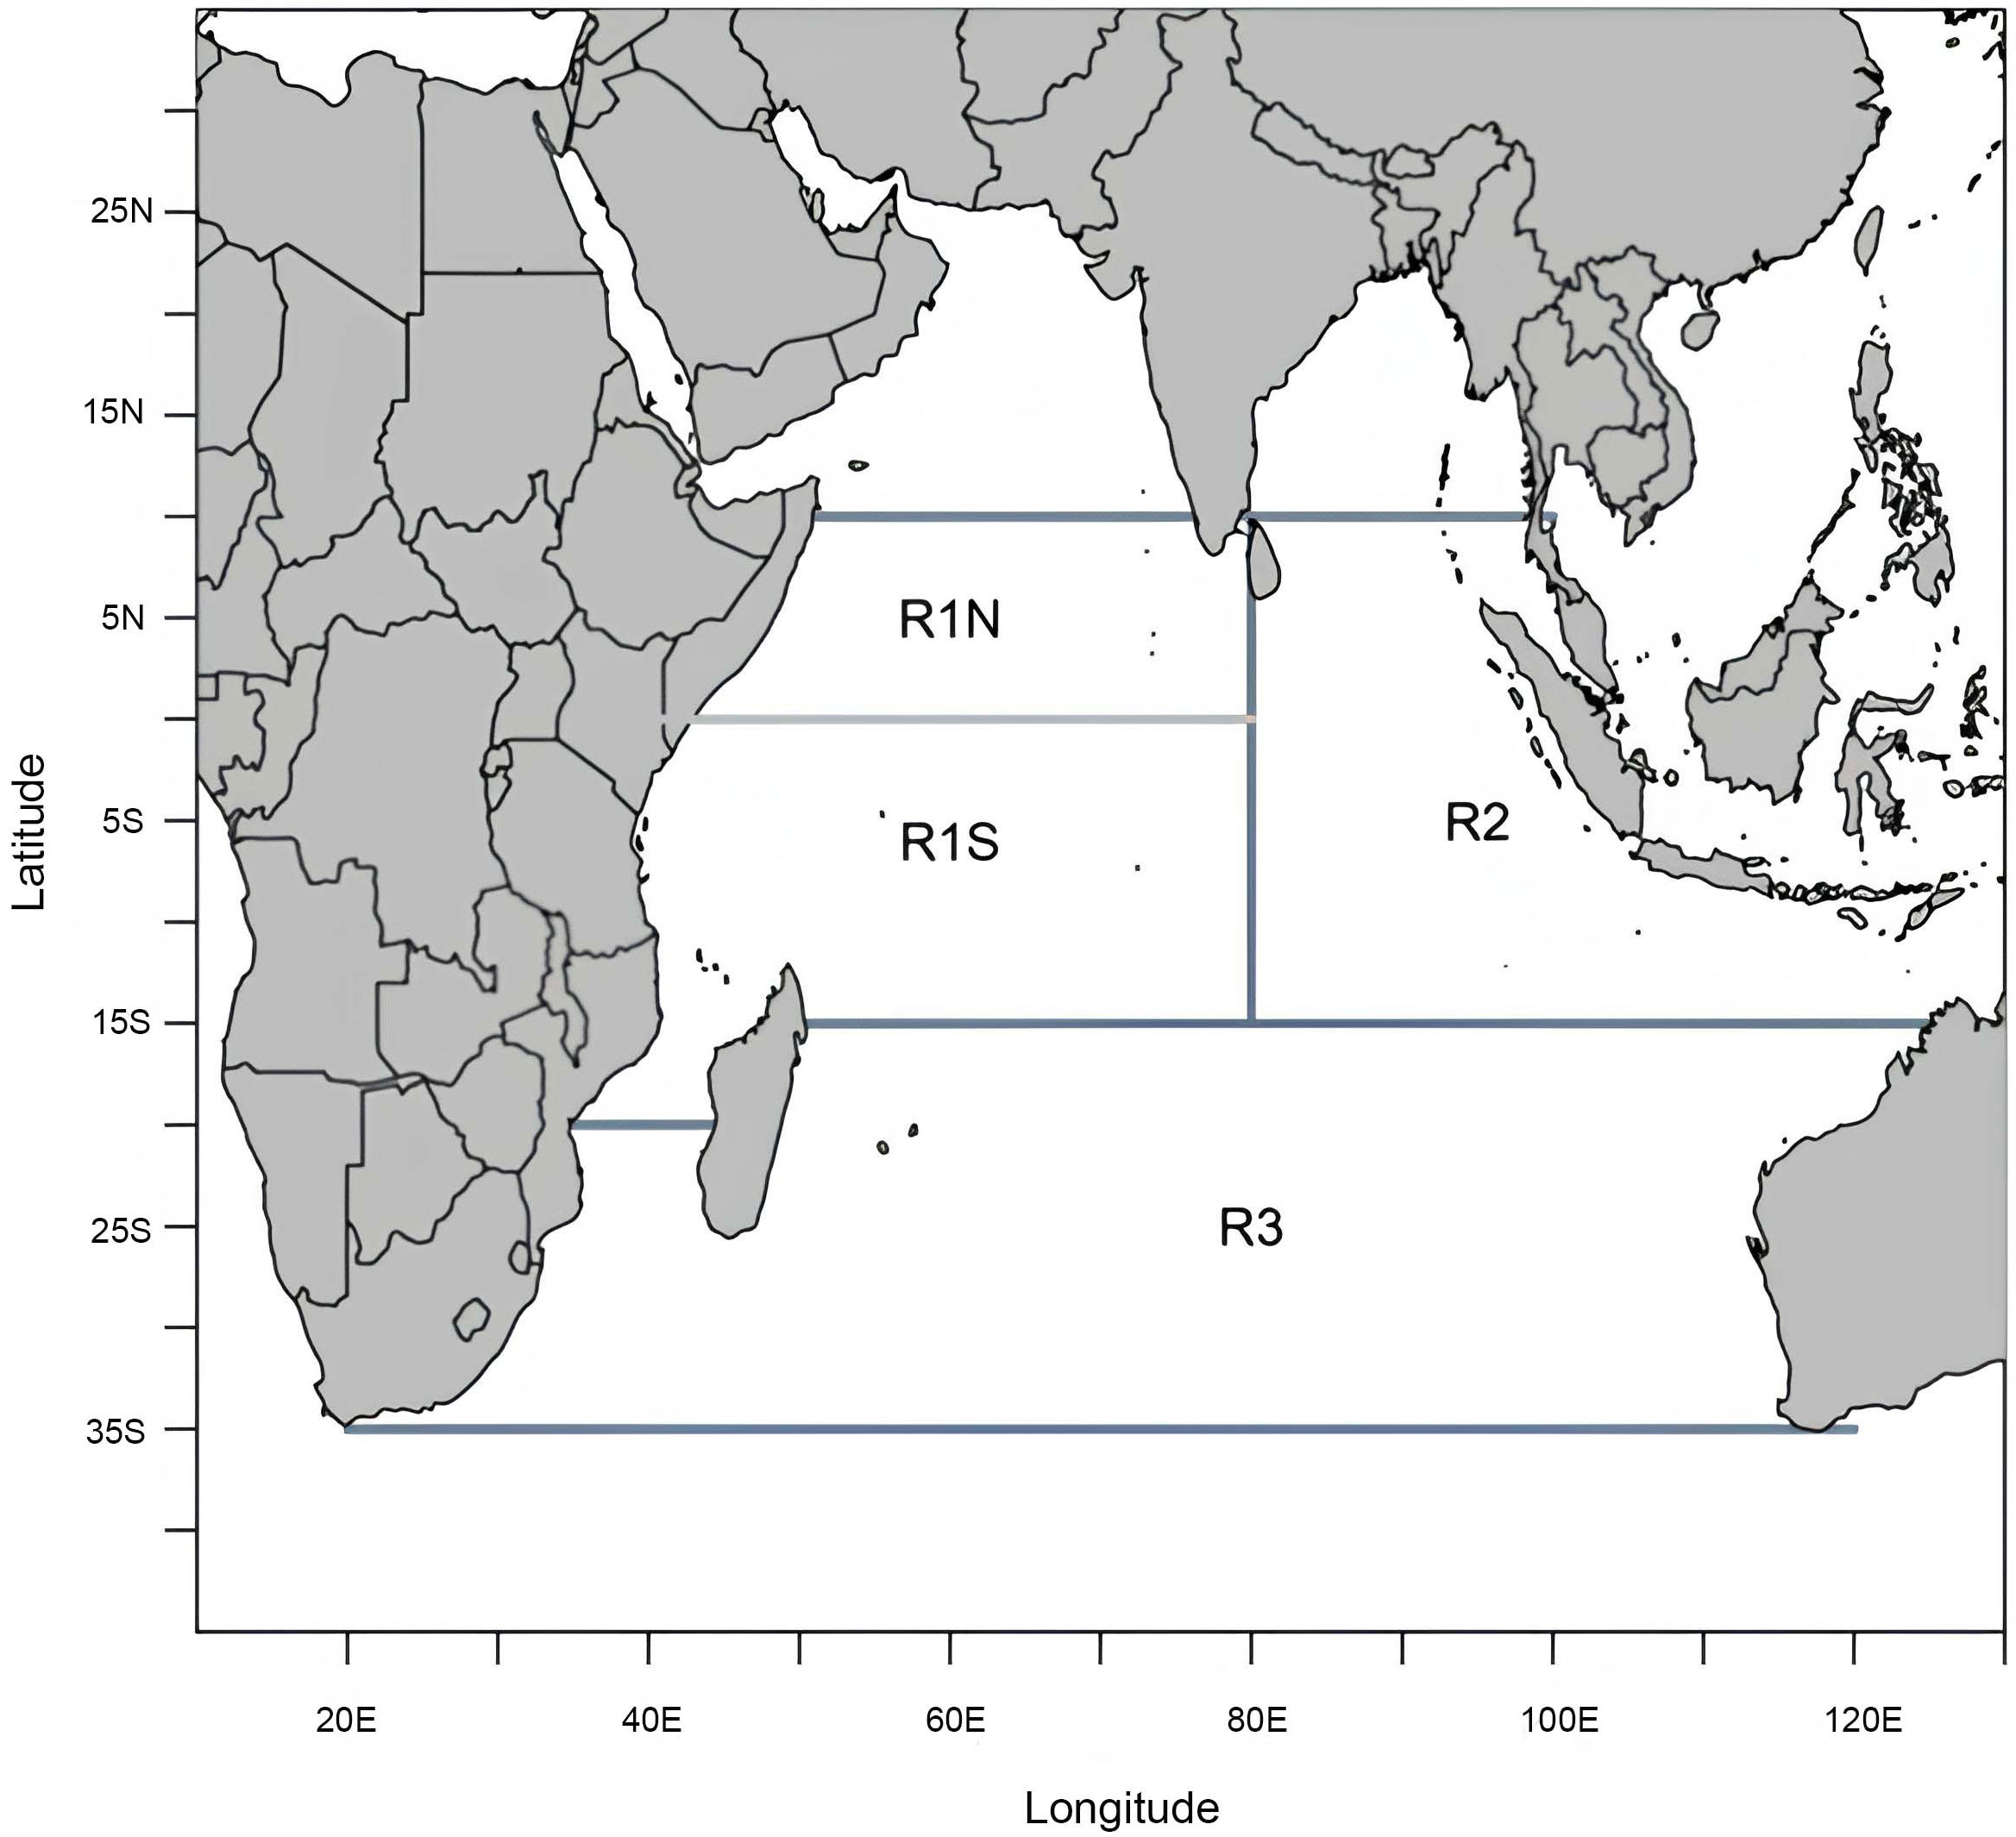
Figure 1 Study area of the stock assessment of the bigeye tuna in the Indian Ocean (Fu et al., 2019).
The B–H stock–recruitment function describes the relationship between the recruit abundance and the spawning biomass of the stock (Miller and Brooks, 2021). The basic function is as follows:
where R represents the number of recruits, and S is the spawning stock biomass. The parameters α and β are related to two types of mortality: α is mainly linked to density-dependent mortality rates, whereas β pertains to the mortality caused by external (or density-independent) factors, such as temperature, wind, currents, and food availability (Beverton and Holt, 1957; Miller and Brooks, 2021). This study focuses on the relationship between MD50 and β; if there is any monotonic relationship between the two, the B–H function may be used to describe the relationship between MD50 and recruitment.
An alternative form of the B–H function was introduced by Mace et al. (1988) in terms of steepness Δ, equilibrium unexploited recruitment R0 or spawning biomass S0, and the unexploited spawning biomass per recruit S0/R0 (also defined as φ0). Francis (1992) denoted the steepness as h, which is more frequently used nowadays. The parameters h, R0, and S0 were extracted from the bigeye tuna stock assessment, conducted by the Stock Synthesis model version 3.24z (SS3) (Fu, 2019). The B–H function was defined in the SS3 model as follows:
where Sy and Ry are the spawning stock biomass and the recruitment in season y, respectively. Comparing Equation (2) to the basic function Equation (1), α can be calculated as (Equation 3):
Assuming that β is a vector of random effects, its seasonal values can be back-calculated according to the observed Sy and Ry time series (Equation 4).
The seasonal Sy and Ry data from 1975 to 2018 have been estimated in the stock assessment model (Fu, 2019). To be consistent with the stock assessment, the same seasonal setting was used in the present study: January–March (season 1), April–June (season 2), July–September (season 3), and October–December (season 4). The spatial structure of SS3 allows the calculation of β for each region and season from 1975 to 2018.
The MD50 (cell size) in equivalent spherical diameter in μm is derived from the cell mass (MB50), which is calculated as follows (Equation 5):
where chla denotes chlorophyll-a in mg/m3, while SST is sea surface temperature in °C (Barnes et al., 2011). Then, MB50 can be converted to MD50 as follows (Equation 6):
(Menden-Deuer and Lessard, 2000; Polovina and Woodworth, 2012).
Since there was limited continuous chlorophyll-a record before the year 2000, monthly chlorophyll-a data from 2000 to 2018 were obtained from NASA’s Moderate-resolution Imaging Spectroradiometer (MODIS) Terra Chlorophyll Data (Terra/MODIS) with a 9-km spatial resolution (NASA Goddard Space Flight Center, 2018) (https://oceandata.sci.gsfc.nasa.gov/directdataaccess/). Therefore, the research period covered the years from 2000 to 2018. The monthly SST data with 1° resolution from 2000 to 2018 were sourced from NOAA Extended Reconstructed SST v5 (Huang et al., 2017) (https://psl.noaa.gov/data/gridded/data.noaa.ersst.v5.html). The chlorophyll-a and SST data were then computed seasonally and averaged over each region to calculate the MD50, aligning with the spatial and temporal stratifications of β. The quarterly MD50 and β from 2000 to 2018 for four regions were then used to analyze the relationship between food availability and recruitment of bigeye tuna.
As the variables followed normal distributions, linear regression analysis was used to evaluate the relationship between MD50 and β. As previously stated, tuna larvae demonstrate a rapid growth in their early life history, becoming juveniles within the first month of life. To validate the significance of food availability at the egg-hatching stage, the time-lag effects were disregarded in this study since new recruitments were defined in the stock assessment model as occurring every season (Fu, 2019).
Given that the metrics of the data sets are distinct, Z-score standardization was applied to normalize individual distributions. The Z-score formula is (Equation 7):
where X is the original data value, and s are the mean and the standard deviation, respectively. A converted Z will result in a distribution with a mean of 0 and a variance of 1.
The distributions of β and MD50 for each region can be visualized in Figure 2. Given that β represents density-independent mortality in the B–H function, the negative monotonic relationship observed between β and MD50 implies that lower food availability would lead to higher mortality and, consequently, diminished recruitment levels. According to Figure 2, the majority of MD50 is negatively related to β as hypothesized, although there are some outliers. The outliers with lower MD50 values but still lower β mean that there is less food availability but higher recruitment compared to other points. When plotting β against MD50 by season, it appears that most outliers arise from the same season. In the regions R1N, R2, and R3, outliers predominantly occurred in season 2 (April–June). In the region R1S, outliers were primarily attributed to season 3 (July–September). We referred to these seasons as anomalous seasons, which make it more difficult to find mean patterns. Therefore, for each area, two comparisons were carried out between β and MD50 time series: one using the original datasets and the other with the anomalous seasons associated with the outliers removed and only containing the normal season. In all regions, the time series of β and MD50 have significant opposite trends, especially when the anomalous seasons were excluded (Figure 3).
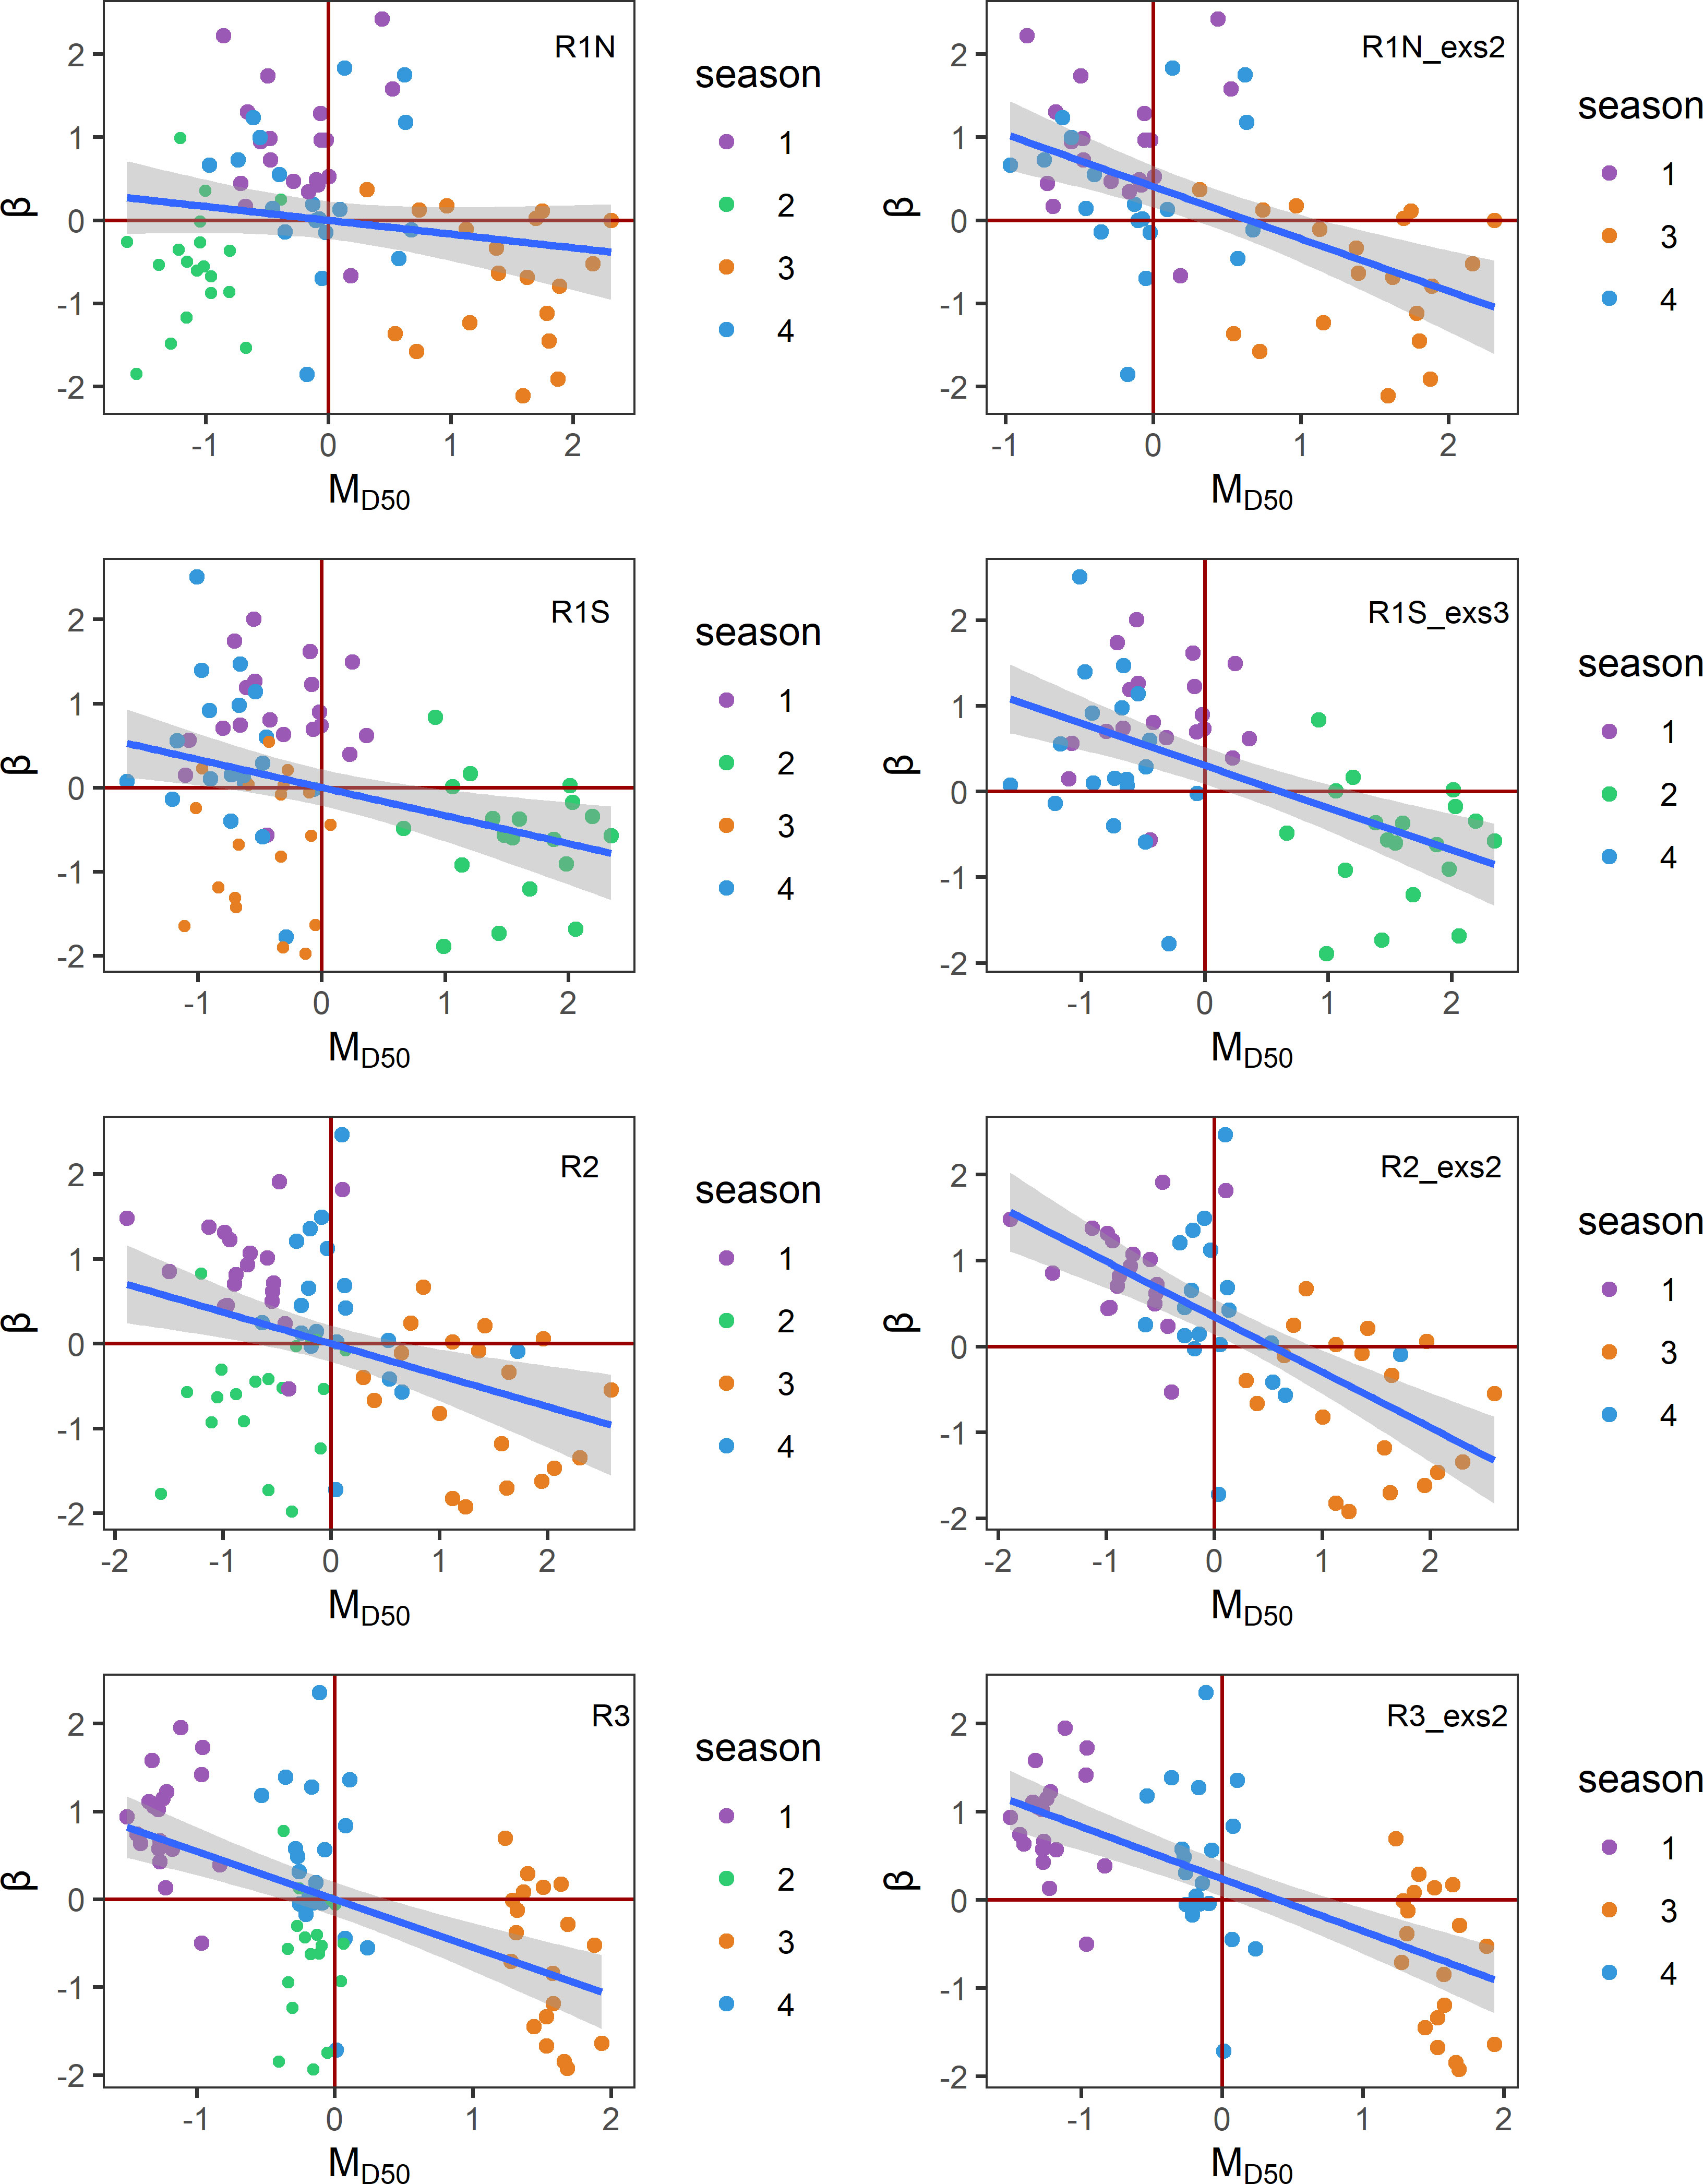
Figure 2 Scatter plots of Z-transformed MD50 and β with fitted linear regression lines in four regions. The figures on the left include all-season data, while the figures on the right exclude anomalous seasons. R1N_exs2, excluding season 2 data in R1N; R1S_exs3, excluding season 3 data in R1S; R2_exs2, excluding season 2 data in R2; R3_exs2, excluding season 2 data in R3.
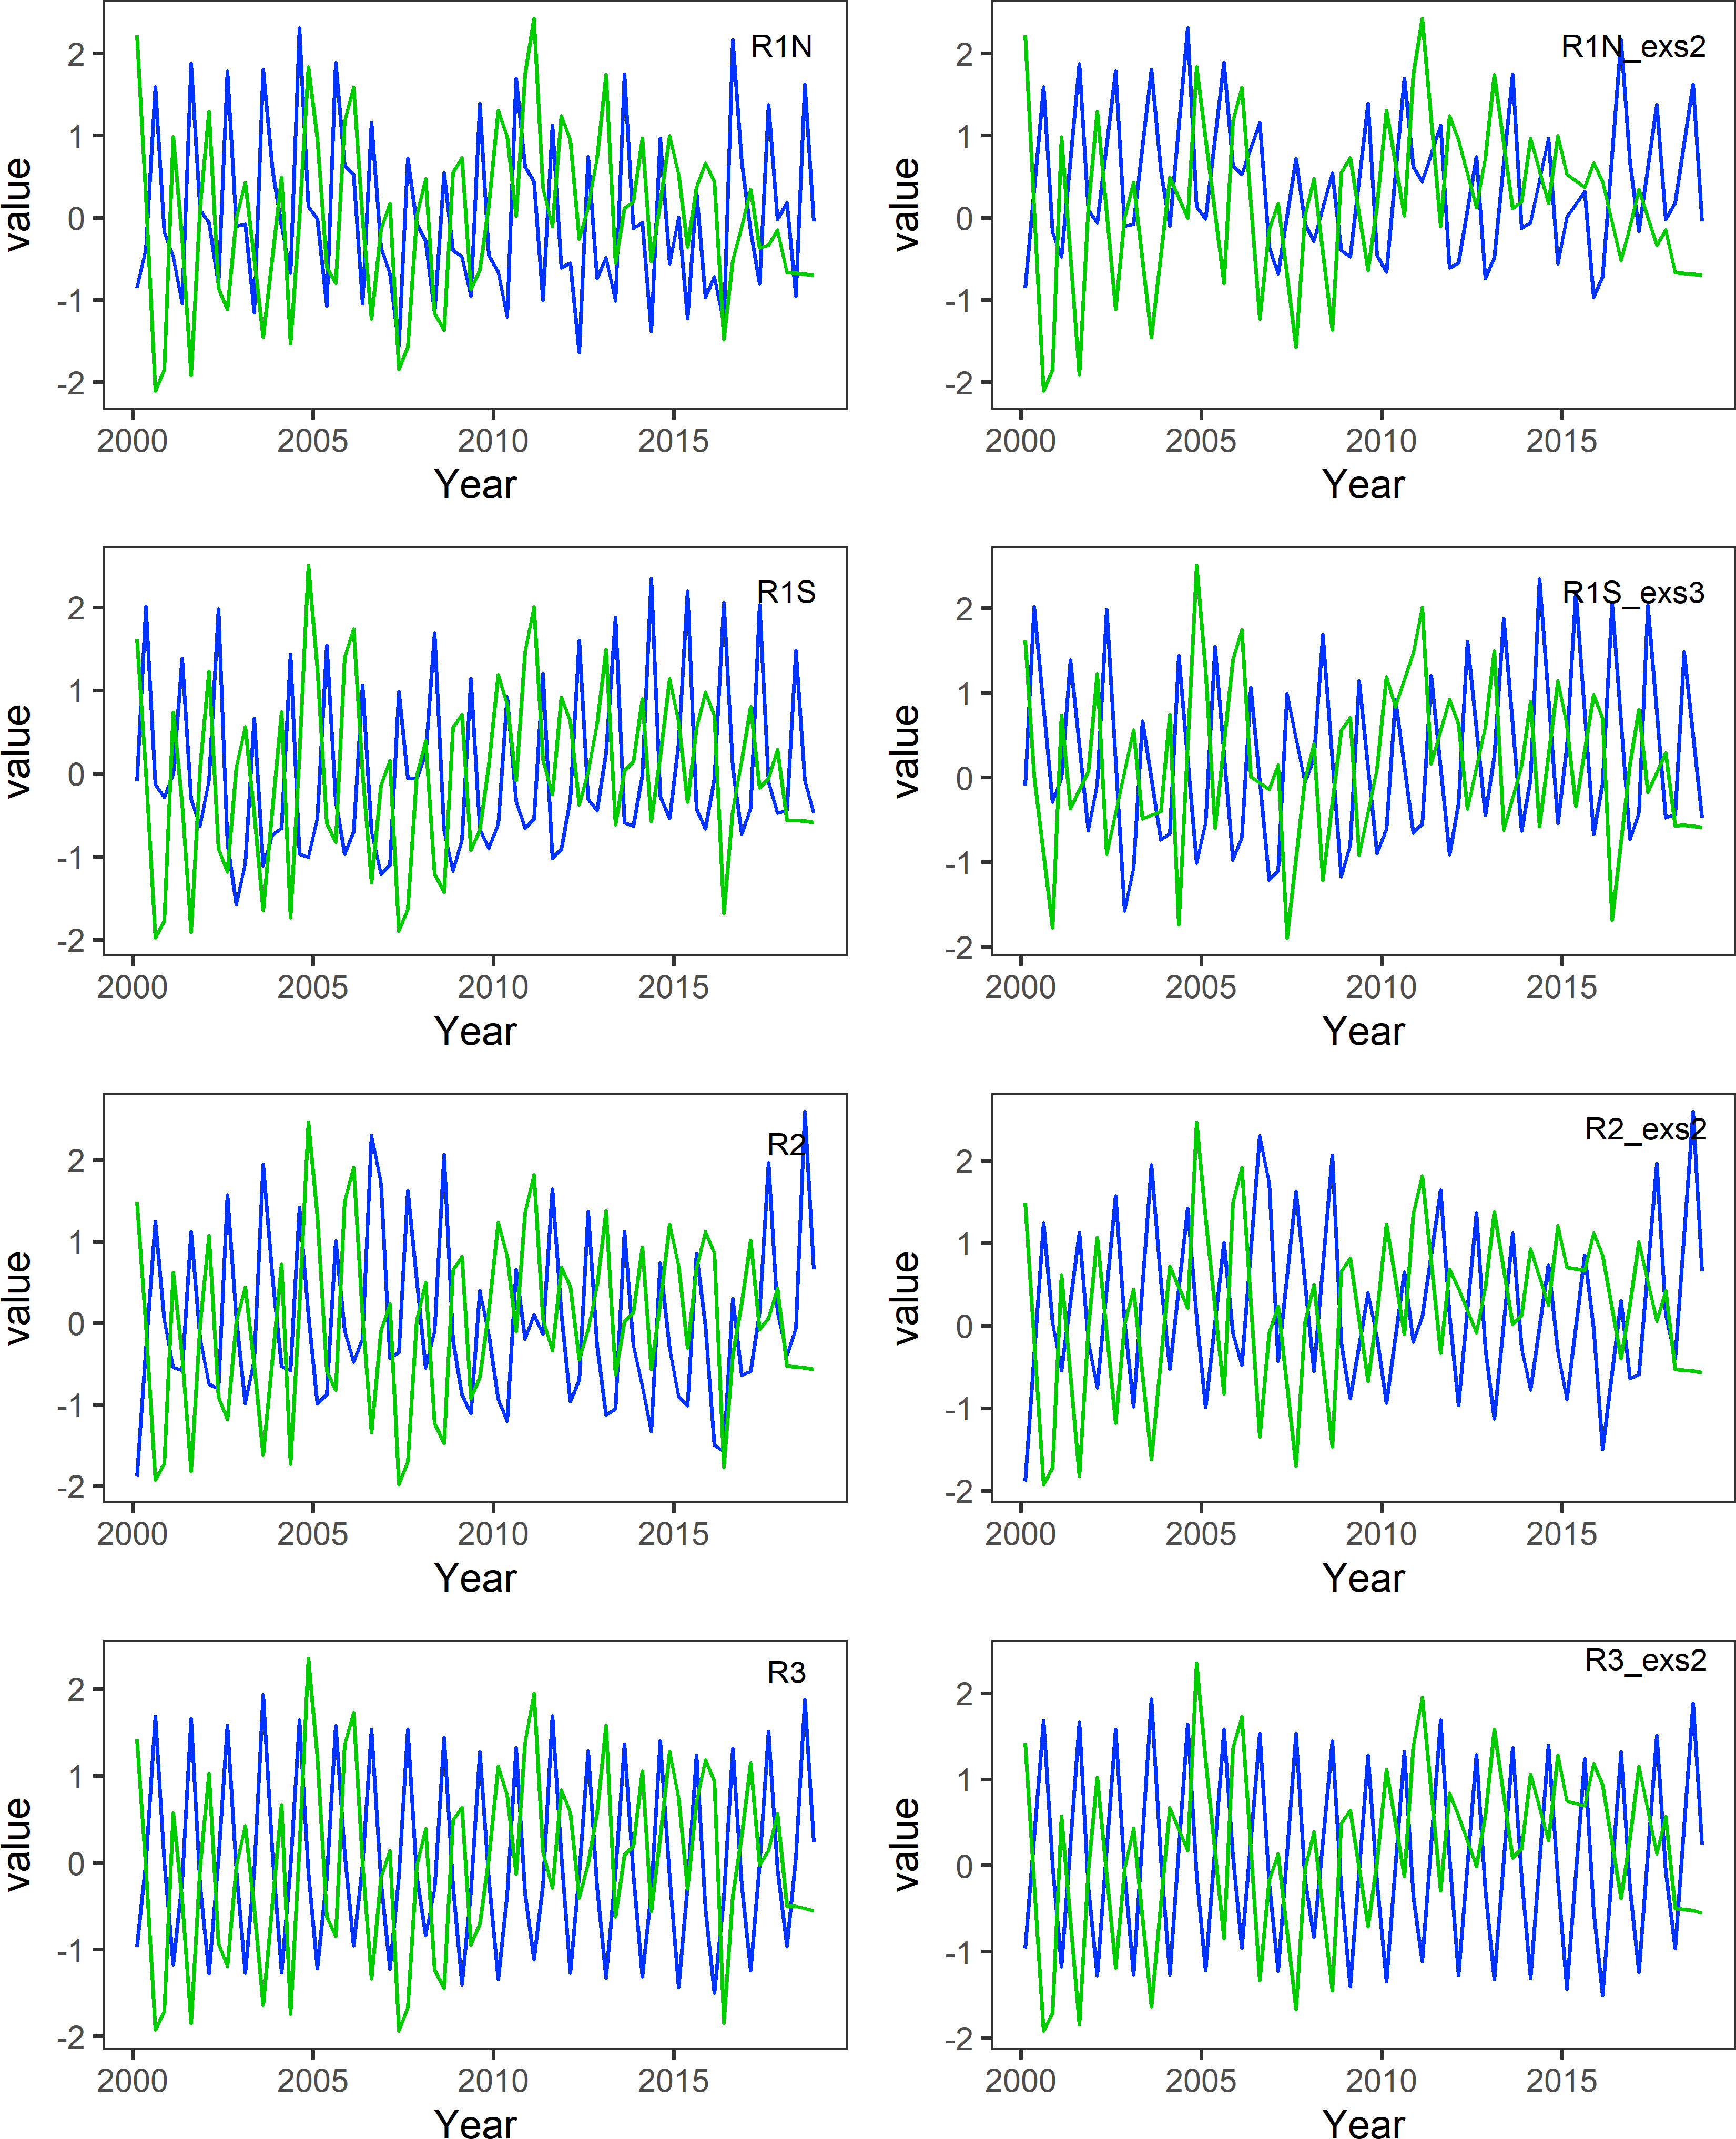
Figure 3 Time series of Z-transformed MD50 (blue) and β (green) from 2000 to 2018. The figures on the left include all-season data, while the figures on the right exclude anomalous seasons. R1N_exs2, excluding season 2 data in R1N; R1S_exs3, excluding season 3 data in R1S; R2_exs2, excluding season 2 data in R2; R3_exs2, excluding season 2 data in R3.
Model 1 was developed using data from all seasons, while model 2 utilized the data excluding anomalous seasons. The results of linear regression are presented in Table 1, and the Pearson correlation coefficients are shown in Table 2. According to model 1, MD50 showed significant negative linear relationships with β in regions R1S (p = 0.003, r = -0.333), R2 (p < 0.001, r = -0.371), and R3 (p < 0.001, r = -0.546). However, no significant correlation was found in region R1N (p = 0.152, r = -0.166). Upon the removal of the anomalous season, model 2 exhibited enhanced correlations. β and MD50 had significant correlations (p < 0.001) in all regions, with correlation coefficients being -0.544 in R1N, -0.561 in R1S, -0.665 in R2, and -0.677 in R3, respectively. The residual diagnostics of the linear regression models were shown as Q–Q plots in Figure 4.
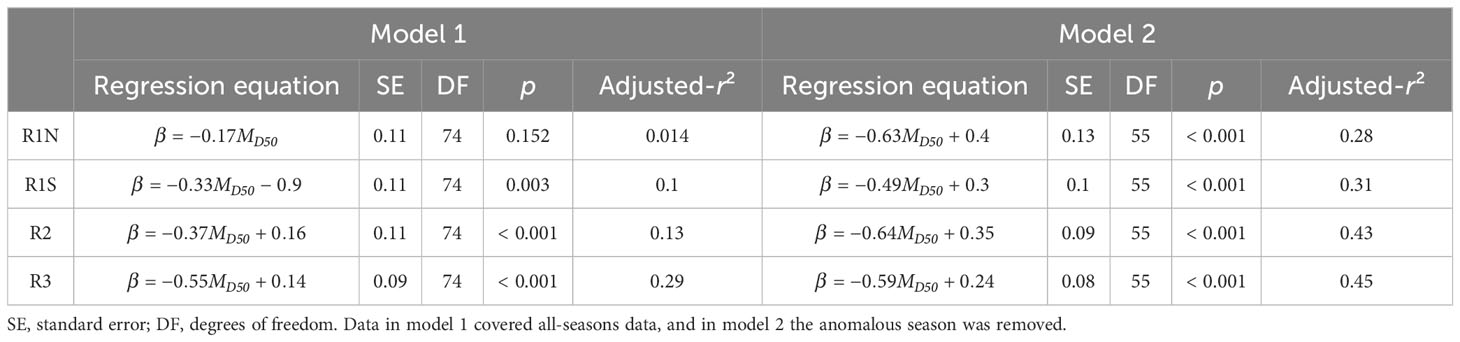
Table 1 Summary of regression analysis on β and MD50 in four regions.
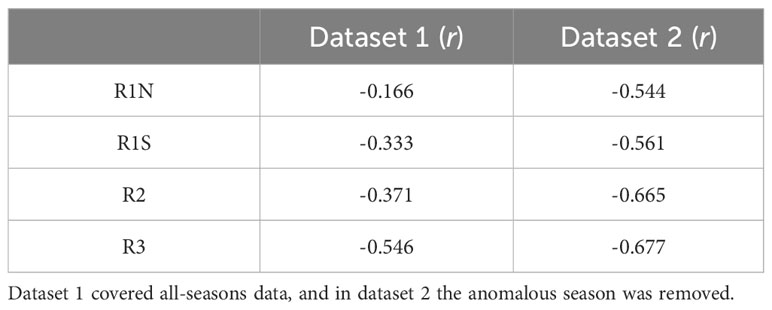
Table 2 Correlation coefficients between β and MD50 in four regions.
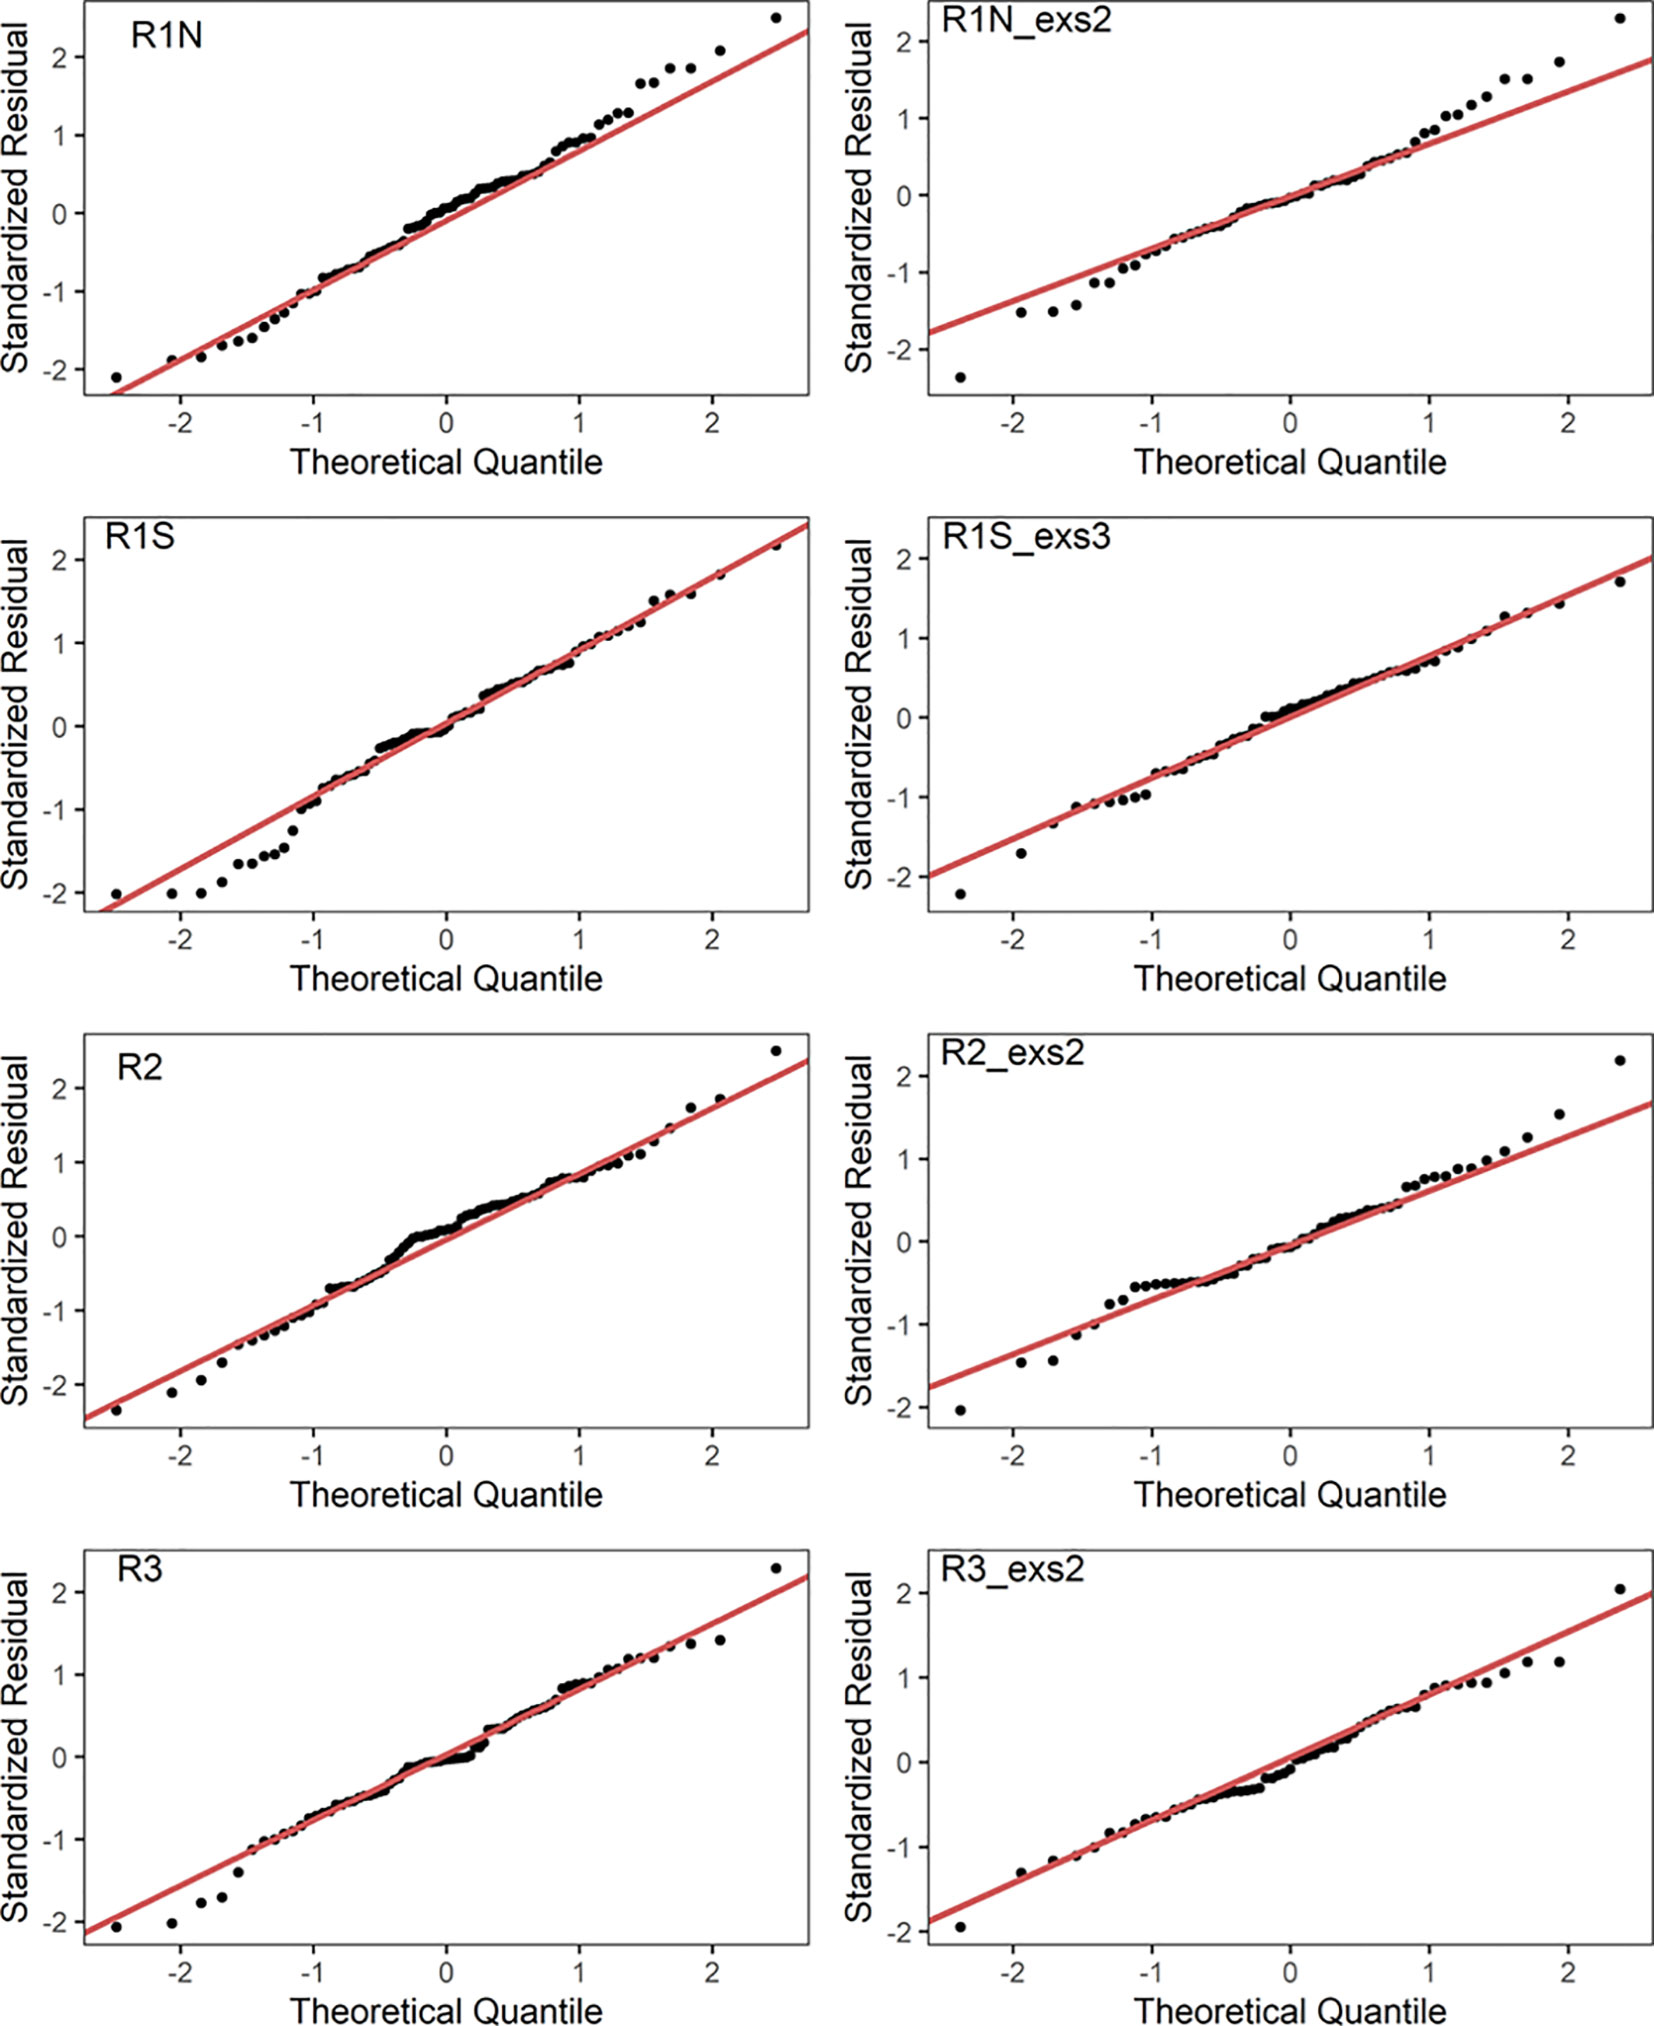
Figure 4 Residual diagnostics of linear regression models as Q–Q plots. R1N_exs2, excluding season 2 data in R1N; R1S_exs3, excluding season 3 data in R1S; R2_exs2, excluding season 2 data in R2; R3_exs2, excluding season 2 data in R3.
The results highlight that food availability plays a crucial role in bigeye tuna recruitment, thereby supporting the hypothesis of the “critical period”, which posits that the survival rate of newly hatched larvae is highly sensitive to feeding conditions during the first feeding stage (Hjort, 1914). A noteworthy negative relationship is observed between β and MD50 fit across all regions. It is generally believed that the eastern Indian Ocean (R2) serves as the principal spawning area, and the temperate region (R3) functions as the feeding grounds for bigeye tuna (Reglero et al., 2014; Muhling et al., 2017; Fu, 2019). Accordingly, the highest values of correlation coefficients were discovered in the R3 and closely followed by R2. It is worth mentioning that tuna larvae exhibit a marked preference for warmer waters (García et al., 2013; Alvarez et al., 2021), and R3 is located in the temperate Indian Ocean where the temperature is presumably cooler for bigeye tuna spawning or larval survival. The high correlation coefficient in R3 could be ascribed to the increased metabolic demands in lower-temperature environments. The results of this study indicate that, in addition to temperature reported by literature, food availability also strongly influences recruitment success. The “critical period” hypothesis was also borne out in the study of Woodworth-Jefcoats and Wren (2020). In their study, MD50 was identified as an environmental driver of bigeye tuna recruitment and can be an informative predictor of bigeye tuna catch rates in Hawaii’s deep-set longline fishery with a 4-year forecast window, aligning with the results of our study. The importance of food availability on recruitment is also found in other marine fishes, e.g., Pomacentrus amboinensis (Jones, 1986), Sardina pilchardus (Guisande et al., 2001), and North Sea cod (Olsen et al., 2011). Regional differences should also be noticed in this study. Across the four regions, we observed different correlation coefficients between food availability and recruitment. This heterogeneity emphasized the importance of spatially structured stock assessment. Accurately accounting for population structure in stock assessments can improve model performance and reduce bias (Punt, 2019).
A strong seasonal pattern was evident in the results. The recruitment is lower during seasons 1 and 4 and corresponds to the lower MD50 in all regions. Recruitment is higher during seasons 2 and 3. However, MD50 are relatively lower in season 2 in R1N, R2, and R3. Based on the previous hypothesis that more food could bring more recruitment, season 2 with opposite trends may be anticipated to be the spawning season. Despite the insufficient food supply, numerous eggs may also contribute to higher recruitment. Besides this, spawning seasons often coincide with optimal environmental conditions that support egg development and survival. Some researchers have shown that the lipid composition of egg improved due to the alteration of habitat that adults are exposed to during the spawning seasons (Navas et al., 1997; Yanes-Roca et al., 2009). A higher lipid composition of fish eggs enhances their survival and development by providing energy reserves, essential fatty acids for structural integrity, and resilience against environmental stressors (Singh et al., 2021). Consequently, high-quality eggs generally lead to higher hatching rates, improving the recruitment success (Kjørsvik et al., 2003; Ienaga et al., 2021). However, very limited studies verified the egg quality of bigeye tuna in the Indian Ocean, more efforts still need to be conducted. It is also challenging to explain why the spawning season in R1S deviates from expectations. Furthermore, previous studies have demonstrated that bigeye tuna spawn in the western Indian Ocean between January and April and in the eastern Indian Ocean from December to January and in June (Nootmorn, 2004; Zudaire et al., 2022), which is not consistent with the findings of this study. Given that the model time step is arbitrarily divided, it may lack the flexibility to accurately reflect the complex spawning behavior in nature. In addition, if there are inaccuracies in the growth function estimation, the recruitment timing may also be biased.
There is also considerable uncertainty associated with recruitment estimates obtained from tuna stock assessment models. While growth, selectivity, and natural mortality are typically assumed to be constant over time in stock assessments, recruitment exhibits considerable temporal variations owing to the egg production and the subsequent larvae survival being highly sensitive to both biotic and abiotic factors (Maunder and Thorson, 2019). Most tuna stock assessments (including the Indian Ocean bigeye tuna stock assessment) recognize the concurrent existence of the process and observation errors. The Stock Synthesis model modeled recruitment deviations as log-normally distributed and estimated based on a stationary B–H relationship using a penalized likelihood approach. However, researchers have found that, compared to the penalized likelihood approach, the marginal likelihood approach possesses superior statistical properties (Maunder and Deriso, 2003; Valpine and Hilborn, 2005). Apart from that, estimating the parameters and variance of the stock–recruitment remains a complex task. In the Indian Ocean bigeye tuna stock assessment, the steepness is usually set at 0.7, 0.8, and 0.9, and the CV (σR) is fixed at 0.6. Several studies have pointed out that σR is frequently overestimated, and there are still controversies regarding the setting of σR in tuna stock assessments (ISSF, 2011; Kolody et al., 2019). Fishery-independent recruitment monitoring programs are desirable to increase the precision of population estimation and reduce management uncertainty and risk. However, due to the high cost and logistical challenges, they remain rare in tuna management (Kolody et al., 2019).
Environmental covariates have been integrated into recruitment estimation in various ways. Galindo-Cortes et al. (2010) explored the effect of environmental variables on the Pacific sardine (Sardinops sagax) stock–recruitment (S–R) relationship by incorporating these variables into the S–R function as the additive random errors. Crone et al. (2019) proposed including environmental information in the integrated stock assessments to inform the S–R dynamics. Both methods generated relatively high-quality estimates, either by including environmental covariates as an additional component of the S–R function or by fitting covariates in the model as a survey index of recruits outside the S–R function. These methods could potentially pave the way for incorporating chl-a data into the bigeye tuna S–R function.
More and more research continue to illustrate that the effects of climate change and environmental drivers on fisheries cannot be overlooked. There has been an increased interest in incorporating environmental factors in recruitment forecasting models (Haltuch et al., 2019), and a variety of models have been developed to explore the feasibility of the approach—for example, Langley et al. (2009) developed a generalized linear model (GLM) to predict the variation in yellowfin tuna (Thunnus albacares) recruitment across the western and central Pacific Ocean in relation to a multitude of environmental variables. They reported that integrating the recent GLM recruitment indices into stock assessment may enhance the precision of estimates of the current and projected (in the next 1 to 2 years) biomass and exploitation. Miller et al. (2016) proposed a state-space approach that treats environmental covariates (the mid-Atlantic cold pool) as stochastic processes and estimated the effects of the environment variables on southern New England yellowtail flounder (Limanda ferruginea) recruitment. Although the results suggest that the cold pool was an important predictor of recruitment, the projections were less than ideal due to the uncertainty associated with the projected cold pool. Haltuch et al. (2019) suggested that environmentally informed recruitment forecasting would be more successful for species whose population dynamics are dominated by recruitment and where recruitment is driven by strong environmental factors. Since the results of this study indicated a strong correlation between food availability and bigeye tuna recruitment, future research could concentrate on forecasting recruitment by incorporating MD50 data and identifying more informative environmental predictors.
This paper attempts to investigate the relationship between food availability and the recruitment success of bigeye tuna in the Indian Ocean based on the available data of IOTC. The median phytoplankton size (MD50) was used as a proxy for the larval food quality. We examined the connection between MD50 and the environment-related mortality parameter (β) of the Beverton–Holt stock–recruitment function and also considered the spatial differences in the Indian Ocean. We observed that the time series of β and MD50 exhibits significant opposite trends. MD50 was negatively related to β, suggesting that larger MD50 could bring lower mortality and therefore higher recruitment. This research strongly suggests the importance of incorporating environmental oceanographic variables, such as those related to pre-recruit feeding, into recruitment estimates in the stock assessment of bigeye tuna in the Indian Ocean.
The datasets presented in this article are not readily available because the authors do not have permission to share the stock assessment data. Environmental data will be made available on request. Requests to access the datasets should be directed to YW, c2hvdXd5aEAxNjMuY29t.
YW: Conceptualization, Data curation, Formal analysis, Investigation, Methodology, Writing – original draft. YZ: Conceptualization, Methodology, Supervision, Writing – review & editing. ZG: Data curation, Methodology, Writing – review & editing. JZ: Funding acquisition, Supervision, Writing – review & editing.
The author(s) declare financial support was received for the research, authorship, and/or publication of this article. This research was supported by Program on the Survey, Monitoring and Assessment of Global Fishery Resources sponsored by the Ministry of Agriculture and Rural Affairs.
We are grateful to the working party on tropical tuna (WPTT) of the Indian Ocean Tuna Commission (IOTC) for the stock assessment data.
The authors declare that the research was conducted in the absence of any commercial or financial relationships that could be construed as a potential conflict of interest.
All claims expressed in this article are solely those of the authors and do not necessarily represent those of their affiliated organizations, or those of the publisher, the editors and the reviewers. Any product that may be evaluated in this article, or claim that may be made by its manufacturer, is not guaranteed or endorsed by the publisher.
Alvarez I., Rasmuson L. K., Gerard T., Laiz-Carrion R., Hidalgo M., Lamkin J. T., et al. (2021). Influence of the seasonal thermocline on the vertical distribution of larval fish assemblages associated with Atlantic bluefin tuna spawning grounds. Oceans 2, 64–83. doi: 10.3390/oceans2010004
Anderson J. T. (1988). A review of size dependant survival during pre-recruit stages of fishes in relation to recruitment. J. Northwest Atlantic Fishery Sci. 8, 55–66. doi: 10.2960/J.v8.a6
Artetxe-Arrate I., Fraile I., Marsac F., Farley J. H., Rodriguez-Ezpeleta N., Davies C. R., et al. (2021). “A review of the fisheries, life history and stock structure of tropical tuna (skipjack Katsuwonus pelamis, yellowfin Thunnus albacares and bigeye Thunnus obesus) in the Indian Ocean,” in Advances in Marine Biology (San Diego, California, United States: Academic Press), 39–89. doi: 10.1016/bs.amb.2020.09.002
Barnes C., Irigoien X., De Oliveira J. A. A., Maxwell D., Jennings S. (2011). Predicting marine phytoplankton community size structure from empirical relationships with remotely sensed variables. J. Plankton Res. 33, 13–24. doi: 10.1093/plankt/fbq088
Beverton R. J. H., Holt S. J. (1957). On the dynamics of exploited fish populations (London: Springer Dordrecht). doi: 10.1007/978-94-011-2106-4
Camp E., Collins A. B., Ahrens R. N., Lorenzen K. (2020). Fish Population Recruitment: What recruitment means and why it matters. EDIS 2020, 6. doi: 10.32473/edis-FA241-2022
Crone P. R., Maunder M. N., Lee H., Piner K. R. (2019). Good practices for including environmental data to inform spawner-recruit dynamics in integrated stock assessments: Small pelagic species case study. Fish. Res. 217, 122–132. doi: 10.1016/j.fishres.2018.12.026
Cuttitta A., Torri M., Zarrad R., Zgozi S., Jarboui O., Quinci E. M., et al. (2018). Linking surface hydrodynamics to planktonic ecosystem: the case study of the ichthyoplanktonic assemblages in the Central Mediterranean Sea. Hydrobiologia 821, 191–214. doi: 10.1007/s10750-017-3483-x
Francis R. (1992). Use of Risk Analysis to Assess Fishery Management Strategies: A Case Study using Orange Roughy (Hoplostethus atlanticus) on the Chatham Rise, New Zealand. Can. J. Fish. Aquat. Sci. 49, 922–930. doi: 10.1139/f92-102
Fu D. (2019). Preliminary Indian Ocean Bigeye Tuna Stock Assessment 1950-2018 (Stock Synthesis) (Seychelles: Indian Ocean Tuna Commission), IOTC–2019–WPTT21–61.
Galindo-Cortes G., De Anda-Montañez J. A., Arreguín-Sánchez F., Salas S., Balart E. F. (2010). How do environmental factors affect the stock–recruitment relationship? The case of the Pacific sardine (Sardinops sagax) of the northeastern Pacific Ocean. Fish. Res. 102, 173–183. doi: 10.1016/j.fishres.2009.11.010
García A., Cortés D., Quintanilla J., Rámirez T., Quintanilla L., Rodríguez J. M., et al. (2013). Climate-induced environmental conditions influencing interannual variability of Mediterranean bluefin (Thunnus thynnus) larval growth. Fish. Oceanogr. 22, 273–287. doi: 10.1111/fog.12021
Guisande C., Cabanas J. M., Vergara A. R., Riveiro I. (2001). Effect of climate on recruitment success of Atlantic Iberian sardine Sardina pilchardus. Mar. Ecol. Prog. Ser. 223, 243–250. doi: 10.3354/meps223243
Haltuch M. A., Brooks E. N., Brodziak J., Devine J. A., Johnson K. F., Klibansky N., et al. (2019). Unraveling the recruitment problem: A review of environmentally-informed forecasting and management strategy evaluation. Fish. Res. 217, 198–216. doi: 10.1016/j.fishres.2018.12.016
Hjort J. (1914). Fluctuations in the great fisheries of northern Europe viewed in the light of biological research. Rapp. Conserv. Explor. Mer. 20, 1–228.
Huang B., Thorne P. W., Banzon V. F., Boyer T., Chepurin G., Lawrimore J. H., et al. (2017). NOAA Extended Reconstructed Sea Surface Temperature (ERSST), Version 5 (Boulder, Colorado, United States: NOAA National Centers for Environmental Information). doi: 10.7289/V5T72FNM
Ienaga N., Higuchi K., Takashi T., Gen K., Tsuda K., Terayama K. (2021). Vision-based egg quality prediction in Pacific bluefin tuna (Thunnus orientalis) by deep neural network. Sci. Rep. 11, 6. doi: 10.1038/s41598-020-80001-0
ISSF (2011). Report of the 2011 ISSF Stock Assessment Workshop Rome, Italy, March14-17, 2011, ISSF Technical Report 2011-02 (Washington, D.C., USA: International Seafood Sustainability Foundation).
ISSF (2022). Status of the world fisheries for tuna. Nov. 2022, ISSF Technical Report 2022-15 (Pittsburgh, PA, USA: International Seafood Sustainability Foundation).
Jones G. P. (1986). Food availability affects growth in a coral reef fish. Oecologia 70, 136–139. doi: 10.1007/BF00377123
Kjørsvik E., Hoehne-Reitan K., Reitan K. I. (2003). Egg and larval quality criteria as predictive measures for juvenile production in turbot (Scophthalmus maximus L.). Aquaculture 227, 9–20. doi: 10.1016/S0044-8486(03)00492-7
Kolody D. S., Eveson J. P., Preece A. L., Davies C. R., Hillary R. M. (2019). Recruitment in tuna RFMO stock assessment and management: A review of current approaches and challenges. Fish. Res. 217, 217–234. doi: 10.1016/j.fishres.2018.11.031
Langley A., Briand K., Kirby D. S., Murtugudde R. (2009). Influence of oceanographic variability on recruitment of yellowfin tuna (Thunnus albacares) in the western and central Pacific Ocean. Can. J. Fish. Aquat. Sci. 66, 1462–1477. doi: 10.1139/F09-096
Llopiz J. K., Hobday A. J. (2015). A global comparative analysis of the feeding dynamics and environmental conditions of larval tunas, mackerels, and billfishes. Deep Sea Res. Part II: Topical Stud. Oceanogr. 113, 113–124. doi: 10.1016/j.dsr2.2014.05.014
Mace P. M., Doonan I. J., Fisheries M. (1988). A Generalised Bioeconomic Simulation Model for Fish Population Dynamics (Wellington, New Zealand: MAFFish, N.Z. Ministry of Agriculture and Fisheries).
Maunder M. N., Deriso R. B. (2003). Estimation of recruitment in catch-at-age models. Can. J. Fish. Aquat. Sci. 60, 1204–1216. doi: 10.1139/f03-104
Maunder M. N., Thorson J. T. (2019). Modeling temporal variation in recruitment in fisheries stock assessment: a review of theory and practice. Fish. Res. 217, 71–86. doi: 10.1016/j.fishres.2018.12.014
Menden-Deuer S., Lessard E. J. (2000). Carbon to volume relationships for dinoflagellates, diatoms, and other protest plankton. Limnol. Oceanogr. 45, 569–579. doi: 10.1111/faf.12534
Miller T. J., Hare J. A., Alade L. A. (2016). A state-space approach to incorporating environmental effects on recruitment in an age-structured assessment model with an application to southern New England yellowtail flounder. Can. J. Fish. Aquat. Sci. 73, 1261–1270. doi: 10.1139/cjfas-2015-0339
Miller T. J., Brooks E. N. (2021). Steepness is a slippery slope. Fish and Fisheries 22 (3), 634–645. doi: 10.1111/faf.12534
Miyashita S., Sawada Y., Okada T., Murata O., Kumai H. (2001). Morphological development and growth of laboratory-reared larval and juvenile Thunnus thynnus (Pisces: Scombridae). Fish Bull. 99, 601–616. Available at: http://hdl.handle.net/1834/25539.
Muhling B. A., Lamkin J. T., Alemany F., García A., Farley J., Ingram G. W., et al. (2017). Reproduction and larval biology in tunas, and the importance of restricted area spawning grounds. Rev. Fish Biol. Fish. 27, 697–732. doi: 10.1007/s11160-017-9471-4
Muhling B. A., Tommasi D., Ohshimo S., Alexander M. A., DiNardo G. (2018). Regional-scale surface temperature variability allows prediction of Pacific bluefin tuna recruitment. ICES J. Mar. Sci. 75, 1341–1352. doi: 10.1093/icesjms/fsy017
NASA Goddard Space Flight Center, O.E.L., Ocean Biology Processing Group (2018). MODIS-TERRA Level 3 Mapped Chlorophyll Data Version R2018.0 (Greenbelt, MA, United States: NASA Ocean Biology DAAC). doi: 10.5067/TERRA/MODIS/L3M/CHL/2018
Navas J. M., Bruce M., Trush M., Farndale B. M., Bromage N., Zanuy S., et al. (1997). The impact of seasonal alteration in the lipid composition of broodstock diets on egg quality in the European sea bass. J. Fish Biol. 51, 760–773. doi: 10.3989/SCIMAR.2001.65N111
Nishikawa Y., Kenkyūjo S. E. S. (1985). Average distribution of larvae of oceanic species of Scombroid fishes 1956-1981 (Shizuoka, Japan: Far Seas Fisheries Research Laboratory).
Nootmorn P. (2004). Reproductive Biology of Bigeye tuna in the eastern Indian ocean. IOTC Proc. 7, 1–5.
Olsen E. M., Ottersen G., Llope M., Chan K. S., Beaugrand G., Stenseth N. C. (2011). Spawning stock and recruitment in North Sea cod shaped by food and climate. Proc. R. Soc. B: Biol. Sci. 278, 504–510. doi: 10.1098/rspb.2010.1465
Polovina J. J., Woodworth P. A. (2012). Declines in phytoplankton cell size in the subtropical oceans estimated from satellite remotely-sensed temperature and chlorophyll 1998–2007. Deep Sea Res. Part II: Topical Stud. Oceanogr. 77-80, 82–88. doi: 10.1016/j.dsr2.2012.04.006
Punt A. E. (2019). Spatial stock assessment methods: a viewpoint on current issues and assumptions. Fish. Res. 213, 132–143. doi: 10.1016/j.fishres.2023.106650
Reglero P., Tittensor D. P., Álvarez-Berastegui D., Aparicio-González A., Worm B. (2014). Worldwide distributions of tuna larvae: revisiting hypotheses on environmental requirements for spawning habitats. Mar. Ecol. Prog. Ser. 501, 207–224. doi: 10.3354/meps10666
Robert D., Murphy H. M., Jenkins G. P., Fortier L. (2013). Poor taxonomical knowledge of larval fish prey preference is impeding our ability to assess the existence of a “critical period” driving year-class strength. ICES J. Mar. Sci. 71, 2042–2052. doi: 10.1093/icesjms/fst198
Russo S., Torri M., Patti B., Musco M., Masullo T., Di Natale M. V., et al. (2022). Environmental conditions along tuna larval dispersion: insights on the spawning habitat and impact on their development stages. Water 14 (10), 1568. doi: 10.3390/w14101568
Schaefer K. M. (2001). Reproductive biology of tunas, Fish Physiology (San Diego, California, United States: Academic Press), 225–270. doi: 10.1016/S1546-5098(01)19007-2
Secretariat I. (2022). Review of Indian Ocean bigeye tuna statistical data Indian Ocean Tuna Commission. (Seychelles: Indian Ocean Tuna Commission).
Shropshire T. A., Morey S. L., Chassignet E. P., Karnauskas M., Coles V. J., Malca E., et al. (2022). Trade-offs between risks of predation and starvation in larvae make the shelf break an optimal spawning location for Atlantic bluefin tuna. J. Plankton Res. 44, 782–798. doi: 10.1093/plankt/fbab041
Sifa L., Mathias J. A. (1987). The critical period of high mortality of larvae fish —A discussion based on current research. Chin. J. Oceanol. Limnol. 5, 80–96. doi: 10.1007/BF02848526
Singh S. K., Baidya S., Das P., Biswas P. (2021). “Functional Role of Dietary Supplements on Reproductive Physiology of Fishes,” in Recent updates in molecular Endocrinology and Reproductive Physiology of Fish. Eds. Sundaray J. K., Rather M. A., Kumar S., Agarwal D. (Singapore: Springer), 243–258. doi: 10.1007/978-981-15-8369-8_17
Valpine P.d., Hilborn R. (2005). State-space likelihoods for nonlinear fisheries time-series. Can. J. Fish. Aquat. Sci. 62, 1937–1952. doi: 10.1139/f05-116
Vincent M. T., Hampton J. (2018). Incorporation of updated growth information within the 2017 WCPO bigeye stock assessment grid and examination of the sensitivity of estimates to alternative model spatial structures. Working Paper WCPFC-SC14-2018/SA-WP-03 presented to the Fourteenth Regular Session of the Scientific Committee of the Western and Central Pacific Fisheries, Busan, Republic of Korea. Available at: https://meetings.wcpfc.int/node/10717.
Woodworth-Jefcoats P. A., Wren J. L. K. (2020). Toward an environmental predictor of tuna recruitment. Fish. Oceanogr. 29, 436–441. doi: 10.1111/fog.12487
Yanes-Roca C., Rhody N., Nystrom M., Main K. L. (2009). Effects of fatty acid composition and spawning season patterns on egg quality and larval survival in common snook (Centropomus undecimalis). Aquaculture 287, 335–340. doi: 10.1016/j.aquaculture.2008.10.043
Zhu G., Dai X., Xu L., Zhou Y. (2010). Reproductive biology of Bigeye Tuna, Thunnus obesus, (Scombridae) in the eastern and central tropical Pacific Ocean. Environ. Biol. Fishes 88, 253–260. doi: 10.1007/s10641-010-9636-7
Keywords: recruitment, larvae survival, phytoplankton, bigeye tuna, Indian Ocean
Citation: Wang Y, Zhang Y, Geng Z and Zhu J (2024) Impacts of phytoplankton availability on bigeye tuna (Thunnus obesus) recruitment in the Indian Ocean. Front. Mar. Sci. 11:1392273. doi: 10.3389/fmars.2024.1392273
Received: 27 February 2024; Accepted: 26 June 2024;
Published: 19 July 2024.
Edited by:
Fabio Fiorentino, National Research Council (CNR), ItalyReviewed by:
Bernardo Patti, National Research Council (CNR), ItalyCopyright © 2024 Wang, Zhang, Geng and Zhu. This is an open-access article distributed under the terms of the Creative Commons Attribution License (CC BY). The use, distribution or reproduction in other forums is permitted, provided the original author(s) and the copyright owner(s) are credited and that the original publication in this journal is cited, in accordance with accepted academic practice. No use, distribution or reproduction is permitted which does not comply with these terms.
*Correspondence: Jiangfeng Zhu, amZ6aHVAc2hvdS5lZHUuY24=
Disclaimer: All claims expressed in this article are solely those of the authors and do not necessarily represent those of their affiliated organizations, or those of the publisher, the editors and the reviewers. Any product that may be evaluated in this article or claim that may be made by its manufacturer is not guaranteed or endorsed by the publisher.
Research integrity at Frontiers
Learn more about the work of our research integrity team to safeguard the quality of each article we publish.