 Ghoufrane Derhy
 Khalid Elkalay
 Margarita María Rincón
 Karima Khalil1
- 1Laboratory of Applied Sciences for the Environment and Sustainable Development, School of Technology Essaouira, Cadi Ayyad University, Essaouira, Morocco
- 2Centro Oceanografico de Cádiz (COCAD-IEO), CSIC, Cádiz, Spain
Fisheries management needs to ensure that resources are exploited sustainably and the risk of depletion is at an acceptable level. In developing countries, multi-gear, multispecies fisheries often lack data, making conventional stock assessment approaches unsuitable. Data-limited methods have been developed to compare quantitative measures of fishery and stock status with management and biological reference points. In Morocco, despite its large productive ecosystems, most of the fishing stocks remain unassessed. We selected a stock of chub mackerel, considering the availability of survey data, and the fact that it occupies an important place in small pelagic resources. Although this is an important stock, there is a lack of new information on migration and possible exchange between the two stocks of chub mackerel (central and southern). This study presents the first attempt at a combined assessment to provide Maximum Sustainable Yield (MSY) estimates and related indicators of the Moroccan chub mackerel (center and south) by using two of the most used data-limited approaches, the Stochastic Surplus Production model in Continuous Time (SPiCT) and the Length Based Spawning Potential Ratio estimation (LBSPR). These two approaches were applied to analyze the chub mackerel stock state and estimate how far away it was from the estimated harvest relative to MSY using all available time series data. The findings provide valuable information on MSY advice for this stock while remarking the advantages and limitations of two data-limited approaches for the assessment of chub mackerel. The SPiCT results show that the current harvest level closely aligns with the estimated MSY, and that the estimated biomass (B) is below BMSY, and the estimated fishing mortality (F) exceeds FMSY. For LBSPR, most SPR values are lower than the reference point of 40%, which serves as a proxy for BMSY, indicating also a biomass below BMSY. Both models suggest full to overexploited stock status mainly for the period (2016-2020), and this is a different perception to the one provided only by analyzing survey indices fluctuations that indicate critical status over a longer period. Then, this exercise is also pointing out the importance of having different data sources for a better stock status estimation.
1 Introduction
A large proportion of the world’s fisheries are considered data-poor, and only a fraction of species have been assessed. In data-poor fisheries, the challenge is often for managers to assess the status of fish stock and implement scientific-based management advice (Costello et al., 2012; Hilborn et al., 2020; FAO, 2020a). Recently, several data-limited stock assessment methods have been suggested and widely applied to many fisheries worldwide. As a data-limited fishery, the time series of information available for stock assessment is short or discontinuous data series that includes many gaps (Roa-ureta, 2015; Froese et al., 2017) for supporting quantitative stock assessment approaches. These models are being largely used to estimate stock status and exploitation rates which have been developed rapidly (MacCall, 2009; Dick and MacCall, 2011; Free et al., 2017).
Small-scale fisheries, mainly data-poor stocks, are vital to the livelihoods of millions of people, particularly in developing countries, where they provide essential employment opportunities and support local economies (World bank, 2012). A significant proportion of these fisheries have not been properly assessed, and are in considerably worse condition than the assessed fisheries (Costello et al., 2012). This has led to the development of these new approaches to address requests for management advice on data-limited stocks, which can be limited in estimating Maximum Sustainable Yield (MSY) because of insufficient data (Dick and MacCall, 2011; Thorson et al., 2012; Froese et al., 2017). Most of these methods vary depending on data availability and globally can be divided into catch-based methods, length-based and abundance-based methods (ICES, 2015; Fitzgerald et al., 2018; Liao et al., 2022). Length-based methods rely on length distribution information obtained from catches or surveys, while abundance-based methods utilize time series of commercial catch data and abundance indices as inputs.
The need for clear and easily comprehensible catch limit guidelines arose in fisheries management, leading to the establishment of a predetermined maximum catch that a population could sustain. This concept, referred to as MSY, entails capturing the highest feasible amount from a stock without compromising its long-term capacity to generate sustainable yields (Lart, 2022). It has a century-long history originating from mathematical models introduced to population ecology in the 1930s (Hjort et al., 1933; Tsikliras and Froese, 2019). In the 1950s, Surplus Production models were further developed, contributing to the growth and widespread adoption of MSY (Tsikliras and Froese, 2019). Nowadays, MSY is internationally applied by nearly all regional management bodies, making it a widely utilized tool for assessing exploited fish stocks on a global scale (Milusheva, 2020).
In Morocco, coastal ecosystem modeling is still very limited, although some studies in this field have recently started to be developed, such as trophic, biogeochemical and fisheries modeling (Essekhyr et al., 2019; Ait Ballagh et al., 2021; Damsiri et al., 2021; Rhomad et al., 2021; Derhy et al., 2022; Rhomad et al., 2022). According to the recent published report on halieutic stocks status (INRH/DP, 2019), there has been an increasing trend in catches mainly of small pelagic resources in recent years, and the diagnosis of size structures landed in certain areas calls for vigilance regarding the level of fishing pressure applied to these stocks. Small pelagic stocks dominate the Moroccan continental shelf in terms of both catches and biomass, making them the most significant fishery resource. They constitute over 80% of the total landed catches and contribute significantly to the national economy (DPM, 2019). Due to this strong position, a small pelagic resource management plan has been implemented to ensure the sustainable exploitation of these resources and maximize their value (INRH/DP, 2019). The management approach encompasses various measures such as establishing Total Allowable Catch (TAC) limits per management unit, implementing zoning strategies, and implementing spatial and temporal closures in vulnerable areas to safeguard juvenile and spawning populations during critical periods. Furthermore, supplementary measures have been implemented to regulate fishing mortality on small pelagic species and strengthen the existing management strategies (INRH/DP, 2019). In the 2000s, Morocco initiated the assessment of the target small pelagic fish stocks using a variety of models, including global models based on various methods and Virtual Population Analysis (VPA). These assessments are conducted either by the INRH (National Institute of Fisheries Research) independently or in a collaborative through FAO (CECAF) working groups, depending on the specific stocks under evaluation (INRH/DRH, 2013; INRH/DP, 2019). However, the results of these assessments primarily aim to support decision-makers in refining fisheries management plans but suffer from limited communication and coordination among fishermen (ICES, 2021).
One of the most harvested small pelagic stocks in Morocco is chub mackerel (Scomber colias), which constituted a large part of the overall catch in this region, representing 16% of the overall catch (FAO, 2020b, 2023). Since 1990, catches of this species in the Moroccan Atlantic have shown a general upward trend, reaching a peak of 400000 tons in 2016 (INRH/DP, 2019). An increase of 11% in catch levels was recorded to 420000 tons for 2018 (INRH/DP, 2019). The average catch for the period 1990-2018 was estimated to be about 192000 tons, while the average for the last five years was 379000 tons (FAO, 2023). In the northern (Tangier-Cape cantin) and central (Cape cantin-Cape Bojador A+B) areas of Moroccan Atlantic coast (Figure 1), chub mackerel is exploited depending on its availability by Moroccan coastal purse seiners that mainly target sardines (INRH/DP, 2019). In the southern area (Cabo Bojador-Cap Blanco) (Figure 1), chub mackerel is harvested by Moroccan coastal seiners as well as by Moroccan trawlers of the Refrigerated Sea Water (RSW) type (INRH/DP, 2019; FAO, 2020b). Along the Atlantic coast of Morocco, the core concentration of chub mackerel is observed in the central and southern regions.
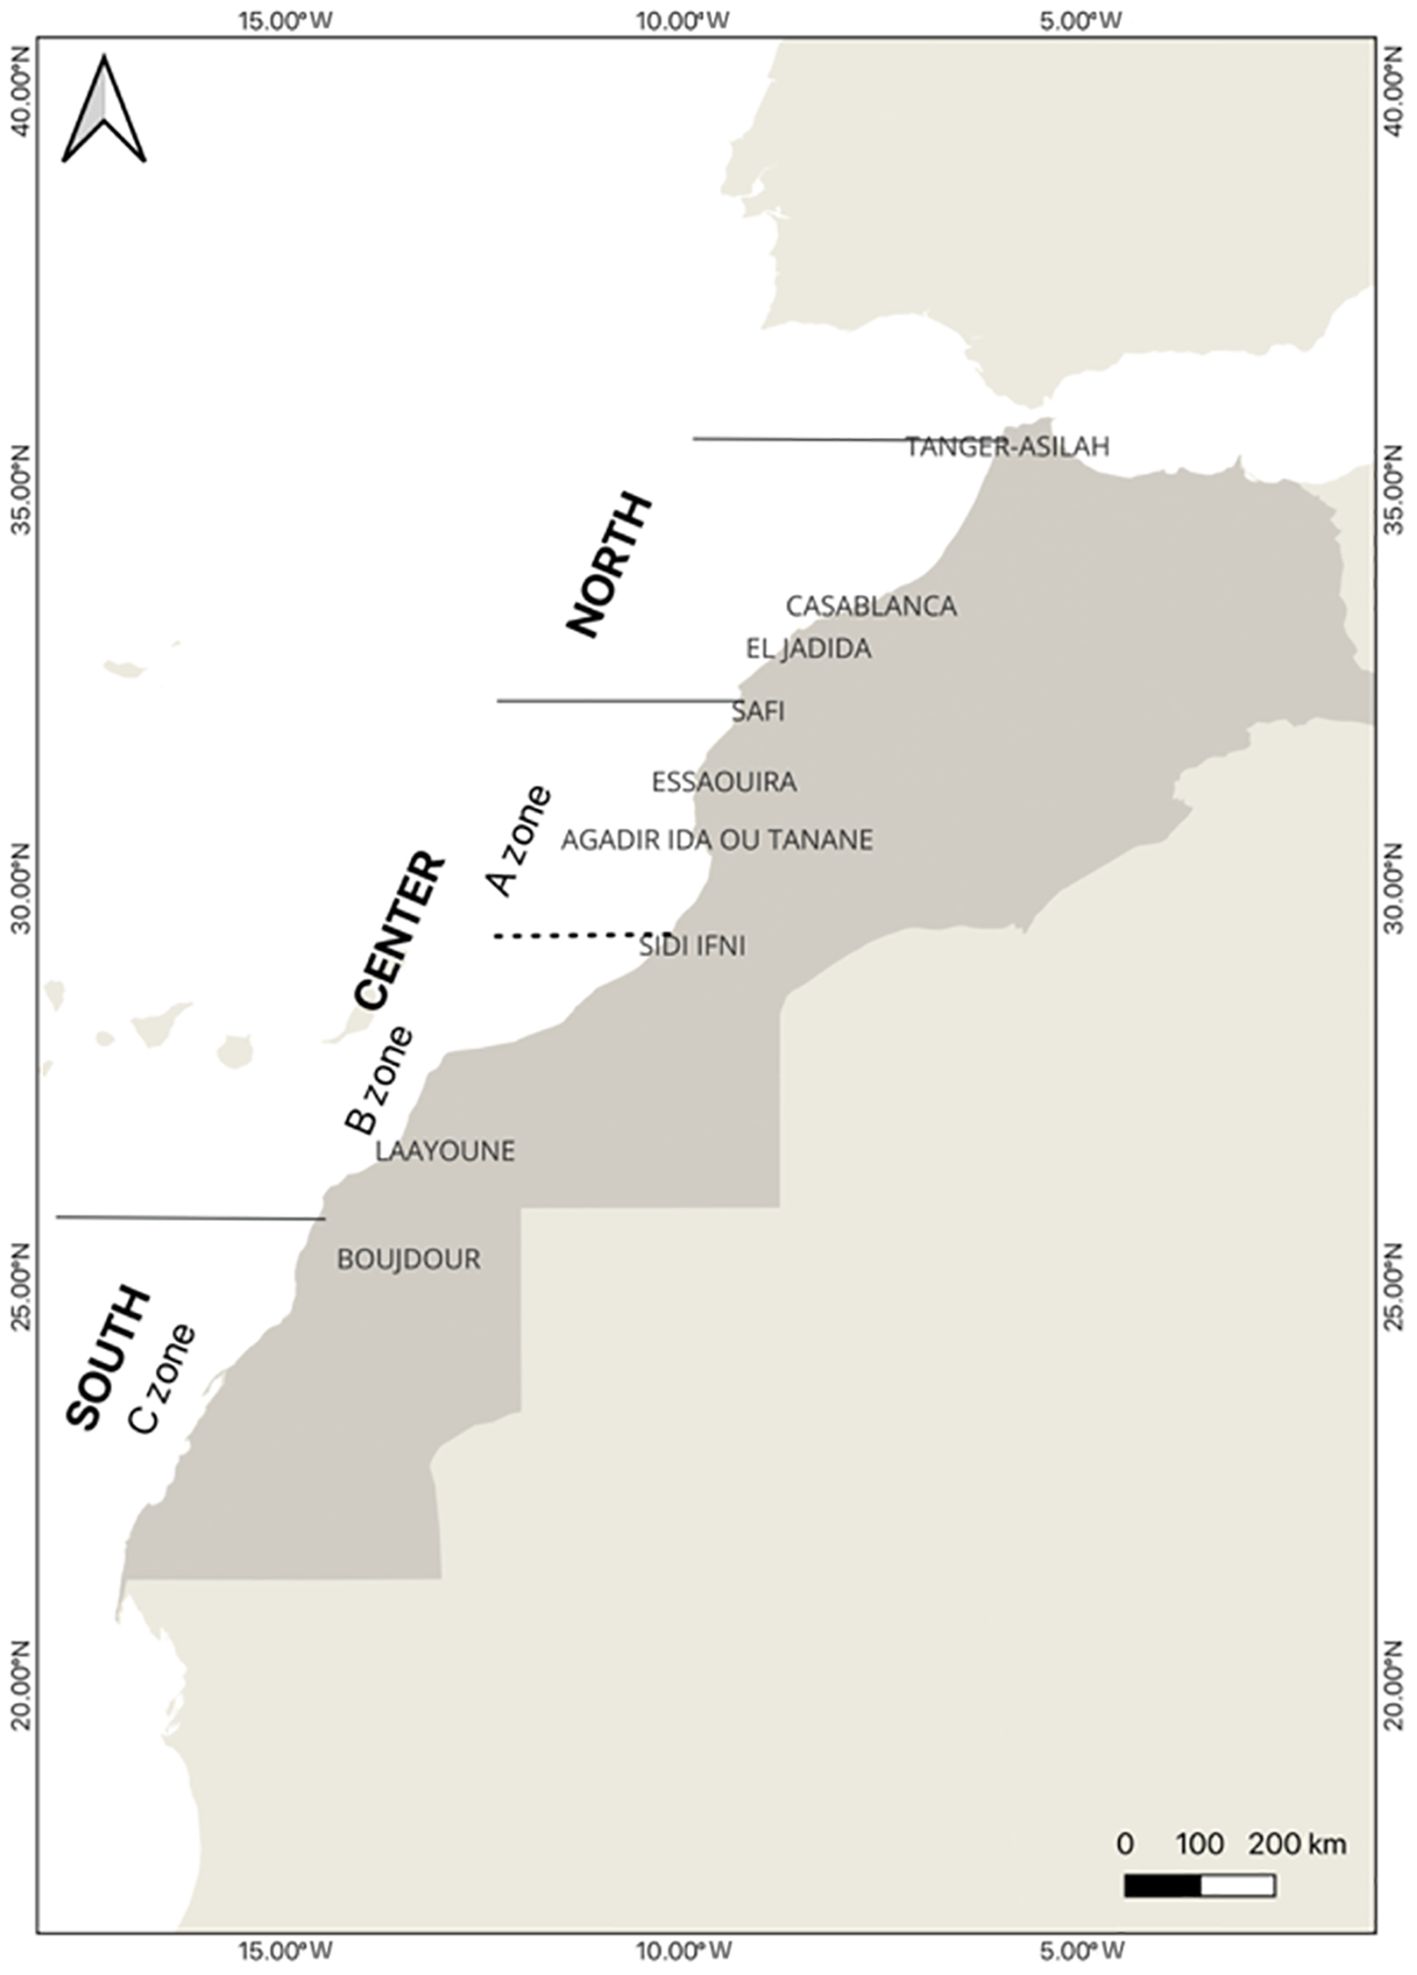
Figure 1. Distribution of fishing areas in the Moroccan Atlantic coast.
According to the FAO, the regional distribution area of chub mackerel along the northwest coast of Africa, as defined by CECAF since 2003, delimits the northern stock {Northern Morocco to Cap Bojador [North+A+B zones (Figure 1)]} and the southern stock (from Cape Bojador (C zone) (Figure 1) to southern Senegal) (FAO, 2006, 2018). However, FAO conducts a joint assessment of the two stocks, as there are still uncertainties regarding the identification of these two stocks and the migration of the chub mackerel (FAO, 2020b). Along the Moroccan coast, four main fishing zones have been identified: The Mediterranean zone (Saadia and Cap Spartel), the North Atlantic zone (Cap Spartel-Cap Cantin), the Central Atlantic zone [Cap Cantin-Cap Bojador (A+B zones)], and the South Atlantic zone [Cap Bojador-Cap Blanc(C zone)] (Figure 1) (Diogoul, 2019). Direct and indirect assessment of the main harvested small pelagic stocks, such as chub mackerel, follows this fishing area division (INRH/DRH, 2013; INRH/DP, 2019). The most abundant concentration of chub mackerel was observed in the central and southern areas (INRH/DP, 2019; ICES, 2021). Although similarities in biological traits, there is currently insufficient conclusive evidence to establish a definite stock identity (ICES, 2021). Therefore, the main acoustic surveys were conducted in the Moroccan region from Cap Cantin to Cap Blanc (A+B+C zones). In this study, for assessment purposes, the center and south of Moroccan Atlantic waters (A+B+C) is assumed as a single chub mackerel stock.
The state of the Moroccan chub mackerel stock was last analyzed by the FAO Working group on the Assessment of Small Pelagic Fish off Northwest Africa in 2021. The assessment of the stocks is most often based on dynamic production (Schaefer and Catch-MSY (CMSY) models) and analytical (eXtended Survivors Analysis/Integrated Catch Analysis (XSA/ICA) and Life Cycle Assessment/Yield Per Recruit (LCA/YPR) models (FAO, 2023). All of these models have been implemented and their results were compared to determine the status of the chub mackerel stock as separate units (northern, central and southern) following the fishing zones division in Morocco (INRH/DP, 2019; FAO, 2020b). Additionally, acoustic surveys are used for assessing biomass trends and to provide abundance indices independent of commercial catches that can also be included in the models (even with a large uncertainty associated).
INRH/DP (2019) and FAO (2023) caution against the critical state of small pelagic fish, particularly the chub mackerel stock in Morocco, and highlight the limited data available and the need to ensure the optimal and sustainable use of these resources for the country’s benefit. In this context exploring the degree of biomass depletion caused by fisheries and providing evidence for potential alternative harvesting policies are of high priority. The overall objective of this paper is to estimate chub mackerel stock status and MSY by using two data-limited approaches: the Surplus Production model in Continuous Time (SPiCT) and the Length-based Spawning Potential Ratio (LBSPR). Then, compare with the stock status estimation by analyzing only the available abundance indices trends and discuss the consequences of their implementation for fisheries management purposes. Based on the different estimates, we make recommendations on exploitation options at a maximum sustainable yield level. To achieve this objective, we first collected information on the life history parameters of this species from the literature, then the two models (SPiCT and LBSPR) were implemented and fitted by testing different assumptions on the stock population, finally we analyzed and compared the models results.
2 Materials and methods
2.1 Data input
A summary of the input data used for the SPiCT and LBSPR models trials is presented in the Table 1. For SPiCT model, two type of time series data (landing and seasonal abundance indices) covering all study areas (A+B+C) were used. Three-time series of abundance indices, in terms of biomass (in tons), were derived from surveys conducted on board the RV Dr. Fridtjof Nansen (autumn), the RV Atlantida (summer) and the R/V Al Amir Moulay Abdellah (autumn). These surveys provided quantitative estimates of abundance using standard equipment, the Simrad Scientific EK-500 echo sounder. Identification of echo traces is done using either a pelagic trawl or a bottom trawl. While LBSPR model, requires the length distribution of landings data, and different life history parameters including estimates of the von Bertalanffy’s growth parameters (L∞-asymptotic length- and k-von Bertalanffy growth coefficient-), the length at 50% (L50) and 95% of maturity (L95), and natural mortality (M). These life history parameters are derived from the literature (Table 1).

Table 1. Available data input used to fit SPiCT and LBSPR models.
Three types of time series data have been used in this study, catches and abundance indices for SPiCT model (Figure 2), and length frequency distributions of the harvested chub mackerel stock for LBSPR model (Figure 3) extracted from FAO and INRH reports. For the length composition of catches, we used data for the period 2004-2019, excluding 2010 due to data anomalies suggesting no fishing occurred that year, which was not the case.
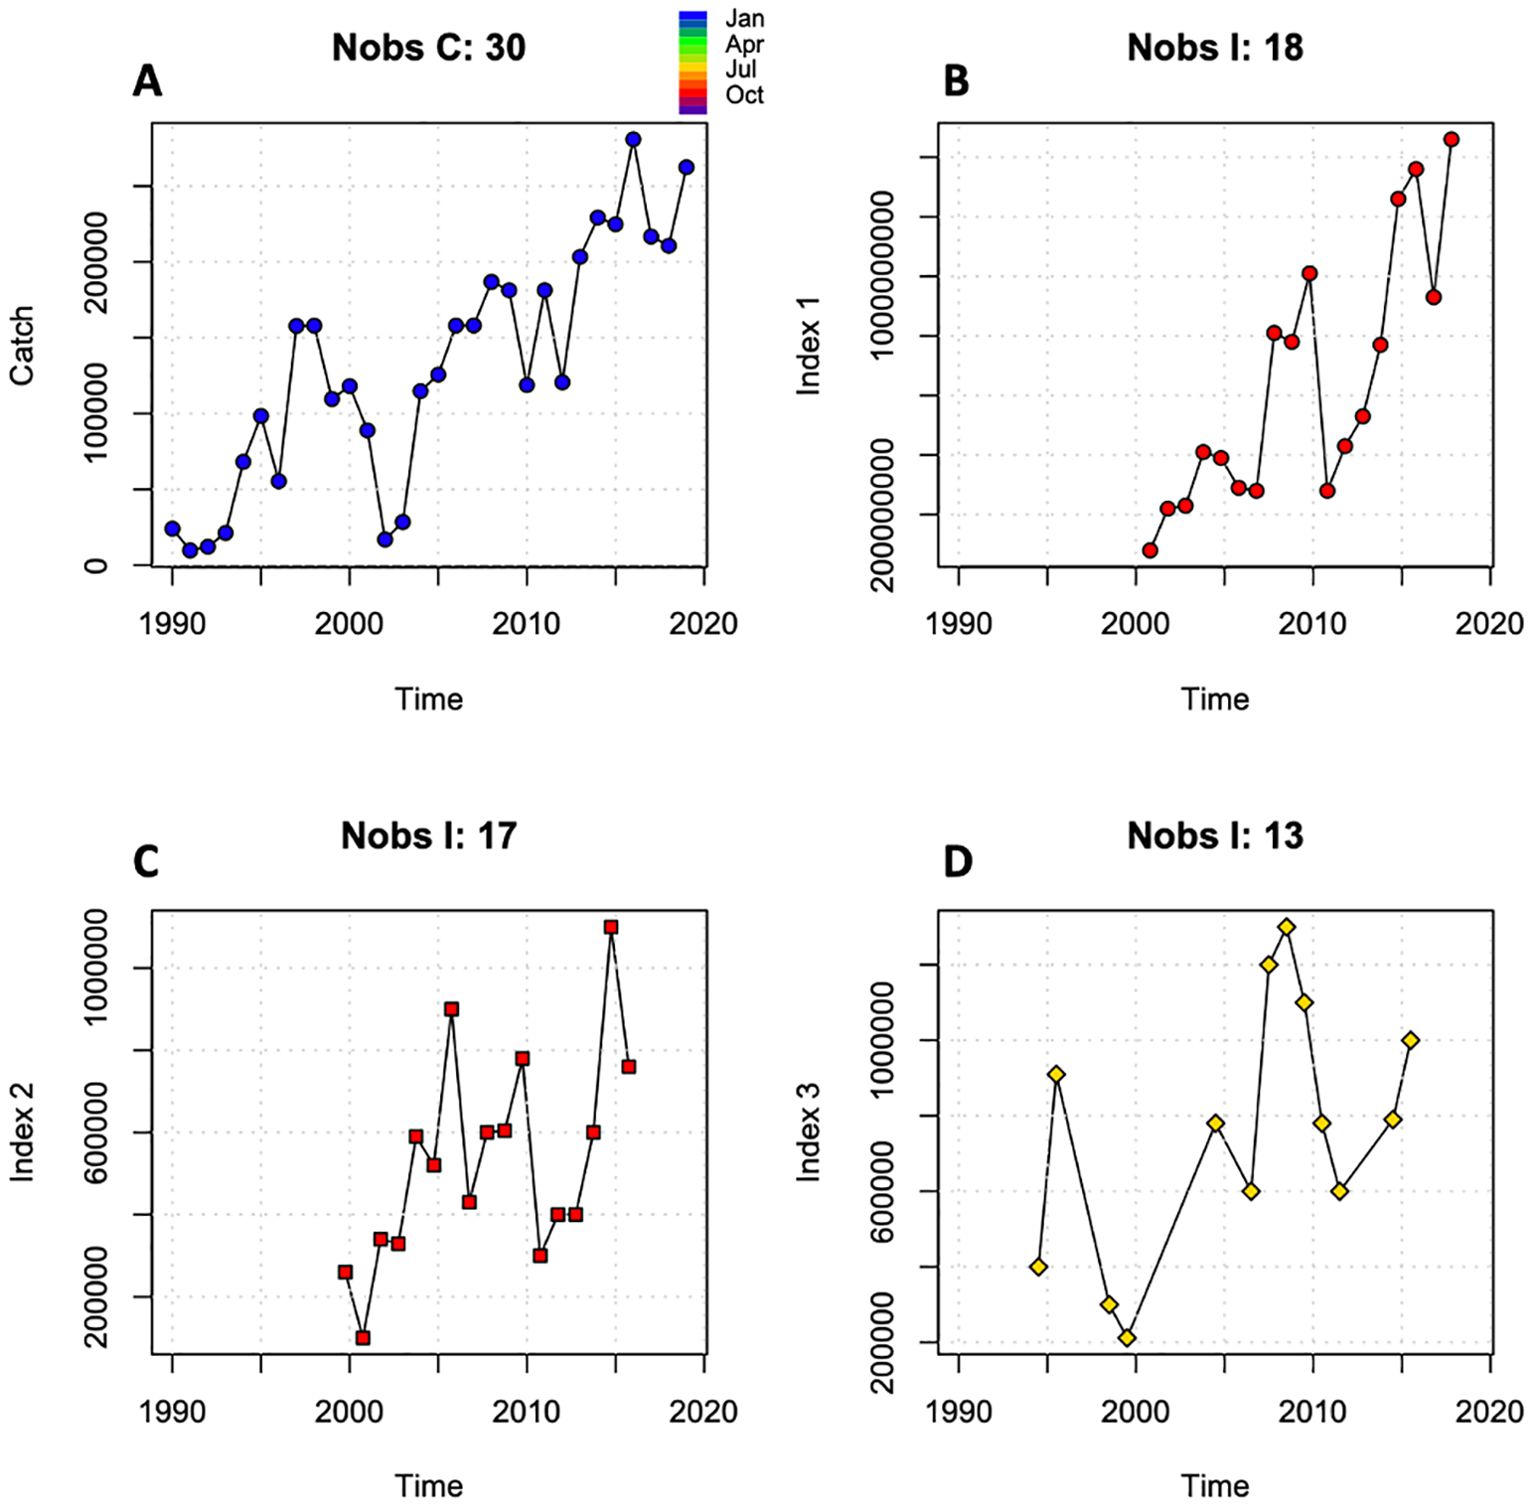
Figure 2. Input data for SPiCT model. Number of observations (Nobs:30) (A): chub mackerel catches in tones. Number of observations (Nobs I:18) (B): Amir Moulay Abdellah acoustic estimates (autumn). Number of observations (Nobs I: 17) (C): Nansen acoustic estimates (autumn). Number of observations (Nobs I: 13) (D): Atlantida acoustic estimates (summer).
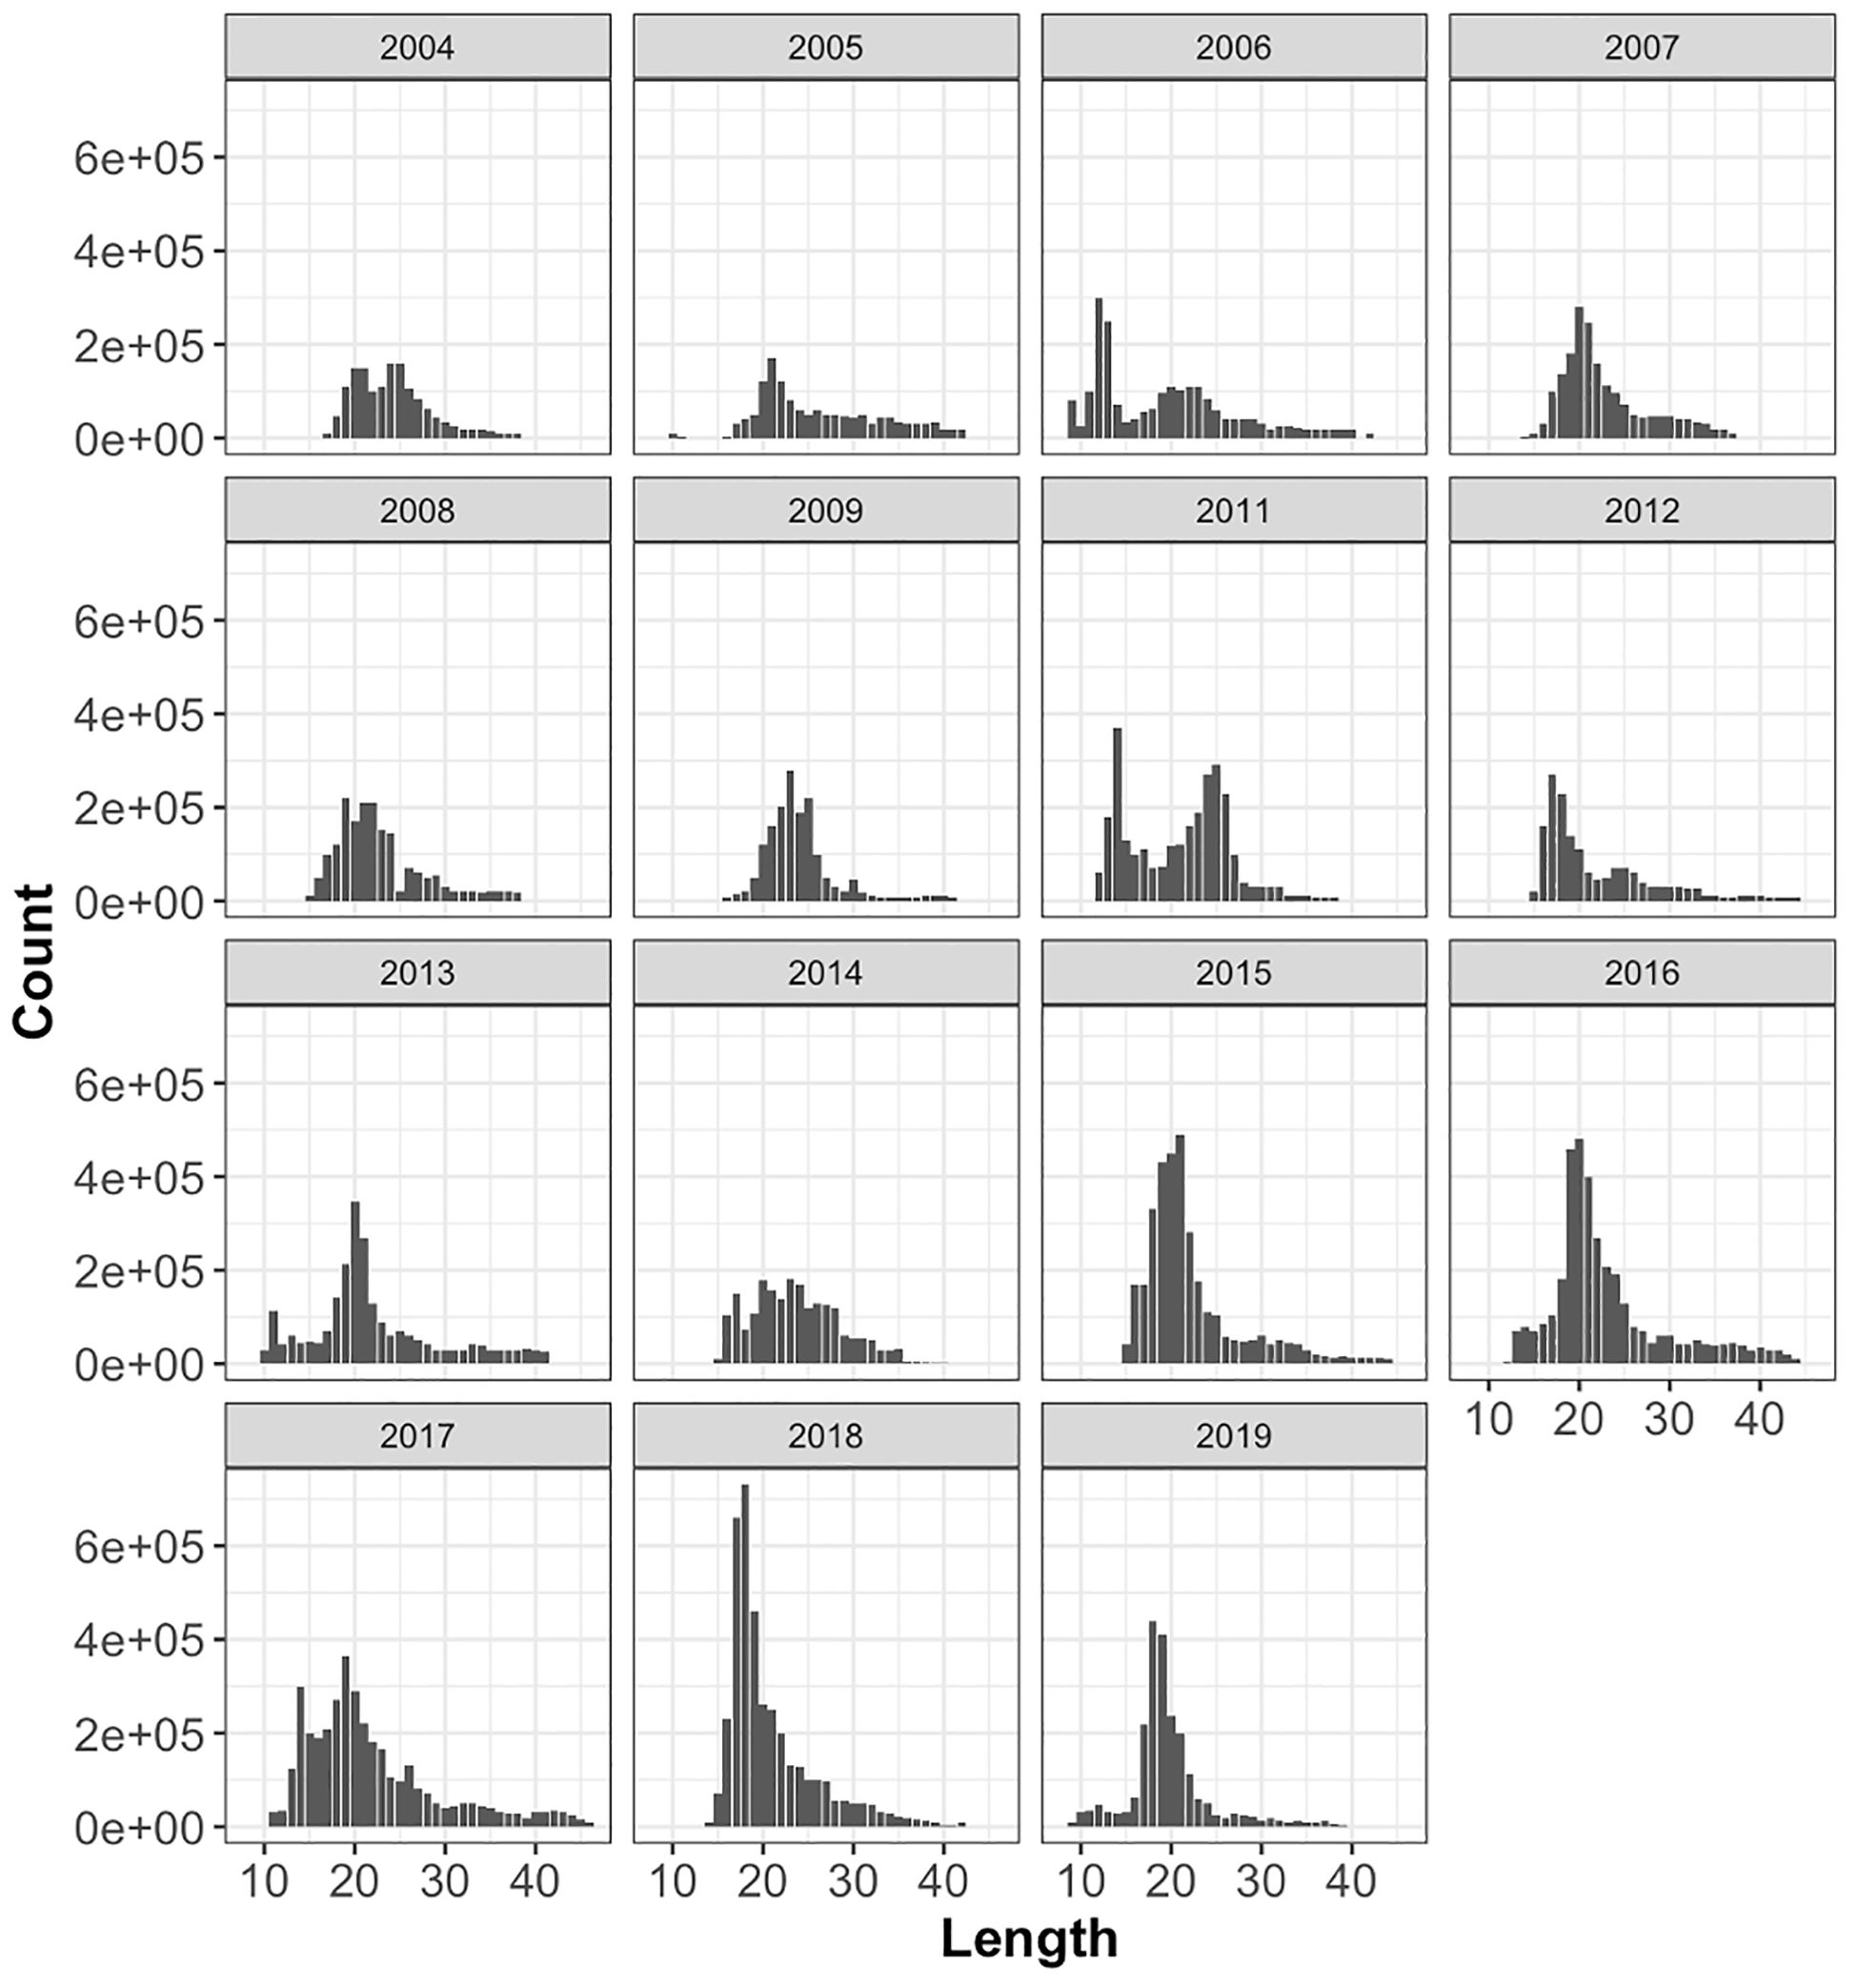
Figure 3. Length distribution of catches used for the LBSPR model implementation.
2.2 Data limited methods
2.2.1 Surplus production model in continuous time model
SPiCT is an expanded version of the conventional surplus production model that offers a comprehensive approach to fish stock assessment. It is a state-space re-parameterized version of the Pella-Tomlinson surplus production model (Pella and Tomlinson, 1969), which assumes exponential growth of a fish stock until it reaches the carrying capacity K, at which point the growth rate decelerates (Pedersen and Berg, 2017). SPiCT is a dynamic model that accounts for temporal variations in fish populations and incorporates the influence of fishing activities on those populations. It relies on a system of differential equations that characterizes the dynamics of the fish population (biomass and fishing mortality). These equations are then compared to the observed data using the observation equation. The model incorporates estimations of observation and process errors to provide stock status and reference points with associated confidence intervals. The simplicity of the surplus production model makes it difficult to adequately describe the population dynamics subject to variability in size structure, species interactions, recruitment, catchability, selectivity, environmental conditions, etc. To mitigate this, it’s common to incorporate a random error term in the equation governing the biomass dynamics, as a proxy for unmodelled variability (process error) (Pedersen and Berg, 2017). As outlined by Pedersen and Berg (2017), uncertainties are introduced to all estimated MSY-based reference points such as MSY, FMSY, and BMSY. However, the influence of stock production is dependent on the parameter n, which determines the shape of the surplus production curve. For values 0< n< 1, random variability (deterministic reference points) is excluded, while for n > 1, stochasticity is incorporated into the estimated reference points. For further details on the method, see (Pedersen and Berg, 2017). In this study, the assessment was performed using the SPiCT R package available at https://github.com/mawp/spict.
Sensitivity analyses were also performed to test the reliability of the results according to some changes in the input parameters, using the intrinsic growth rate (r prior) taken from FishBase, was concluded to be the optimal overall method for comparison. The extreme values and the median of the r parameter range (0.39 - 0.90) were tested.
2.2.1.1 Scenarios setting
A list of scenarios was tested to generate the results. Starting from the baseline state, different population dynamics scenarios were tested (Table 2). First, the model was compiled without prior specifications, using the default configuration. Second, the time series of catch data was reduced to cover the timeframe corresponding to the indices data. In the third scenario, the parameter n, which determines the shape of the production curve, was intentionally set to a value of 2 instead of the original 1.22 estimated in the first two scenarios. This adjustment was made to achieve a symmetrical production curve that aligns with the Schaefer population dynamics approach (Schaefer, 1954). A further scenario (scenario 4) was run by removing the abundance index 1 and keeping the symmetrical production curve. In the last scenario, the default prior for the logarithm of the ratio between the initial biomass and the carrying capacity was set. In this case, the abundance index 1 was also removed (to converge the model) and the prior distribution was specified as a lognormal distribution, with a mean (μ) of ln (0.5) and a standard deviation (σ) of 0.5 as recommended by Kokkalis et al. (2024).
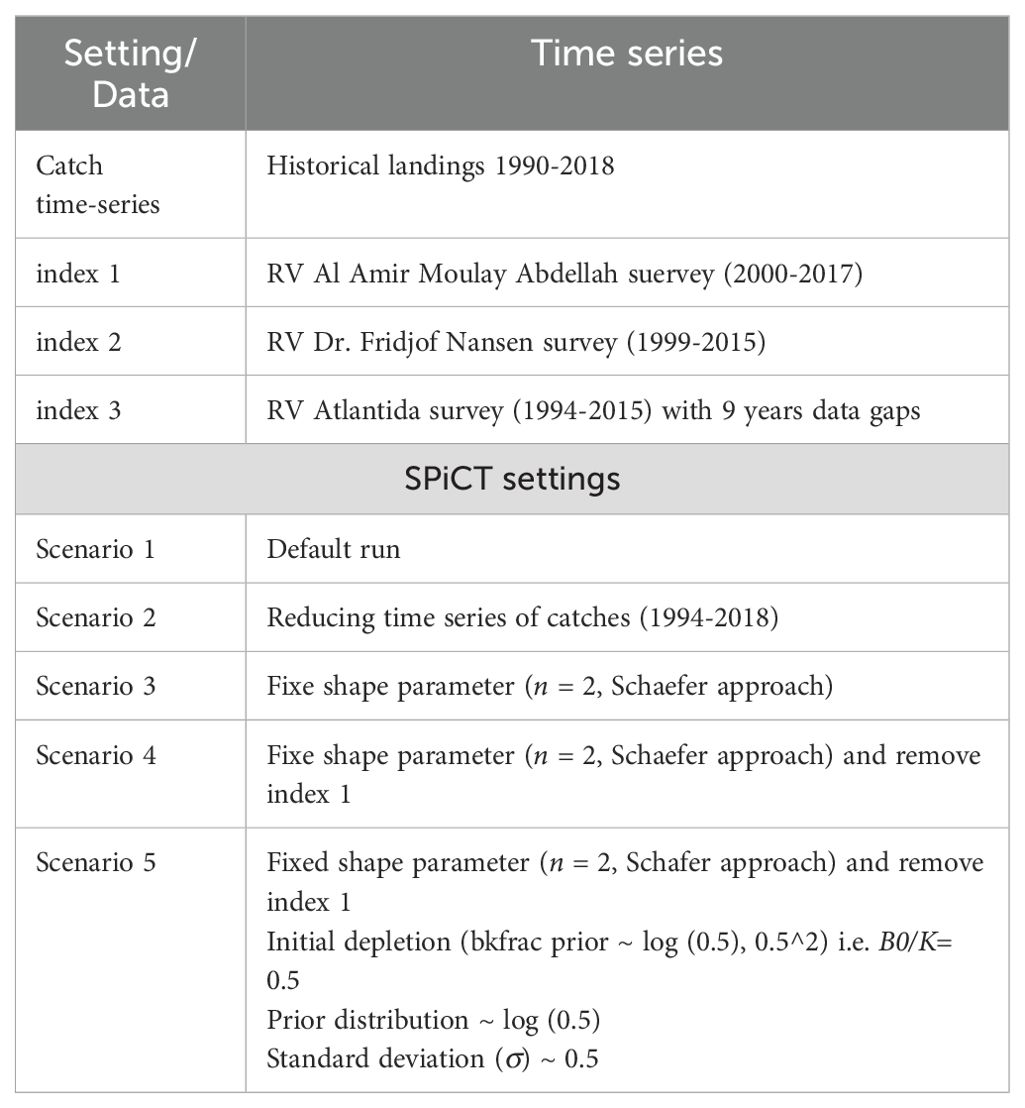
Table 2. SPiCT input data and scenarios settings for chub mackerel.
2.2.2 Length-based spawning potential ratio model
LBSPR model is a fisheries management tool used to estimate the reproductive potential of a fish population by considering the distribution of individuals in terms of size and age. This approach has been developed by Hordyk et al. (2015a) to represent an assessment of the stock based on spawning potential ratio using length data and biological parameters. The basis of the LBSPR model is the concept of Spawning Potential Ratio (SPR), which quantifies the proportion of potential egg production produced by an exploited fish population relative to the hypothetical egg production under unexploited conditions (Hordyk et al., 2019). The SPR value is calculated as (Hordyk et al., 2015a):
Where t represents a normalized age value within the range (tm ≤t ≤ 1); tm is standardized age value at which individuals achieve sexual maturity; is the relative length of an individual at age t (=Lt/L∞); L∞ stands for the theoretical maximum length of an individual; k is growth coefficient from the Bertalanffy equation; M is instantaneous natural mortality; F is instantaneous fishing mortality rate; b corresponds to the exponential factor in the length/weight ratio (W = aFLb).
In fisheries management, this SPR is used to set a target reference point to guide decision-making and ensure the long-term sustainability of the population (Hordyk et al., 2015a). It is employed to determine the appropriate fishing effort necessary to maintain a sufficient number of fish in the population, preserving their reproductive potential and overall sustainability. The model uses length data to estimate the relative impact of fishing on the spawning potential of mature fish in the population compared to an unexploited population. By comparing the theoretically predicted equilibrium length distribution with the observed length distribution, the model derives estimates for the F/M ratio and parameters related to the selectivity curve (Prince et al., 2020). The input data includes also a minimum set of biological parameters such as L∞, with its coefficient of variation (CV) if available, the ratio M/K and the sizes at 50% and 95% of maturity (L50 and L95).
The model was initially applied using M/k and L∞ values derived from previous literature analyses and other local stock information, and it was considered the basic model (Table 1). To perform the sensitivity analysis for this model, either the minimum or maximum values of the parameters k or L∞ were exclusively considered instead of the ones used in the basic model. The different settings are summarized in Table 2. This approach was adopted due to the inherent uncertainty and substantial variability in estimating this particular parameter across different methods. All simulation modeling was performed using the LBSPR R package (Hordyk, 2019).
The model performance was assessed using the LIME (Length-based Integrated Mixed Effects) model, which does not assume equilibrium conditions. The mixed-effects component of LIME enhances traditional length-based methods by allowing for the estimation of recruitment variations independently of fishing mortality over time (Rudd and Thorson, 2018). Although LIME primarily relies on length and life history data, it can also incorporate catch data and an abundance index when available. As demonstrated by (Chong et al., 2020), the bias and precision of SPR were determined using an operating model that provided “true” (unbiased) estimates. This model simulated a population based on the same life history parameters used in LBSPR, setting patterns for fishing mortality (“Endogenous”) and recruitment dynamics (“Pulsed”), and setting initial stock depletion to 30% in 2004 (FAO, 2006; INRH/DRH, 2013). The simulation was executed using the simulation functions within the LIME package (Rudd, 2019) to generate various metrics related to exploitation rates and stock status. These generated quantities were then compared with the outputs of the estimating models (LBSPR and LIME) to assess their accuracy and reliability. Additionally, relative errors between the estimated and “true” values were also calculated as performance metrics for SPR estimates, quantifying bias using the Median Relative Error (MRE) and precision using the Median Absolute Relative Error (MARE) (Chong et al., 2020). Values closer to zero indicate the least biased (MRE) and most precise (MARE) results.
3 Results
3.1 SPiCT model
3.1.1 Model settings outputs
All the runs tested for the central and southern stock of chub mackerel are converged but with varying confidence intervals and different values of estimated parameters (Table 3) (see Supplementary Materials). Results from the tested scenarios indicate that the MSY ranges from 1.56 x 10⁵ to 2.307 x 10⁵ tons (Table 3). The estimates for BMSY fluctuate between 20826.78 and 504988.1 tons while the FMSY varies between 0.267 and 11.079 year-1 (Table 3). The initial two scenarios portray pessimistic scenarios where the stock biomass remained below the target line (BMSY) throughout the entire study period. On the other hand, scenarios 3, 4 and 5 demonstrate a decline in stock biomass during the mid-years followed by a subsequent recovery, then an increase in fishing mortality leading to a deterioration in stock status for scenarios 4 and 5. Scenario 4 was considered as the base-case model and the most robust scenario based on SPiCT diagnostics and hindcast results (see section 3.1.5).
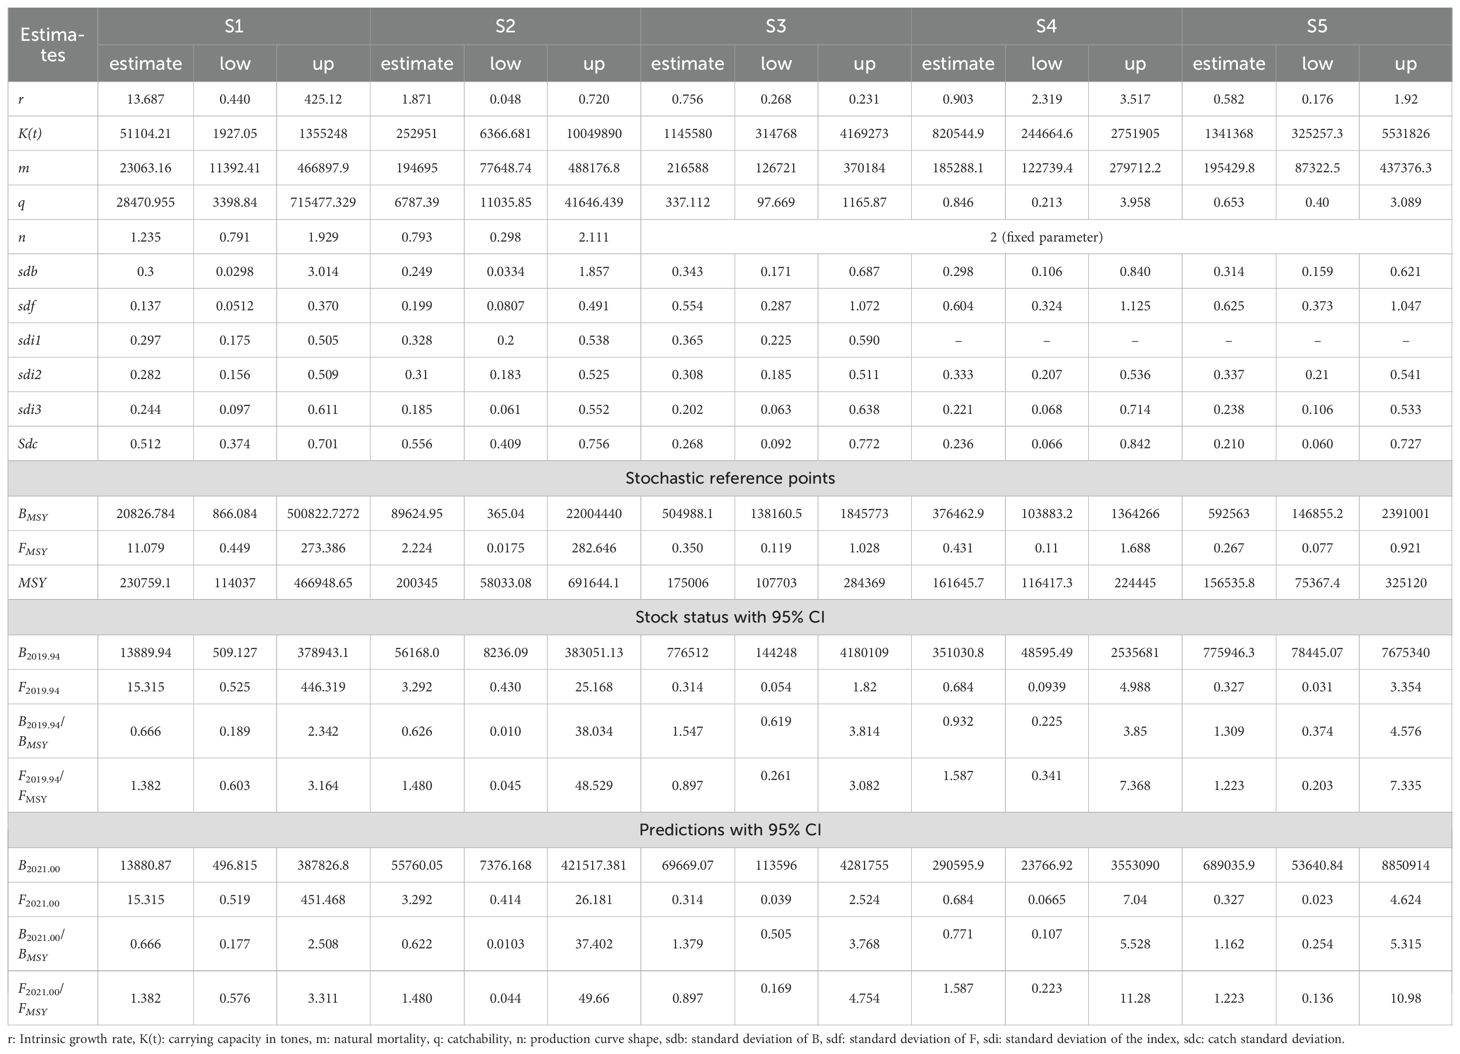
Table 3. SPiCT summary results for each scenario.
3.1.2 Catch curve
Estimate and observed catch data with the estimated reference point (MSY) for the most favorable scenario results (scenario 4) are shown in Figure 4. Annual chub mackerel landings ranged from 11255 to 258844 tons, significantly increasing over the 1990-2019 period with large fluctuations. The catches were very low at the beginning of the 1990s with around 21000 tons. They started to increase until reaching 163373 tons in 1998 before dropping in 2002 to 23259 tones. Since then, a progressive increase in catches has been observed, with a peak of around 170000 in the 2007-2009 period followed by a slight drop in catches (133877 tons) in 2012. From 2011, catches increased steadily over time. The SPiCT assessment estimated the chub mackerel MSY to be 161645.7 tones and the stock was approximately 65% over its target point at 2019. In the whole period from 1990 to 2012, the catches fluctuated under the MSY reference point, with a slight upturn in 2008. After this period the catches moved above the MSY line.
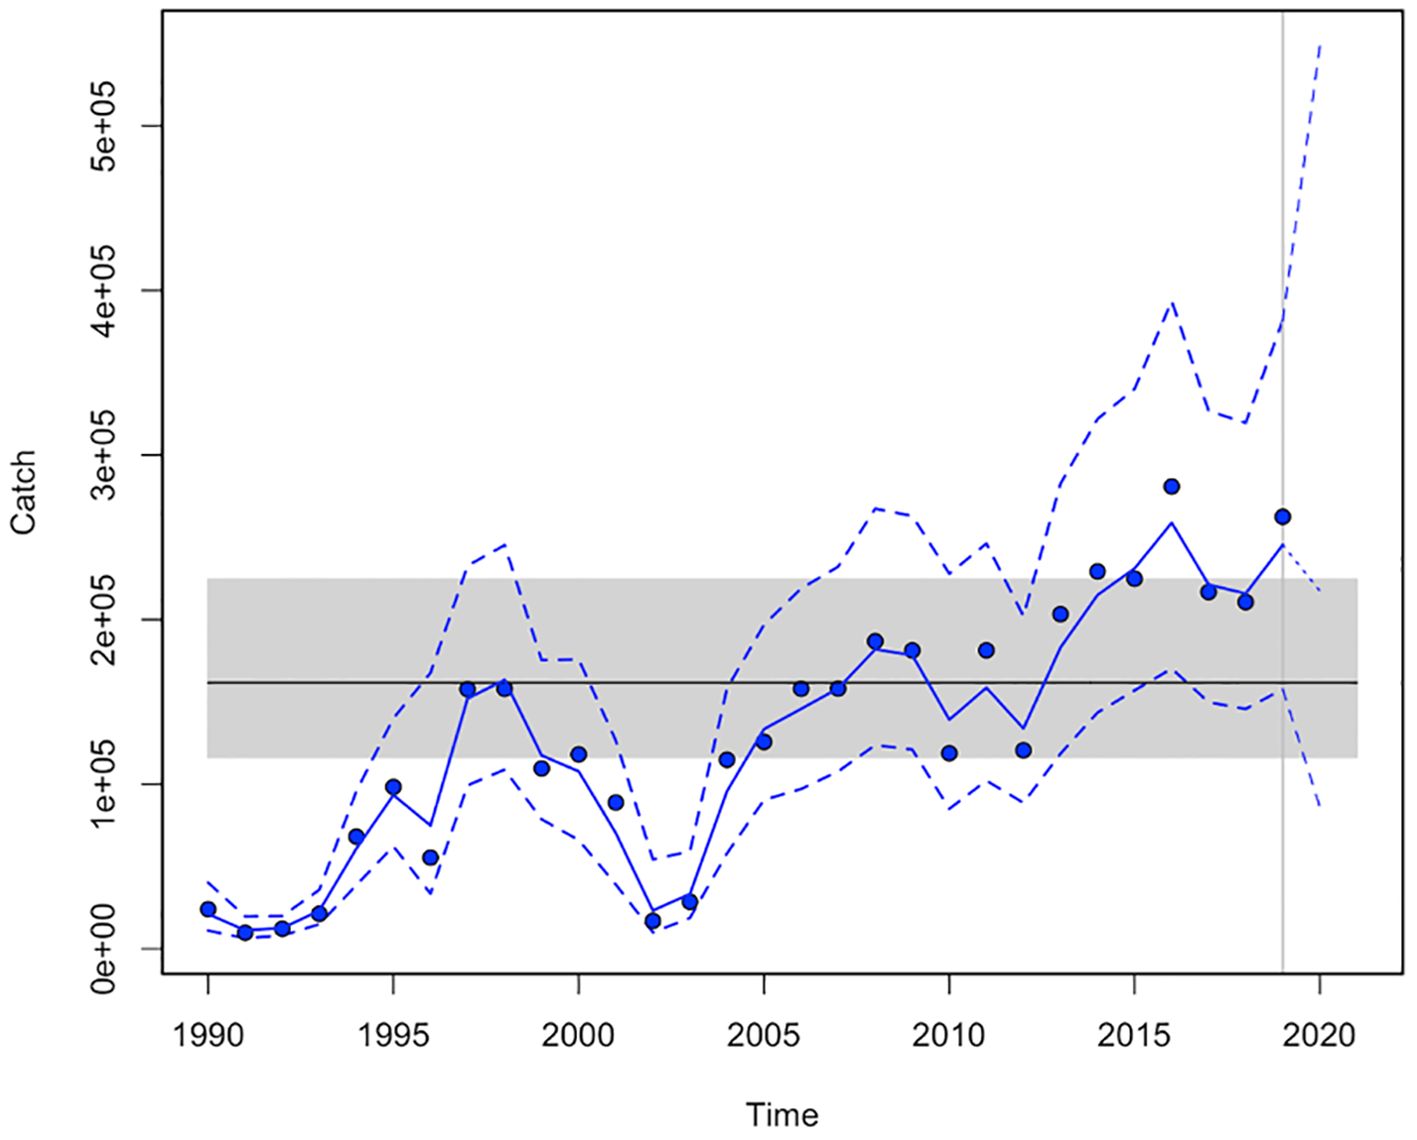
Figure 4. Estimated catch (blue line) versus observed catch (points) with the estimated MSY (horizontal black line) and its 95% confidence interval (CI) (grey region).
3.1.3 Relative stock biomass (B/BMSY) and fishing mortality (F/FMSY)
The estimated curves for stock biomass and fishing mortality relative to their reference points B/BMSY and F/FMSY for scenario 4 are shown in Figure 5. A gradual increase in stock biomass has been observed over the 30-year period with a few ups and downs. It is suggested that biomass was subject to strong fluctuations, as it was at a low level. This is shown also in Table 4, where the median biomass estimated at MSY for the whole 1990-2004 period was higher than the absolute biomass of the stock. After this period, average B/BMSY values exceeded 1 until 2019, then in 2020 and 2021, average biomass fell 15% below the BMSY target level, suggesting a slight decline in stock status during these two years. The estimated fishing mortality has increased from 0.5 FMSY in the first part of the 1991-1997 period to 3 times FMSY (fishing mortality at Maximum Sustainable Yield) in the period from 1998 to 2002. Then a decrease was observed of this fishing mortality to stabilize after 2006 around the FMSY value (Figure 5) and exceeding the FMSY reference point again after 2015. Average values of F/FMSY show that the two periods 1995-1999 and 2015-2021 were marked by strong fishing pressure, leading to a significant increase in fishing mortality (Table 4).
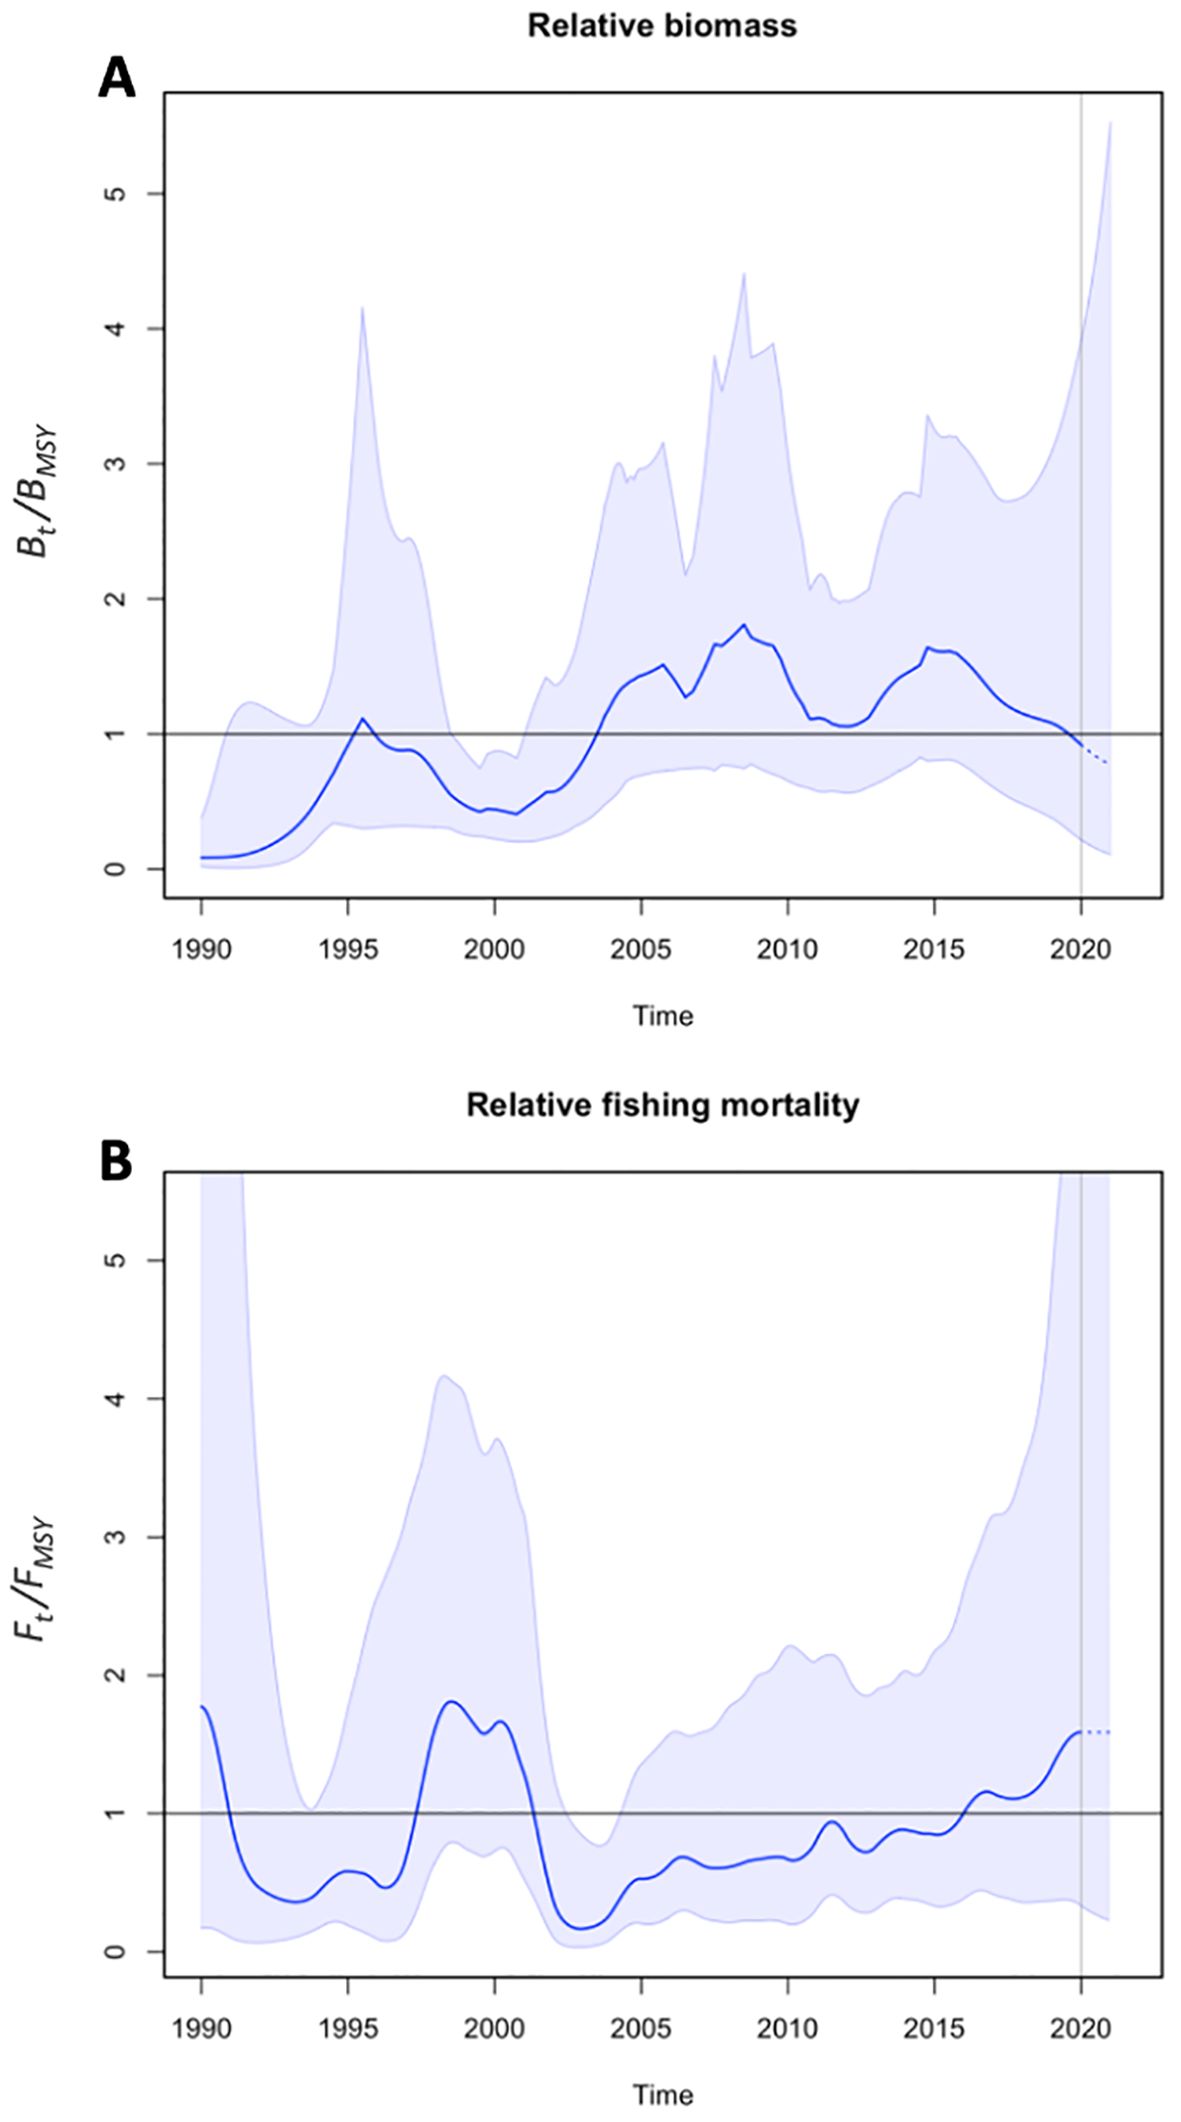
Figure 5. B/BMSY (A) and F/FMSY (B) trends over time and its 95% confidence intervals (CI) (blue region).
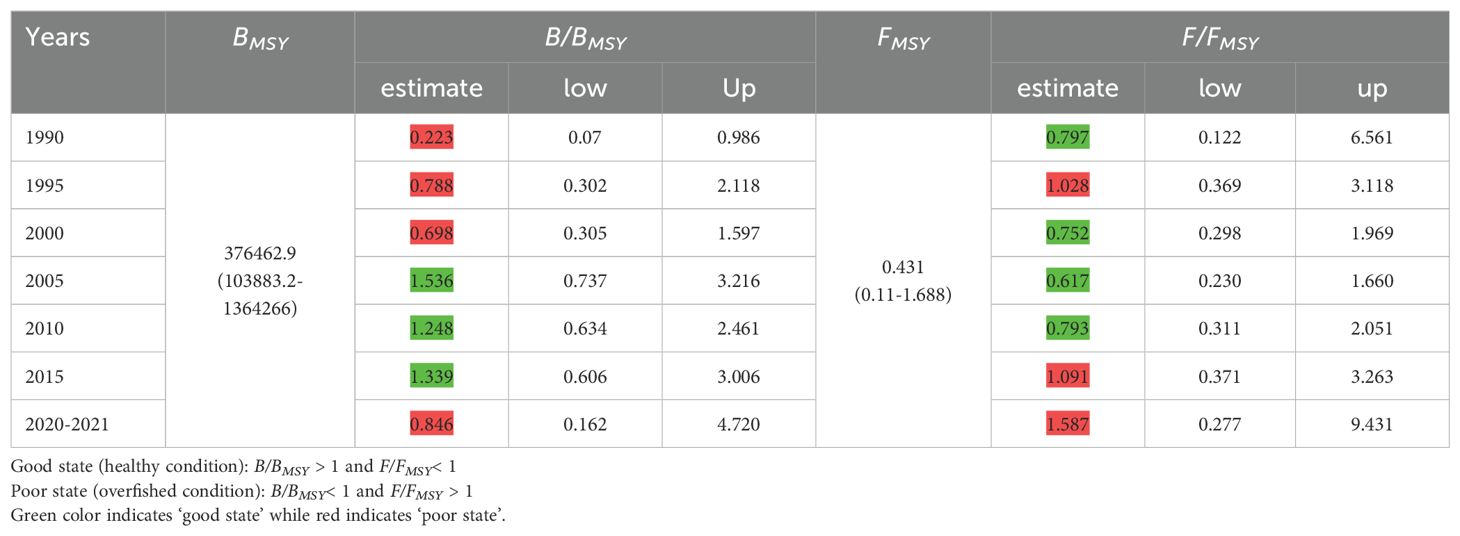
Table 4. Relative biomass (B/BMSY) and fishing mortality (F/FMSY) variation of chub mackerel by 5-year average value (except for the last two years).
3.1.4 Stock status: Kobe plot
The Kobe plot illustrating the relationship between stock abundance and fishing mortality is presented in Figure 6. The stock’s temporal trajectory is depicted on the plot, providing a visual representation of its historical status. According to Figure 6, the chub mackerel stock initiates in the red zone, as the population has been in an overexploitation state. Through certain ups and downs in fishing mortality over a given period, the stock fluctuated between the red and yellow zones, while biomass status was still below the reference point. Until fishing mortality stabilized below FMSY, and biomass increased above BMSY, the stock trajectory shifted into the green zone until 2015. Then, an increase in fishing mortality was detected, leading to a drop in the stock’s status. This decline moved the stock to the yellow zone (Ft ≥ FMSY), eventually falling to the red zone (overexploitation status) in 2020 and 2021. Based on the model results, the trajectory of the chub mackerel stock in the Kobe plot shows a strong variation in stock status. It has moved from an overexploitation and full exploitation state to an under-exploitation (Bt > BMSY and Ft< FMSY), before declining back to overexploitation in the last two years of the study period.
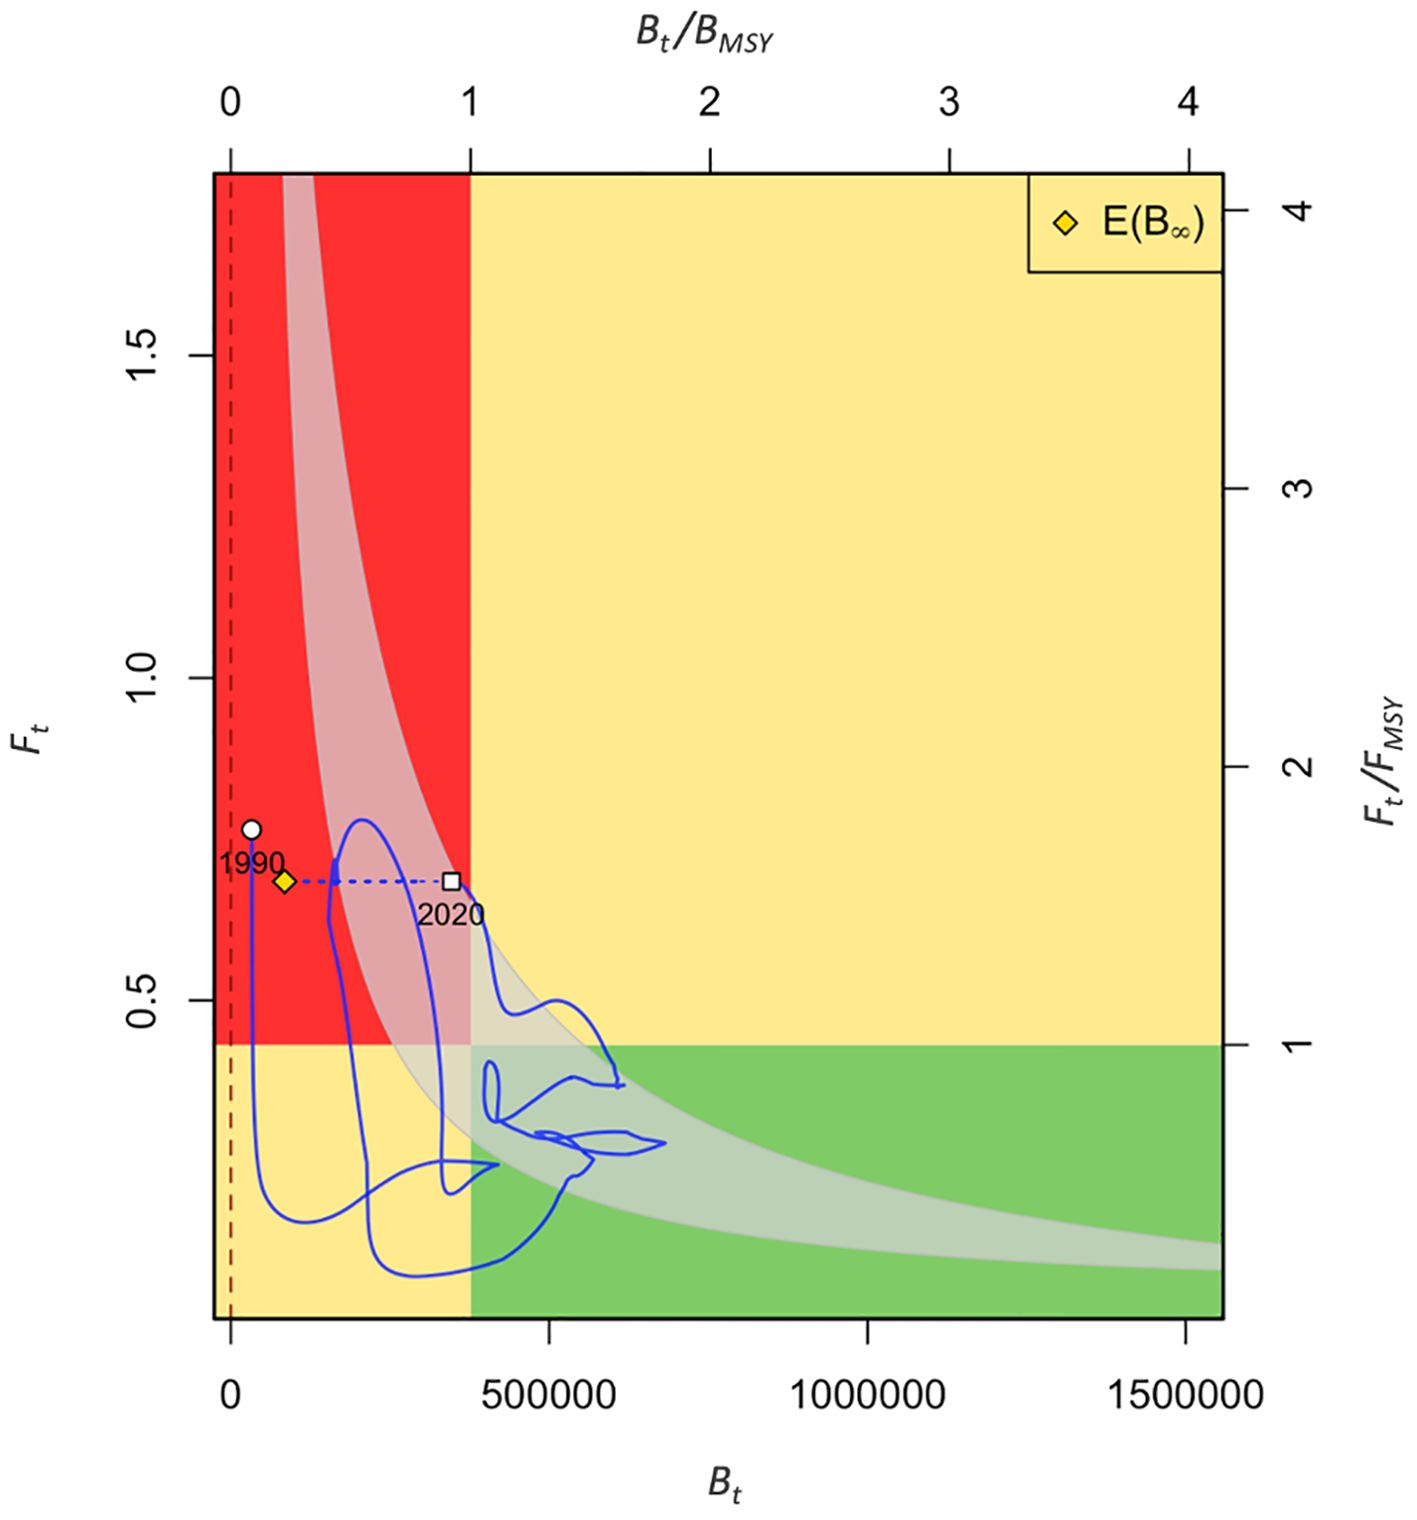
Figure 6. Kobe plot resulting from SPiCT model. 95% Confidence Intervals (CI) of reference points (BMSY and FMSY) are shown using grey shaded region, red panel: overfished and overfishing phase (Bt< BMSY, Ft > FMSY), green panel: fishery’s safe zone (Bt > BMSY, Ft< FMSY), and two yellow panels: recovery phase of the stock with reduced fishing pressure (Bt ≥ BMSY, Ft ≥ FMSY/Bt ≤ BMSY; Ft ≤ FMSY).
To test the sensitivity of the SPiCT assessment to the model prior ranges (see Supplementary Materials), a sensitivity analysis of the r prior changes was conducted. The model provides different estimates of the stock abundance and shows similar patterns to this stock prior. The sensitivity analysis of the r prior within SPiCT found the assessment to be robust to changes in that prior, resulting in a median change in B/BMSY of<0.01.
3.1.5 SPiCT diagnostics
Scenario 4, the selected model, proved to be the most favorable option with the best residual diagnostics (fewest violations in terms of the catch data non-normality) (see Supplementary Materials for more details) and high consistent trends among the different runs in the retrospective plots. The estimated Mohn’s rho fell within the acceptable range of -0.15 and 0.20 (Figure 7), as proposed by Hurtado-Ferro et al. (2015), which increases the confidence of the model outputs. While the hindcast analysis reveals that indices 2 and 3 estimates from Mean Absolute Scaled Error (MASE) (0.8, 0.24, respectively) can be considered as importing data sources to support that the chub mackerel model is consistent with the observed abundance data in retrospect. In contrast, index 1 with MASE= 2.22, suggesting that the model’s prediction skill for this survey index was low compared to the mean abundance estimates. As shown in Figure 7, by removing index 1 data in scenario 4, Mohn’s rho got low for B/BMSY, therefore the model slightly underestimates B/BMSY compared to the scenario 3.
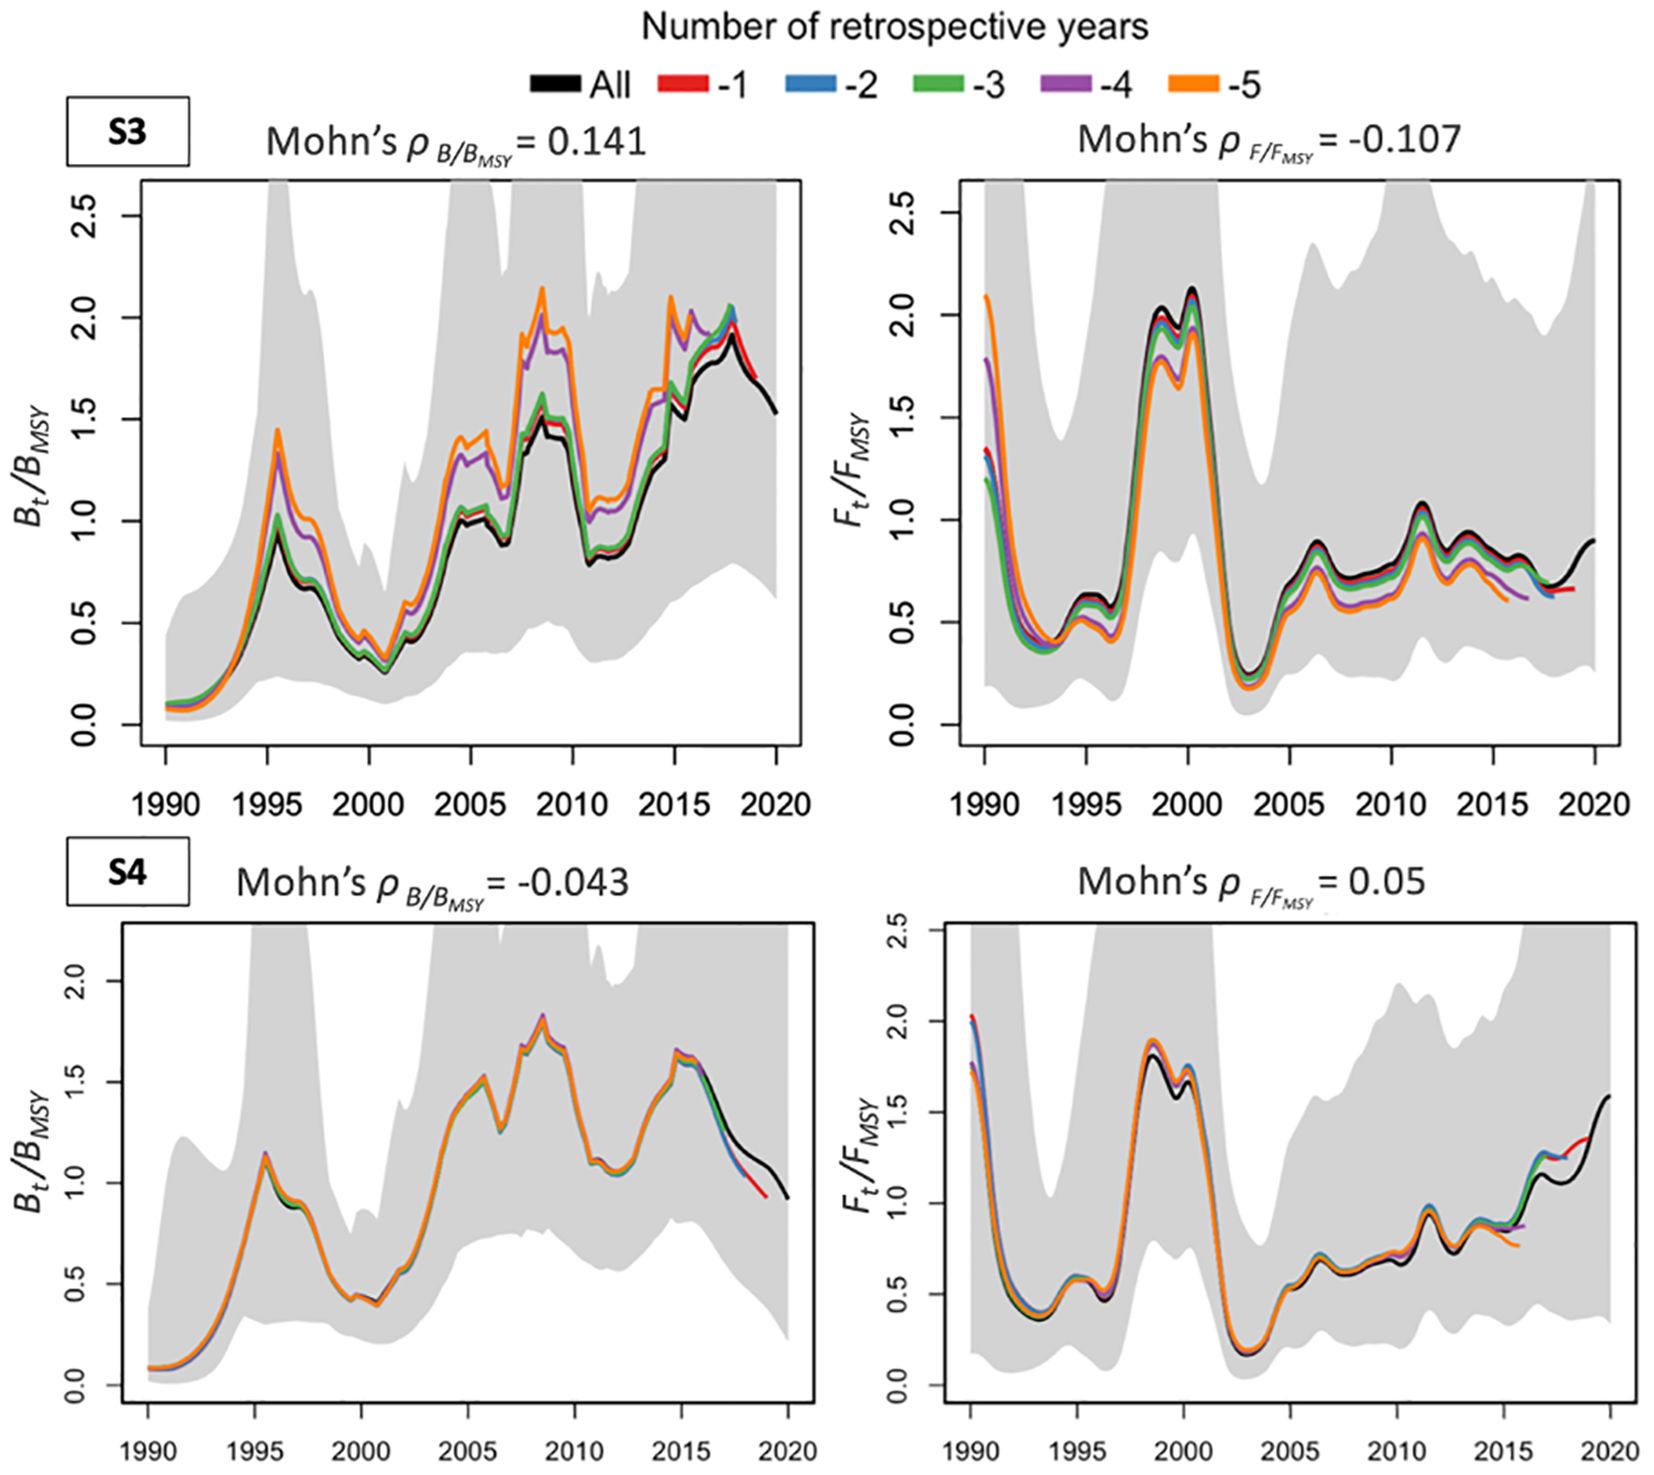
Figure 7. Retrospective analysis plots of model scenarios 3 and 4 for B/BMSY and F/FMSY trend estimates.
3.2 LBSPR model
Since there is limited available information regarding the biological and ecological characteristics of chub mackerel stock, as well as the absence of continuous time series data on biological indicators, the LBSPR model is applied to provide additional information on stock status. The results of the LBSPR model in the basic parameter configuration show that the catch length-frequency data over the whole period exhibited a predominantly unimodal distribution (Figure 8). The size structure predicted by the model fitted to the histograms allowed to match the length composition of the catch. The chub mackerel catches contain high proportions of fish around the L50 value. For most unimodal distributions of length frequencies, the highest peak occurs around 20 cm (+2 cm).
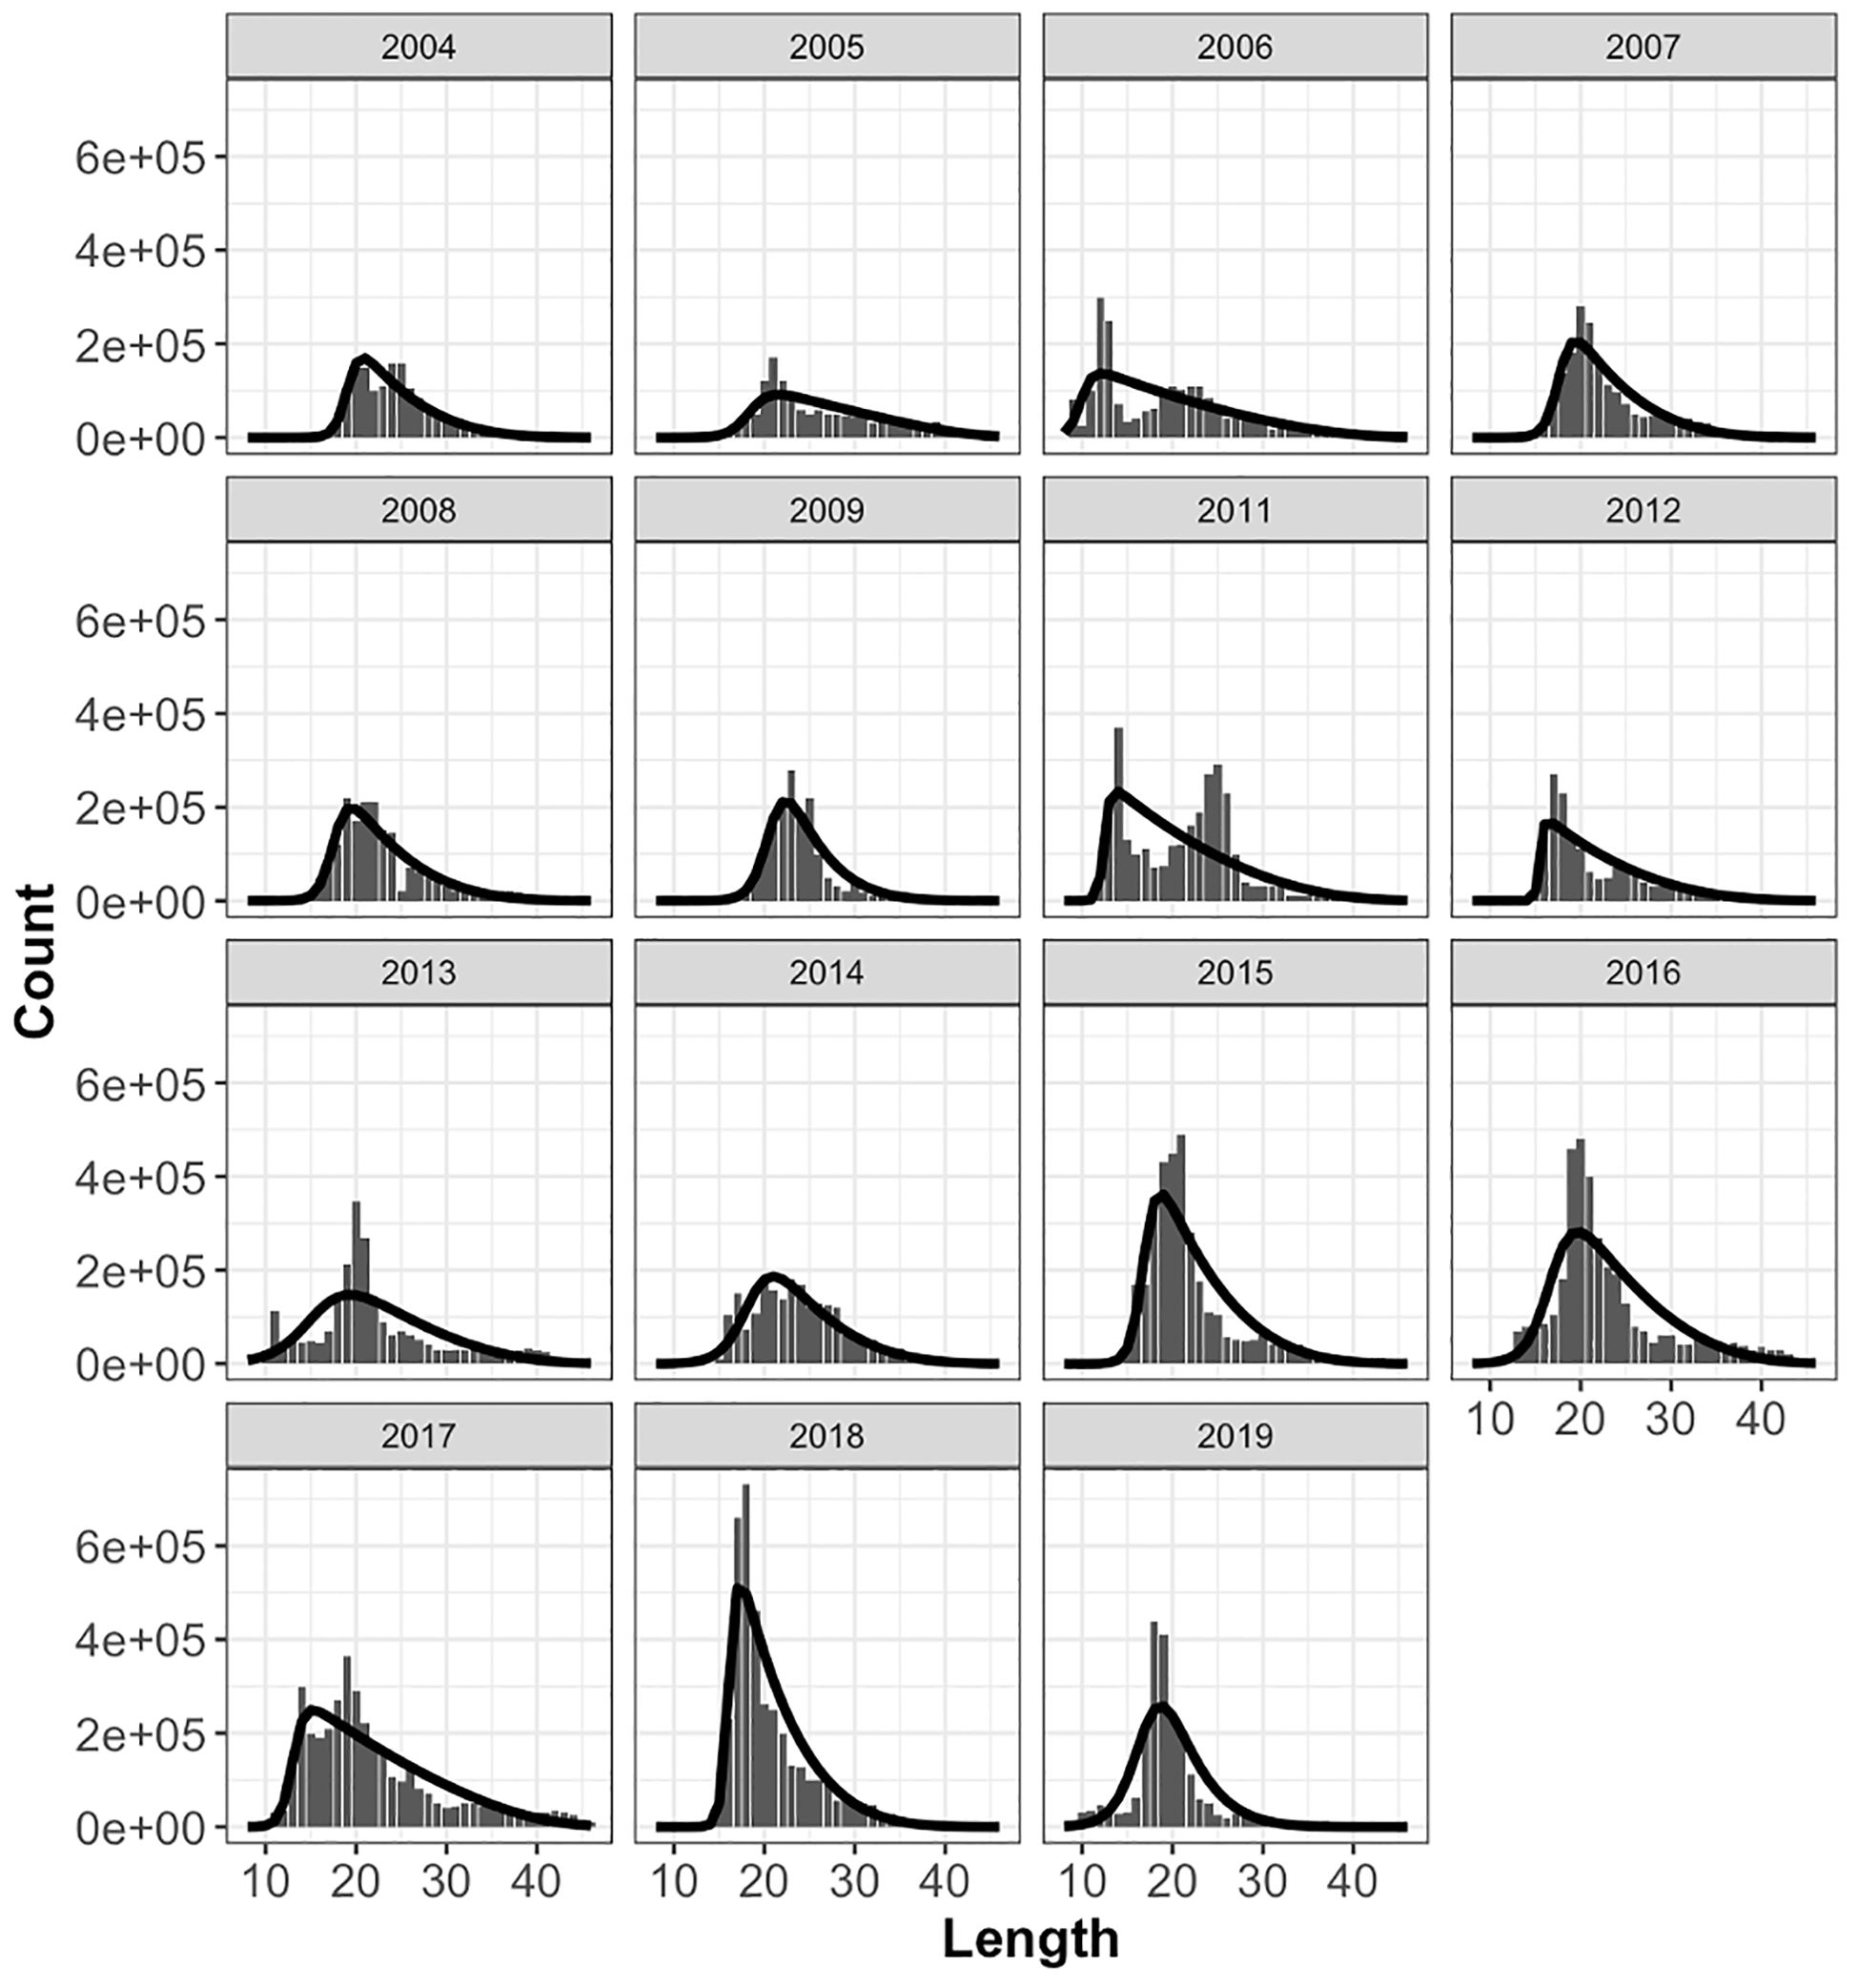
Figure 8. Length composition distributions for chub mackerel with curves fitted by LBSPR model assessment.
Selectivity, specifically the length at capture at the 50% (SL50) and 95% (SL95) levels, was employed to determine the proportional representation of different length ranges. Based on Figure 9, it is evident that the estimated selectivity curves for each year predominantly lie below the maturity curve. This observation suggests a significant presence of juvenile individuals in the catches, indicating a higher proportion of younger fish. Within this region, the selectivity pattern has exhibited an upward trend over time, as illustrated in Figure 9. This trend signifies a growing proportion of smaller fish being captured in the region.
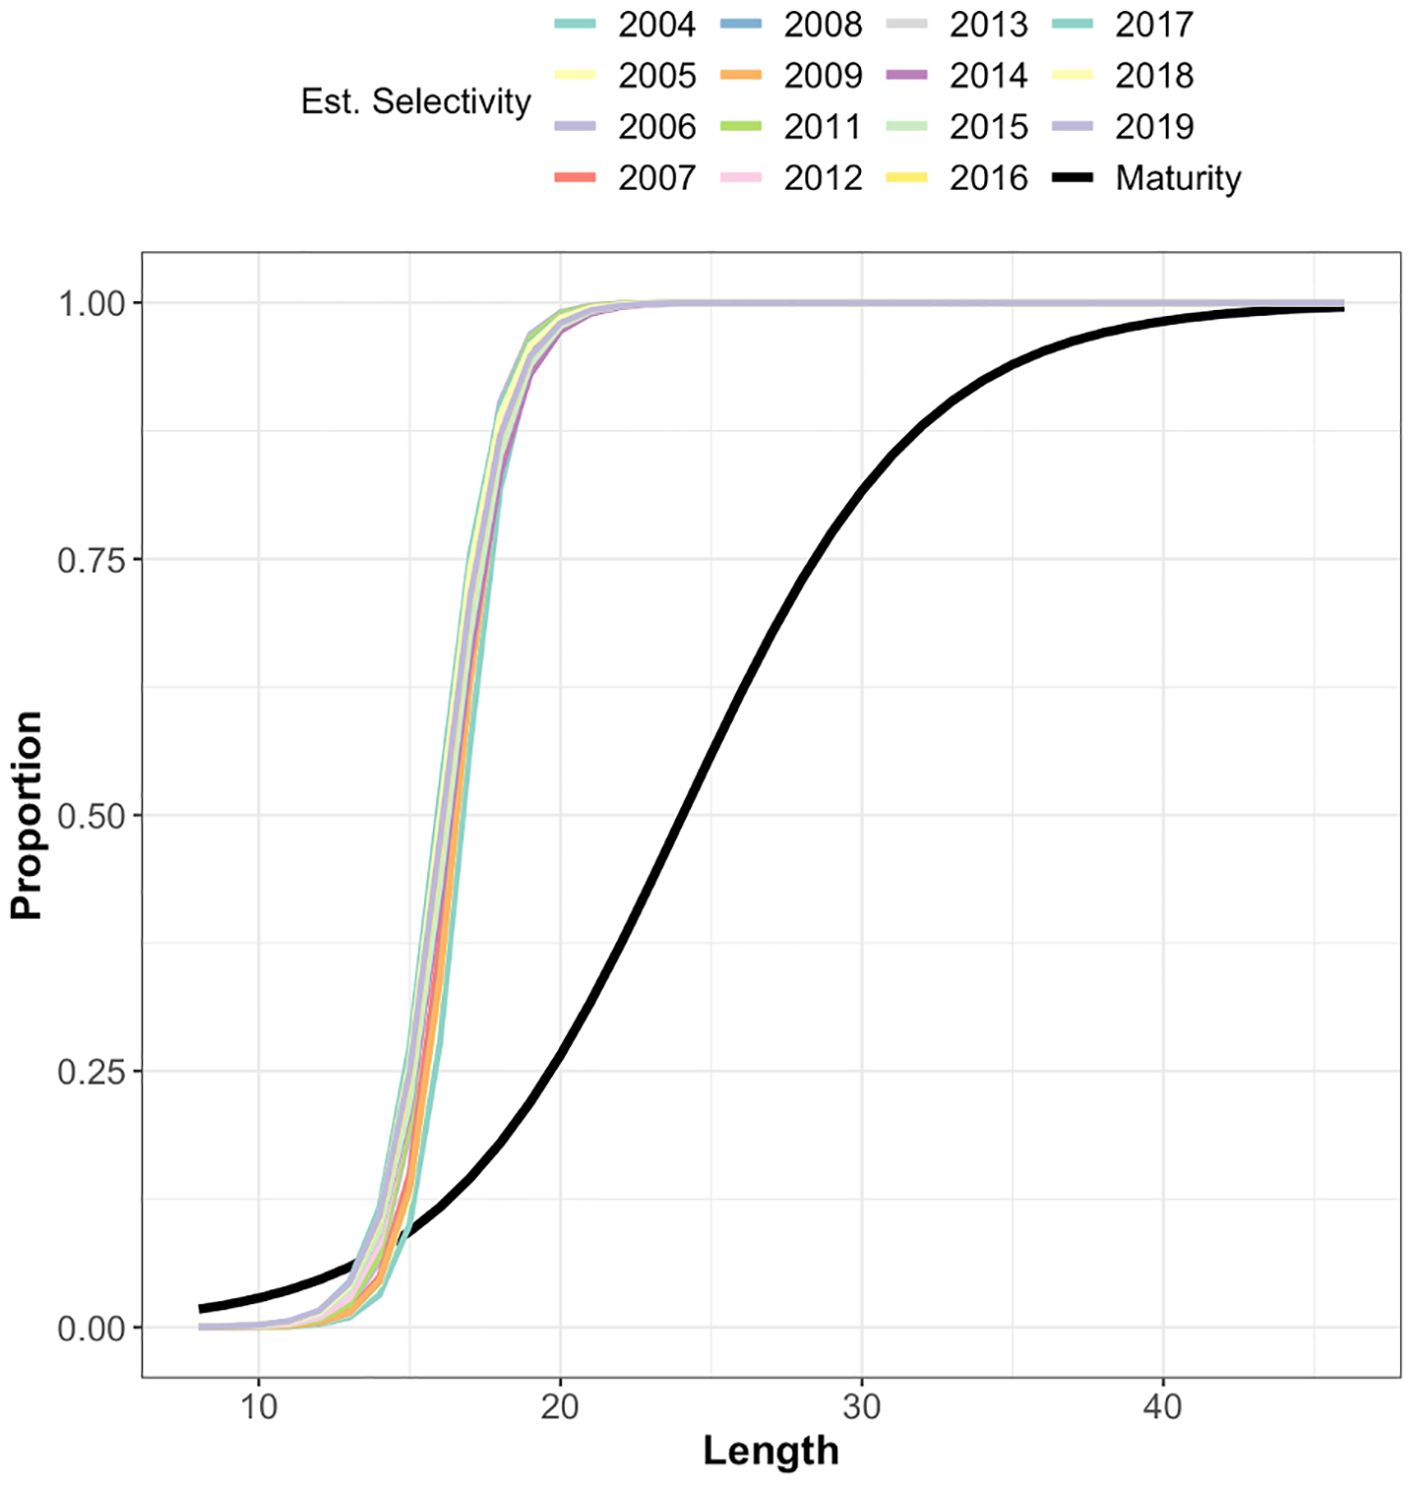
Figure 9. Maturity at length and the selectivity at length curves for chub mackerel.
The LBSPR model provides stock status by comparing the current spawning potential ratio to a reference level (such as the ratio that corresponds to MSY). In this case, in the absence of abundance information, SPR can be used to set an alternative reference point to the biomass at maximum sustainable yield (BMSY). The SPR results for the chub mackerel stock consistently fluctuated below the reference point of 0.4, which serves as a proxy for BMSY (with the exception of three data points) (Figure 10). The fitted relative fishing mortality (F/M) displayed a slight increase, indicating a rise in fishing pressure. The results of the LBSPR method suggest that, overall, the chub mackerel stock has been exploited at MSY level, with an increasing trend in fishing mortality. Additionally, the model estimates the selectivity sizes at 50 and 95% (SL50 and SL95). The LBSPR outputs indicate that changes in selectivity estimates are minimal, which is expected given that there is no temporal evolution in fishing fleet selectivity (Figure 10).
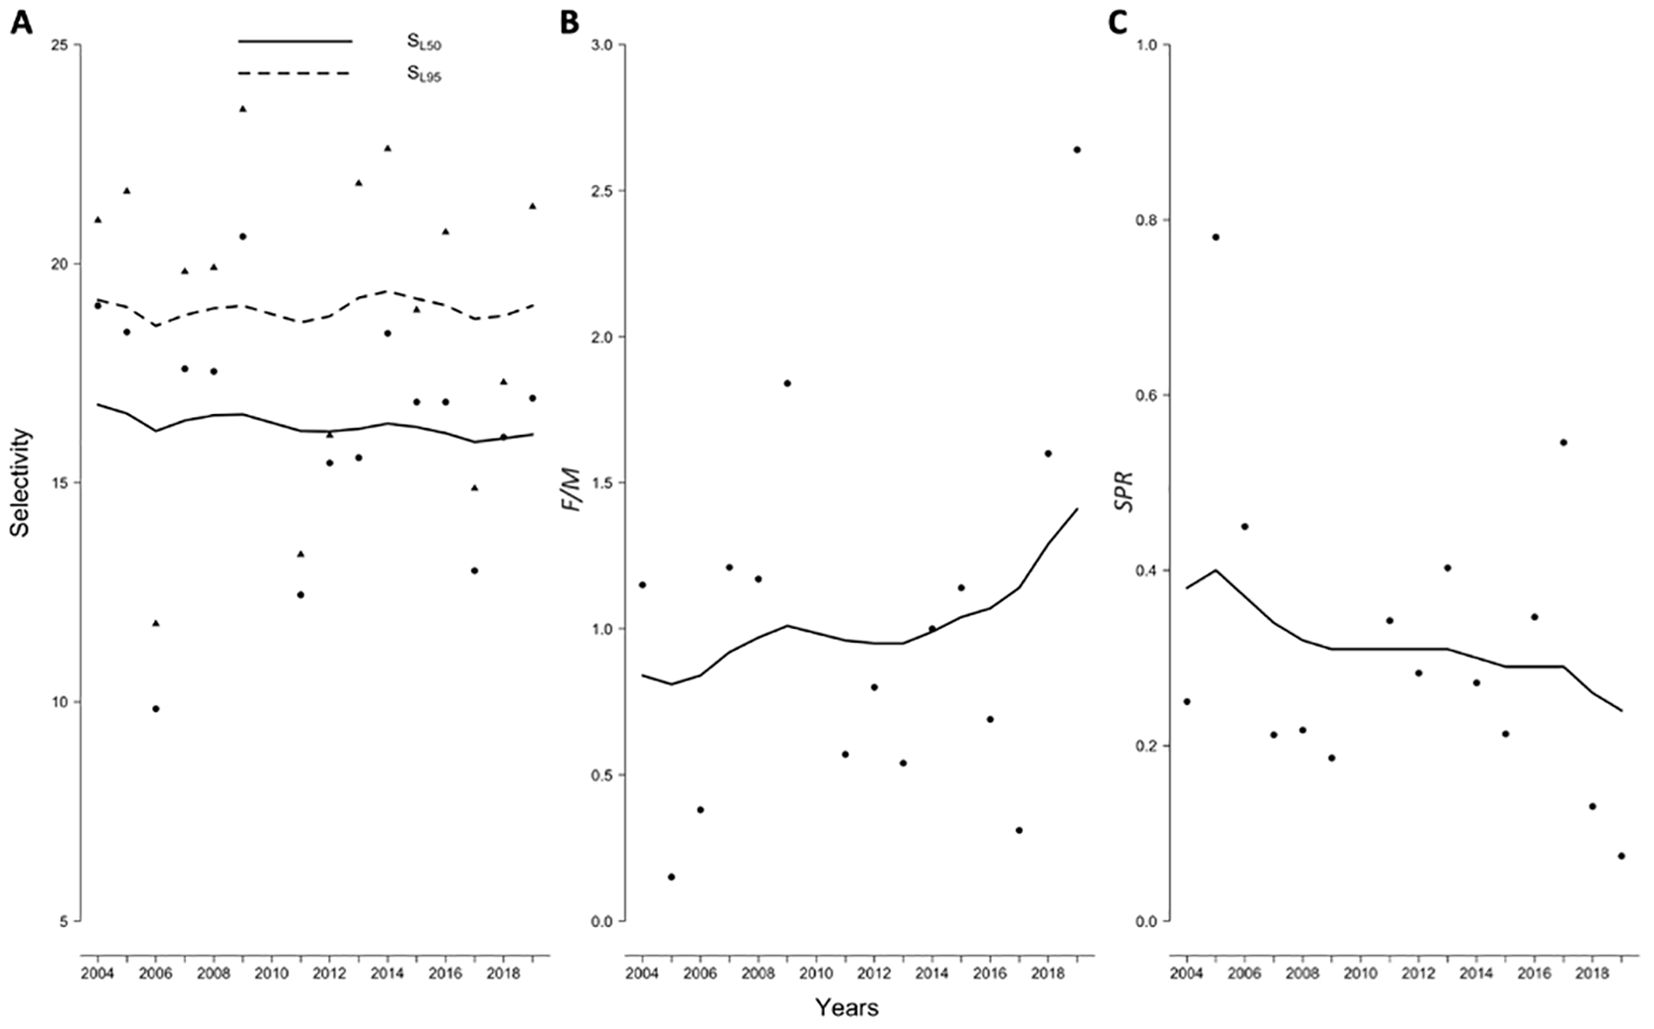
Figure 10. Visual display of estimated quantities [SL50 and SL95 (A), F/M (B), SPR (C)], the black line corresponds to the smoother line to the estimated points.
Results from the sensitivity analysis performed for the LBSPR method are summarized in Figure 11 and show the SPR and F/M estimates and the smoother lines for the alternative configuration/settings. The analysis reveals that inaccuracies in the values of M/k and L∞ affect F/M and SPR estimates similarly. More precisely, higher values of M/k or lower values of L∞ lead to a more optimistic assessment of stock status, characterized by an overestimation of SPR and an underestimation of F/M.
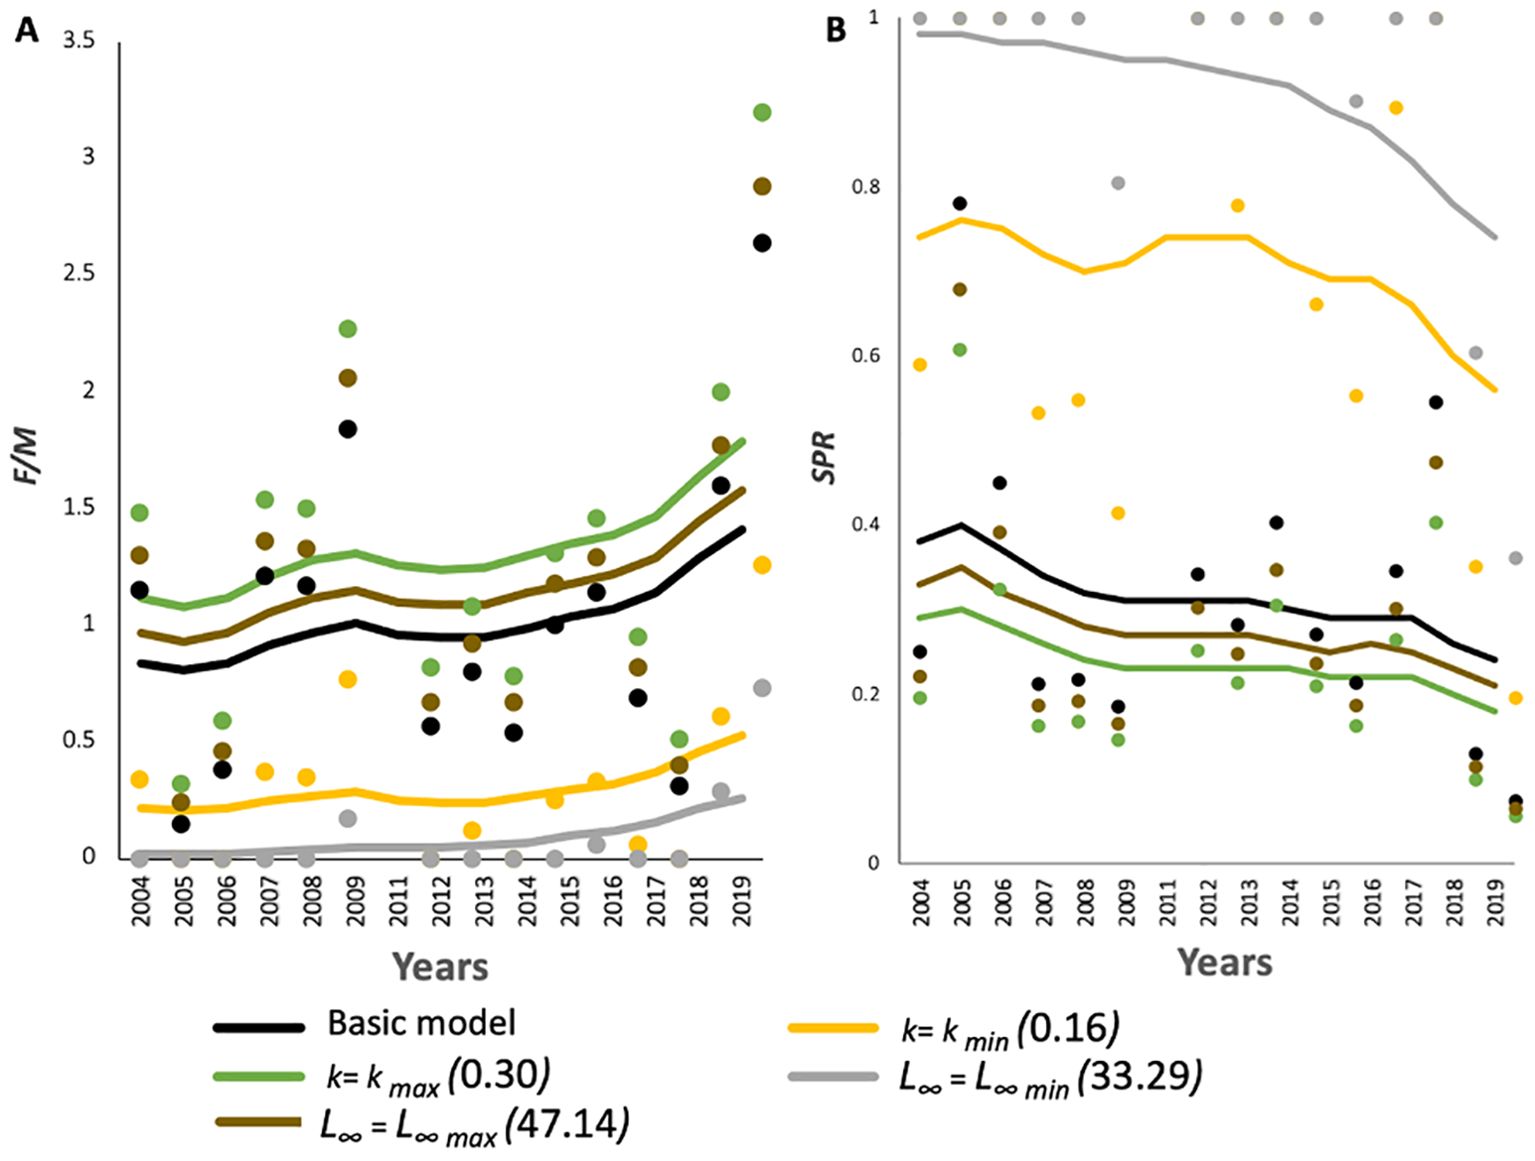
Figure 11. Plots of the F/M (A) and SPR (B) and their smoother lines derived from the sensitivity analysis carried out for the LBSPR model applied to chub mackerel.
According to Figures 10C and 12, both the LBSPR and LIME methods underestimated SPR. The “true” SPR is calculated for each year based on simulation testing from the life history list (Table 1). LIME method performed well, with a reduced confidence interval under the 30% depletion level of the stock. Both models exhibited negative bias in estimating SPR (Table 5). The LBSPR was the least biased in estimating SPR with<30% bias and imprecise. However, LIME showed high bias and low precision for SPR estimates, indicating the complexity of this method for integrating the effects of fishing mortality and recruitment variations on length frequency data.
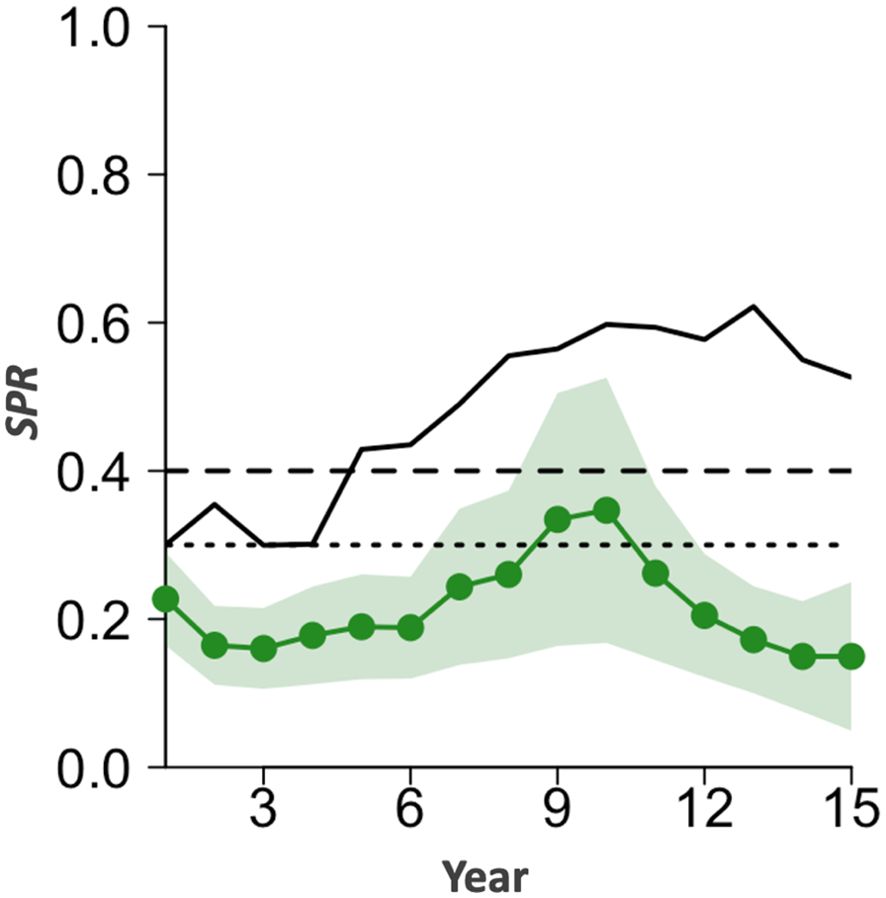
Figure 12. LIME estimates for SPR including 15 years (2004-2019) of length, catch and abundance index data (excluding the year 2010). The black curve corresponds to the “true” operational model and the green curve corresponds to the LIME model with its 95% Confidence Interval (shaded green region), the horizontal dashed black lines indicate the 0.4 target reference point and the 0.3 limit reference point.
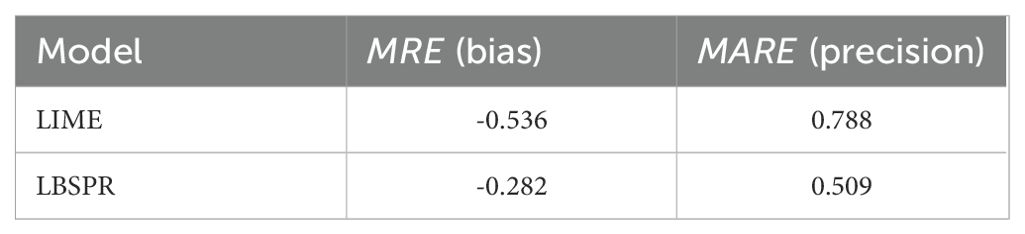
Table 5. Bias (MRE) and precision (MARE) calculated for SPR from LBSPR and LIME length-based methods.
4 Discussion
4.1 Stock status summary from SPiCT and LBSPR outputs
Gaining insights into the life history of chub mackerel and assessing its stock status is essential for initiating the development of a management plan aimed at preserving its population (Teixeira et al., 2016; Bouzzammit and El Ouizgani, 2019). This study uses two assessment methods designed for data-limited stocks and commonly applied for small and medium pelagic fisheries (Fréon et al., 2005). The application of these methods demonstrates that the surplus production model and length-based model offer a valuable tool for stock assessment of small-scale fisheries. Moreover, the chub mackerel of the central and southern, Moroccan Atlantic coast has never been assessed as a stock unit.
The SPiCT assessment reveals that the chub mackerel stock initially recovered from overexploitation to sustainable levels but fell below safe biological limits after 2015 due to increased fishing mortality. Historically, this stock has exhibited a slight upward trend from 1991 to 1997. However, since 1997, an overall decline has been observed in exploitation. This decrease can be attributed to several factors, including the expiration of the fisheries agreement with Russian at the close of 1999. Consequently, Russian trawlers operating under this agreement stopped their activities. Additionally, the cessation of operations by trawlers from Ukraine and other countries, which were operating under rental agreements or joint ventures, by the end of 2011 further contributed to this decline (FAO, 2013). As this species is exploited by multiple fleets, some targeting sardines and may also target chub mackerel when it becomes more available, mostly in summer, others by pelagic trawlers from different countries operating under fishing agreements, although normally this species is not the target of all these fleets. In recent years, there has a significant increase in the production of chub mackerel [around 20000 tons in 2010 to over 60000 tons in 2020 (FAO, 2020b)], however, its production is still affected by different factors such as the fishing season, weather conditions, and fishing regulations (ICES, 2021). Due to the variability of these factors, fish stock biomass can exhibit significant fluctuations from year to year. Consequently, the catch levels failed to reach a state of stability at the MSY reference point. However, if we compare only the catch data declared in the fishing activity reports, it can be suggested that the chub mackerel stock in the center and south of the Moroccan Atlantic coast is currently considered relatively stable in terms of fishing mortality (DPM, 2021).
Assessing the chub mackerel stock status based on the surveys data in the center and south of the Moroccan Atlantic coast separately, shows that the stock has been depleted (INRH/DP, 2019), and in order to maintain stock sustainability and facilitate its recovery, fisheries need to reduce their catches and fishing mortality. This reduction is necessary to restore the stock to a healthy state where MSY can be achieved (INRH/DP, 2019; FAO, 2020b). However, monitoring stock status based on survey data is more difficult, especially in harvesting systems where many operators’ fish seasonally and/or within temporal agreements (Smith et al., 2005). These results were relatively consistent with Schaefer’s production surplus model (Biodyn method) findings. For the central chub mackerel stock, the model shows full exploitation status, with biomass below the optimal level and reduced fishing mortality in 2017 and 2018, which doubled in 2019, leading to overexploitation (INRH/DP, 2019). In contrast, the assessment conducted in 2017 for the southern stock revealed a favorable condition, indicating an underexploited stock (INRH/DP, 2017), with biomass exceeding the optimal level and aligning with the maximum sustainable catch, along with reduced fishing effort. However, due to intensive exploitation of the southern stock between 2017 and 2019, it experienced a decline, and the results from the Biodyn approach indicate an overexploited state (INRH/DP, 2019). The combined SPiCT assessment for these two areas in this study, using multiple abundance indices, indicated a full exploitation to overexploitation state of the stock in the period from 2016 to 2021. In this case, with the availability of catch and multiple indices, SPiCT model is supported and recommended and is becoming increasingly commonly applied to European ICES stocks (Pedersen and Berg, 2017; Bouch et al., 2021; Dichmont et al., 2021). Unlike the Biodyn model, SPiCT can incorporate standard error information into the model parameters, enhancing its robustness (Soto et al., 2023).
Since there is limited available information regarding the biological and ecological characteristics of chub mackerel stock, as well as the absence of continuous time series data on biological indicators, the LBSPR model is applied to provide additional information on stock status. The LBSPR results for the last two years of the study (2018-2019) indicated that this stock is below the stock status limit (SPR<0.2) and remained consistently below the target reference points for stock status (SPR<0.4) in most years. Additionally, most of the fish caught were below the length at maturity, and in both scenarios, this stock was estimated to be in overexploitation status. Therefore, it is possible that most fish in the population are below length at maturity, and consequently, the model overestimates F/M ratios and underestimates SPR, and the effects of length data biased towards smaller fish have a greater impact (almost threefold) on SPR estimates than length data biased towards larger fish (Dai et al., 2021).
As Atlantic chub mackerel is considered a medium-lived species, it is recruited at an early age, allowing more accurate population data to be collected. These species therefore seem the easiest to assess, as their cohorts can be tracked and it’s easier to sample sufficient length classes (Chong et al., 2020; Pons et al., 2020). Regarding the sensitivity of results to logistic size selectivity, in most years, the length distribution is truncated at the left side entailing an underrepresentation of larger individuals in our data for this stock, which could be simply because they are not caught. Medeiros-Leal et al. (2023), demonstrated a dome-shaped selectivity for Atlantic chub mackerel associated with different selectivity patterns for the main fishing operations targeting this species in the Azores. In this study, given that this species is caught by multiple fleets, it can be assumed that the logistic selectivity assumption has been violated.
Therefore, assumptions and model structure and inputs are different between SPiCT and LBSPR models, unsurprisingly, to different results on the proxy of the stock status for chub mackerel. These results obtained with the length-based model and the surplus production model were different from the results of the previous assessment of the two stocks separately using the Biodyn approach. This species has a discontinuous distribution on the continental shelf, shifting between the central and southern zones (INRH/DP, 2019; ICES, 2021). Since 2004, catches have increased steadily in the southern area and remain stagnant in the center, with minor fluctuations (INRH/DRH, 2013). In the recent period (2016-2020), 67% of total catches were harvested in the southern zone and 26% in the central zone, while the highest abundances of chub mackerel were observed in the center (45%) and the south (35%) (INRH/DP, 2019; FAO, 2020b). It may be suggested that this close similarity in biomass level between the two fishing areas, and the large and high fluctuation of catches taken in the south compared with the center, may support the combined assessment results for this stock in this present paper. As has been the case since 2013, the CECAF Working Group has conducted joint assessments of both chub mackerel stock in their regional distribution area (from northern Morocco to southern Senegal), which is the only viable option due to the lack of data on the identified stocks in this region (FAO, 2020b). However, Studies recommend further research on chub mackerel migration behavior, genetics, morphometry, and meristic characterization globally to confirm biological management units for assessment purposes (Domínguez-Petit et al., 2022; Jurado-Ruzafa et al., 2024).
The combination of assessments highlights a limitation in length-based approaches while providing useful ecological insight and information on trends in fish size, fishing mortality (F) and stock status that is a direct value to managers (Hoggarth et al., 2006). Surplus production model estimates of absolute stock abundance, carrying capacity, and exploitation pressure, that are important quantities for informing fisheries management practice (Doray et al., 2010). Monitoring abundance indices such as CPUE, which typically ignore discards, is more difficult, especially in regions where many parties operate seasonally and/or as part of a diversity of activities (Smith et al., 2005; Soto et al., 2023). In this case, an advantage of the SPiCT model is that it can incorporate multiple abundance indices that may, in combination, represent patterns in catch and effort (Pedersen and Berg, 2017).
4.2 Comparison between the two models
When applying quantitative data-poor approaches to stock assessment, it will be important to incorporate other types of fisher’s knowledge into the interpretation of model outputs (Johannes et al., 2000). The two models used in this study are both data-limited models, but vary widely in the data required for their use. The model SPiCT does not consider the stock’s age structure, the variabilities in recruitment process and individual growth of fish, and its vulnerability to fishing gears. The model also assumed the stock’s carrying capacity and intrinsic growth rate to be constant over time regardless of environmental variations (Pedersen and Berg, 2017). Initial biomass is a random effect in SPiCT and is therefore estimated by the model, however, the quality of estimation can vary depending on the data and should be checked via the joint correlation of the fixed and random effects, and its sensitivity to prior assumptions. In cases where the abundance index begins after periods of high exploitation, it might be advisable to use expert knowledge to define a defensible prior for biomass depletion at the start of the time series (Aeberhard et al., 2018).
In terms of model performance SPiCT was< 40% biased and imprecise across scenarios when estimating the reference points. When estimating F/FMSY, the model performed the best in the full exploited scenario, each being< 20% biased and precise. At the beginning of the catch series, reported catches are particularly low, causing troubles with the absence of corresponding abundance data for the same period. This gap is further highlighted by the overestimation of fishing mortality with the limited estimated biomass, creating a lack of contrast. However, from 1994 onwards, there has been a marked increase in catches, in parallel with the information available on stock abundance. This increase in abundance indices probably contributes to the improvement in model fit. Given the lack of contrast, the abundance indices will be driving the model, as shown when removing abundance index 1.
For the LBSPR model, instead of catch data, length composition of catches is needed along with different life history parameters such as L∞, the ratio M/k, L50 and L95 to estimate the SPR, the relative fishing mortality (F/M) and the selectivity-at-length parameters (SL50 and SL95). Like any statistical model, the LBSPR model has certain assumptions that must be met for the model to be valid and provide reliable results. Based on the model results, we suggest that the proportion of fish in the population that is mature enough to spawn still important compared to the proportion of fish that would be able to spawn if the stock was depleted. Within a workshop on Atlantic chub mackerel held by ICES (ICES, 2021), a number of trials were conducted to assess this stock using the LBSPR model in different ICES and FAO areas, including the center and south of the Moroccan Atlantic coast. The results of these trials for the period 2002-2018 show high stock potential with an upward trend in relative fishing mortality associated with a declining SPR, which is consistent with those of the current LBSPR model with recent data and additional sources for life history parameters.
The sensitivity of the results was tested for the available values of k (ICES, 2021), revealing a slight sensitivity of the F/M ratio and SPR-estimated trends, resulting in stability of both estimates for a high value of k. In the current model, using the maximum and minimum values of k and L∞ had a significant impact on the normality point distribution of the model. This led to an overestimation of SPR and an underestimation of F/M when L∞ decreased and M/k increased. According to Shephard et al. (2018), a low L∞ can lead to false positives, suggesting a healthy stock status when the stock is actually in poor condition. Therefore, it is recommended to use estimates from stock-specific studies to accurately determine initial life history values in length-based assessments (Rudd et al., 2019).
Although this study briefly illustrated the impact of including recruitment variability on stock status, the operational model and LIME approach were mainly used to evaluate the performance of the LBSPR model. Despite a reduction in precision, LBSPR maintained a lower bias in SPR estimation than the LIME method. Introducing recruitment and fishing variability increased the bias compared with no error in the LBSPR model. This may support the fact that the basic assumptions of the LBSPR model including constant recruitment and fishing proved precise when the underlying selectivity is asymptotic (logistic size selectivity) (Hordyk et al., 2015b; Rudd and Thorson, 2018; Pons et al., 2019; Chong et al., 2020). However, in this study, the disproportionately high frequency of small fish sampled and the underestimated SPR led to detecting a dome-shaped selectivity (Pons et al., 2019).
Both the LBSPR model and SPiCT model have their advantages and limitations, The LBSPR model is often preferred when there is limited data available on the fish population, However, it does not take into account the random effect in the process population dynamics, as well as abundance indices and environmental variability that can affect the stock’s reproduction potential. In the other hand, SPiCT model requires more data on the stock’s biomass and harvest rates but can provide more comprehensive estimates of the stock’s sustainability and MSY. However, a combination of both models may be used to provide a more comprehensive assessment.
5 Conclusion
This study presents the first attempt at a combined assessment of chub mackerel stock harvested in Morocco’s two fishing zones [central zone (A+B) and southern zone (C)]. Two data-limited models have been used to assess the stock status and the biological reference points. Although the two approaches provide a qualitatively distinct assessment, they align closely regarding the stock status, indicating a transition from full exploitation to overexploitation, particularly during the period from 2016 to 2020. The LBSPR model showed a bad fit relative to the model’s equilibrium assumption, which calls for data from a fleet that targets a wide range of sizes, including adults, leading to reduced bias in SPR estimates (Pons et al., 2019; Medeiros-Leal et al., 2023). These disagreements between these assessments suggest that further investigation is required to identify the causes and that some caution is necessary considering the uncertainties still remaining regarding the chub mackerel stock units.
The methods presented in the current paper provide information on stock health, but it can be expected that the stock will have difficulty maintaining its level considering the low to medium resilience of the species, but the high carrying capacity may allow the stock to stabilize or increase the catches as seen in the mid_2000s period onwards. Based on the SPiCT outputs (biomass and fishing mortality estimates), fisheries managers can set appropriate catch limits and fishing efforts to ensure the long-term sustainability of the fishery. Additionally, the availability of length distribution data leads to assessing the current spawning potential ratio and comparing it to a reference level associated with MSY, enabling informed decisions on stock management. However poor-quality data and inadequate input parameters add uncertainty to LBSPR estimates, requiring updated life history parameters data, particularly for k and L∞, through a good sampling protocol covering the whole stock to improve accuracy.
Data availability statement
The raw data supporting the conclusions of this article will be made available by the authors, without undue reservation.
Author contributions
GD: Methodology, Writing – original draft, Writing – review & editing. KE: Supervision, Writing – review & editing. MR: Funding acquisition, Methodology, Supervision, Writing – review & editing. KK: Supervision, Writing – review & editing.
Funding
The author(s) declare that financial support was received for the research, authorship, and/or publication of this article. This research has been developed in the framework of the Math4Fish project: New tools for mathematical modelling in Spanish fisheries scientific advice, financed by the European Union – NextGenerationEU, and the Recovery and Resilience Facility, Component 3, Investment 7 and has been carried out within the framework of the agreement between the Spanish Ministry of Agriculture, Fishing and Food and the Spanish National Research Council (CSIC) through the Spanish Institute of Oceanography (IEO) to promote fisheries research as a basis for sustainable fisheries management. Views and opinions expressed are however those of the author(s) only and do not necessarily reflect those of the European Union or European Commission. Neither the European Union nor the European Commission can be held responsible for them.
Acknowledgments
The authors would like to thank the editor and the reviewers for their very useful suggestions and comments on this manuscript, which helped to improve the paper.
Conflict of interest
The authors declare that the research was conducted in the absence of any commercial or financial relationships that could be construed as a potential conflict of interest.
Publisher’s note
All claims expressed in this article are solely those of the authors and do not necessarily represent those of their affiliated organizations, or those of the publisher, the editors and the reviewers. Any product that may be evaluated in this article, or claim that may be made by its manufacturer, is not guaranteed or endorsed by the publisher.
Supplementary material
The Supplementary Material for this article can be found online at: https://www.frontiersin.org/articles/10.3389/fmars.2024.1386541/full#supplementary-material
References
Aeberhard W. H., Flemming J. M., Nielsen A. (2018). Review of state-space models for fisheries science. Annu. Rev. Of Stat Its Application 5, 215–235. doi: 10.1146/annurev-statistics-031017-100427
Ait Ballagh F. E., Rabouille C., Andrieux-Loyer F., Soetaert K., Lansard B., Bombled B., et al. (2021). Spatial variability of organic matter and phosphorus cycling in rhône river spatial variability of organic matter and phosphorus cycling in rhône river prodelta sediments (NW Mediterranean Sea, France): a model-data approach. Estuaries Coasts 44, 1765–1789. doi: 10.1007/s12237-020-00889-9
Bouch P., Minto C., Reid D. G. (2021). Comparative performance of data-poor CMSY and data-moderate spict stock assessment methods when applied to data-rich, real-world stocks. ICES. J. Mar. Sci. 78, 264–276. doi: 10.1093/icesjms/fsaa220
Bouzzammit N., El Ouizgani H. (2019). Morphometric and meristic variation in the Atlantic chub mackerel scomber colias Gmelin 1789 from the Moroccan coast. Indian J. Fisheries 66, 8–15. doi: 10.21077/ijf.2019.66.2.78488-02
Chong L., Mildenberger T. K., Rudd M. B., Taylor M. H., Cope J. M., Branch T. A., et al. (2020). Performance evaluation of data-limited, length-based stock assessment methods. ICES J. Mar. Sci. 77, 97–108. doi: 10.1093/icesjms/fsz212
Costello C., Ovando D., Hilborn R., Gaines S. D., Deschenes O., Lester S. E. (2012). Status and solutions for the world’s unassessed fisheries. Science 338, 517–520. doi: 10.1126/science.1223389
Dai L., Wang F., Gao C., Hodgdon C., Xu L., Wang J., et al. (2021). Evaluating the impact of systematic error on the estimation performance of a length-based spawning potential ratio. Mar. Coast. Fish. 13, 673–686. doi: 10.1002/mcf2.10185
Damsiri Z., Khalil K., Derhy G., Rhomad H., Adebola T., Elkalay K. (2021). An ecopath model for fisheries management in the Mogador marine protected area (Moroccan, Atlantic). Community Ecol. 23, 13–26. doi: 10.1007/s42974-021-00069-0
Derhy G., Macías D., Elkalay K., Khalil K., Rincón M. M. (2022). Stochastic modelling to assess external environmental drivers of Atlantic chub mackerel population dynamics. Sustainability 14, 9211. doi: 10.3390/su14159211
Dichmont C. M., Deng R. A., Dowling N., Punt A. E. (2021). Collating stock assessment packages to improve stock assessments. Fisheries Res. 236, 105844. doi: 10.1016/j.fishres.2020.105844
Dick E. J., MacCall A. D. (2011). Depletion-Based Stock Reduction Analysis : A catch-based method for determining sustainable yields for data-poor fish stocks. Fisheries Res. 110, 331–341. doi: 10.1016/j.fishres.2011.05.007
Diogoul N. (2019). Procédure Nationale d’évaluation directe des stocks de petitspoissons pélagiques au Royaume du Maroc: acoustique halieutique & écho-intégration. Dakar, Sénégal: Université Cheikh Anta Diop de Dakar (UCAD).
Domínguez-Petit R., Navarro. M. R., Cousido-Rocha. M., Tornero. J., Ramos. F., Jurado-Ruzafa. A., et al. (2022). Spatial variability of life-history parameters of the Atlantic chub mackerel (Scomber colias), an expanding species in the northeast Atlantic. Scientia Marina 86, e048. doi: 10.3989/scimar.2022.86n4
Doray M., Masse J., Petitgas P. (2010). Pelagic fish stock assessment by acousticmethods at Ifremer. Ref. R.INT. DOP/DCN/EMH 10- 02. Ifremer. doi: 10.13155/11446
DPM (2019). Rapport d’activité du Département de la pêche maritime-Année 2018. Available online at: http://www.mpm.gov.ma/wps/portal/PortaIl-MPM/ACCUEIL/Publications/Rapports.
DPM (2021). Rapport d’activité du Département de la pêche maritime-Année 2020. Available online at: http://www.mpm.gov.ma/wps/portal/PortaIl-MPM/ACCUEIL/Publications/Rapports.
Essekhyr H., Khalil K., Damsiri Z., Derhy G., Elkalay K. (2019). Trophic interactions in the coastal ecosystem of Morocco: An Ecopath approach. Community Ecol. 20, 161–171. doi: 10.1556/168.2019.20.2.6
FAO (2006). Report of the Working Group on the Assessment of Small Pelagic fish off Northwest Africa. Nouadhibou, Mauritania, 26 April–5 May 2005 (Rome: FAO Fisheries and Aquaculture Report No. 1221).
FAO (2013). Report of the Working Group on the Assessment of Small Pelagic fish off Northwest Africa. Casablanca. Morocco, 24–28 May 2011 (Rome: FAO Fisheries and Aquaculture Report No. 1026).
FAO (2018). Report of the Working Group on the Assessment of Small Pelagic fish off Northwest Africa. Nouadhibou, Mauritania, 22–27 May 2017 (Rome: FAO Fisheries and Aquaculture Report No. 1221).
FAO (2020a). The state of world fisheries and aquaculture. 2020. Sustainability in action Rome, Italy. doi: 10.4060/ca9229en
FAO (2020b). Report of the Working Group on the Assessment of Small Pelagic Fish of Northwest Africa Casablanca, Morocco. 8-13 July 2019. Fishery Committee for the Eastern Central Atlantic (CECAF) (FAO Fisher and Aquaculture Report No. 1309). Rome, Italy. doi: 10.4060/ca9562b
FAO (2023). Report of the Working Group on the Assessment of Small Pelagic fish off Northwest Africa 2021 held virtually from 21–25 June 2021. Fishery Committee for the Eastern Central Atlantic (CECAF) (FAO Fisher and Aquaculture Report No. 1370). Rome, Italy. doi: 10.4060/cc2467b
Fitzgerald C. J., Delanty K., Shephard S. (2018). Inland fish stock assessment: Applying data-poor methods from marine systems. Fisheries Manage. Ecol. 25, 240–252. doi: 10.1111/fme.12284
Free C. M., Jensen O. P., Wiedenmann J., Deroba J. J. (2017). The refined ORCS approach : A catch-based method for estimating stock status and catch limits for data-poor fish stocks. Fisheries Res. 193, 60–70. doi: 10.1016/j.fishres.2017.03.017
Fréon P., Cury P., Shannon L., Roy C. (2005). Sustainable exploitation of small pelagic fish stocks challenged by environmental and ecosystem changes: A review. Bull. Mar. Sci. 76, 385–462.
Froese R., Demirel N., Coro G., Kleisner K. M., Winker H. (2017). Estimating fisheries reference points from catch and resilience. Fish Fisheries 18, 506–526. doi: 10.1111/faf.12190
Hilborn R., Amoroso R. O., Anderson C. M., Baum J. K., Branch T. A., Costello C., et al. (2020). Effective fisheries management instrumental in improving fish stock status. Proc. Natl. Acad. Sci. United States America 117, 2218–2224. doi: 10.1073/pnas.1909726116
Hoggarth D., Abeyasekera S., Arthur R., Beddington J., Burn R., Halls A. (2006). Stock assessment for fishery management – A framework guide to the stock assessment tools of the Fisheries Management Science Programme (FMSP) Vol. 2006 (Rome, FAO: FAO Fisheries Technical Paper. No. 487), 261.
Hordyk A. (2019). LBSPR: length-based spawning potential ratio. R package version 0.1.5. Available at: https://CRAN.R-project.org/package=LBSPR.
Hordyk A. R., Loneragan N. R., Prince J. D. (2015b). An evaluation of an iterative harvest strategy for data-poor fisheries using the length-based spawning potential ratio assessment methodology. Fish Res. 171, 20–32. doi: 10.1016/j.fishres.2014.12.018
Hordyk A., Ono K., Valencia S., Loneragan N., Prince J. (2015a). A novel length-based empirical estimation method of spawning potential ratio (SPR), and tests of its performance, for small-scale, data-poor fisheries Adrian. ICES J. Mar. Sci. 72, 217–231. doi: 10.1093/icesjms/fsu004
Hordyk A., Prince J. D., Carruthers T. R., Walters C. J. (2019). Comment on “ A new approach for estimating stock status from length frequency data ” by Froese et al., (2018). ICES J. Mar. Sci. 76, 457–460. doi: 10.1093/icesjms/fsy168
Hurtado-Ferro F., Szuwalski C. S., Valero J. L., Anderson S. C., Cunningham C. J., Johnson K. F., et al. (2015). Looking in the rear-view mirror: bias and retrospective patterns in integrated, age-structured stock assessment models. ICES J. Mar. Sci. 72, 99–110. doi: 10.1093/icesjms/fsu198
ICES (2015). Report of the Fifth Workshop on the Development of Quantitative As- sessment Methodologies based on Life-history Traits, Exploitation Characteristics and other Relevant Parameters for Data-limited Stocks (WKLIFE V), 5–9 October 2015, Lisbon, Portugal Vol. 56 (Copenhagen, Denmark:ICES CM 2015/ACOM), 157.
ICES (2021). Second Workshop on Atlantic chub mackerel (Scomber colias) (WKCOLIAS2). ICES Sci. Rep. 3, 18. doi: 10.17895/ices.pub.8142
INRH/DP (2017). Rapport annuel de l’état des stocks et des pêcheries marocaines 2017. Département Des Pêches, Institut National de Recherche Halieutique, INRH, Casablanca (Morocco).
INRH/DP (2019). Rapport annuel de l’état des stocks et des pêcheries marocaines 2019. Département Des Pêches, Institut National de Recherche Halieutique, INRH, Casablanca (Morocco).
INRH/DRH (2013). Rapport annuel de l’état des stocks et des pêcheries marocaines 2013. Département Des Pêches, Institut National de Recherche Halieutique, INRH, Casablanca (Morocco).
Johannes R. E., Freeman M. M. R., Hamilton R. J. (2000). Ignore fishers ‘ knowledge and miss the boat. Fish Fisheries 1, 257–271. doi: 10.1111/j.1467-2979.2000.00019.x
Jurado-Ruzafa A., Vasconcelos J., Otero-Ferrer J. L., Navarro M. R., Massaro A., Hernández C., et al. (2024). Phenotypic response of a geographically expanding species, Scomber colias: Clues in the fish otolith shape. Estuarine Coast. Shelf Sci. 305, 108880. doi: 10.1016/j.ecss.2024.108880
Kokkalis A., Berg C. W., Kapur M. S., Winker H., Jacobsen N. S., Taylor M. H., et al. (2024). Good practices for surplus production models. Fisheries Res. 275, 107010. doi: 10.1016/j.fishres.2024.107010
Lart W. (2022). Guide to Fishing at Maximum Sustainable Yield (MSY). Seafish, SR743 Version 2 February 2022. Edinburgh, UK.
Liao B., Xu Y., Sun M., Zhang K., Liu Q. (2022). Performance comparison of three data-poor methods with various types of data on assessing southern Atlantic albacore fishery. Front. Mar. Sci. 9. doi: 10.3389/fmars.2022.825461
MacCall A. D. (2009). Depletion-corrected average catch : a simple formula for estimating sustainable yields in data-poor situations. ICES J. Mar. Sci. 66, 2267–2271. doi: 10.1093/icesjms/fsp209
Medeiros-Leal W., Santos R., Peixoto U. I., Casal-Ribeiro M., Novoa-Pabon A., Sigler M. F., et al. (2023). Performance of length-based assessment in predicting small-scale multispecies fishery sustainability. Rev. Fish Biol. Fisheries 33, 819–852. doi: 10.1007/s11160-023-09764-9
Milusheva S. (2020). The maximum (Un)Sustainable yield. An assessment (Múnich: GRIN Verlag). Available at: https://www.grin.com/document/1000032.
Pedersen M. W., Berg C. W. (2017). A stochastic surplus production model in continuous time. Fish Fisheries 18, 226–243. doi: 10.1111/faf.12174
Pella J. J., Tomlinson P. (1969). A generalized stock production model. Bull. Inter-American Trop. Tuna Commission 13, 421–458.
Pons M., Cope J. M., Kell L. T. (2020). Comparing performance of catch-based and length-based stock assessment methods in data-limited fisheries. Can. J. Fish Aquat Sci. 77, 1026–1037. doi: 10.1139/cjfas-2019-0276
Pons M., Kell L., Rudd M. B., Cope J. M., Lucena Frédou F. (2019). Performance of length-based data-limited methods in a multifleet context: Application to small tunas, mackerels, and bonitos in the Atlantic Ocean. ICES J. Mar. Sci. 76, 960–973. doi: 10.1093/icesjms/fsz004
Prince J., Creech S., Madduppa H., Hordyk A. (2020). Length based assessment of spawning potential ratio in data-poor fisheries for blue swimming crab (Portunus spp.) in Sri Lanka and Indonesia: Implications for sustainable management. Regional Stud. Mar. Sci. 36, 101309. doi: 10.1016/j.rsma.2020.101309
Rhomad H., Khalil K., Elkalay K. (2022). Water quality modeling in Atlantic region: review, science mapping and future research directions. Water Resour. Management 37, 451–499. doi: 10.1007/s11269-022-03382-z
Rhomad H., Khalil K., Neves R., Bougadir B., Elkalay K. (2021). Modeling investigation of the nutrients and phytoplankton dynamics in the Moroccan Atlantic coast : A case study of Agadir coast. Ecol. Model. 447, 109510. doi: 10.1016/j.ecolmodel.2021.109510
Roa-ureta R. H. (2015). Stock assessment of the Spanish mackerel (Scomberomorus commerson) in Saudi waters of the Arabian Gulf with generalized depletion models under data-limited conditions. Fisheries Res. 171, 68–77. doi: 10.1016/j.fishres.2014.08.014
Rudd M. B. (2019). LIME: An R package for simulation and estimation using length data to account for variable fishing mortality and recruitment. Available online at: https://github.com/merrillrudd/LIME.
Rudd M. B., Thorson J. T. (2018). Accounting for variable recruitment and fishing mortality in length-based stock assessments for data-limited fisheries. Can. J. Fish Aquat Sci. 75, 1019–1035. doi: 10.1139/cjfas-2017-0143
Rudd M. B., Thorson J. T., Sagarese S. R. (2019). Ensemble models for data-poor assessment: accounting for uncertainty in life-history information. ICES J. Mar. Sci. 76, 870–883. doi: 10.1093/icesjms/fsz012
Schaefer M. B. (1954). Some aspects of the dynamics of populations important to the management of the commercial marine fisheries. Am. Trop. Tuna Commission Bulletin 1, 25–56.
Shephard S., Davidson I. C., Walker A. M., Gargan P. G. (2018). Length-based indicators and reference points for assessing data-poor stocks of diadromous trout Salmo trutta. Fish. Res. 199, 36–43. doi: 10.1016/j.fishres.2017.11.024
Smith C. T., Templin W. D., Seeb J. E., Seeb L. W. (2005). Single nucleotide polymorphisms provide rapid and accurate estimates of the proportions of U.S. and Canadian Chinook salmon caught in Yukon river fisheries. North Am. J. Fisheries Manage. 25, 944–953. doi: 10.1577/M04-143.1
Soto M., Fernández-Peralta L., Pennino M. G., Kokkalis A., Rey J., Salmerón F., et al. (2023). Effects of misreporting landings, discards, and Catch Per Unit of Effort index in state-space production models: the case of black hake in northwest Africa. ICES J. Mar. Sci. 80, 2591–2605. doi: 10.1093/icesjms/fsac188
Teixeira C. M., Gamito R., Leitão F., Murta A. G., Cabral H. N., Erzini K., et al. (2016). Environmental influence on commercial fishery landings of small pelagic fish in Portugal. Regional Environ. Change 16, 709–716. doi: 10.1007/s10113-015-0786-1
Thorson J. T., Cope J. M., Branch T. A., Jensen O. P. (2012). Spawning biomass reference points for exploited marine fishes, incorporating taxonomic and body size information. Can. J. Fisheries Aquat. Sci. 69, 1556–1568. doi: 10.1139/f2012-077
Tsikliras A. C., Froese R. (2019). “Maximum Sustainable Yield,” in Encyclopedia of Ecology, 2nd edn, vol. 1 . Ed. Fath B. D. (Elsevier, Oxford), 108–115. 2780 pp.
World bank (2012). The World Bank Annual Report 2012 (The World Bank). (Washington DC: World Bank). Available at: http://documents.worldbank.org/curated/en/168831468332487486/Main-report
Keywords: chub mackerel, data-poor fisheries, SPiCT, LBSPR, Moroccan Atlantic coast, MSY
Citation: Derhy G, Elkalay K, Rincón MM and Khalil K (2024) Stochastic surplus production and length-based assessment models to compare Maximum Sustainable Yield advice for the Moroccan Atlantic chub mackerel. Front. Mar. Sci. 11:1386541. doi: 10.3389/fmars.2024.1386541
Received: 15 February 2024; Accepted: 29 July 2024;
Published: 20 September 2024.
Edited by:
Pablo Presa, University of Vigo, SpainReviewed by:
Wendell Medeiros-Leal, Marine Research Institute (IMAR), PortugalYibang Wang, Chinese Academy of Sciences (CAS), China
Richard Kindong, Shanghai Ocean University, China
Copyright © 2024 Derhy, Elkalay, Rincón and Khalil. This is an open-access article distributed under the terms of the Creative Commons Attribution License (CC BY). The use, distribution or reproduction in other forums is permitted, provided the original author(s) and the copyright owner(s) are credited and that the original publication in this journal is cited, in accordance with accepted academic practice. No use, distribution or reproduction is permitted which does not comply with these terms.
*Correspondence: Margarita María Rincón, bWFyZ2FyaXRhLnJpbmNvbkBpZW8uY3NpYy5lcw==
‡ORCID: Ghoufrane Derhy, orcid.org/0000-0003-4196-3682
Margarita María Rincón, orcid.org/0000-0002-2866-3178