 Hui Li1,2,3
 Yang Liu
 Chaoyue Wang
 Yahong Zhou
95% of researchers rate our articles as excellent or good
Learn more about the work of our research integrity team to safeguard the quality of each article we publish.
Find out more
ORIGINAL RESEARCH article
Front. Mar. Sci. , 16 May 2024
Sec. Marine Biogeochemistry
Volume 11 - 2024 | https://doi.org/10.3389/fmars.2024.1384289
To investigate the hydrogeochemical characteristics of shallow groundwater and evaluate groundwater salinization state in Cangzhou, China, two sampling campaigns have been conducted. In summer, 33 groundwater samples, 3 seawater samples and 5 river water samples were collected. In winter, 22 groundwater samples were collected. The hydrochemical type was determined by the Piper diagram. Evolution mechanisms of groundwater were analyzed by the Gibbs diagram. The trend of de-salinization or salinization of groundwater was determined by the hydrochemical facies evolution diagram. The groundwater salinization grade was evaluated by both the seawater intrusion groundwater quality index (GQISWI) and the attribute recognition model based on entropy weight (ARMEW). The Piper diagram shows that Na+ is the dominant cation and Cl- is the dominant anion in shallow groundwater, and the groundwater in this area is mainly of Cl-Na type followed by Cl-Ca·Mg type. The evaporation-crystallization process has significant influence on the evolution of saline groundwater. In summer, most brackish groundwater exhibit compositions of the freshening stage with direct cation exchange, and most saline groundwater is mainly at the seawater intrusion stage with reverse cation exchange. In winter, compared to the summer season, more groundwater samples in the middle of study area exhibit intrusion trend, and without obvious Na-HCO3 facies. In summer, values of GQISWI range from 20.47 to 75.38 with an average of 59.31. The GQISWI gradually increases from east to west, denoting the degree of groundwater salinization is alleviated from coast to inland. In winter, values of GQISWI range from 54.47 to 79.09 with an average of 66.00, slightly higher than that in summer. The proportion of no salinization (Grade I), minor salinization (Grade II) and serious salinization (Grade III) of groundwater samples in Cangzhou identified by ARMEW is 3.0%, 21.2% and 75.8% in summer, respectively. In winter, the proportion is 9.1% for Grade II and 90.9% for Grade III. The GQISWI index shows the largest area of Grade II, and ARMEW presents the largest area of Grade III in both seasons. Compared with GQISWI index, ARMEW model gives more conservative evaluation results of groundwater salinization. The results provide useful information on the groundwater salinization status for the local area, and help for the management of groundwater resources in Cangzhou.
Groundwater is one of the crucial resources for coastal areas which accommodate 40% of the world’s population (Essink, 2001). Nevertheless, growing population and city expansion have exerted enormous stress on groundwater quantity (Kumar et al., 2023). The excessive exploitation of groundwater has caused many problems including seawater intrusion, soil salinization, worsened groundwater quality and ecological deterioration (Stamatis and Voudouris, 2003; Bless et al., 2018; Li et al., 2022; Xiong et al., 2022).
Groundwater salinization is becoming one of the major environmental issues in more and more coastal areas around the world, and about 32% of the coastal metropolitan cities have been threatened. It is reported that over 501 cities around the world facing groundwater salinization issues (Cao et al., 2021). Many countries have paid much attention to the research of groundwater salinization, including USA (Jasechko et al., 2020; Lotfata and Ambinakudige, 2020), UK (Moulds et al., 2023), Korea (Kim et al., 2021), Australia (Banks et al., 2021), India (Dhakate et al., 2020), Spain (Martínez-Pérez et al., 2022), Italy (Ghiglieri et al., 2012), Saudi Arabia (Benaafi et al., 2022, 2023) and Tunisia (Moussaoui et al., 2023).
To evaluate regional groundwater salinization status, chemical indexes such as Cl- or total dissolved solids (TDS) are commonly used. Compared to the single-index method, the multi-index evaluation method has obvious advantages, which can reflect the groundwater salinization degree more comprehensively and stably. The multi-index evaluation method includes the GALDIT method (ChaChadi and Lobo-Ferreira, 2001), the “water quality index” (WQI) method (Boyacioglu, 2007), the groundwater quality index for seawater intrusion (GQISWI, Tomaszkiewicz et al., 2014), fuzzy mathematics (Zhao, 1998; Icaga, 2007), analytic hierarchy process (Saaty, 1980), and entropy weight method (Zou et al., 2006). Wherein, the GQISWI incorporates the seawater proportion and information from the Piper graph to convert groundwater chemical types into numerical values (0~100). Therefore, it can directly evaluate the degree of groundwater salinization by values of GQISWI, which is more comprehensive than the single-index method. Besides, for the entropy weight method, it has obvious advantages in calculating index objective weights. However, entropy weights are easily influenced by sample size and value. Also, it depends excessively upon objective data when determining weights, and ignores the relation between objectives and indicators. This sometimes leads to confusing and unexplained assessments (Wang et al., 2022).
To address these limitations, here, the entropy weight method was coupled with the attribute recognition model which fully considers the sample information. In this method, the index weights are determined by the judgment matrix related to representative values for evaluation indices under objective conditions. It combines the objective weighting characteristics of entropy weight method with the ordered segmentation of attribute recognition model. By this means, the subjectivity of the weight of each factor is eliminated, and the evaluation results are in accord with the fact. Therefore, to assess groundwater salinization status, this study applied both the GQISWI index and the attribute recognition model based on entropy weight (ARMEW).
In China, groundwater salinization research has been reported for coastal aquifers near the Jiaozhou Bay (Gang et al., 2019), the Yellow River delta (Liu et al., 2014), the Laizhou Bay (Xue et al., 1993; Han et al., 2011; Wang et al., 2020), the Qianhuangdao area (Zhang et al., 2013), and the southern China (Xiong et al., 2022). However, there were few studies investigating the hydrogeochemical characteristics and groundwater salinization in the coastal region of Cangzhou on the west of Bohai Bay. Groundwater salinization status was seldom investigated for this important area that 7.54 million people inhabit. In addition, although different evaluation methods have been put forward in previous work, few studies compared the salinization results between different evaluation methods. To fill these gaps, the present study tries to conduct a detailed and a systematic evaluation on the groundwater salinization status and related hydrogeochemical characteristics through multidisciplinary methods. The main goals of this work include: (1) identify shallow groundwater hydrogeochemical characteristics and its evolution mechanisms; (2) assess and compare the degree of groundwater salinization through both methods of GQISWI index and the ARMEW. The results provide useful information on the groundwater salinization status for the local area, and help for the management of groundwater resources.
Cangzhou City is located in the east of Hebei Province, China, with an area of 14,304 km2 (Figure 1). The climate in this area is controlled by the warm temperate continental monsoon, with four distinct seasons. The annual average temperature is 12.5°C. The annual average precipitation is 581 mm and the annual average evaporation is 1,574 mm. The precipitation in July to September accounts for 66% of the annual precipitation. The terrain in this region is flat with the general elevation lower than 16 m, and it inclines slightly from southwest to northeast. The South Canal, part of the Beijing-Hangzhou Canal, flows through this area. Other main rivers include the Ziya River, the Jiedijian River, the Nanpai Canal, the Dalangdian Canal, and the Xuanhui River.
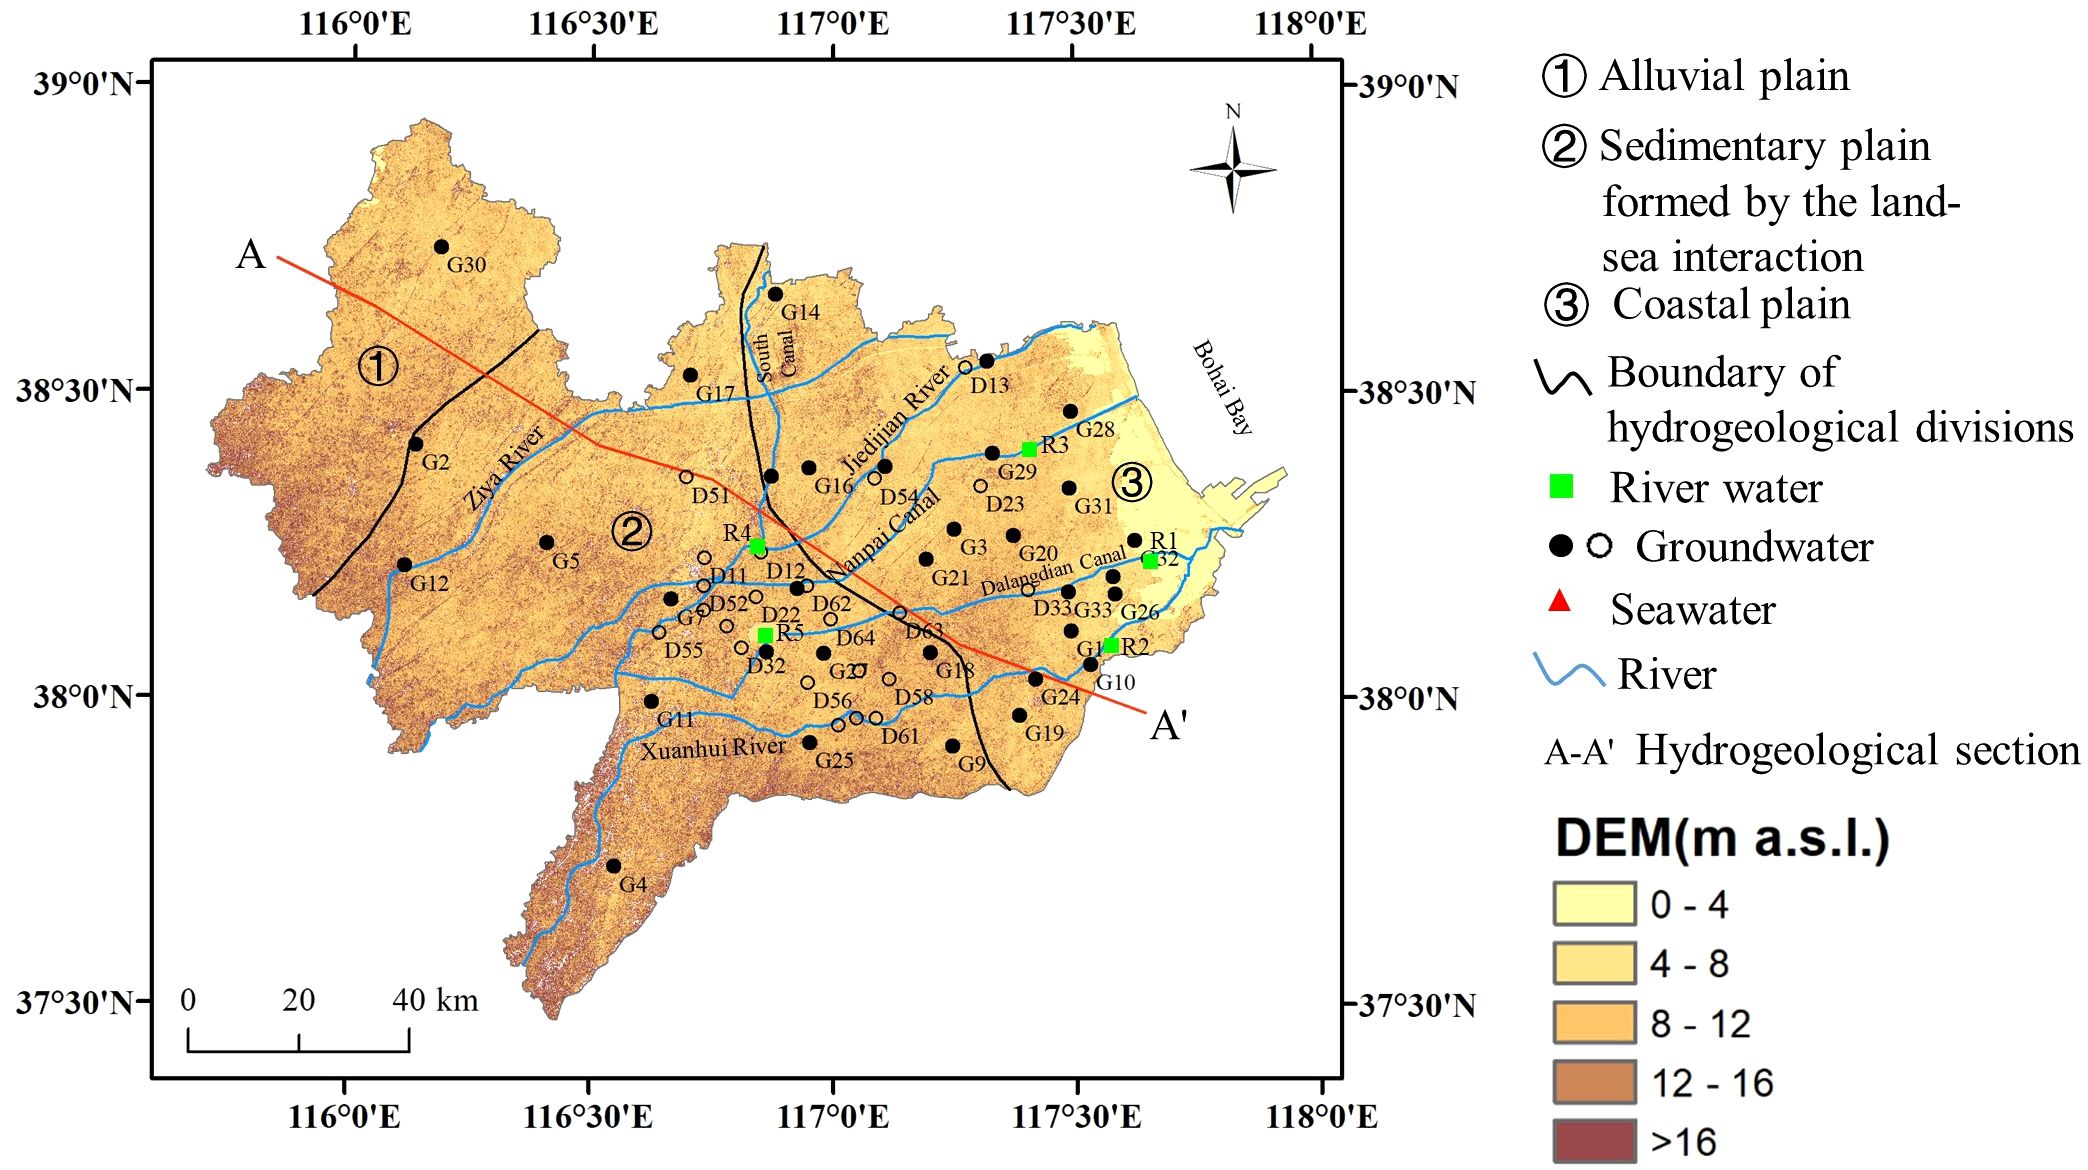
Figure 1 Map of research location with sampling points in Cangzhou, China. Solid black circles denote groundwater samples collected in summer and hollow circles denote groundwater samples collected in winter.
The hydrogeological unit of shallow aquifer in this region is classified into three types (Figure 1, Xu, 2009) the alluvial plain (①), the sedimentary plain formed by the land-sea interaction (②) and the coastal plain (③). From inland to sea, the sediments of aquifers change from fine sand to silt. From top to bottom, the quaternary aquifers in Cangzhou area is categorized into 4 groups (Figure 2). In this study, we focus on the aquifer I, which consists of Holocene loose sediments with a bottom depth of 20~30 m (Chen et al., 2015).
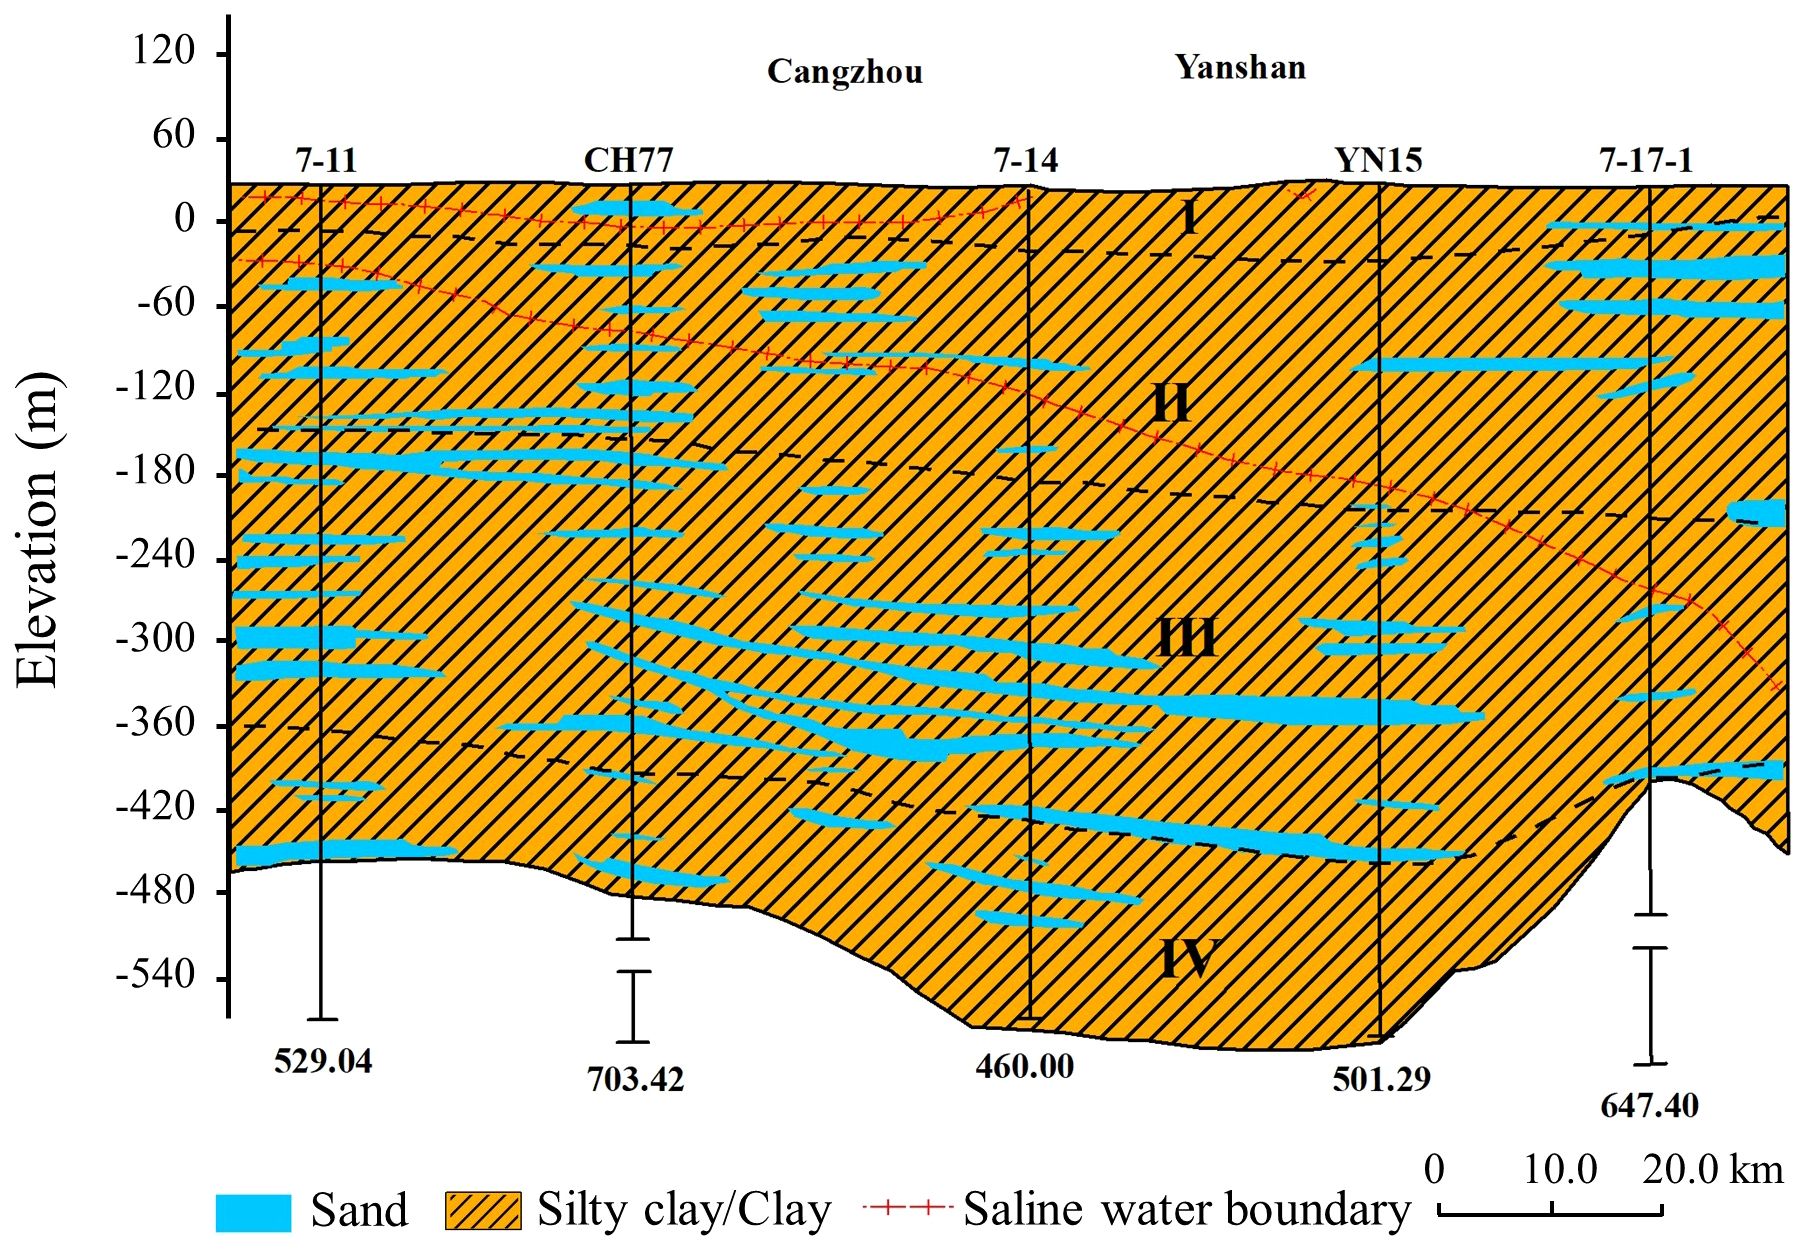
Figure 2 Hydrogeological profile of A-A’, Cangzhou area, Hebei Province, China.
The aquifer receives recharge mainly from atmospheric precipitation. Groundwater is discharged mainly through evaporation and extraction. Under the natural state, the groundwater flow direction is in accordance with the terrain slope, that is, from southwest to northeast. The flat terrain with the small hydraulic gradient result in a slow movement of groundwater. Compared with the western regions, groundwater in the coastal areas is almost stagnant. It is reported that from 1990 to 2015, the average groundwater depth in this region first increased, then decreased, from the initial 3.26 to 4.06 m (Yan et al., 2021).
Brackish water is widely distributed within this area. The thickness of the brackish water shrinks gradually from coast toward inland (Figure 2), forming a wedge between the shallow freshwater and the deep freshwater. The formation of the brackish water in Cangzhou result from combined effects of various factors such as paleoclimate conditions, paleogeographic and geological environment and transgressions in the Quaternary period. For example, the dry climate in the late Pleistocene serve as the decisive factor for the formation of brackish water in aquifer group II. In addition, it is reported that Cangzhou has experienced seven transgressions in the quaternary period (Xu et al., 2009). Due to the influence of transgressions and tides, a large amount of salt brought by seawater stayed in the loose sedimentary layer. On the other hand, the residual seawater is preserved in the aquifer during the regression, resulting in an increase in the total dissolved solids (TDS), which directly affected the chemical composition of local groundwater.
Two sampling campaigns were conducted. In summer (May~June 2022, wet season), we collected 33 groundwater samples, 3 seawater samples and 5 river water samples. In winter (December~January, dry season), 22 groundwater samples were collected (Figure 1). Locations and ground elevations of the sampling sites were recorded using the RTK (South Yinhe1) device. All groundwater samples were taken from the loose Quaternary porous aquifer I. The depth of wells changes from 4 m to 30 m, and the sampling depths range from one to ten meters. Before sampling, wells were pumped for 5-10 min to avoid stagnant water in the pipeline. Surface water were collected 0.2 m below the water surface. All samples were filtered through a 0.45 μm membrane, and stored in a polyethylene plastic bottle (500 mL). The sampling bottles were sealed, refrigerated at 4 °C and transported to the Groundwater Mineral Water and Environmental Monitoring Center, Ministry of Land and Resources for water quality analysis. Values of pH were determined by the glass electrode method. Major cations of K+, Ca2+, Na+, Mg2+ were examined by ICP-AES (iCAP 6300). Major anions of HCO3− and CO32− were examined by titration, and SO42− and NO3− were determined by the ion chromatographic method. The Cl− was examined by the silver nitrate volumetric method. All indexes were measured strictly according to the standard for groundwater quality of the People’s Republic of China (GB/T 14848-2017). The data reliability was checked by the charge balance error, with all errors within ±7% (Supplementary Table S1).
The index of GQISWI (Equations 1–5) proposed by Tomaszkiewicz et al. (2014) was used for seawater intrusion.
The hydrochemical facies evolution diagram (HFE-D) acts as a useful tool to identify whether the aquifer is in the stage of sea water intrusion or freshening (Giménez-Forcada, 2010). It highlights 4 typical facies (Na-HCO3, Na-Cl, Ca-HCO3 and Ca-Cl) from 16 facies. During the intrusion process, the increasing groundwater salinity (Equation 6) induces inverse exchange reactions, forming the characteristic Ca-Cl facies. Further, the groundwater evolves into seawater (Na-Cl). In the freshening stage, freshwater recharge causes direct exchange reactions, forming the Na-HCO3 facies. Then the water composition gradually gets similar to that of recharge water and helps the recovery of aquifers.
The steps of establishing the ARMEW (Cheng, 1997; Zhang et al., 2010; Li et al., 2012) are as follows:
(1) Construction of the initial sample space matrix and grade standard matrix.
The initial sample space matrix X contains m rows and n columns (Equation 7), where m are the number of groundwater samples, n means the number of evaluation indices, and xij represents the measurement value of the jth index for the ith water sample.
Assume F is an attribute space on X, and (C1, C2, C3⋯, CK) is an ordered partitioned set of F with the condition C1>C2>C3>⋯>CK. Once the grading criteria of evaluation indices are determined, the grading standard matrix can be expressed as Equation 8:
where ajk (j=1, 2,⋯, n; k=1, 2,⋯, K) is the kth partition value of jth index in F, and aj1<aj2,⋯,<ajK, or aj1>aj2,⋯,>ajK. Five evaluation indices including Cl-, TDS, Revelle Index (RI), SO42- and Sodium Adsorption ratio (SAR) were selected in this study.
With reference to the Chinese Technical Specification for Seawater Monitoring and Evaluation (HY/T 0314-2021), the Standard for Groundwater Quality (GB/T 14848-2017) and related literature (Zhang et al., 2022), the range and representative value of each evaluation index for different grades were determined and given in Table 1. Based on these evaluation indices and their representative values, the grading standard matrix can be written as Equation 9:
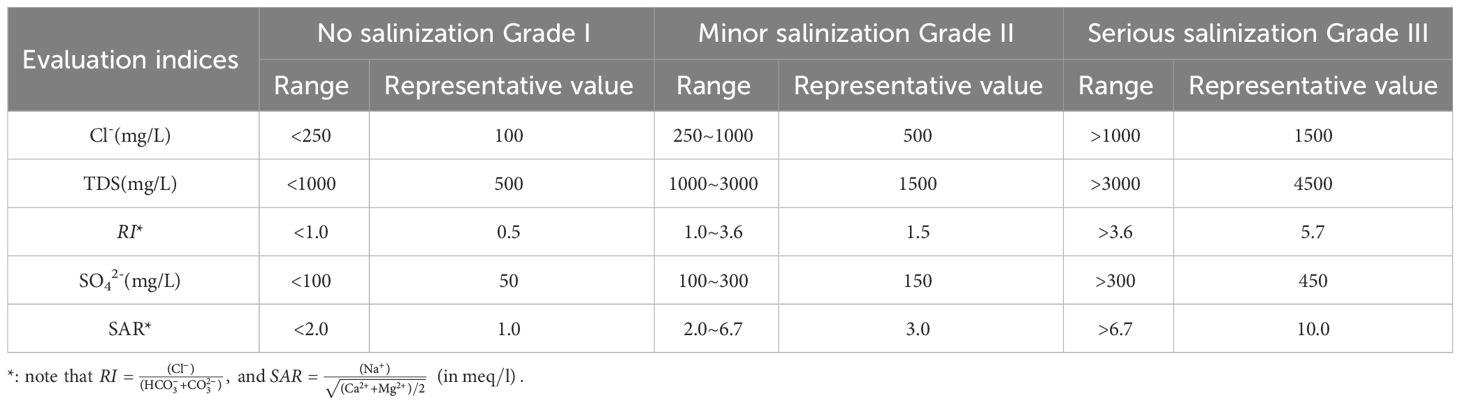
Table 1 Grading criteria and representative values for evaluation indices of groundwater salinization.
(2) Determination of weight based on Shannon entropy theory.
The initial matrix is normalized to eliminate the incomparability of each index due to different dimensions. The normalization method is as follows:
where (xij)max and (xij)min are the maximum value and the minimum value of jth evaluation indicator in the initial matrix, respectively.
The entropy value of the jth evaluation indicator is:
The weight of index j is calculated as:
(3) Calculation of attribute measure and attribute recognition.
Suppose aj1<aj2,⋯,<ajK, the attribute measure of xij with the attribute Ck is defined as μijk=μ(xij∈Ck), and it satisfies Equation 14:
Then the attribute measure of ith water sample μik=μ(xi∈Ck) considering the weight index is calculated as:
According to the confidence criterion, the groundwater salinization grade ki can be determined by:
Generally, the value of λ ranges from 0.6 to 0.75 and it equals 0.65 in this study.
Based on the scoring criteria of attribute recognition, the eigenvalue of groundwater salinization grade () is calculated. The larger the eigenvalue, the lower the groundwater salinization grade.
where nl=K+1−l. Finally, xi can be sorted by the .
The hydrochemical facies and water types for water samples have been assessed using Piper diagram as shown in Figure 3. For river water samples, the water type of R5, collected in the upper reaches of the Dalangdian Canal, is HCO3-Ca. The river water sample R4 is of Cl-Ca·Mg type. The other three river samples collected in the lower reaches are characterized by the Cl-Na type, indicating that they have been affected by seawater.
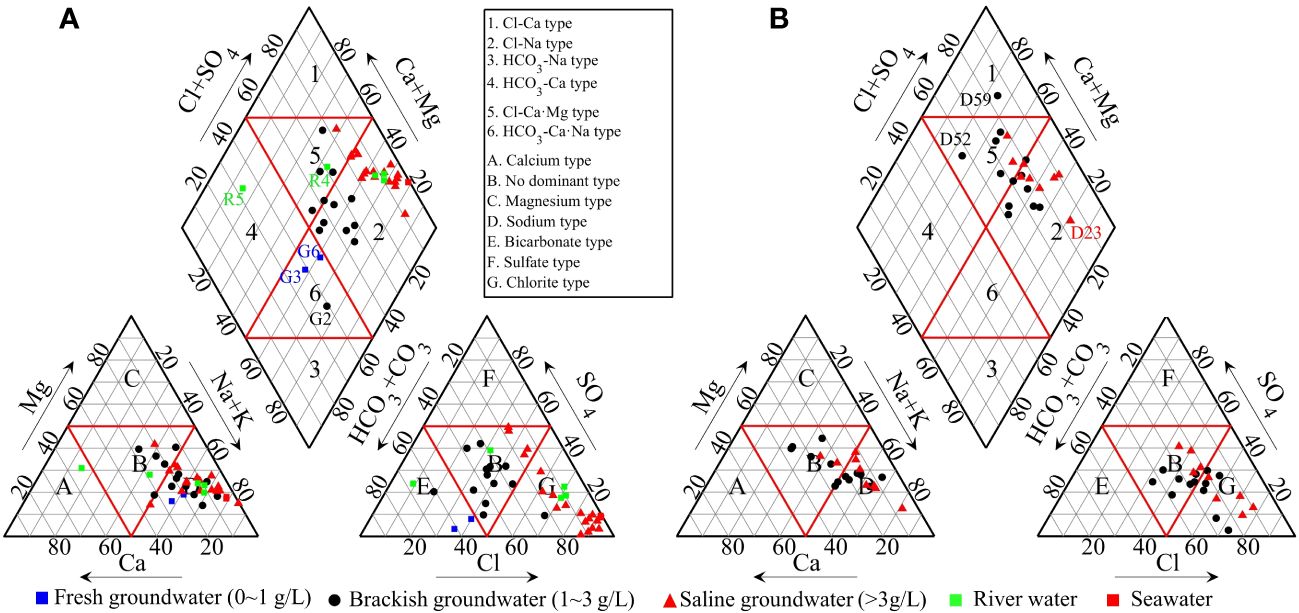
Figure 3 Piper diagrams of the collected water samples in summer (A) and winter (B) in Cangzhou, China.
For groundwater samples, in summer, three groundwater samples (G2, G3, G6) fall in zone 6, i.e., the HCO3-Ca·Na type. The other groundwater samples fall in zones 2 and 5, and the proportions are 72.7% and 18.2%, respectively. In winter, the sample of D59 fall in zone 1, i.e., the Cl-Ca type. The other groundwater samples also fall in zones 2 and 5, and the proportions are 68.2% and 27.3%, respectively. These indicate that the groundwater in this area is mainly of Cl-Na type followed by Cl-Ca·Mg type.
The geostatistical analysis was performed to determine spatial distribution of the GQISWI in the study area using the ArcGIS Geostatistical Analyst (Nas and Berktay, 2010). The ordinary kriging method was used in this study. The normal distribution pattern has been checked by a histogram tool and normal QQPlots and it was determined that it approximates normal distributions. An analysis trend was made, and it was determined that there is a linear trend along the East-West direction. This trend was removed before kriging interpolations. The 11 different semivariogram models were tested (Supplementary Table S2). From the cross-validation statistics, the Gaussian model is chosen as the final model for summer and the J-Bessel model is chosen for winter.
As indicated by Tomaszkiewicz et al. (2014), the GQISWI can range between 0 and 100, where 0 is indicative of seawater and 100 represents freshwater. In general, index values are above 75 for freshwater and below 50 for saline groundwater and seawater. Mixed groundwater has a GQISWI between 50 and 75.
In summer, values of GQISWI range from 20.47 to 75.38 with an average of 59.31. Figure 4 shows that values of GQISWI in the central and western regions are generally above 50, and values of GQISWI in the eastern coastal area are mostly below 50. Equations 1–5 indicate that the higher the GQISWI index, the lighter the groundwater salinization degree. In this area, the GQISWI gradually increases from east to west, indicating that the degree of groundwater salinization is gradually alleviated from coast to inland. The GQISWI index of the G32 sample, southeast of the study area, achieves the lowest value, highlighting a serious groundwater salinization status there. In winter, values of GQISWI range from 54.47 to 79.09 with an average of 66.00, slightly higher than that in summer.
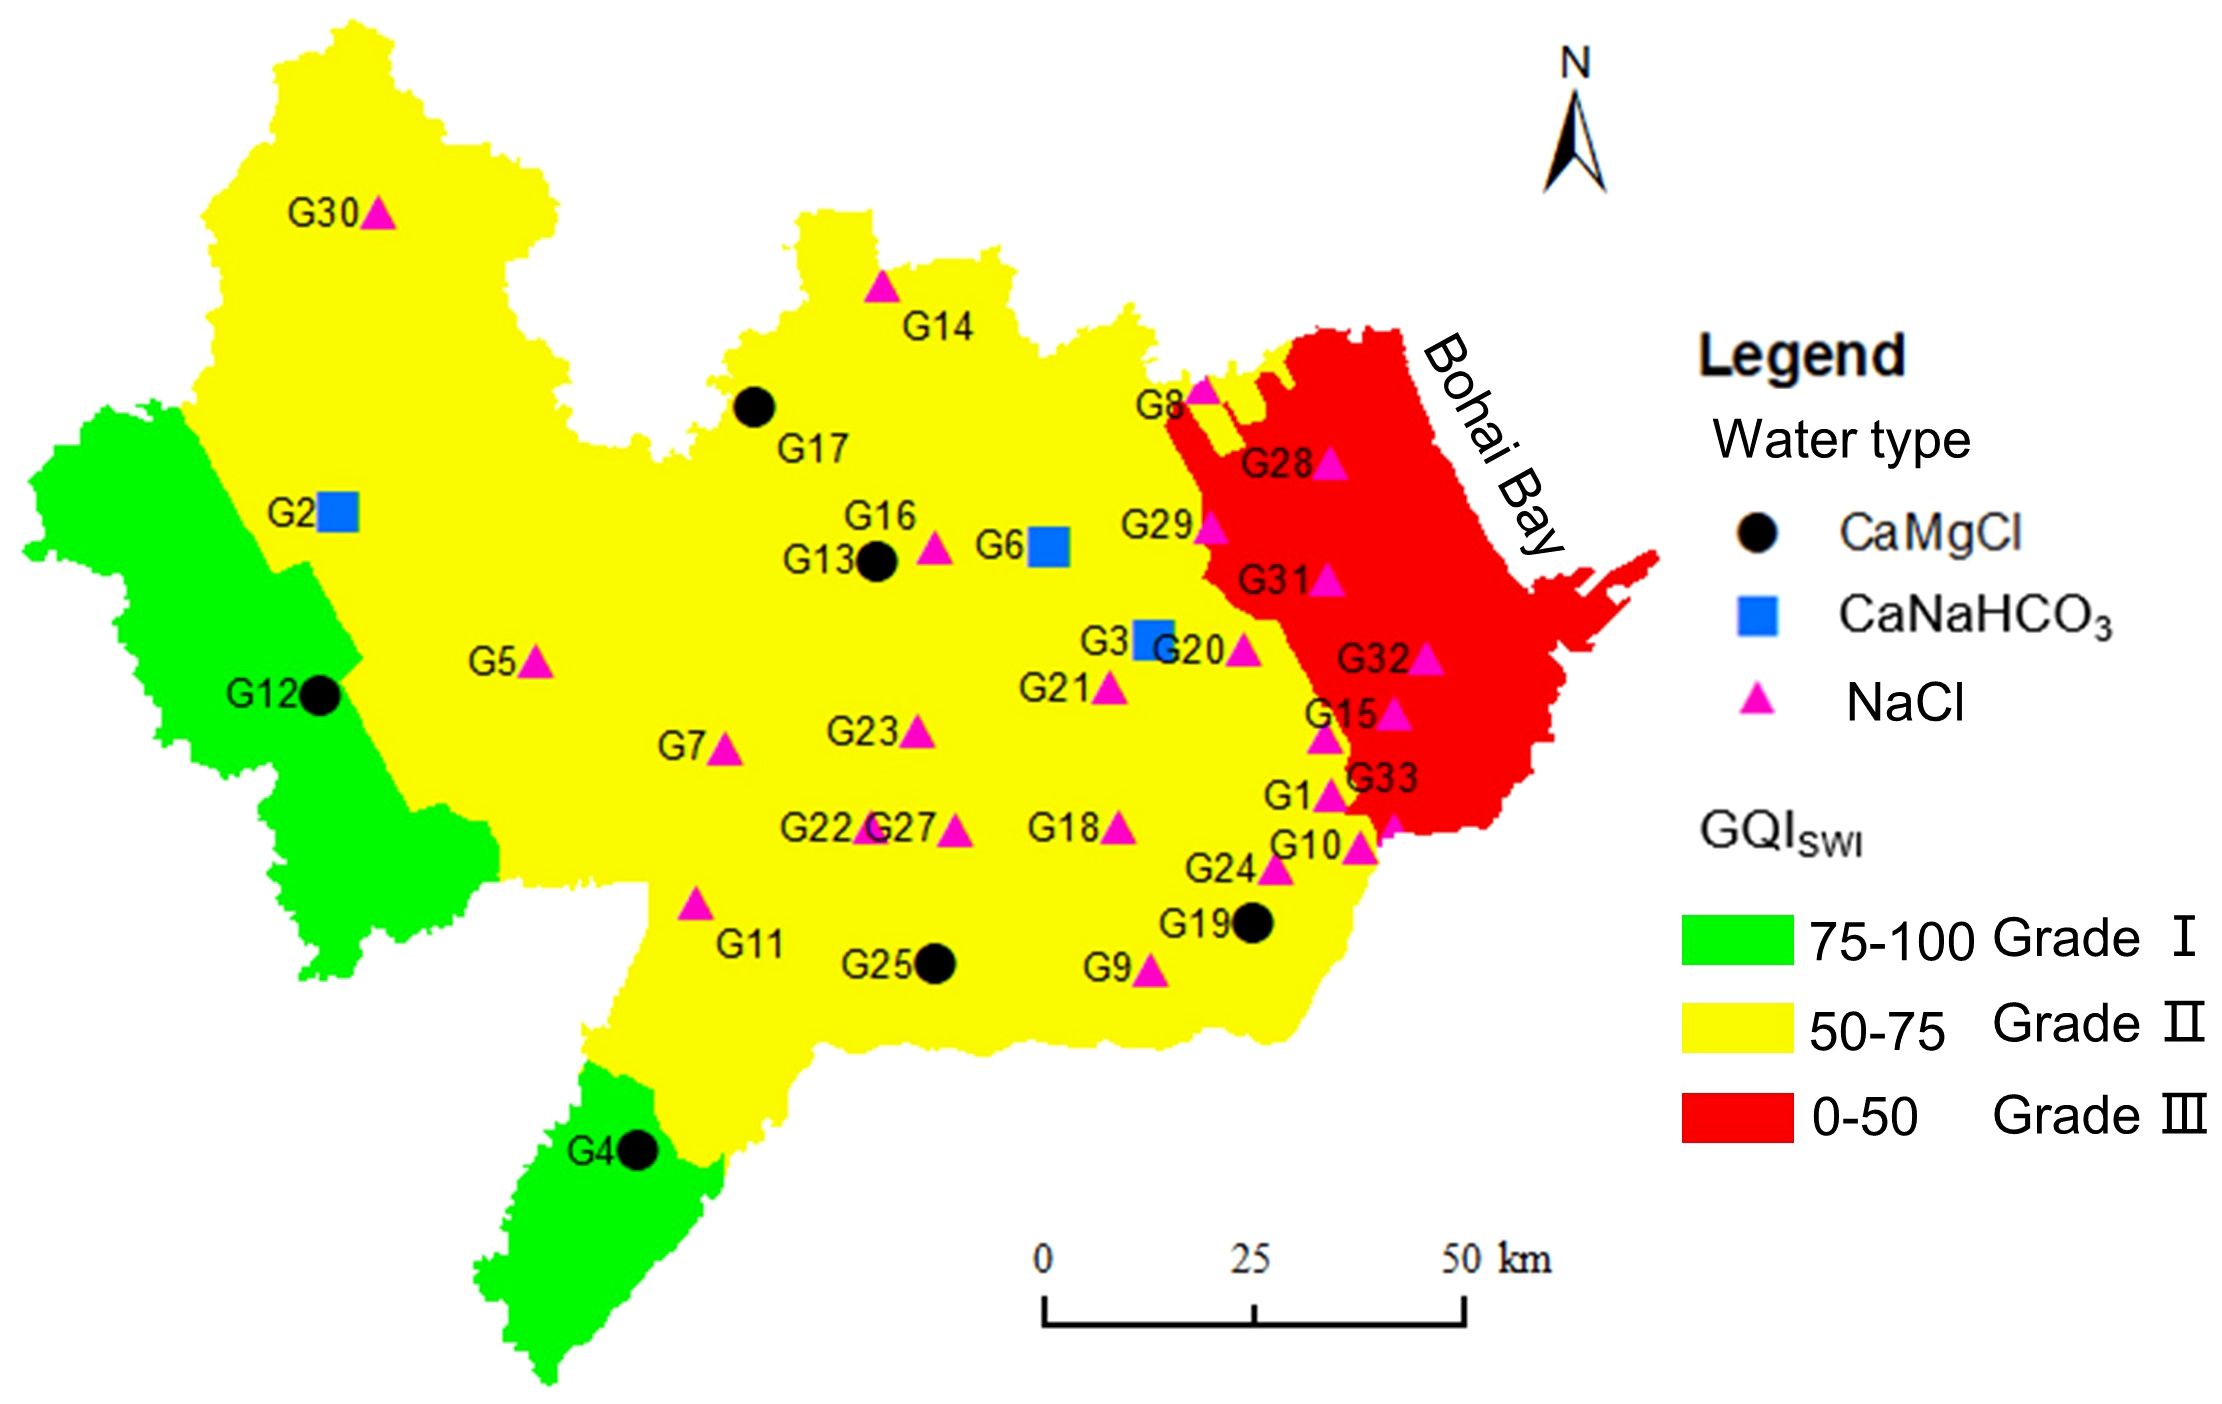
Figure 4 Distribution of GQISWI in summer of Cangzhou, China.
Table 2 gives the calculated weight of evaluation indices according to the measured data and Equations 10–13. Put these weights into Equation 15, the attribute measure of each water sample can be derived (Table 3). The salinization grade is determined by Equation 16, and the corresponding eigenvalue is calculated by Equation 17. Note that the larger the , the lower the groundwater salinization grade. The results indicate that the proportion of no salinization (Grade I), minor salinization (Grade II) and serious salinization (Grade III) identified by ARMEW in groundwater samples in summer in Cangzhou is 3.0%, 21.2% and 75.8%, respectively. In winter, the proportion is 9.1% for Grade II and 90.9% for Grade III.
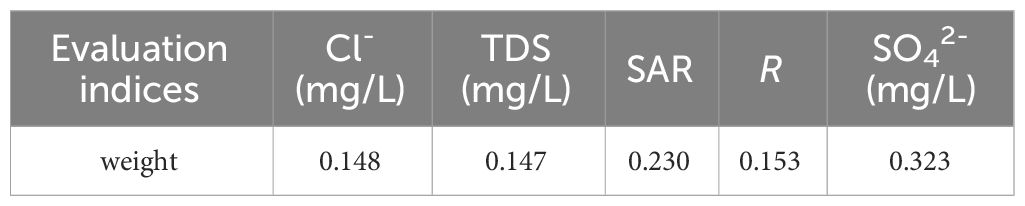
Table 2 Weights of evaluation indices.
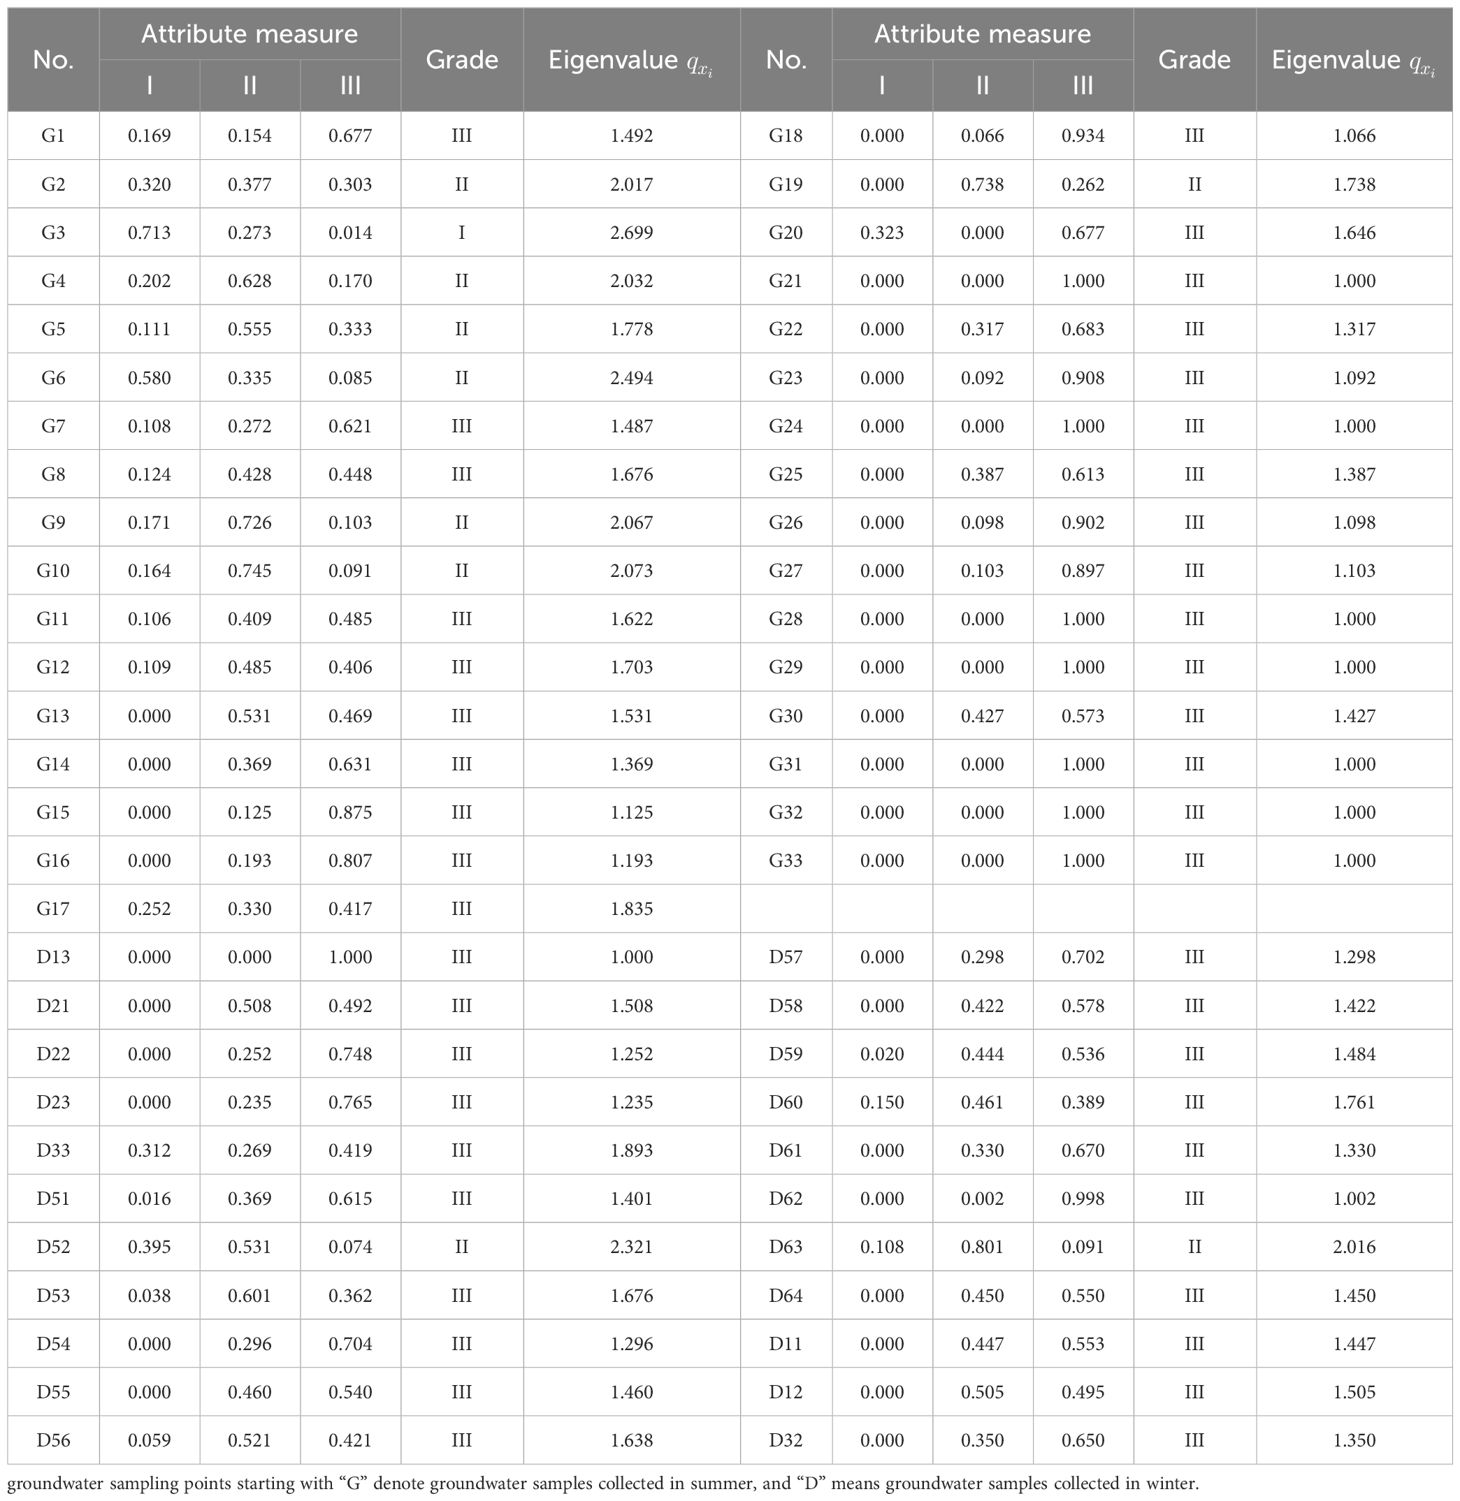
Table 3 Attribute measure and seawater intrusion grades.
There are three main mechanisms controlling the groundwater composition, including atmospheric precipitation, rock dominance, and evaporation-crystallization process (Gibbs, 1970). As shown in Figure 5, all saline groundwater and seawater fall into the zone of evaporation dominance, suggesting the evaporation-crystallization process is of vital importance during saline groundwater evolution. Brackish groundwater are located at the intersection of the evaporation dominance zone and the rock dominance zone, indicating these groundwater samples have been influenced by both effects. The hydrochemistry of the freshwater samples (G3, G6, R4, R5) is dominated by the water-rock interaction. Figure 5A shows that the Na+/(Na+ +Ca2+) values of groundwater change from 0.406 to 0.997 with an average of 0.759, implying strong cation exchange and high background concentration of Na+. Figure 5B shows that the Cl-/(Cl-+HCO3-) values of groundwater range from 0.238 to 0.967 with an average of 0.681. The sample of G2 has the minimum value of Cl-/(Cl-+HCO3-) and the sample of G32 has the largest value. The evolution from G2 to G32 corresponds to the evolutionary path from the HCO3 end-member to the Cl end-member, which is in line with the results from Figures 3 and 4.
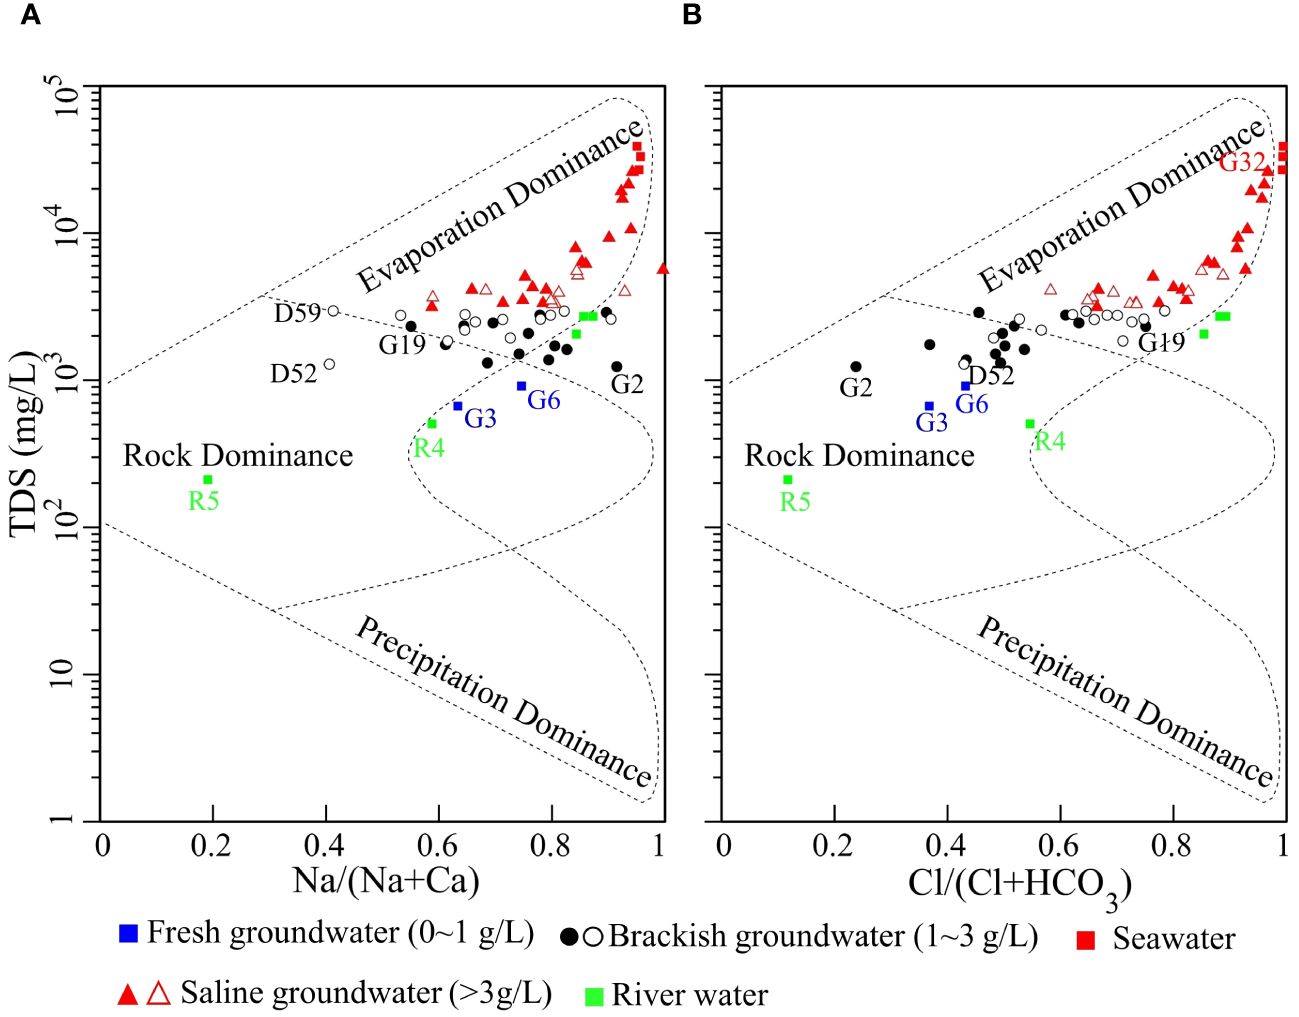
Figure 5 Variation of Na+/(Na++Ca2+) (A) and Cl-/(Cl-+HCO3-) (B) as a function of TDS. Solid symbols denote water samples collected in summer and hollow symbols denote groundwater samples collected in winter.
Figures 6A and C show that Na++K+ and Mg2+ are mostly distributed along the local seawater dilution line (LSDL), which reflects the mixing between seawater and continental water contributions. The concurrence of the sodium and chloride values with the mixing line is due to the high solubility product of halite, which is considered as the main source of both elements. Figures 6B and D show that most groundwater samples exhibit larger calcium and sulfate content than the expected from the LSDL, and 89% of the samples present a higher Ca2+/SO42- ratio than that of local seawater (0.43, meq/L ratio). Such a high Ca2+/SO42- ratio suggests underground gypsum dissolution. Figure 6E shows that the HCO3- of all groundwater samples are distributed above the LSDL. When the atmospheric precipitation infiltration through the soil zone, the mineral dissolution reactions occur (Appelo and Postma, 2006). Through these reactions, the cations dissolve from rocks into groundwater, increasing the content of cations, while simultaneously increases HCO3–.
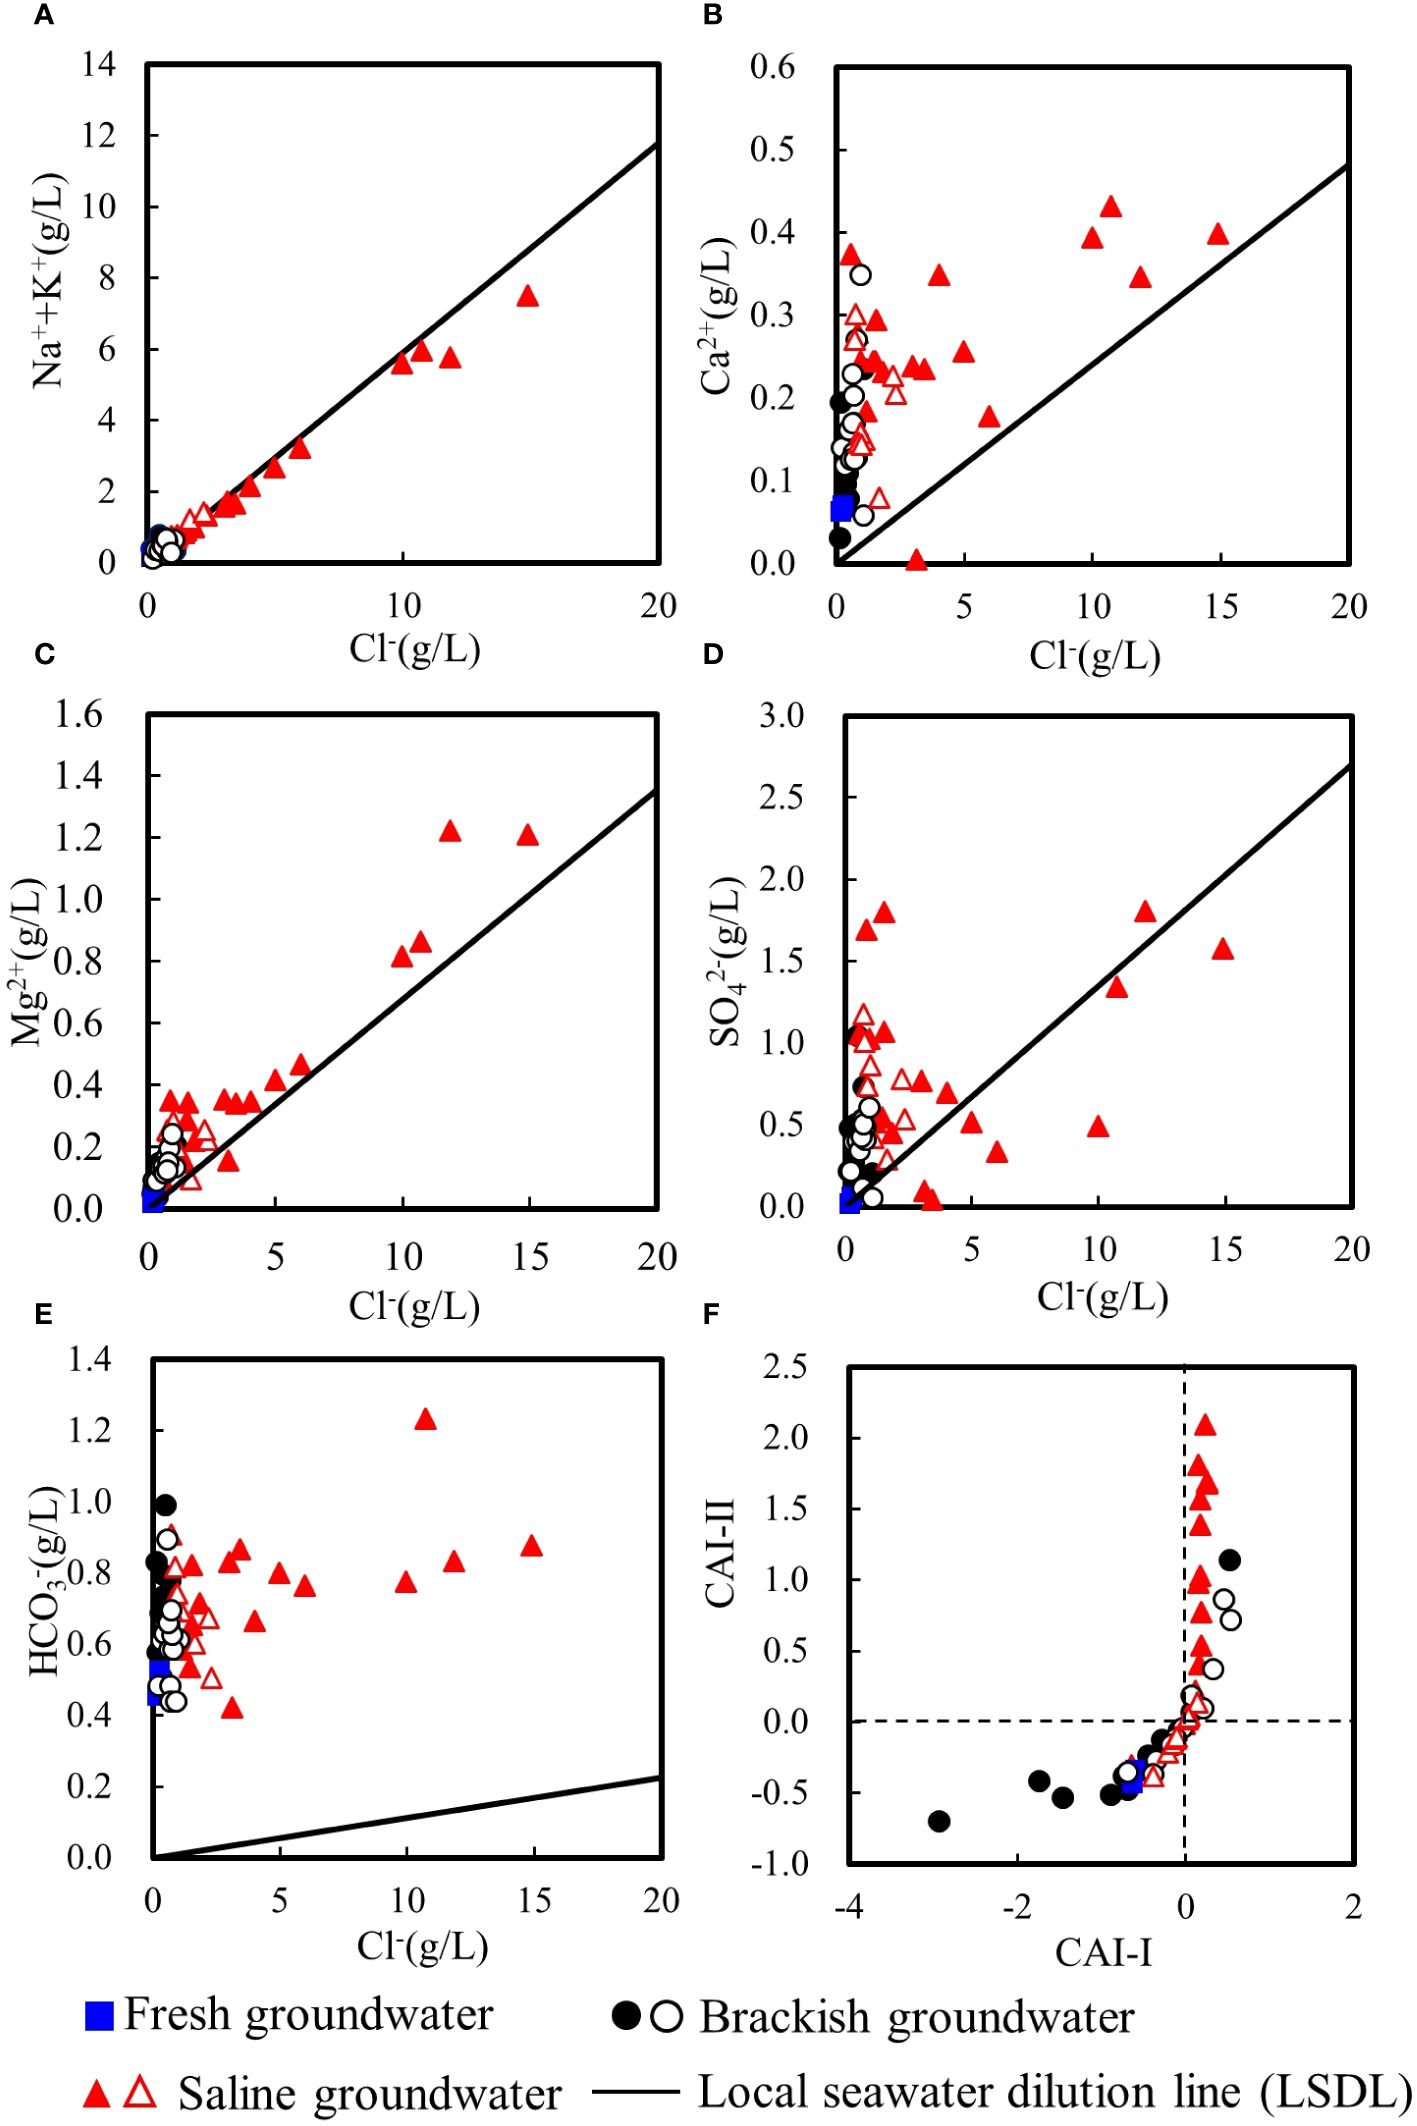
Figure 6 Plots of major ions vs. Cl− (A–E), and (F) CAI-II vs. CAI-I. Solid symbols denote groundwater samples collected in summer and hollow symbols denote groundwater samples collected in winter.
The chlor-alkaline indices (CAI-I and CAI-II; Equation 18, 19) were used to further study the cation exchange process of groundwater (Schoeller, 1984):
Figure 6F shows that in summer and in winter, 84.6% and 61.5% of brackish groundwater present negative chlor-alkaline indices. This indicates that Ca2+ and Mg2+ in these brackish groundwater are being replaced by Na+ and K+ in aquifers, i.e., direct cation exchange. Positive chlor-alkaline indices account for 72.2% in summer and 44.4% in winter of saline groundwater, indicating the reverse cation exchange occurs during seawater intrusion for these saline samples (Appelo and Postma, 2006; Giménez-Forcada, 2010). For the whole year, negative chlor-alkaline indices have a slight advantage than the positive ones, as the percentage of negative ones accounts for 56.4% of the total groundwater samples.
The HFE-D was plotted to further investigate the cation-exchange process during seawater intrusion and freshening (Figure 7). Here, freshwater belong to Ca-HCO3 facies (13), and seawater correspond to Na-Cl facies (4). In summer (Figure 7A), about 41.5% of total water samples follow the mixing line, suggesting an ideal mixing between freshwater and seawater without ionic exchange for these samples. Most saline groundwater samples, represented by G20, G29, and G31, exhibit compositions following Trend 1. Particularly, the proportion of Na++K+ and Ca2+ of the groundwater sample G19 is 33.4% and 27.2%, respectively. It is very close to the Ca-Cl facies, implying the advance of the saline front, the same as that shown in Figure 4. Besides, about 42.4% of the total groundwater samples exhibit compositions following Trend 2, i.e., the freshening process. The Na-HCO3 facies is observed at G2, G3 and G6, indicative of the evident direct cation exchange reactions during the freshening phase. This further proves the result from Figure 6F. In winter (Figure 7B), about 18.2% of groundwater samples follow the mixing line. Three water samples D21, D59, and D63, exhibit significant intrusion trend. Particularly, the proportion of Ca2+ and Cl- of D59 is 34.8% and 56.9%, respectively. Therefore, it obviously belongs to the Ca-Cl facies, the same as the result from Piper diagram. Besides, about 54.5% of the groundwater samples follow the freshening trend, but without obvious Na-HCO3 facies compared to the summer campaign.
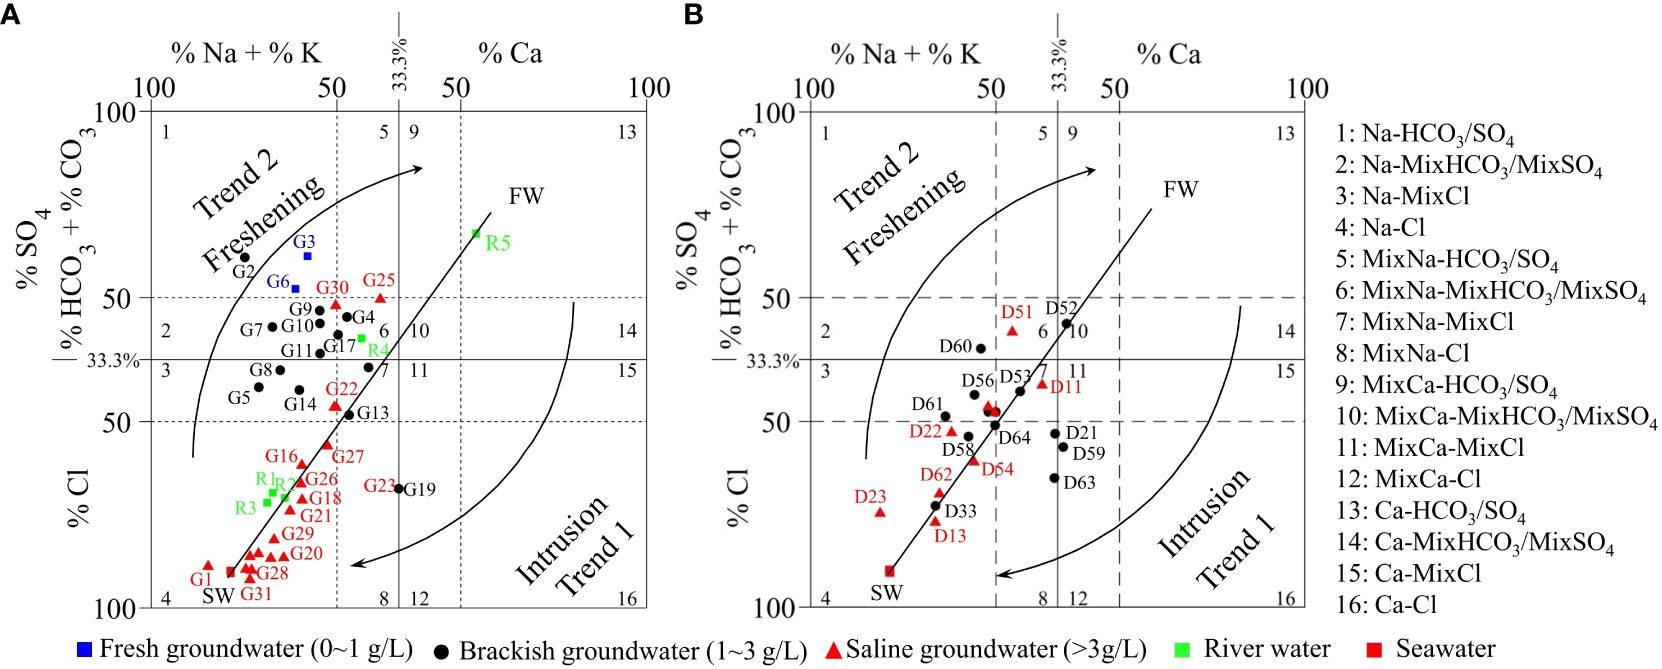
Figure 7 The HFE-D of shallow groundwater in summer (A) and winter (B) of Cangzhou.
The occurrence of groundwater freshening is based on the existing saline groundwater and soil. As indicated by Figure 2, the density difference between upper saline water and deep fresh water drive the saline water moving downward. This process has become more active under the influence of extracting deep groundwater. As a result, the upper shallow groundwater is becoming fresher (Guo et al., 1995). Also, due to the influence of historical transgressions, there are remains of transgressions preserving in this area, including marine evaporate sources or marine strata. This provided Na-rich soil such as sodium-montmorillonite. It has been reported that the main cation of the saline soil in the coastal plain of Cangzhou is Na+ (He et al., 2021). In recent years, the government has implemented the South-to-North water diversion project and restricted groundwater extractions. Thus, local people generally use delivered surface water for irrigation nowadays. The Ca-HCO3 river water continuously recharges Ca2+ to groundwater. The excess Ca2+ and the widespread Na-rich soil together trigger the direct cation exchange.
The mineral saturation index (SI) is calculated through PHREEQC to determine the dissolution or precipitation of minerals. It is usually supposed that values in the ±0.5 range approximate equilibrium status. Figures 8A and B shows that the maximum value for the calculated SI of halite and gypsum is -2.75 and -1.17, respectively, indicating a subsaturation state for the two minerals. This means that groundwater is available to continue dissolving these two minerals from the matrix, and they do not precipitate out of the solution even under the strong effects of evaporation. Figures 8C and D show that the minimum SI value of dolomite and calcite is 1.03 and 0.21, respectively, indicating that they are in an oversaturated state and have a tendency to precipitate, which further aggravates soil hardening. These results agree with the research by Xu et al. (2009).
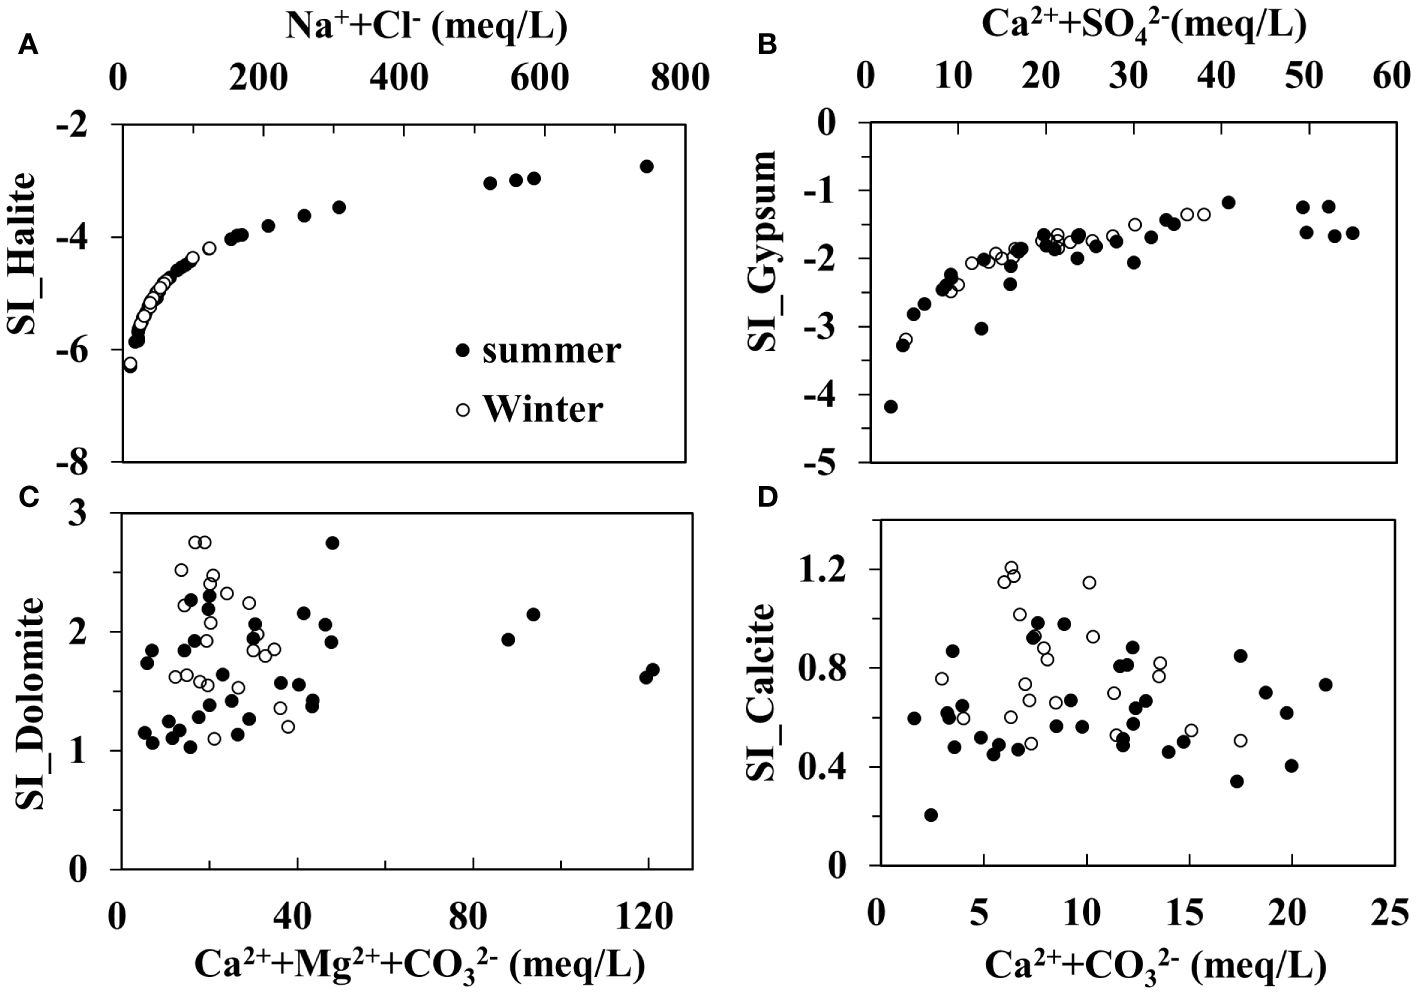
Figure 8 Plots of SI for halite (A), gypsum (B), dolomite (C) and calcite (D) vs. ion concentrations of groundwater. Solid symbols denote groundwater samples collected in summer and hollow symbols denote groundwater samples collected in winter.
Figure 9 shows the percentage of groundwater salinization degree identified by different methods. In summer (Figure 9A), the consistency between the ARMEW and the evaluation method based on single index of Cl- is 60.6%, and that between the ARMEW and the GQISWI index method is 45.5%. The latter two methods gave the same evaluation result for Grade I, and their percentages are less than that estimated by the Cl- index. The percentage of Grade II determined by the ARMEW is smaller than those determined by the other two methods. The percentage of Grade III determined by the ARMEW is the largest among the three methods. In winter (Figure 9B), for Cl- and GQISWI index, the percentage of Grade II has increased by 33.3 and 19.7%, respectively, compared to that in summer. The decrease in the percentage of Grade III identified by these two methods is due to the lack of corresponding sampling points in the eastern part of the study area in the winter campaign. For the result of ARMEW, the percentage of Grade III has increased by 15.1% compared to that in summer. Again, the groundwater salinization degree evaluated by the ARMEW is the highest among the three methods.
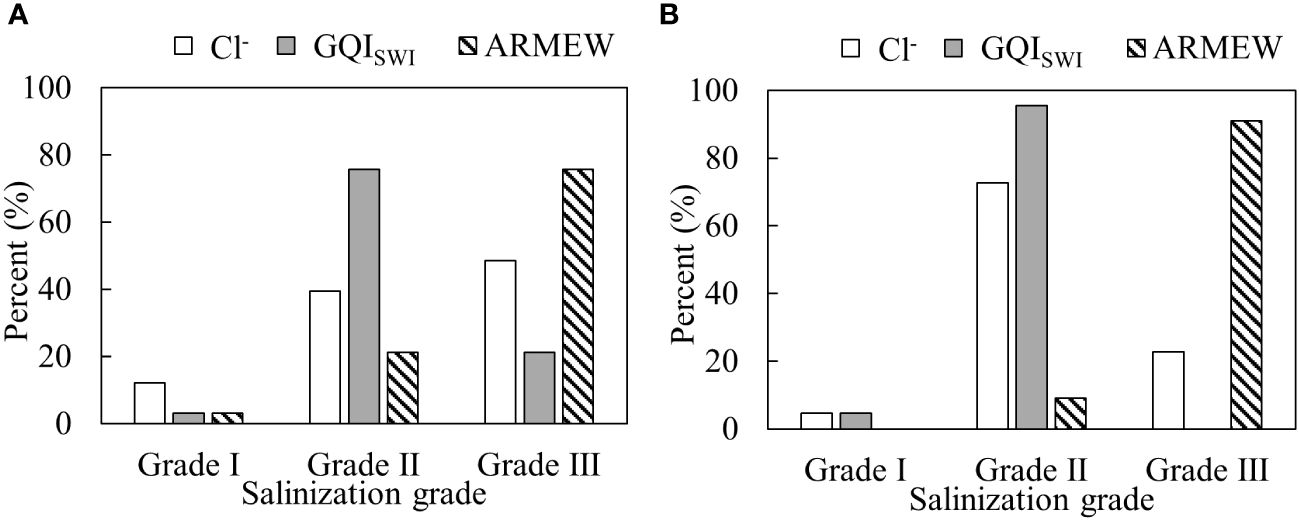
Figure 9 Percent of groundwater salinization grades by different methods in summer (A) and in winter (B). For the index of GQISWI, grades are determined as indicated by Tomaszkiewicz et al. (2014). That is, Grade I: 75~100; Grade II: 50~75; Grade III: 0~50.
Figure 10 shows the spatial distributions of groundwater salinization in Cangzhou based on Cl- and the ARMEW in summer. It can be seen that the salinization grade generally increases from inland to coast. Combined with Figure 4, the evaluation method based on Cl- gives the largest area of Grade I. The GQISWI index shows the largest area of Grade II, and ARMEW presents the largest area of Grade III. In the west of the study area, although Cl- content is small, TDS or SO42 value has reached the level of minor salinization (TDS>1 g/L or SO42 >100 mg/L, Table 1), and thus it belongs to Grade II in Figure 10B. In the middle of this area, although Cl- content is smaller than 1 g/L, most samples including G7, G11, G16, G22, G23, and G27 have a SAR value higher than 6.7, which reaches the level of serious salinization. All the three methods demonstrate a serious salinization in the east of this area, at least including G15, G28, G29, G31~33.
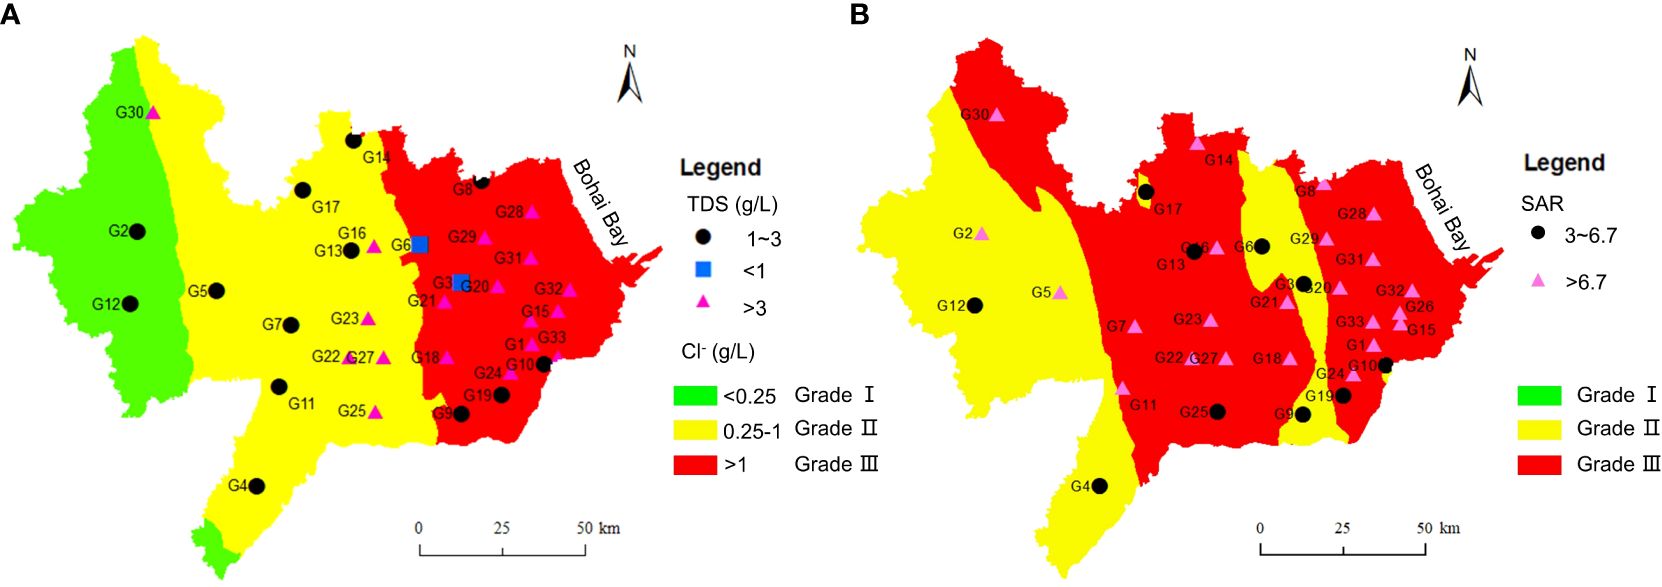
Figure 10 Spatial distributions of groundwater salinization degree in Cangzhou based on Cl- (A) and ARMEW (B) in summer.
The spatial distributions of groundwater salinization identified by different methods in winter are given in Supplementary Figure S1. Similar to the result of Figure 10, the GQISWI index shows the largest area of Grade II, and ARMEW presents the largest area of Grade III. In winter, instead of higher SAR values in summer, the higher grade identified by ARMEW is mainly due to large values of SO42- in 81.8% water samples, which exceeds the threshold of 300 mg/L.
This study investigated the hydrogeochemical characterization of shallow groundwater and evaluated the groundwater salinization status in both wet and dry seasons in Cangzhou, China. Through the Piper and Gibbs diagrams, the water type and evolution mechanisms of groundwater were analyzed. The groundwater salinization status was determined by both the GQISWI index and the ARMEW. The trend of de-salinization or salinization of groundwater in this region was determined through the HFE-D. The main conclusions include:
(1) The hydrochemical types in this area are characterized by Cl-Na and Cl-Ca·Mg. The Gibbs diagram illustrates that the evaporation-crystallization process has significant influence on the evolution of saline groundwater.
(2) Values of GQISWI range from 20.47 to 75.38 with an average of 59.31 in summer. The GQISWI gradually increases from east to west. That is, the degree of groundwater salinization is gradually alleviated from coast to inland. In winter (dry season), values of GQISWI range from 54.47 to 79.09 with an average of 66.00, slightly higher than that in summer.
(3) The proportion of no salinization (Grade I), minor salinization (Grade II) and serious salinization (Grade III) in groundwater samples in summer identified by the ARMEW is 3.0%, 21.2% and 75.8%, respectively. In winter, the proportion is 9.1% for Grade II and 90.9% for Grade III.
(4) For the whole year, negative chlor-alkaline indices have a slight advantage than the positive ones. The HFE-D diagram reveal that in summer most brackish groundwater exhibit compositions of the freshening stage with direct cation exchange, and most saline groundwater is mainly at the seawater intrusion stage with reverse cation exchange. In winter, compared to the wet summer season, more groundwater samples in the middle of study area exhibit intrusion trend, and without obvious Na-HCO3 facies.
(5) Comparison between different methods stresses that the GQISWI index shows the largest area of Grade II, and ARMEW presents the largest area of Grade III in both seasons. That is, compared with GQISWI index, ARMEW model gives more conservative evaluation results of groundwater salinization.
This study only analyze the recent status of groundwater salinity distribution. Driven by different factors, the groundwater salinization degree may fluctuate. Since the 1970s and 1980s, large quantities of deep fresh groundwater has been exploited in this area until more than a decade ago, when the government implemented the policies of limited groundwater mining and South-to-North water diversion project. How these human activities have affected the dynamics of groundwater salinity in recent decades remains to be further explored. In addition, this study only focuses on shallow groundwater, and future studies can evaluate deep groundwater salinization and its vertical connection with shallow groundwater. In spite of these shortcomings, the research results of this study are helpful for evaluating groundwater salinity degree, for understanding the characteristics and evolution mechanisms of brackish and saline groundwater in this area, and for the subsequent research on salinity dynamics.
The original contributions presented in the study are included in the article/Supplementary Material. Further inquiries can be directed to the corresponding author.
HL: Formal Analysis, Investigation, Writing – original draft. YL: Validation, Visualization, Writing – review & editing. CW: Formal analysis, Methodology, Writing – original draft, Writing – review & editing. KY: Conceptualization, Supervision, Writing – review & editing. YZ: Funding acquisition, Methodology, Writing – review & editing. XF: Conceptualization, Investigation, Writing – review & editing. XB: Investigation, Visualization, Writing – review & editing. XL: Resources, Visualization, Writing – review & editing.
The author(s) declare financial support was received for the research, authorship, and/or publication of this article. This work was funded by Science Research Project of Hebei Education Department (ZD2022119), the Natural Science Foundation of Hebei Province of China (D2022403016), the Open Project Program of Hebei Center for Ecological and Environmental Geology Research (No. JSYF-202104), the National Pre-research Funds of Hebei GEO University in 2023 (KY202314), the Central Leading Local Science and Technology Development Fund Project (236Z4204G), Funding for basic scientific research of universities in Hebei Province (QN202212), Science and technology innovation team project of Hebei GEO University (KJCXTD-2021-14).
The authors declare that the research was conducted in the absence of any commercial or financial relationships that could be construed as a potential conflict of interest.
All claims expressed in this article are solely those of the authors and do not necessarily represent those of their affiliated organizations, or those of the publisher, the editors and the reviewers. Any product that may be evaluated in this article, or claim that may be made by its manufacturer, is not guaranteed or endorsed by the publisher.
The Supplementary Material for this article can be found online at: https://www.frontiersin.org/articles/10.3389/fmars.2024.1384289/full#supplementary-material
Appelo C. A. J., Postma D. (2006). Geochemistry, Groundwater and Pollution. 2nd ed (Rotterdam: AA Balkema).
Banks E. W., Post V. E. A., Meredith K., Ellis J., Cahill K., Noorduijn S., et al. (2021). Fresh groundwater lens dynamics of a small bedrock island in the tropics, Northern Australia. J. Hydrol. 595, 125942. doi: 10.1016/j.jhydrol.2020.125942
Benaafi M., Abba S. I., Aljundi I. H. (2023). State-of-the-art on the conceptual advancement of seawater intrusion: A comprehensive review, management, and possible future research direction. J. King Saud. Univ.-Sci. 35, 102749. doi: 10.1016/j.jksus.2023.102749
Benaafi M., Tawabini B., Abba S. I., Humphrey J. D., Al-Areeq A. M., Alhulaibi S. A., et al. (2022). Integrated hydrogeological, hydrochemical, and isotopic assessment of seawater intrusion into coastal aquifers in Al-Qatif Area, Eastern Saudi Arabia. Molecules 27, 6841. doi: 10.3390/molecules27206841
Bless A. E., Colin F., Crabit A., Devaux N., Philippon O., Follain S. (2018). Landscape evolution and agricultural land salinization in coastal area: A conceptual model. Sci. Total Environ. 625, 647–656. doi: 10.1016/j.scitotenv.2017.12.083
Boyacioglu H. (2007). Development of a water quality index based on a European classification sheme. Afr. J. Online (AJOL) 33, 101–106. doi: 10.4314/wsa.v33i1.47882
Cao T., Han D., Song X. (2021). Past, present, and future of global seawater intrusion research: A bibliometric analysis. J. Hydrol. 603, (PA). doi: 10.1016/j.jhydrol.2021.126844
ChaChadi A. G., Lobo-Ferreira J. P. (2001). “Sea water intrusion vulnerability mapping of aquifers using GALDIT method,” in Proc. workshop on modelling in hydrogeology (Anna University, Chennai), 143–156.
Chen J., Yan Y., Wang M., Wang H., Li W. (2015). Temporal-spatial patterns and evolution mechanism of groundwater salinity in groundwater of Cangzhou Area, Hebei Province, China. Earth Environ. 43, 522–528. doi: 10.14050/j.cnki.1672-9250.2015.05.006
Cheng Q. (1997). Attribute recognition theoretical model with application. Acta Scientiarum Naturalium Universitatis Pekinensis 33, 12–20. doi: 10.13209/j.0479-8023.1997.002
Dhakate R., Ratnalu G. V., Sankaran S. (2020). Hydrogeochemical and isotopic study for evaluation of seawater intrusion into shallow coastal aquifers of Udupi District, Karnataka, India. Geochem. 80, 125647. doi: 10.1016/j.chemer.2020.125647
Essink G. (2001). Improving fresh groundwater supply-problems and solutions. Ocean Coast. Manage. 44, 429–449. doi: 10.1016/S0964-5691(01)00057-6
Gang S., Jia T., Wang B., Cheng X., Deng Y., Han Y., et al. (2019). Assessment of seawater intrusion in Laoshan district of Qingdao city by using model of set pair analysis based on entropy weight method. Mar. Environ. Sci. 38, 939–944 + 976. doi: 10.13634/j.cnki.mes.2019.06.018
Ghiglieri G., Carletti A., Pittalis D. (2012). Analysis of salinization processes in the coastal carbonate aquifer of Porto Torres (NW Sardinia, Italy). J. Hydrol. 432-433, 43–51. doi: 10.1016/j.jhydrol.2012.02.016
Gibbs R. J. (1970). Mechanisms controlling world water chemistry. Science 170, 1088–1090. doi: 10.1126/science.170.3962.1088
Giménez-Forcada E. (2010). Dynamic of sea water interface using hydrochemical facies evolution diagram. Groundwater 48, 212–216. doi: 10.1111/j.1745-6584.2009.00649.x
Guo Y., Shen Z., Zhong Z. (1995). Brackish water migration and its relationship with shallow brackish water desalination in Hebei Plain. Hydrogeol. Eng. Geol. 22, 8–12. doi: 10.16030/j.cnki.issn.1000-3665.1995.02.003
Han D., Kohfahl C., Song X., Xiao G., Yang J. (2011). Geochemical and isotopic evidence for palaeo-seawater intrusion into the south coast aquifer of Laizhou Bay, China. Appl. Geochem. 26, 863–883. doi: 10.1016/j.apgeochem.2011.02.007
He J., Den Q., Ma X., Su X., Ma X. (2021). Soil salinization affected by hydrogeochemical processes of shallow groundwater in Cangzhou City, a coastal region in North China. Hydrol. Res. 52, 1116–1131. doi: 10.2166/nh.2021.183
Icaga Y. (2007). Fuzzy evaluation of water quality classification. Ecol. Indic. 7, 710–718. doi: 10.1016/j.ecolind.2006.08.002
Jasechko S., Perrone D., Seybold H., Fan Y., Kirchner J. W. (2020). Groundwater level observations in 250,000 coastal US wells reveal scope of potential seawater intrusion. Nat. Commun. 11, 3229. doi: 10.1038/s41467-020-17038-2
Kim I. H., Chung I. M., Chang S. W. (2021). Development of monthly seawater intrusion vulnerability assessment method using GALDIT. Water 13, 1820. doi: 10.3390/w13131820
Kumar M., Panday D. P., Bhagat C., Herbha N., Agarwal V. (2023). Demystifying the decadal shift in the extent of groundwater in the coastal aquifers of Gujarat, India: A case of reduced extent but increased magnitude of seawater intrusion. Sci. Total Environ. 898, 165451. doi: 10.1016/j.scitotenv.2023.165451
Li F., Angelini C., Byers J. E., Craft C., Pennings S. C. (2022). Responses of a tidal freshwater marsh plant community to chronic and pulsed saline intrusion. J. Ecol. 110, 1508–1524. doi: 10.1111/1365-2745.13885
Li M., Xia J., Li F., Meng D. (2012). The application of attribute recognition model based on coefficient of entropy to the assessment of seawater intrusion. Prog. Geogr. 31, 324–329. doi: 10.11820/dlkxjz.2012.03.007
Liu Q., Li F., Zhang Q., Li J., Zhang Y., Tu C., et al. (2014). Impact of water diversion on the hydrogeochemical characterization of surface water and groundwater in the Yellow River Delta. Appl. Geochem. 48, 83–92. doi: 10.1016/j.apgeochem.2014.07.009
Lotfata A., Ambinakudige S. (2020). Degradation of groundwater quality in the coastal aquifers of the USA. Sustain. Water Res. Manage. 6, 41. doi: 10.1007/s40899-020-00403-w
Martínez-Pérez L., Luquot L., Carrera J., Marazuela M. A., Goyetche T., Pool M., et al. (2022). A multidisciplinary approach to characterizing coastal alluvial aquifers to improve understanding of seawater intrusion and submarine groundwater discharge. J. Hydrol. 607, 127510. doi: 10.1016/j.jhydrol.2022.127510
Moulds M., Gould I., Wright I., Webster D., Magnone D. (2023). Use of electrical resistivity tomography to reveal the shallow freshwater–saline interface in The Fens coastal groundwater, eastern England (UK). Hydrogeol. J. 31, 335–349. doi: 10.1007/s10040-022-02586-2
Moussaoui I., Rosa E., Cloutier V., Neculita C. M., Dassi L. (2023). Chemical and isotopic evaluation of groundwater salinization processes in the Djebeniana coastal aquifer, Tunisia. Appl. Geochem. 149, 105555. doi: 10.1016/j.apgeochem.2022.105555
Nas B., Berktay A. (2010). Groundwater quality mapping in urban groundwater using GIS. Environ. Monit. Assess. 160, 215–227. doi: 10.1007/s10661-008-0689-4
Schoeller H. (1984). Geochemistry of groundwater. Groundwater studies-an international guide for research and practice (Paris: UNESCO) 1984, 1–46.
Stamatis G., Voudouris K. (2003). Marine and human activity influences on the groundwater quality of southern Korinthos area (Greece). Hydrol. Process. 17, 2327–2345. doi: 10.1002/hyp.1245
Tomaszkiewicz M., NAJM M. A., EL-FADEL M. (2014). Development of a groundwater quality index for seawater intrusion in coastal aquifers. Environ. Model. Softw. 57, 13–26. doi: 10.1016/j.envsoft.2014.03.010
Wang Z., Wang S., Liu W., Su Q., Tong H., Xu X., et al. (2020). Hydrochemical characteristics and irrigation suitability evaluation of groundwater with different degrees of seawater intrusion. Water 12, 3460. doi: 10.3390/w12123460
Wang X., Zheng W., Tian W., Gao Y., Wang X., Tian Y., et al. (2022). Groundwater hydrogeochemical characterization and quality assessment based on integrated weight matter-element extension analysis in Ningxia, upper Yellow River, northwest China. Ecol. Indic. 135, 108525. doi: 10.1016/j.ecolind.2021.108525
Xiong G., Chen G., Wu J., Wang Z., Yu H., Fu T., et al. (2022). Identifying the characteristics and potential risk of seawater intrusion for southern China by the SBM-DEA model. Sci. Total Environ. 844, 157205. doi: 10.1016/j.scitotenv.2022.157205
Xu Y. (2009). Geochemistry and 2H and 18O stable isotopes of Cangzhou aquifer systems. (PhD thesis). Beijing: China University of Geosciences (Beijing).
Xu Y., Tian X., Zheng Y., Li W. (2009). Increase and decrease in salinity of the shallow groundwater in Cangzhou. Hydrogeol. Eng. Geol. 2, 112–116. doi: 10.1287/mksc.1080.0385
Xue Y., Wu J., Liu P., Wang J., Jiang Q., Shi H. (1993). Sea-water intrusion in the coastal area of Laizhou Bay, China; 1. Distribution of sea-water intrusion and its hydrochemical characteristics. Groundwater 31, 532–537. doi: 10.1111/j.1745-6584.1993.tb00584.x
Yan B., Li X., Hou J., Bi P., Sun F. (2021). Study on the dynamic characteristics of shallow groundwater level under the influence of climate change and human activities in Cangzhou, China. Water Supply. 21, 797–814. doi: 10.2166/ws.2020.308
Zhang B., Song X., Han D., Guo Z., Xiao G., Yang J. (2013). Seawater intrusion degree evaluation based on mathematical statistics and fuzzy mathematics in Qinhuangdao Yangdai River Plain. Scientia Geographica Sin. 33, 342–348. doi: 10.13249/j.cnki.sgs.2013.03.342
Zhang X., Feng W., Li N. (2010). Attribute recognition model based on entropy weight and its application to evaluation of groundwater quality. Appl. Mech. Mater. 29-32, 2698–2702. doi: 10.4028/www.scientific.net/AMM.29-32.2698
Zhang Y., Li H., Lian C., Ding K., Zhang W., Shi L., et al. (2022). Evaluation of seawater intrusion degree in Xingcheng city, Liaoning province by entropy weight method and attribute recognition model. Mar. Environ. Sci. 41, 774–782. doi: 10.13634/j.cnki.mes.2022.05.014
Zhao J. (1998). Hydrochemical indexes of seawater intrusion and comprehensive judgement on intrusive degree. Chin. Geographical Sci. 18, 16–24. doi: 10.1017/S0266078400010713
Keywords: groundwater salinization, hydrochemical characteristics, seawater intrusion, groundwater quality index, attribute recognition model based on entropy weight, Cangzhou
Citation: Li H, Liu Y, Wang C, Yu K, Zhou Y, Fu X, Bai X and Li X (2024) Hydrogeochemical characteristics of shallow groundwater and salinization evaluation in the coastal aquifers of Cangzhou, China. Front. Mar. Sci. 11:1384289. doi: 10.3389/fmars.2024.1384289
Received: 09 February 2024; Accepted: 29 April 2024;
Published: 16 May 2024.
Edited by:
Alessandro Bergamasco, National Research Council (CNR), ItalyReviewed by:
Veljko Srzić, University of Split, CroatiaCopyright © 2024 Li, Liu, Wang, Yu, Zhou, Fu, Bai and Li. This is an open-access article distributed under the terms of the Creative Commons Attribution License (CC BY). The use, distribution or reproduction in other forums is permitted, provided the original author(s) and the copyright owner(s) are credited and that the original publication in this journal is cited, in accordance with accepted academic practice. No use, distribution or reproduction is permitted which does not comply with these terms.
*Correspondence: Chaoyue Wang, d2FuZ2NoYW95dWUwOEAxNjMuY29t
Disclaimer: All claims expressed in this article are solely those of the authors and do not necessarily represent those of their affiliated organizations, or those of the publisher, the editors and the reviewers. Any product that may be evaluated in this article or claim that may be made by its manufacturer is not guaranteed or endorsed by the publisher.
Research integrity at Frontiers
Learn more about the work of our research integrity team to safeguard the quality of each article we publish.