
94% of researchers rate our articles as excellent or good
Learn more about the work of our research integrity team to safeguard the quality of each article we publish.
Find out more
ORIGINAL RESEARCH article
Front. Mar. Sci., 28 May 2024
Sec. Marine Fisheries, Aquaculture and Living Resources
Volume 11 - 2024 | https://doi.org/10.3389/fmars.2024.1384046
 Li Dai1Zhen Zhang1
 Jinhu Liu2,3*Jianxin Chen4Yu Zhang4Wenjie Zhang1Qi Li1Wei Bai1Rongyong Zhang1*Hao Xiao4
To investigate the expulsion effect of different expulsion modes on Hexagrammos otakii, this study examined various environmental conditions in an indoor tank. Specifically, different lighting conditions (white, blue, and green light at illumination intensities of 5000 lx, 8000 lx, and 10000 lx) were explored, as well as varied sound conditions (sound frequencies of 150 Hz, 300 Hz, and 450 Hz at different sound pressure levels of 130 dB, 140 dB, and 150 dB) and bubble curtain conditions (air volumes of 60 L/min, 120 L/min, and 180 L/min). Additionally, the expulsion effect of different fish densities (1.56 tails/m2, 2.35 tails/m2, 3.13 tails/m2) of Hexagrammos otakii was investigated. The findings revealed that the bubble curtain exhibited the most effective expulsion effect on Hexagrammos otakii, with an expulsion rate of (40.4 ± 12.0) %, the highest period of 53%, and an average expulsion distance of 3.0 expulsion intervals when the air volume was 180 L/min and the fish density was 1.56 tails/m2. Conversely, the expulsion effect of light and sound on Hexagrammos otakii was found to be insignificant, with the expulsion rate of sound not exceeding 20% and that of light being lower than 15%. These results have implications for the selection and design of fish expulsion equipment in offshore areas, such as those surrounding wind farms and nuclear power plants. Therefore, this study provides valuable scientific reference for resource managers and practitioners in the field.
Hexagrammos otakii, commonly known as the “northern grouper of China”, is a coastal cold-temperature benthic fish that falls under Scorpaeniformes of Hexagrammiidae within the Hexagrammos genus (Liu, 2008). It is primarily found in the rocky areas around the continental shelf and islands, as well as the sediment waters nearby. The distribution of this species spans the Bohai Sea, Yellow Sea, and East China Sea in China, along with the offshore waters of Korea and Japan (Liu et al., 1990). It holds significance as an important economic fish species of rocks (Cheng, 1962). However, the recent years have seen a significant reduction in ocean space due to the large-scale construction of offshore wind farms, nuclear power plants, and other energy facilities (Song and Liu, 2006; Ni et al., 2009; Chen and Fang, 2010; Zhang and Li, 2018). The noise generated by offshore wind farms (Huang et al., 2022) and the cooling water entrainment at nuclear power stations (Ke et al., 2022) have the potential to impact the marine ecological environment. Consequently, the urgency to protect marine fishery resources has made managing the presence of Hexagrammos otakii in these areas a pressing issue.
Sound and light are crucial environmental factors that significantly impact fish behavior. One significant device affecting fish behavior is the underwater bubble curtain. This device is artificially combined by inflating equipment, an air pipeline, and an open air outlet pipe, which collectively generate a bubble curtain wall at a specific depth underwater. This bubble curtain wall has a pronounced impact on various aspects of fish behavior, including their growth, survival, feeding, and reproduction. It is known that such devices can stimulate the sensory organs of fish, which can effectively block their path and reduce their activity space, thus resulting in the aggregation and blocking of fish. In recent years, research has focused on exploring the potential effects of different stimulus sources on the blocking and repelling of various fish species. For instance, Liu et al. (2021) conducted a study on the impact of light color on the behavioral response of Oncorhynchus mykiss and found that rainbow trout were most responsive to yellow light, showing a strong evasive effect. Similarly, Shafiei Sabet et al. (2016) discovered that zebrafish (Danio rerio) exhibited fewer crossing times under dim light conditions as compared to bright light conditions in a laboratory tank stocking scenario with a middle partition. Several studies have investigated the impact of different acoustic stimuli on the behavior of various fish species. Shi et al. (2014) observed that rectangular wave interrupts at 150 Hz had a positive effect on the phonotactic behavior of Sebastiscus marmoratus in an artificial reef model. Gong et al. (2023) determined that an optimal radius of 250 m was required for the acoustic domestication of Sebastes Xui using sinusoidal wave parameters of 300 Hz and 155 dB in an ocean pasture demonstration area. Additionally, Bertucci et al. (2010) found that male Cichlidae use sound signals to regulate male behavior during disputes, reducing aggression and escalating the risk of fighting. Moreover, Bai et al. (2013) discovered that the blocking effect of bubble curtains at different densities varied for Hemibarbus maculatus and Onychostoma sima, with the former achieving the best blocking effect at a pore distance of 1.0 cm and a pore size of 2.0 mm. Furthermore, Zhou et al. (2023) found that a bubble curtain with an aperture of 1.0 mm, a hole distance of 2.0 cm, and an air volume of 120 L/min had a significant stopping effect on rainbow trout. Finally, Zielinski et al. (2014) conducted flume experiments that demonstrated a 75-85% reduction in the number of carps (Cyprinus carpio) passing through a deep-water and coarse bubble system curtain in both upstream and downstream directions.
Those empirical researches presented above demonstrates the crucial role that strategic utilization of light, sound, and bubble curtain can play in the expulsion and containment of fish. The development of marine ranches necessitates the use of acoustic and photoelectric technologies to regulate the behavior of fish species such as Hexagrammos otakii. Additionally, numerous coastal power plants in China employ seawater for cooling purposes. However, the intake pumps of these plants inadvertently draw in fish species such as Hexagrammos otakii, leading to detrimental consequences for local fishery resources. Consequently, there is an imperative need to implement acoustic and photoelectric technologies to preclude fish from entering the water intake system. Nevertheless, existing research on light, sound, and bubble curtain technologies predominantly revolves around their applications in fishing and the attraction of fish schools (Chen et al., 2012; Fatmawati et al., 2020; Flores-Martin et al., 2021), with limited studies examining different expulsion methods for specific fish species to ascertain the most effective approach (Kim and Mandrak, 2017). Therefore, this study endeavors to investigate the efficacy of light, sound, and bubble curtain as means of expulsion for Hexagrammos otakii, with the aim of providing valuable insights into the behavioral traits of this species, advancing the manipulation of fish behavior, and offering theoretical references for the management of fish in marine ranches and the expulsion of fish at water intakes.
The Hexagrammos otakii used in the experiment was acquired from Yantai Tianyuan Fisheries Co., LTD., with a total length of 106.8 ± 0.9mm and a weight of 14.53 ± 4.28g. In order to ensure the uniformity of the fish species, careful examination was undertaken to verify similar size and the absence of any health or disease issues. Subsequently, the fish was temporarily housed in a circular circulating water tank, specifically located in the Acoustics Acclimation Laboratory of Ocean University of China, with an inner diameter of 1.5m and a depth of 1m. The fish was cultured with seawater with a salinity of 32-35 SAL-ppt at a temperature range of 16.0-19.0°C, with 16.0-21.0°C being the optimal temperature. The dissolved oxygen levels were maintained between 7.0-8.0 mg/L, while the pH was kept at 7.7. In addition, the tank was exposed to natural light during the experiment. Prior to the commencement of the experiment, the water tank was disinfected using a 0.1% potassium permanganate solution, followed by the introduction of seawater. Furthermore, the fish was regularly fed at 8 a.m. every day, the water was replaced every three days, and the fish pond feces were routinely removed at night.
Before the experiment, the fish individuals was gathered in zone I, which was situated closest to the expulsion source, to provide a more accurate reflection of the expulsion effect. The experimental tank, denoted in white, is 3.40m long, 1.88m wide, and 0.50m deep, and it was divided into 4 sections along the length direction. Each of these sections, with a length of 0.85m and a width of 1.88m, was labelled I, II, III, and IV based on their distance from the expulsion source. Sections I and II constituted the upper half, while sections III and IV comprised the lower half (Figure 1). Additionally, a real-time monitoring camera was positioned directly above the sink and connected via a wireless network. This camera, combined with the Ezviz Studio software on the computer, enabled real-time video monitoring and recording.
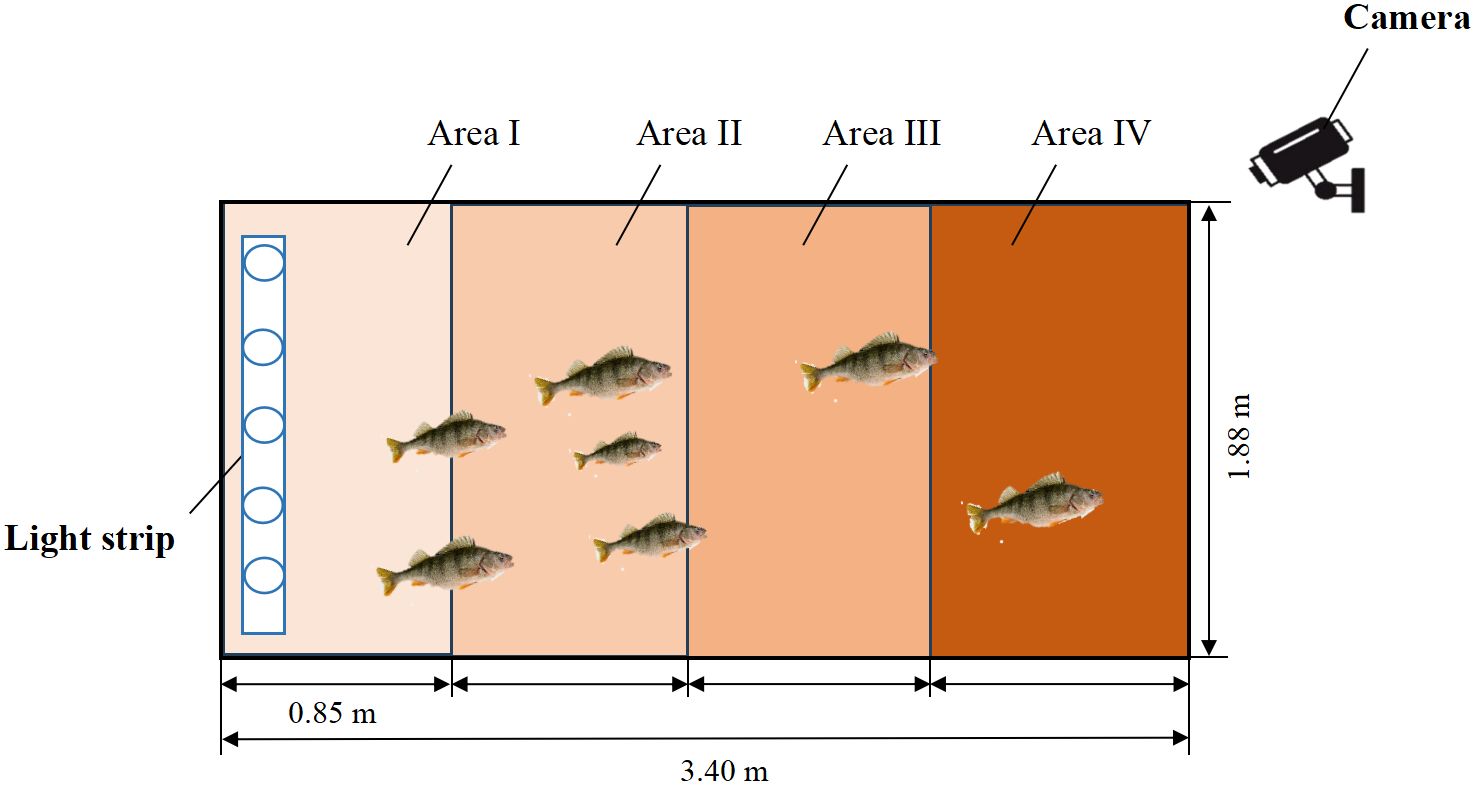
Figure 1 Schematic diagram of light expulsion experiment.
The experimental setup involves the connection of two underwater light tubes, each measuring 1.46m in length and 30mm in width, in parallel using cable ties to create a light belt. This light belt is longitudinally positioned at the beginning of section I across the width of the sink, with sinks located at the back and both ends of the light belt to ensure that it is fully submerged, thereby producing a distinct light curtain as a source of illumination. The arrangement of this setup is illustrated in Figure 1. The light belt has a power rating of 32W and allows for adjustment of light colors and illumination intensity using a wireless remote control. The TES1330A illumination intensity meter is utilized to measure the illumination intensity at a distance of 1 cm from the water surface directly above the lamp belt. The parameters of the lamp tube, including different gear positions and colors, are then measured and documented in Table 1.
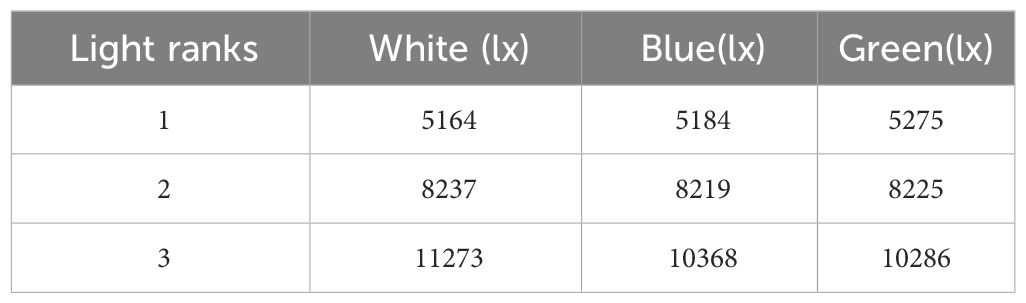
Table 1 Measured illumination intensity for different lighting colors.
The underwater sound equipment comprises a power amplifier (KHz brand model MA-080), an underwater speaker (DNH Aqua-30, Norway, rated power: 20 W), and a hydrophone (SPH32R, frequency response range 1 kHz to 30 kHz, receiving sensitivity -182 dB). The power amplifier’s role is to amplify the pre-implanted sound band in order to drive the underwater horn and emit the desired intensity sound. The underwater loudspeaker is connected to the power amplifier to serve as the sound emission source for the experiment. The hydrophone, which is connected to the computer, serves as a transducer to convert the sound signal into an electrical signal for receiving sound signals in the water. This allows for the direct display of sound frequency and sound pressure level on the MARS software on the computer, facilitating adjustments to the sound frequency and pressure level of the underwater loudspeaker. The experimental layout is depicted in Figure 2, with the underwater speaker positioned in the middle of the starting end of zone I to serve as the source of sound emission.
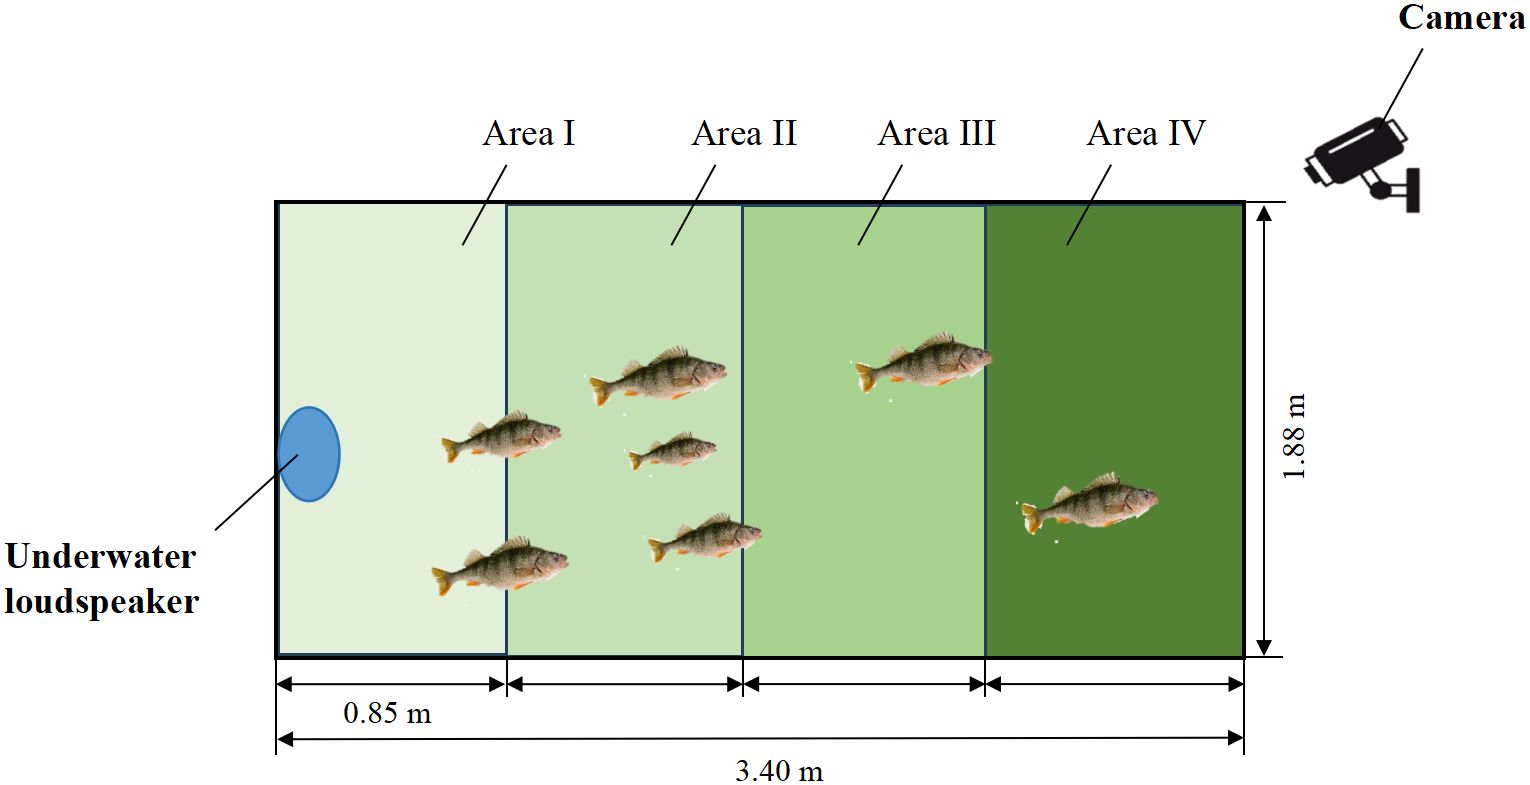
Figure 2 Schematic diagram of sound expulsion experiment.
Connecting a 1.2m long white hard plastic pipe with an inner diameter of 2cm to the bottom end of the sink, uniformly drill 1mm apertures at 2cm intervals along the length of the pipe, and seal both ends with insulation tape (Figure 3). The bubble curtain pipe was then connected to a thermoplastic polyurethane rubber (TPU) hose with a 6.0mm diameter, by Zhejiang Fujii Air Compressor Co., LTD. Subsequently, three different air filling control settings were implemented by adjusting the number of air pumps to deliver 60, 120, and 180 L/min.
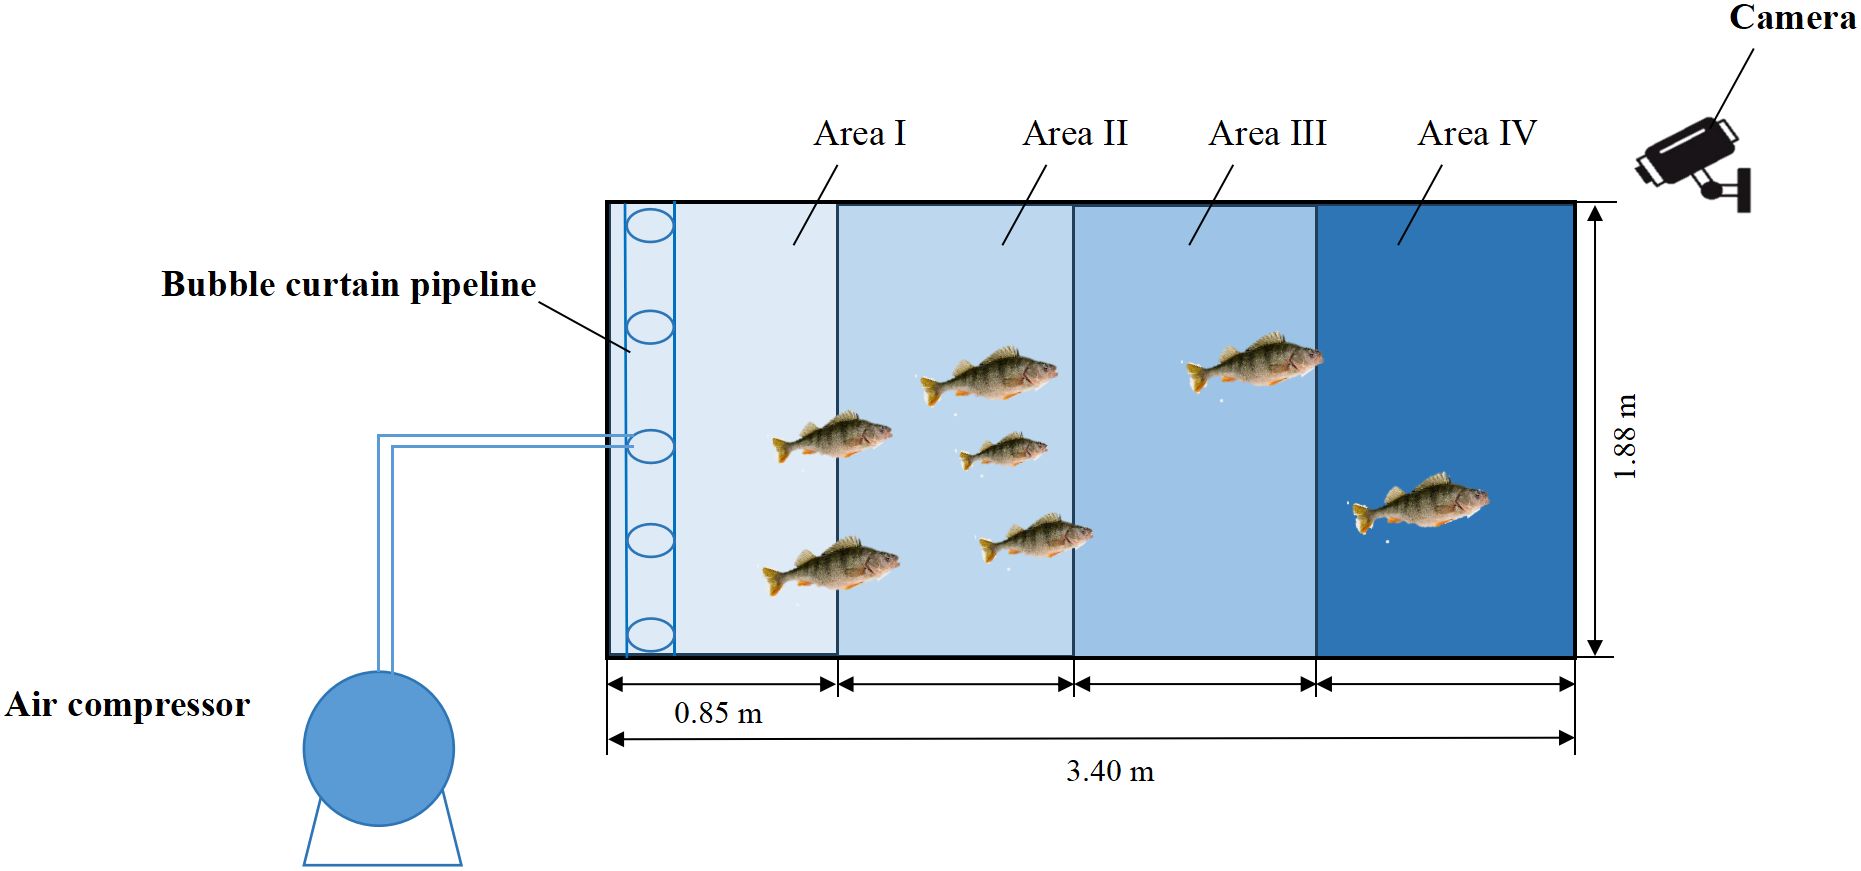
Figure 3 Schematic diagram of bubble curtain expulsion.
The experimental setup involved conducting a series of experiments under an initial illumination intensity of 5000 lx, during which white light, blue light, and green light conditions were compared to determine the optimal light color. Subsequently, the optimal illumination intensity for each condition, at 8000 lx and 10000 lx, was also tested, with each condition repeated three times. Both the blank group and the experimental group were exposed to the illumination conditions for a duration of 10 minutes. Further details of the illumination conditions are presented in Table 2.
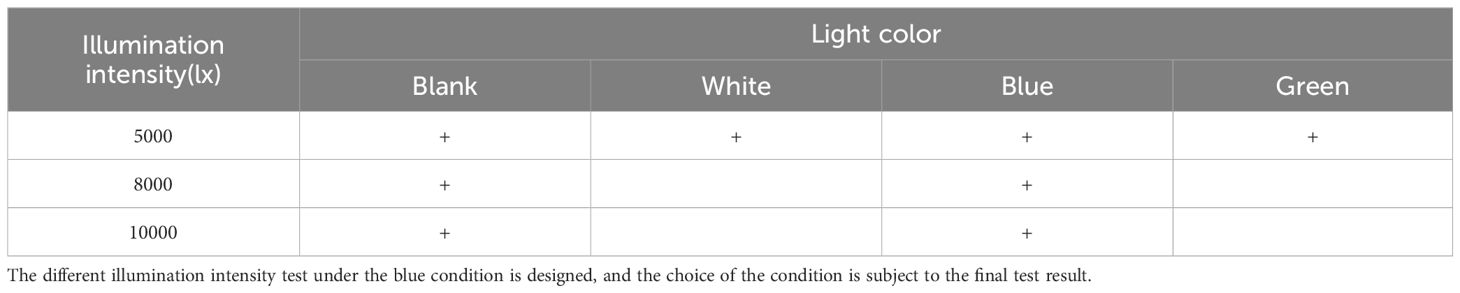
Table 2 Lighting condition.
The experiment begins by employing a sound frequency of 150 Hz. The experiment then investigates the impact of sound pressure levels of 130 dB, 140 dB, and 150 dB at this frequency, and subsequently compares the working conditions with the optimal sound pressure level. Following this, experiments are conducted with the optimal sound frequencies of 300 Hz and 450 Hz under the established working conditions. Each working condition is replicated three times. Both the blank group and the experimental group have a duration of 10 minutes. The specific test conditions are outlined in Table 3.
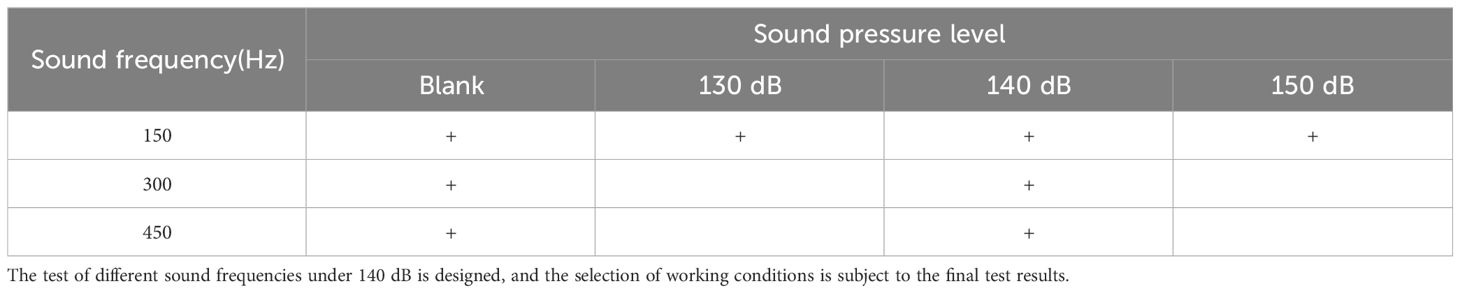
Table 3 Sound condition.
In this experiment, the optimal air capacity conditions were compared by first adopting a fish density of 1.56 fish/m2 (10 fish) and conducting experiments at air capacities of 60, 120, and 180 L/min successively. Subsequently, experiments at different densities of 2.35 fish/m2 (15 fish) and 3.13 fish/m2 (20 fish) were conducted under the previously identified optimal air capacity conditions. Each experimental condition was repeated three times, with both the blank group and the experimental group having a duration of 10 minutes. The specific test conditions can be found in Table 4.
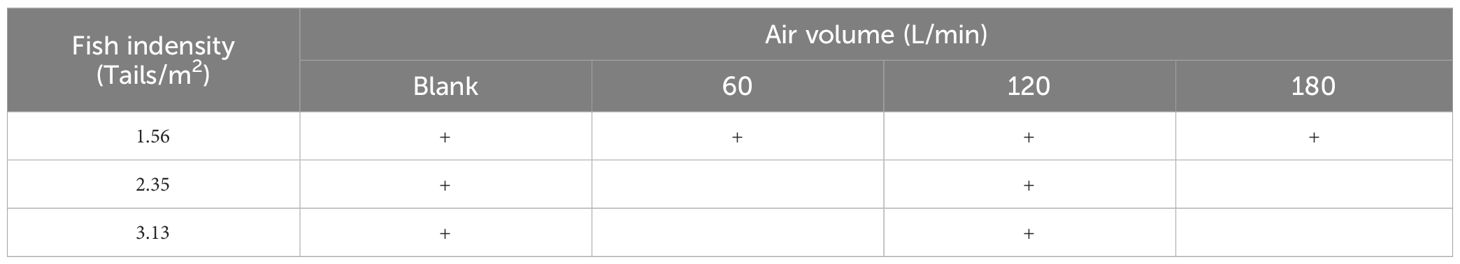
Table 4 Bubble curtain condition.
In this study, repelling rate and relative repelling distance were used to quantify the repelling effect indicators. Repelling rate is defined as the ratio of repelled fish to the total amount, and the calculation method is detailed in the Equation 1:
Where, Pt is the expulsion rate at time t, Xt is the number of expelled fish at time t, X1 is the initial number of fish, and M is the total number of fish under this condition.
Average expulsion distance refers to the average distance individuals are driven to escape, calculated using the shown Equation 2:
Where, Dt is the average escape distance of expelled fish individuals at time t, Dnt is the relative distance of expelled fish individuals at time t (this study assumes that an individual crossing one interval is counted as an escape unit distance, and so on), Xnt is the number of escaped fish individuals at time t corresponding to Dnt distance, where X1t+X2t++X3t…+Xnt=Xt.
To ensure more accurate and clear calculations of the two indicators, this study adopts the assumption that fish individuals crossing from the upper half to the lower half upon being stimulated by the expulsion source are classified as escaping individuals. Conversely, fish individuals that continue to wander in the upper half after the stimulus source is activated are not considered as escaping individuals. Additionally, the study accounts for instances where fish return after being driven away; therefore, fish that return from the lower half to the upper half at a specified time are classified as negative in terms of drive rate and drive distance. This strategy considers the proximity of the upper half to the expulsion source and the distance of the lower half from the expulsion source, thus enhancing the accuracy and clarity of the calculations.
This study utilized the Kruskal-Wallis H non-parametric test to establish the significance across different groups, as the experimental samples from various working conditions were independent of one another and are drawn from the same population. The Kruskal-Wallis H non-parametric test was employed to compare three or more independent samples, enabling the examination of whether these samples originate from the same population or if the median of one population differs from that of the others.
The results indicated that the expulsion rates of (-2.2 ± 9.4) %, (0.4 ± 14.3) %, and (8.9 ± 7.9) % were observed under the conditions of white light, green light, and blue light, respectively, with a fixed illumination intensity of 5000 lx (Figure 4). A Kruskal-Wallis H non-parametric test revealed a significant difference in the expulsion rate among the three light colors on Hexagrammos otakii expulsion (H=-20.314, P<0.05). Specifically, the fish repellent rate showed a significant difference between blue light and green light (H=-17.963, P<0.05), as well as a stronger significant difference between blue light and white light (H=-22.148, P<0.01), indicating the superior repellent effect of blue light compared to green and white light. Furthermore, Figure 5 displays the expulsion rates of 5000, 8000, and 10000 lx under the condition of illumination intensity, resulting in rates of (8.9 ± 7.9) %, (8.5 ± 7.6) %, and (10.4 ± 13.7) %, respectively, when the light color is blue. Subsequent analysis using the Kruskal-Wallis H non-parametric test indicated no significant difference in the expulsion rate among the three light intensities (H=0.123, P>0.05) when the light color was blue, suggesting that these three light intensities of blue light did not significantly differ in their impact on the expulsion rate of Hexagrammos otakii.
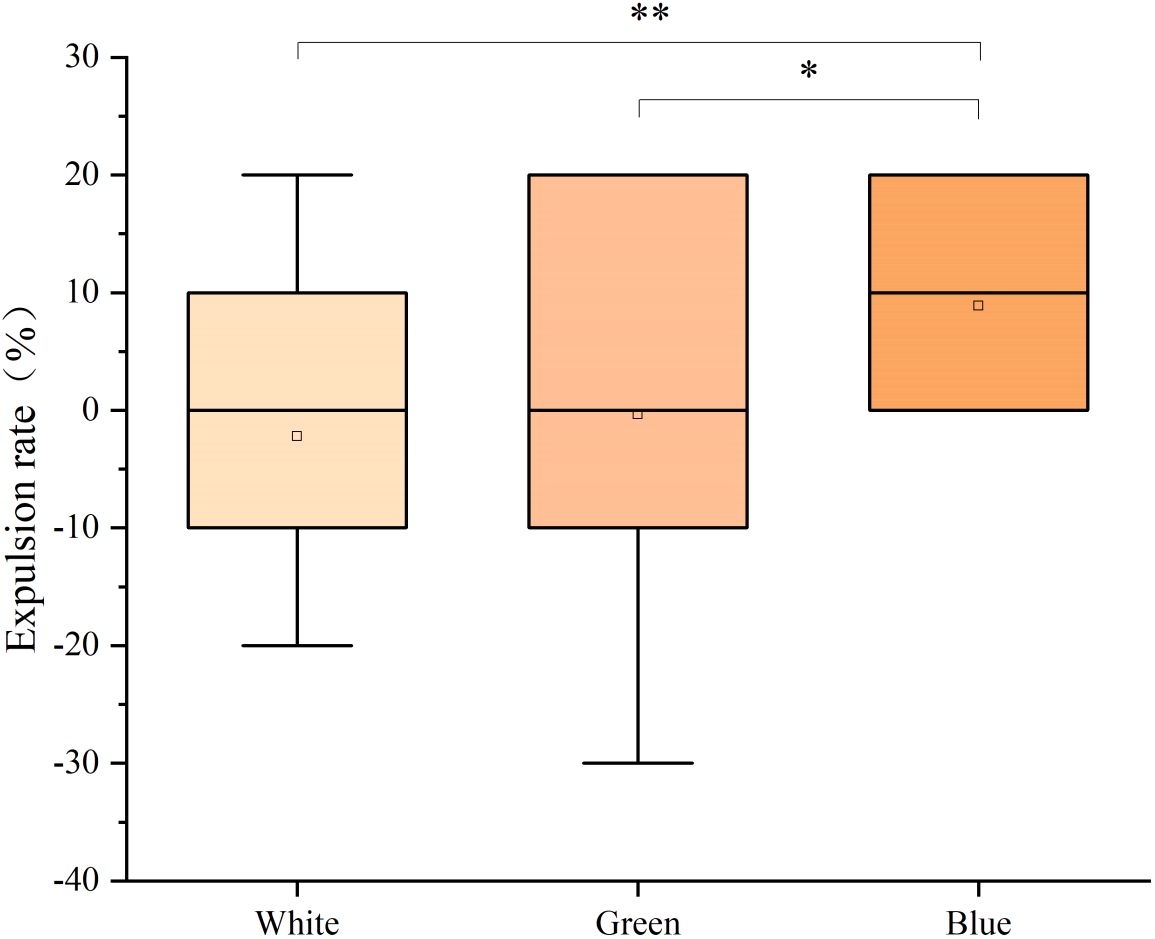
Figure 4 Comparison of fish expulsion rate under three kinds of light color. * indicate significant differences at P< 0.05, ** indicate significant differences at P< 0.01.
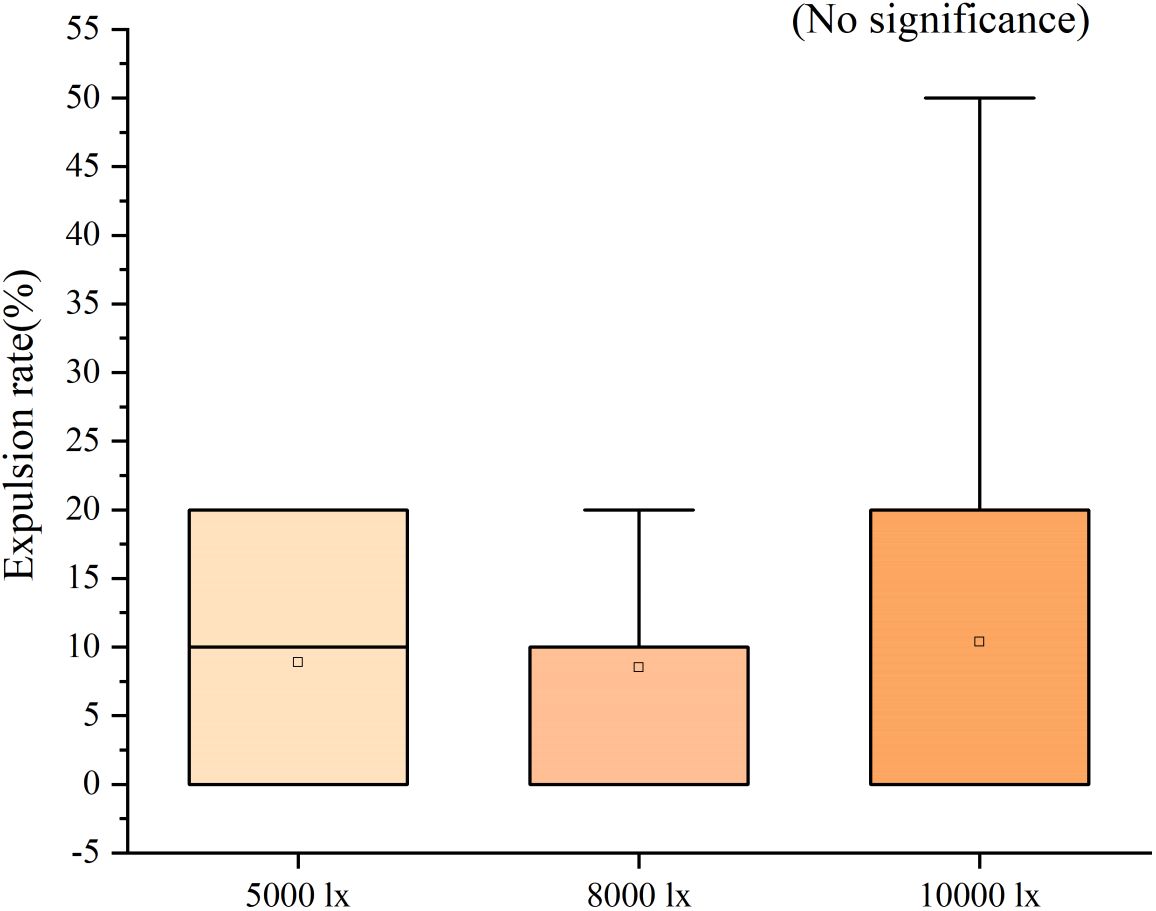
Figure 5 Comparison of fish expulsion rate under three kinds of illumination intensity.
The expulsion rate of the three illumination intensities under blue light at different time periods was depicted in Figure 6. The maximum expulsion rate of 13% occurred at the second minute under an intensity of 5000 lx, the first minute under 8000 lx, and the second, third, and eighth minutes under 10000 lx. Notably, the expulsion rate remained below 10% for the remaining working conditions. Moving on to Figure 7, this figure illustrated the average expulsion distance of fish under the three light intensities across different time periods. The highest average expulsion distance of 2 intervals was observed at 5000 lx during the 5th minute, followed by 8000 lx, which showed an average expulsion distance of 1.8 intervals at the 9th minute.
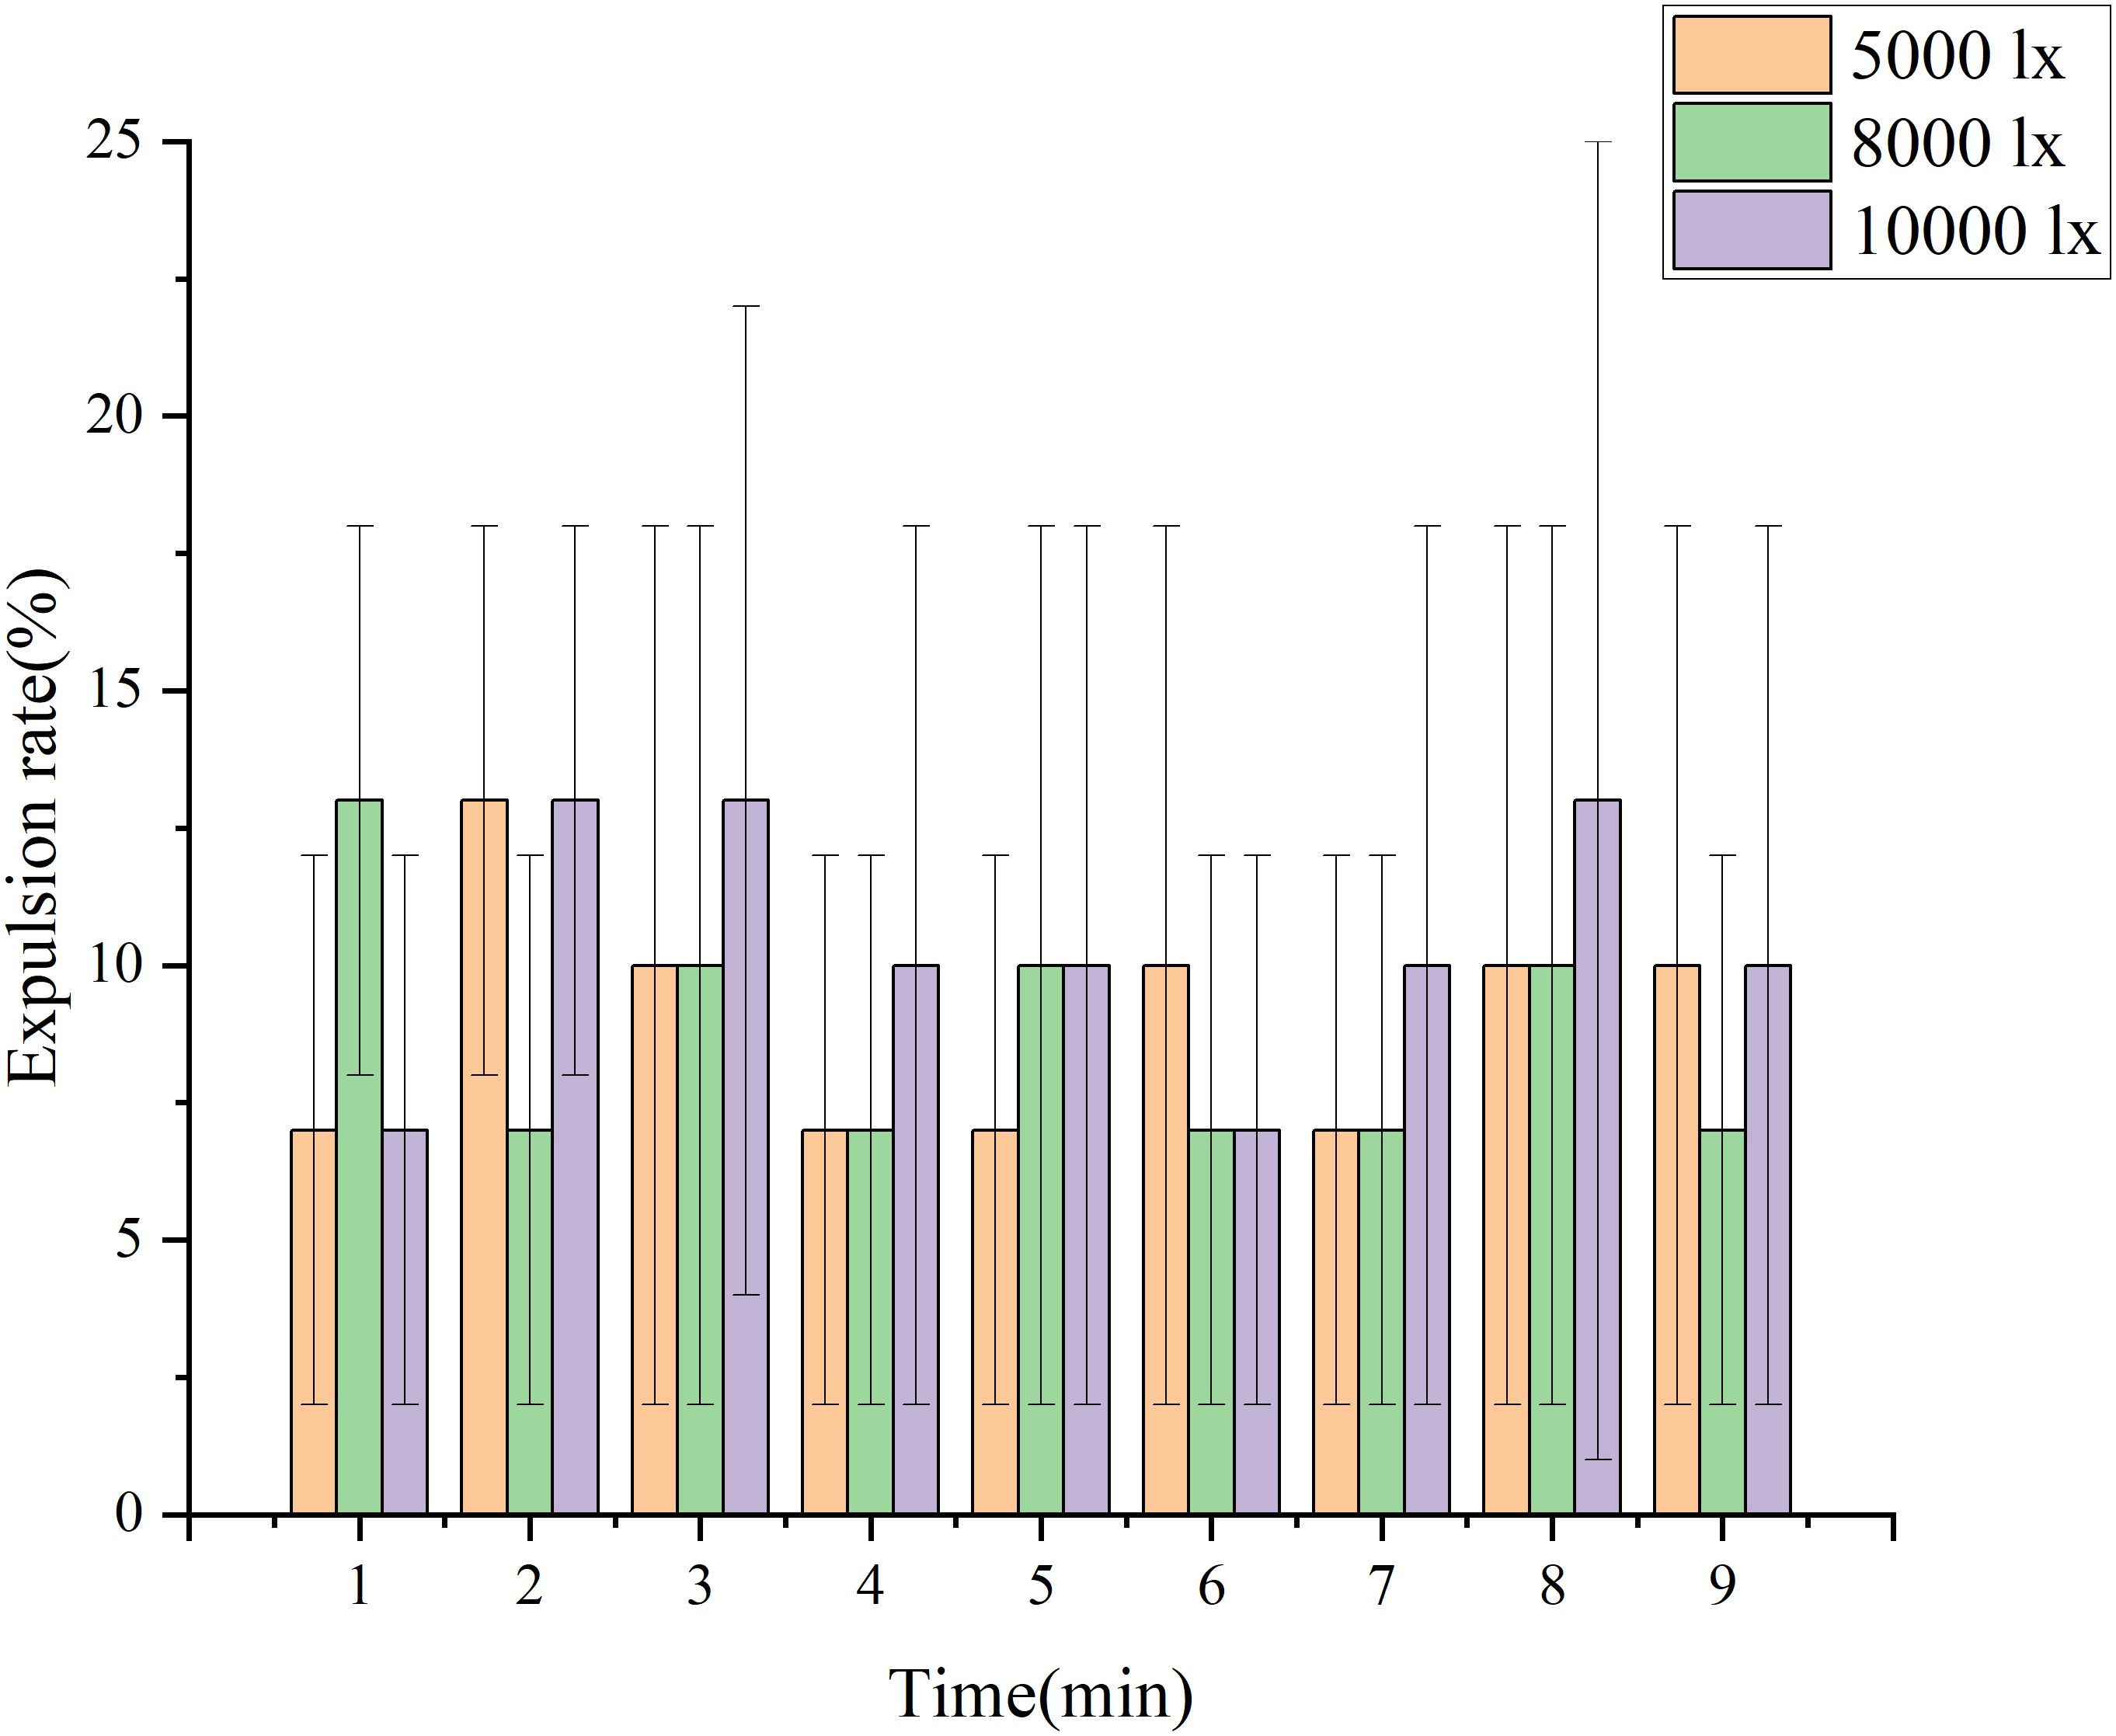
Figure 6 Fish expulsion rate under three kinds of illumination intensity and different time periods.
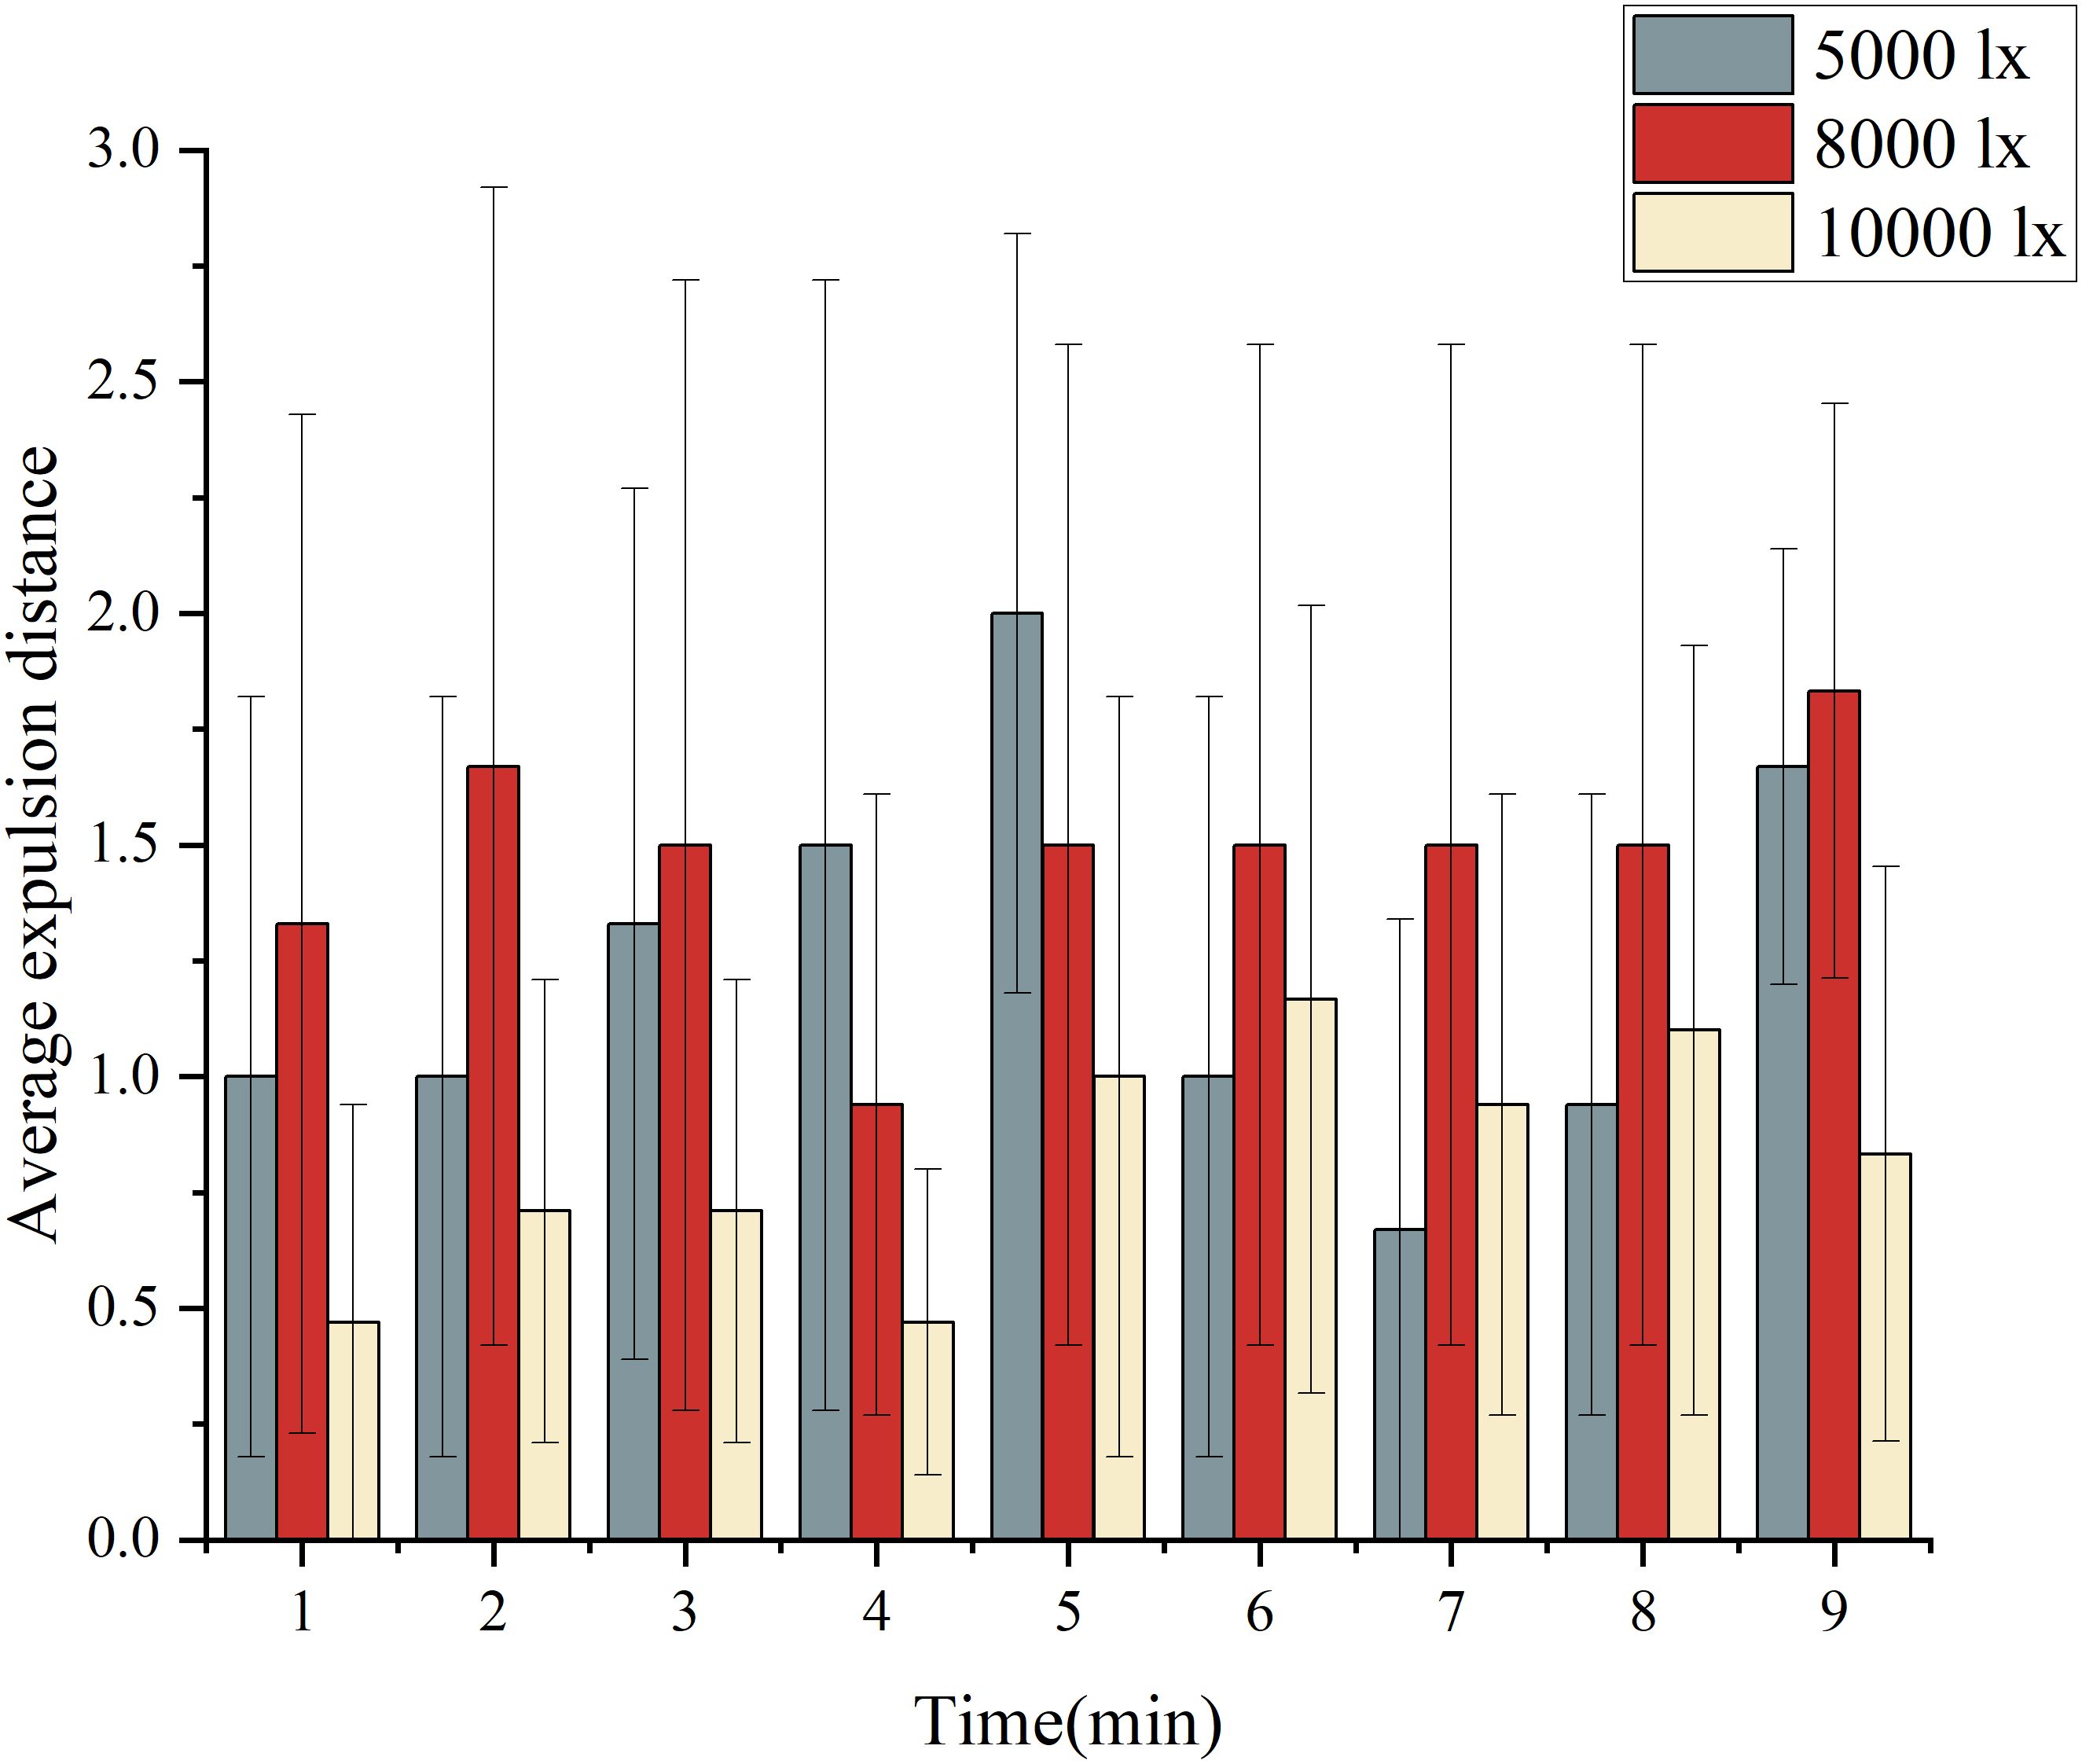
Figure 7 Average expulsion distance of fish under three kinds of illumination intensity and different time periods.
The expulsion rates under the sound frequency of 150 Hz and sound pressure levels of 130, 140, and 150 dB were (4.4 ± 7.4) %, (9.6 ± 22.5) %, and (13.3 ± 15.4) %, as depicted in Figure 8. The Kruskal-Wallis H non-parametric test indicated no significant difference in the number of fish driven by different sound pressure levels (H=4.613, P>0.05). Notably, the highest average fish expulsion rate was observed at the sound frequency of 150 Hz and sound pressure level of 150 dB. To further investigate, comparisons were made using three groups of sound frequencies—150, 300, and 450 Hz—all with a sound pressure level of 150 dB. Figure 9 illustrated the expulsion rates for the three sound frequencies as (13.3 ± 15.4) %, (3.0 ± 6.0) %, and (3.7 ± 5.5) %, respectively. The Kruskal-Wallis H non-parametric test revealed significant differences between the three groups of sound frequency conditions (H=10.916, P<0.05). Furthermore, a strong and significant difference was observed between the sound frequencies of 150 Hz and 300 Hz (H=17.944, P<0.01), as well as between 150 Hz and 450 Hz (H=15.056, P<0.05). These results suggested that the sound frequency of 150 Hz and sound pressure level of 150 dB had a superior expulsion effect on fish.
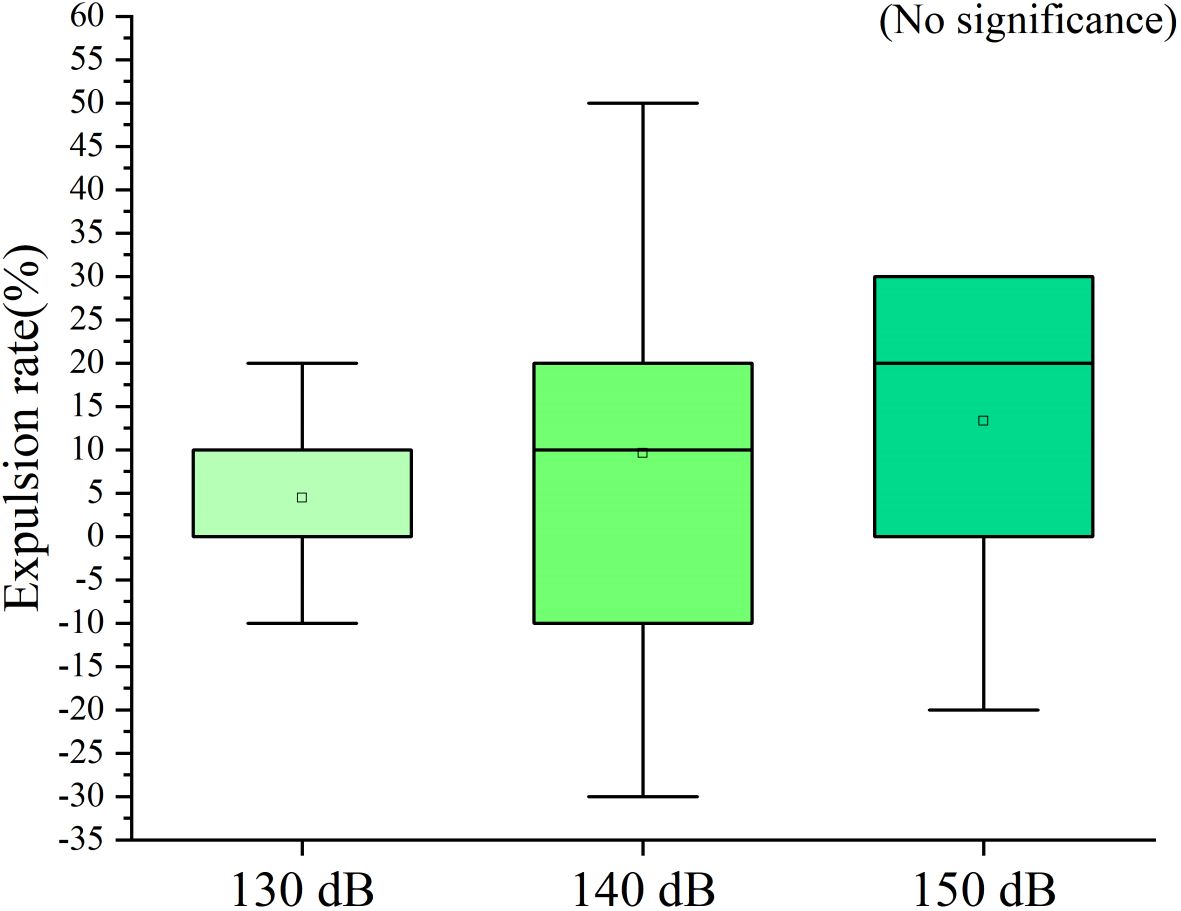
Figure 8 Comparison of fish expulsion rate under three kinds of sound pressure level.
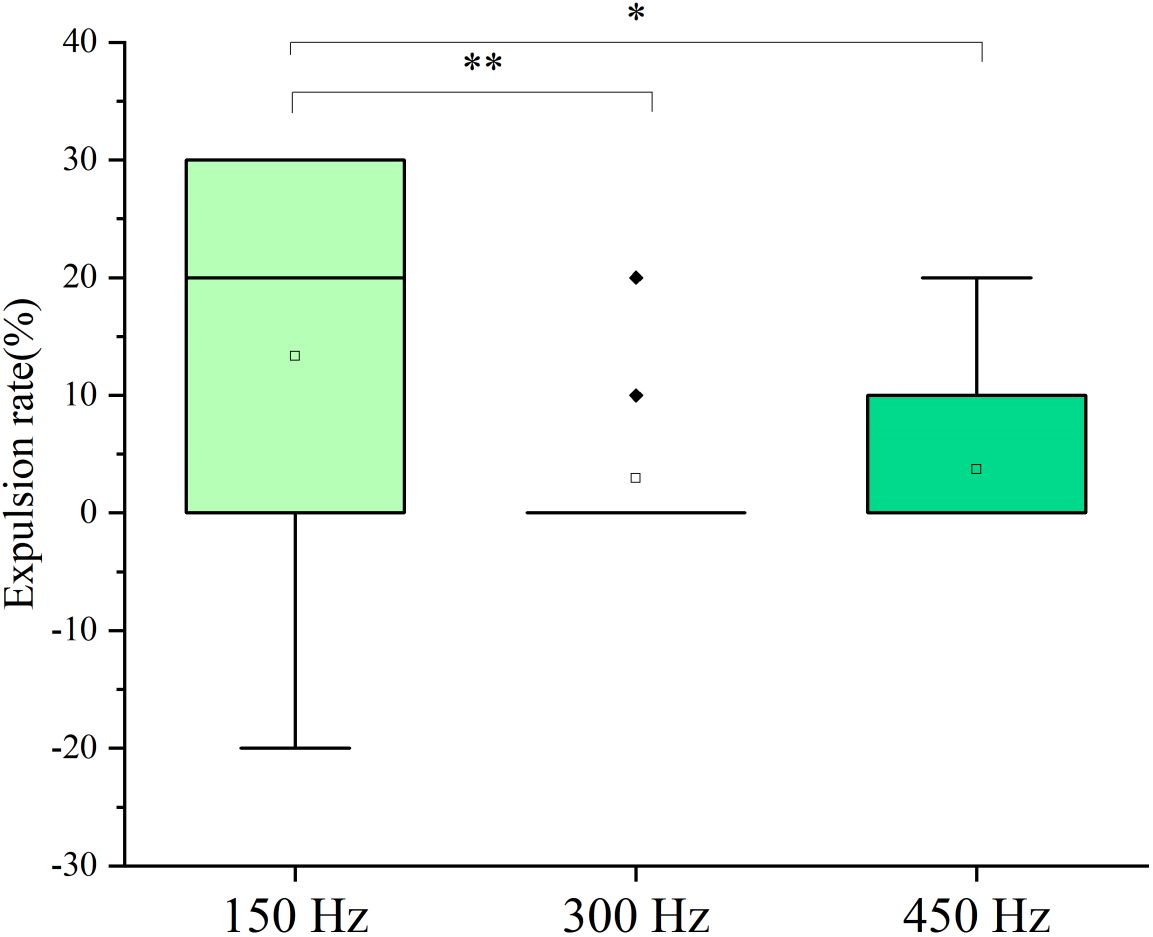
Figure 9 Comparison of fish expulsion rate under three kinds of sound frequencies. * indicate significant differences at P< 0.05, ** indicate significant differences at P< 0.01.
Figure 10 displayed the fish repellency rates at different time periods for three groups of sound frequencies (150, 300, and 450 Hz) at a sound pressure level of 150 dB. Notably, the condition of 150 dB and 150 Hz demonstrates a positive effect on the fish repellency rate, with the highest rate peaking at about 20% at the 4th minute. Contrastingly, during the initial minutes, the fish repellency rate for 300 Hz and 450 Hz sound frequencies is less than 10%, and even shows a negative trend. Conversely, Figure 11 indicated the average expulsion distance for the three sound frequencies at various time periods. It is observed that the maximum expulsion distance is recorded at the 4th minute for the 150 Hz sound frequency at a sound pressure level of 150 dB, reaching 2 expulsion intervals. In contrast, the expulsion rate remains lower than 2 intervals under the other working conditions and time periods.
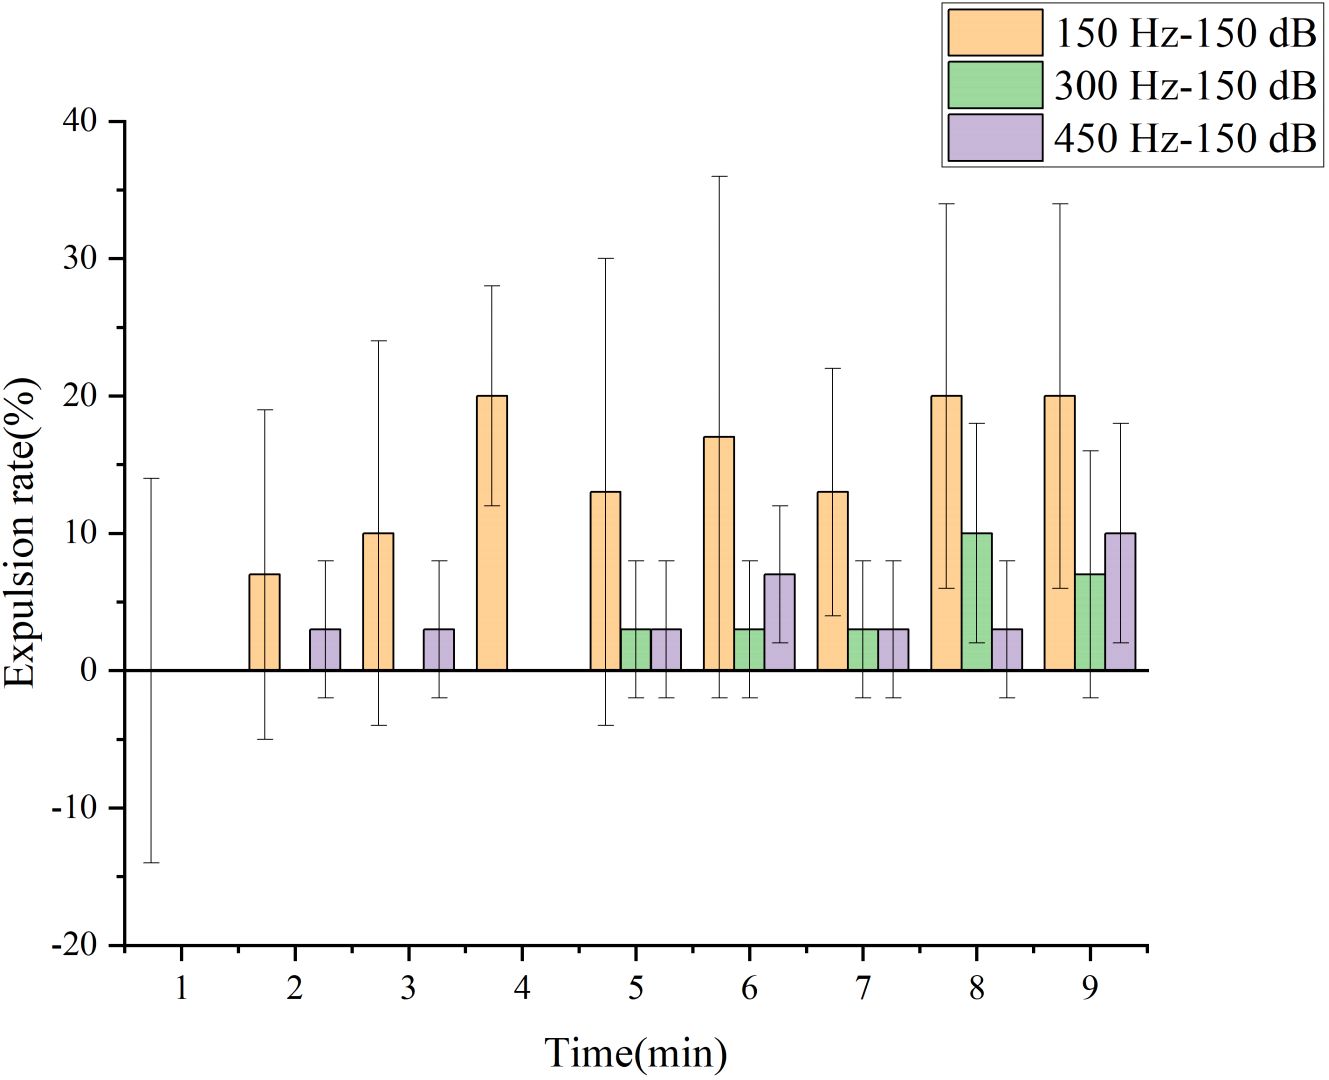
Figure 10 Fish expulsion rate under three kinds of sound frequency and different time periods.
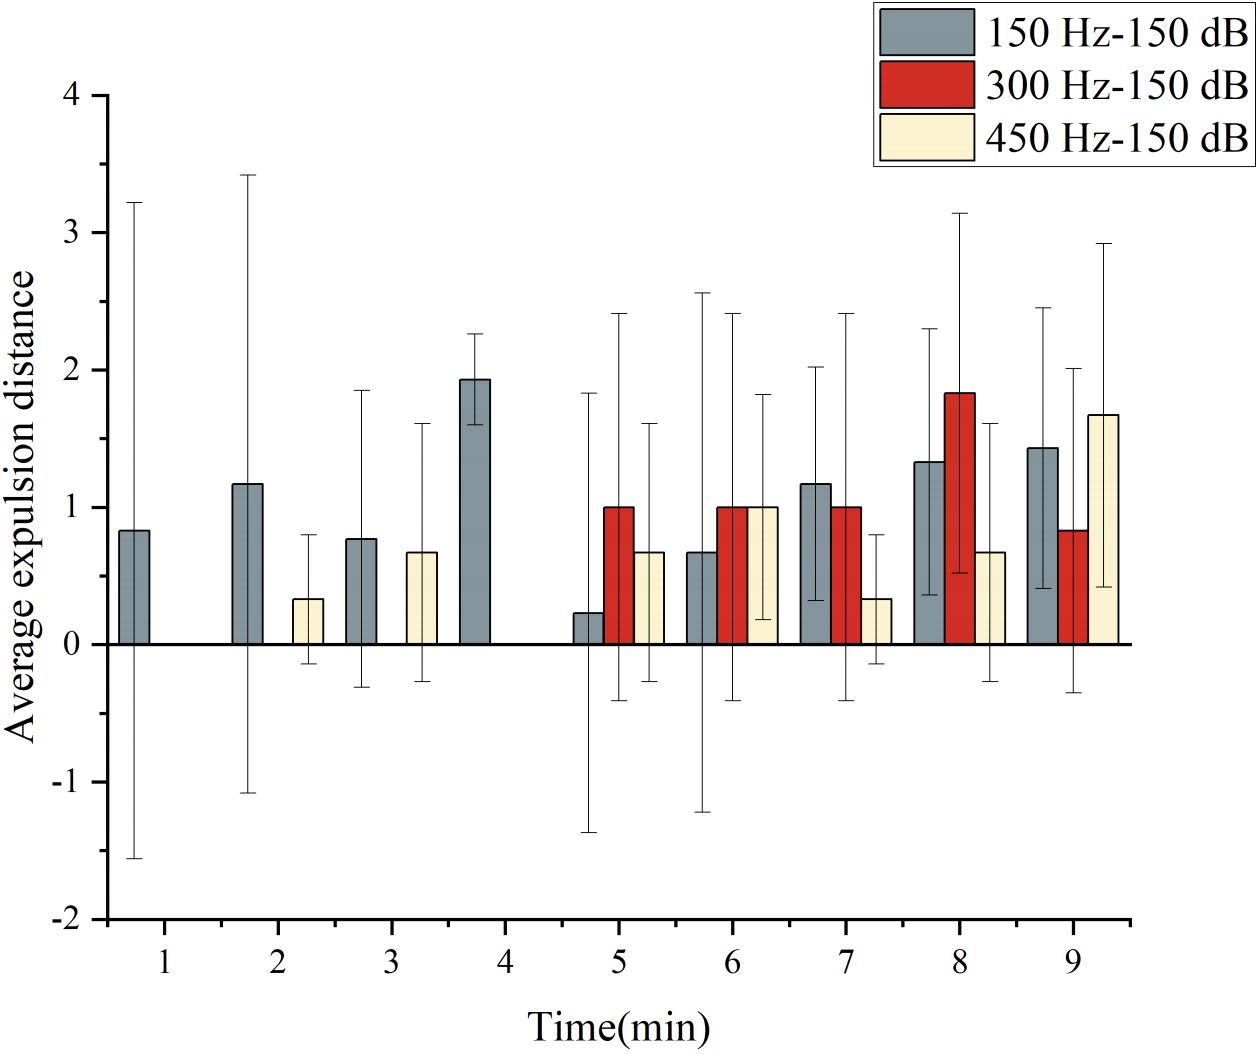
Figure 11 Average expulsion distance of fish under three sound frequency and different time periods.
The expulsion rates of fish at a fish density of 1.56 tails/m2 and three different air flow rates of 60, 120 and 180 L/min were depicted in Figure 12, showing rates of (22.6 ± 13.2)%, (32.6 ± 21.7)% and (40.4 ± 12.0)%, respectively. Statistical analysis using the Kruskal-Wallis H non-parametric test indicated significant differences in fish expulsion rates under varied air consumption conditions. Specifically, there was a strong and significant difference between 180 L/min and 60 L/min (H=-26.370, P<0.01), as well as a significant difference between 120 L/min and 60 L/min (H=-13.685, P<0.05). Moreover, a significant difference was observed between 180 L/min and 120 L/min (H=-12.685, P<0.05), suggesting that the fish expulsion rate at 180 L/min surpassed that at 60 L/min and 120 L/min. Subsequently, the expulsion rates of fish at air flow rate 180 L/min under different fish densities were compared using the data represented in Figure 13, showing rates of (40.4 ± 12.0)%, (32.3 ± 11.8)% and (30.0 ± 14.4)% for fish densities of 1.56, 2.35, and 3.13 tails/m2, respectively. The Kruskal-Wallis H non-parametric test indicated significant differences in the number of fish expelled under identical working conditions and different densities. Notably, there were significant differences between 1.56 tails/m2 and 3.13 tails/m2 (H=-17.574, P<0.01), as well as between 1.56 tails/m2 and 2.35 tails/m2 (H=-13.259, P<0.05).
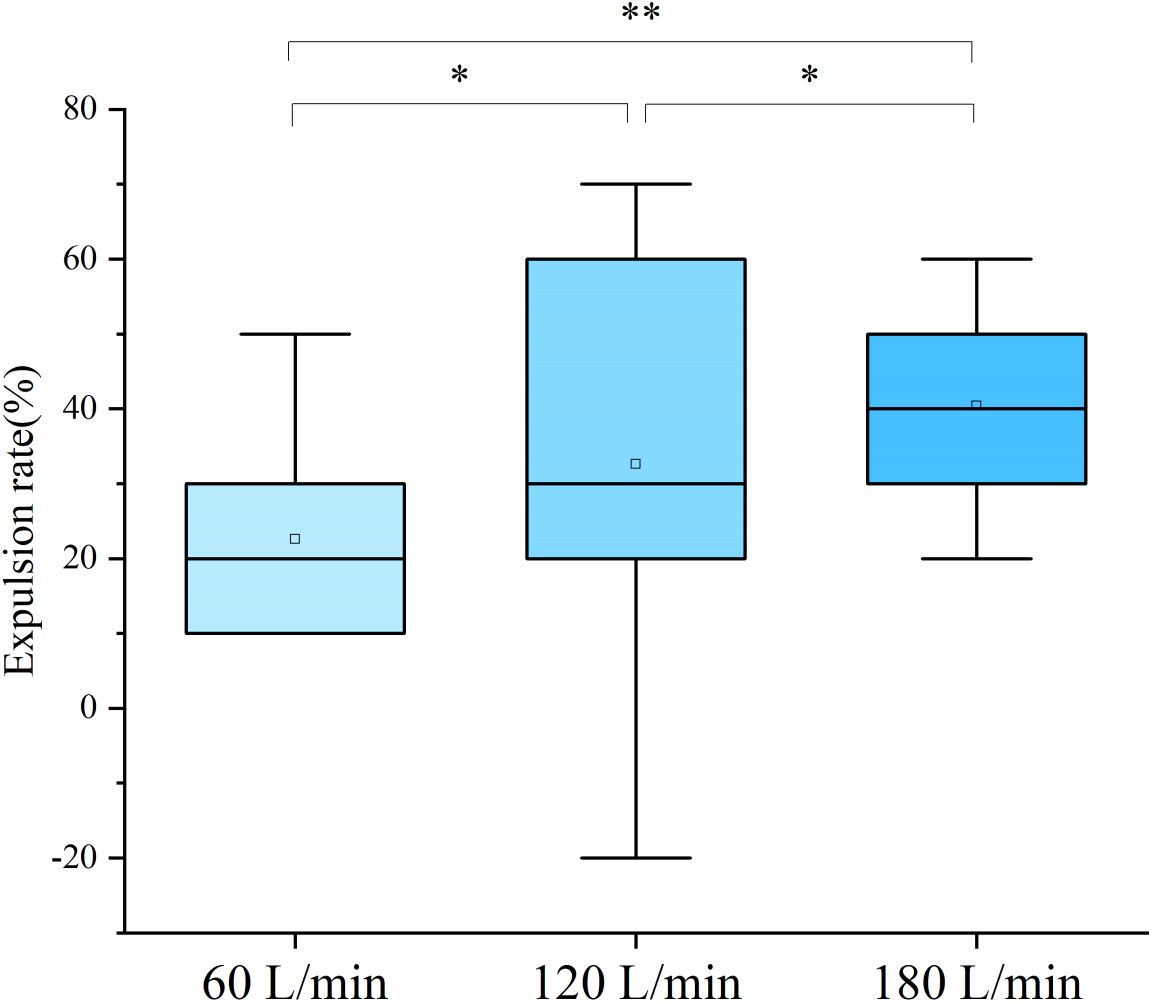
Figure 12 Comparison of fish expulsion rate under three kinds of air volume of bubble curtain. * indicate significant differences at P< 0.05, ** indicate significant differences at P< 0.01.
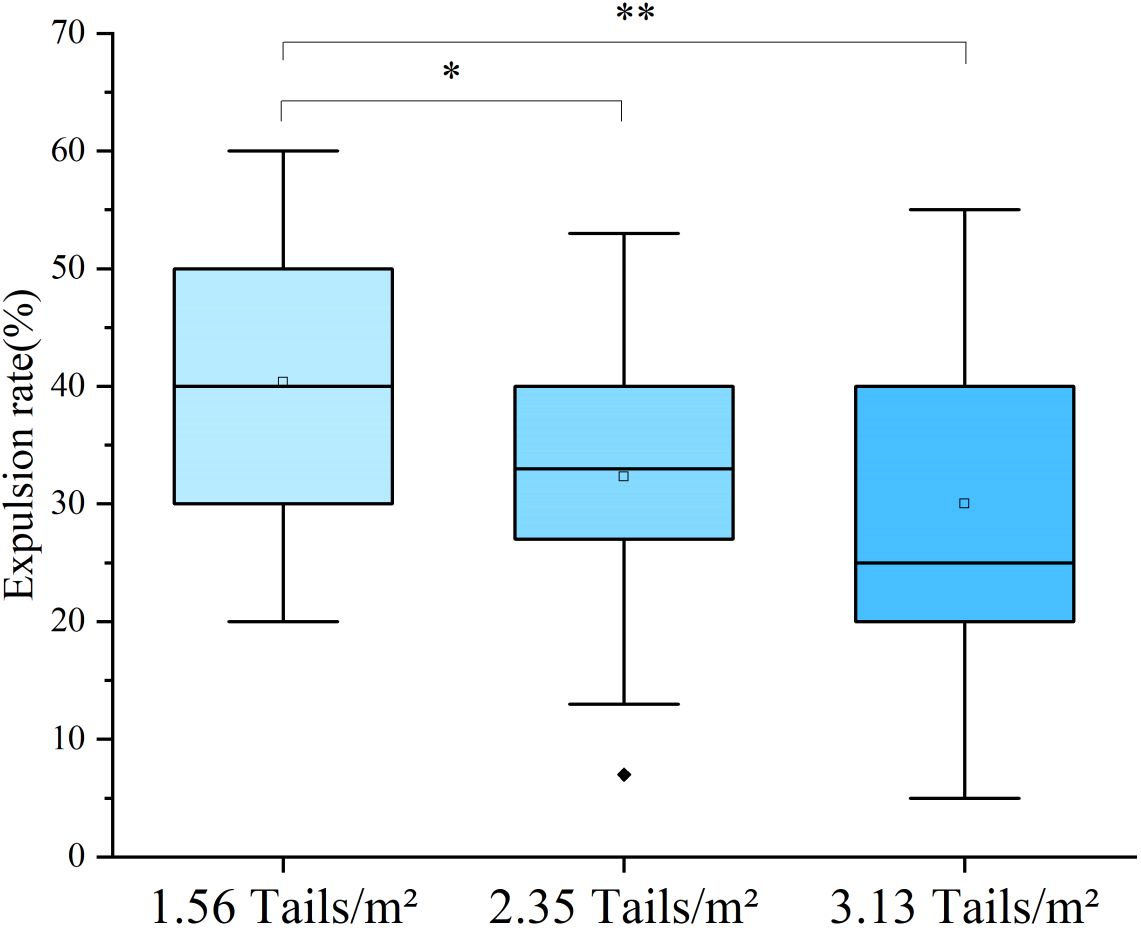
Figure 13 Comparison of fish expulsion rate under three kinds of fish density. * indicate significant differences at P< 0.05, ** indicate significant differences at P< 0.01.
The highest fish expulsion efficiency was observed when the air density is 180 L/min and the fish density is 1.56 tails/m2, with an expulsion rate as high as 53% at the 9th minute (Figure 14). Furthermore, the highest two expulsion distances occurred at approximately 4-5 minutes when the air volume was 180 L/min and the fish density was 1.56 tails/m2 (Figure 15). The average expulsion distance of fish reached above 3.0 intervals, with the highest at 3.3 expulsion intervals. Additionally, under the condition of 120 L/min air volume and a fish density of 1.56 tails/m2, the average fish drive rate exceeded 3.0 in 6-7 minutes, as shown in the same figure.
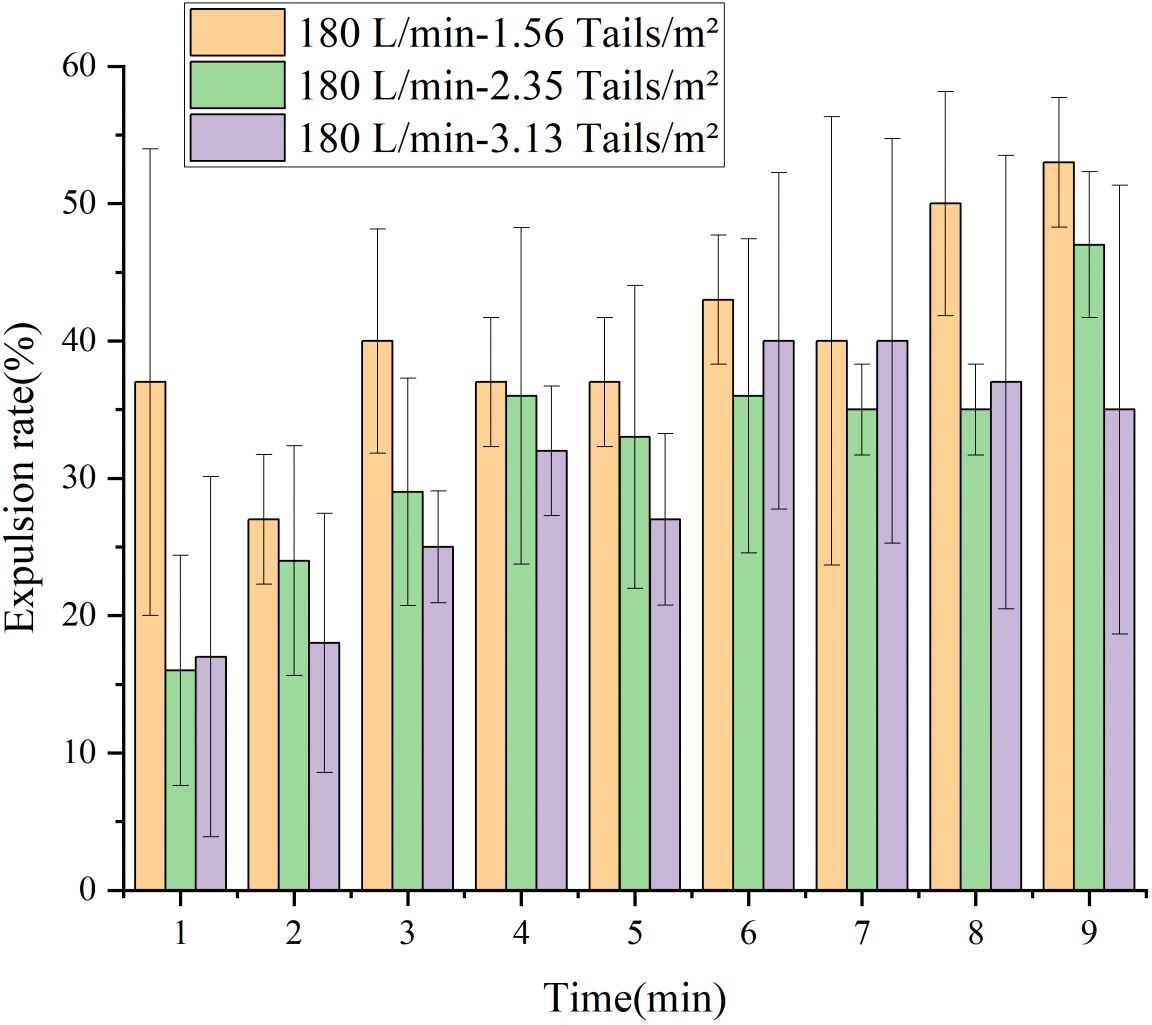
Figure 14 Fish expulsion rates of different individual density and time periods.
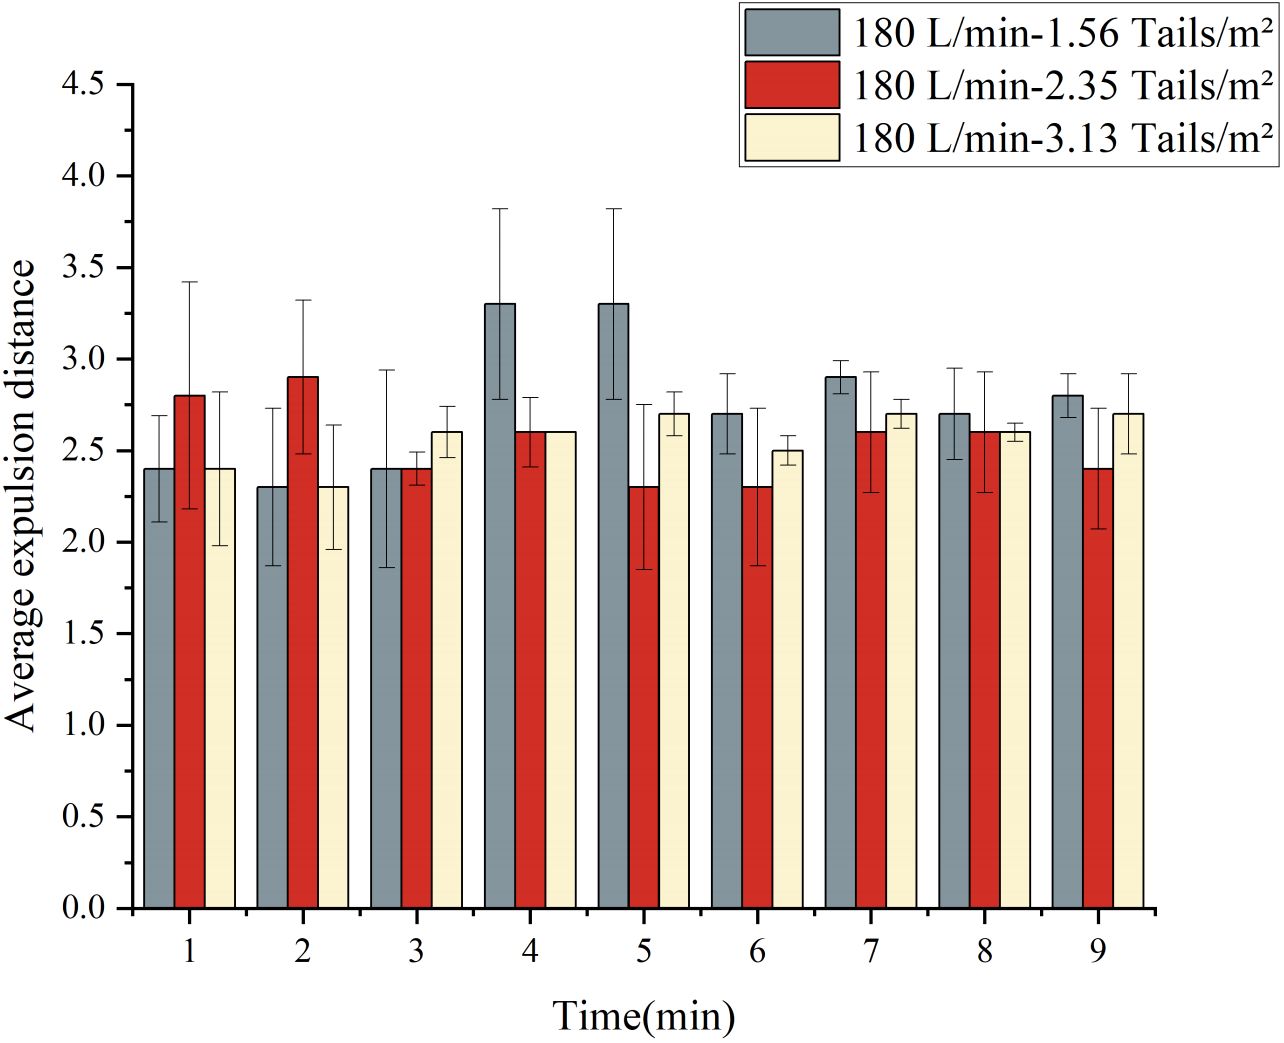
Figure 15 Average expulsion distance of fish under three kinds of bubble curtain working conditions and different time periods.
This study investigated the expulsion effect of different working conditions, using three expulsion modes of light, sound, and bubble curtain, on Hexagrammos otakii. The results revealed that the bubble curtain method exhibited the most effective expulsion of Hexagrammos otakii, particularly when the fish density was at 1.56 tails/m2 and the bubble curtain air volume was set at 180 L/min. This configuration achieved an overall expulsion rate of (40.4 ± 12.0) %, with the highest expulsion rate reaching 53% and an average expulsion distance of 3.0 intervals. Additionally, at fish densities of 2.35 and 3.13 tails/m2 under the same air volume, the expulsion rates exceeded 30%. Conversely, the expulsion effect of light and sound was found to be less pronounced, with expulsion rates not exceeding 20%. The experimental outcomes for the bubble curtain indicated a positive correlation between air volume and expulsion effect, with the expulsion effect being more pronounced at lower fish densities and gradually decreasing as fish density increased. This was attributed to the weak aggregation effect at low density, enhancing the expulsion effect of the bubble curtain. Furthermore, in the light experiment, blue light demonstrated a more significant expulsion effect on fish schools compared to white and green light. However, the expulsion rate of fish schools did not significantly differ with variations in blue light’s illumination intensity.
The experiment revealed that not all individual fish exhibited a repellant response to blue light; in fact, some fish remained facing the light source for an extended period without moving. This indicates that the expulsion effect of light on this fish species is influenced by individual differences. Furthermore, the results from the sound experiment demonstrated that sound frequency had a more pronounced expulsion effect on Hexagrammos otakii compared to sound pressure level. Specifically, low frequency sound had a greater impact than high frequency sound. Additionally, the fish’s response to the sound showed irregularities, with some individuals moving away from the sound source after a period of time. This phenomenon was observed across all control groups in each experiment, suggesting that the expulsion effect of the sound conditions on the fish species may be limited.
According to experimental observations, Hexagrammos otakii, a benthic reef fish species, manifests predominantly sedentary behavior, often congregating in the corners of the tank, with a small proportion engaging in free swimming. When two or three individuals gather, they exhibit circular movements and occasional swimming, whereas larger groups display lower levels of activity. Upon exposure to stimuli, such as light, sound, and a bubble curtain, Hexagrammos otakii demonstrates varying degrees of responsiveness. Particularly, their reaction to the bubble curtain is distinct, as it elicits an accelerated swimming speed and variable direction. Conversely, light and sound seem to have minimal effects on their stimulation. Researchers have proposed that the impact of a bubble curtain on fish schools can be categorized into passive and active modes. The passive mode refers to the circulation formed by the bubble curtain in the tank. The active mode, on the other hand, involves the perception of the shape and vibration of the bubble curtain due to its strong explosive force, resulting in a pronounced stress response and expulsion. Observations from light and sound experiments indicate a less obvious response of Hexagrammos otakii to these stimuli. Scholars have noted that the effects of light and sound on fish primarily manifest in their growth and physiology, rather than in their behavior (Huang et al., 2022; Wei et al., 2023). This may elucidate why the bubble curtain demonstrates the most effective expulsion, while light and sound exhibit comparatively weaker effects.
The implementation of this study still has several deficiencies that need to be addressed. In the bubble curtain experiment, the study only considered the expulsion effect of air volume on fish, neglecting the potential impact of factors such as pore size and hole distance, which could yield different expulsion effects. Therefore, it is imperative to conduct further experiments to optimize the bubble curtain in the future (Ma et al., 2016; Zhou et al., 2023). In the sound experiment, the study only investigated frequencies ranging from 150 to 450 Hz and sound pressure levels from 130 to 150 dB. However, it is crucial to note that different fish species have distinct perceptual ranges of frequencies and sound pressure levels, necessitating further research on more diverse working conditions to determine whether the conditions in this study reach the hearing threshold of Hexagrammos otakii (Zhou, 2011; Wang et al., 2018). Moreover, in the light experiment, the study utilized only white, blue, and green light colors, at illumination intensities of 5000, 8000, and 10000 lx. It is worth noting that different fish species exhibit varying responses to light color, as highlighted by Liu et al. (2021), who demonstrated that rainbow trout is more adapted to blue and green light and has a certain evasive reaction to yellow and white light. Therefore, future studies should explore a wider range of light colors and intensities to encompass the diversified responses of different fish species.
The original contributions presented in the study are included in the article/supplementary materials, further inquiries can be directed to the corresponding author/s.
The animal studies were approved by Animal Research and Ethics Committees of Ocean University of China. The studies were conducted in accordance with the local legislation and institutional requirements. Written informed consent was obtained from the owners for the participation of their animals in this study.
LD: Formal Analysis, Writing – original draft, Methodology. ZZ: Writing – original draft, Data curation. JL: Data curation, Supervision, Writing – review & editing, Writing – original draft. JC: Methodology, Supervision, Writing – review & editing. YZ: Investigation, Validation, Methodology, Writing – review & editing. WZ: Investigation, Formal Analysis, Writing – original draft. QL: Validation, Methodology, Supervision, Writing – review & editing. WB: Formal Analysis, Investigation, Resources, Writing – review & editing. RZ: Formal Analysis, Supervision, Visualization, Writing – review & editing. HX: Data curation, Writing – review & editing, Formal Analysis.
The author(s) declare financial support was received for the research, authorship, and/or publication of this article. This article was financially supported by Laoshan Laboratory (Grant LSKJ202202905).
LD, ZZ, WZ, QL, WB, and RZ were employed by China Nuclear Power Engineering Co., Ltd. JC, YZ, and HX were employed by Hainan Nuclear Power Co., Ltd.
The remaining author declares that the research was conducted in the absence of any commercial or financial relationships that could be construed as a potential conflict of interest.
All claims expressed in this article are solely those of the authors and do not necessarily represent those of their affiliated organizations, or those of the publisher, the editors and the reviewers. Any product that may be evaluated in this article, or claim that may be made by its manufacturer, is not guaranteed or endorsed by the publisher.
Bai Y. Q., Luo J., Niu J. T., Chen Q. W., Zhu H. F., Liu D. F., et al. (2013). Avoidance responses of Hemibarbus maculates and Onychostoma sima to bubble curtains with different density. J. Hydroecol. 34, 63–69. doi: 10.15928/j.1674–3075.2013.04.015
Bertucci F., Beauchaud M., Attia J., Mathevon N. (2010). Sounds modulate males’ aggressiveness in a cichlid fish. Ethology 116, 1179–1188. doi: 10.1111/j.1439-0310.2010.01841.x
Chen Y. S., Fang Z. (2010). Quo status, trend and suggestion of wind energy industry in China. Mag. Equip. Mach. 4, 14–19.
Chen D. H., Liu H. S., Hu Q. S., Wang W. D., Zhang S. Y. (2012). Attractive effect of acoustic taming on Sparus Macrocephalus in a cage. J. Shanghai Ocean Univ. 21, 554–560.
Fatmawati R., Riyanto M., Wahju R. I. (2020). Fish behavior characterization with an RGB-LED intensity based on pulse width modulation (PWM) system in fixed lift net. IOP Conference Series. Earth Environ. Sci. 584, 1–9. doi: 10.1088/1755–1315/584/1/012032
Flores-Martin N., Leighton T. G., White P. R., Kemp P. S. (2021). The response of common carp (Cyprinus carpio) to insonified bubble curtains. J. Acoust. Soc Am. 150, 3874–3888. doi: 10.1121/10.0006972
Gong D. H., Song M. Y., Cui X. J., Yin L. M., Xu P. X., Tian T., et al. (2023). Study on the effective range of sound domestication for Sebastes schlegelii. Fish. Mod. 50, 20–26. doi: 10.3969/j.issn.1007-9580.2023.03.003
Huang L. Y., Wang Y. N., Huang G. F., Liu B. (2022). Advances in research on the effects of offshore wind farm on fish welfare. J. Fish. China 46, 2226–2240. doi: 10.11964/jfc.20211113179
Ke Y., Liu X. G., Tan S. Z., Yang S., Huang Y. Z., Wei T. Q., et al. (2022). Radioactive level in Fishes and Surface Sediments from the Coastal Areas of Nuclear Power plants. Ocean Dev. Manage. 39, 91–98. doi: 10.20016/j.cnki.hykfygl.20220810.002
Kim J., Mandrak N. E. (2017). Effects of strobe lights on the behavior of freshwater fishes. Environ. Biol. Fish. 100, 1427–1434. doi: 10.1007/s10641-017-0653-7
Liu X., Huang L. Y., Liu C. D., Sheng H. X., Huang J. H., Liu Z. W., et al. (2021). Effects of light colors on behavior response, plasma cortisol and biochemical indexes of rainbow trout Oncorhynchus mykiss. J. Fish. China 45, 740–747. doi: 10.11964/jfc.20200812368
Liu X. S., Wu J. N., Han G. Z. (1990). Investigation and Division of Fisheries Resource of Yellow and Bohai Sea (Beijing: Ocean Press).
Ma D. Y., Xing B. B., Qi Y. K., Zhou J. Y., Zhuang X., Zhang G. S. (2016). Blocking effect of bubble curtains on fat greenling Hexagrammos otakii. J. Dalian Ocean Univ. 31, 311–314. doi: 10.16535/j.cnki.dlhyxb.2016.03.015
Ni Y. L., Xin H. L., Liu Y. (2009). Analysis on the development and present technology status of offshore wind power in China. Energ. Eng. 4, 21–25. doi: 10.16189/j.cnki.nygc.2009.04.013
Shafiei Sabet S., Van Dooren D., Slabbekoorn H. (2016). Son et lumiere: Sound and light effects on spatial distribution and swimming behavior in captive zebrafish. Environ. pollut. 212, 480–488. doi: 10.1016/j.envpol.2016.02.046
Shi J., Qian W. G., Tang Z. C., Han Z. X., Zhang S. (2014). Acoustic taming of dusty stingfish Sebastisous marmoratus by 150 Hz rectangular interval sound. J. Dalian Ocean Univ. 29, 514–519.
Song C., Liu H. Z. (2006). The development and trend of wind power plant at sea. Elec. Pow. Sur. Des. 2, 55–58.
Wang Y. N., Yu J. N., Zhuang X., Li H. Q., Liu H. C., Yu X. M., et al. (2018). Auditory sensitivity in crucian carp Carassius auratus Linnaeus. J. Dalian Ocean Univ. 33, 775–781. doi: 10.16535/j.cnki.dlhyxb.2018.06.015
Wei Y. C., Wang Y. N., Wang W., Wang W. J., Gu Y. X., Zhang Z., et al. (2023). Effects of photoperiod on growth, lipid metabolism and antioxidant enzyme activities of Hexagrammos otakii. Chin. Fish. Qual. Stand. 13, 10–16. doi: 10.3969/j.issn.2095–1833.2023.05.002
Zhang J. L., Li S. Y. (2018). Current situation and future development trend of offshore wind power industry. Wind Eng. 10, 48–52.
Zhou M., Huang L. Y., You X. X., Lan G. H., Li Y. Y., Liu X. (2023). Obstructing effect Of bubble curtain on rainbow trout (Oncorhynchus Mykiss). Acta Hydrobiol. Sin. 47, 2003–2010. doi: 10.7541/2023.2022.0403
Keywords: light, sound, bubble curtain, Hexagrammos otakii, fish behavior
Citation: Dai L, Zhang Z, Liu J, Chen J, Zhang Y, Zhang W, Li Q, Bai W, Zhang R and Xiao H (2024) A study of the effects of light, sound, and bubble curtains on the expulsion effect of Hexagrammos otakii. Front. Mar. Sci. 11:1384046. doi: 10.3389/fmars.2024.1384046
Received: 08 February 2024; Accepted: 18 April 2024;
Published: 28 May 2024.
Edited by:
Wei Huang, Ministry of Natural Resources, ChinaReviewed by:
Yazhou Jiang, Chinese Academy of Fishery Sciences, ChinaCopyright © 2024 Dai, Zhang, Liu, Chen, Zhang, Zhang, Li, Bai, Zhang and Xiao. This is an open-access article distributed under the terms of the Creative Commons Attribution License (CC BY). The use, distribution or reproduction in other forums is permitted, provided the original author(s) and the copyright owner(s) are credited and that the original publication in this journal is cited, in accordance with accepted academic practice. No use, distribution or reproduction is permitted which does not comply with these terms.
*Correspondence: Rongyong Zhang, emhhbmdyeWNAY25wZS5jYw==; Jinhu Liu, bGl1amluaHVAcWRpby5hYy5jbg==
Disclaimer: All claims expressed in this article are solely those of the authors and do not necessarily represent those of their affiliated organizations, or those of the publisher, the editors and the reviewers. Any product that may be evaluated in this article or claim that may be made by its manufacturer is not guaranteed or endorsed by the publisher.
Research integrity at Frontiers
Learn more about the work of our research integrity team to safeguard the quality of each article we publish.