 Mathieu Adgé
 Jérémy Lobry
 Anne Tessier1,3
 Serge Planes
95% of researchers rate our articles as excellent or good
Learn more about the work of our research integrity team to safeguard the quality of each article we publish.
Find out more
ORIGINAL RESEARCH article
Front. Mar. Sci. , 15 May 2024
Sec. Marine Ecosystem Ecology
Volume 11 - 2024 | https://doi.org/10.3389/fmars.2024.1379331
To achieve its energy transition, the French government is planning to install floating wind farms in the Mediterranean Sea in the Gulf of Lion. In order to study the effects of such installations on the ecosystem, A trophic model was developed to study the evolution of biomass and ecological network indicators (ENA). Four scenarios were designed in order to simulate 1/the “reef effect” caused by the new hard substrate created by the wind farm structure, 2/the association of the reef effect with the reserve effect caused by the closure of the wind farm to fishing, 3/the impact of regular harvesting of sessile organisms from the hard substrate by fishermen and, 4/the impact of the transfer of these organisms to the seafloor. Our study suggests changes in the ecosystem structure and functioning after the introduction of a wind farm, where low trophic level groups became more important in the functioning of the trophic web, the ecosystem maturity decreased, and the overall activity and diversity increased. The biomass of some pelagic and demersal groups increased. Overall, the introduction of large wind farm platforms will transform the local ecosystem, enhancing the overall production which will likely provide benefits to local fisheries focused on higher trophic level groups.
The third part of the IPCC’s (Intergovernmental Panel on Climate Change) sixth assessment report (Riahi et al., 2022) once again insisted on the need for a rapid and profound energy transition: “Warming cannot be limited too well below 2°C without rapid and deep reductions in energy system CO2 and GHG emissions”. In this context, in 2015, the French Parliament passed a law, Loi de transition énergétique pour la croissance verte, n° 2015-992, stating that by 2030 the share of renewable energies should reach 40% of the final energy production. Following the passing of the law, multiple calls for projects were launched in support of various forms of renewable energy production, including fixed and floating offshore wind power. In total, twelve wind farm projects were awarded in France: five projects in the Channel and North Sea, four in the Atlantic Ocean and three in the Mediterranean Sea. All three Mediterranean projects are based on the deployment of floating wind turbines, a decision that was made based on two main criteria. First, wind farms must be invisible from the coast for socio-economic reasons (Bishop and Miller, 2007; Ladenburg, 2009; Westerberg et al., 2013) mainly to avoid conflict with tourism activities and local residents (Westerberg et al., 2013). Second with the rapid drop in bathymetry (Roddier et al., 2010) in the Gulf of Lion, only floating wind turbines are possible. An experimental phase that included three separate pilot projects, each of which consisted of three wind turbines per project, off the coast of Gruissan, Leucate and Port-Saint-Louis-du-Rhône, is expected to be launched in 2024. Based on the result of this experimental phase, two commercial farms of 25 wind turbines should then be built in the Gulf of Lion. It is certain that a project on such a large scale raises questions about the potential environmental impacts of floating wind turbines, which are currently poorly documented.
While data on floating wind turbines are scarce, they are more common for bottom-fixed wind turbines, but they may only partially reflect the environmental impacts of floating wind turbines due to the different positioning of foreing structures in the water column. During the construction phase, the distribution and composition of sediments is affected (Dannheim et al., 2020; Benhemma-Le Gall et al., 2021), Cliquez ou appuyez ici pour entrer du texte.; noise pollution creates stress for fish and mammals that likely leave the area (Debusschere et al., 2016; Benhemma-Le Gall et al., 2021). During the operation phase, wind turbines are a danger to birds due to collisions with the blades (Furness et al., 2013; Cook et al., 2018). Noise from the turbine leads to behavior changes of some fishes (Su et al., 2020; Niu et al., 2021). To protect metal structures from corrosion, sacrificial anodes are often added. Thus, over time, metal concentrations in the water around the site are expected to increase (Huang et al., 2017; Khim et al., 2018). Their impacts are expected to be low on fish (Fonseca et al., 2017) but high on zoobenthos communities (Esteban et al., 2022; Leleyter et al., 2016). The cables may influence fish movements due to magnetic field emissions (Tricas and Gill, 2011; Gill et al., 2014; Hutchison et al., 2020). However, the main impact of wind turbines will be the introduction of a new substrate (Petersen and Malm, 2006) which may lead to changes in floating and benthic communities (Coates et al., 2014; Lu et al., 2020). The biofouling that develops on the structure is mainly composed of bivalves, algae and small crustaceans (Joschko et al., 2008; Bray, 2017; Higgins et al., 2019). This so-called “reef effect” can be seen as negative, particularly because it can provide a habitat for invasive species (Langhamer, 2012).
In most cases, however, the installation of primary consumers leads to an increase in the density and biomass of fish (Lindeboom et al., 2011; Reubens et al., 2014; Wang et al., 2019). As an example, cod seem to benefit from the monopile wind farms in the North Sea (Lindeboom et al., 2011; Reubens et al., 2014). In addition to the reef effect, the introduction of a wind farm is typically accompanied by the partial or total closure of fishing within the wind farm area. This phenomenon is known as “the reserve effect”, as this reduction in fishing leads to the creation of a sort of Marine Protected Area (MPA) that can drive an increase in biomass and species diversity (Harmelin-Vivien et al., 2008; Valls et al., 2012; Giakoumi et al., 2017). Beyond the potential effects on the different ecological communities, the predicted ecosystem impacts of wind farms must also be considered at the scale of the entire food web.
Recently, Raoux et al. (2017) proposed an innovative way to investigate the potential impacts of offshore wind farms on food webs by implementing a mass-balanced modeling approach using the Ecopath with Ecosim (EwE) modeling suite (Christensen and Walters, 2004; Christensen et al., 2008). The EwE models allow for the food web as a whole to be studied, for its functioning and structure to be characterized and for changes over time to be detected, a process which can also integrate the influence of future climate change (Serpetti et al., 2017; Nogues et al., 2021; le Marchand et al., 2022), fisheries (Piroddi et al., 2017) and changes associated with the implementation of monopile wind turbines (Raoux et al., 2019; Nogues et al., 2021, 2017; Wang et al., 2019). In association with EwE modeling, (Ulanowicz, 1986) indices derived from Ecological Network Analysis (ENA - Ulanowicz, 1986) can be calculated to quantify changes in the functioning and structure of the ecosystem (Raoux et al., 2017; Raoux et al., 2019; Nogues et al., 2021; le Marchand et al., 2022). Until now, to the best of our knowledge, two trophic models on floating wind turbines have been developed. (Serpetti et al., 2021) developed an Ecospace model to study the impacts of Multi-Purpose Platforms (including aquaculture activity, wind turbines, wave device converters and solar panels). About the offshore wind turbine, they studied the impact of low-frequency noise and did not explore the “reef-effect” aspect. Le Marchand (2020) studied the DCP effect of a floating wind farm in the Bay of Biscay. In general, we would expect the overall trends from the EwE modeling to be very similar to those observed for monopiles, though the areas that can be colonized by floating wind turbines are not in the same stratum in the water column as for monopiles, and will be much larger. In addition, by affecting another stratum, floating will impact pelagic groups more than benthic groups as Le Marchand (2020) suggested.
The objectives of this study were to simulate the impacts of floating wind turbines in the Gulf of Lion marine food web. The study of floating wind turbines has inevitably led to the use of new modeling methods and scenarios. Using an innovative approach based on Ecopath modeling, a mass-balanced static model was created in order to simulate the implantation of the wind turbines with the addition of biofouling groups. Simulation-derived scenarios of 30 years were created to study the effects of the most commonly considered management methods for wind farms and floating buoys. The first scenario modelized the reef effect. The second scenario modelized the combination of the reef effect and the reserve effect modeled by closing the wind farm to fishing. The third scenario modelized the combination of the reef effect and regular scraping of the biofouling groups to maintain initial buoyancy of the structure. The last scenario modelized the combination of the reef effect, regular scraping of the biofouling groups and the transfer of the scraped biomass to the seafloor. Effects of the different scenarios on the trophic web were studied using the evolution of biomasses and ENA indicators. A specific effort was made to quantify the sensitivity of the results to the input parameters of the biofouling groups by using the plugin permitting to use Monte Carlo simulation in EwE.
The future floating wind farm studied in this paper will be implanted in 2025 in the Western Mediterranean Sea, about 18 kilometers off the coast of Gruissan (Aude, France) and about 30 kilometers from the edge of the continental shelf (Figure 1). The depth in this area varies between 60 to 70 meters. The substrate in this area is essentially muddy (Hamdi et al., 2010). According to IFREMER SIH data about landings, the main commercial species in the study area are Engraulis encrasicolus, Octopus spp., Scomber scolias, Scomber scrombus, Diplodus spp.,.
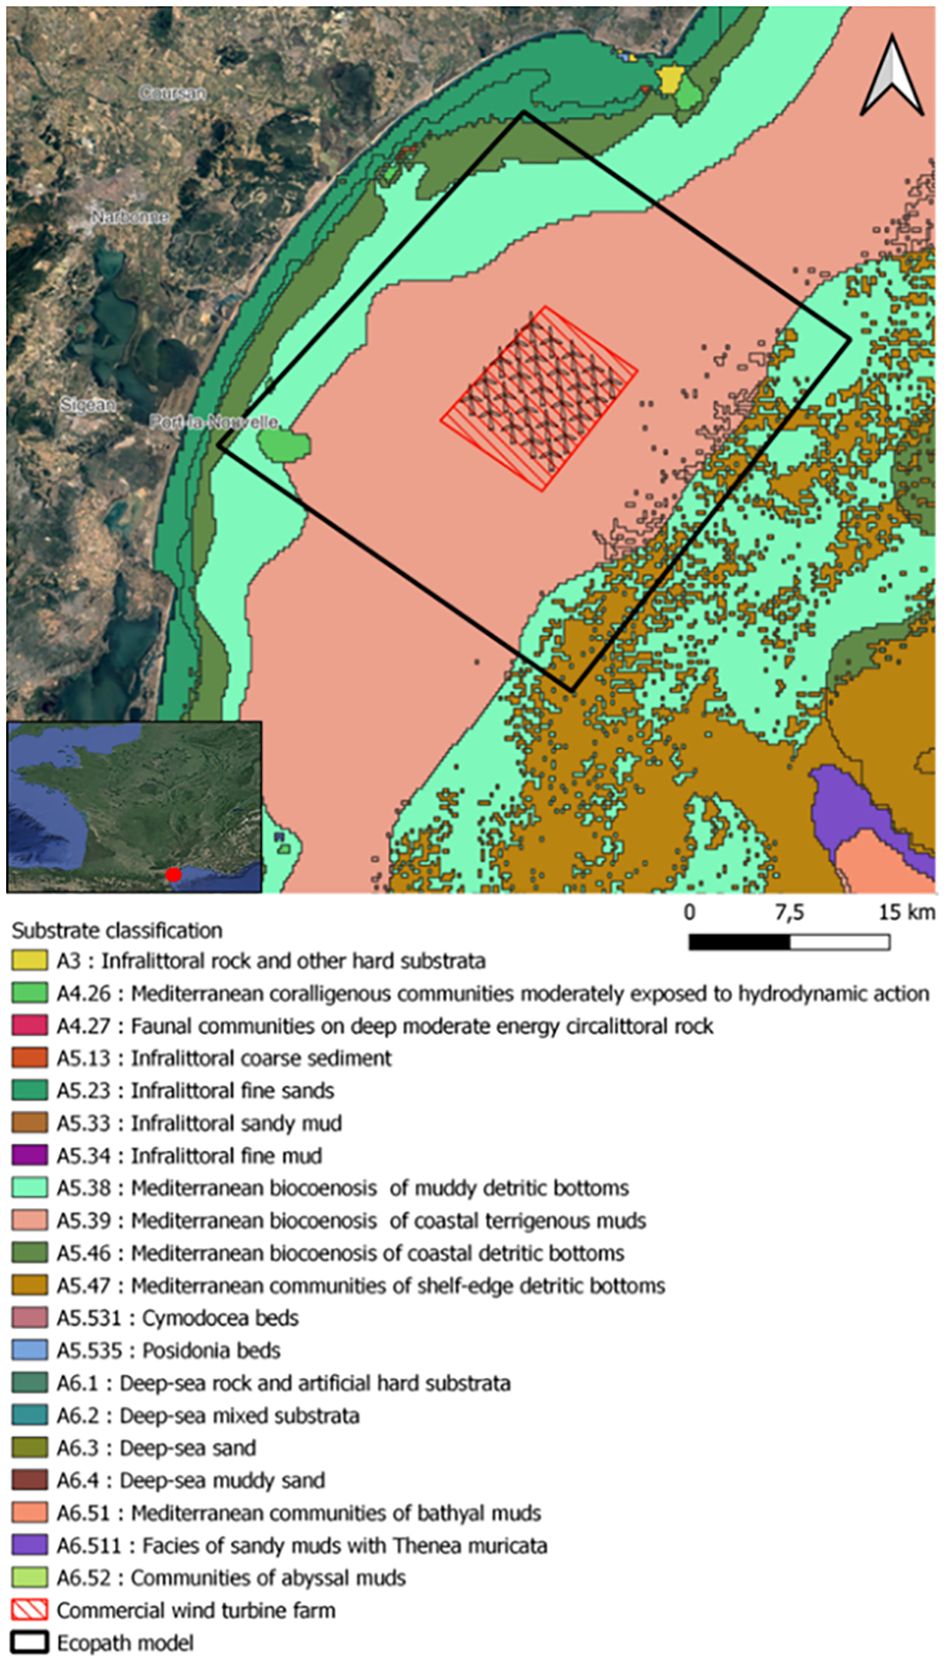
Figure 1 Position of the potential commercial wind farm in the Gulf of Lion, types of substrates (Hamdi et al., 2010). The polygon with red hatched lines represents the potential position of the commercial wind farm. The polygon with black line represents the spatial coverage of the Ecopath model. The red dot shows the location of the wind farm compared to France territory.
The EolMed pilot project, developed by Qair SA, started in 2016, involves the installation of three wind turbines producing a total power of 30 MW. The three wind turbines should be built by the end of 2024. The top of the tower of the wind turbine is located at about 100 m above the surface. The blade is about 80 m long. The wind turbine has a rotor diameter of 160 meters. The originality of this project is based on its floating foundation. This structure has a square shape with a central damping pool, which dampens the movements of the swell. The dimensions will be 49 m long, 49 m wide and will reach an underwater depth of 13 m. The turbine will be anchored by a maximum of 8 anchor lines. After this pilot project, a commercial wind farm park, composed of 25 wind turbines (Figure 1), is planned. The commercial wind farm (i.e. with 25 wind turbines and floating systems based on the design of the actual EolMed pilot project) was used as the focus of our this study. The spatial scope of this park, 100 km², will allow to create food web models of equivalent size to those found in the literature on wind turbines (Raoux et al., 2019, 2017; Wang et al., 2019).
Ecopath and Ecosim parameters and equations are presented in the Appendix A.
An initial Ecopath model was calibrated for the year 2019 corresponding to the year initial timing for the implantation of the wind farm, though due to several delays, this timeframe has now been shifted to 2025.
Species clustering in each of the functional groups included in the Ecopath model was based on their habitat, food preference, size and commercial importance. The final food-web model contained 27 functional groups (1 marine mammal, 1 seabird, 13 teleost fishes, 2 cartilaginous fishes, 5 invertebrates, 2 zooplankton, 1 phytoplankton, 1 alga and 1 detritus) (Figure 2).
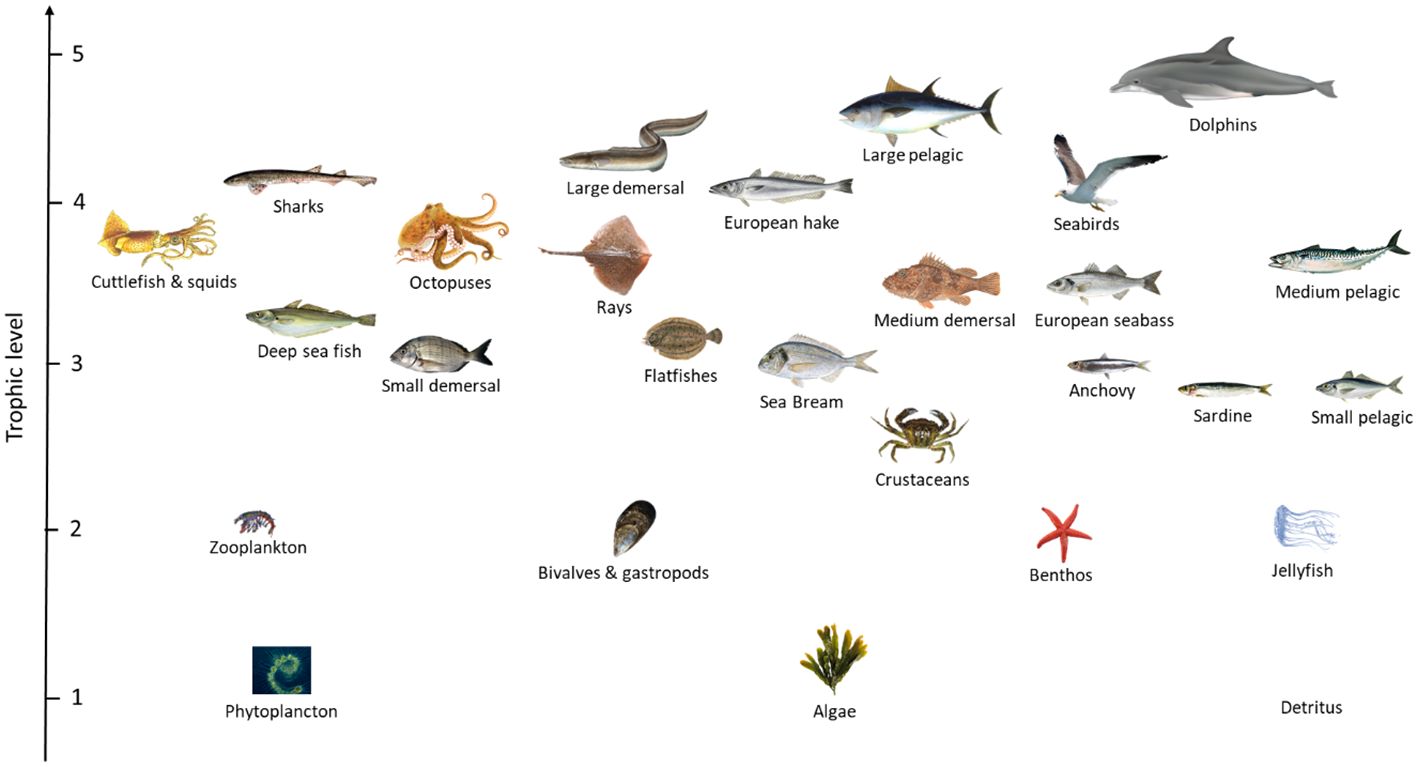
Figure 2 Food web illustration of the Gruissan ecosystem. The y-axis represents the trophic level of each functional group. The food web presented corresponds to the initial food web before the wind turbine installation.
Input parameters were obtained from available data from published articles or from sampling campaigns conducted by IFREMER (the French Institute for the Exploitation of the Sea) and PELAGIS (French observatory of marine mammals and birds). Pre-processing was carried out in order to select the species presented in the vicinity of the implantation area, to transform the unit of measurement to the unit used in EwE (biomass/km²) and to group species into functional groups to obtain biomass for each functional groups. Final data are summarized in Table 1 (more detailed information are gathered in Appendix B). Biomass values were obtained from the MEDITS campaign (Jadaud and Certain, 1994), the PELMED campaign (Bourdeix and Hattab, 1985), and the PELAGIS campaign (Laran et al., 2011). Production/biomass and consumption/biomass ratios were taken from the literature or obtained from empirical equations using asymptotic length, asymptotic weight and growth data (Nilsson and Nilsson, 1976; Banse and Mosher, 1980; Innes et al., 1987; Opitz, 1996; Pauly, 1980; Palomares and Pauly, 1998). Diet composition (Table C1) was obtained by compiling published information primarily in the Mediterranean Sea. Assimilation rates were obtained from a published model (Coll et al., 2007; Bǎnaru et al., 2013). For almost every Ecopath model, many species have a part of their life cycle outside of the model area (Christensen et al., 2008). Two options are proposed to manage this issue by Christensen et al. (2008): 1) ‘diet import’ approach which consists of setting the diet import proportion to the proportion of time spent outside of the model area; 2) ‘model expansion’ approach which adds functional groups in order to represent the outside food web structure. The first option was chosen then a proportion of the diet composition (Table C1) of these groups as imports to the ecosystem was added. Principal fishing activities present in the area were included in the Ecopath model: bottom trawling, pelagic trawling, seine, longline and other types of fishing. Fishing data were obtained from the IFREMER SIH. An index of confidence to the data (pedigree) was associated to each data (Christensen et al., 2008). Values of pedigree index are provided in Table C2.
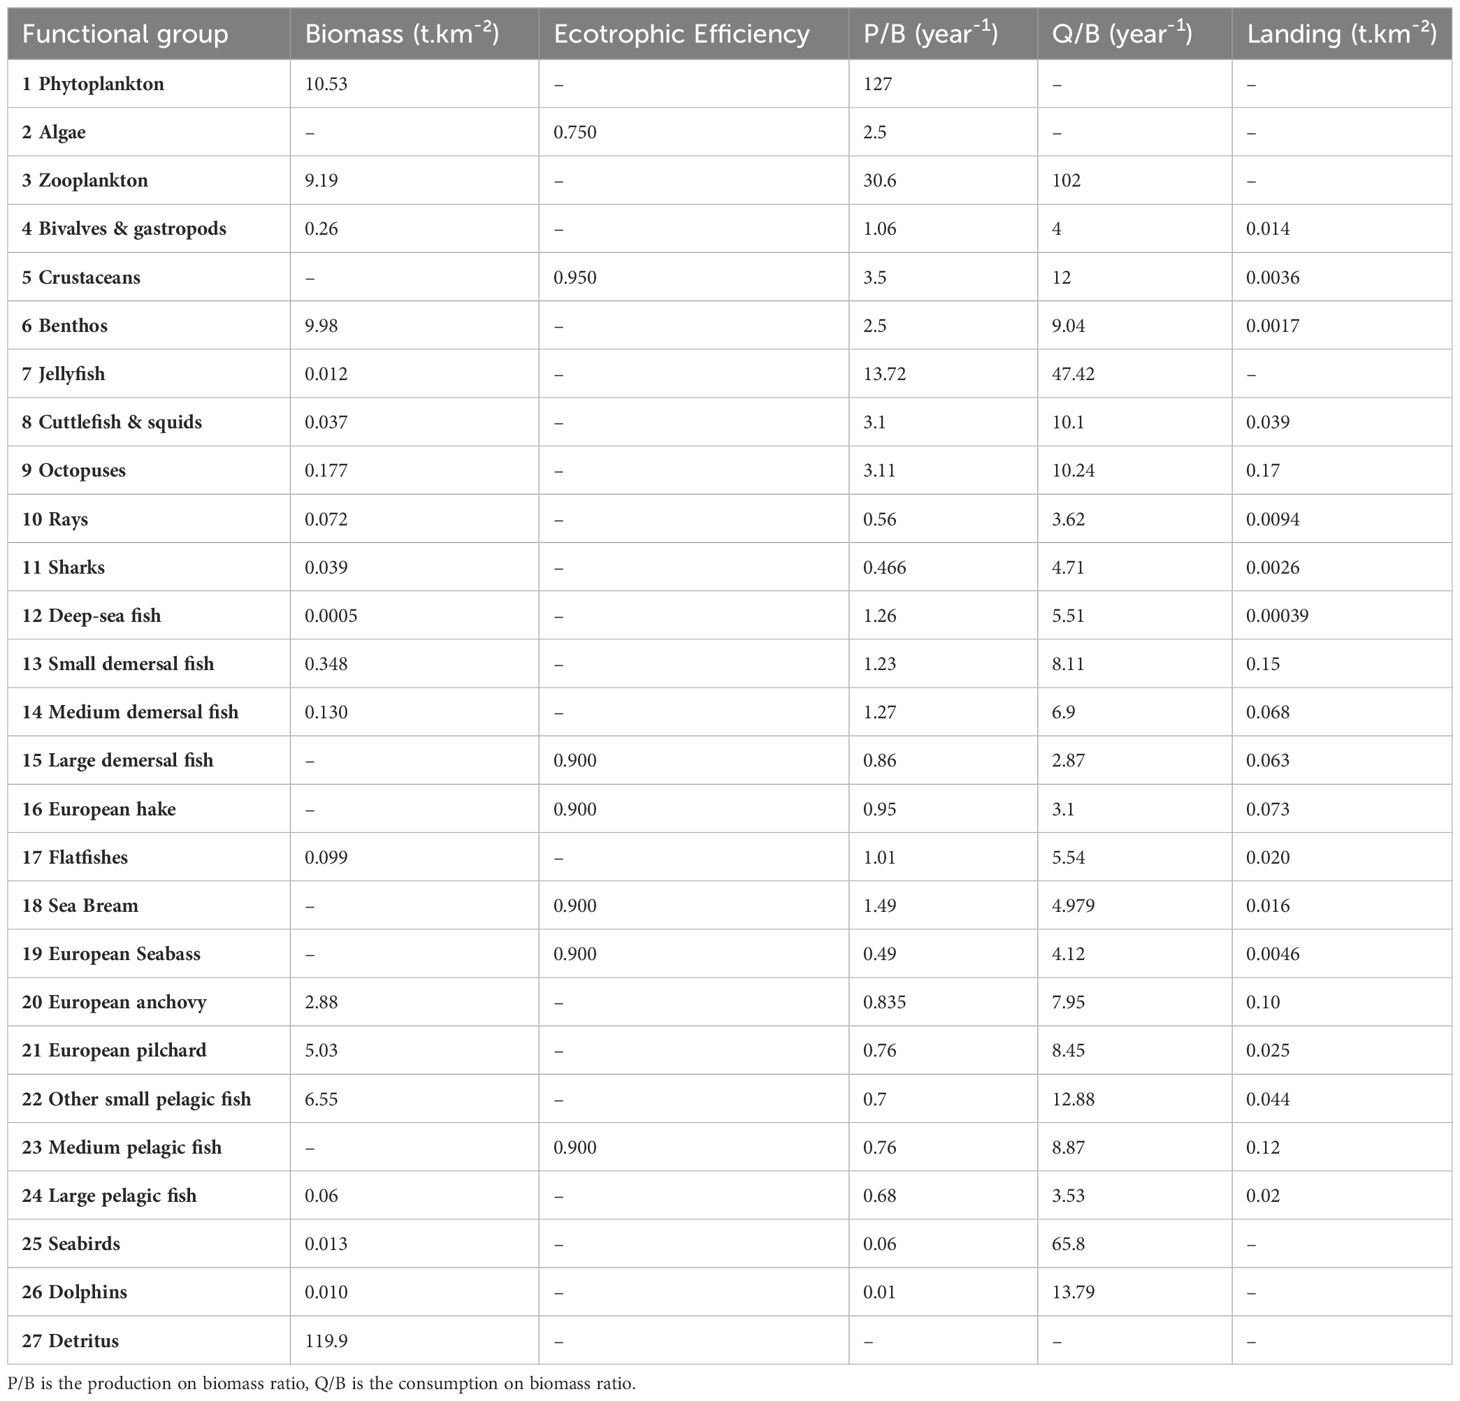
Table 1 Input parameters of the BOWF model, (i.e. representing the situation Before Of the Wind Farm installation).
Balancing an Ecopath model requires compliance with certain constraints. Physiological and thermodynamic rates for each functional group must be respected (Heymans et al., 2016): (1) EE values must be inferior to 1, (2) P/Q for consumers must be between 0.05 and 0.3 and (3) R/B must be between 1 and 10 for fish groups (Christensen et al., 2008). All models were balanced using a step-by-step expert calibration procedure (Heymans et al., 2016). This means that in order to obtain a mass-balanced model, inputs (B, P/B, Q, EE and diets) were modified to satisfy the physiological and thermodynamic constraints. Procedures (Method D1) and results (Figures D2, D3) of the balancing step are provided in Appendix D.
A preliminary step that is required before an Ecosim model can be run to explore prospective scenarios is the calibration of the model through the estimation of a vulnerability matrix that allows for variations in biomasses to be reproduced, as observed in the ecosystem (Heymans et al., 2016). Thus, in order to fit the model to historical trends, biomass and capture sampling data from 2008 and 2019 were used from the databases previously mentioned in section 2.3. An Ecopath model, HIST (Figure 3A), was created for the first year of the historical data (2008). Biomass, P/B, Q/B and EE were calculated according to the data available in 2008. If data were missing, data from our BOWF model were used. Input parameters are presented in Table 2. Data used to fit to biomass historical trends are presented in Appendix E. The strategy used to fit to time series thanks to the estimation of vulnerabilities was a “predator” search strategy meaning that a vulnerability value was set for each predator and not for each “predator-prey” relationship.
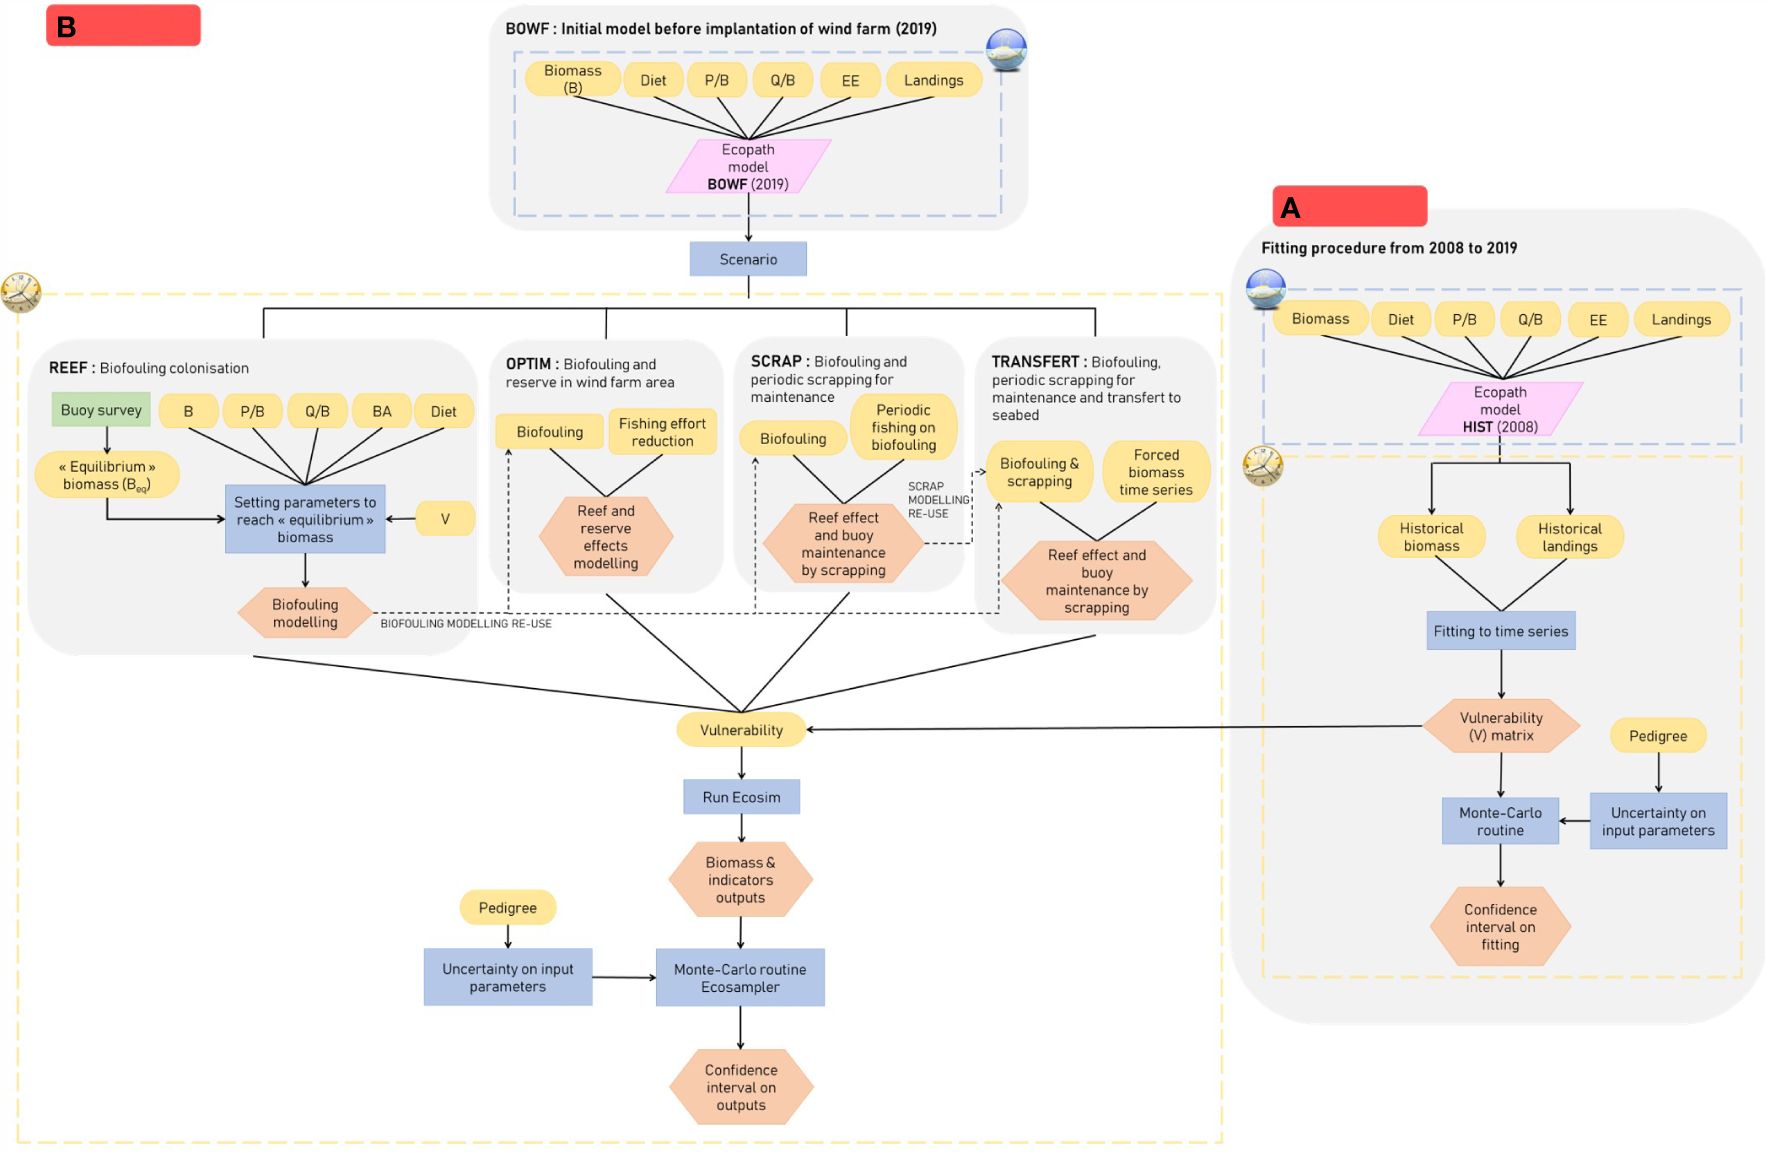
Figure 3 Workflow the different stages from the building of the initial models of 2019 (BOWF) to the development of the scenario (REEF, OPTIM, SCRAP and TRANSFERT) (B) and the building of the fitting to time series model (HIST) (A).
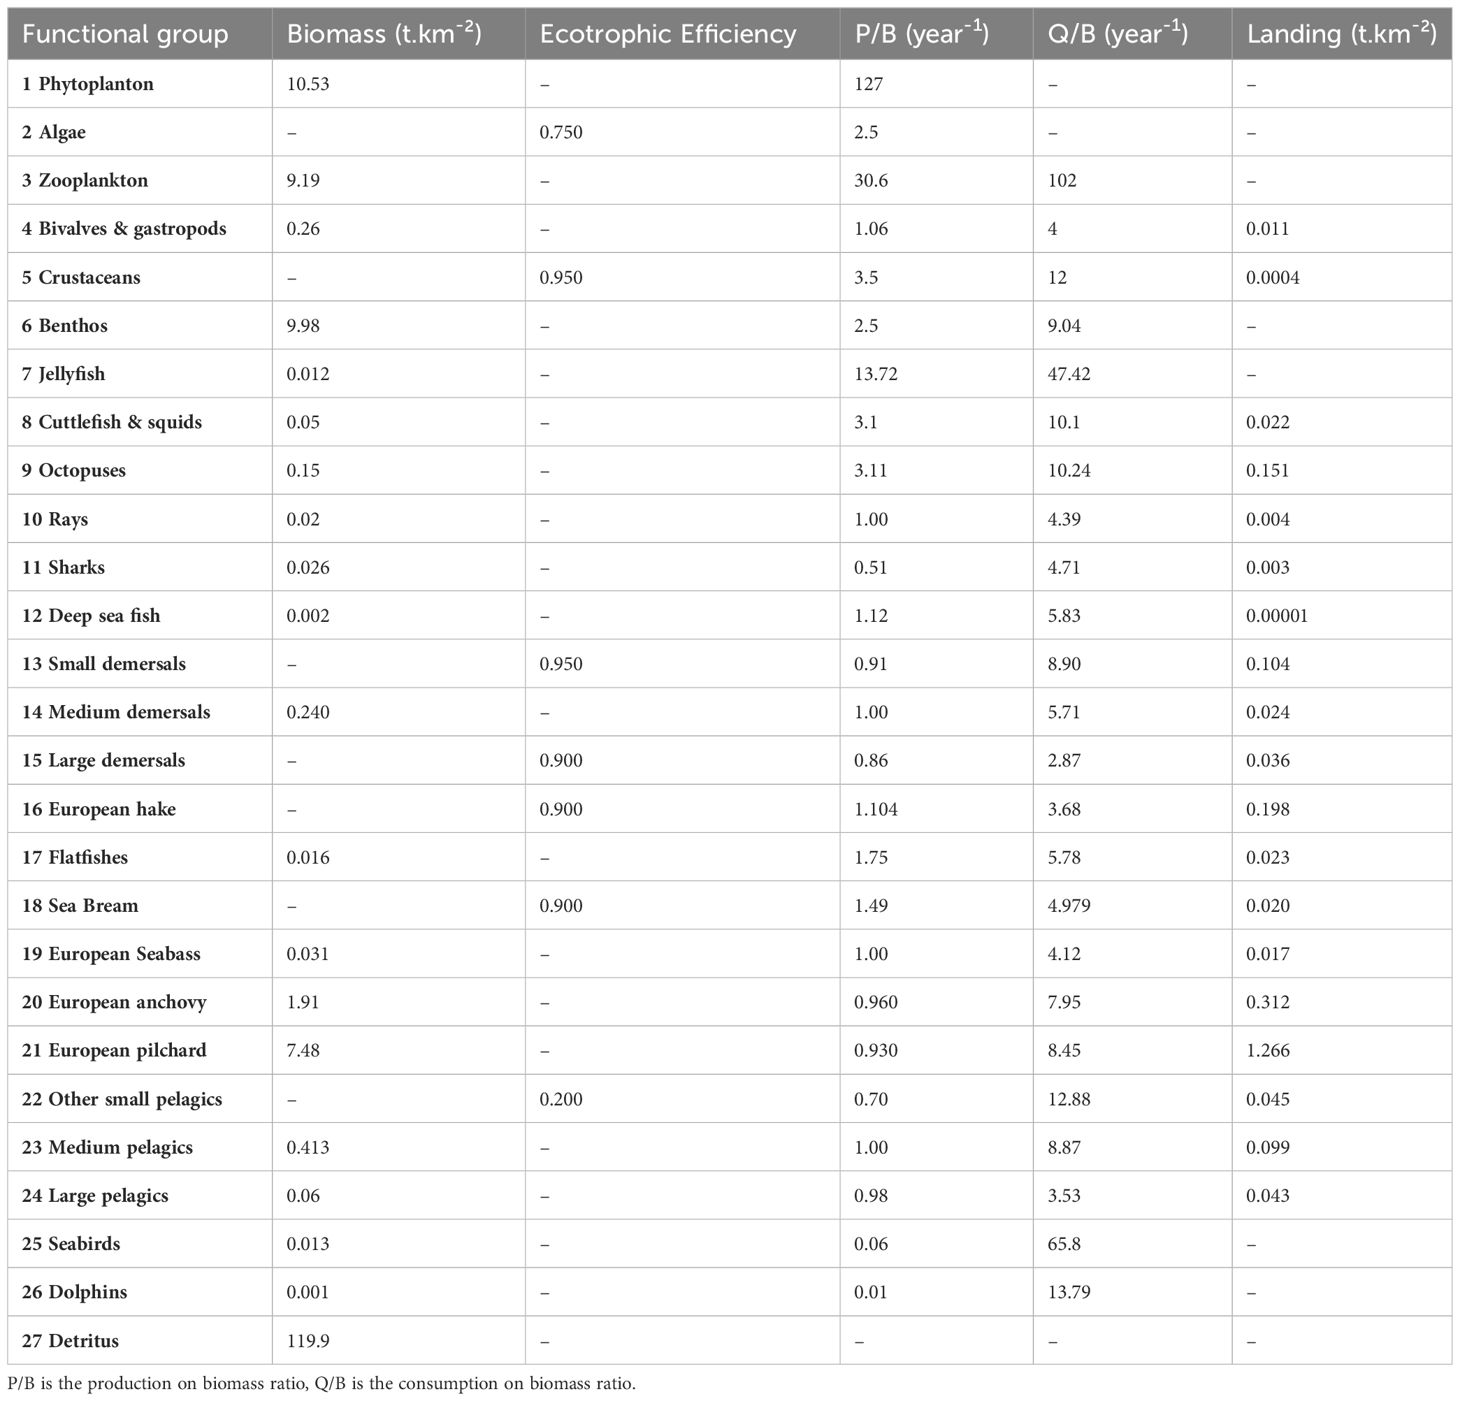
Table 2 Input parameters of the HIST model, (i.e. representing the situation for the first year of the historical data, 2008).
The fishing technique used in the MEDITS campaign does not allow for a reliable estimate of the biomass of some pelagic species. Then, admitted that biomass data for European Seabass and Medium Pelagic Fish were admitted as not reliable, then the fitting was conducted on the fishing data. No biomass data were available for Bivalves & gastropods, Crustaceans and Large Pelagic Fish; thus, fishing data were used for the fitting procedure. In order to use fishing data as reference, relative fishing effort data were used as input in the fitting procedure (Table 3). The fishing effort time series were calculated with the following formula:
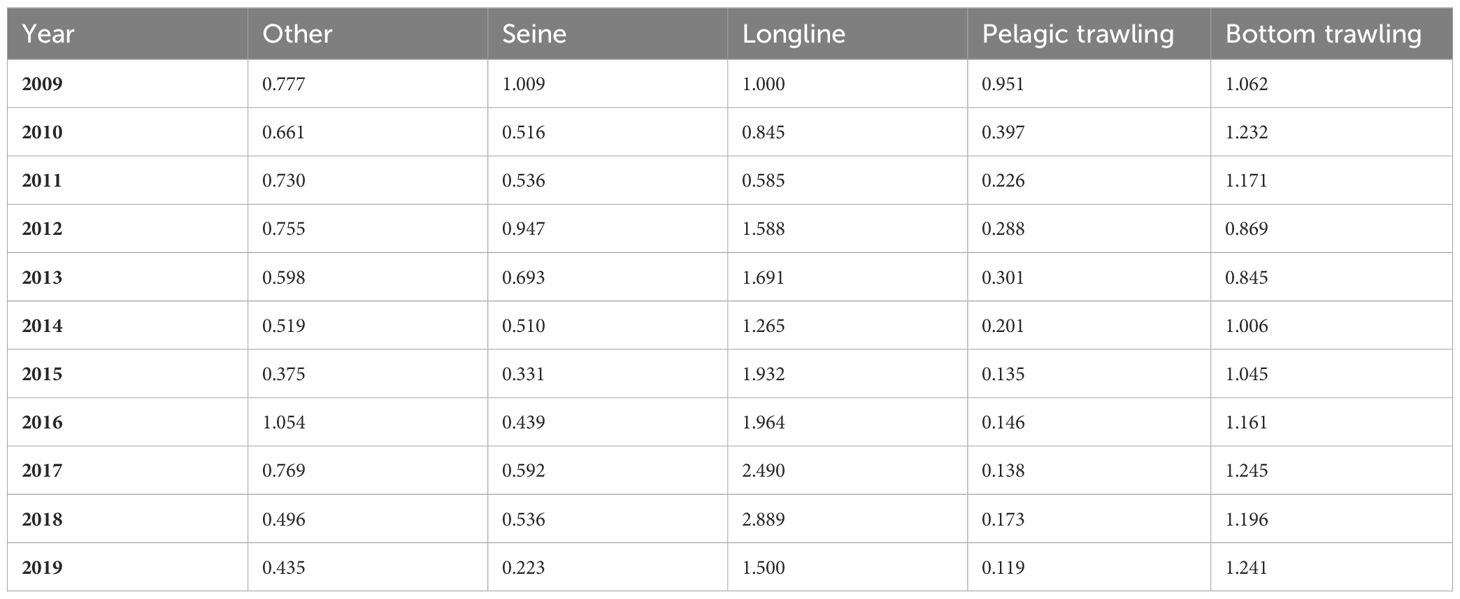
Table 3 Relative fishing effort for each fishing activities presented in the Ecopath model.
where is the power value (kWh) of the vessel for the nth year, and Technological coefficient is a factor of evolution of the power of the vessel. These factors were retrieved from (Pauly and Palomares, 2010) and presented in the Table 4. Initial power for 2008 were obtained from the EVOMED report (2011) (Sartor et al., 2011). The power for the year between 2009 and 2018 were obtained from the formula above using the n year power to calculate the n+1 year.
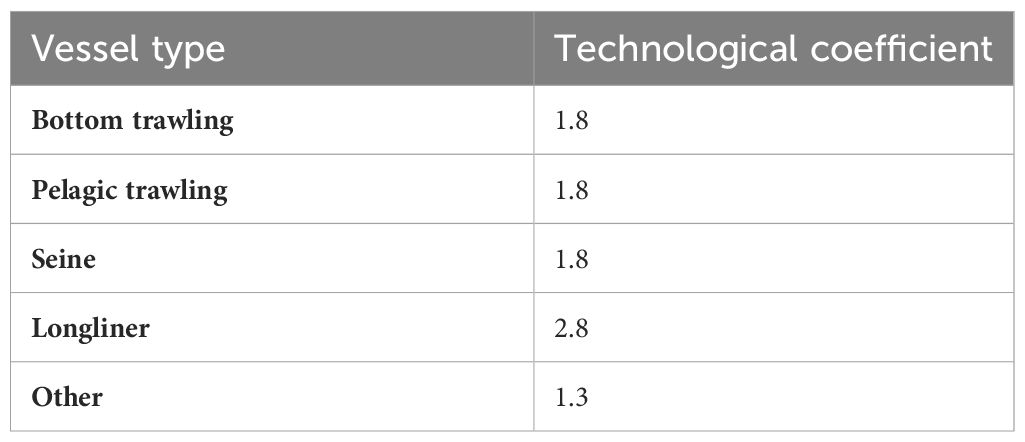
Table 4 Technological coefficients of fishing vessels by gear type used to calculate relative fishing vessel effort.
Two indicators were used to study the quality of the fit of the time series: the Akaike Information Criterion (AIC) and the Sum of Squares (SS) of deviations between model and data (Mackinson, 2013). The AIC is an indicator that penalizes fitting on too many parameters. The lower the AIC indicator is, the “better” the fitting. SS, sum of square difference, is an indicator which measures the accuracy of the fitting. A low SS indicated that the model fits well with respect to reference data.
The fitting had an AIC of 2.096 and an SS of 159.6. When comparing with other models in the Mediterranean Sea on the basis of fitting with only trophic interaction, the AIC and SS obtained seems to acceptable (Papantoniou et al., 2023; Piroddi et al., 2017; Tsagarakis et al., 2022; Vilas et al., 2021). The Monte Carlo routine was applied to assess the sensitivity of the biomass output to the input parameters (B, P/B, Q/B and EE). Input parameters were modified according to a normal distribution centered on the Ecopath input value and with a deviation parameter. In our case, pedigree index was applied to the coefficient of variation (Table F2). 500 iterations were ran, which allowed for plotting in the 5th and 95th percentile for the fitted results. These results (Figure F3) and the matrix of vulnerability (Table F1) are available in the Appendix F.
After the implantation of the wind turbine and its associated floater, the first stages of colonization of the hard virgin substrate by benthic organisms will occur (Spagnolo et al., 2014). In order to determine which organisms will most likely colonize the hard virgin substrate, the biofouling from threebuoys in the Gulf of Lion were collected and analyzed. Furthermore, a literature review on artificial hard substrate was also carried out (Joschko et al., 2008; Lindeboom et al., 2011; Salta et al., 2013; Bray, 2017; Higgins et al., 2019) to determine the most probable biofouling species and ecological succession on floating buoys. The colonizer groups will most likely be dominated by bivalves & gastropods, worms and echinoderms. Based on samplings on buoys in the Gulf of Lion, it was assumed that groups such as crustaceans would likely thrive in the structure developed by engineering groups (mostly Mytilus galloprovincialis). The distribution of fish before and after the installation of monopile OWF was used. The observations are mainly on demersal fishes, some spend a part of their life cycle around the structures (Degraer et al., 2020). However, observations of pelagic fishes are infrequent because the surface of the jacket of monopile OWFs is small and the biofouling in the pelagic zone is not relevant. Only Van Hal et al. (2017) found out that Horse mackerel (Trachurus trachurus) and Mackerel (Scomber scombrus) were abundant near a monopile OWF in the Netherlands. Because of the scarcity of literature on floating structure impacts on fish distribution (Mascorda Cabre et al., 2021), information about fish abundance around mussel farms were studied because in our opinion are close to floating structures in terms of food provision. There is clear evidence in the literature that mussel farm provides a direct food source (Callier et al., 2018; McKindsey et al., 2011) and that fish species densities increase near it especially pelagic species (Brehmer et al., 2003; McKindsey et al., 2011). Peteiro et al. (2010) and Šegvić-Bubić et al. (2011) pointed out that mussel farms are strongly affected by predation for Seabream. Šegvić-Bubić et al. (2011) studied the stomach content of Sparus Aurata near the mussel farm and found out that mussel was the dominant prey. They also observed an increase in Dicentrarchus labrax near the mussel farm. Considering all the elements found in the literature about feeding around OWF and mussel farms, it is clear that predators would prey on the groups in the floating hard substrate instead of the groups living on the bottom substrate. The main argument of this hypotheses is that opportunist pelagic groups and some demersal groups prefer feeding on the nearest prey.
In order to characterize the short-term changes that the marine ecosystem may undergo as a result of the implementation of a commercial farm in the Gulf of Lion, a decision was made to model year n+1 after the implementation of the wind turbines. This model derived from the 2019 (BOWF) model which remained unchanged except for the addition of 3 new groups present on the hard substrate, including Bivalves & gastropods hard substrate, Crustaceans hard substrate and Benthos hard substrate. To determine their biomasses, sampling data from an experimental buoy implemented in the zone of study were used (unpublished data). The biofouling on this buoy is 4 years old. It was assumed that biomass on this buoy has reached a steady state, and then these biomasses were targeted for the 5th year of our REEF Ecosim model (Beq, Figure 3B). In order to simulate “reef-effect” and fit to the biomasses sampled in the buoy, P/B, Q/B were set equal to the values of the BOWF model (Figure 3B). biomass and biomass accumulation were set randomly (Figure 3B). Then, pedigree was used (values in Table G2) from BOWF model for P/B, Q/B, and 0.05 biomass accumulation and 0.4 for biomass (highest value available in Ecopath) and ran a Monte-Carlo routine to obtain the best combination of parameters to reach the steady state value of biomass for the 5th year (Monte-Carlo parameters available in Table G3). Finally, vulnerabilities were adjusted by manual optimization to reach the steady state value of biomass for the 5th year. Input parameters for hard substrate groups are summarized in Table 5. According to the literature presented above and the diet composition matrix, the groups most likely to take advantage of the “reef effect” were: Small demersal fishes, Sea Bream, European Seabass, Medium pelagic fishes and Large pelagic fishes. A part of these groups’ diet within the bottom substrate group was replaced by the same groups from the hard substrate (Diet matrix available at Table G1). Switching power parameters from EwE were set to 2 for the groups which will most likely feed on prey from the hard substrate. This allowed to initially allocate a small portion of the predator’s diet on hard substrate groups, for which a proportion then increased with the increase prey biomass thanks to the empirical relationship implemented in the EwE software.
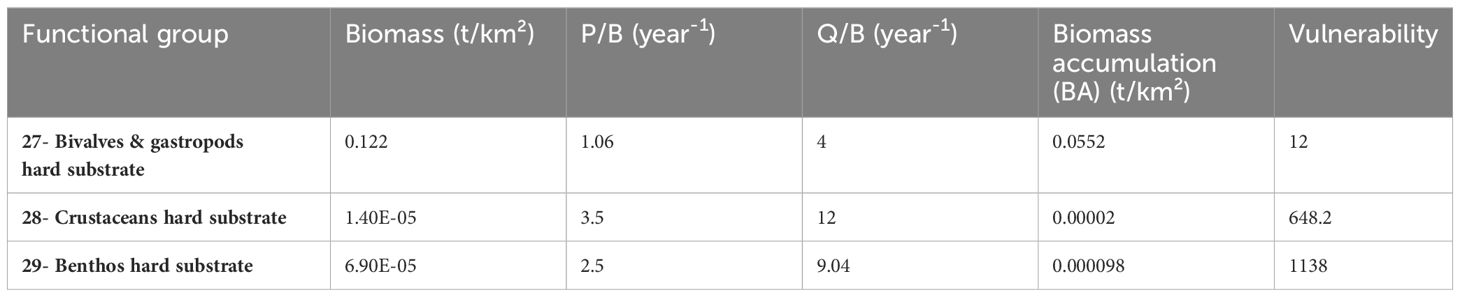
Table 5 Input parameters for the hard substrate groups in the scenario REEF.
No landings were entered for the hard substrate groups, whereas for the other groups, landings remained the same meaning that fishing is fully allowed within the OWF. Monte-Carlo routine was used to determine the sensitivity of the output parameters to the input parameters for groups on the hard substrate. The coefficient of variation for each group was obtained from the pedigree and applied to biomass, P/B, Q/B and BA. 500 iterations with the Monte-Carlo routine were performed. The Ecosampler plugin recorded every Ecopath and Ecosim model made by Monte-Carlo routine. This plugin allowed for all Monte-Carlo models that were created, to be saved, and to then extract all of the outputs which were useful for our study (Steenbeek et al., 2018). Coefficients of variation are available in Appendix G. Due to the large sample sizes, t-test and Wilcoxon’s test found an extremely low p-value even between all scenarios, for which we then selected another method of statistical analyses used by Tecchio et al. (2016) in an analysis of the differences of ENA indicators. This method is a non-parametric effect size statistic introduced by Cliff (1993):
where and are score respectively within samples 1 and 2, and are the size of the sample 1 and sample 2. This test estimates the probability that a randomly selected value in one sample is higher than a randomly selected value in the second sample minus the reverse probability (Tecchio et al., 2016). A difference scale for the Cliff index was proposed by Romano et al. (2006), negligible for < 0.147, small for < 0.33, medium for < 0.474, large for ≥ 0.474.
The installation of floating wind turbines will make it difficult to fish in the area (Bray, 2017). Thus, a model, named OPTIM, that excluded commercial fishing in the farm area, was developed.
In this model, the same input parameters were used as in the REEF scenario and the modeling procedure for the “reef effect” was also identical (Figure 3B). We assumed that the entire farm area will be closed to fishing activities and fishing efforts in the OPTIM scenario decreased linearly by 10% as wind farm represents 10% of the surface of our model. Here, we used the same method to study sensibility as was used as in REEF scenario (Figure 3B).
A large accumulation of biomass on the structure of the turbine can affect its buoyancy, at which point a scraping may be necessary. To address this issue, a scenario, named SCRAP, was built in order to simulate periodical harvest of all hard substrate groups on the wind turbine float by fishermen or a maintenance operator. Input parameters and “reef effect” modeling procedure were the same as in the REEF scenario (Figure 3B). A new fictitious fishing fleet was added to the model that only catches groups grown on the hard substrate in order to simulate the scraping of biofouling on the wind turbine float. The initial landings (Table 6A) were set low, and every five years fishing effort for this particular fleet was calibrated to increase in order to simulate harvest of the groups present on the hard substrate (Table 6B).
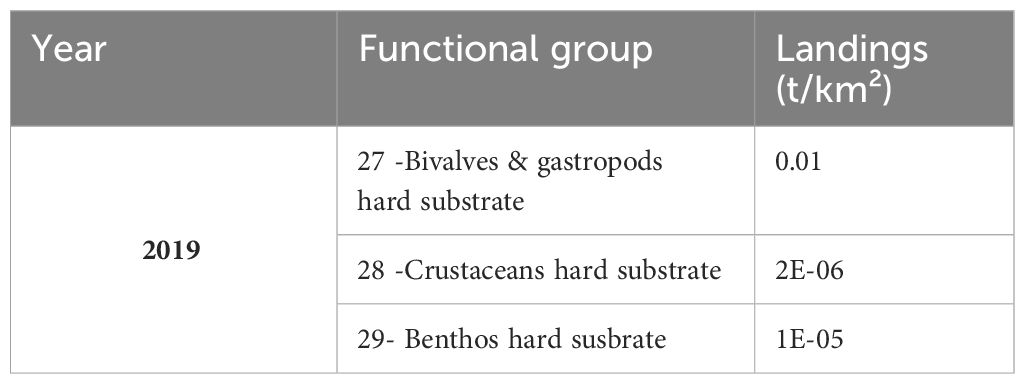
Table 6A Landings (t.km-²) for the groups on the hard substrate.
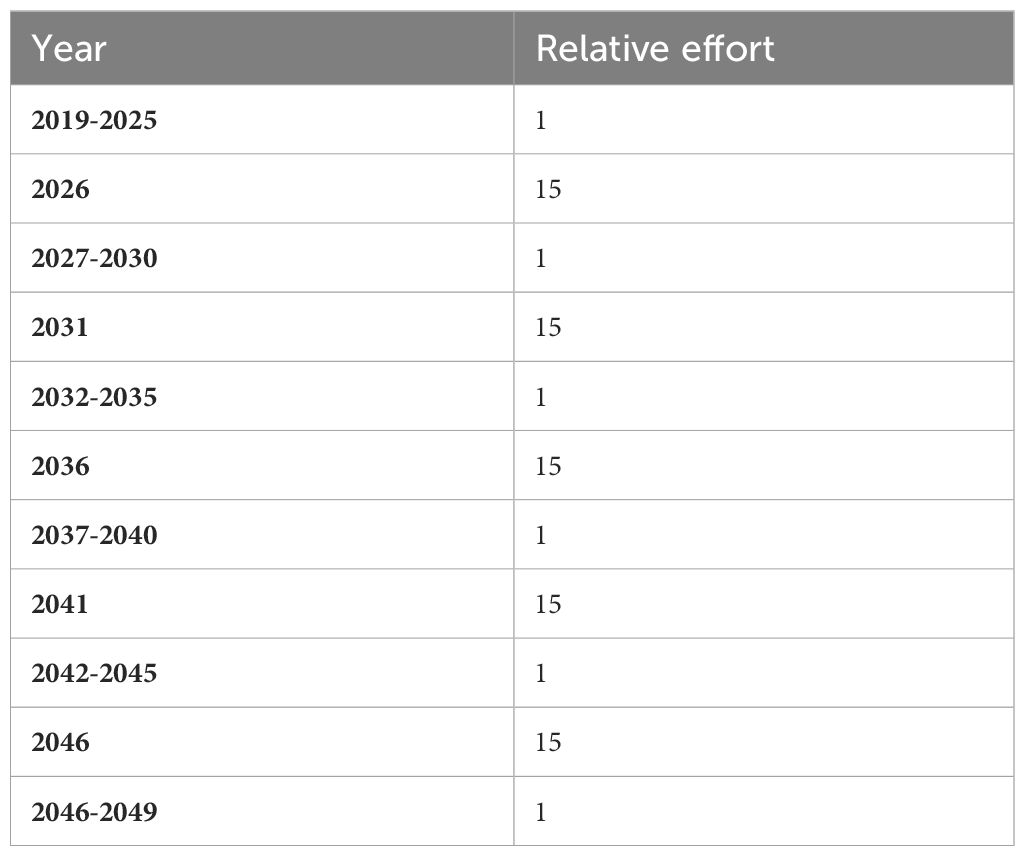
Table 6B Relative fishing effort time series for the fictitious fleet targeting the groups on the hard substrate.
Here, we used the same method to study sensibility as in the previous scenario (Figure 3) except that some specific landings (Table 6B) for the fishing fleet on the hard substrate were added and coefficient values were set to 0.1.
While scraping may be necessary for the functioning of the floating systems, it may not necessarily be financially advantageous for fishermen. Then a maintenance team may scrap the sessile organisms on the floating structure, and let them settle on the seafloor. To reflect this scenario, we developed a model, TRANSFERT. Input parameters and “reef effect” modeling procedure were the same as in previous scenarios (Figure 3B). We added the same fleet as the one used in the SCRAP scenario, instead of extracting the biomass from the model the fleet in the TRANSFERT scenario, allowed for the extracted biomass to settle on the seafloor. In order to simulate this transfer, the biomass scraped by the fleet was retrieved and then added to the biomass of the equivalent group present on the seafloor as a forcing biomass (Table 7). The transfer of biomass to the seafloor was only significant for the group Bivalves & gastropods hard substrate when compared to all other groups (Crustaceans hard substrate, Benthos hard substrate).
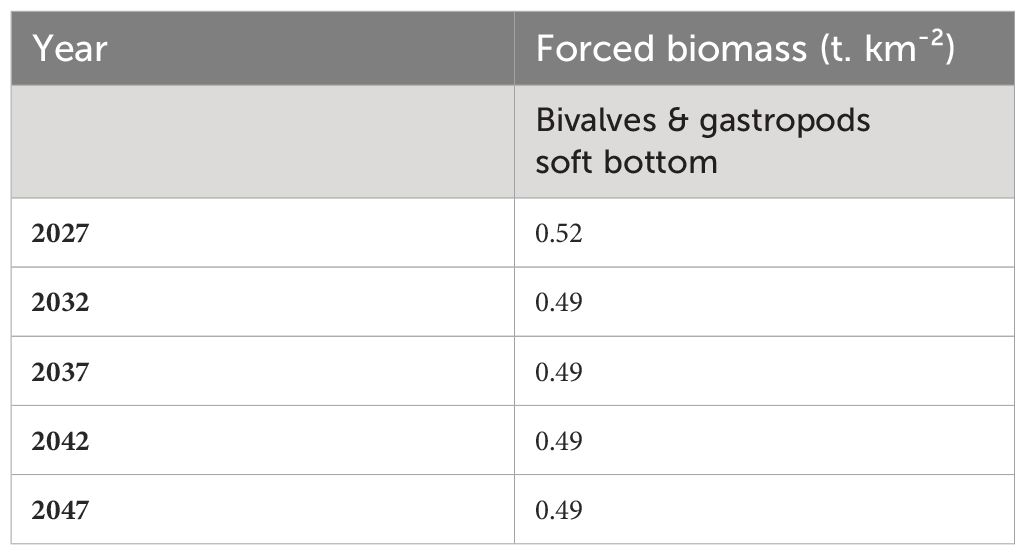
Table 7 Force biomass (t.km-²) for bivalves & gastropods soft bottom.
Here, we used the same coefficient values for sensibility as those used in the SCRAP scenario (Figure 3). Time-series of forced biomass for each value of landings tested by Monte-Carlo were created and then implemented in EwE in order to obtain outputs. Uncertainties were then obtained.
Ecosystem indicators were used to compare scenarios by using the mean of the last four years based as in Agnetta et al. (2022); Ricci et al. (2023). The “Network Analysis” routine of the EwE suite was implemented in order to compute ENA indicators (Ulanowicz (1986). Indicators were separated into three themes: structure, maturity and/or resilience and diversity and are provided in Table 8.
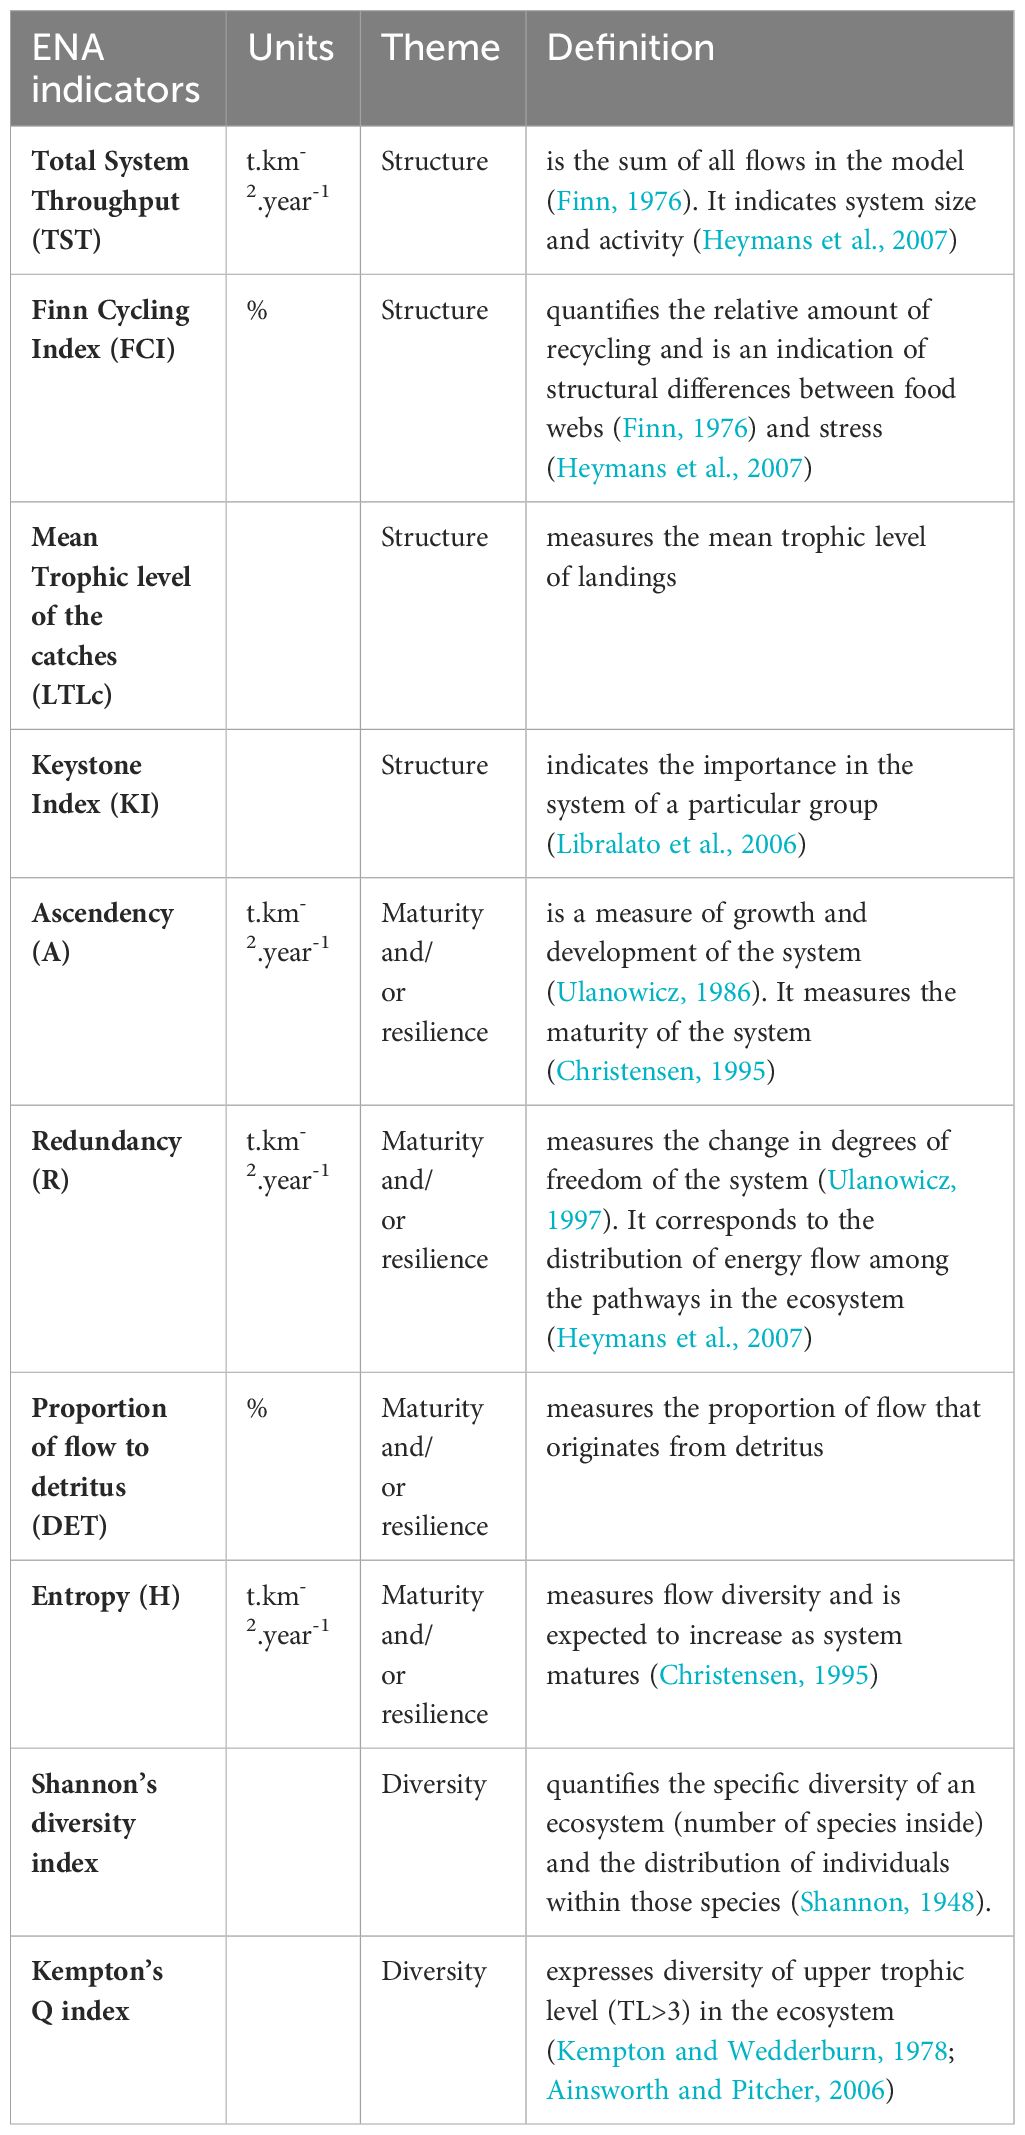
Table 8 ENA indicators used, their associated themed and their definition.
The pedigree index of the BOWF model was 0.525. Ecotrophic efficiencies (EE) ranged from zero to 0.979 (Table 9). An EE of 0 was obtained for top-predator groups, Dolphins and Seabirds whereas the highest EE was obtained for Small Demersal which had a medium trophic level (3.15). Trophic level ranged from 1 to 4.69 (Table 9). The groups with TL=1 were the primary producers and corresponded to Phytoplankton, Algae and Detritus. Dolphins occupied the highest TL. Other top-predator groups in the model had a trophic level superior to 4, such as Seabirds (TL=4.022), European hake (TL=4.049), Sharks (TL=4.132), Large Pelagic (TL=4.233) and Large Demersal (TL=4.279). Omnivory index ranged from 0 to 1.378. Null and low omnivory index (OI) were obtained for low trophic level groups such as Bivalves & gastropods, Benthos, European anchovy (OI=0), Zooplankton, European pilchard and Other Small Pelagic (OI=0.111) while a high omnivory index concerned high trophic level groups such as Large Pelagic (OI=1.071), Rays (OI=1.114), European Hake (OI=1.187), Sharks (OI=1.312) and Large Demersal (OI=1.378). Omnivory indices for all functional groups are gathered in Table H1.
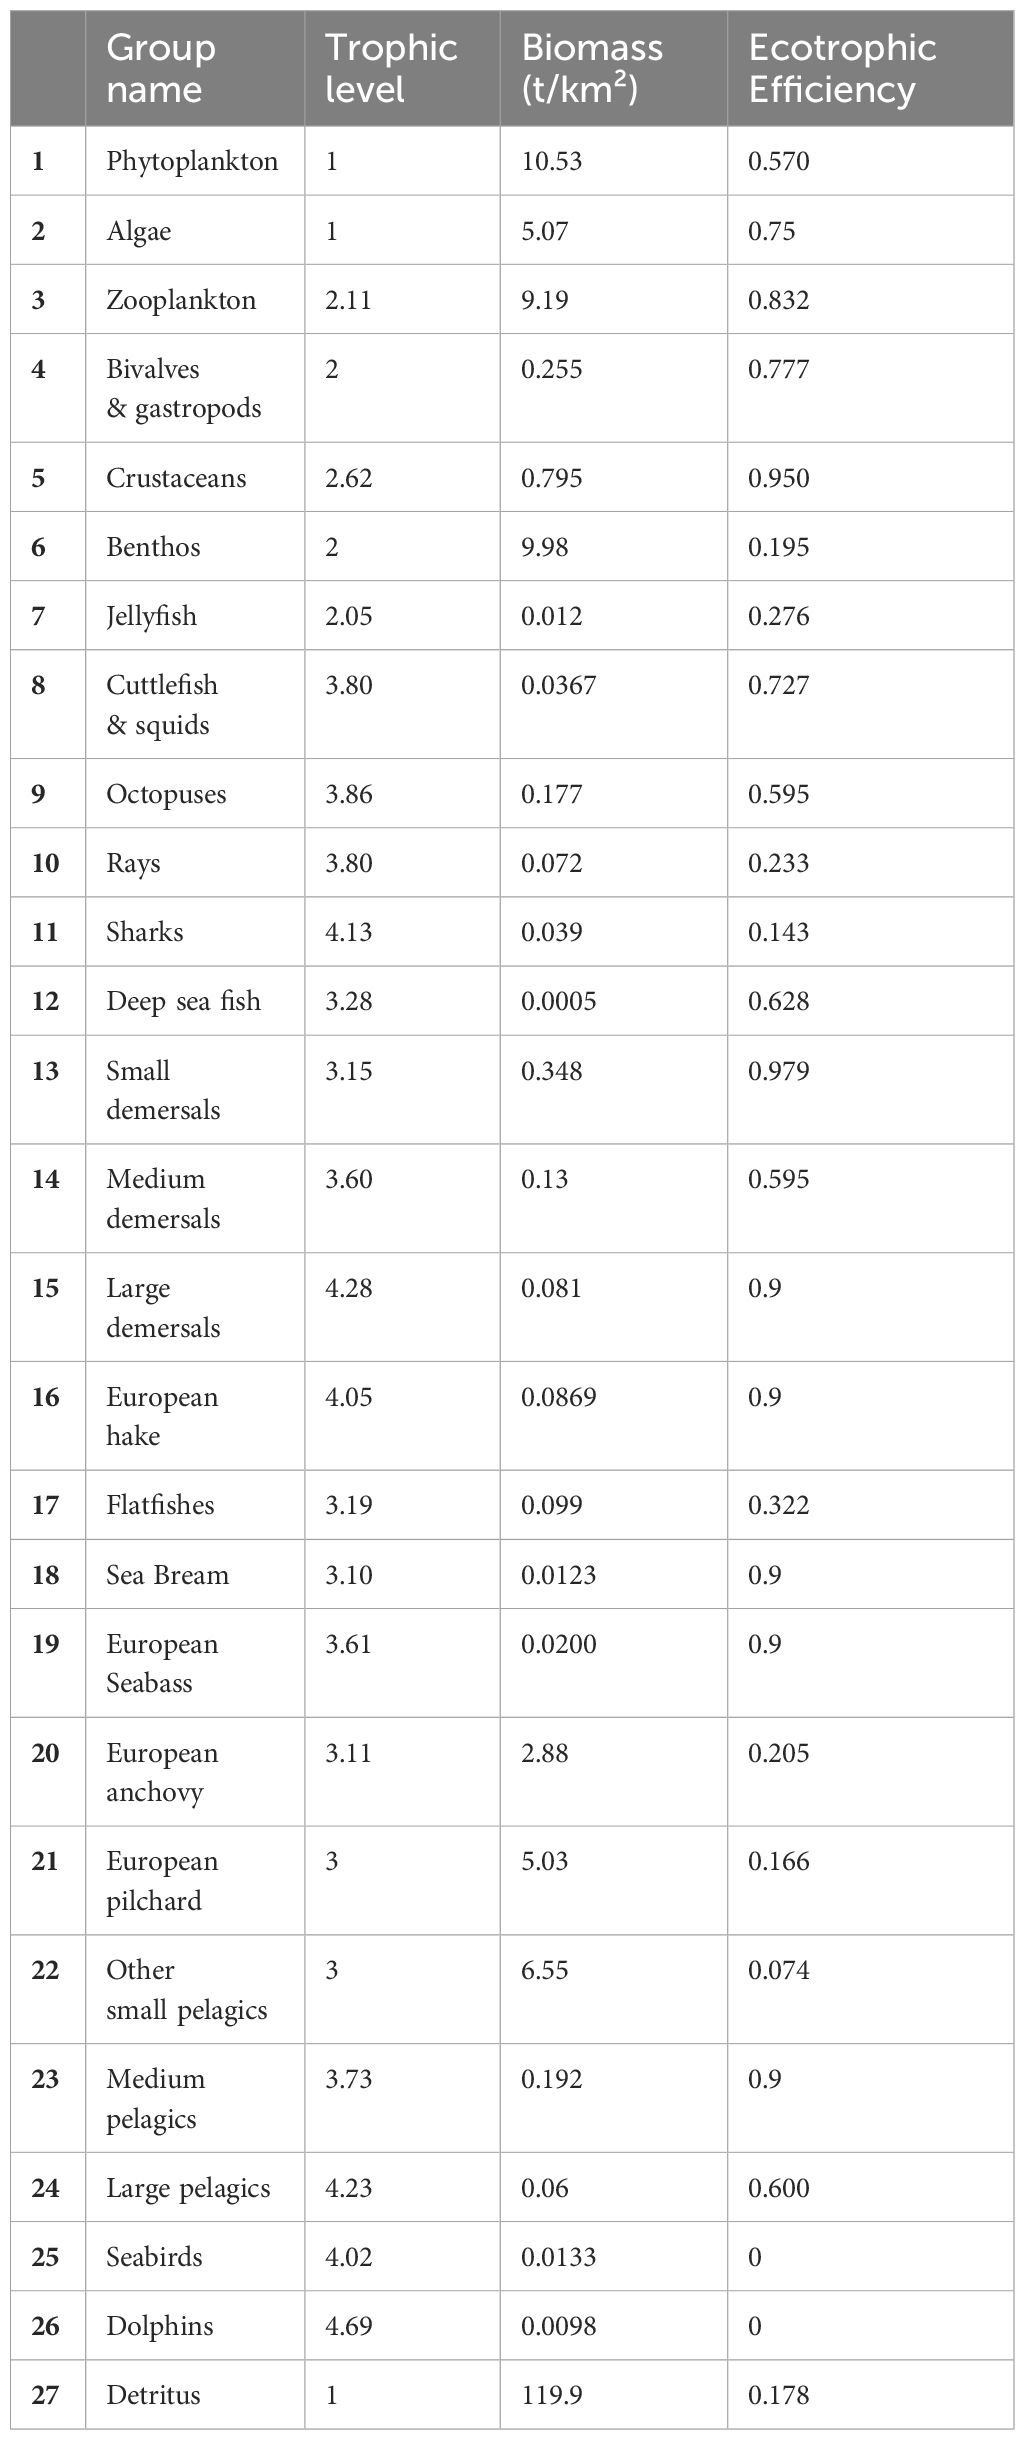
Table 9 Basic estimates of Ecopath for BOWF (Before Offshore Wind Farm) model.
The living functional group with the highest biomass was Phytoplankton, it represented 20% of the total living biomass. The consumer group with the highest biomass was Benthos, it represented 19% of the total living biomass. For the fishes, Other Small Pelagic was the most abundant group followed by European pilchard and European anchovy, all of which are pelagic fishes.
Highest keystone index (K1, Libralato et al., 2006) was obtained for Crustaceans (K1=-0.0878). The second and third highest keystone indices were calculated for Benthos (K1=-0.22) and Zooplankton (K1=-0.237) (Figure 4; Table H1).
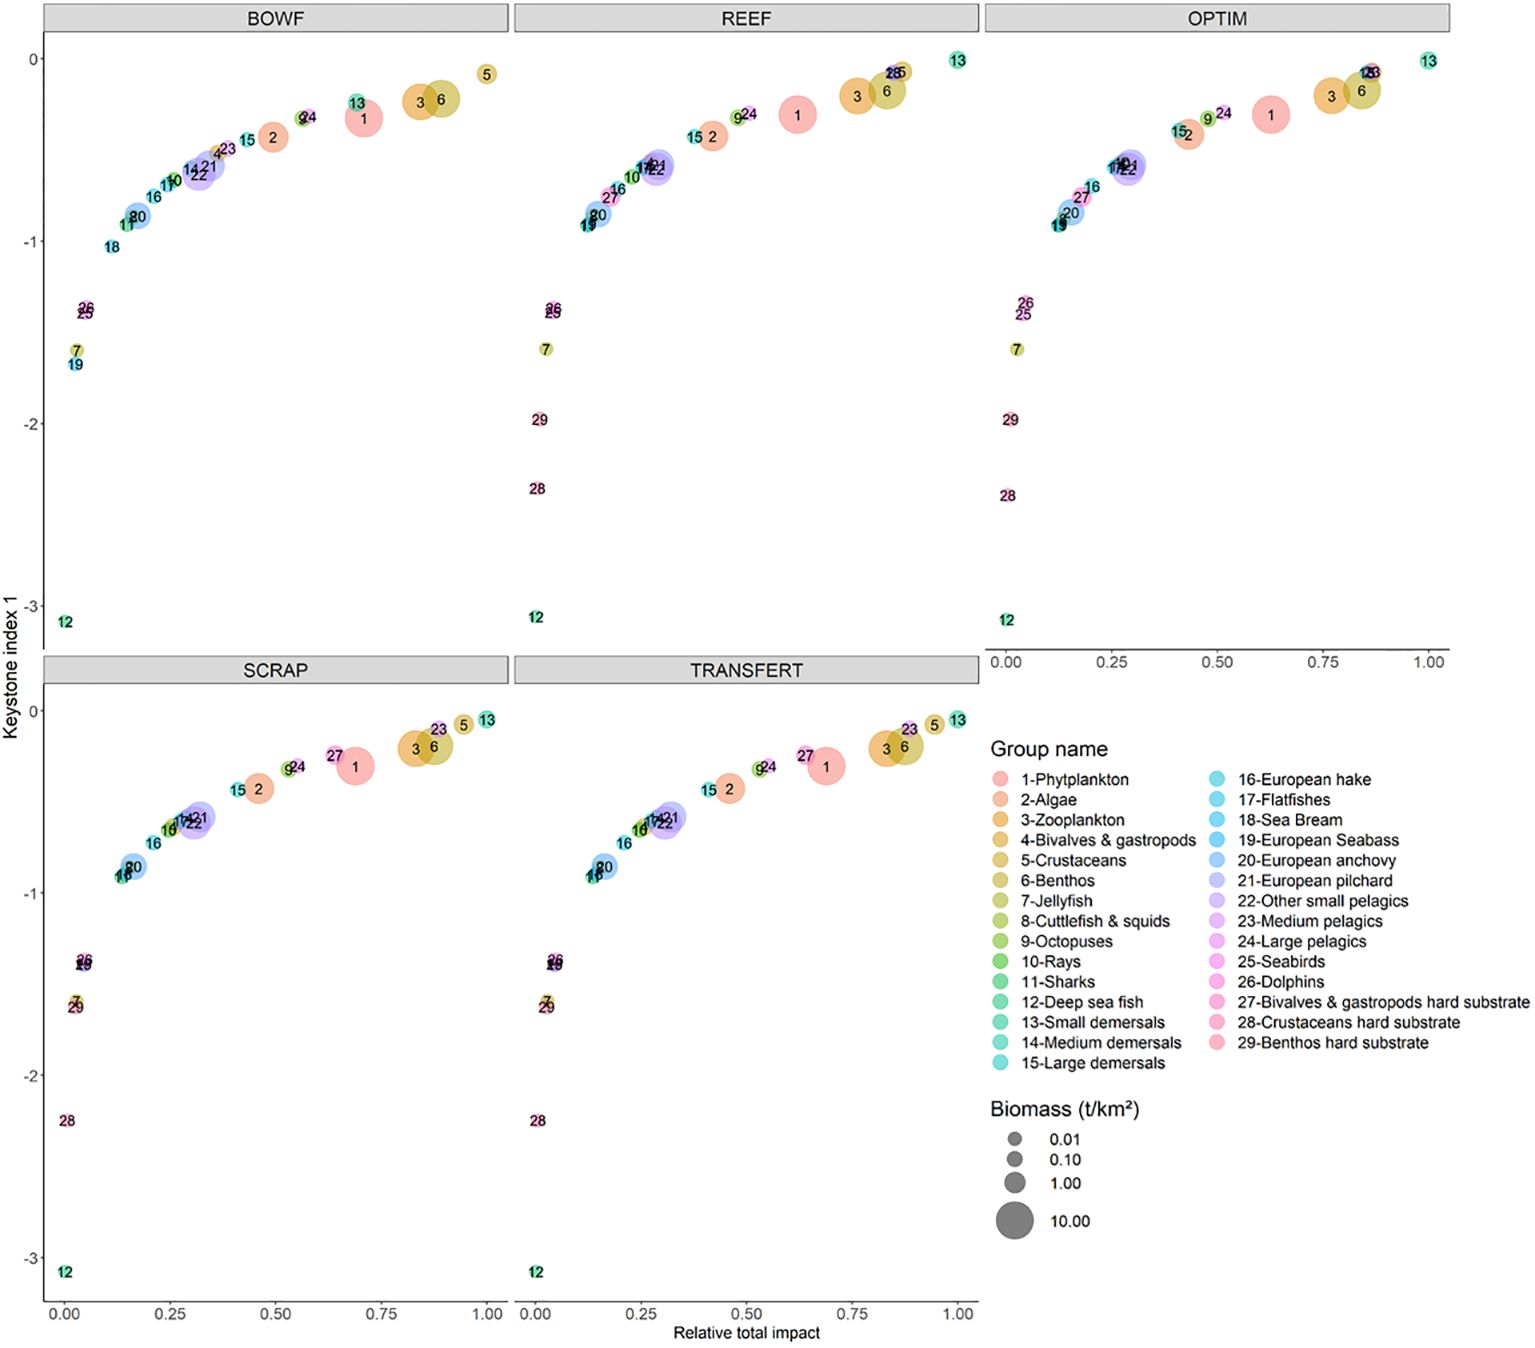
Figure 4 Keystone index (Libralato et al., 2006) against Relative total impact for the five scenario: BOWF (Before Offshore Wind Farm), REEF (reef effect), OPTIM (reef + reserve effect), SCRAP (reef effect + scraping of the biofouling by fishermen) and TRANSFERT (reef effect + scraping and transfer to sea bottom). The size of the circles is proportional to the functional group biomass.
Total System Throughput (TST, t.km-2.year-1) (Table 8) increased in all four scenarios compared to BOWF. Highest TST was obtained for the OPTIM scenario, then a slightly lower TST was obtained for REEF. TST for TRANSFERT was lower than the OPTIM and REEF values of TST. Finally, TST decreased slightly between TRANSFERT and SCRAP (Figure 5). Finn Cycling Index (FCI, %) (Table 8) decreased for the 4 scenarios compared to the BOWF model. FCI values for the REEF and OPTIM scenarios were identical. FCI was identical for the SCRAP and the TRANSFERT scenario, which in turn was greater than the REEF and OPTIM scenarios (Figure 5). Regarding Mean Trophic Level catch (MTLc) (Table 8), the OPTIM scenario is the only scenario of the four which presents values above the BOWF model. Among the three other scenarios, it was the REEF scenario which had the higher MTLc., TLc was slighty higher for the TRANSFERT scenario compared to the SCRAP scenario (Figure 4).
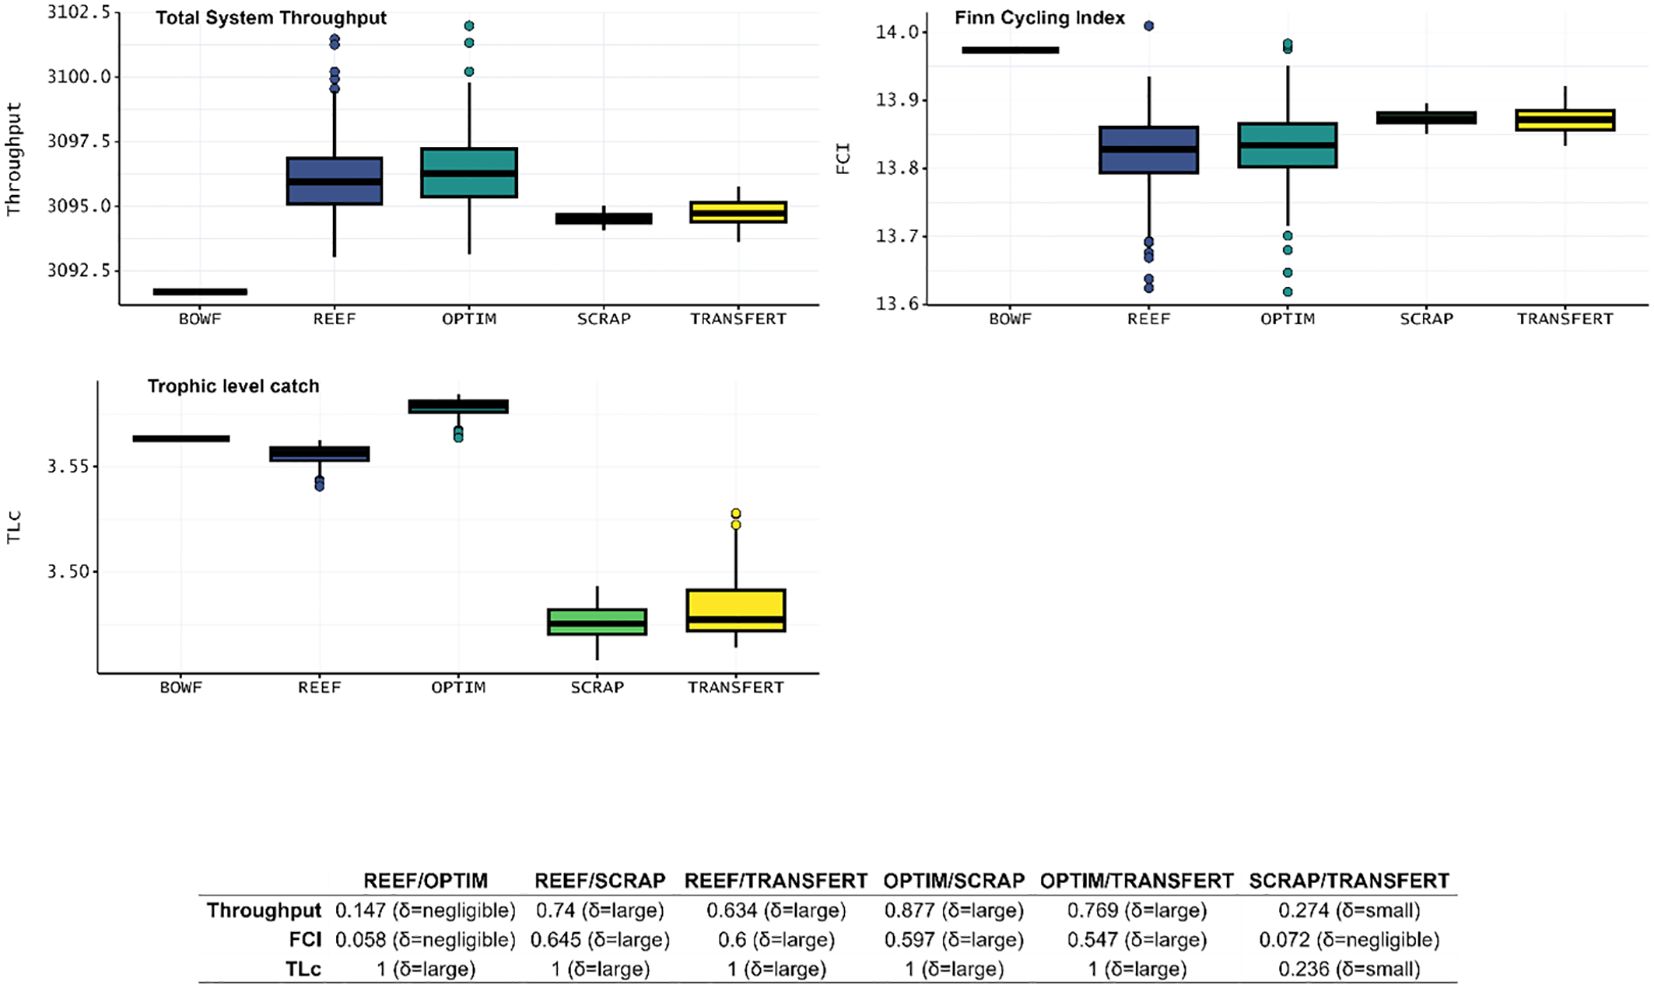
Figure 5 Boxplots of ENA indices, Total System Throughput (t.km-2.year-1), Finn Cycling Index (%), Mean Trophic Level of catch, about the food web structure for the five Ecosim scenario: BOWF (Before Offshore Wind Farm), REEF (reef effect), OPTIM (reef + reserve effect), SCRAP (reef effect + scraping of the biofouling by fishermen) and TRANSFERT (reef effect + scraping and transfer to sea bottom) using Monte-Carlo and Ecosampler routines for the last four scenario. The table below the boxplots presented the value of Cliff’s delta obtained and the scale of differences.
With the introduction of the REEF effect, the keystone index (KI) (Table 8) changed (Figure 4). Highest values of keystone index for the BOWF scenario were obtained for low trophic level organisms such as Crustaceans, Benthos, Zooplankton and Phytoplankton. For the REEF, SCRAP and TRANSFERT scenarios, the highest values of keystone index were obtained for a mix of fish groups such as Small Demersal and Medium Pelagic and low trophic level organisms such as Crustaceans, Benthos and Zooplankton. Highest keystone index values varied slightly for the OPTIM scenario compared to the other scenarios. Sea Bream became an important group while Small demersal, Medium Pelagic Crustaceans, Benthos and Zooplankton remained important structural groups (Figure 4). The differences between BOWF scenario and the other scenarios may be linked with the structure of model (new groups added).
Ascendency (A, t.km-2.year-1) (Table 8) increased for the whole scenario compared to the BOWF scenario, with the highest value of OPTIM only slightly higher than the value for REEF (Figure 6). Regarding the scraping scenario, TRANSFERT scenario presented slightly higher values than the SCRAP scenario (Figure 6). Ascendency for the SCRAP and TRANSFERT scenario were largely inferior to REEF and OPTIM scenarios. Redundancy (R, t.km-2.year-1) (Table 8), proportion of flow to detritus (DET, %) (Table 8) and entropy (H, t.km-2.year-1) (Table 8) increased for the whole scenario compared to the BOWF scenario. Highest values for the three indicators were obtained for the REEF and OPTIM scenarios (Figure 6). R, DET and H for SCRAP and TRANSFERT were largely inferior to the values for REEF and OPTIM scenarios. These indicators were slightly higher for the TRANSFERT scenario compared to the SCRAP scenario (Figure 6).
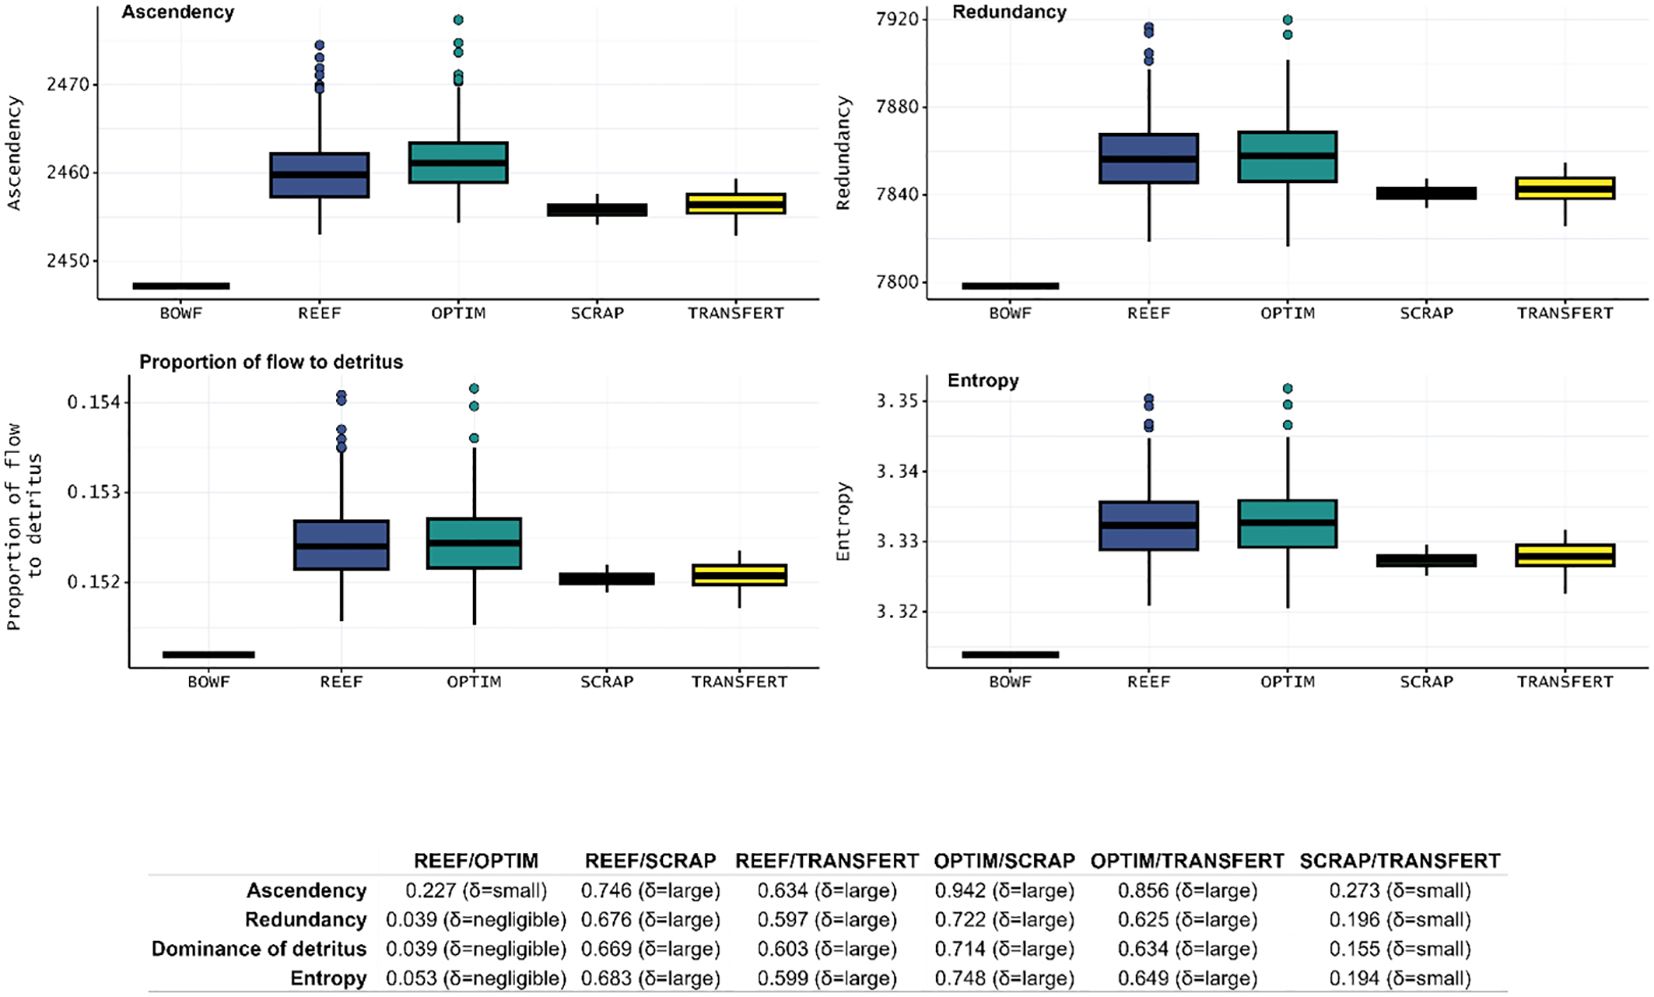
Figure 6 Boxplots of ENA indices, Ascendency (t.km-2.year-1), Redundancy (t.km-2.year-1), Proportion of flow to detritus (%), Entropy (t.km-2.year-1) about the maturity of the ecosystem for the five Ecosim scenario: BOWF (Before Offshore Wind Farm), REEF (reef effect), OPTIM (reef + reserve effect), SCRAP (reef effect + scraping of the biofouling by fishermen) and TRANSFERT (reef effect + scraping and transfer to seafloor bottom) using Monte-Carlo and Ecosampler routines for the last four scenario. The table below the boxplots presented the value of Cliff’s delta obtained and the scale of differences.
Shannon diversity index (SI) (Table 8) increased for the all scenarios compared to the BOWF scenario. SI values were much higher for the REEF and OPTIM scenarios compared to both SCRAP and TRANSFERT scenarios. SI increased slightly between the REEF and OPTIM scenarios while SI remained constant between the SCRAP and TRANSFERT scenario (Figure 7). Kempton Q (Table 7) increased slightly for the REEF and SCRAP scenarios compared to the BOWF scenario while it seemed constant for the TRANSFERT scenario and decreased largely for the OPTIM scenario. Kempton Q was much higher for the REEF scenario than the SCRAP scenario. Value of Kempton Q decreased slightly between the SCRAP and TRANSFERT scenarios. Kempton Q was largely inferior for the OPTIM scenario compared to all other scenarios (Figure 7).
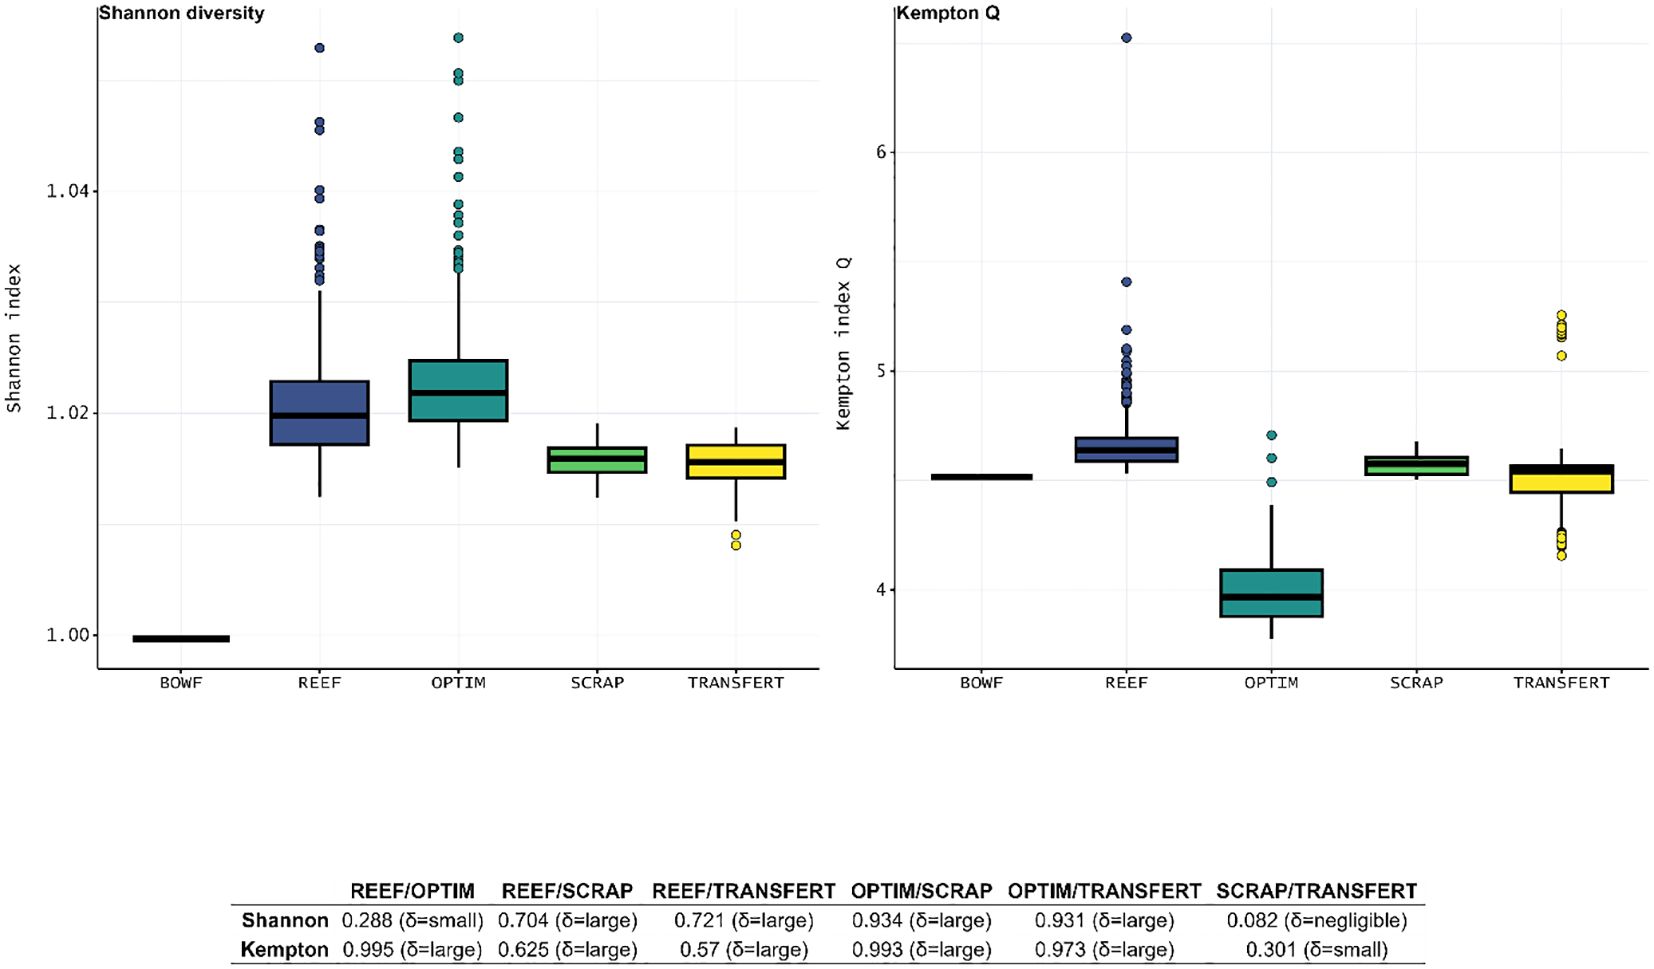
Figure 7 Boxplots of ENA indices, Shannon diversity and Kempton’s Q index, about diversity for the five Ecosim scenario: BOWF (Before Offshore Wind Farm), REEF (reef effect), OPTIM (reef + reserve effect), SCRAP (reef effect + scraping of the biofouling by fishermen) and TRANSFERT (reef effect + scraping and transfer to sea bottom seafloor) using Monte-Carlo and Ecosampler routines for the last four scenario. The table below the boxplots presented the value of Cliff’s delta obtained and the scale of differences.
Regarding the biomass trends obtained at the end year of the simulation, several species seemed to benefit from the reef effect and the derived scenarios. Indeed, Small Demersal biomass was multiplied by between 1.03 and 1.189 for the REEF, 1.018 and 1.181 for the OPTIM, 1.055 and 1.117 for the SCRAP and 1.049 and 1.104 for the TRANSFERT scenarios. Sea Bream biomass also increased by a factor between 1.153 and 1.867 for the REEF, 1.177 and 1.904 for the OPTIM, 1.158 and 1.305 for the SCRAP, 1.079 and 1.262 for the TRANSFERT scenarios. Some groups seemed to benefit more from the partial closure of the fishery, with Large Demersal biomass multiplied by between 1.018 and 1.110 for the REEF, 1.073 and 1.171 for the OPTIM scenarios. Medium Pelagic biomass increased by a factor between 1.020 and 1.065 for the REEF, 1.252 and 1.294 for the OPTIM scenarios. Large Pelagic biomass was multiplied by between 1.034 and 1.076 for the REEF scenario while for the OPTIM scenario biomass was multiplied by between 1.33 and 1.384. In the TRANSFERT scenario, biomass for groups such as Flatfishes and Sea Bream increased significantly, after the hard substrate was scraped, by an approximate factor of 1.2 and 2.1, respectively, but this increase did not extend over time and biomasses returned to their initial values. Overall, biomass trends decreased for some groups such as Crustaceans, Jellyfish and Cuttlefish & Squids. For Cuttlefish & squids, biomass decreased by a factor between 0.981 and 0.997 for the REEF, 0.945 and 0.962 for the OPTIM scenarios, while they remained constant for the SCRAP and the TRANSFERT scenarios. Biomass declines appeared more severe in the OPTIM scenario (Figure 8). Biomasses for the functional groups missing from Figure 8 are available in Figure I1 and values of biomass for each year are available in Table I2.
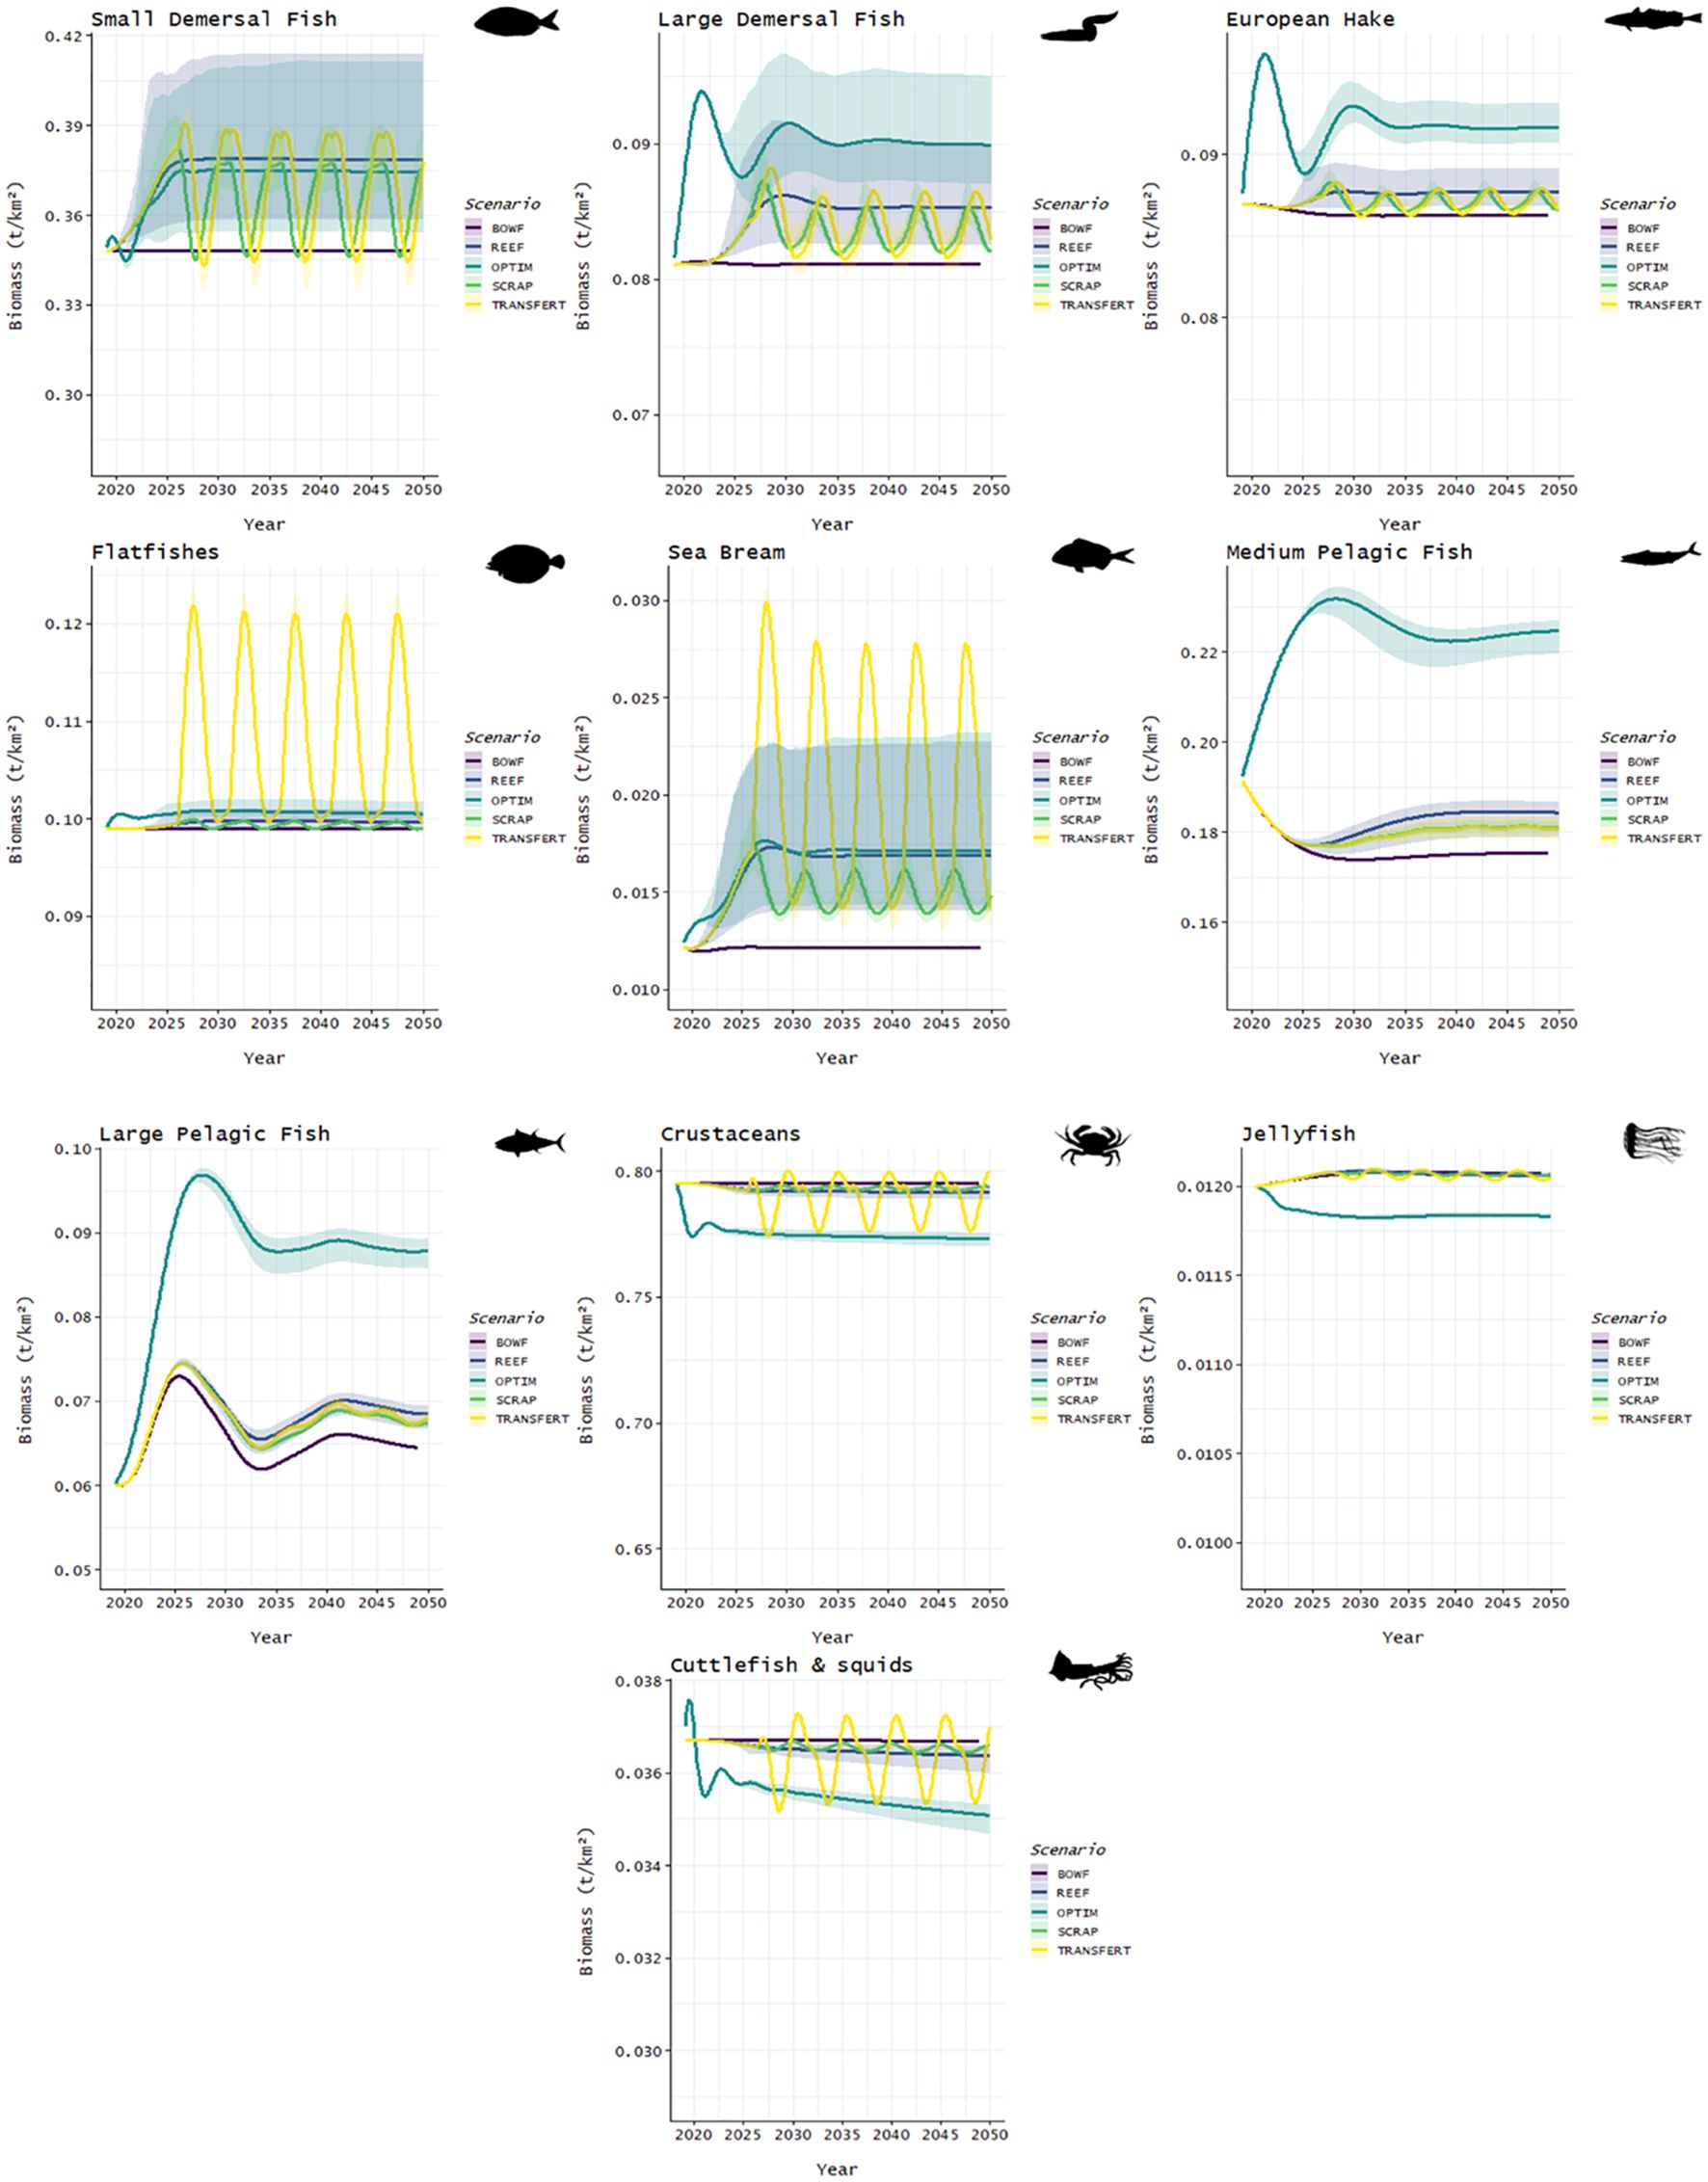
Figure 8 Biomass evolution between different scenarios. Straight line represents the reference data. The clear ribbon represents the interval of confidence of 95%. Five scenarios are presented: BOWF (Before Offshore Wind Farm), REEF (reef effect), OPTIM (reef +reserve effect), SCRAP (reef effect + scraping of the biofouling by fishermen), TRANSFERT (reef effect + scraping and transfer to the sea bottom).
Pedigree is the only indicator that addresses the quality of the input data that is included within an Ecopath model (Morissette, 2007). The Ecopath model BOWF had a high pedigree index, compared to the mean pedigree (0.44) value that was obtained by Morissette (2007) and revealed that input data in BOWF was of acceptable quality. However, the pedigree indices obtained in the BOWF model were lower than most of those obtained for the Ecopath model that was developed in the North-Western Mediterranean Sea (Coll et al., 2006; Bǎnaru et al., 2013; Corrales et al., 2015) which ranged from 0.62 to 0.67, and were slightly higher than the one obtained by Vilas et al. (2021) (0.50). In the present model, biomass data were mainly local and were obtained from detailed samplings. Like for the majority of EwE models, P/B and Q/B were obtained mainly from an empirical equation and trophic levels were lower than those included in other Ecopath models. Landings were local but not as precise as they could have been; even if we did collect landing values in six large areas in the Gulf of Lion. In parallel, diet remains the main source of incertitude in the present model. Even if most of the diet data came from sampling in the Mediterranean Sea, diets change and adapt to available resources both seasonally (Morte et al., 2002) and geographically (Rumolo et al., 2016). Catch and diet were certainly the most uncertain factors in our model and explain the differences in pedigree obtained here, compared to other models.
The initial Ecopath model, BOWF, was composed of 27 functional groups. According to the keystone index, the majority of the most ‘structuring’ group were within the low trophic level categories such as Crustaceans, Benthos, Zooplankton, characterized by a high keystone index and relative total impact. Bǎnaru et al. (2013) and Corrales et al. (2015) found that dolphins, seabirds and high trophic level fish were keystone species in the ecosystem. Both added that low trophic organisms played an important role in the ecosystem (Bǎnaru et al., 2013; Corrales et al., 2015). In the BOWF model we developed, diets of high trophic level organisms were essentially based on imports because of the limited size of our model compared to their feeding area; this may partly explain the differences in the key groups.
Artificial hard substrate introduction in the Mediterranean Sea are mainly colonized by mussels, which are pioneers in the colonization of this substrate (Fabi et al., 2002; Airoldi and Bulleri, 2011; Spagnolo et al., 2014). Similarly, we expect that the introduction of wind farm turbines will provide new habitat, for crustaceans and benthos organisms and an additional source of food that will be integrated in the trophic web. In our model, we thus assumed that this new source of food would lead to a change in a proportion of the diet for some demersal and pelagic groups. Results of the EwE model (REEF) showed that Sea Bream and Small Demersal functional groups could largely benefit from the introduction of the wind farm while Medium Pelagic and Large Pelagic fish functional groups only benefited slightly. European Hake as a separate functional group benefited from the reef effect, but in the fitting procedure, biomass data simulated by Ecosim were largely superior to the reference biomasses. As such, the increase in biomass of European Hake should be taken with caution. The Rays functional group benefited from the reef effect while the Rays functional group did not feed on the hard substrate. The high vulnerability obtained from the fitting procedure for Rays (Appendix F) means that the Rays as a functional group was far from its carrying capacity (Christensen et al., 2008). Rays biomass was probably driven by the “bottom-up” effect, and thus when Rays prey biomass increased, Rays biomass skyrocketed. Adding a reserve effect (OPTIM) from the wind farm led to a higher biomass for most fish groups including those which benefited from the reef effect and those with a high trophic level. As an example, Medium Pelagic and Large Pelagic functional groups benefited only slightly from the reef effect while they benefited largely from the reserve in the wind farm area. This result was expected, as one of the major effects of MPAs is the protection of high trophic level populations (Valls et al., 2012). Some low trophic groups were affected (e.g. Jellyfish) from the combined reef and reserve effect, mainly due to the increase of the biomass of their predators.
According to the scenario with the combined reef and reserve effect (OPTIM), the implantation of an offshore wind farm will have an impact on food web structure. Here, the quantity of flows in the ecosystem increased, characterized by the total system throughput. The quantity of flows with the introduction of the hard substrate was supposed to slightly increase in the case of monopile windfarm (Raoux et al., 2019; Wang et al., 2019; Nogues et al., 2021). Our approach suggests that the colonization of the floating hard substrate had an equivalent impact. Finn Cycling Index decreased with the reef effect and with the association with the reserve effect, suggesting that the structure of the food web changed due to the implantation of the offshore wind farm (Finn, 1976). Compared to the previous model developed for monopiles, the trend for the Finn Cycling Index in the present study was the opposite. Nogues et al. (2021) and Wang et al. (2019) obtained a slight increase in the FCI index. Energy recycling capabilities seemed to decrease with the implantation of floating wind farms while it increased with monopile wind farms (Raoux et al., 2017). A hypothesis to explain this pattern is that monopile wind farms provide benefits mainly to bottom fish groups that feed more on detritus compared to pelagic groups. The effects of the introduction of a wind farm on the mean trophic level of the catch were largely studied by Raoux et al. (2019). Like in their models, our results indicated that the increase in low trophic level biomass overwhelmed the increase in high trophic level biomass.
According to Ulanowicz (1986), Ascendency (A, t.km-2.year-1) is expected to increase as an ecosystem matures (Ortiz and Wolff, 2002; Ulanowicz, 1986; Raoux et al., 2019). Two other indicators were proposed in this study to characterize the maturity of the system: the proportion of flows to detritus (%) and entropy (t.km-2.year-1). When the system matures, a shift from herbivory to detritivory is expected (Christensen, 1995; Geers et al., 2016; Odum, 1969). For a mature ecosystem, species diversity is expected to be high but with EwE, several species are gathered in the functional group making measurement difficult. Christensen (1995) proposed to measure the flow diversity instead of species diversity by quantifying the statistical entropy (H, t.km-2.year-1) for all groups in the ecosystem. The results of the present work on these indicators pointed out that under a reef effect (REEF and OPTIM) the ecosystem seemed to be more mature than a model without a reef effect (BOWF). Even if a high value of Ascendency is correlated with a more mature system, it also means that since the system is more active in specific pathways, it may lose flexibility and thus lose resilience (Raoux et al., 2019). Redundancy (R, t.km-2.year-1) and Ascendency for both REEF and OPTIM increased compared to the scenario without a wind farm, meaning that the system did not lose its flexibility. Indeed, Redundancy measures the number of parallel trophic pathways that link the different functional groups (Ulanowicz, 1986). When there is an increase in Redundancy, this means that the flows are distributed in several alternative pathways to link one specific group to another (Heymans et al., 2007), and results in an increase in the resilience of the ecosystem (Heymans, 2003). Based on the results for Redundancy, it appears that the reef effect (REEF and OPTIM) led to a higher resilience compared to the model without the reef effect (BOWF). Raoux et al. (2019) found similar results with respect to the maturity and resilience after the introduction of the reef effect. Further, it appears that the introduction of both floating and monopile wind turbines led to a system that was more mature and flexible system in response to potential disturbances.
According to Shannon’s diversity index, diversity increased with the introduction of the reef effect. However, Kempton’s Q index showed that the diversity increased only for the reef effect and not for the combination of the reef and reserve effects. Different trends were obtained with the Shannon’s diversity index vs the Kempton’s Q index. Shannon’s diversity index studied the overall diversity of functional groups and equitability, and took into account all of the trophic levels in the system, while Kempton’s Q index only studied the diversity of the upper trophic levels (Kempton and Wedderburn, 1978). Overall diversity increased with the introduction of the reef effect (REEF and OPTIM) but the diversity for the upper trophic levels only increased with the reef effect and decreased with the reserve effect. Marine Protected Areas are expected to benefit all trophic levels (Soler et al., 2015). In the model with the reserve effect, there were dissimilarities between functional groups. Further, as several functional groups (Large Pelagic, Medium Pelagic, Rays) benefited largely from the reserve effect, an overall decrease in diversity might result for high trophic levels.
Functional groups which largely benefited from the reef effect, such as Sea Bream and Small demersal, experienced a reduction in their proliferation with the scraping scenario. When compared only to the reef effect, a reduction in biomass was common to the majority of groups. Adding the transfer of biomass to the seafloor benefited Flatfishes, Sea Bream, Octopuses and Small demersal functional groups for which biomass was largely increased. However, this increase was followed by an increase in fishing pressure, inherent to Ecopath, which nullified the benefit for these functional groups.
With regular scraping of the biofouling (SCRAP and TRANSFERT), the Total System Throughput (TST, t.km-2.year-1) decreased compared to the scenarios with reef effect only. However, the decrease in this indicator was predictable since biomass was extracted and thus the production from the extracted biomass was removed from the ecosystem. The trophic level of catch (TLc) is inevitably reduced because of the scraping on the hard substrate sessile organism which are low trophic level groups. The regular scraping of biofouling and its deposition to the sea bottom led to slightly higher value for TST and TLc than only the regular harvesting of the biofouling. The difference in TST is due to the periodic high increase in biomass (Figure 8) of some groups such as Small Demersal, Large Demersal, Sea Bream, Flatfishes. This increase was not obtained in the SCRAP scenario and then it explained the difference. The same explanation can be use to explain the higher TLc in the TRANSFERT scenario compared to the SCRAP because with the periodic high increase in biomass of some medium and high trophic level, it balanced the impact of the harvest of the hard susbtrate group on the TLc indicator. The FCI values highlighted important structural differences (Finn, 1976) between the reef effect and the scenario in which reef organisms were scraped. Differences in structure between the scraping and sampling (SCRAP) and the scraping and settling (TRANSFERT) were negligible according to FCI.
In 1985, Odum proposed an evolution of the indicators that he developed previously (Odum, 1969) to determine trends in a stressed ecosystem. Odum, (1985) considers that a stressed ecosystem has a low efficiency in its conversion of energy to organic structure, which leads to a decrease in species diversity and a decrease in the redundancy of parallel processes. Proportion of flow to detritus, redundancy and entropy decreased from both scraping scenarios compared to the reef effect scenario. It appears that the regular scraping of the hard substrate led to a less mature system. This result is consistent with the assumption that under regular perturbations, an ecosystem is less mature (Nilsson and Grelsson, 1995). Also, the decrease in the Ascendency (t.km-2.year-1) from the reef scenario to the scraping scenario appears in line with these results according to the indicators studied in the present paper, where scraping and allowing the organisms settle on the sea bottom led to a more mature system than scraping and removing the organisms for the ecosystem.
Diversity of an ecosystem is expected to decrease with intense fishing effort (Bianchi et al., 2000). With the scraping of the hard substrate, the benthic organisms on the substrate were subjected to a very high fishing effort, for which we would expect the overall diversity to decrease. Kempton’s Q index and Shannon diversity index confirmed this assumption.
The model developed to study the potential effects of a floating offshore wind farm in the Gulf of Lion addressed the colonization of the hard substrate by groups that were present in minority in the food web (i.e buoys, shipwrecks). We proposed an original approach to simulate for the colonization of large floating devices. This approach relied mainly on the parameters, biomass accumulation, and vulnerability (see 2.7.1) and enabled us to follow the speed of the colonization observed on a floater in the Gulf of Lion. In order to better fit with reality, more field data for biofouling succession and biomass are needed. To better integrate this new food source in the trophic web, it will be essential to observe species present around the OWF and carry out stomach content analysis to ensure which functional groups feed on the biofouling organism. In the present study, network analysis indicators were used to quantify the effects of the wind farm on the ecosystem. These indicators permitted us to study the effects of the implantation of the wind farm in a global way (Raoux et al., 2019). However, the links between these indicators and the system maturity, or resilience, are complex (Raoux et al., 2019). The present study and other models for offshore windfarms (Raoux et al., 2019; Nogues et al., 2021, 2017) highlight a greater maturity and/or resilience of the ecosystem on the basis of the network analysis indicators, while Wang et al. (2019) who developed both a pre-implantation model and a post-implantation model with sampling for input parameters for both, found more mixed results for the maturity of the system.
In addition, the present model covered an area of 1,000km² in the Gulf of Lion. The use of a restricted area was required to study the impact of the wind farm turbines, and similar surface areas were used by Raoux et al. (2017), (2019), Wang et al. (2019). The main constraint of an EwE model on a small area was the population dynamics. One way of managing this limit is to introduce a proportion of imports into the diet of groups that were occasionally present in the area (Christensen et al., 2008), but this proportion was difficult to determine precisely and we opted for the percentage of the feeding area covered by the EwE model. Another way to manage this issue is to create an Ecospace model on a larger area, i.e Gulf of Lion, then simulate the migration of highly mobile groups.
The French Ministry of Ecological Transition announced the tendering of two 250 MW wind farms in the Gulf of Lion. In this context, the development of an Ecospace model representing the entire Gulf of Lion and simulating the effects of the implantation of these two wind farms is required. However, our model does not cover all of the potential impacts of wind turbines that can be simulated with EwE. An update EwE model should work on including the effects of noise (Debusschere et al., 2016; Serpetti et al., 2021), electric fields (Gill et al., 2014), pollution from float components (Leleyter et al., 2016), the bioengineering effect of the biofouling organism (Sadchatheeswaran et al., 2020) which can provide refuge for some species and reduce their vulnerability to predaction.
The EwE model was built in the Gulf of Lion in order to study the effects of the floating wind farm on the trophic web. It provided original knowledge on the effect of floating wind turbines in the Gulf of Lion as well as the effect of fisheries management associated with wind farms and biofouling on the floats. More precisely, this modeling of the impacts of floating wind turbines at the scale of the ecosystem, in the Gulf of Lion showed: 1) the invasion of the hard substrate by benthic organisms led to an increase in the number of fish groups and delivered benefits to some high-level predators (Wang et al., 2024), as shown on monopile wind farm in the Bay of Seine by Raoux et al. (2017) but beneficiary fish groups are mainly pelagic in floating wind farm compared to monopile one. A closure of the park to fishing accentuated this effect, whereas regular scraping of the substrate might counteract it; 2) the introduction of hard substrate increased the importance of low trophic level groups as well as groups of fish that benefit from the reef effect, as shown in monopile wind farm in the Bay of Seine by Raoux et al. (2019, 2017); 3) maturity and resilience of the ecosystem increased following the introduction of wind turbines according to some network analysis indicators Cliquez ou appuyez ici pour entrer du texte. Finally, this model is a starting point in the study of the different impacts of the offshore wind farm at a large scale, and allows for these impacts to be combined with other temporal changes, such as climate change.
The raw data supporting the conclusions of this article will be made available by the authors, without undue reservation.
The manuscript presents research on animals that do not require ethical approval for their study.
MA: Formal analysis, Investigation, Methodology, Software, Visualization, Writing – original draft, Writing – review & editing. JL: Conceptualization, Formal analysis, Methodology, Software, Writing – review & editing. AT: Conceptualization, Funding acquisition, Methodology, Project administration, Writing – review & editing. SP: Conceptualization, Funding acquisition, Methodology, Project administration, Writing – review & editing.
The author(s) declare that financial support was received for the research, authorship, and/or publication of this article. We thank the ADEME (Agence de l’environnement et de la maîtrise de l’énergie, 2019) for funding a part of this study.
We are grateful to the IFREMER for giving us access to essential data for this study, in particular MEDITS, PELMED and the SIH for fishing data. We thank the PELAGIS observatory for the data on the megafauna and seabirds. We thank Titouan Morage, Alexandre Sofianos and Sandra Baksay who collected the samples on buoys and Sandra Baksay who performed the biomass quantifications.
The authors declare that the research was conducted in the absence of any commercial or financial relationships that could be construed as a potential conflict of interest.
All claims expressed in this article are solely those of the authors and do not necessarily represent those of their affiliated organizations, or those of the publisher, the editors and the reviewers. Any product that may be evaluated in this article, or claim that may be made by its manufacturer, is not guaranteed or endorsed by the publisher.
The Supplementary Material for this article can be found online at: https://www.frontiersin.org/articles/10.3389/fmars.2024.1379331/full#supplementary-material
B, Biomass input; P/B, Production on Biomass input; Q/B, Consumption on Biomass input; BA, Biomass accumulation input; EE, Ecotrophic efficiency input; EwE, Ecopath with Ecosim; OI, Omnivory Index; TL, Trophic Level; MTLc, Mean Trophic Level catch; TST, Total System Throughput; A, Ascendency; FCI, Finn Cycling Index; BOWF, Before Offshore Wind Farm scenario; REEF, Reef Effect scenario; OPTIM, Reef associated with reserve effect scenario; SCRAP, Reef effect associated with scraping scenario; TRANSFERT, Reef effect associated with scraping and transfer to seafloor scenario.
Agnetta D., Badalamenti F., Colloca F., Cossarini G., Fiorentino F., Garofalo G., et al. (2022). Interactive effects of fishing effort reduction and climate change in a central mediterranean fishing area: Insights from bio-economic indices derived from a dynamic food-web model. Front. Mar. Sci. 9, 909164.
Ainsworth C. H., Pitcher T. J. (2006). Modifying Kempton’s species diversity index for use with ecosystem simulation models. Ecol. Indic. 6, 623–630. doi: 10.1016/j.ecolind.2005.08.024
Airoldi L., Bulleri F. (2011). Anthropogenic disturbance can determine the magnitude of opportunistic species responses on marine urban infrastructures. PloS One 6, e22985. doi: 10.1371/journal.pone.0022985
Bǎnaru D., Mellon-Duval C., Roos D., Bigot J. L., Souplet A., Jadaud A., et al. (2013). Trophic structure in the Gulf of Lions marine ecosystem (north-western Mediterranean Sea) and fishing impacts. J. Mar. Syst. 111–112, 45–68. doi: 10.1016/j.jmarsys.2012.09.010
Banse K., Mosher S. (1980). Adult body mass and annual production/biomass relationships of field populations. Ecol. Monogr. 50, 355–379. doi: 10.2307/2937256
Benhemma-Le Gall A., Graham I. M., Merchant N. D., Thompson P. M. (2021). Broad-scale responses of harbor porpoises to pile-driving and vessel activities during offshore windfarm construction. Frontiers in Marine Science 8, 664724.
Bianchi G., Gislason H., Graham K., Hill L., Jin X., Koranteng K. (2000). Impact of fishing on size composition and diversity of demersal fish communities. doi: 10.1006/jmsc.2000.0727
Bishop I. D., Miller D. R. (2007). Visual assessment of off-shore wind turbines: The influence of distance, contrast, movement and social variables. Renewable Energy 32, 814–831. doi: 10.1016/j.renene.2006.03.009
Bray L. (2017). Preparing for offshore renewable energy development in the Mediterranean. (Doctoral dissertation, University of Plymouth).
Brehmer P., Gerlotto F., Guillard J., Sanguinède F., Guénnegan Y., Buestel D. (2003). New applications of hydroacoustic methods for monitoring shallow water aquatic ecosystems: the case of mussel culture grounds. Aquat. Living Resour. 16 (3), 333–338.
Callier M. D., Byron C. J., Bengtson D. A., Cranford P. J., Cross S. F., Focken U., et al. (2018). Attraction and repulsion of mobile wild organisms to finfish and shellfish aquaculture: a review. Rev. Aquaculture. 10 (4), 924–949. doi: 10.1111/raq.12208
Christensen V. (1995). Ecosystem maturity — towards quantification. Ecol. Model. 77, 3–32. doi: 10.1016/0304-3800(93)E0073-C
Christensen V., Walters C. J. (2004). Ecopath with Ecosim: methods, capabilities and limitations. Ecol. Model. 172, 109–139. doi: 10.1016/j.ecolmodel.2003.09.003
Christensen V., Walters C. J., Pauly D., Forrest R. (2008). Ecopath with Ecosim version 6 User Guide. Lenfest Ocean Futures Project, 235.
Cliff N. (1993). Dominance statistics: Ordinal analyses to answer ordinal questions. psychol. Bull. 114, 494. doi: 10.1037/0033-2909.114.3.494
Coates D. A., Deschutter Y., Vincx M., Vanaverbeke J. (2014). Enrichment and shifts in macrobenthic assemblages in an offshore wind farm area in the Belgian part of the North Sea. Mar. Environ. Res. 95, 1–12. doi: 10.1016/j.marenvres.2013.12.008
Coll M., Palomera I., Tudela S., Sardà F. (2006). Trophic flows, ecosystem structure and fishing impacts in the South Catalan Sea, Northwestern Mediterranean. J. Mar. Syst. 59, 63–96. doi: 10.1016/j.jmarsys.2005.09.001
Coll M., Santojanni A., Palomera I., Tudela S., Arneri E. (2007). An ecological model of the Northern and Central Adriatic Sea: Analysis of ecosystem structure and fishing impacts. J. Mar. Syst. 67, 119–154. doi: 10.1016/j.jmarsys.2006.10.002
Cook A. S. C. P., Humphreys E. M., Bennet F., Masden E. A., Burton N. H. K. (2018). Quantifying avian avoidance of offshore wind turbines: Current evidence and key knowledge gaps. Mar. Environ. Res. 140, 278–288. doi: 10.1016/j.marenvres.2018.06.017
Corrales X., Coll M., Tecchio S., Bellido J. M., Fernández Á.M., Palomera I. (2015). Ecosystem structure and fishing impacts in the northwestern Mediterranean Sea using a food web model within a comparative approach. J. Mar. Syst. 148, 183–199. doi: 10.1016/j.jmarsys.2015.03.006
Dannheim J., Bergström L., Birchenough S. N., Brzana R., Boon A. R., Coolen J. W., et al. (2020). Benthic effects of offshore renewables: identification of knowledge gaps and urgently needed research. ICES J. Mar. Sci. 77 (3), 1092–1108.
Debusschere E., Hostens K., Adriaens D., Ampe B., Botteldooren D., de Boeck G., et al. (2016). Acoustic stress responses in juvenile sea bass Dicentrarchus labrax induced by offshore pile driving. Environ. pollut. 208, 747–757. doi: 10.1016/j.envpol.2015.10.055
Degraer S., Carey D. A., Coolen J. W., Hutchison Z. L., Kerckhof F., Rumes B., et al. (2020). Offshore wind farm artificial reefs affect ecosystem structure and functioning. Oceanography 33 (4), 48–57.
Fabi G., Luccarini F., Panfili M., Solustri C., Spagnolo A. (2002). Effects of an artificial reef on the surrounding soft-bottom community (central Adriatic Sea). ICES J. Mar. Sci. 59, S343–S349. doi: 10.1006/jmsc.2002.1308
Finn J. T. (1976). Measures of ecosystem structure and function derived from analysis of flows. J. Theor. Biol. 56, 363–380. doi: 10.1016/S0022-5193(76)80080-X
Fonseca A. R., Sanches Fernandes L. F., Fontainhas-Fernandes A., Monteiro S. M., Pacheco F. A. L. (2017). The impact of freshwater metal concentrations on the severity of histopathological changes in fish gills: A statistical perspective. Sci. Total Environ. 599–600, 217–226. doi: 10.1016/j.scitotenv.2017.04.196
Furness R. W., Wade H. M., Masden E. A. (2013). Assessing vulnerability of marine bird populations to offshore wind farms. J. Environ. Manage. 119, 56–66. doi: 10.1016/j.jenvman.2013.01.025
Geers T. M., Pikitch E. K., Frisk M. G. (2016). An original model of the northern gulf of mexico using ecopath with ecosim and its implications for the effects of fishing on ecosystem structure and maturity. Deep Sea Res. Part II: Topical Stud. Oceanography 129, 319–331. doi: 10.1016/j.dsr2.2014.01.009
Giakoumi S., Scianna C., Plass-Johnson J., Micheli F., Grorud-Colvert K., Thiriet P., et al. (2017). Ecological effects of full and partial protection in the crowded Mediterranean Sea: A regional meta-analysis. Sci. Rep. 7 (1), 8940. doi: 10.1038/s41598-017-08850-w
Gill A. B., Gloyne-Philips I., Kimber J., Sigray P. (2014). “Marine Renewable Energy, Electromagnetic (EM) Fields and EM-Sensitive Animals,” in Marine Renewable Energy Technology and Environmental Interactions. Eds. Shields M. A., Payne A. I. L. (Springer Netherlands, Dordrecht), 61–79. doi: 10.1007/978-94-017-8002-5_6
Hamdi A., Vasquez M., Populus J. (2010). Cartographie des habitats physiques Eunis - Côtes de France. Convention Ifremer/AAMP n° 09/12177764/FY. (IFREMER).
Harmelin-Vivien M., le Diréach L., Bayle-Sempere J., Charbonnel E., García-Charton J. A., Ody D., et al. (2008). Gradients of abundance and biomass across reserve boundaries in six Mediterranean marine protected areas: Evidence of fish spillover? Biol. Conserv. 141, 1829–1839. doi: 10.1016/j.biocon.2008.04.029
Heymans J. J., Coll M., Link J. S., Mackinson S., Steenbeek J., Walters C., et al. (2016). Best practice in Ecopath with Ecosim food-web models for ecosystem-based management. Ecol. Model. 331, 173–184. doi: 10.1016/j.ecolmodel.2015.12.007
Heymans J. J., Guénette S., Christensen V. (2007). Evaluating network analysis indicators of ecosystem status in the Gulf of Alaska. Ecosystems 10, 488–502. doi: 10.1007/s10021-007-9034-y
Heymans S. (2003). Comparing the newfoundland marine ecosystem models using information theory. Fisheries Centre Res. Rep. 11 (5), 62–71.
Higgins E., Scheibling R. E., Desilets K. M., Metaxas A. (2019). Benthic community succession on artificial and natural coral reefs in the northern Gulf of Aqaba, Red Sea. PloS One 14 (2). doi: 10.1371/journal.pone.0212842
Huang Y. F., Gan X. J., Chiueh P. T. (2017). Life cycle assessment and net energy analysis of offshore wind power systems. Renewable Energy 102, 98–106.
Hutchison Z. L., Bartley M. L., Degraer S., English P., Khan A., Livermore J., et al. (2020). Offshore wind energy and benthic habitat changes. Oceanography 33 (4), 58–69.
Innes S., Lavigne D. M., Earle W. M., Kovacs K. M. (1987). Feeding rates of seals and whales. J. Anim. Ecol. 56, 115–130. doi: 10.2307/4803
Joschko T. J., Buck B. H., Gutow L., Schröder A. (2008). Colonization of an artificial hard substrate by Mytilus edulis in the German Bight. Mar. Biol. Res. 4, 350–360. doi: 10.1080/17451000801947043
Kempton R. A., Wedderburn R. W. M. (1978). A comparison of three measures of species diversity. Biometrics 34, 25–37. doi: 10.2307/2529585
Khim J. S., Park J., Song S. J., Yoon S. J., Noh J., Hong S., et al. (2018). Chemical-, site-, and taxa-dependent benthic community health in coastal areas of the bohai sea and northern yellow sea: a sediment quality triad approach. Sci. total Environ. 645, 743–752.
Ladenburg J. (2009). Visual impact assessment of offshore wind farms and prior experience. Appl. Energy 86, 380–387. doi: 10.1016/j.apenergy.2008.05.005
Langhamer O. (2012). Artificial reef effect in relation to offshore renewable energy conversion: state of the art. Sci. World J. 2012.
Laran S., Nivière M., Genu M., Dorémus G., Serre S., Spitz J., et al. (2021). “Distribution et abondance de la mégafaunemarine lors des campagnes SAMM cycle i et II en méditerranée,” in Rapport final. observatoire pelagis (UMS 3462, La Rochelle Université /CNRS) & OFB), 76.
Le Marchand M. (2020). Modélisation écosystémique des effets combinés du changement climatique et d'un parc éolien flottant dans le golfe de gascogne (Doctoral dissertation, université de bretagne occidentale-brest).
Leleyter L., Baraud F., Gil O., Gouali S., Lemoine M., Orvain F. (2016). “Aluminium impact on the growth of benthic diatom,” in Marine Sediments: Formation, Distribution and Environmental Impacts, 1st ed. (Nova Science Publishers, Shirley Williams, Inc), 1–19.
le Marchand M., ben Rais Lasram F., Araignous E., Saint-Béat B., Lassalle G., Michelet N., et al. (2022). Potential combined impacts of climate change and non-indigenous species arrivals on Bay of Biscay trophic network structure and functioning. J. Mar. Syst. 228, 103704. doi: 10.1016/j.jmarsys.2022.103704
Libralato S., Christensen V., Pauly D. (2006). A method for identifying keystone species in food web models. Ecol. Model. 195, 153–171. doi: 10.1016/j.ecolmodel.2005.11.029
Lindeboom H. J., Kouwenhoven H. J., Bergman M. J. N., Bouma S., Brasseur S., Daan R., et al. (2011). Short-term ecological effects of an offshore wind farm in the Dutch coastal zone; Acompilation. Environ. Res. Lett. 6. doi: 10.1088/1748-9326/6/3/035101
Lu Z., Zhan X., Guo Y., Ma L. (2020). Small-scale effects of offshore wind-turbine foundations on macrobenthic assemblages in pinghai bay, china. J. Coast. Res. 36 (1), 139–147.
Mackinson S. (2013). Combined analyses reveal environmentally driven changes in the North Sea ecosystem and raise questions regarding what makes an ecosystem model’s performance credible? Can. J. Fisheries Aquat. Sci. 71, 31–46. doi: 10.1139/cjfas-2013-0173
Mascorda Cabre L., Hosegood P., Attrill M. J., Bridger D., Sheehan E. V. (2021). Offshore longline mussel farms: a review of oceanographic and ecological interactions to inform future research needs, policy and management. Rev. Aquaculture 13 (4), 1864–1887.
McKindsey C. W., Archambault P., Callier M. D., Olivier F. (2011). Influence of suspended and off-bottom mussel culture on the sea bottom and benthic habitats: a review. Can. J. Zoology 89 (7), 622–646.
Morissette L. (2007). Complexity, cost and quality of ecosystem models and their impact on resilience: a comparative analysis, with emphasis on marine mammals and the Gulf of St. Lawrence. (Doctoral dissertation, University of British Columbia).
Morte M. S., Redón M. J., Sanz-Brau A. (2002). Diet of phycis blennoides (Gadidae) in relation to fish size and season in the Western Mediterranean (Spain). Mar. Ecol. 23, 141–155. doi: 10.1046/j.1439-0485.2002.02763.x
Nilsson S. G., Nilsson I. N. (1976). Numbers, food consumption, and fish predation by birds in lake Möckeln, Southern Sweden. Ornis Scandinavica (Scandinavian J. Ornithology) 7, 61–70. doi: 10.2307/3676175
Niu F. Q., Li Z., Xue R. C., Yang Y., Ma L. (2021). Impact of pile driving underwater noise from offshore wind turbines on the large yellow croaker (Pseudosciaena crocea). Mar. Sci. 45 (8), 9.
Nogues Q., Raoux A., Araignous E., Chaalali A., Hattab T., Leroy B., et al. (2021). Cumulative effects of marine renewable energy and climate change on ecosystem properties: Sensitivity of ecological network analysis. Ecol. Indic. 121, 107128. doi: 10.1016/j.ecolind.2020.107128
Odum E. P. (1969). The Strategy of Ecosystem Development: An understanding of ecological succession provides a basis for resolving man’s conflict with nature. Science 164, 262–270. doi: 10.1126/science.164.3877.262
Ortiz M., Wolff M. (2002). Trophic models of four benthic communities in tongoy bay (Chile): comparative analysis and preliminary assessment of management strategies. J. Exp. Mar. Biol. Ecol. 268 (2), 205–235.
Palomares M. L. D., Pauly D. (1998). Predicting food consumption of fish populations as functions of mortality, food type, morphometrics, temperature and salinity. Mar. Freshw. Res. 49, 447–453. doi: 10.1071/MF98015
Papantoniou G., Zervoudaki S., Assimakopoulou G., Stoumboudi M. T., Tsagarakis K. (2023). Ecosystem-level responses to multiple stressors using a time-dynamic food-web model: The case of a re-oligotrophicated coastal embayment (Saronikos gulf, e mediterranean). Sci. Total Environ. 903, 165882.
Pauly D. (1980). On the interrelationships between natural mortality, growth parameters, and mean environmental temperature in 175 fish stocks. ICES J. Mar. Sci. 39, 175–192. doi: 10.1093/icesjms/39.2.175
Pauly D., Palomares M. D. (2010). An empirical equation to predict annual increases in fishing efficiency. Fisheries Centre Working Paper 7, 1–12.
Peteiro L. G., Filgueira R., Labarta U., Fernández-Reiriz M. J. (2010). The role of fish predation on recruitment of mytilus galloprovincialis on different artificial mussel collectors. Aquacultural Eng. 42 (1), 25–30.
Petersen J. K., Malm T. (2006). Offshore windmill farms: threats to or possibilities for the marine environment. AMBIO: A J. Hum. Environ. 35, 75–80. doi: 10.1579/0044-7447(2006)35[75:OWFTTO]2.0.CO;2
Piroddi C., Coll M., Liquete C., Macias D., Greer K., Buszowski J., et al. (2017). Historical changes of the Mediterranean Sea ecosystem: Modelling the role and impact of primary productivity and fisheries changes over time. Sci. Rep. 7. doi: 10.1038/srep44491
Raoux A., Lassalle G., Pezy J. P., Tecchio S., Safi G., Ernande B., et al. (2019). Measuring sensitivity of two OSPAR indicators for a coastal food web model under offshore wind farm construction. Ecol. Indic. 96, 728–738. doi: 10.1016/j.ecolind.2018.07.014
Raoux A., Tecchio S., Pezy J. P., Lassalle G., Degraer S., Wilhelmsson D., et al. (2017). Benthic and fish aggregation inside an offshore wind farm: Which effects on the trophic web functioning? Ecol. Indic. 72, 33–46. doi: 10.1016/j.ecolind.2016.07.037
Reubens J. T., Degraer S., Vincx M. (2014). The ecology of benthopelagic fishes at offshore wind farms: a synthesis of 4 years of research. Hydrobiologia 727, 121–136. doi: 10.1007/s10750-013-1793-1
Riahi K., Schaeffer R., Arango J., Calvin K., Guivarch C., Hasegawa T., et al. (2022). Mitigation pathways compatible with long-term goals. In IPCC, 2022: Climate Change 2022: Mitigation of Climate Change. Contribution of Working Group III to the Sixth Assessment Report of the Intergovernmental Panel on Climate Change. Shukla P. R., Skea J., Slade R., Al Khourdajie A., van Diemen R., McCollum D., et al, (eds.)]. Cambridge University Press, Cambridge, UK and New York, NY, USA. doi: 10.1017/9781009157926.005
Ricci P., Serpetti N., Cascione D., Cipriano G., D'Onghia G., De Padova D., et al. (2023). Investigating fishery and climate change effects on the conservation status of odontocetes in the northern ionian sea (Central mediterranean sea). Ecol. Model. 485, 110500.
Roddier D., Cermelli C., Aubault A., Weinstein A. (2010). WindFloat: A floating foundation for offshore wind turbines. J. Renewable Sustain. Energy 2, 033104. doi: 10.1063/1.3435339
Romano J., Kromrey J. D., Coraggio J., Skowronek J., Devine L. (2006). Exploring methods for evaluating group differences on the NSSE and other surveys: Are the t-test and Cohen’sd indices the most appropriate choices (Citeseer: Annual meeting of the Southern Association for Institutional Research).
Rumolo P., Bonanno A., Barra M., Fanelli E., Calabrò M., Genovese S., et al. (2016). Spatial variations in feeding habits and trophic levels of two small pelagic fish species in the central Mediterranean Sea. Mar. Environ. Res. 115, 65–77. doi: 10.1016/j.marenvres.2016.02.004
Sadchatheeswaran S., Branch G. M., Shannon L. J., Moloney C. L., Coll M., Robinson T. B. (2020). Modelling changes in trophic and structural impacts of alien ecosystem engineers on a rocky-shore island. Ecol. Model. 433, 109227.
Salta M., Wharton J. A., Blache Y., Stokes K. R., Briand J. F. (2013). Marine biofilms on artificial surfaces: Structure and dynamics. Environ. Microbiol. 15 (11), 2879–2893. doi: 10.1111/1462-2920.12186
Sartor P., Sbrana M., Chato Osio G., Ligas A., Reale B., Colloca F., et al. (2011). The 20th century evolution of mediterranean exploited demersal resources under increasing fishing disturbance and environmental change, EVOMED. Open call tenders no. Ch 4, 140–235.
Šegvić-Bubić T., Grubišić L., Karaman N., Tičina V., Jelavić K. M., Katavić I. (2011). Damages on mussel farms potentially caused by fish predation–self service on the ropes? Aquaculture 319 (3-4), 497–504.
Serpetti N., Benjamins S., Brain S., Collu M., Harvey B. J., Heymans J. J., et al. (2021). Modeling small scale impacts of multi-purpose platforms: An ecosystem approach. Front. Mar. Sci. 8. doi: 10.3389/fmars.2021.694013
Serpetti N., Baudron A. R., Burrows M. T., Payne B. L., Helaouët P., Fernandes P. G., et al. (2017). Impact of ocean warming on sustainable fisheries management informs the Ecosystem Approach to Fisheries. Sci. Rep. 7. doi: 10.1038/s41598-017-13220-7
Shannon C. E. (1948). A mathematical theory of communication. Bell system Tech. J. 27, 379–423. doi: 10.1002/bltj.1948.27.issue-3
Soler G. A., Edgar G. J., Thomson R. J., Kininmonth S., Campbell S. J., Dawson T. P., et al. (2015). Reef fishes at all trophic levels respond positively to effective marine protected areas. PloS One 10 (10), e0140270.
Spagnolo A., Cuicchi C., Punzo E., Santelli A., Scarcella G., Fabi G. (2014). Patterns of colonization and succession of benthic assemblages in two artificial substrates. J. Sea Res. 88, 78–86. doi: 10.1016/j.seares.2014.01.007
Steenbeek J., Corrales X., Platts M., Coll M. (2018). Ecosampler: A new approach to assessing parameter uncertainty in Ecopath with Ecosim. SoftwareX 7, 198–204. doi: 10.1016/j.softx.2018.06.004
Su W., Wu N., Zhang L., Chen M. (2020). A review of research on the effect of offshore wind power project on marine organisms. Mar. Sci. Bull. 39, 291–299.
Tecchio S., Chaalali A., Raoux A., Tous Rius A., Lequesne J., Girardin V., et al. (2016). Evaluating ecosystem-level anthropogenic impacts in a stressed transitional environment: The case of the Seine estuary. Ecol. Indic. 61, 833–845. doi: 10.1016/j.ecolind.2015.10.036
Tricas T., Gill A. B. (2011). Effects of EMFs from undersea power cables on elasmobranchs and other marine species.
Tsagarakis K., Libralato S., Giannoulaki M., Touloumis K., Somarakis S., Machias A., et al. (2022). Drivers of the north aegean sea ecosystem (Eastern mediterranean) through time: insights from multidecadal retrospective analysis and future simulations. Front. Mar. Sci. 9, 919793.
Ulanowicz R. E. (1986). Growth and Development: Ecosystems Phenomenology (New York: Springer-Verlag).
Valls A., Gascuel D., Guénette S., Francour P. (2012). Modeling trophic interactions to assess the effects of a marine protected area: Case study in the NW Mediterranean Sea. Mar. Ecol. Prog. Ser. 456, 201–214. doi: 10.3354/meps09701
Van Hal R., Griffioen A. B., Van Keeken O. A. (2017). Changes in fish communities on a small spatial scale, an effect of increased habitat complexity by an offshore wind farm. Mar. Environ. Res. 126, 26–36.
Vilas D., Coll M., Corrales X., Steenbeek J., Piroddi C., Macias D., et al. (2021). Current and potential contributions of the Gulf of Lion Fisheries Restricted Area to fisheries sustainability in the NW Mediterranean Sea. Mar. Policy 123, 104296. doi: 10.1016/j.marpol.2020.104296
Wang J., Zou X., Yu W., Zhang D., Wang T. (2019). Effects of established offshore wind farms on energy flow of coastal ecosystems: A case study of the Rudong offshore wind farms in China. Ocean Coast. Manage. 171, 111–118. doi: 10.1016/j.ocecoaman.2019.01.016
Wang L., Wang B., Cen W., Xu R., Huang Y., Zhang X., et al. (2024). Ecological impacts of the expansion of offshore wind farms on trophic level species of marine food chain. J. Environ. Sci. 139, 226–244. doi: 10.1016/j.jes.2023.05.002
Keywords: Ecopath with Ecosim (EwE), offshore floating wind farm, reef effect, reserve effect, Ecological Network Analysis (ENA), ecological modeling
Citation: Adgé M, Lobry J, Tessier A and Planes S (2024) Modeling the impact of floating offshore wind turbines on marine food webs in the Gulf of Lion, France. Front. Mar. Sci. 11:1379331. doi: 10.3389/fmars.2024.1379331
Received: 31 January 2024; Accepted: 22 April 2024;
Published: 15 May 2024.
Edited by:
Jesper H. Andersen, NIVA Denmark Water Research, DenmarkReviewed by:
Roberto Carlucci, University of Bari Aldo Moro, ItalyCopyright © 2024 Adgé, Lobry, Tessier and Planes. This is an open-access article distributed under the terms of the Creative Commons Attribution License (CC BY). The use, distribution or reproduction in other forums is permitted, provided the original author(s) and the copyright owner(s) are credited and that the original publication in this journal is cited, in accordance with accepted academic practice. No use, distribution or reproduction is permitted which does not comply with these terms.
*Correspondence: Mathieu Adgé, YWRnZS5tYXRoaWV1QGdtYWlsLmNvbQ==
Disclaimer: All claims expressed in this article are solely those of the authors and do not necessarily represent those of their affiliated organizations, or those of the publisher, the editors and the reviewers. Any product that may be evaluated in this article or claim that may be made by its manufacturer is not guaranteed or endorsed by the publisher.
Research integrity at Frontiers
Learn more about the work of our research integrity team to safeguard the quality of each article we publish.