 Fenggui Chen
 Zhiyi Cui1
- 1Third Institute of Oceanography, Ministry of Natural Resources, Xiamen, China
- 2Fujian Provincial Key Laboratory of Marine Ecological Conservation and Restoration, Xiamen, China
The protection pattern of typical marine ecosystems is an overall summary of the regional marine ecosystem protection, indicating the protection status of typical marine ecosystems. The coastal waters of China and ASEAN countries have a highly diverse range of ecosystem types, including mangroves, coral reefs, and seagrass beds. The need to protect these ecosystems is urgent, but establishing marine protected areas often involves conflicts with stakeholders highly dependent on these ecosystems. By constructing an analysis model of the protection pattern and driving mechanisms of typical marine ecosystems, with a focus on the China-ASEAN region, this study aimed to analyze the characteristics of typical marine ecosystems protection patterns in China-ASEAN, evaluate the current protection status of these ecosystems, discuss the driving factors, and derive a regression function to clarify the quantitative relationship between the protection pattern and driving factors of typical marine ecosystems in the China-ASEAN region. The results indicate that there are four main driving factors influencing the protection pattern of typical marine ecosystems in China-ASEAN countries. The most significant driving factor is the Natural Geographic and Resource Factor, followed by Urbanization, Industrial Structure, and Population Size and GDP Factor. Among these, the Natural Geographic and Resource Factor and the Industrial Structure Factor have a positive impact, while the others have a negative impact. In the future, it is crucial to fully consider the diversity and distribution of marine ecosystems to promote joint efforts among China-ASEAN countries in protecting marine ecosystems through international cooperation.
1 Introduction
The rapid growth of population, the changes and improvements of technology and the increase of consumer demand greatly increased the demand for more food, more energy and more trade. As land resources are limited or decreasing, more and more goods and services need to come from coastal and marine areas (Douvere, 2008). Coastal areas are the gateway of marine resources, and have long been regarded as a pole of human development (Cantasano and Pellicone, 2014). In the 20th century, due to economic development and population growth, the relationship between man and the ocean became heavy. With the limitation of resources in space and quantity, economic development leads to more and more adverse effects, including over-expansion, habitat loss and destruction, pollution, climate change and cumulative threats to the whole marine health (Cantasano and Pellicone, 2014).
In order to reduce the risk to marine health and promote social ecological resilience, various spatial management tools are needed to provide rapid response and long-term intervention measures to promote sustainability and security (Reed et al., 2020). Many scientists advocate the reform with ecosystem-based marine utilization management as the core (Douvere, 2008). Marine protected areas (MPAs) are considered as one of the most effective tools to maintain the stability and resilience of marine ecosystems (Knowlton, 2004), and they are clearly defined marine and coastal environmental areas. The clear purpose of the governance or management of MPAs is to “protect the nature with relevant ecosystem services and cultural values for a long time” (Bohorquez et al., 2019), which plays a key role in biodiversity protection and sustainable utilization of marine resources (Worm et al., 2006; Humphreys and Herbert, 2018; Hu et al., 2020). The construction of marine protected areas has attracted worldwide attention, and the global commitment is to protect 10% of the oceans by 2020 (e.g. Sustainable Development target 14.5 under the United Nations Sustainable Development Goals) (UNEP, 2011), including many other regional or national protection targets. In the past decade, the proposal, designation and implementation of marine protected areas have been accelerating (Sala et al., 2018), and nearly 18,000 MPAs have been reported in the protection database1. The 30x30 campaign, proposed after 2020, aims to achieve the protection and management of at least 30% of the Earth’s land and marine areas globally by 2030 (Obura et al., 2021), setting higher standards for marine conservation.
Different parts of the ocean and coastline may be best suited for different purposes, such as protection, entertainment or resource harvesting. The increase in the number and spatial scope of marine protected areas obviously affects the users of marine resources, and may conflict with local communities that rely directly on marine resources for their livelihood (Mascia et al., 2010; Cinner et al., 2014; Burbano et al., 2020). With the increasing demand for marine resources and space, it is more and more necessary to balance the needs of different departments and conservation. Integrated management, including marine spatial planning, must be effectively implemented in order to avoid or minimize the negative impact of the marine environment and conflicts between different uses (Calado and Bentz, 2013). Zoning strategy is a management tool for planning and managing various marine space uses, and it needs to balance the relationship between ecological protection and economic development.
The waters around China and ASEAN (Association of Southeast Asian Nations) countries have highly diversified ecosystem types, including mangroves, coral reefs and seagrass beds, which are still under high threat (Yang et al., 2023). Mangrove is a unique coastal ecosystem, which plays an important role in maintaining the stability of the coastline, providing shelter and breeding grounds (Akram et al., 2023) and filtering pollutants in water. Coral reefs play an important role in marine biodiversity, fisheries resources, coastal protection and tourism (Camargo et al., 2009). Seagrass bed is an important vegetation type in marine ecosystem, which plays a key role in maintaining marine ecological balance, providing habitat, purifying water bodies and alleviating climate change (Brodie et al., 2020).
The requirements of protecting these ecosystems are urgent, but the establishment of marine protected areas often involves conflicts with stakeholders who are highly dependent on ecosystems (Kamil et al., 2017). Understanding the spatial distribution pattern changes and driving factors behind ecosystem health is of great significance to ecosystem management (Xu et al., 2022). Currently, research on typical marine ecosystems focuses on the establishment of marine protected areas (Edgar et al., 2014), marine protected area networks (Grantham et al., 2013), and the conservation status of typical marine ecosystems (Hooker & Gerber, 2004). Research on typical marine ecosystem conservation patterns and driving mechanisms is scarce. Only by deeply analyzing the protection status of typical marine ecosystems in the waters around China-ASEAN countries and understanding their driving factors can we put forward effective management measures, avoid conflicts among stakeholders and promote the coordinated development of marine ecological protection and marine economy in this region. Therefore, it is of great significance for the sustainable development of China-ASEAN countries to study the protection pattern and driving mechanism of typical marine ecosystems. There are two main objectives in this study: (1) to analyze the protection pattern characteristics of typical marine ecosystems in China-ASEAN and evaluate the protection status of typical marine habitats; (2) to explore the driving mechanism of the typical marine ecosystems protection pattern in China-ASEAN countries. The ensuing section of this article introduces the characteristics of the case area, and the third part provides the research methods, including the protection pattern analysis, factor analysis and regression analysis, the analysis results are placed in the fourth part, and the last section of the article shows the main conclusions and discussions.
2 Site description
The waters in southern China and the waters around ASEAN countries have highly diverse ecosystem types, including mangroves, coral reefs and seagrass beds, mainly because their geographical and geological locations allow hot and humid climate throughout the year and form unique natural assets (Kamil et al., 2017). These typical ecosystems play an important role in maintaining offshore biodiversity, protecting coastline coastlines and participating in global the global carbon cycle. The shallow warm water in Southeast Asia contributes to the fact that 30% of coral reefs in the world are located in this area (Woodruff, 2010). which is also home to the most diverse mangroves and the second most diverse seagrass beds in the world (Wilkinson et al., 2006). The beaches and mangroves in Southeast Asia are also breeding grounds for turtles and various marine life (such as sharks, reptiles and birds) (Kim et al., 2019). The rich marine ecosystem in this area supports millions of people. For example, at least 350 million people live within 50 kilometers of the coast. They not only rely on coastal and marine ecosystems for food, but also rely on other economic and cultural resources (Clifton et al., 2010).
However, for decades, the marine ecosystem in this region has been under great pressure and threat due to many human influences such as overfishing, destructive fishing, coastal development, tourism, pollution and erosion (Sørensen and Thomsen, 2009). Research shows that 50-80% of mangroves in this area have been destroyed, and seagrass beds have suffered similar losses, while 48% of coral reefs in this area have been threatened from high to very high (Kamil et al., 2017). China and Southeast Asian countries are aware of the degradation of marine ecosystems and are studying various management strategies to effectively manage their coastal resources. According to the best available scientific knowledge about the ecosystem and its dynamics, we should comprehensively manage human activities to determine the vital impacts on the health of marine ecosystems and take actions, so as to realize the sustainable utilization of goods and services and maintain the integrity of the ecosystem (Douvere, 2008). One of the strategies is to protect important habitats and establish these areas as marine reserves to limit activities. Therefore, this study selects the coastal countries of China and ASEAN (as shown in Figure 1) as the case area to conduct research on the conservation patterns and driving mechanisms of typical marine ecosystems.
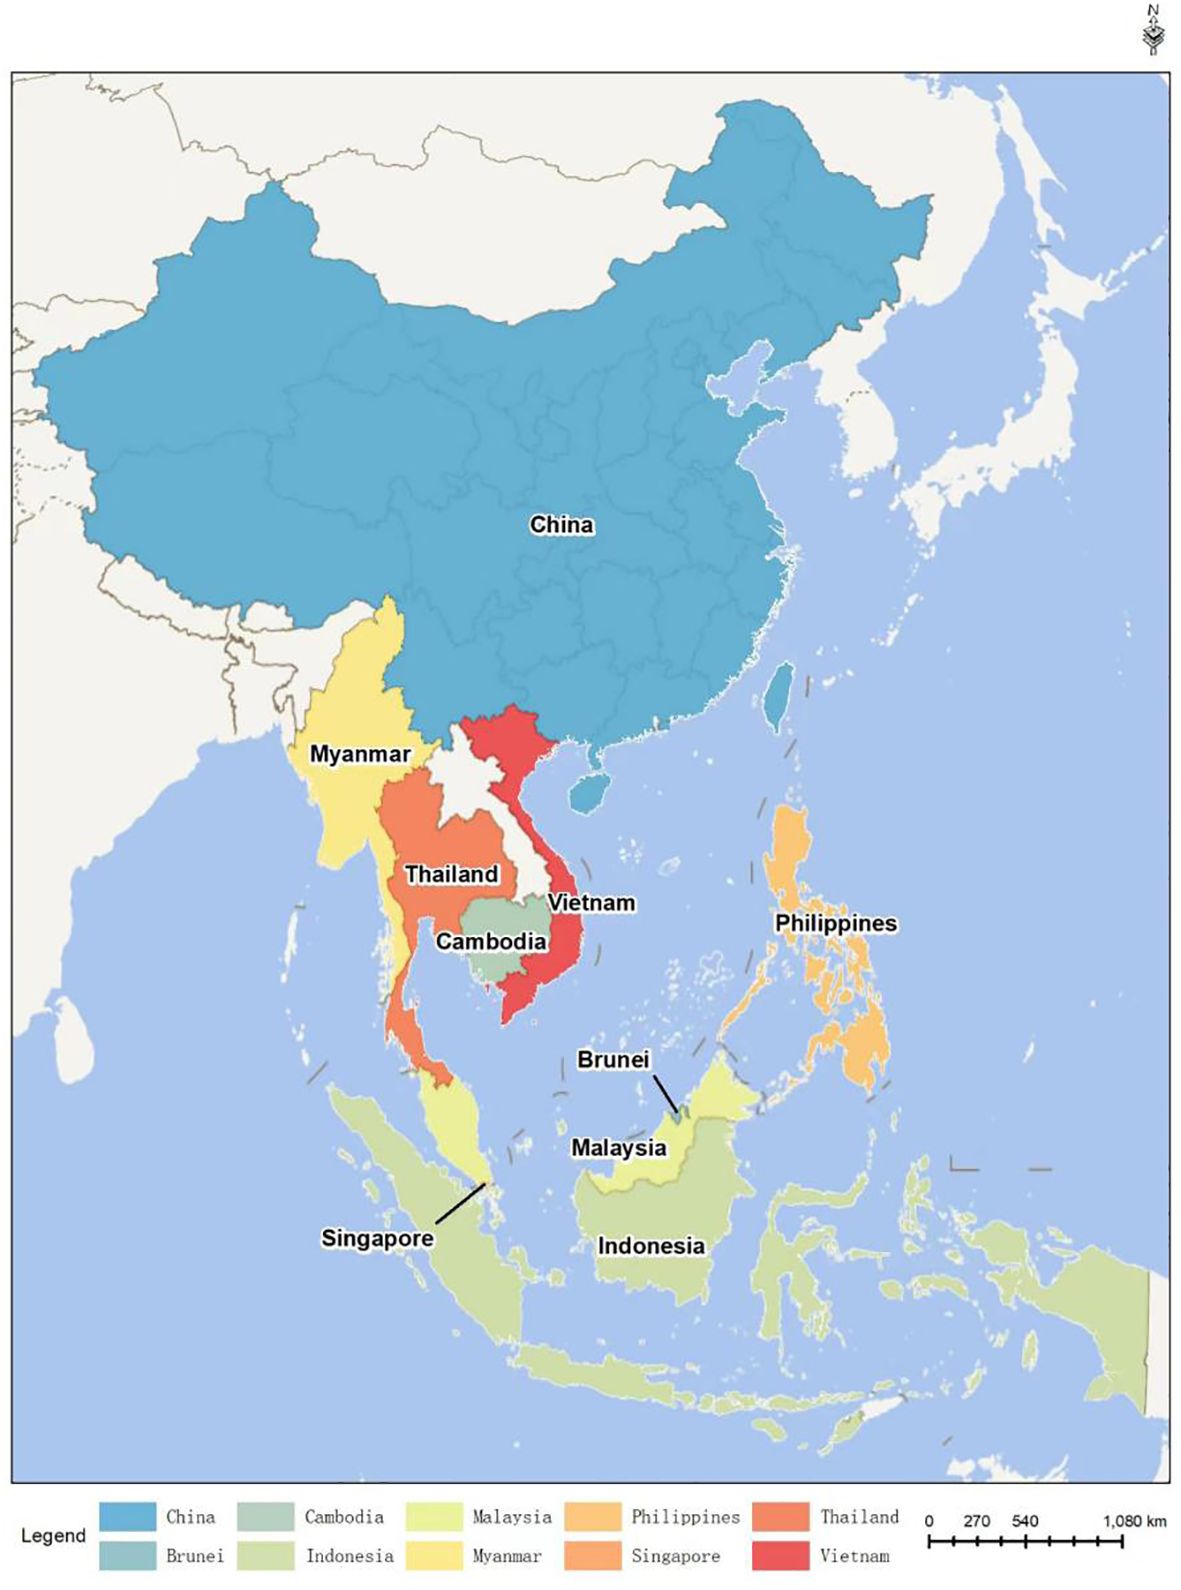
Figure 1 The location of China and ASEAN countries.
3 Materials and methods
Based on the analysis of the protection patterns of three typical marine ecosystems in China and ASEAN countries, this study constructs a set of indicator systems for driving factors of typical marine ecosystem protection patterns. Through factor analysis to identify driving factors, a regression model is then constructed to obtain the regression function, thus clarifying the quantitative relationship between the protection patterns of typical marine ecosystems and their driving factors. The specific research framework is illustrated in Figure 2.
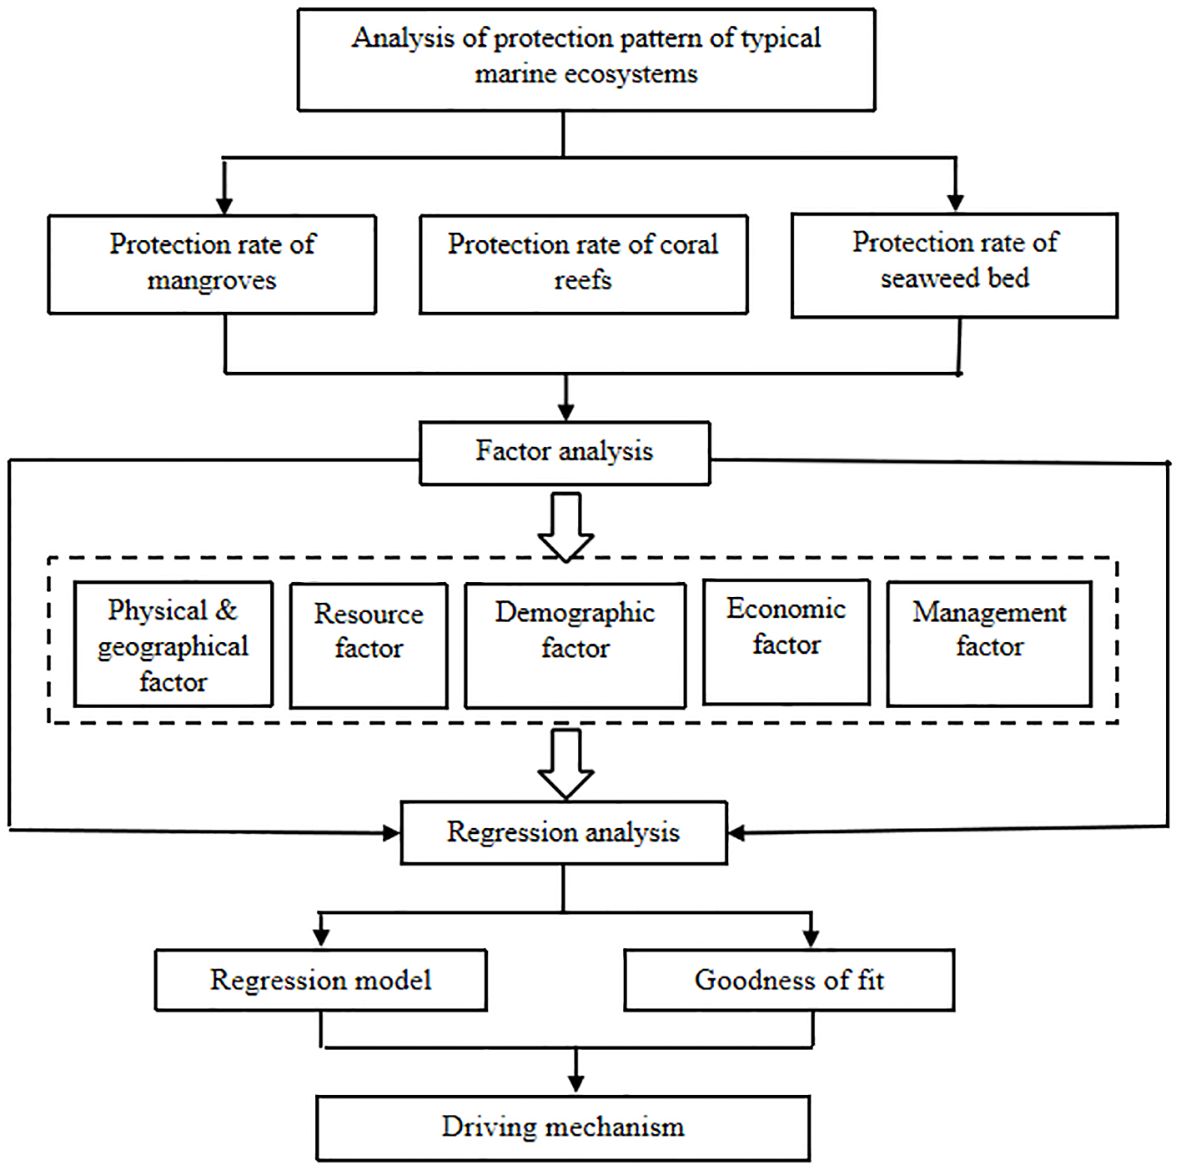
Figure 2 Analysis framework.
3.1 Data collection
Scientific, rational and authoritative data is the key to science. The index data selected in this study are from authoritative sources, as shown in Table 1.
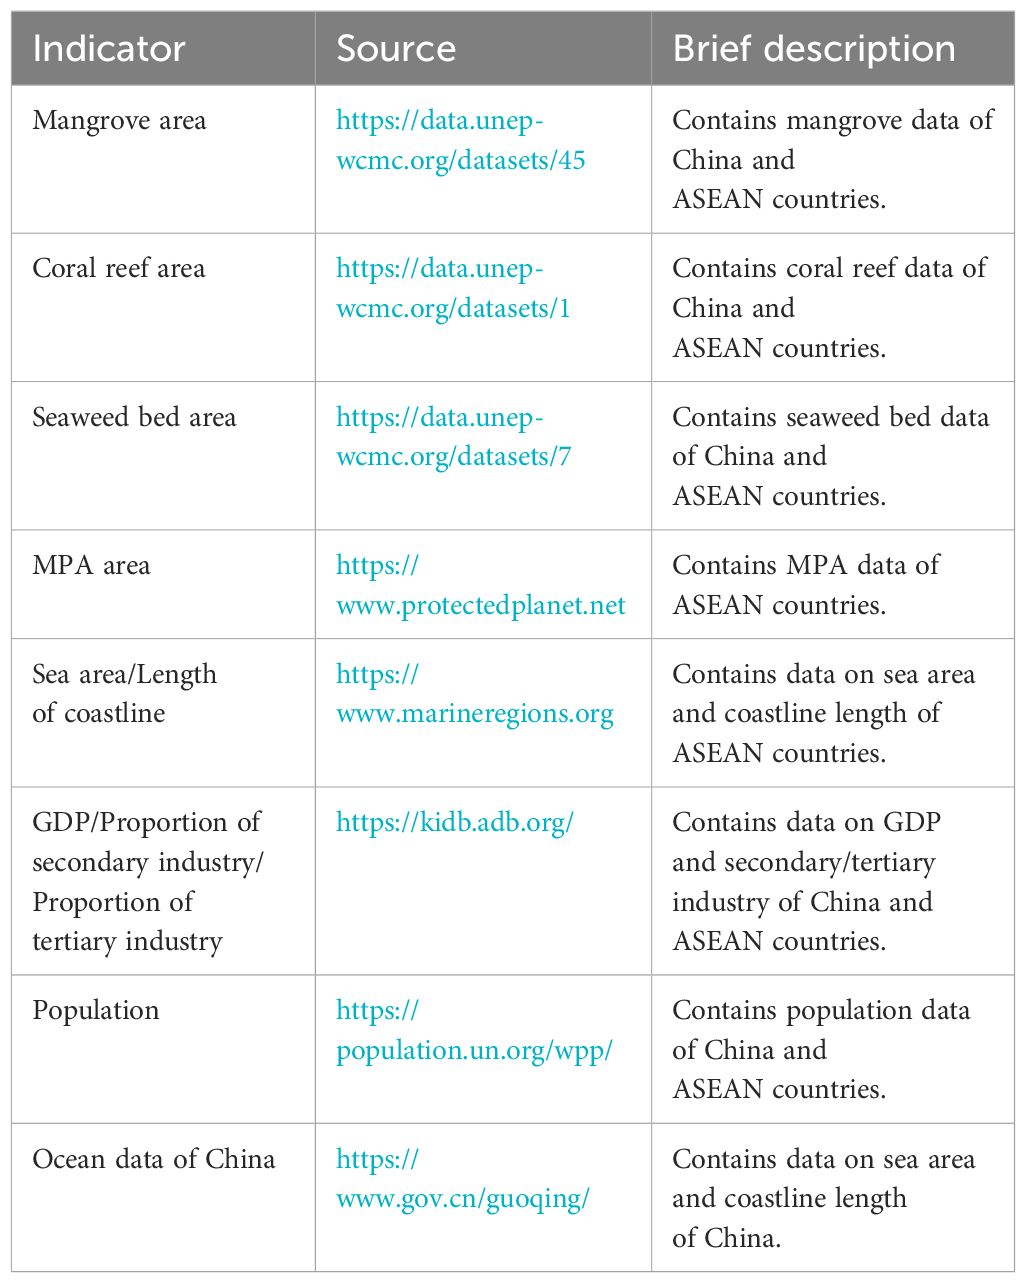
Table 1 Indicator data source.
3.2 Analysis of protection pattern of typical marine ecosystems
More and more marine protected areas have been established to protect and preserve marine natural capital, ecosystem services and cultural values, thus avoiding various threats to coastal and offshore marine ecosystems by human beings (Picone et al., 2020). China-ASEAN countries have established marine protected areas to protect typical marine ecosystems, such as mangroves, coral reefs and seagrass beds, so as to ensure the integrity and stability of these ecosystems. These areas are usually protected by laws and regulations that restrict the development and fishing of mangroves, coral reefs and seagrass beds. In this study, the area and proportion of three typical marine ecosystems in China and ASEAN countries are calculated, and the relationship between the three typical marine ecosystems and marine protected areas is clarified by using arcgis software, thus the protection pattern of three typical marine ecosystems in China and ASEAN countries is obtained.
The calculation formulas for the protection rates of three typical marine ecosystems are shown in Equations 1–4:
here R is the total protection ratio of three typical marine ecosystems in China and ASEAN countries; RM is the protection rate of mangrove mangroves; RC is the protection rate of coral reefs; RS is the protection rate of seaweed bed; AMM, AMC and AMS are the areas of mangroves, coral reefs and seagrass beds located in marine protected areas respectively; AM0, AC0 and AS0 are the total areas of mangroves, coral reefs and seagrass beds in the region respectively.
3.3 Factor analysis
Factor analysis is a statistical technique, which is used to reveal the potential structure or factors in observation data. Factor analysis and its extensions are widely used in the social and behavioral sciences, and can be considered as a useful tool for exploration and model fitting in multivariate analysis (Yalcin and Amemiya, 2002). In this study, it is applied to the analysis of driving factors of typical marine ecosystem protection pattern. The process is divided into two steps. The first step is to construct the index system of driving factors for the protection pattern of of typical marine ecosystems. In the second step, SPSS software is used to screen factors and select driving factors with the elgenvalues greater than 1.0.
This study discusses the factors affecting the protection pattern of typical marine ecosystems, which can be mainly divided into two categories: natural factors and socio-economic factors. As we know, the quantity and importance of three typical marine ecosystem resources is an important natural factor of its protection pattern. The ocean is regarded as the blue territory of the country, and the change of the protection pattern of typical marine ecosystems is essentially the change of sea area utilization mode, that is, from an unprotected state to a protected state, or from a protected state to an unprotected state. Lin et al. investigated the driving factors by analyzing the temporal and spatial changes of the approved reclamation areas under the regional sea use planning (RSUP) system, and thought that policy adjustment and economic factors played a vital role, and the proportion of marine secondary industry also played an important role (Lin et al., 2022). Zhang et al. used remote sensing images to analyze the temporal and spatial changes and driving forces of coastline, and found that the internal factors of driving forces of comprehensive utilization of coastline include economic base, population growth and urbanization level, and the external factors mainly include national macro-policies and external market environment (Zhang et al., 2022). Zhang & Niu analyzed the historical changes and future trends of coastline and coastal beach utilization types in recent decades, and selected GDP per unit land area and population density as driving factors to carry out Drivers-State-Impact (D-S-I) analysis (Zhang and Niu, 2021).
Based on the above analysis, we selected 14 related indicators (Table 2) such as nature, resources, population, economy and management to explore the influencing factors of typical marine ecosystem protection pattern. According to the open source data, the relevant index values of China and ASEAN coastal countries in 2021 were obtained, and the original data matrix of 14 indicators was constructed as the data source for quantitative analysis of the influencing factors of typical marine ecosystem protection pattern, and factor analysis was carried out by SPSS.
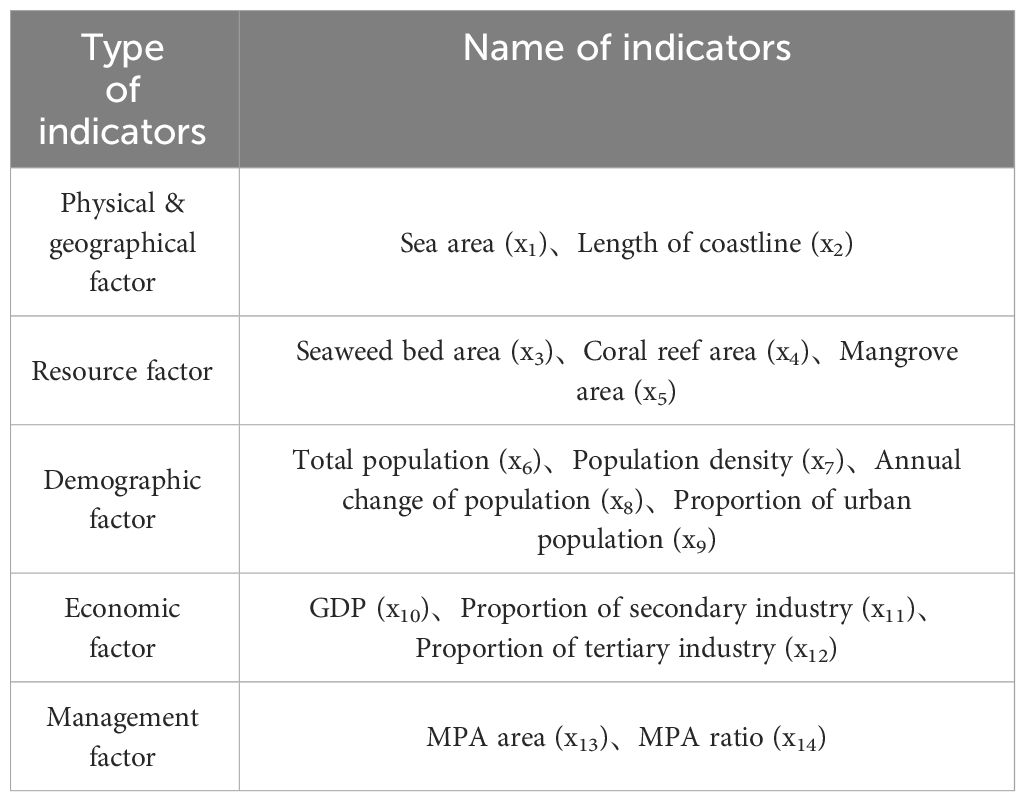
Table 2 The index system of driving factors of typical marine ecosystem protection pattern.
3.4 Regression analysis
Regression analysis is a statistical method for studying the relationship between two or more variables. The main purpose is to describe the relationship between independent variables and dependent variables by establishing a mathematical model (Zvizdojević and Vukotić, 2015; Du et al., 2024), so as to predict or explain the value of dependent variables given independent variables. In this study, the quantitative relationship between the driving factor and the marine ecosystem protection pattern was determined by regression analysis.
The multiple linear regression model is represented by Equation 5:
where is the value of the response variable associated with the th observation and is the constant (intercept) term; is the regression coefficient, and is the residual, which represents the difference between the fitted value and the true value. The regression coefficients can be estimated by the least square method. We used IBM SPSS statistic 24.0 to carry out regression analysis. The specific methods were as follows: the standardized data of each driving factor in China and ASEAN countries were substituted into each factor expression, and the factor score matrix was calculated. The other matrix was obtained by standardizing the protection rate and protection area of marine ecosystems in China and ASEAN. Taking the protection rate and protection area (y1, y2) of marine ecosystems in China and ASEAN as dependent variables, and the driving factors as independent variables, a multiple regression model of marine ecosystem protection pattern and driving factors in China-ASEAN countries was established.
4 Results
4.1 Analysis results of typical ecosystem protection pattern
The analysis results of typical ecosystem protection patterns are shown in Figure 3. The seagrass beds in China-ASEAN countries cover an area of 48,177.79 km2, of which 20.77% are located in marine protected areas, and the coral reefs cover an area of 39,350.65 km2, of which 25.86% are located in marine protected areas. Mangroves cover an area of 37,322.35 km2, of which 9.23% are located in marine protected areas. Generally speaking, the protection rate of mangroves is the lowest among the three typical marine ecosystems in China-ASEAN countries, and protection efforts can be further strengthened in the future.
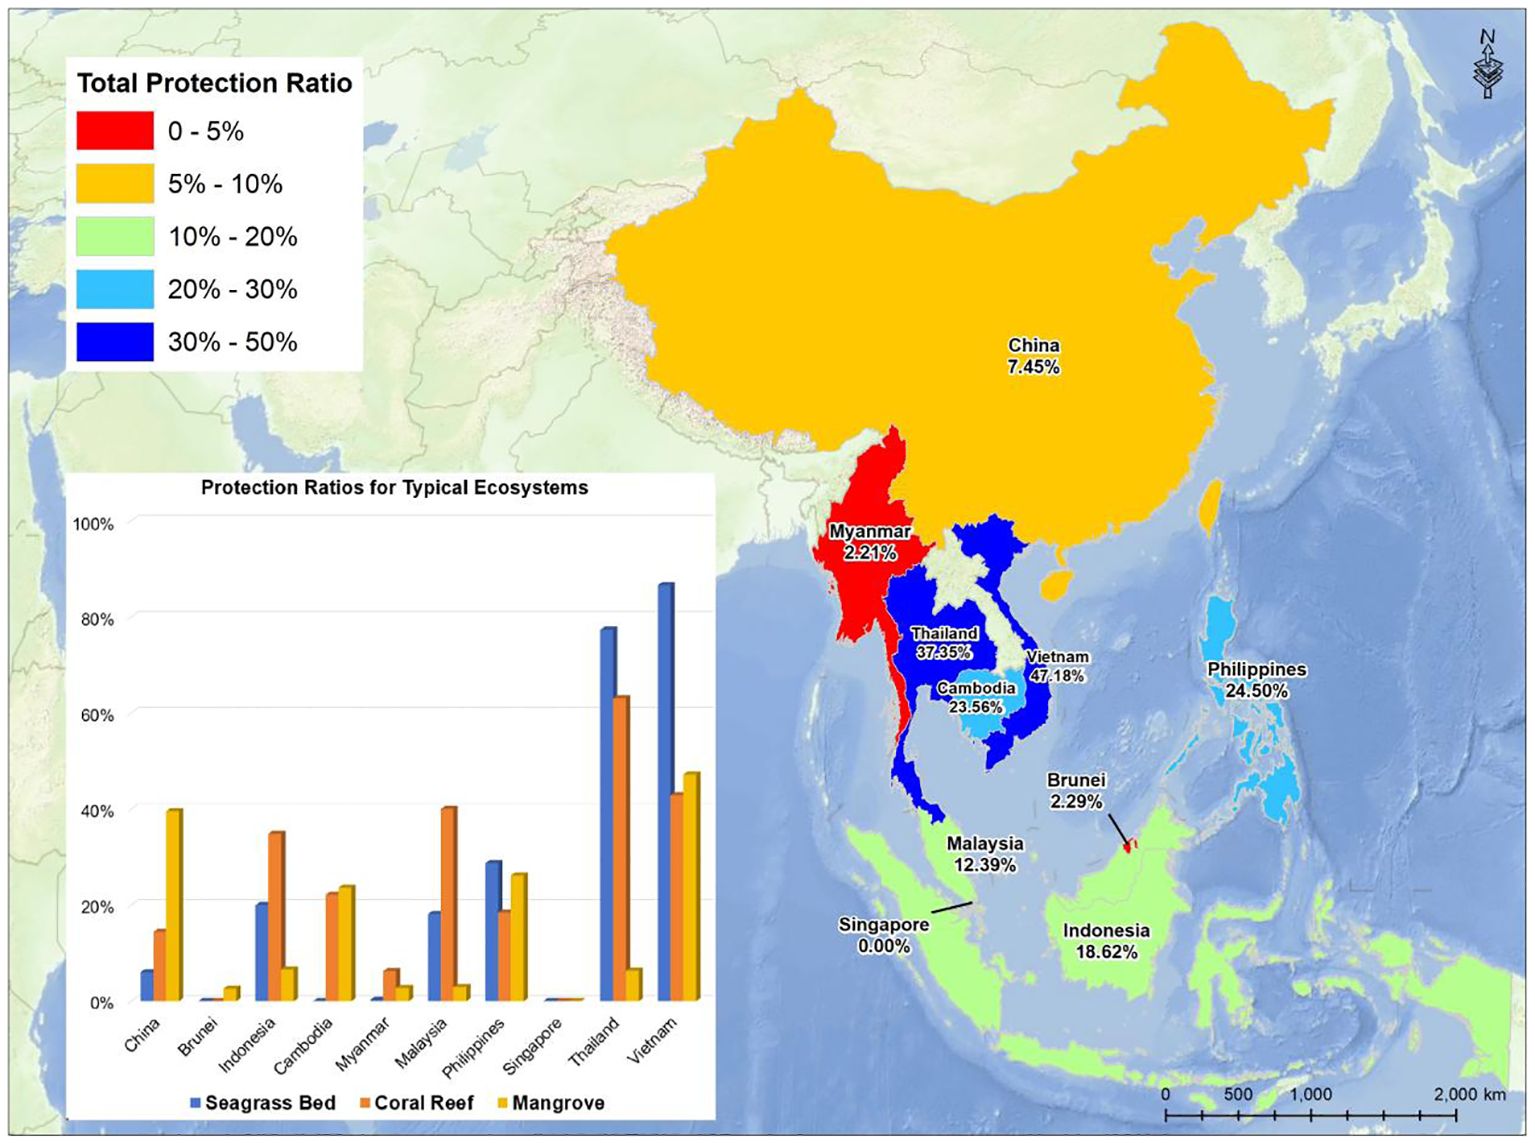
Figure 3 Typical marine habitat protection pattern map of China-ASEAN countries.
As can be seen from Figure 3, the protection rates vary greatly among China-ASEAN countries. The country with the largest area of seagrass bed located in marine protected areas is the Philippines, with a protection rate of 28.76%, while the country with the highest protection rate of seagrass beds is Vietnam, with a protection rate of 86.64%. With 6,966 km2 of coral reefs located in marine protected areas, Indonesia has the highest coral reef protection area among China-ASEAN countries, while Thailand has the highest coral reef protection rate, reaching 63.09%. Among Indonesian mangroves, the area protected by marine protected areas is 1,940 km2, which is the largest among China-ASEAN countries. The country with the highest mangrove protection rate is Vietnam with a protection rate of 47.23%.
The difference of total protection rates of three typical marine ecosystems in China-ASEAN countries is shown in Figure 4. The five countries with the highest total protection rates are Vietnam, Thailand, the Philippines, Cambodia and Indonesia, and the total protection rates of the three typical marine ecosystems all exceed 15%.
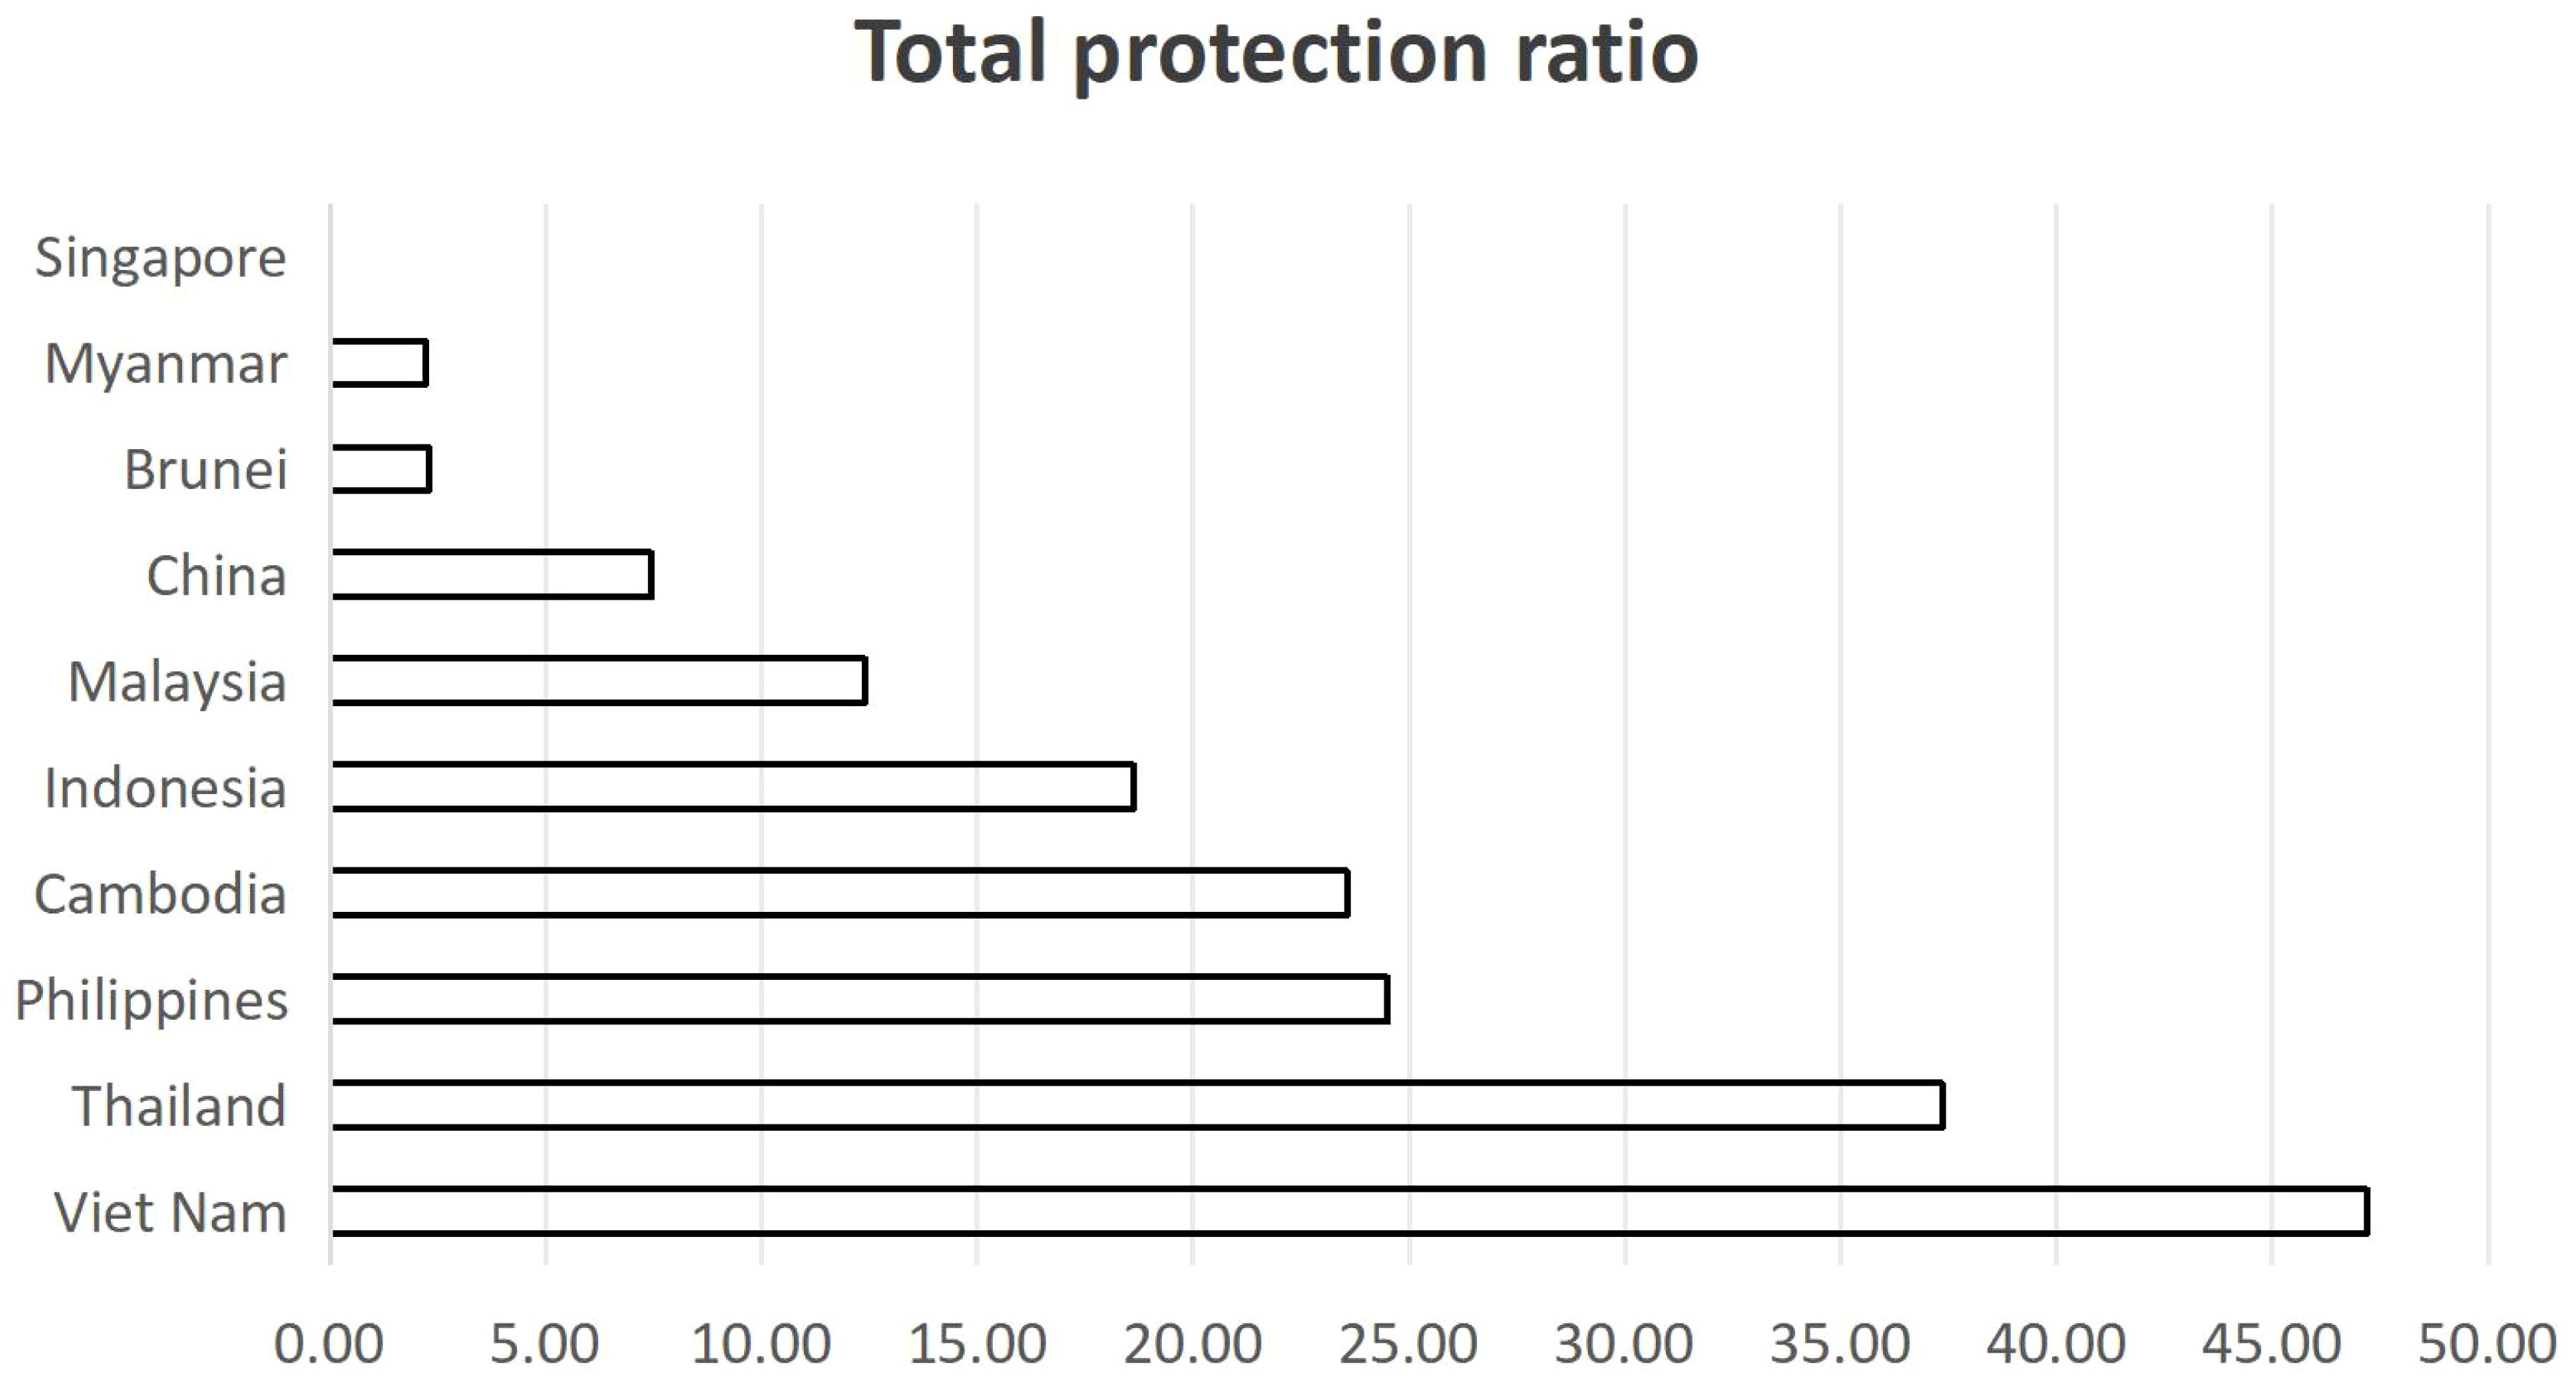
Figure 4 Comparison of total protection rate of typical marine habitats in China-ASEAN countries.
4.2 Factor analysis results
Factor analysis was conducted using the “maximum variance orthogonal rotation method,” and 4 driving factors were extracted based on the principle of elgenvalues greater than 1.0. As shown in Table 3, the cumulative variance contribution rate of the 4 factors reached 90.741%, which comprehensively reflects the driving force information of the typical marine ecosystem conservation patterns represented by the original indicators. Extracting 4 factors is acceptable and scientific. The loadings of the 4 factors are shown in Table 4.
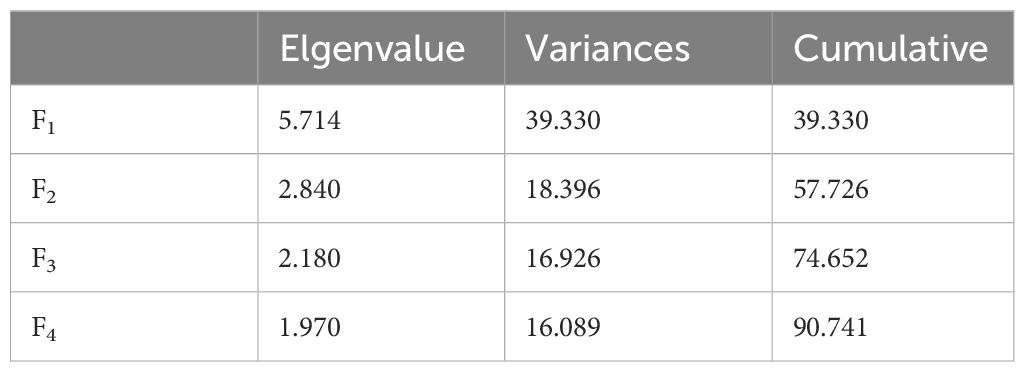
Table 3 The elgenvalues and variances contribution rate.

Table 4 The loading matrix of factors.
From Table 2 and Table 3, it can be observed that the eigenvalue of the first factor (F1) is 5.714, with a variance contribution rate of 39.330%. Variables x1、x2、x3、x4、x5 and x13 exhibit the highest positive loadings on the F1 common factor, showing a positive correlation with F1. Since all of the highly correlated variables with F1 include natural geographic factors, resource factors, and some management factors, F1 can be named as the “Natural Geographic and Resource Factor.” According to the regression algorithm, the factor score function can be computed as:
The eigenvalue of the second factor (F2) is 2.840, with a variance contribution rate of 18.396%. Variables x8, x9 and x14 exhibit the highest loadings on F2. Among them, x8 and x14 have the maximum negative loadings, indicating a negative correlation with F2, while x9 has the maximum positive loading, indicating a positive correlation with F2. Since x9 represents the urban population ratio, which reflects the level of urbanization in the region, F2 can be named the “Urbanization Factor.” The factor score function computed according to the regression algorithm is:
The eigenvalue of the third factor (F3) is 2.180, with a variance contribution rate of 16.926%. Variables x7, x11 and x12 exhibit the highest loadings on F3. Among them, x7 and x12 are positively correlated with F3, while x11 is negatively correlated with it. Since x11 and x12 represent industrial structure factors and have higher loadings, F3 can be named the “Industrial Structure Factor.” The factor score function computed according to the regression algorithm is:
The eigenvalue of the fourth factor (F4) is 1.970, with a variance contribution rate of 16.089%. Variables x6 and x10 exhibit the highest positive loadings on F4, indicating a positive correlation with F4. Based on variables x6 and x10, F4 can be named the “Population Size and GDP Factor.” The factor score function computed according to the regression algorithm is:
From the above quantitative analysis, it can be concluded that the Natural Geographic and Resource Factor is the most important factor affecting the protection pattern of typical ecosystems, followed by the Urbanization Factor, the Industrial Structure Factor and the Population Size and GDP Factor.
4.3 Regression analysis results
R2 is used to measure the goodness of fit of a regression model (Wang et al., 2021), with higher values indicating that the independent variables have stronger explanatory power for the dependent variable (Tu et al., 2019). We found that the regression analysis results of the protection rate of marine ecosystems and driving factors are not satisfactory (the coefficient of determination R2 = 0.473), indicating that regression analysis is not suitable. Therefore, we have only analyzed the regression analysis results of the protection area of the China-ASEAN marine ecosystem and driving factors (F1, F2, F3, F4).
Through regression analysis, the regression model of the protection area of the China-ASEAN marine ecosystem can be obtained as follows.
The coefficient of determination R2 = 0.975 indicates that the four factors can explain 97.5% of the information regarding the protection area of the China-ASEAN typical marine ecosystems. This suggests that the protection area of the China-ASEAN typical marine ecosystems is greatly influenced by these four factors. Moreover, the regression test results show that the linear fitting results are very ideal, indicating that the regression equation can effectively express the relationship of influence.
Firstly, considering the coefficients of each influencing factor in the regression equation, it’s evident that the four factors have different magnitudes of influence on the protection area of typical marine ecosystems. The factor “Natural Geographic and Resource” has the greatest impact, with an increase of one unit resulting in a change of 4025.845 units in the protection area of typical marine ecosystems. The “Urbanization Factor” follows, with an increase of one unit leading to a decrease of 424.823 units in the protection area. The “Population Size and GDP Factor” decreases the protection area by 312.603 units for each unit increase, while the “Industrial Structure Factor” increases the protection area by 226.841 units for each unit increase.
Secondly, considering the signs of the coefficients of the influencing factors in the regression equation, it is noted that the “Natural Geographic and Resource Factor” and “Industrial Structure Factor” have positive effects on the protection area of typical marine ecosystems, whereas the “Urbanization Factor” and “Population Size and GDP Factor” have negative effects.
5 Discussion and conclusion
The research on the protection pattern and driving mechanism of typical marine ecosystems is a highly complex and comprehensive study, involving natural science, social science, economics, management, and other multidisciplinary fields. The innovation and main contribution of this research are embodied in the following three aspects. Firstly, a research framework and model of driving factors for the typical marine ecosystem protection pattern were constructed to guide a systematic analysis of the current situation and mechanisms of the typical marine ecosystem protection pattern. Complexity science emphasizes the hierarchical coupling of ecological and social systems across organizational, spatial, and temporal scales. One of the key challenges in the research and management of social ecosystems is the lack of standardized and rigorously collected data (Leenhardt et al., 2015). This limitation hinders the linkage between changes in ecological processes and dynamic responses within the social system, as well as the subsequent feedback between them. Based on a qualitative analysis of the influencing factors in the typical marine ecosystem protection pattern, this study constructed the index system of driving factors for the typical marine ecosystem protection pattern. The original data matrix was established through open-source data acquisition, and quantitative methods were employed to conduct factor analysis, obtaining the driving factors. This process connected the protection of the typical marine ecosystem with social dynamic changes and provides insights for research in the social ecosystem. Secondly, through quantitative analysis, the relationship between the protection pattern of typical marine ecosystems and driving factors was established. Quantitative analysis allows for the quantification of the strength of the relationship between driving factors and dependent variables (Sušnik, 2018). Through statistical indicators such as the correlation coefficient or regression coefficient, we can determine the degree of influence of each factor on the dependent variable, thus evaluating its importance. In this study, the quantitative relationship between the driving factors and the marine ecosystem protection pattern was determined by regression analysis, resulting in a multiple regression model of the marine ecosystem protection pattern and driving factors. Thirdly, taking China-ASEAN countries as case areas, this research evaluated the protection pattern and driving mechanisms of three typical marine ecosystems. By adopting this method, a comprehensive assessment of the protection status of typical marine ecosystems in China-ASEAN was achieved, and the driving factors and mechanisms of the protection pattern of typical marine ecosystems in China-ASEAN were identified.
Coral reefs, seagrass beds, and mangroves are three important ecological types in marine ecosystems, and their presence and health are directly related to the stability and biodiversity of marine ecosystems (Moberg and Rönnbäck, 2003). The importance of these marine ecosystems is gradually being recognized, and various conservation measures are continuously being proposed (Huang et al., 2019). The establishment of marine protected areas plays a crucial role in the protection of typical marine ecosystems in the region (Yacob et al., 2009; Hu et al., 2020). The analysis of driving factors affecting the protection pattern of typical marine ecosystems in China-ASEAN countries shows that the driving factors influencing their protection pattern include the Natural Geographic and Resource Factor, the Urbanization Factor, the Industrial Structure Factor, and the Population Size and GDP Factor. The results of regression analysis indicate that the Natural Geographic and Resource Factor has the greatest impact, followed by the Urbanization Factor and Population Size and GDP Factor, while the Industrial Structure Factor has the smallest impact. We also found that the Natural Geographic and Resource Factor and the Industrial Structure Factor have a positive impact on the protection area of typical marine ecosystems, while the effects of the other two factors are negative.
The Natural Geographic and Resource Factor is the most important factor affecting the protection pattern of marine ecosystem ecosystems. The resources and natural conditions of coral reefs, seagrass beds and mangroves have a direct relationship with biodiversity (Somerfield et al., 2002). The presence of diverse ecosystems contributes to a greater variety of species and gene pools, essential for the overall health and adaptability of the entire marine ecosystem (Tett et al., 2013). This means higher species richness, which is crucial for maintaining ecological balance and biodiversity, aiding in enhancing species adaptability and resilience to cope with environmental changes and pressures, and increasing the likelihood of various functions and services within the ecosystem being fully utilized (Antão et al., 2020). There is often connectivity among diverse marine ecosystems, creating ecological channels that facilitate the migration, reproduction, and feeding activities of many marine organisms (Schlägel et al., 2020). Preserving this connectivity is crucial for the survival and reproductive success of species. A multitude of marine ecosystems contributes to greater stability and resilience, enhancing the ecosystem’s ability to withstand external pressures and changes (Soulé et al., 2004). In the event of damage to one area, other regions may serve as sources of support and recovery. In general, an increase in the number of marine ecosystems promotes the formation of a more complex, flexible, and stable ecosystem network, thereby improving the overall sustainability of the marine environment. Therefore, when formulating marine ecosystem protection strategies, it is essential to consider the diversity and distribution of marine ecosystems in order to establish a more comprehensive protection pattern.
The Urbanization Factor is another key factor influencing the protection pattern of marine ecosystems. With the advancement of urbanization, the proportion of urban population continues to increase, industrialization levels rise, and the demand for marine resources, including fishery products, energy, and pharmaceuticals, also increases (Kennish, 2002). This may lead to problems such as overfishing, overexploitation, and other forms of excessive resource use, putting pressure on marine ecosystems. Pollutants such as wastewater, plastic waste, and chemicals emitted during urbanization can directly harm marine ecosystems (Ray, 2011). This can well explain why the urbanization factor is a negative factor for the protection of typical marine ecosystems.
The Industrial Structure factor is the third key factor influencing the pattern of marine ecosystem protection. The development of certain industries may result in overfishing, pollution, and other adverse impacts on marine ecosystems (Islam and Tanaka, 2004), while others may not. This is because different industrial structures may lead to various types of marine resource utilization and environmental impact (Klinger et al., 2018). The income of most small-scale coastal fishermen relies on marine resources. If they engage in fishing activities without protective measures, the ecosystem may be threatened. Therefore, restrictions on the timing, spatial distribution, fishing gear, and catch quotas of fishing activities are necessary (Rees et al., 2020). The secondary industry may result in the discharge of a significant amount of wastewater, waste gas, and solid waste, some of which may enter the marine environment. These emissions may contain harmful substances, causing pollution to the marine ecosystem and posing a threat to the survival and reproduction of marine life (Okereke et al., 2016). Science, technology, and research institutions in the tertiary industry may contribute to the monitoring and protection of marine ecosystems through innovative technologies and methods (Rose et al., 2014). The tourism industry, as a tertiary sector, is often utilized as a livelihood strategy to complement biodiversity conservation efforts in protected areas. Specifically, its aim is to replace traditional income-generating activities in the region and improve community well-being, ultimately reducing poverty and alleviating threats to biodiversity (Pham, 2020). The above explanation elucidates the negative correlation between the proportion of the secondary industry (x11) and F3, as well as the positive correlation between the proportion of the tertiary industry (x12) and F3. The rationalization of industrial structure and increased investment in scientific research play a significant promoting role in the efficiency of marine environmental conservation (Wang et al., 2020). Overall, the industrial structure factor is considered a positive factor for typical marine ecosystem conservation. From a management perspective, comprehensive measures need to be taken to ensure the coordinated development of industries and the protection of the marine environment.
The Population Size and GDP Factor is the fourth key factor affecting the protection pattern of marine ecosystems. An increase in the total population is usually accompanied by a rise in the demand for marine resources. A high GDP is typically associated with stronger economic activities, including fisheries, industry, and trade. These activities can have both direct and indirect impacts on marine ecosystems, such as overfishing, coastal development, and industrial pollution (Jiang et al., 2001). While a high GDP may lead to the development of science and technology, resulting in more effective fishery and resource development in some cases, it may also introduce new environmental problems like overfishing and ecosystem destruction. A higher GDP is generally accompanied by stronger government and environmental management capabilities, aiding in the implementation and supervision of environmental protection policies. Overall, the Population Size and GDP Factor has a complex and interrelated impact on the protection of marine ecosystems (Güneralp and Seto, 2008). Therefore, achieving sustainable marine ecosystem management requires a comprehensive consideration of the balance between population growth, economic development, and environmental protection to ensure the sustainable utilization of marine resources and the health of ecosystems.
The protection pattern involves identifying and implementing a series of management policies to maintain the health and stability of typical marine ecosystems. This may include establishing natural reserves, managing fishing activities, restricting pollution, among other measures, to ensure the biodiversity and ecological balance of marine ecosystems. This process requires the effective implementation of marine spatial planning to maximize benefits, minimize conflicts, and safeguard the marine environment. Planning can coordinate the needs of various stakeholders, such as fisheries, shipping, and energy development, to ensure the sustainable utilization of marine resources. In terms of various ecological, economic, and social management objectives, designing a well-planned marine protected area network can surpass individual marine protected areas (Grorud-Colvert et al., 2014). Since typical marine ecosystems often span national borders, international cooperation is essential for their effective management and protection. International collaboration can facilitate the sharing of information, scientific research cooperation, joint monitoring, and the development of standardized regulations, thereby enhancing the effectiveness of conservation measures. The existing marine protected area network in China and ASEAN region includes regional networks of international marine protected areas, regional marine protected area networks, sub-regional marine protected area networks, and marine protected area networks of individual countries or regions. Regional networks of international marine protected areas, such as World Heritage sites, biosphere reserves, and internationally important wetlands, reflect the proactive awareness and efforts of countries and stakeholders within the region in biodiversity conservation. The initiation of relevant initiatives and projects meets the practical development needs and priority concerns of different countries and regions.
Data availability statement
The original contributions presented in the study are included in the article/supplementary material. Further inquiries can be directed to the corresponding authors.
Author contributions
FC: Conceptualization, Methodology, Writing – original draft, Writing – review & editing. ZC: Data curation, Writing – original draft. JW: Visualization, Writing – original draft. YJ: Data curation, Writing – original draft. FC: Writing – review & editing.
Funding
The author(s) declare financial support was received for the research, authorship, and/or publication of this article. This research was financially supported by the National Social Science Fund of China (Grant No. 22BGL185).
Conflict of interest
The authors declare that the research was conducted in the absence of any commercial or financial relationships that could be construed as a potential conflict of interest.
Publisher’s note
All claims expressed in this article are solely those of the authors and do not necessarily represent those of their affiliated organizations, or those of the publisher, the editors and the reviewers. Any product that may be evaluated in this article, or claim that may be made by its manufacturer, is not guaranteed or endorsed by the publisher.
Footnotes
- ^ Marine Protected Areas coverage in 2022, www.protectedplanet.net, accessed October 8th, 2022.
References
Akram H., Hussain S., Mazumdar P., Chua K. O., Butt T. E., Harikrishna J. A. (2023). Mangrove health: A review of functions, threats, and challenges associated with mangrove management practices. Forests 14, 1698. doi: 10.3390/f14091698
Antão L. H., Bates A. E., Blowes S. A., Waldock C., Supp S. R., Magurran A. E., et al. (2020). Temperature-related biodiversity change across temperate marine and terrestrial systems. Nat. Ecol. Evol. 4, 927–933. doi: 10.1038/s41559-020-1185-7
Bohorquez J. J., Dvarskas A., Pikitch E. K. (2019). Categorizing global MPAs: A cluster analysis approach. Mar. Policy 108, 103663. doi: 10.1016/j.marpol.2019.103663
Brodie G., Holland E., N'Yeurt A. D. R., Soapi K., Hills J. (2020). Seagrasses and seagrass habitats in Pacific small island developing states: Potential loss of benefits via human disturbance and climate change. Mar. Pollut. Bull. 160, 111573. doi: 10.1016/j.marpolbul.2020.111573
Burbano D. V., Meredith T. C., Mulrennan M. E. (2020). Exclusionary decision-making processes in marine governance: The rezoning plan for the protected areas of the 'iconic' Galapagos Islands, Ecuador. Ocean Coast. Manage. 185, 105066. doi: 10.1016/j.ocecoaman.2019.105066
Calado H., Bentz J. (2013). The Portuguese maritime spatial plan. Mar. Policy 42, 325–333. doi: 10.1016/j.marpol.2013.03.014
Camargo C., Maldonado J. H., Alvarado E., Moreno-Sánchez R., Mendoza S., Manrique N., et al. (2009). Community involvement in management for maintaining coral reef resilience and biodiversity in southern Caribbean marine protected areas. Biodiversity Conserv. 18, 935–956. doi: 10.1007/s10531-008-9555-5
Cantasano N., Pellicone G. (2014). Marine and river environments: A pattern of Integrated Coastal Zone Management (ICZM) in Calabria (Southern Italy). Ocean Coast. Manage. 89, 71–78. doi: 10.1016/j.ocecoaman.2013.12.007
Cinner J. E., Daw T., Huchery C., Thoya P., Wamukota A., Cedras M., et al. (2014). Winners and losers in marine conservation: Fishers’ displacement and livelihood benefits from marine reserves. Soc. Natural Resour. 27, 994–1005. doi: 10.1080/08941920.2014.918229
Clifton J., Unsworth R. K. F., Smith D. J. (2010). Marine Research and Conservation in the Coral Triangle: the Wakatobi National Park (Inc, New York: Nova Science Publishers).
Douvere F. (2008). The importance of marine spatial planning in advancing ecosystem-based sea use management. Mar. Policy 32, 762–771. doi: 10.1016/j.marpol.2008.03.021
Du B., Ye S., Gao P., Ren S., Liu C., Song C. (2024). Analyzing spatial patterns and driving factors of cropland change in China's National Protected Areas for sustainable management. Sci. Total Environ. 912, 169102. doi: 10.1016/j.scitotenv.2023.169102
Edgar G. J., Stuart-Smith R. D., Willis T. J., Kininmonth S., Baker S. C., Banks S., et al. (2014). Global conservation outcomes depend on marine protected areas with five key features. Nature 506, 216–220. doi: 10.1038/nature13022
Grantham H. S., Agostini V. N., Wilson J., Mangubhai S., Hidayat N., Muljadi A., et al. (2013). A comparison of zoning analyses to inform the planning of a marine protected area network in Raja Ampat, Indonesia. Mar. Policy 38, 184–194. doi: 10.1016/j.marpol.2012.05.035
Grorud-Colvert K., Claudet J., Tissot B. N., Caselle J. E., Carr M. H., Day J. C., et al. (2014). Marine protected area networks: assessing whether the whole is greater than the sum of its parts. PLoS One 9, e102298. doi: 10.1371/journal.pone.0102298
Güneralp B., Seto K. C. (2008). Environmental impacts of urban growth from an integrated dynamic perspective: A case study of Shenzhen, South China. Global Environ. Change 18, 720–735. doi: 10.1016/j.gloenvcha.2008.07.004
Hooker S. K., Gerber L. R. (2004). Marine reserves as a tool for ecosystem-based management: the potential importance of megafauna. BioScience 54, 27–39. doi: 10.1641/0006-3568(2004)054[0027:MRAATF]2.0.CO;2
Hu W., Liu J., Ma Z., Wang Y., Zhang D., Yu W., et al. (2020). China's marine protected area system: Evolution, challenges, and new prospects. Mar. Policy 115, 103780. doi: 10.1016/j.marpol.2019.103780
Huang F., Lin Y., Zhao R., Qin X., Chen Q., Lin J. (2019). Dissipation theory-based ecological protection and restoration scheme construction for reclamation projects and adjacent marine ecosystems. Int. J. Environ. Res. Public Health 16, 4303. doi: 10.3390/ijerph16214303
Humphreys J., Herbert R. (2018). Marine protected areas: science, policy & management. Estuarine Coast. Shelf Sci. 215, 215–218. doi: 10.1016/j.ecss.2018.10.014
Islam M. S., Tanaka M. (2004). Impacts of pollution on coastal and marine ecosystems including coastal and marine fisheries and approach for management: a review and synthesis. Mar. Pollut. Bull. 48, 624–649. doi: 10.1016/j.marpolbul.2003.12.004
Jiang Y., Kirkman H., Hua A. (2001). Megacity development: managing impacts on marine environments. Ocean Coast. Manage. 44, 293–318. doi: 10.1016/S0964-5691(01)00052-7
Kamil K. A., Hailu A., Rogers A., Pandit R. (2017). An assessment of marine protected areas as a marine management strategy in Southeast Asia: A literature review. Ocean Coast. Manage. 145, 72–81. doi: 10.1016/j.ocecoaman.2017.05.008
Kennish M. J. (2002). Environmental threats and environmental future of estuaries. Environ. Conserv. 29, 78–107. doi: 10.1017/S0376892902000061
Kim Y., Kim C.-k., Lee D. K., Lee H.-w., Andrada R. II. T. (2019). Quantifying nature-based tourism in protected areas in developing countries by using social big data. Tourism Manage. 72, 249–256. doi: 10.1016/j.tourman.2018.12.005
Klinger D. H., Eikeset A. M., Davíðsdóttir B., Winter A. M., Watson J. R. (2018). The mechanics of blue growth: Management of oceanic natural resource use with multiple, interacting sectors. Mar. Policy 87, 356–362. doi: 10.1016/j.marpol.2017.09.025
Knowlton N. (2004). Multiple “stable” states and the conservation of marine ecosystems. Prog. Oceanography 60, 387–396. doi: 10.1016/j.pocean.2004.02.011
Leenhardt P., Teneva L., Kininmonth S., Darling E., Cooley S., Claudet J. (2015). Challenges, insights and perspectives associated with using social-ecological science for marine conservation. Ocean Coast. Manage. 115, 49–60. doi: 10.1016/j.ocecoaman.2015.04.018
Lin Y., Xue X., Hu W., Chen Q., Zhang Y., Huang F., et al. (2022). Implementing Regional Sea Use Planning system in China: Evolution, drivers and experiences. Mar. Policy 146, 105298. doi: 10.1016/j.marpol.2022.105298
Mascia M. B., Claus C. A., Naidoor R. (2010). Impacts of marine protected areas on fishing communities. Conserv. Biol. 24, 1424–1429. doi: 10.1111/j.1523-1739.2010.01523.x
Moberg F., Rönnbäck P. (2003). Ecosystem services of the tropical seascape: interactions, substitutions and restoration. Ocean Coast. Manage. 46, 27–46. doi: 10.1016/S0964-5691(02)00119-9
Obura D. O., Katerere Y., Mayet M., Kaelo D., Msweli S., Mather K., et al. (2021). Integrate biodiversity targets from local to global levels. Science 373, 746–748. doi: 10.1126/science.abh2234
Okereke J. N., Ogidi O. I., Obasi K. O. (2016). Environmental and health impact of industrial WastewaterEffluents in Nigeria - A review. Int. J. Advanced Res. Biol. Sci. 3, 55–67.
Pham T. T. T. (2020). Tourism in marine protected areas: Can it be considered as an alternative livelihood for local communities? Mar. Policy 115, 103891. doi: 10.1016/j.marpol.2020.103891
Picone F., Buonocore E., Claudet J., Chemello R., Russo G. F., Franzese P. P. (2020). Marine protected areas overall success evaluation (MOSE): A novel integrated framework for assessing management performance and social-ecological benefits of MPAs. Ocean Coast. Manage. 198, 105370. doi: 10.1016/j.ocecoaman.2020.105370
Ray S. (2011). Impact of population growth on environmental degradation: case of India. J. Economics Sustain. Dev. 2, 72–77.
Reed J. R., Lombard, Amanda T., Sink K. J. (2020). A diversity of spatial management instruments can support integration of fisheries management and marine spatial planning. Mar. Policy 119, 104089. doi: 10.1016/j.marpol.2020.104089
Rees S. E., Sheehan E. V., Stewart B. D., Clark R., Appleby T., Attrill M. J., et al. (2020). Emerging themes to support ambitious UK marine biodiversity conservation. Mar. Policy 117, 103864. doi: 10.1016/j.marpol.2020.103864
Rose R. A., Byler D. J., Eastman R., Fleishman E., Geller G., Goetz S., et al. (2014). Ten ways remote sensing can contribute to conservation. Conserv. Biol. 29, 350–359. doi: 10.1111/cobi.12397
Sala E., Lubchenco J., Grorud-Colvert K., Novelli C., Roberts C., Sumaila U. R. (2018). Assessing real progress towards effective ocean protection, Marine. Policy 91, 11–13. doi: 10.1016/j.marpol.2018.02.004
Schlägel U. E., Grimm V., Blaum N., Colangeli P., Dammhahn M., Eccard J. A., et al. (2020). Movement-mediated community assembly and coexistence. Biol. Rev. 95, 1073–1096. doi: 10.1111/brv.12600
Somerfield P., Yodnarasri S., Aryuthaka C. (2002). Relationships between seagrass biodiversity and infaunal communities: implications for studies of biodiversity effects. Mar. Ecol. Prog. Ser. 237, 97–109. doi: 10.3354/meps237097
Sørensen T. K., Thomsen L. N. (2009). A comparison of frameworks and objectives for implementation of marine protected areas in Northern Europe and in Southeast Asia. Aquat. Ecosystem Health Manage. 12, 258–263. doi: 10.1080/14634980903140323
Soulé M. E., Mackey B. G., Recher H. F., Williams J. E., Woinarski J. C. Z., Driscoll D., et al. (2004). The role of connectivity in Australian conservation. Pacific Conserv. Biol. 10, 266. doi: 10.1071/PC040266
Sušnik J. (2018). Data-driven quantification of the global water-energy-food system. Resources Conserv. Recycling 133, 179–190. doi: 10.1016/j.resconrec.2018.02.023
Tett P., Gowen R. J., Painting S. J., Elliott M., Forster R., Mills D. K., et al. (2013). Framework for understanding marine ecosystem health. Mar. Ecol. Prog. Ser. 494, 1–27. doi: 10.3354/meps10539
Tu M., Liu Z., He C., Fang Z., Lu W. (2019). The relationships between urban landscape patterns and fine particulate pollution in China: A multiscale investigation using a geographically weighted regression model. J. Of Cleaner Production 237, 117744. doi: 10.1016/j.jclepro.2019.117744
United Nations Environment Programme (2011). Strategic Plan for Biodiversity 2011-2020: Further Information Related to the Technical Rationale for the Aichi Biodiversity Targets, Including Potential Indicators and Milestones (New York: UNEP).
Wang X., Chu B., Feng X., Li Y., Fu B., Liu S., et al. (2021). Spatiotemporal variation and driving factors of water yield services on the Qingzang Plateau. Geogr. Sustainability 2, 31–39. doi: 10.1016/j.geosus.2021.02.002
Wang S., Xing L., Chen H. (2020). Impact of marine industrial structure on environmental efficiency. Manage. Environ. Quality: Int. J. 31, 111–129. doi: 10.1108/MEQ-06-2019-0119
Wilkinson C., Caillaud A., DeVantier L., South R. (2006). Strategies to reverse the decline in valuable and diverse coral reefs, mangroves and fisheries: the bottom of the J-Curve in Southeast Asia? Ocean Coast. Manage. 49, 764–778. doi: 10.1016/j.ocecoaman.2006.06.014
Woodruff D. S. (2010). Biogeography and conservation in Southeast Asia: how 2.7 million years repeated environmental fluctuation affect today's pattern and future of the remaining refugial-phase biodiversity. Biodiversity Conserv. 19, 919–941. doi: 10.1007/s10531-010-9783-3
Worm B., Barbier E. B., Beaumont N., Duffy J. E., Folke C., Halpern B. S., et al. (2006). Impacts of biodiversity loss on ocean ecosystem services. Science 314, 787–790. doi: 10.1126/science.1132294
Xu W., He M., Meng W., Zhang Y., Yun H., Lu Y., et al. (2022). Temporal-spatial change of China's coastal ecosystems health and driving factors analysis. Sci. Total Environ. 845, 157319. doi: 10.1016/j.scitotenv.2022.157319
Yacob M. R., Radam A., Shuib A. (2009). A contingent valuation study of marine parks ecotourism: the case of Pulau Payar and Pulau Redang in Malaysia. J. Sustain. Dev. 2, 95–105. doi: 10.5539/jsd.v2n2p95
Yalcin I., Amemiya Y. (2002). Nonlinear factor analysis as a statistical method. Stat. Sci. 16, 275–294. doi: 10.1214/ss/1009213729
Yang Z., Chandran S. D., Zhao Y. (2023). ASEAN, China and South China Sea: Alternative approach for security cooperation. Bussecon Rev. Soc. Sci. (2687-2285) 4, 25–31. doi: 10.36096/brss.v4i2.387
Zhang L., Li G., Liu S., Wang N., Yu D., Pan Y., et al. (2022). Spatiotemporal variations and driving factors of coastline in the Bohai Sea. J. Ocean Univ. China 21, 1517–1528. doi: 10.1007/s11802-022-5114-z
Zhang T., Niu X. (2021). Analysis on the utilization and carrying capacity of coastal tidal flat in bays around the Bohai Sea. Ocean Coast. Manage. 203, 105449. doi: 10.1016/j.ocecoaman.2020.105449
Keywords: China-ASEAN countries, driving factor, protection pattern, regression analysis, typical marine ecosystems
Citation: Chen F, Cui Z, Wu J, Jiang Y and Cai F (2024) Protection pattern and driving mechanism of typical marine ecosystems: a case study of China-ASEAN countries. Front. Mar. Sci. 11:1378188. doi: 10.3389/fmars.2024.1378188
Received: 29 January 2024; Accepted: 03 April 2024;
Published: 22 April 2024.
Edited by:
James Scott Maki, Marquette University, United StatesReviewed by:
Qutu Jiang, The University of Hong Kong, Hong Kong SAR, ChinaYangfan Li, Xiamen University, China
Copyright © 2024 Chen, Cui, Wu, Jiang and Cai. This is an open-access article distributed under the terms of the Creative Commons Attribution License (CC BY). The use, distribution or reproduction in other forums is permitted, provided the original author(s) and the copyright owner(s) are credited and that the original publication in this journal is cited, in accordance with accepted academic practice. No use, distribution or reproduction is permitted which does not comply with these terms.
*Correspondence: Fenggui Chen, Y2hlbmZlbmdndWlAdGlvLm9yZy5jbg==; Yuhuan Jiang, amlhbmd5dWh1YW5AdGlvLm9yZy5jbg==