 Ali K. Ibrahim1,2*
 Hanqi Zhuang2
 Michelle Schärer-Umpierre3
 Caroline Woodward1
 Nurgun Erdol2
 Laurent M. Chérubin1
- 1Harbor Branch Oceanographic Institute, Florida Atlantic University, Fort Pierce, FL, United States
- 2Department of Electrical Engineering and Computer Science (EECS), Florida Atlantic University, Boca Raton, FL, United States
- 3HJR Reefscaping, Boquerón, Puerto Rico
In this paper, we present the first machine learning package developed specifically for fish calls identification within a specific range (0–500Hz) that encompasses four Caribbean grouper species: red hind (E. guttatus), Nassau (E. striatus), yellowfin (M. venenosa), and black (M. bonaci). Because of their ubiquity in the soundscape of the grouper’s habitat, squirrelfish (Holocentrus spp.) sounds along with vessel noise are also detected. In addition the model is also able to separate grouper species call types. This package called FADAR, the Fish Acoustic Detection Algorithm Research is a standalone user-friendly application developed in Matlab™. The concept of FADAR is the product of the evaluation of various deep learning architectures that have been presented in a series of published articles. FADAR is composed of a main algorithm that can detect all species calls including their call types. The architecture of this model is based on an ensemble approach where a bank of five CNNs with randomly assigned hyperparameters are used to form an ensemble of classifiers. The outputs of all five CNNs are combined by a fusion process for decision making. At the species level, the output of the multimodel is thus used to classify the calls in terms of their types. This is done by species specific deep learning models that have been thoroughly evaluated in the literature on the species concerned here, including transfer learning for red hind and yellowfin groupers and custom designed CNN for Nassau grouper, which has a greater number of known call types than the other species. FADAR was manually trained on a diversity of data that span various regions of the Caribbean Sea and also two recorder brands, hydrophone sensitivities, calibrations and sampling rates, including a mobile platform. This strategy has conferred FADAR substantive robustness to a diversity of noise level and sources that can be found in the grouper calls frequency band such as vessels and marine mammals. Performance metrics based on sensitivity (recall) and specificity showed the same performance level for both balanced and unbalanced datasets and at locations not used in the training set.
1 Introduction
Many fish species undergo long distance migrations, where mature adults gather in high densities to form large spawning aggregations that are reoccurring in time and space (Domeier and Colin, 1997). Many known fish spawning aggregations (FSA) sites are also multi-species breeding hot spots (Heyman and Kjerfve, 2008), which increases the vulnerability of these spawning populations to harvest and environmental changes (Erisman and Rowell, 2017). Site fidelity, temporal predictability, bathymetric features (i.e. shelf-break, capes) and circulation anomalies (eddies, flow reversals) are some of the major characteristics of the spawning habitat (Claro and Lindeman, 2003; Kobara and Heyman, 2008; Chérubin et al., 2011; Kobara et al., 2013; Reglero et al., 2018). While these characteristics ensure reproductive success, their predictability is the cause of over-exploitation and depletion of aggregating populations (Sadovy, 1997; Sala et al., 2001). Of numerous historical Caribbean-wide FSAs (Smith, 1972; Eklund et al., 2000), only a few are protected and remain to date while many are in need of protection (Sadovy et al., 2008). They play a critical role in the persistence of marine populations and their disappearance through the extirpation of large predatory fishes contributes to top-down changes in coral reef ecosystems and biodiversity loss (Mumby et al., 2006).
While many of the FSAs are known to fishers, which they specifically target during spawning season, not all of them have been documented. There may be unreported FSAs, which, if discovered, would contribute to the assessment of the grouper population, for example, in the greater Caribbean region and elsewhere in the world. Characterization of the FSAs in terms of the timing, duration, sex ratio and size of the aggregation is crucial for stock assessment, the design and evaluation of management measures, and conservation. FSAs, being the sole reproductive events, are critical to the marine ecosystem. They are globally under threat because of their small numbers and size, which negatively impacts the fish population and the ecosystem, along with the livelihood and socioeconomic of the fishing communities.
More than eight hundred soniferous fish species have been identified (Looby et al., 2022; Rice et al., 2022). Among them, codfishes, drum fishes, grunts, groupers, snappers, jacks, and catfishes are part of the most abundant and commercially important species (Rountree et al., 2006). Invertebrates also produce sounds. Among those, important to fisheries, are white shrimp (Penaeus setiferus) Berk (1998), spiny lobsters (Palinuridae) (Moulton, 1957; Fish, 1964; Patek, 2002), American lobster (Homarus americanus) (Fish, 1966; Henninger et al., 2005), mussels (Mytilus edulis), sea urchins (Fish, 1964), and perhaps squid (Theuthida) (Iversen et al., 1963). Most soniferous fish species produce low frequency sounds, usually below 1000 Hz (Ladich, 2004) that are typically broadband short-duration signals. Some fish species can produce sound with frequencies that can reach 8 kHz (Zelick et al., 1999; Tavolga et al., 2012) or with more complex acoustic features (Vasconcelos et al., 2011). Sound producing mechanisms are species dependent and sound characteristics vary with circumstances, such as courtship, threats or territorial defense (Kasumyan, 2008). Therefore, fish sound can be used to monitor fish activity, and in particular courtship to identify the location and delineate FSAs (Chérubin et al., 2020), to determine temporal and seasonal patterns of the spawning activity (Locascio and Mann, 2008; Mann et al., 2009, 2010; Nelson et al., 2011; Schärer et al., 2012b), the behavior of fishes including population structure and its changes (Hawkins, 1986; Luczkovich et al., 1999; Rountree et al., 2006, 2008; Walters et al., 2009; Rowell et al., 2011). Some calls produced by fish aggregated to spawn are known as courtship associated sounds (CASs) in their behavioral context (Mann et al., 2010), whereas others are agonistic or territorial but also part of the FSA (Rowell et al., 2018).
Passive acoustic monitoring (PAM) has been used for more than sixty years in fish biology and fishery surveys [see Fish et al. (1952); Fish and Mowbray (1970) for review]. PAM is a fishery-independent, non-intrusive method that can provide in-situ information critical for understanding the efficacy of management measures and for the discovery of new or previously extirpated aggregations recovering from overfishing (Woodward et al., 2023). PAM data can also provide a window into the number of species using the FSA site, its biodiversity and fishing pressure through the monitoring of vessel noise (Mahale et al., 2023), establishing the significance of the site to multi-species spawning aggregations and its fishery management. Where the recovery of threatened and endangered species, such as the Nassau grouper (Epinephelus striatus), is difficult to monitor by more traditional means, PAM offers a solution to this type of population assessments. High signal to noise ratio is paramount to the detection of sound sources in PAM surveys of FSAs, which is best achieved when the recording station is fixed. However, assessing the spatial extent of the FSA is limited by the number of recorders and their locations. This constraint can be mitigated with the use of mobile autonomous platforms, which have provided new insights into the fish distribution in general (Wall et al., 2017) and at FSAs (Chérubin et al., 2020; Woodward et al., 2023). While substantially beneficial at advancing science and management, long-term PAM generates large volumes of high-resolution acoustic data that is extremely labor intense to analyze by listening and visualizing spectrograms. Challenges primarily stem from the identification of the sound sources and the enumeration of species specific sounds, from differences in human perception, and from the signal to noise ratio in the recordings.
In recent years, automatic fish sound signal detection methods have been developed. These traditional machine learning (ML) techniques, inspired by automatic speech recognition (Vieira et al., 2015), require a pre-processing step to convert raw audio data into features that are used as input to a machine learning (ML) model to identify a signal of interest (Pace, 2008; Bahoura and Simard, 2010; Kottege et al., 2015; Urazghildiiev and Van Parijs, 2016; Choi et al., 2019). For example, Noda et al. (2016) successfully classified one hundred and two different species of fish sounds. They used linear Frequency Cepstral Coefficients, Mel-Frequency Cepstral Coefficients (MFCC), Shannon Entropy and Syllable Length for feature extraction. For the classification, they evaluated the three conventional machine-learning algorithms: K-Nearest Neighbors, Random Forest (RF), and Support Vector Machines (SVMs). They applied their method to two public databases, FishBase and Discovery of Sound In The Sea (DOSITS) and obtained a classification accuracy of 95.24%, 93.56%, and 95.58%, for each classifier, respectively. Sattar et al. (2016a, b) also used similar techniques based on fish call feature analysis to identify grunts, growls and groans from the plainfin midshipman (Porichthys notatus) in large acoustic datasets. Handcrafted acoustic cepstral features were used for classification and detection of four Caribbean grouper species CAS by Ibrahim et al. (2018a) with 82.7% accuracy. The main disadvantage of this kind approach is that the chosen features must be uniquely designed for a specific application, and may involve nontrivial steps that require expertise in multiple disciplines Baumgartner and Mussoline (2011). Non trivial steps include feature dimension reduction using PCA Binder and Hines (2012), acoustic index calculation and complex entropy based detectors as used in Siddagangaiah et al. (2019) and, image correlation methods (Matthews and Beaujean, 2016; Ricci et al., 2017) as examples.
Deep Learning (DL) methods have emerged as an effective tool in the field of bioacoustics due to their huge success and widespread adoption in other pattern recognition fields such as image classification (He et al., 2016), object detection (Zhao et al., 2019), speech recognition (Meng et al., 2019) and music processing (Nam et al., 2018). DL improves the process by acting as a feature extractor that is an integral part of the architecture of a Deep Neural Network (DNN) (Bohnenstiehl, 2023), learning non-linear representations of the data through a multi-layer neural network approach. This relative simplicity, inherent to DNNs, makes them highly versatile to conduct for various classification tasks (O’Mahony et al., 2019), outperforming conventional ML techniques since they are able of more discriminatory representations than traditional feature extraction (Shorten and Khoshgoftaar, 2019). In practice, however, some DL-based detectors and classifiers for acoustic signals still employ a pre-processing step like computing spectrograms (Shiu et al., 2020; Vickers et al., 2021).
DL methods have been successfully applied in terrestrial environments for the sound classification of animals such as insects (Silva et al., 2013), frogs (Huang et al., 2009), birds (Bravo Sanchez et al., 2021; Mehyadin et al., 2021), bats (Parsons and Jones, 2000), and other mammals (Pandeya and Lee, 2018; Clink and Klinck, 2021), including the monitoring of farm livestock welfare through their sound Mcloughlin et al. (2019). Automated approaches to identify bird vocalizations are also based on classifiers trained on spectrograms and are becoming increasingly popular for conducting avian PAM within broad-scale monitoring programs. BirdNET, for example, is a user-friendly freely available, multispecies classifier, that uses a convolutional neural network (CNN) to efficiently process large quantities of audio data to quickly identify more than nine hundred bird species (Kahl et al., 2021).
More recently, DL techniques have been applied to automated detection and classification of marine mammal and fish sounds. Their success has been demonstrated by many studies for binary marine mammal species detection and multi-class species classification (Belghith et al., 2018; Liu et al., 2018; Bergler et al., 2019; Bermant et al., 2019; Shiu et al., 2020; Yang et al., 2020; Zhong et al., 2020; Allen et al., 2021; Ibrahim et al., 2021; White et al., 2022), advancing the capabilities of mining large PAM datasets for detecting species of interest. However, these methods generally require large amount of validated training data and progress has been limited by challenges related to the lack of labeled datasets adequate for training and testing. Large quantities of known and as yet unidentified broadband signal types mingle in marine recordings, with variability introduced by acoustic propagation, source depths and orientations, and interacting signals (Frasier, 2021; Laplante et al., 2021). Manual classification of these datasets is unmanageable without an in-depth knowledge of the acoustic context and biodiversity data of each recording location. A signal classification pipeline which combines unsupervised and supervised learning phases with opportunities for expert oversight to label signals of interest was presented in Frasier (2021). The workflow presented in the former was implemented with user-interfaces within the publicly available acoustic data processing software package Triton (Wiggins et al., 2010). White et al. (2022) trained a DL model for multi-class marine sound source detection to explore its utility for extracting sound sources for use in marine mammal conservation and ecosystem monitoring. A training set was developed comprising existing datasets amalgamated across geographic, temporal and spatial scales, collected across a range of acoustic platforms. Transfer learning was used to fine-tune an open-source state-of-the-art CNN to detect odontocete tonal and broadband call types and vessel noise (from 0 to 48 kHz). The input to the CNN algorithm consists of spectogram images to exploit the differences of this time-frequency representation between each sound source.
Here, we present a DL-based workflow called Fish Acoustic Detection Algorithm Research (FADAR) initially designed to identify and classify the CAS of four Caribbean grouper species, namely Nassau grouper [E. striatus - Schärer et al. (2012b)], red hind [E. guttatus - Mann et al. (2010)], black grouper [Mycteroperca bonaci - Schärer et al. (2014)], and yellow fin grouper [M. venenosa - Schärer et al. (2012a)]. FADAR also identifies squirrelfish [Holocentrus spp - Luczkovich and Keusenkothen (2007)] and vessel noise as a background noise class. This workflow is the outcome of several DL models development specifically applied to fish sounds detection and classification.
In Ibrahim et al. (2018b), CNN and Long Short Term Memory (LSTM) networks were used to classify the previous four groupers species. CNNs were designed to effectively identify spatial patterns from images (Yamashita et al., 2018). LSTMs are a special type of Recurrent Neural Networks (RNN) that were designed to solve the vanishing gradient problem stemming from long-term dependencies contained in a time-series (Bengio et al., 1994). However, RNNs are also known for their pattern discrimination capabilities in time signals. Denoised spectrograms of CAS were used as input to both DL models. The CNN classifier was better than LSTM at discriminating the fish calls with over 90% accuracy. It also outperformed the handcrafted MFCC classifier built for the same species (Ibrahim et al., 2018a). Not only groupers species could be successfully identified through their calls, but also the various call types within species (Ibrahim et al., 2019; Wilson et al., 2020).
Call types among CAS exhibit significant acoustics feature differences. They can be used to understand the evolution of the fish behavior during the spawning season. The change in their relative numbers can be observed during the days leading and following peak calls (Wilson et al., 2020; Zayas et al., 2020). Using calls recorded during three consecutive spawning seasons at a Nassau grouper FSA in the Cayman Islands, Wilson et al. (2020) described the spectral and temporal characteristics of nine call types known or presumed to be produced by the four epinephelid species of interest in this study. For example, red hind grouper produce at least four distinct types of sounds that are most commonly heard during FSA (Zayas et al., 2020). Unsupervised classification methods can be used to determine the underlying representation in the input data without labeled data. One such method, known as stacked auto encoder or SAE was successfully applied to the specific task of identifying red hind call types by learning the latent representation of the main call types (Ibrahim et al., 2019).
The concept of Transfer Learning (TL) is also built into the foundation of FADAR (Ibrahim et al., 2020). Transfer learning relies on pre-trained DNNs, that have been trained for specific image recognition tasks on a large number of images. Their ability to identify specific patterns can be used for other pattern recognition tasks. Additional layers of neurons are then added to the pre-trained model to train the new model on the specific dataset. In essence, the pre-trained DNN acts as feature extractors that are generic enough that they apply to multiple tasks (Laplante et al., 2022).
The remainder of the paper is organized as follows. Section 2 presents the acoustic characteristics of the call types of all the fish species currently identified by FADAR. The architecture of the proposed FADAR tool composed of multiple classifiers, the datasets used for training and testing, and the metrics used to evaluate FADAR skills are presented in Section 3. Section 4 presents the classification results of the grouper sounds and the evaluation of FADAR on datasets from various Caribbean regions, depths and instruments. In Section 5 the FADAR App is presented followed by a discussion in Section 6. Concluding remarks are given in Section 7.
2 Grouper sounds
The four epinephelid species of interest in this study are found in the greater Caribbean, including the Gulf of Mexico and the Bahamas. They all spawn during the winter and spring months (December to May) in the Northern Hemisphere (Nemeth, 2012) and their spawning aggregations are cued to the moon and the winter solstice (Nemeth et al., 2007). FSAs often occur at remote locations and in water depths between 30 and 80 m, near the shelf break, where spawning activities usually peak at dusk but are contingent upon water temperatures and local current conditions (Nemeth, 2009). Spawning grouper population are thus challenging to observe and monitor (Kobara et al., 2013) and their CAS production constitutes the only way to monitor their presence remotely and their spawning activity across the entire spawning season.
Red hind produce at least four distinct types of stereotyped sounds that are heard during FSAs and in captivity during the spawning week (Wilson et al., 2020; Zayas et al., 2020). The first red hind sound (RH1) is a combination of a short pulse followed by a short tone (Figure 1A) with frequency range 20–360 Hz. The short tone is a short pulse-period pulse train (Ibrahim et al., 2019), whose period can vary and that can be extended by various longer pulse-period, short duration pulse trains. The second red hind sound (RH2) is composed of a series of pulses followed by an extended tone (Figure 1B). It can be combined with a pulse train before or after the call and the tone can be modulated like RH1 and also be extended or shortened. The third type of red hind sounds consists of a grunt (RH3). It can be produced as a single grunt or in a train consisting of two or three successive grunts as shown in Figure 1C. The fourth type of red hind calls is the pulse which can be produced alone or as a train alone or as part of other call types, usually before or after RH1 or RH2 calls. Figure 1D shows consecutive short pulses, resulting in a pulse train without any other type of calls. Figure 1E shows a combination of RH4 and RH2, where several pulses of increasing frequency precede the long tone. The fifth type of sounds associated with the red hind FSA is called a chorus. It consist of the continuous overlap of call types RH1 and RH2. Both call types are not immediately distinguishable in the spectrogram but can be heard (Appeldoorn-Sanders et al., 2023).
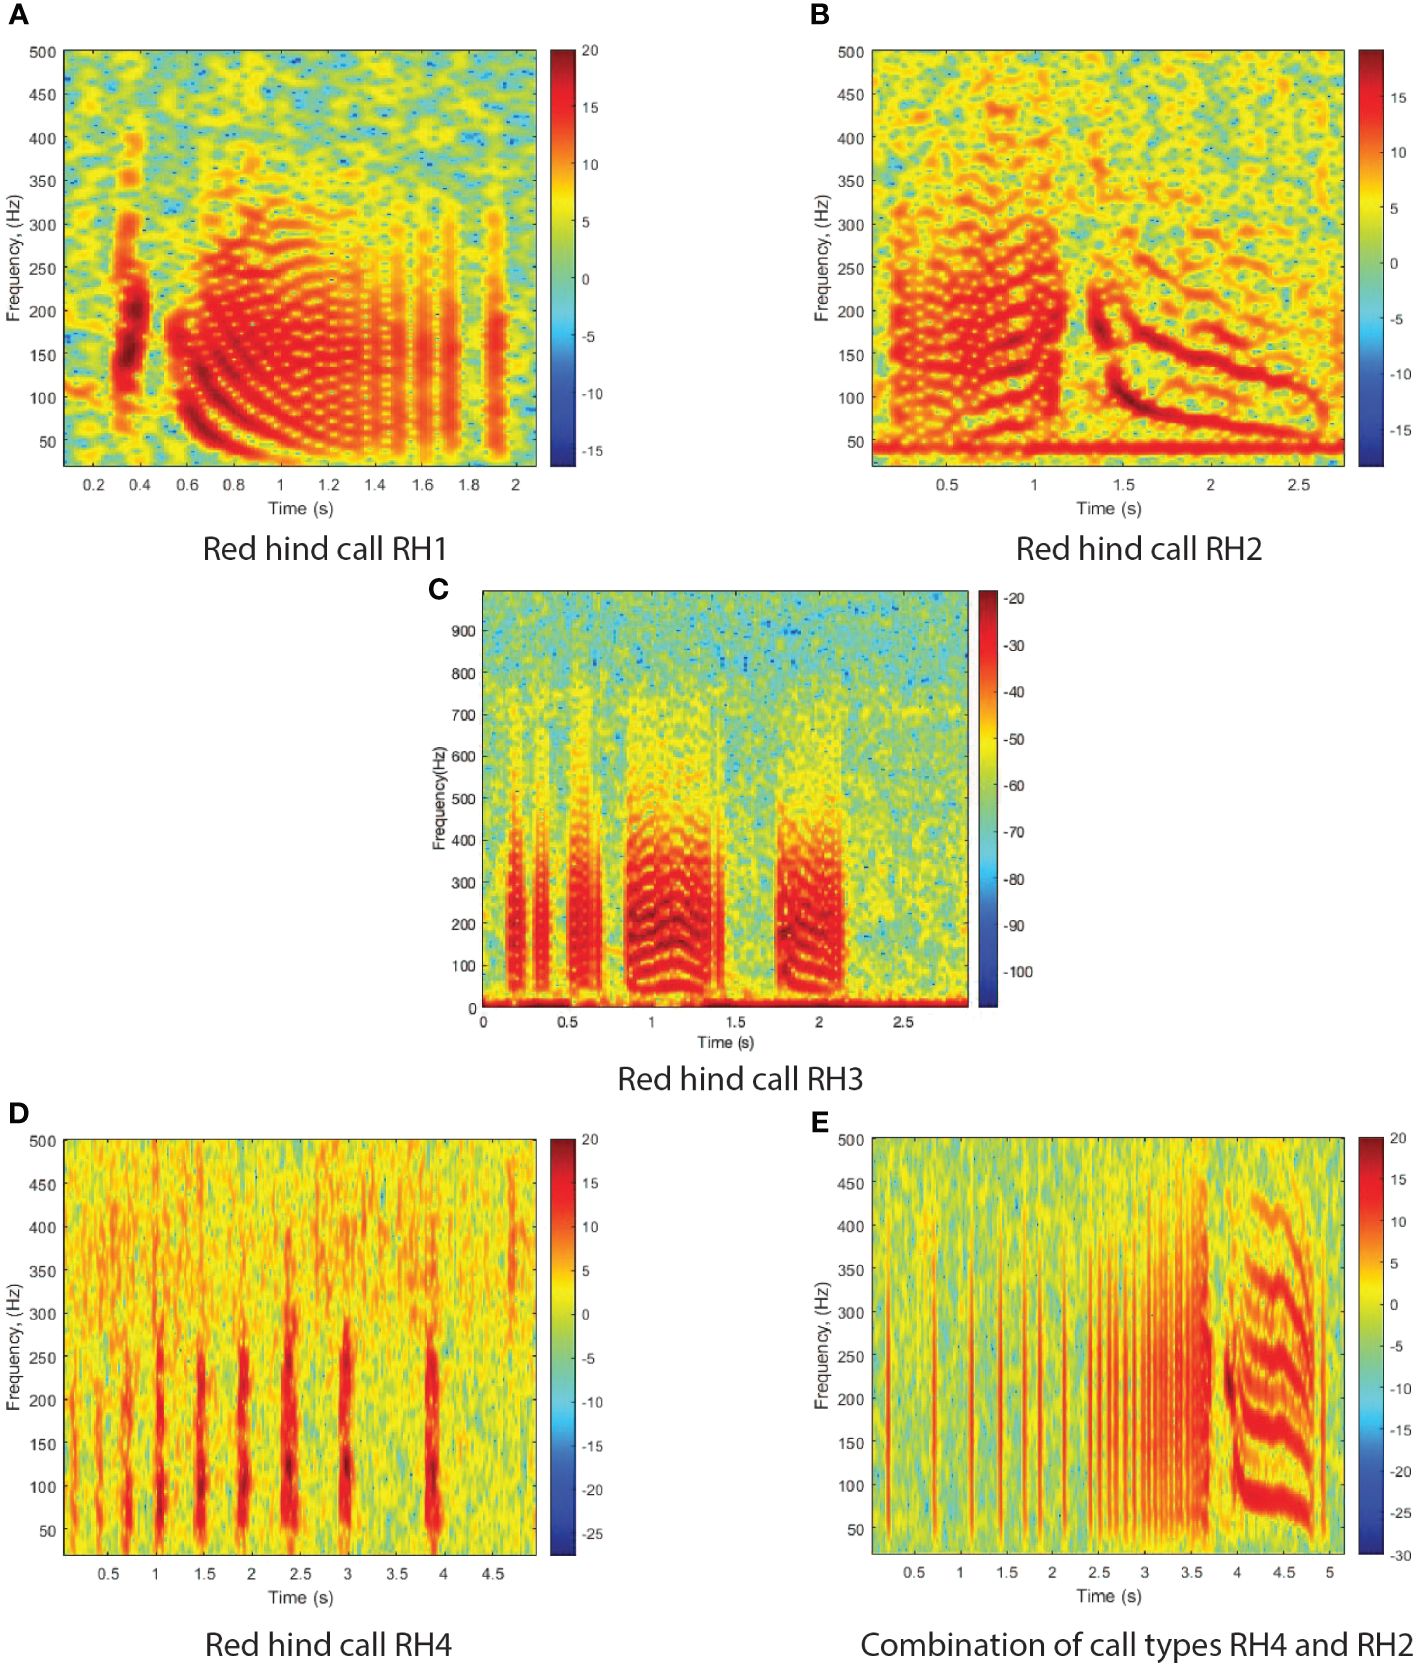
Figure 1 Spectrograms of four red hind grouper call types and a combination of call types. Note that the times axis differs among images. (A) Red hind call RH1; (B) Red hind call RH2; (C) Red hind call RH3; (D) Red hind call RH4; (E) Combination of call types RH4 and RH2. The spectrograms were calculated with a FFT size of 4096 points and show the relative intensity in dB. The calls were recorded off the west coast of Puerto Rico, at Abrir la Sierra fish spawning aggregation site during the spawning season of 2015.
Nassau grouper calls have also been categorized as four distinct types as shown by Schärer et al. (2012b); Wilson et al. (2020), and Rowell et al. (2018). The Nassau grouper call N1 is an alarm call, composed of a variable number of low frequency pulses (Figure 2A). The CAS call N2 consists of a modulated tone that may be preceded by a variable number of pulses or a shorter tonal call (Figure 2B). N3 is an agonistic call made of pulses and double pulse segments (Figure 2C) that occurs along with competitive displays of males as described in Rowell et al. (2018). The fourth type of calls, labeled N4 is a Nassau grouper call that included a variable number of grunt pairs in sequence (Figure 2D). All Nassau grouper calls peak frequency ranged between 90 and 300Hz as shown in Wilson et al. (2020). Further descriptions of the four call types frequency and duration characteristics can be found in Wilson et al. (2020).
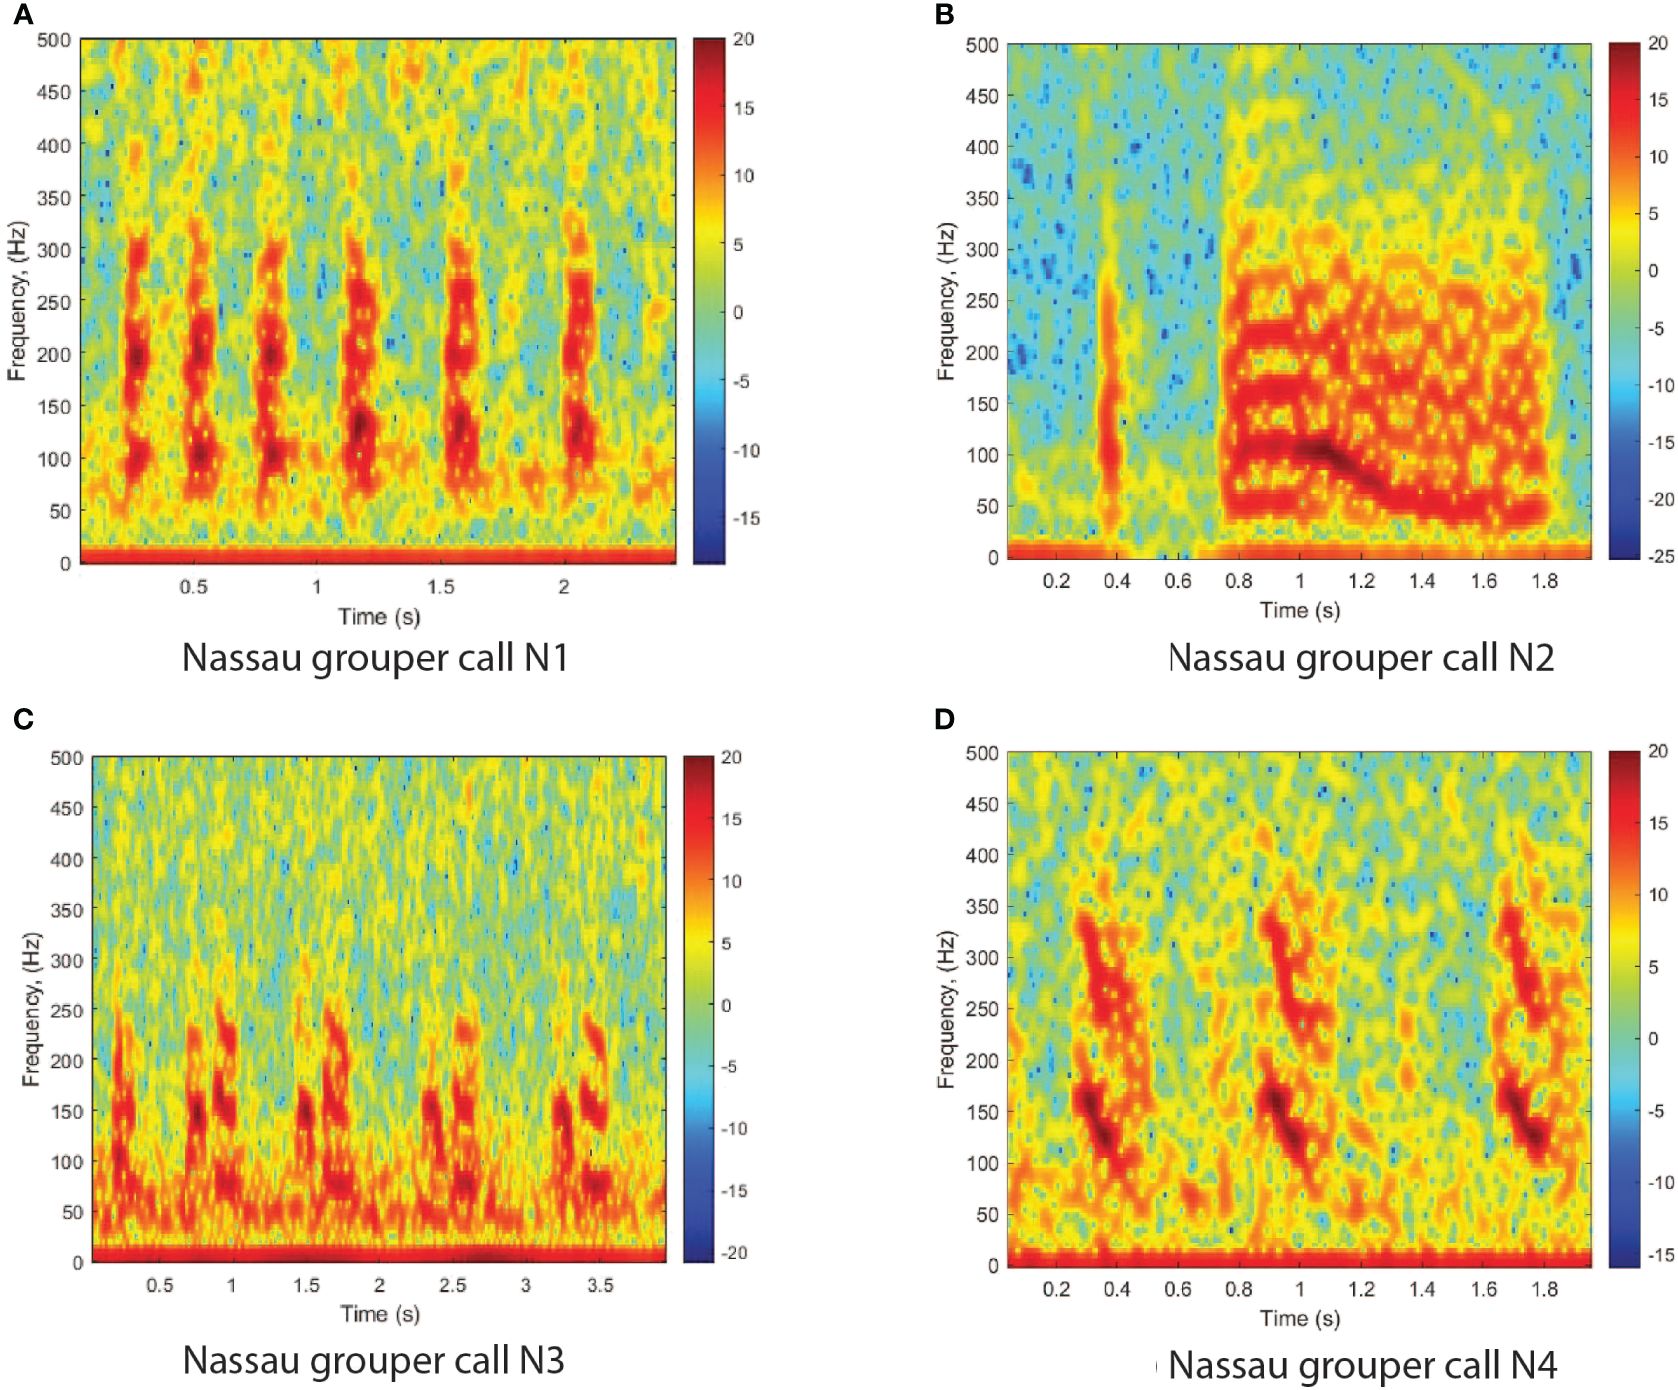
Figure 2 Spectrograms of four Nassau grouper call types as identified in the literature. (A) Nassau grouper call N1; (B) Nassau grouper call N2; (C) Nassau grouper call N3; (D) Nassau grouper call N4. The spectrograms were calculated with a FFT size of 4096 points and show the relative intensity in dB. The calls were recorded off the west coast of Puerto Rico, at Bajo de Sico fish spawning aggregation site during the spawning season of 2014.
Yellowfin grouper calls have been categorized as two types that may occur subsequently or separately Schärer et al. (2012a). They consist of variable series of fast pulses or tonal calls labeled YF1 (Figure 3A) and of a rather uniform pulse train labeled YF2 (Figure 3B). Tonal calls average duration is about 3s ranging between 1.29s and 5.69s with a peak frequency in the range 88.9 to 141.7Hz. Pulse calls duration is in the same range as the tonal call with peak frequency range of 101.4Hz to 132.4Hz. Both calls are known as CAS and were recorded at FSAs.
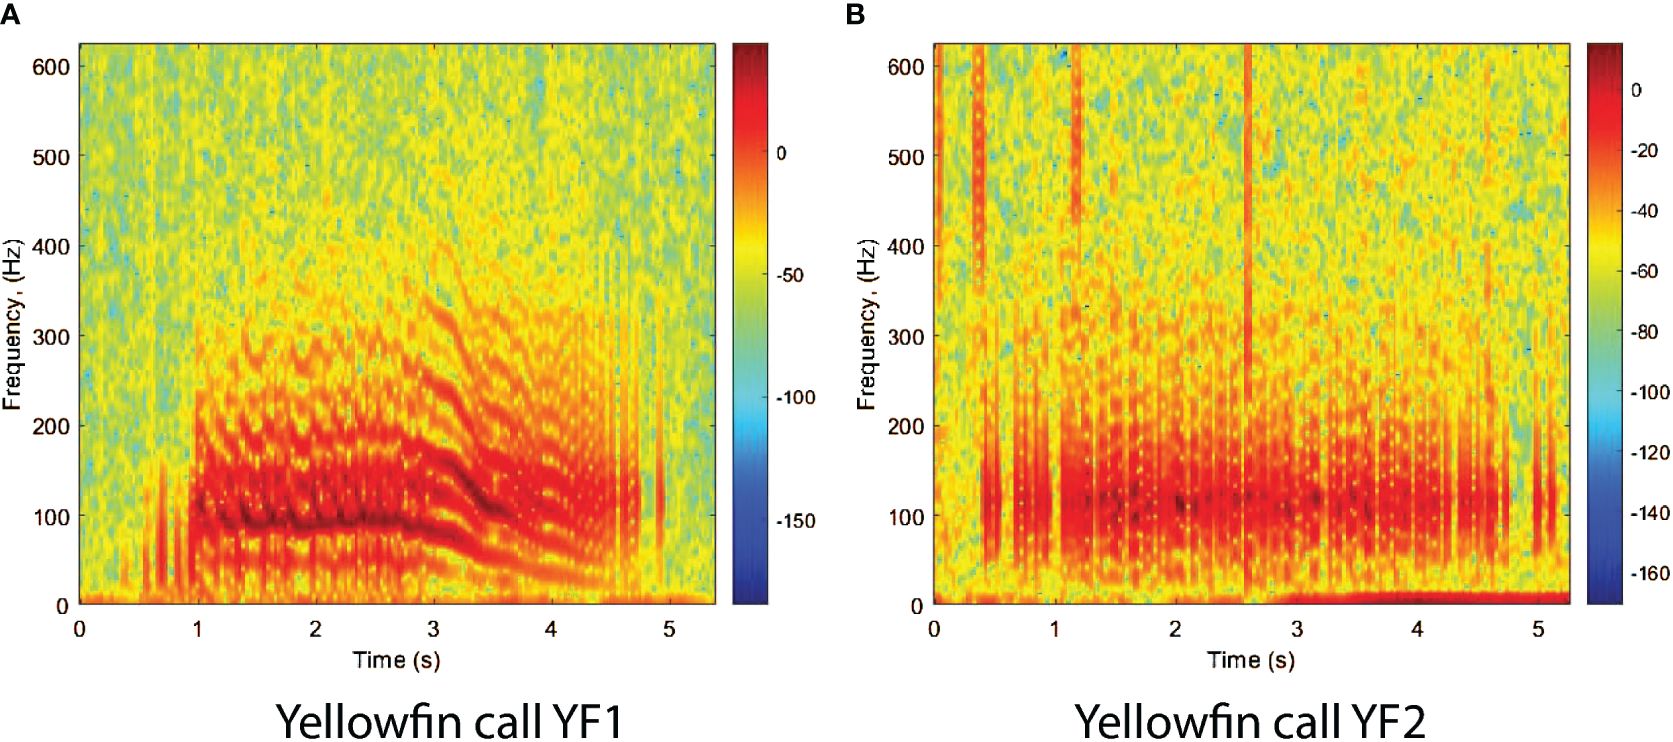
Figure 3 Spectrograms of yellowfin grouper call types. (A) Yellow fin call YF1. (B) Yellow fin call YF2. The spectrograms were calculated with a FFT size of 4096 points and show the relative intensity in dB. The calls were recorded off the west coast of Puerto Rico, at Mona Island fish spawning aggregation site during the spawning season of 2013.
Black grouper produces at least two variations of a lower frequency, modulated tonal call, which ranges between 60 Hz and 120 Hz, but generally has a longer duration than Nassau grouper call N2 (Figure 4A). This call is sometime preceded by a set of pulses and associated to courtship displays as shown by Schärer et al. (2014) and Wilson et al. (2020).
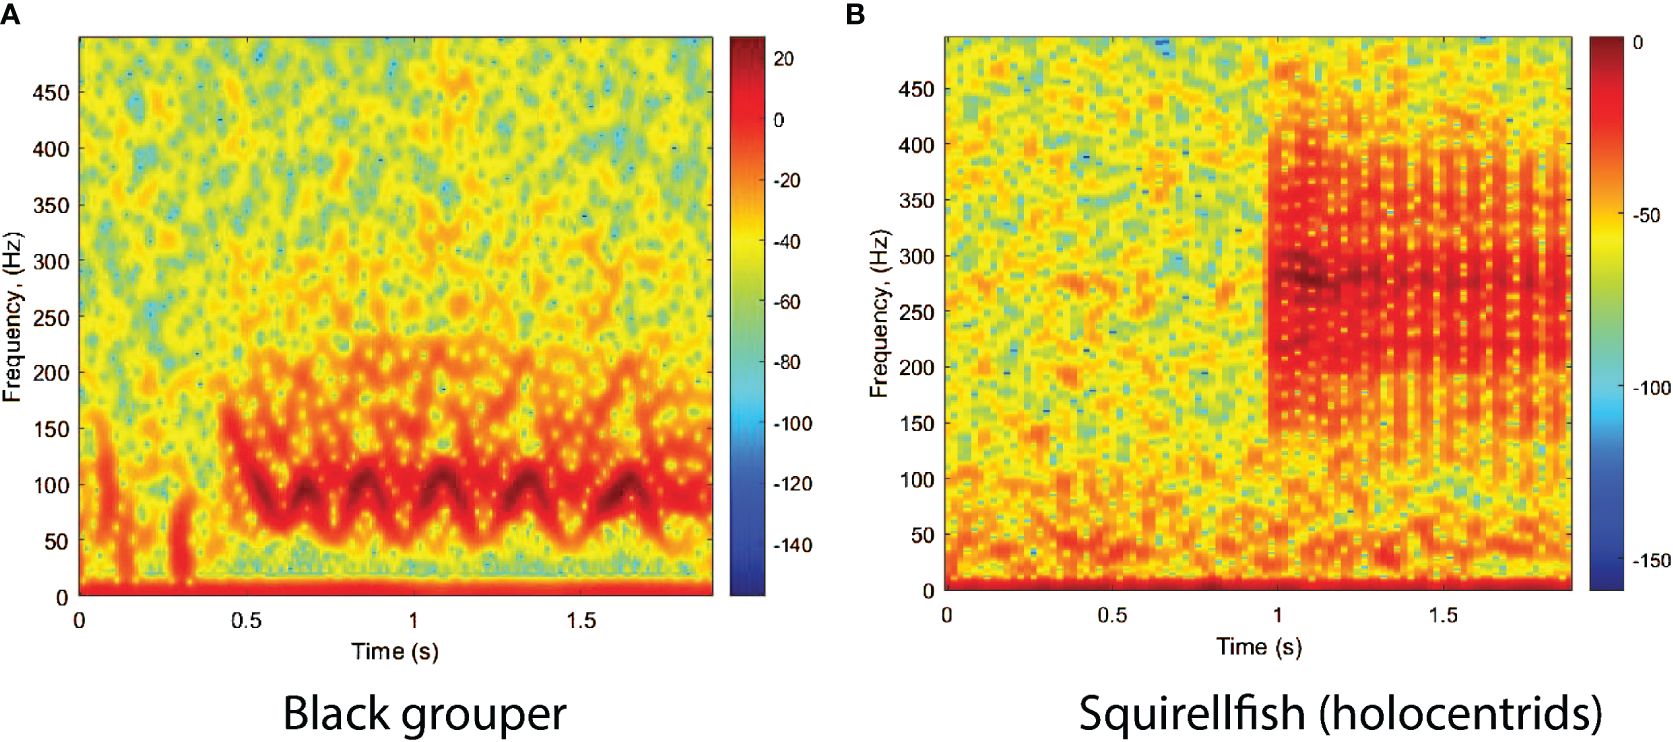
Figure 4 Spectrogram of (A) black grouper courtship call and (B) of holocentrids (squirrelfish). The spectrograms were calculated with a FFT size of 4096 points and show the relative intensity in dB. The calls were recorded off the west coast of Puerto Rico, at Abrir la Sierra fish spawning aggregation site during the spawning season of 2014.
Although our focus was mostly on epinephelids, we noticed that in a significant number of recordings the presence of another sound, in an overlapping frequency range with the grouper range. This sound was identified to be from squirrelfishes, mainly Holocentrus rufus and H. adscensionis, which are a primary component of the Caribbean coral reef soundscapes (Moulton, 1958). Their grunts form an acoustic signature known as the ‘staccato’. It consists of a pulse train in the frequency range 120–400 Hz with a duration of 1 to 2 s (Figure 4B), which is well described in Winn and Marshall (1963), Winn et al. (1964), and Parmentier et al. (2011). In Puerto Rico both species have been documented in reef habitats in similar abundances (National Centers for Coastal Ocean Science (NCCOS) and Southeast Fisheries Science Center (SEFSC), 2020). This call was considered as one of the classes to improve the FADAR’s accuracy as it would otherwise be mislabeled as a yellowfin grouper call, which looks very similar structurally, although of different frequency range as shown by Figures 3B, 4B.
3 Methods
3.1 FADAR workflow
FADAR was developed in Matlab™, with Deep Learning, Signal Processing and Audio toolboxes. The general workflow of the algorithm consists of a preprocessing stage where the sound signal is converted into an RGB image of the spectrogram. Then the images are analyzed by the DL models that constitute FADAR, which produces an output that is the classification of the sound sources according to the classes defined for the models (Figure 5). However, the classification process involves two stages. For the general identification of grouper species, not including their call types, FADAR consists of an ensemble of deep learning models with randomly selected hyper parameters. The classification of call types for the different species though, is conducted by species specific deep learning sub models as shown hereafter.
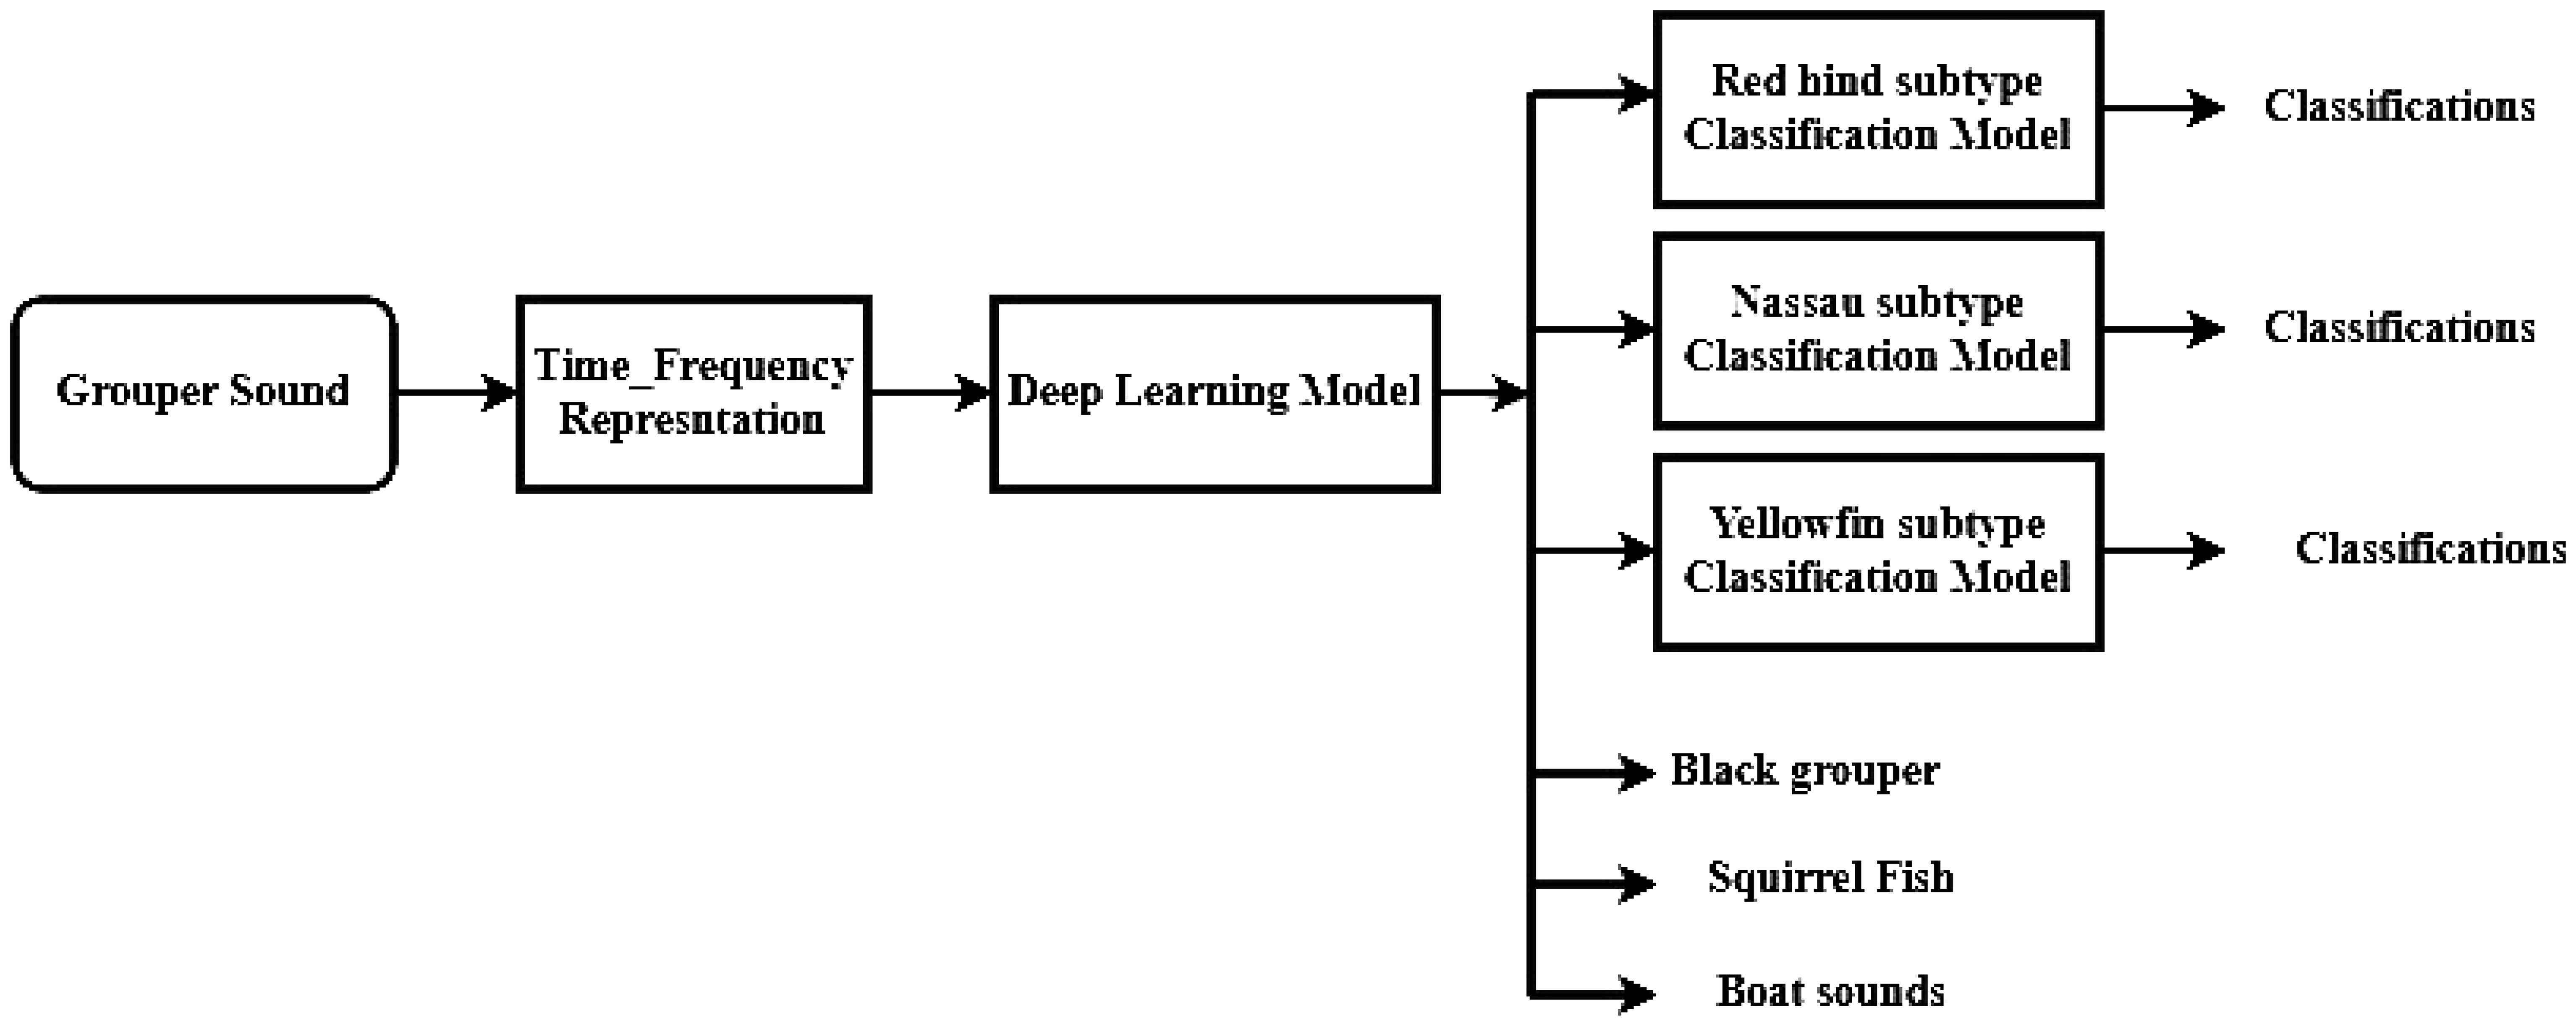
Figure 5 Fish Acoustic Detection Algorithm Research (FADAR) workflow.
In the pre-processing stage, the input audio files are first re-sampled to 10 kHz then divided into 2 s audio segments without predetermined filtering. A spectrogram is created for each segment in the 0–500 Hz frequency range and then converted into an intensity image using Matlab™ RGB conversion tools. Spectrograms were generated by applying a Hanning window, with a frame length of 0.1 s (1000 samples), 80% overlap and an NFFT size of 4096 points. These images were thus used to train and test FADAR for all the classes chosen for this model. No calibration was applied to the input. During the training stage, the diversity of data resulting from different gain setups was accounted for as shown below, which increases the classification robustness to the data source.
FADAR training took place with a total of 73466 spectrograms (or images) encompassing all four grouper species call types, squirrelfish sounds, vessel and background noise. The data split was 80% for training and 20% for validation. 180162 images of fish CAS and 632850 images of vessel and ambient noise, not part of the training/validation set were used for testing and were manually labeled. The numbers per class are presented in Sections 3.3 and 3.4.
3.2 Main FADAR model
Classifying data with an automated approach is an iterative process that hinges on the formulation of the problem, the data analysis, feature extraction and selection, classifier selection, and the validation of the model. Classification models fail for several reasons, including insufficient data preprocessing, overfitting during the training stage, unsuitability of the model for the tasks, and lack of independent data for model validation. Ibrahim (2019) proposed an ensemble-based approach for DL data classification and event forecasting, called multimodel deep learning (MMDL). In the proposed method, the architecture construction process is automated by diversifying the structure of CNN classifiers. The selection of hyperparameters for each classifier of the ensemble is randomized to allow the system to devise the most suitable network architecture for a given dataset. The MMDL algorithm then fuses the results from the different architecture classifiers, which collectively improves the performance of individual classifiers. Such approach was proposed and implemented for the detection of North Atlantic right whale up-calls by Ibrahim et al. (2021). The general network architecture of the CNNs consists of a randomized number of convolutional blocks that each contain convolutional layers, a ReLU activation layer, a batch normalization layer, and a max-pooling layer as shown in Figure 6. Therefore the proposed MMDL algorithm for grouper CAS detection and classification consists of a bank of five CNNs where, to reduce the design complexity, a randomized generation process is applied to assign values to hyperparameters by setting up a range for the number of convolutional layers [3 5], number of filters [8 32], neurons in fully connected layers [300 790], and batch size [16 128]. These randomly generated DL models form an ensemble of classifiers. The outputs of each model are combined by using a fusion strategy for decision making as shown in Figure 7. The fusion block analyzes the outputs of individual models to identify locally consistent, discriminative, and representative patterns. The types of metrics used in this process were selected according to the results of an early study by Moreno-Seco et al. (2006) that tested the efficacy of fusion methods like Majority Voting, Unweighted Average, and PatternNet. The latter consistently outperformed the other methods, and was used in the MMDL. The fusion process and implementation is further described in (Ibrahim et al., 2021).
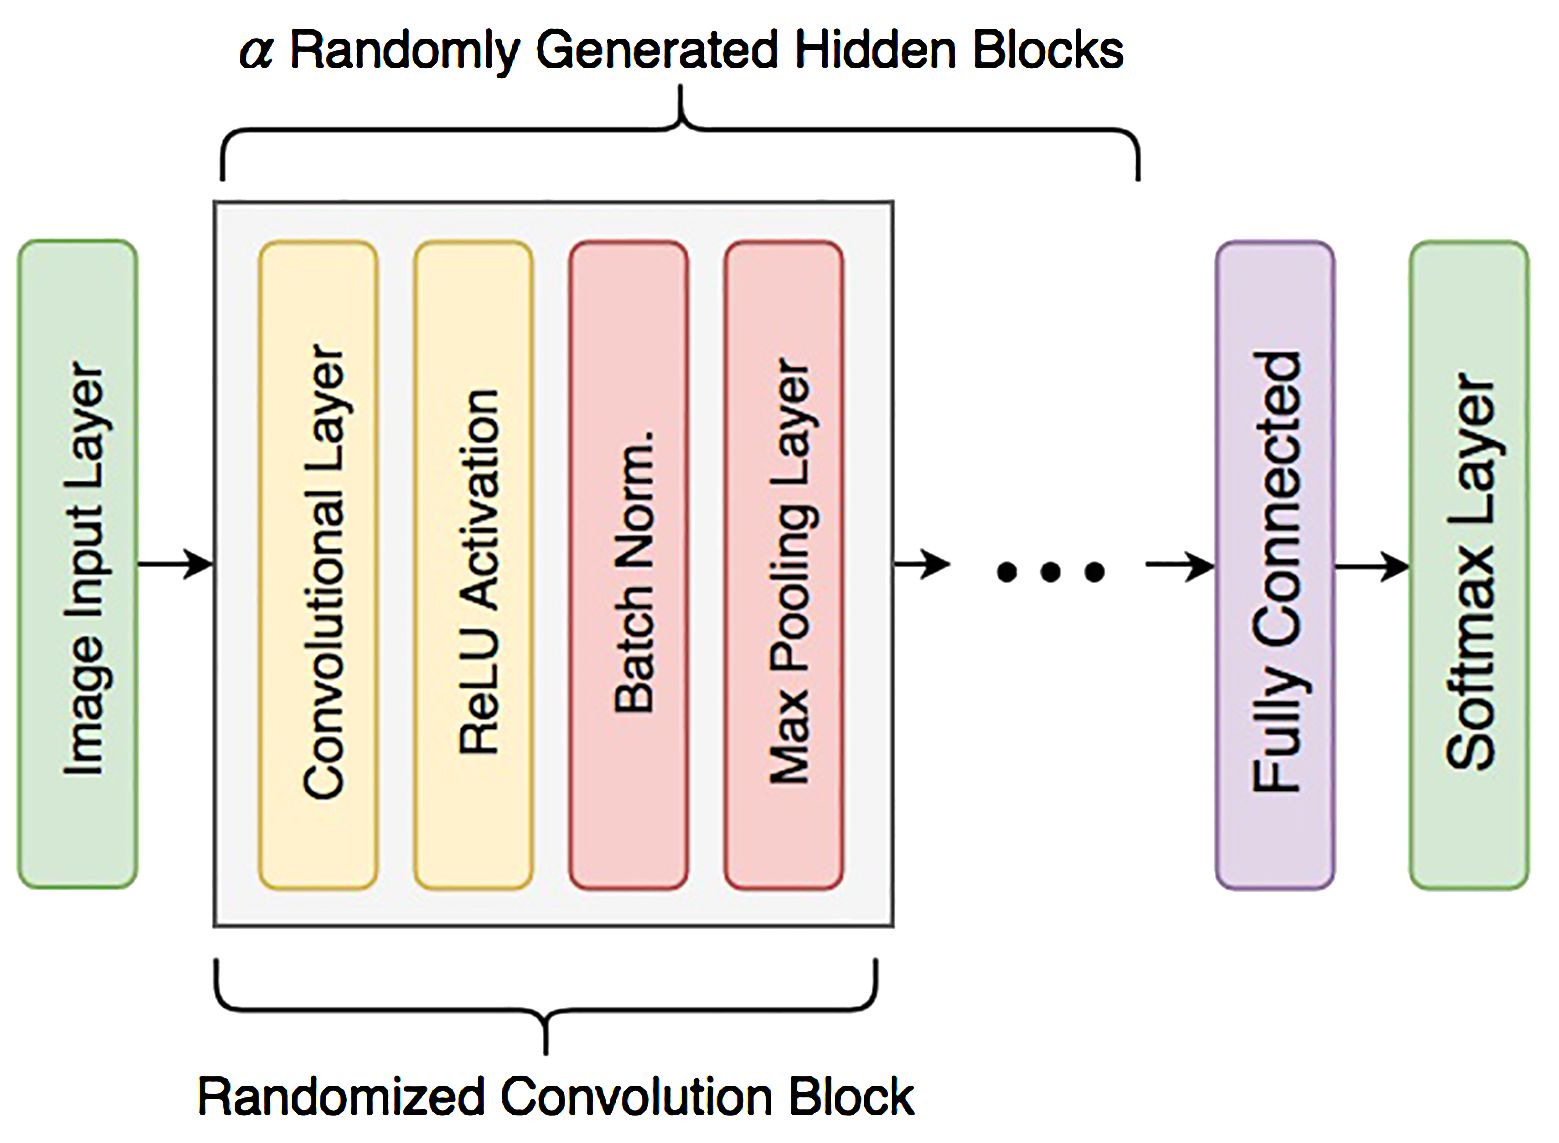
Figure 6 General structure of an individual CNN network with α convolution blocks.
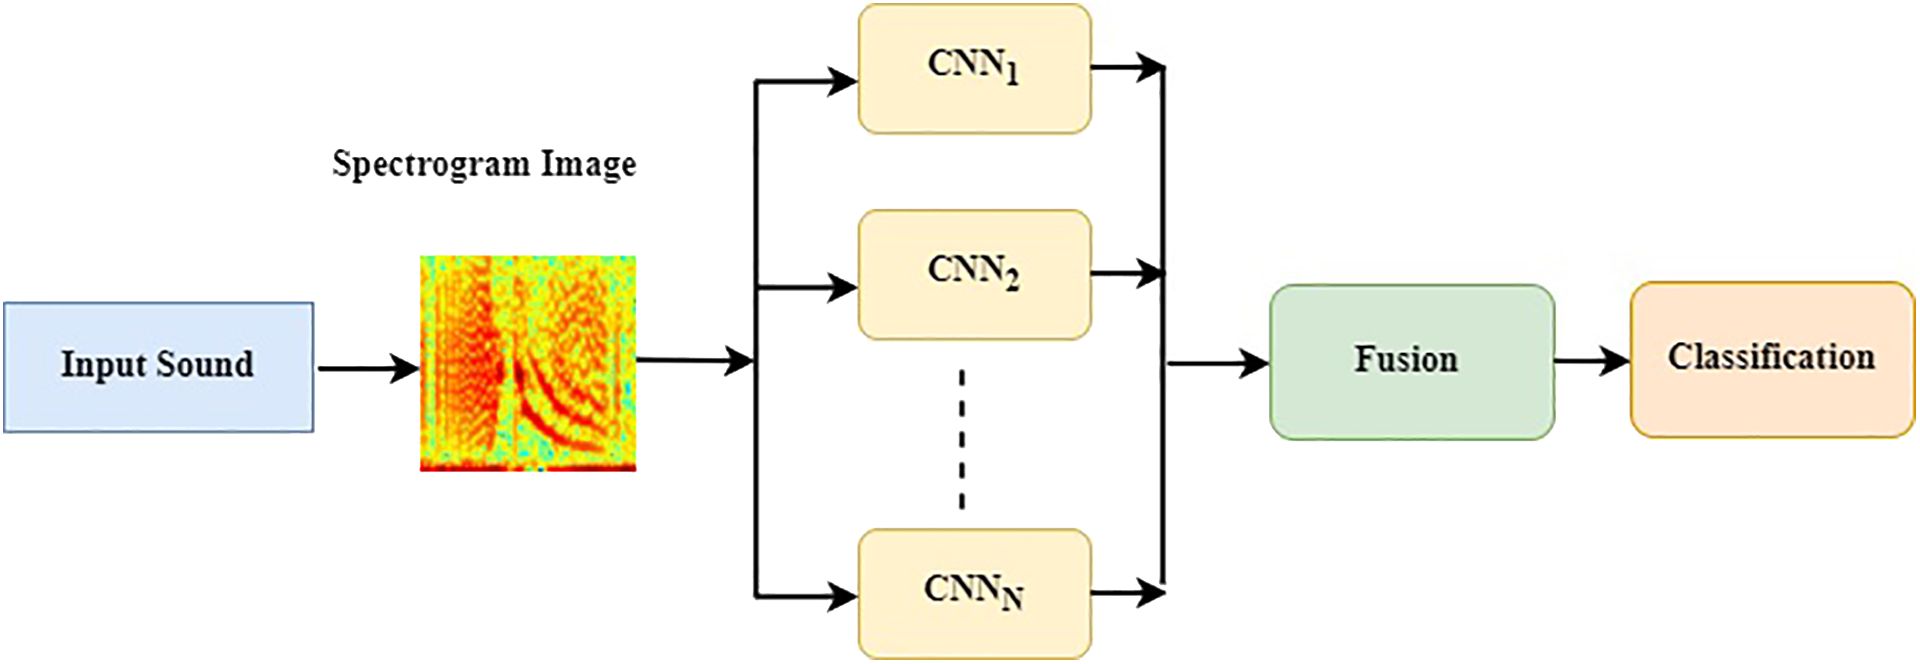
Figure 7 Multi-model deep learning (MMDL) CNN ensemble flow chart used in the Fish Acoustic Detection Algorithm Research (FADAR).
The MMDL, is thus the main FADAR model that is used to detect and classify the four groupers species’ CAS, regardless of the call type, as well as squirrelfish and boat sounds. In order to classify the call types, species specific classifiers or sub-models were designed for red hind, Nassau and yellowfin groupers, which are presented in the following sub-section. The sub-models are applied to the outputs of the MMDL as shown in Figure 5.
3.3 Species specific call types classifiers
3.3.1 Red hind call types classifier
In Ibrahim et al. (2019), a random ensemble of stacked auto-encoders was designed to classify RH1 and RH2 red hind grouper call types. An accuracy of 95% was obtained with 15 random SAEs, which requires extensive processing times with large numbers of parameters. In order to make the model more efficient, an approach based on Transfer Learning was preferred. Transfer Learning involves leveraging a DL model that has been trained for one task (source domain) as the starting point for a new task (target domain). Typically, the source model is trained on vast quantities of data where the layers of the network have learned to extract features that are useful to the given task. Ideally, some of these features would be generic enough that they may be shared across tasks. Transfer Learning occurs when the knowledge learned in the source domain is transferred during the start of the training process of a new model to make predictions on the target domain. Specifically, the knowledge learned is contained within the weights of the trained network, and can be easily loaded as the starting point of the new training process. Usually, the target domain has limited access to data and therefore, greatly benefits from the inherited knowledge. Transfer Learning can be applied in many different ways, depending on the problem. It can involve techniques such as freezing certain layers of the network therefore preserving the weights of those layers that were learned previously, replacing the classification layers, training for only a few epochs to fine-tune the network, or a combination of these techniques. Pre-trained models were selected for extracting the deep informative features from spectrogram images generated from red hind sounds. Different types of pre-trained model were used such as ResNet, MobileNetV2 (Howard et al., 2017), Efficient Net (Tan and Le, 2020), and ShuffleNet (Zhang et al., 2017) as shown in Ibrahim et al. (2019). White et al. (2022) used a similar transfer learning approach based on EfficientNet B0 to classify marine sound sources, which provides a computationally efficient architecture for rapid classification. EfficientNet introduces a compound scaling method that uniformly scales the depth, width, and resolution of the network. This scaling approach ensures that the model becomes more powerful as it gets larger while maintaining efficiency. By carefully balancing these scaling factors, EfficientNet achieves improved accuracy compared to other models while using fewer resources. The combination of accuracy and efficiency of the EfficientNet, along with its scalability and transfer learning capabilities, makes it a relevant choice as the red hind call types classifier but also because of its higher accuracy than the others. More than 17000 samples were used for training and validation following the same 80/20 ratio as in the other DL models (Table 1). More than 94000 were used for testing and were separate from the training/validation set (Table 2). The structure of the red hind call types submodel is shown in Figure 8.
Table 1 Numbers of 2-second sound samples used for training and validation (80/20 split) per location.
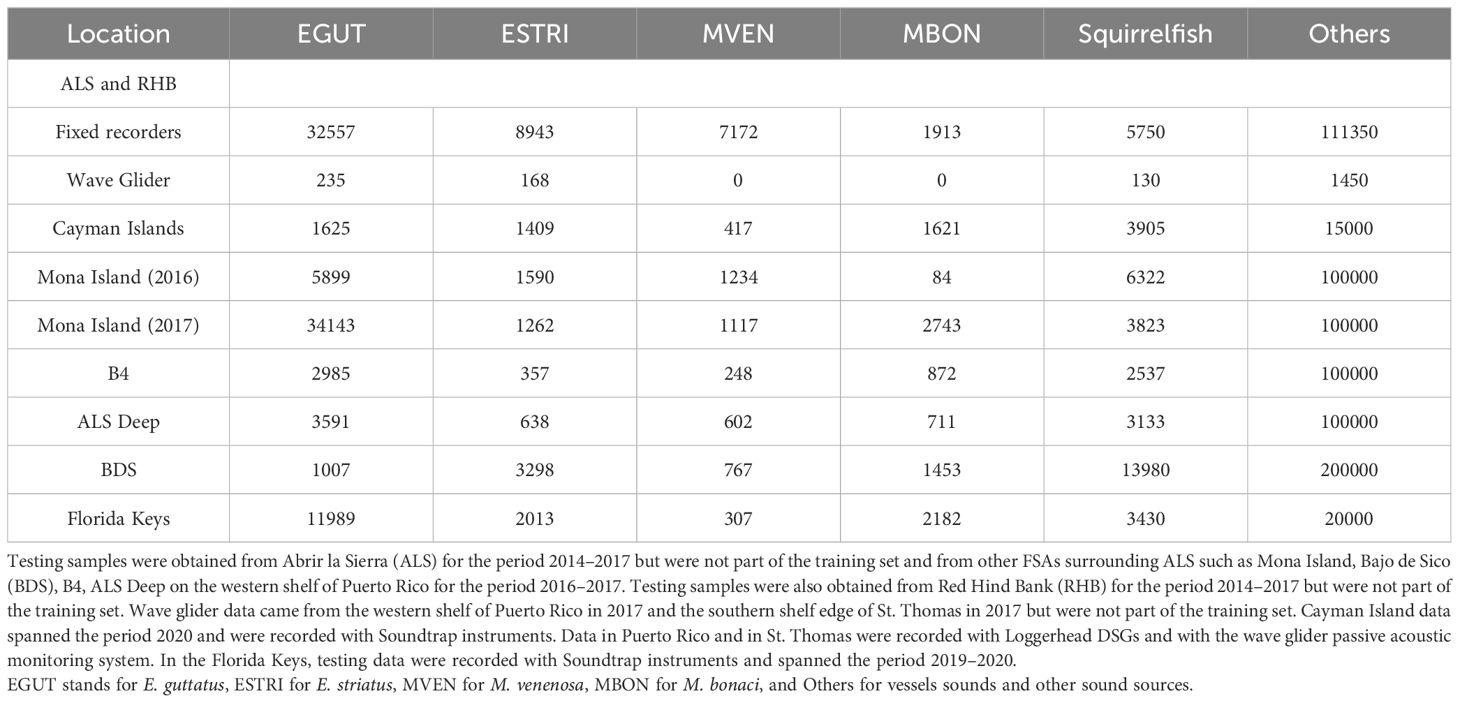
Table 2 Numbers of 2-second sound samples used for testing per location.
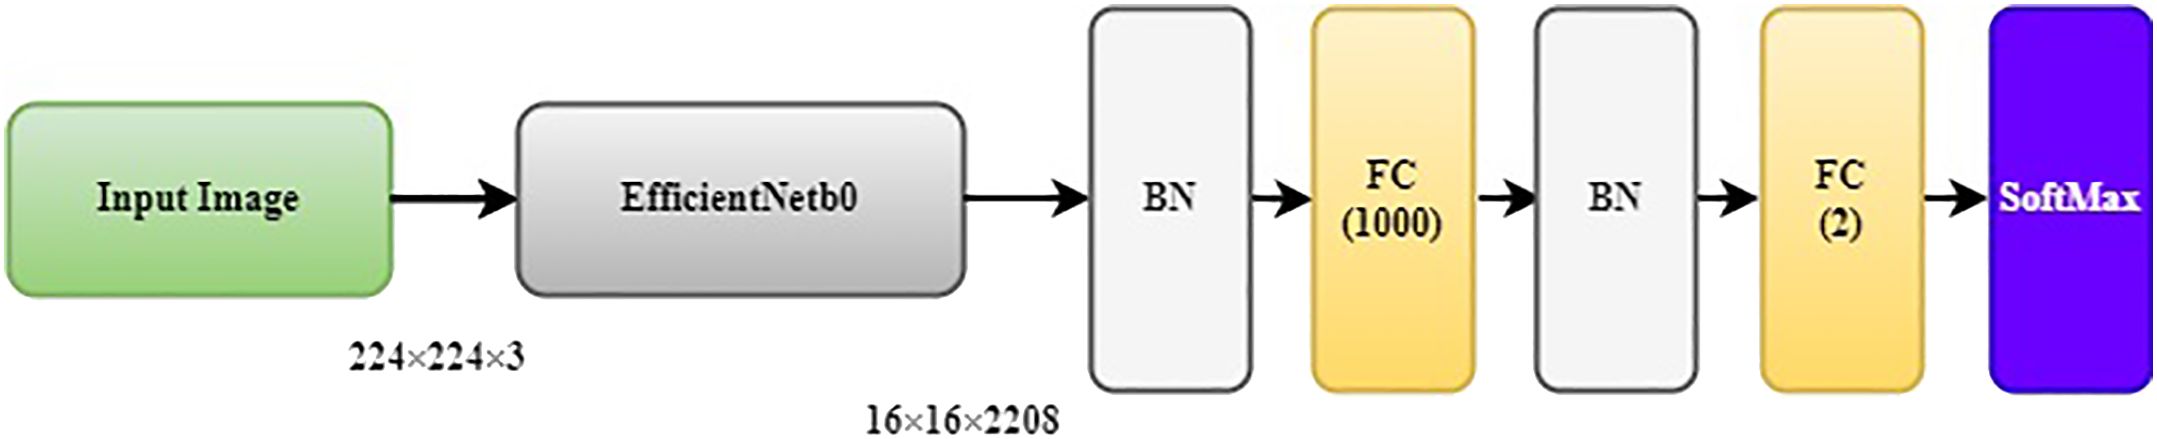
Figure 8 General structure of the red hind grouper call type model. BN indicates Batch Normalization. FC indicates fully connected layers with 1000 neurons and the last FC layer has only two neurons.
3.3.2 Nassau grouper call types classifier
While at least four Nassau call types have been identified, only two classes were used for the call type classification. Class 1 labeled as FN1 encompasses pulse-like calls such as N1, N3, and N4 and class 2, labeled as FN2 tonal calls such as N2. Due to this added complexity within the FN1 class a transfer learning approach did not provide satisfying results. Therefore, a CNN model was specifically designed for the Nassau grouper call type classification. The superior performance of the shallow CNN model over the transfer learning could be attributed to its reduced complexity. The simplified architecture of the shallow CNN, with fewer layers and parameters, allows it to more effectively focus on the specific features relevant to the Nassau grouper call types classification task. While pre-trained intricate design is tailored for a broader range of challenges, its complexity might lead to overfitting or less adaptability to the target dataset. In contrast, the shallow CNN’s simplicity enables it to efficiently extract and learn the key characteristics of Nassau grouper call type images, ultimately resulting in enhanced classification performance. The Nassau CNN model utilizes a 16-layer structure with seven layers of convolution, three fully connected layers and a softmax layer (Figure 9). The first two convolutional layers contain 3x3 filter of stride 1, the number of filters being 8, and a maxpooling layer of 2x2 filter of stride 2. The next two convolutional layers are made of 3x3 filter with stride 1, the number of filters being 16, which are followed by a maxpooling layer of 2x2 filter of stride 2. Each of the remaining three convolutional layers are followed by a maxpooling layer. The number of filters of the remaining convolutional layers are 32, 48, 64, respectively. The last maxpooling layer is followed by a fully connected layer with 1024 nodes, a dropout layer with a probability of 0.25, then another fully connected layer with 512 nodes, a dropout layer with a probability of 0.5, then yet another fully connected with 2 nodes with a SoftMax activation layer that ensures the output predictions across all classes. More than 10000 samples were used for training and validation following the same 80/20 ratio (Table 1). About 19678 were used for testing and were separate from the training/validation test (Table 2).
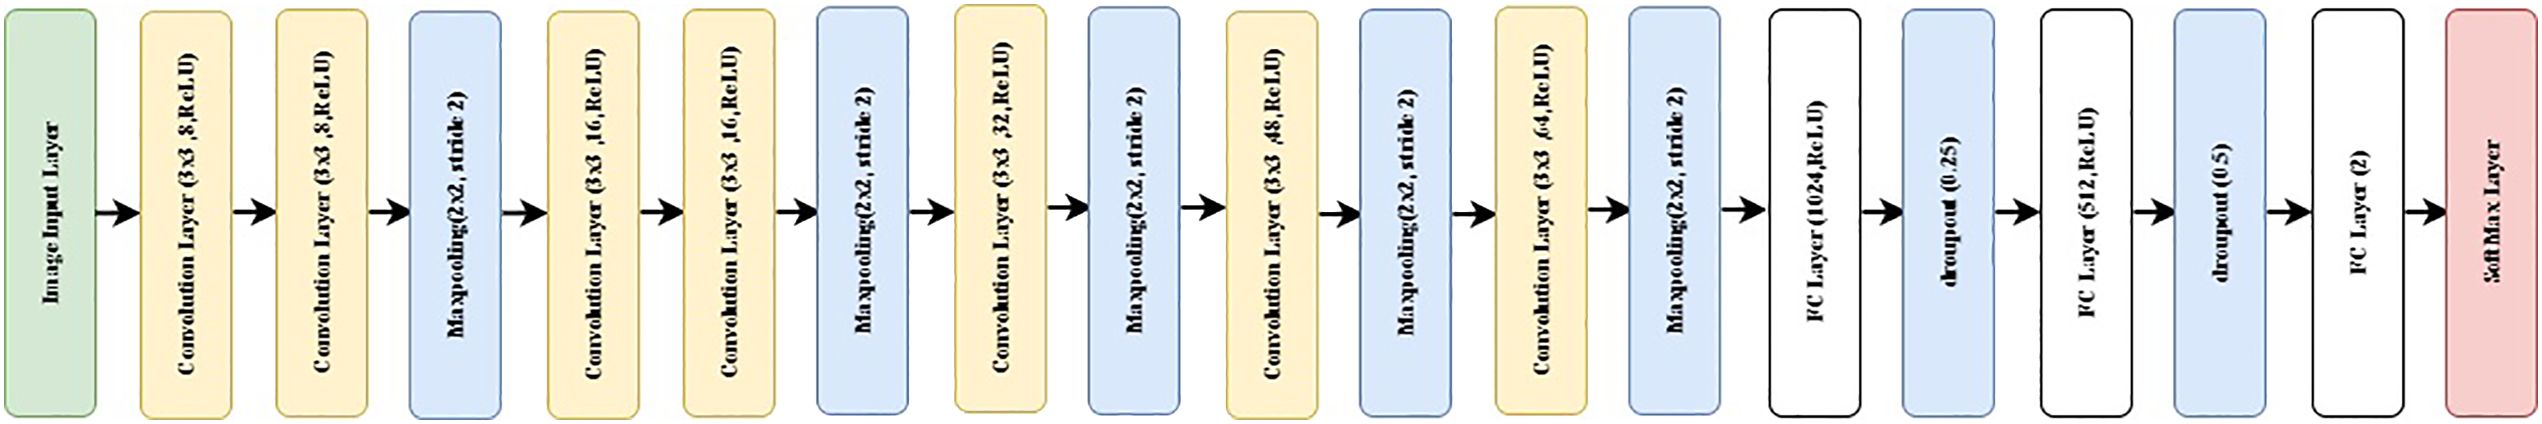
Figure 9 General structure of the Nassau grouper call types Convolutional Neural Network (CNN) model. FC stands for fully connected.
3.3.3 Yellowfin grouper call types classifier
The design of the yellowfin grouper call-type classification model also utilizes a Transfer Learning concept as done in Ibrahim et al. (2020) because of the relatively comparable dissimilarity between call types as in the red hind calls. EfficientNet was also selected as the pre-trained model to classify yellowfin grouper call types. Using Transfer Learning in this case improved the accuracy of the classification. This model is the same as the one used for the red hind grouper but trained with yellowfin calls. The number of call used in this model for training and validation was about 11000 (Table 1). About 11864 were used for testing and were separate from the training/validation test (Table 2).
3.3.4 Data annotation, classes and call counting
The same pre-processing conversion steps were applied to all the acoustic data used to create the training library. An important consideration is the assurance that one or more, call or call type, - including part of the call only if located at the beginning or end of the window - of the species concerned was comprise within the 2s window used for each sample as described in Section 3.1. The classes of the main FADAR model comprised one class for red hind that included the two main call types RH1 and RH2, one class for Nassau grouper that included call types FN1 and FN2 (see Section 3.3.2), one class for both call types of yellowfin grouper, one class for black grouper, one class for squirrelfish and one class boat and background noise, all in the same frequency range. For the call type classification, new classes were created, corresponding to each of the call types for the species concerned. Classes were labeled by a team trained by the authors. Each file was auditively analyzed with canceling headphones and/or visualized with acoustic analysis software. Grouper sounds were quantified per file by visual inspection of spectrograms using Ishmael Bioacoustics (version 3.0) or Audacity (version 3.3.3) or Matlab™ software. For each file an image of the sound was created and classified by an observer depending on the pattern, duration, and frequency of each signal. Classes were labeled from a wide range of data sources as shown in Table 1, which included different recorder types, mobile or fixed platforms, depth, geographical regions and sampling rates. No calibrations were applied to the input data in order to improve the code flexibility at handling a diverse set of data types without significant pre-processing.
While the 2s window length was selected to mostly capture one call at once, input files were in general longer than 20s. Therefore, the splitting of the file in 2s windows can lead to the same call being counted twice. To remedy this issue, when identifying the number of calls in each file, we implemented the following algorithm. The amplitude of the signal in the first and last 0.5s of each 2s window is calculated and compared to a carefully chosen threshold. If the successive window amplitude is above the threshold, then the signal is part of the same call, otherwise it signifies the end of the call. This operation ultimately provides the number of calls in each input file.
3.4 Datasets
To obtain a robust classifier, the training data should encompass the full diversity of each class. To increase the diversity of our training set we utilized data collected by a variety of institutions, under differing survey protocols and across a range of geographic locations and temporal scales. However, all the acoustic data used in this study was collected at FSA sites in the Caribbean Sea. The dataset spans the period 2014–2020 and encompasses three geographic regions from the western shelf of the island of Puerto Rico, in the Greater Antilles, and spans multiple years at the same locations. A second set of data was collected in the neighboring islands of St. Thomas and St Croix of the U.S. Virgin Islands. They were collected under the auspices of three different organizations, namely the Caribbean Fisheries Management Council (CFMC), the Caribbean Coral Reef Institute (CCRI) of the University of Puerto-Rico and the National Oceanic and Atmospheric Administration (NOAA) Southeast Area Monitoring and Assessment Program (SEAMAP-C). The other geographic region that contributed acoustic data to this dataset is in the Cayman islands, more specifically the western shelf edge of Little Cayman. And the third geographic region is the western tip of the Florida Keys in the Gulf of Mexico, namely Riley’s Hump and Western Dry Rocks.
Because all the deployments targeted grouper spawning aggregation sites, all four groupers species can be heard but may not be present at every site. On the Puerto-Rican shelf and in the U.S. Virgin Islands, red hind is the most abundant species. However, spawning sites for yellowfin and Nassau groupers were also monitored and at some locations black grouper CAS were also heard. In the Cayman islands, the recorders were deployed at Nassau grouper spawning sites with the incidental presence of red hind, yellow fin and black grouper. In the Florida Keys, recorders were deployed at spawning aggregation sites of multiple groupers species. All recordings also include the sound of squirrelfish and surface vessels, however, the other sound sources vary with the locations and were not specifically identified for this study. While most acoustic data were obtained from bottom mounted fixed recorders, we also added to this dataset recordings from a mobile surface platform that surveyed the insular shelf edge of St. Thomas and Puerto Rico [see Chérubin et al. (2020); Woodward et al. (2023) for more details]. The relative proportion of data per class between locations used for training and validation is given in Table 1. The relative proportion of data per class between locations used for testing is given in Table 2. The testing data wasn’t used in the training/validation stage although it came from the same overall dataset as shown in Tables 1, 2.
Along with the different locations, research groups, and methods, the type of recorders also varied but consisted mainly of Loggerhead Instruments recording units. Each unit was programmed to record ambient sounds either continuously for short-term week-long deployments or through a duty cycle for long-term months-long deployments. In Puerto-Rico and the U.S. Virgin Islands most units were Loggerhead Instruments digital sprectrogram recorders (DSG), using a sampling rate of 80 kHz. In the Cayman Islands, acoustic recordings were obtained from DSGs between 2013 and 2020 Wilson et al. (2020) and Ocean Instruments SoundTrap Model 300HF in 2020. DSG instruments recorded at a sample rate of 50 kHz and Soundtrap at 48 kHz. In the Florida Keys, Soundtrap recorders were used with sampling rates of 44.1 kHz. All these recorders were fixed on the ocean floor. Acoustic recording units from mobile platforms were also considered in our training data set. They were collected by an embedded system on a wave glider and recorded ocean sounds between 10 and 20 m below the surface. More details on the glider operations and the payload system can be found in Chérubin et al. (2020); Woodward et al. (2023). The sampling rate for the PAM system was 10 kHz. Therefore, the training dataset encompasses several types of recorders, hydrophone sensitivities, gain setups, and sampling rates that will contribute to the robustness of FADAR.
3.5 FADAR testing procedure and performance metrics
In this section, we present the model testing procedure, the evaluation metrics and then the explainability tools that were applied to identify the spectral features used in the classification process. The experiments were implemented in Matlab™ following a standard validation procedure, which is explained next. The dataset used for training is shown in Table 1, and the testing dataset is shown in Table 2. Among the training data, 80% of the data were randomly chosen for training, while the remaining 20% were reserved for validation. This process was repeated five times until all data points in the training set were validated once. Finally, the trained model was tested using the reserved test data.
Sensitivity, specificity, and accuracy defined as Equations 1–3:
where TP stands for true positive, TN true negative, FP false positive and FN false negative were calculated for each class to measure the performance of the various classification models. Here, TN corresponds to the vessel/ambient noise class. The ability of a model to identify true positives is referred to as sensitivity also called recall, while the ability of a model to identify true negatives, which is one of our classes is referred to as specificity. More specifically, the sensitivity score shows the ability of the model to correctly identify the candidate sample’s call-type, while the specificity score shows the ability of the model to correctly state that the candidate sample does not belong to that particular call-type. While accuracy may be an inadequate measure of the performance of the classifier for imbalanced datasets, where TN ≫ TP, Hildebrand et al. (2022) recommend measuring the classifier performance using metrics that are expressed in terms of ratios, namely the true positive and true negative rates. Here we also calculated for each of the six classes the receiver-operating-characteristic curves (ROC).
3.6 Enhancing model transparency with interpretability techniques
In our pursuit of a more comprehensible and transparent classification model, we integrated three pivotal interpretability techniques known as Gradient-weighted Class Activation Mapping (Grad-CAM), Local Interpretable Model-agnostic Explanations (LIME), and Occlusion Sensitivity. These methodologies collectively shed light on the decision-making processes within complex CNN architectures. In scientific and engineering contexts, the notion of a “black box” underscores the challenge of understanding processes devoid of explanatory insights, meaning that humans, even those who design them, cannot understand how variables are being combined to make predictions (Rudin and Radin, 2019).
Grad-CAM operates as a post-hoc explanation approach, facilitating model interpretability without necessitating structural alterations to the examined CNN architecture (Selvaraju et al., 2019). By producing heat maps that vividly highlight regions of an input image contributing positively to the network’s classification decision for a specific class, Grad-CAM provides a visual representation of activation intensity, ranging from vibrant orange (high activity) to cooler blue (lower activity). This technique offers transparent insights into the decision rationale of diverse CNN-based models (Selvaraju et al., 2019).
LIME constitutes an approach that furnishes explanations for classifiers of all kinds, striving to construct a locally interpretable model closely approximating the actual model’s behavior for a given input and prediction (Ribeiro et al., 2016). By highlighting superpixels in orange to denote positive contributions and in blue for negative ones, LIME effectively segments an image, pinpointing regions with substantial influence on the classification outcome. This approach quantifies contributions, thus illuminating areas that significantly affect classification results.
Occlusion Sensitivity enhances model interpretability by systematically occluding portions of an input image and measuring the corresponding impact on the classification outcome. By iteratively masking different sections of an image, the technique discerns the image regions that exert the most influence on the model’s predictions. Occlusion Sensitivity thus further contributes to the transparency and insights into how the CNN arrives at its decisions, enhancing the model’s overall interpretability.
Collectively, these techniques offer a deeper understanding of the intricate decision-making processes within our model.
4 Results
4.1 Features of interest in the call type classification
In the study herein, because the classification is based on RGB spectrogram images, FADAR classification of the calls is based on the identification of spectral features as shown by Figure 10. The identification of tonal calls is mostly based on the slope and energy of the tonal bands of the calls. The highest energy bands are the greatest contributors to the call identification for red hind call RH1, Nassau grouper call FN1 and yellowfin grouper call YF1 according to Grad-CAM. However, this metric shows significant overlap between the three species frequency bands. Instead, the LIME and Occlusion sensitivity metrics indicate different parts of each of the calls that do not overlap suggesting that key time-frequency features exist and enable the distinction between calls. The time-frequency features of the black grouper tonal call are distinct from the other three species according to Grad-CAM, LIME and Occlusion Sensitivity metrics.
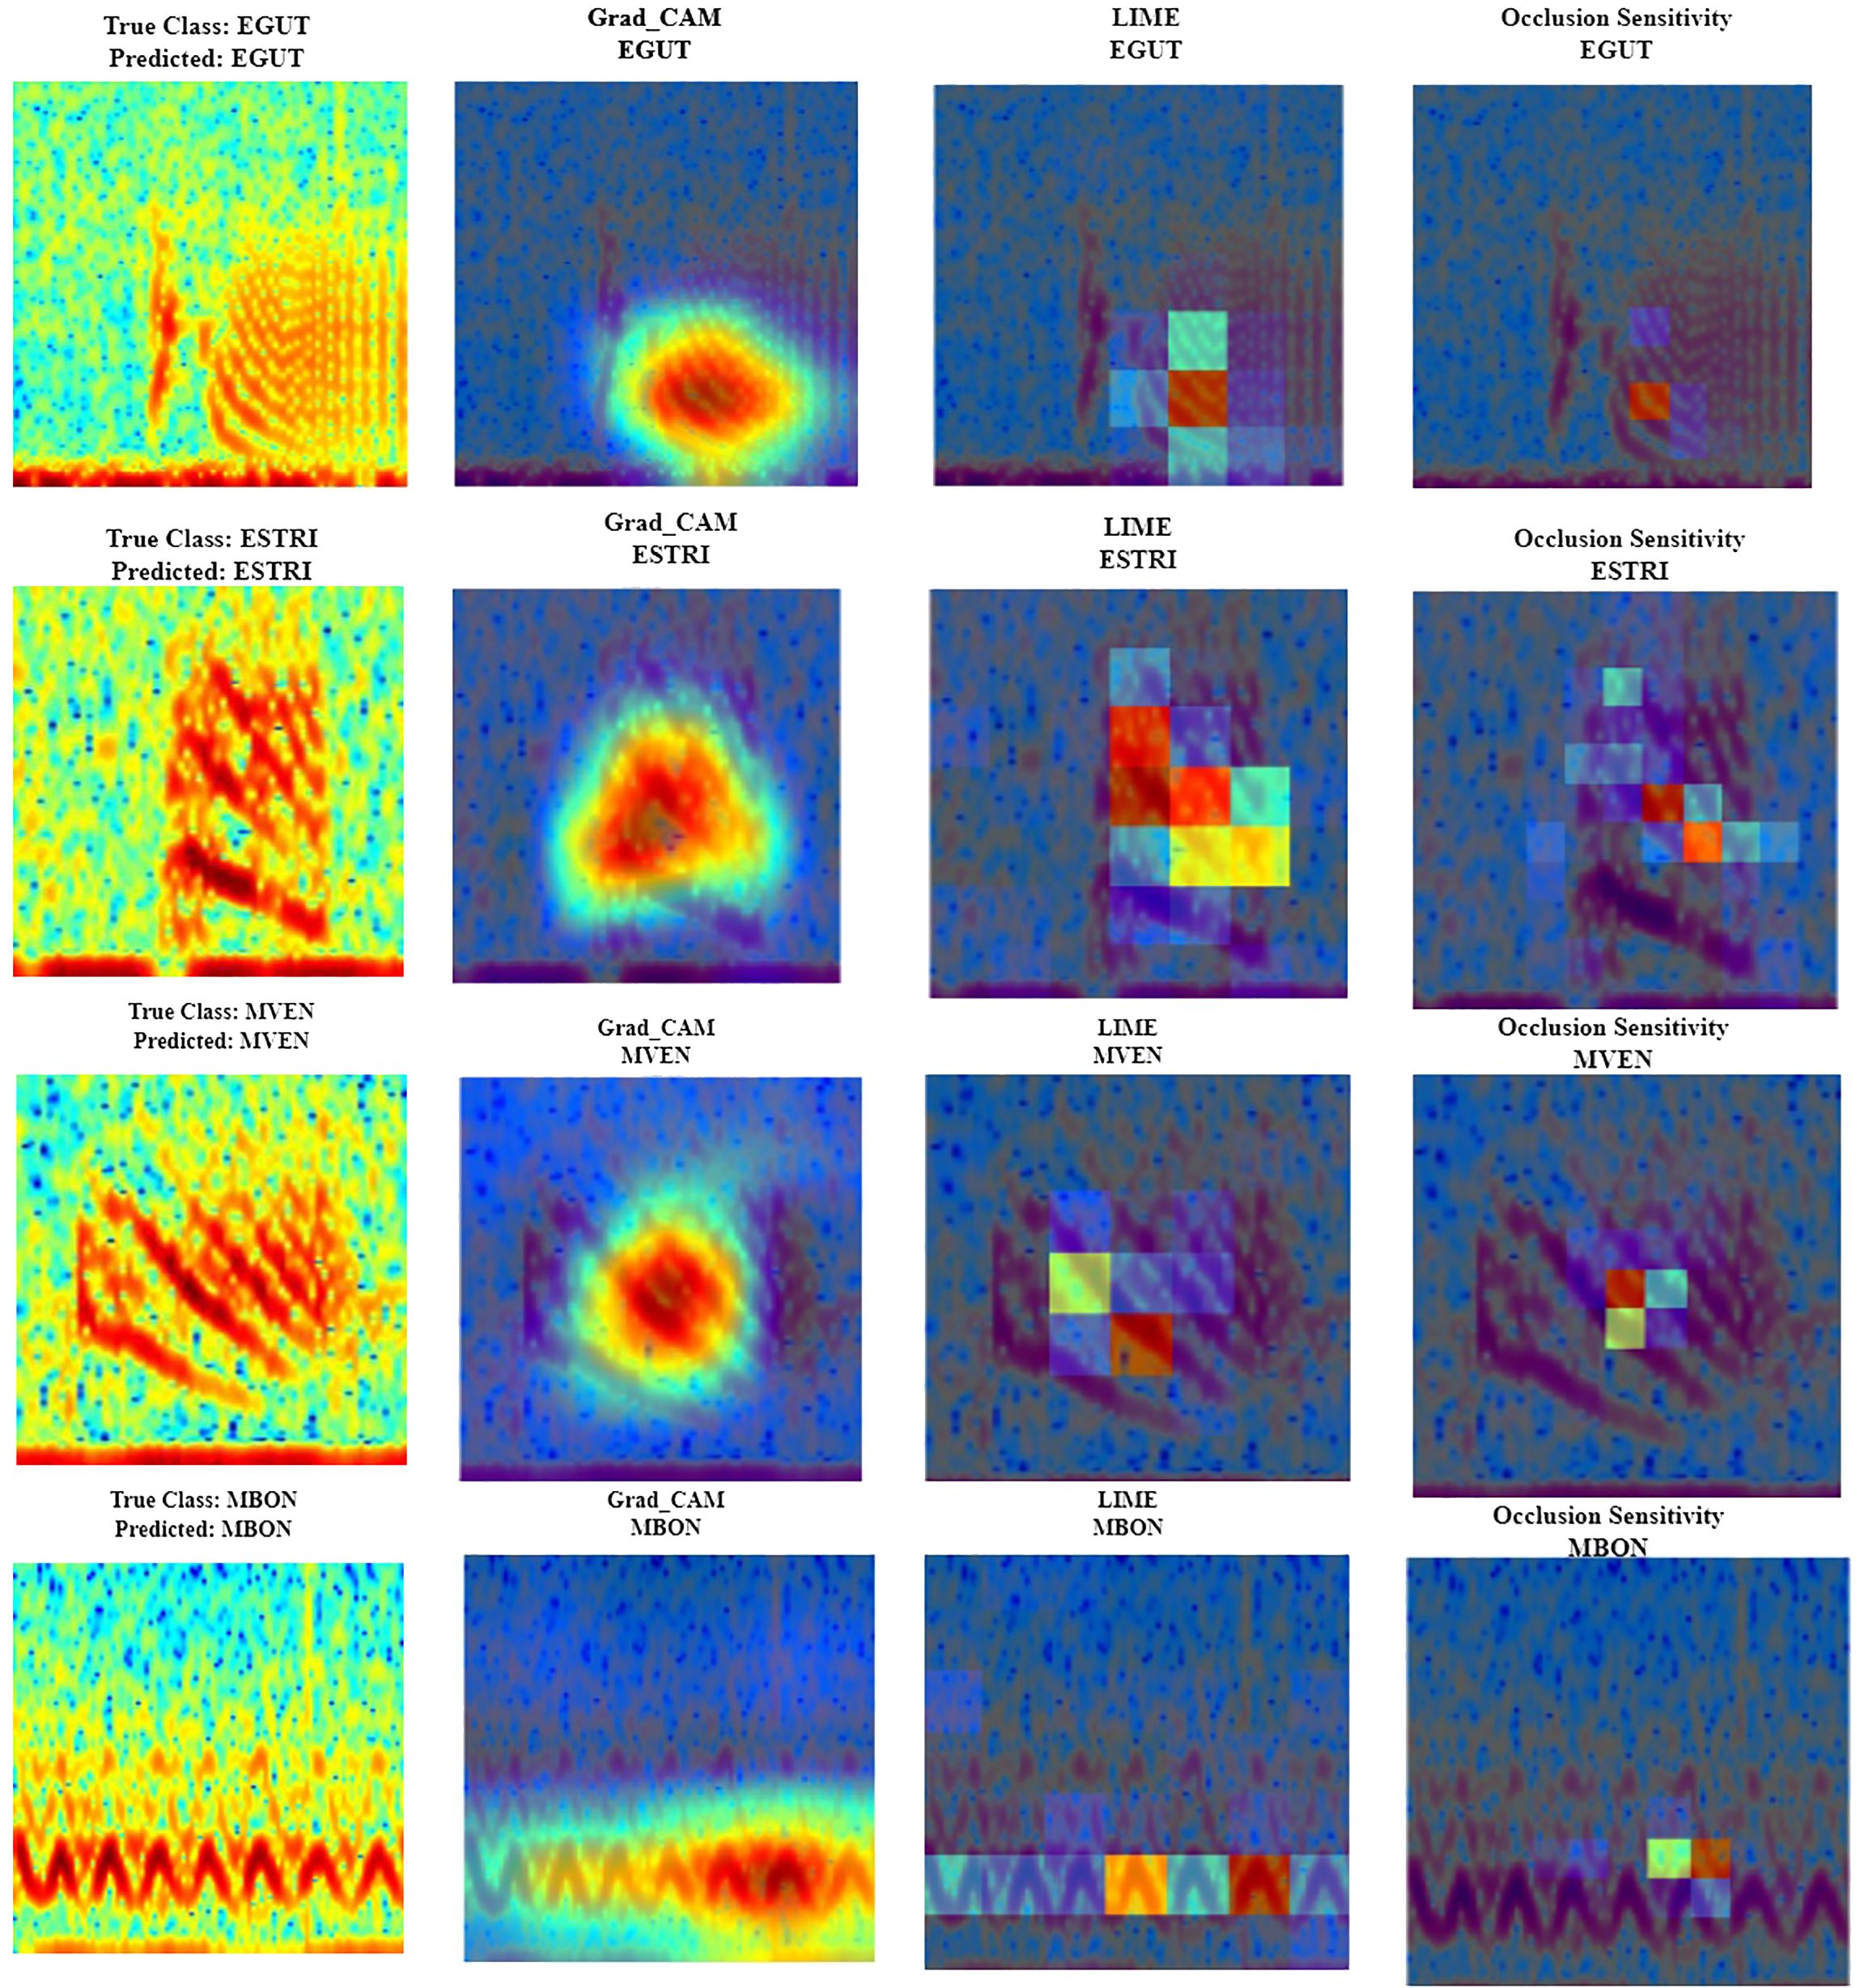
Figure 10 Spectral regions and features of interest identified by Gradient-weighted Class Activation Mapping (Grad-CAM - second column), Local Interpretable Model-agnostic Explanations (LIME- third column), and occlusion sensitivity (fourth column) interpretability measures in the call spectrograms (first column; the spectrograms were calculated with a FFT size of 4096 points) of red hind (first row, EGUT), Nassau (second row, ESTRI), yellowfin (third row, MVEN) and black grouper (fourth row, MBON).
The same interpretability measures were also applied to the distinction between call types for red hind grouper (Figure 11) and yellow fin grouper (Figure 12). The Grad-CAM metric for red hind grouper suggests that the spectral features selected by the sub-model are the maximum energy of the spectral band in the RH1 calls and the time-varying pulses in the time frequency representation of the RH2 calls. For the yellowfin grouper sub-model, the spectral features of interest are a specific frequency range in the maximum slope region of the tonal call for call type YF1 and the extent the peak energy band of the pulse train sound, YF2.
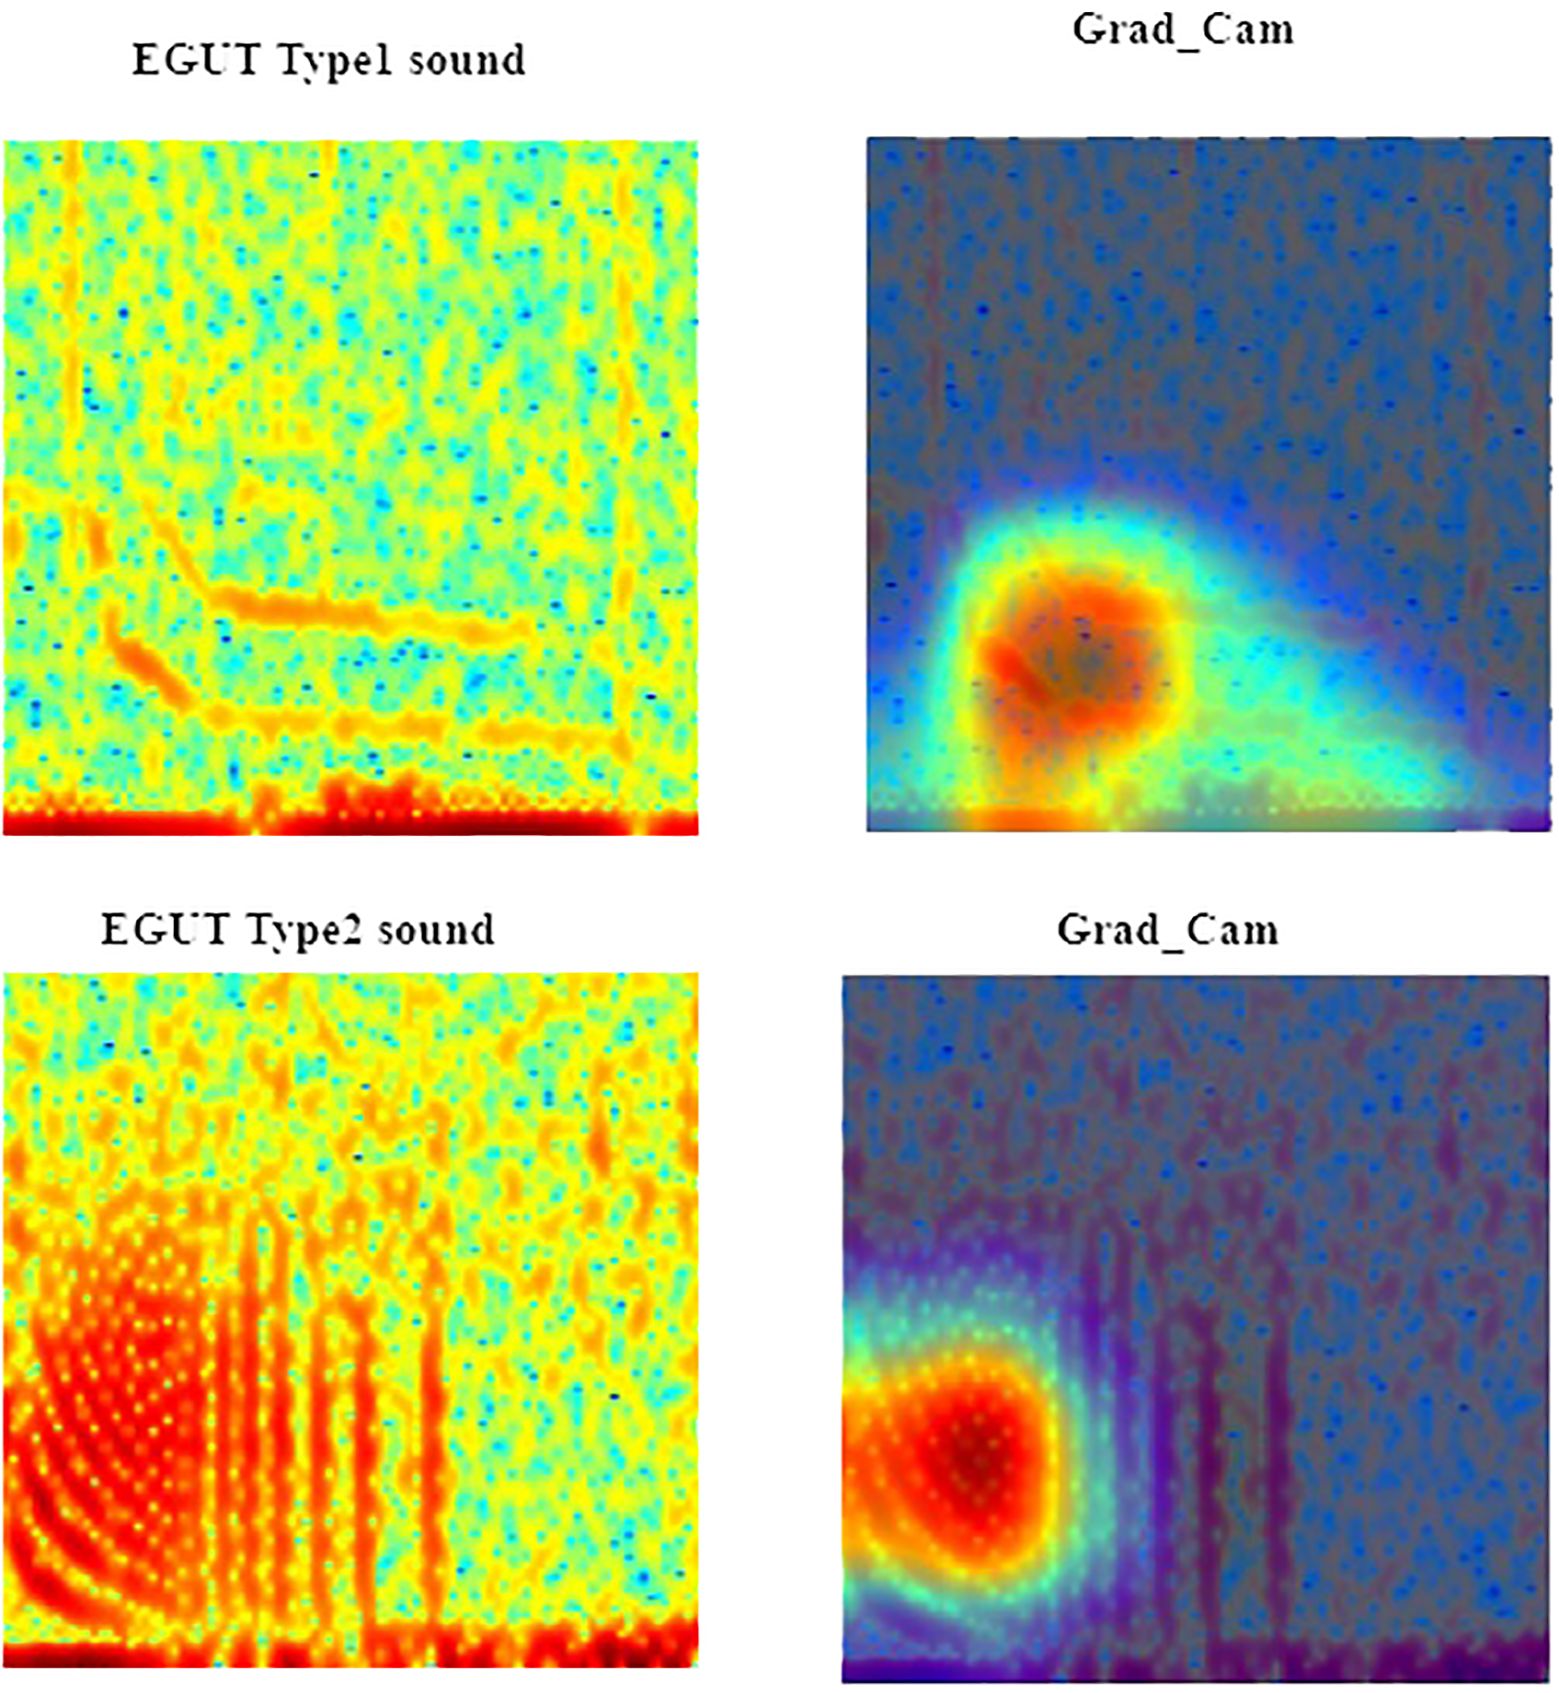
Figure 11 Spectral regions and features of interest identified by Gradient-weighted Class Activation Mapping (Grad-CAM - second column) interpretability measure in the red hind grouper (EGUT) call type RH1 (first row) and call type RH2 (second row) spectrograms. The spectrograms were calculated with a FFT size of 4096 points.
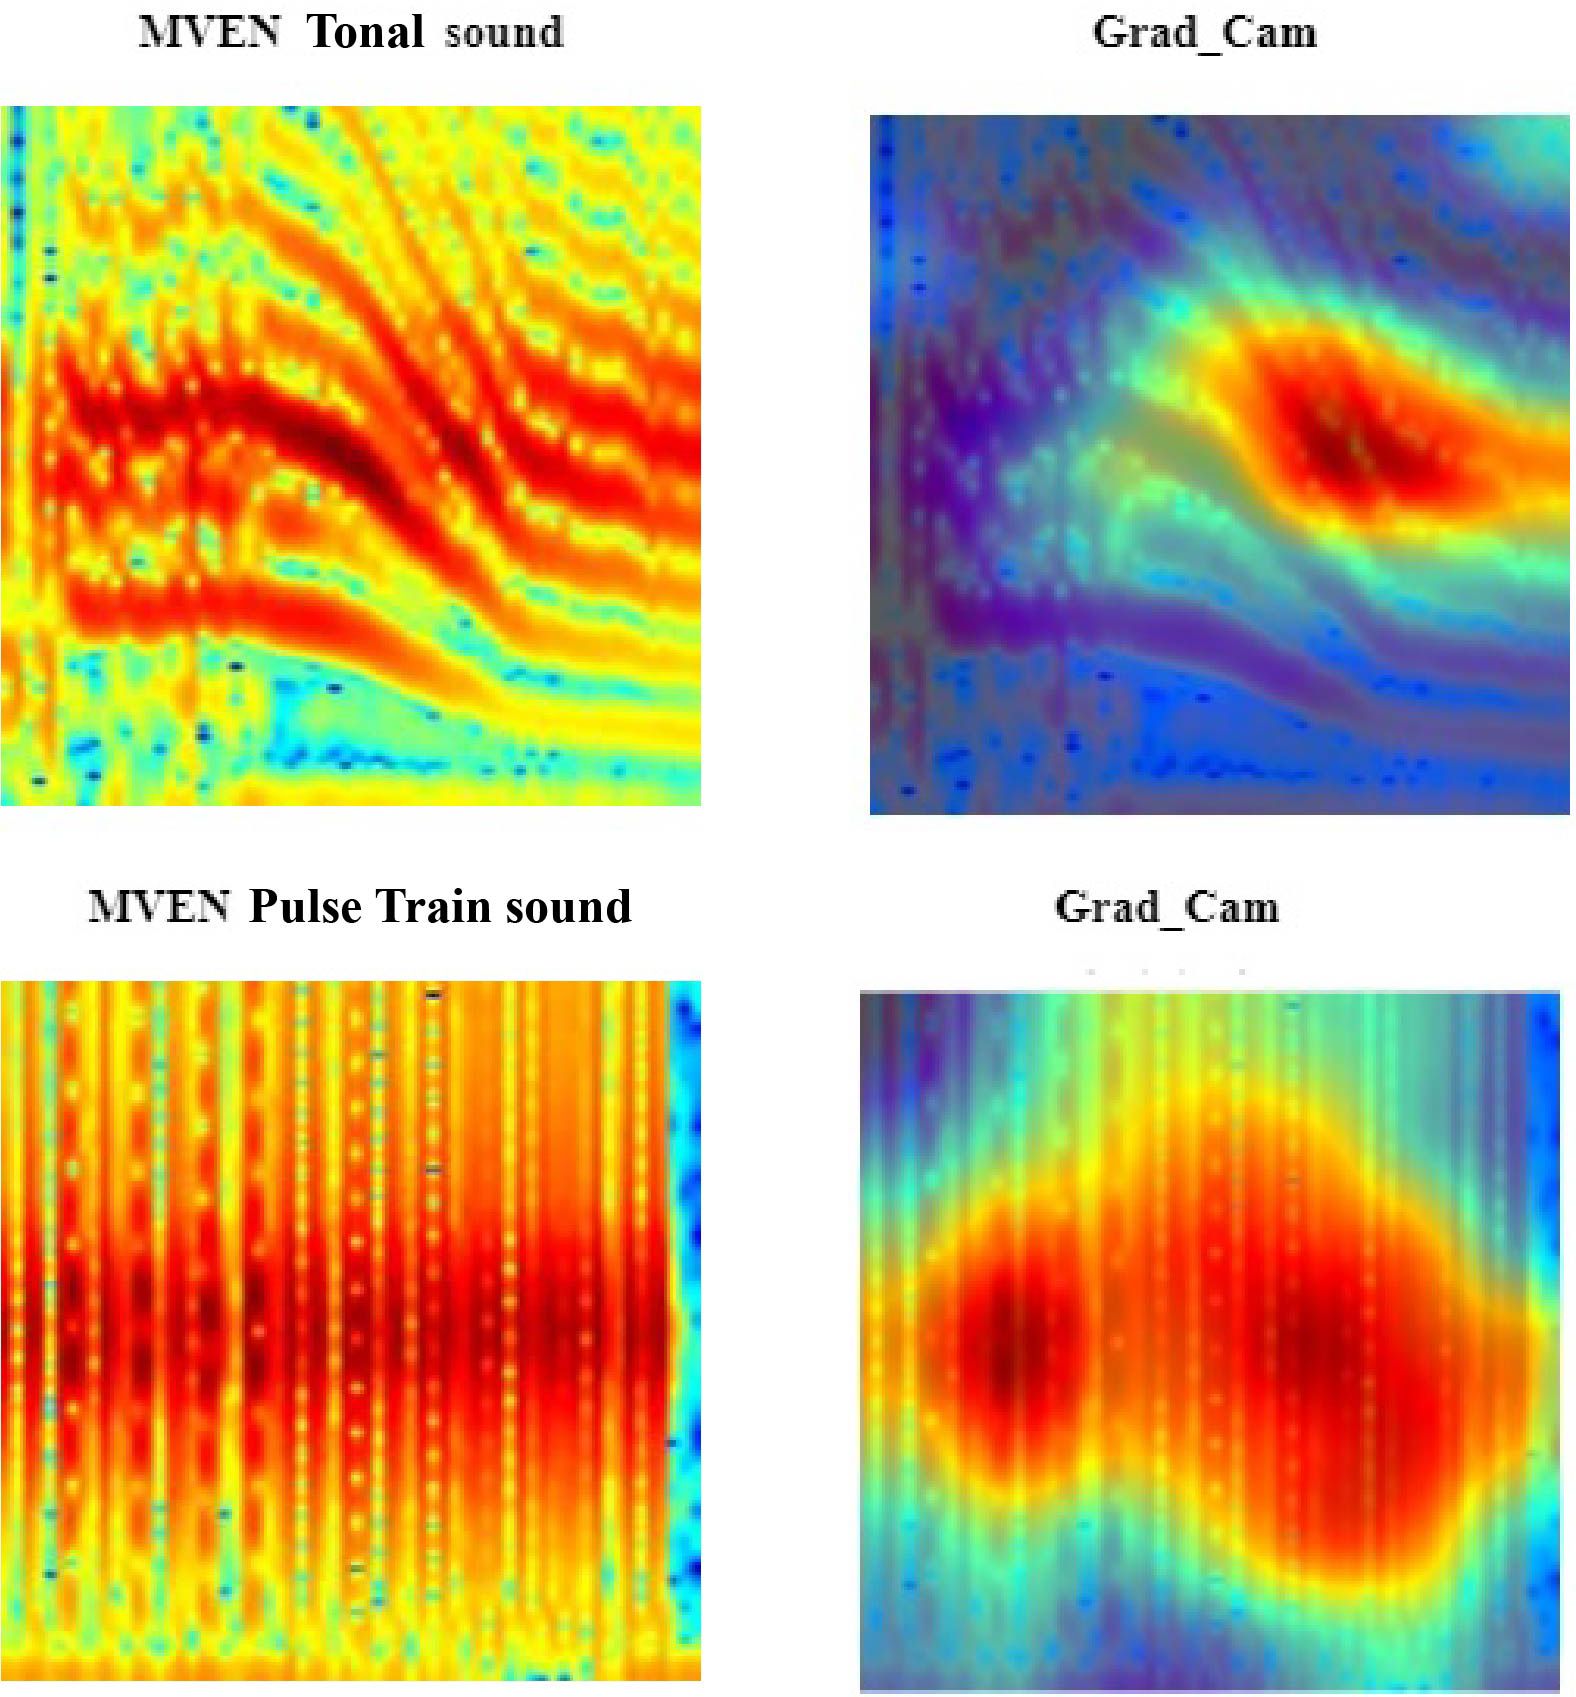
Figure 12 Spectral regions and features of interest identified by Gradient-weighted Class Activation Mapping (Grad-CAM - second column) interpretability measure in the yellow fin grouper (MVEN) call type YF1 (first row) and call type YF2 (second row) spectrograms. The spectrograms were calculated with a FFT size of 4096 points.
4.2 Evaluation of FADAR
We first present the evaluation of FADAR main model, a MMDL algorithm for grouper CAS detection and classification (see Section 3.2). The results are shown in Table 3 and consist of the average over all the test data for each class. FADAR sensitivity is greater than 0.91 for all classes, the lowest score being for yellowfin grouper. Specificity is however greater than 0.98 for all classes, the lowest score being for black grouper. And accuracy is greater than 0.94, the lowest score being for yellowfin grouper. Considering all classes together, the sensitivity, specificity and accuracy of FADAR main model are above 0.97 for the testing dataset used in this study that includes a diversity of recording platforms, gain, sampling frequency, location and depths. All three measures are the highest for boat sound and squirrelfish.
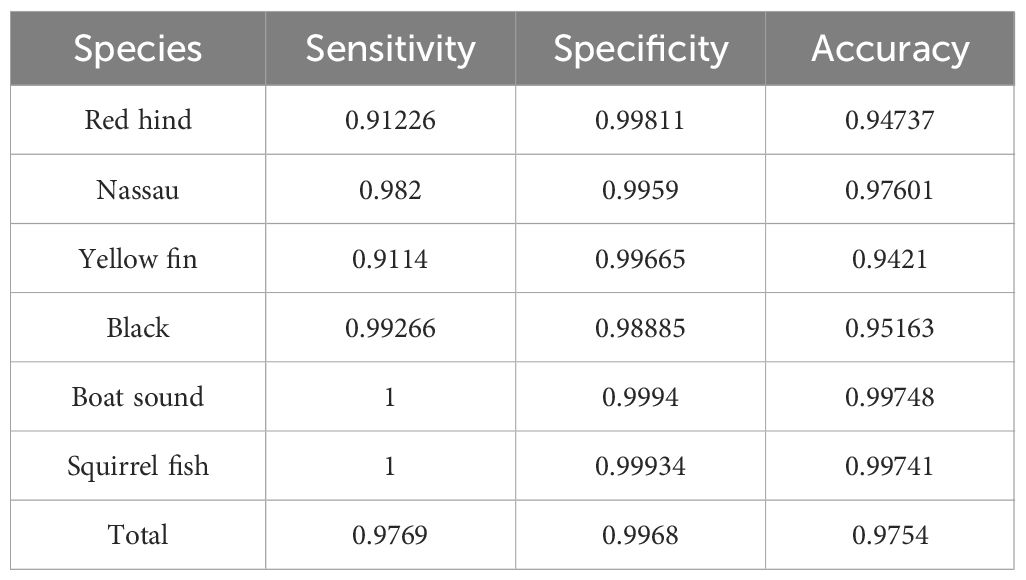
Table 3 Evaluation metric values of the main FADAR model.
The ROC curves for each of the classes, corresponding to the results of FADAR classification expressed in terms of Accuracy in Table 3 are shown in Figure 13. The ROC curves suggest a high probability of TP and low probability of FP for all six classes, which also confirms that using accuracy as a performance measure of FADAR is appropriate.
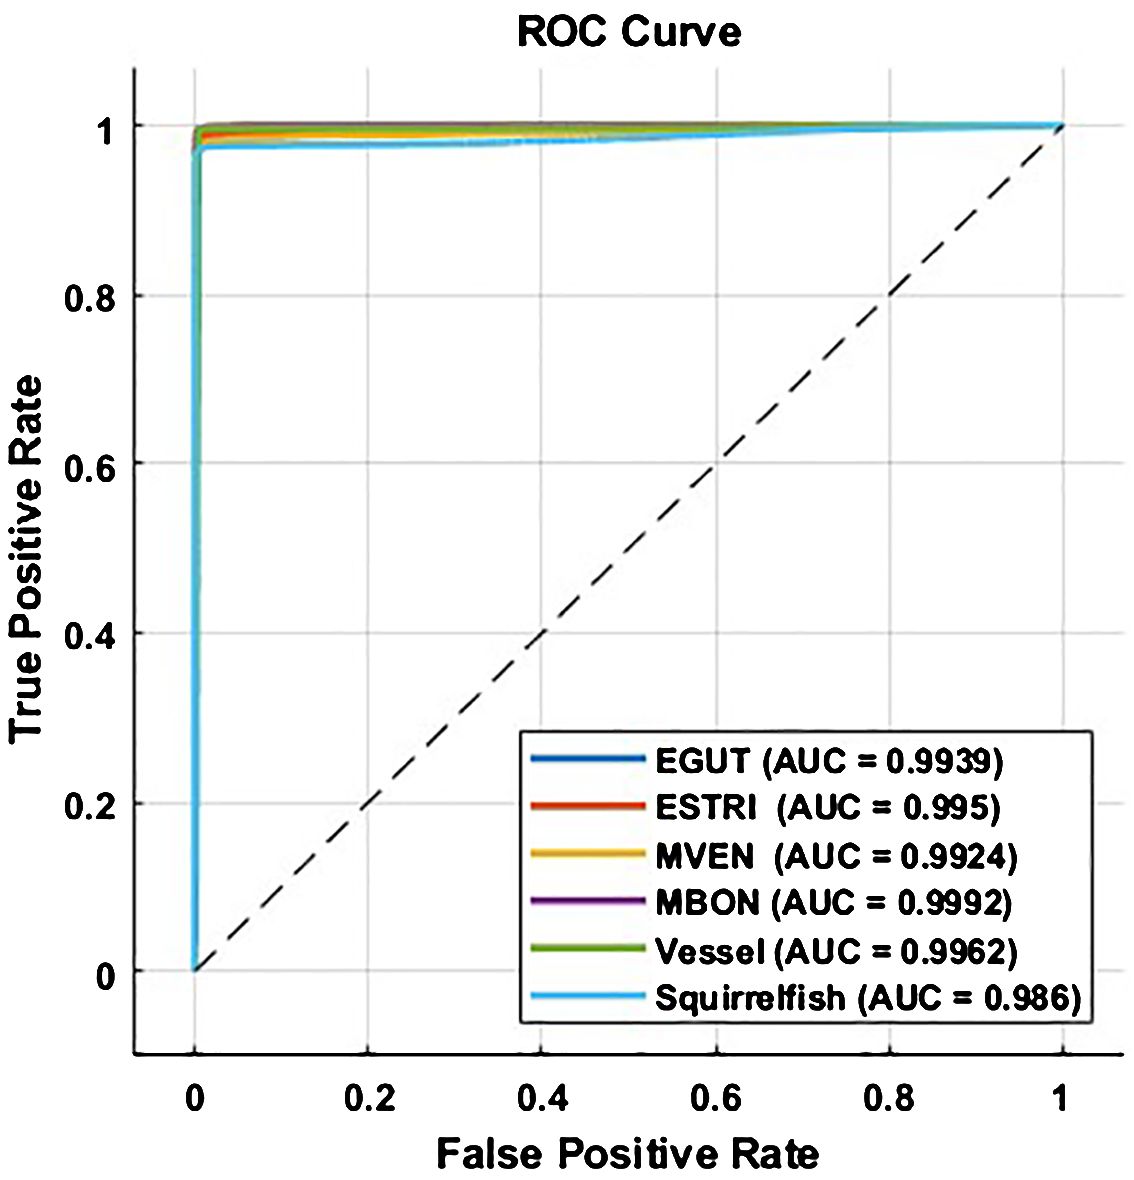
Figure 13 Performance of FADAR’s multi-model deep learning (MMDL) is illustrated as ROC curves for each classes.
FADAR’s main model was also evaluated to account for the effect of region (Table 4) and depth (Table 5). For the effect of region we chose to compare three geographically distinct regions such as the western Caribbean FSA in the Cayman Islands, the Western shelf of Puerto Rico and the southern shelf of St. Thomas in the central Caribbean region, and the Florida Keys in the Gulf of Mexico. The regional comparison reveals few differences across region for all classes. Squirrelfish sound classification shows a slight decrease in accuracy (<0.9) due to a decrease in sensitivity at ALS. Different instruments were also used, namely Soundtrap recorders in the Cayman Islands and the Florida Keys, and Loggerhead DSG recorders at ALS and RHB. The results show no significant differences according to the instrument. Because most grouper spawning aggregation sites are located near the shelf edge, the depth variation between sites is minimal regardless of the species, although on the western shelf of Puerto Rico the FSA at BDS is located at 50 m depth. Therefore we compared the results of FADAR on recordings at BDS, ALS and ASL Deep, which is 4 m deeper than ALS and made by the wave glider, between 10 and 20 m below the surface. Table 5 shows no significant differences between depths.
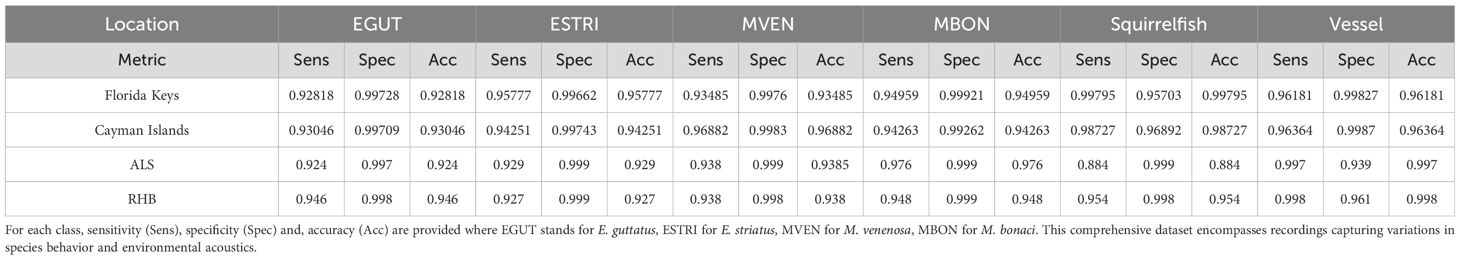
Table 4 Performance metrics for different acoustic datasets across three distinct regions: the Florida Keys (Gulf of Mexico), the Cayman Islands (Western Caribbean), Abrir la Sierra (ALS) and Red Hind Bank (RHB) in the northern central Caribbean.
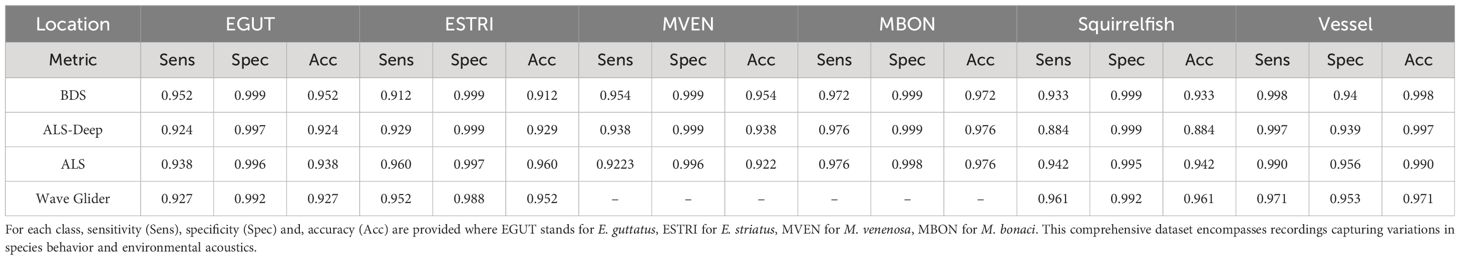
Table 5 Performance metrics for different acoustic datasets across depth: Bajo de Sico (BDS) FSA is located at 50 m depth, Abrir la Sierra (ALS) Deep at 28 m, ALS at 24 m, and the Wave Glider PAM is towed between 10 and 20 m below the surface.
The same analysis was conducted to evaluate the skills of the sub-models on call type classification for each species concerned. The results are shown in Table 6 for red hind grouper calls, Table 7 for Nassau grouper calls and Table 8 for yellow fin grouper calls. The red-hind grouper sub-model sensitivity and accuracy is slightly improved over FADAR main model and is above 0.93 for all three measures. Nassau grouper sub-model exhibits lower skills at classifying the call types than the main model does at identifying any Nassau calls. However all three measures remain above 0.9. Finally, the yellow fin grouper sub-model showed improved sensitivity over the main model. Classification skills were much improved in terms of all three metrics for the YF1 call especially. Specificity and accuracy of the classification of YF2 calls were lower than in the main FADAR model. Overall, the sub-models exhibit higher sensitivity for tonal-like calls such as RH1, N1, and YF1.
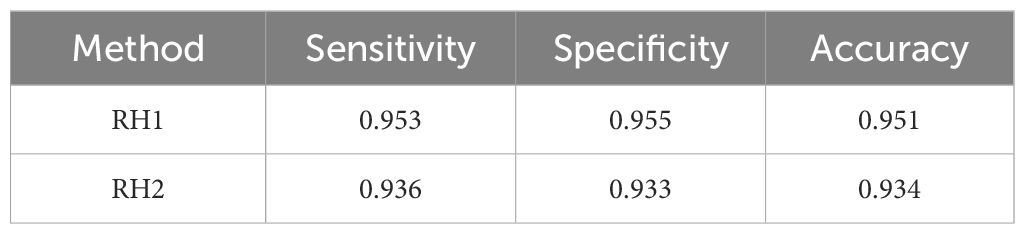
Table 6 Evaluation metric values of the red hind grouper sub-model.
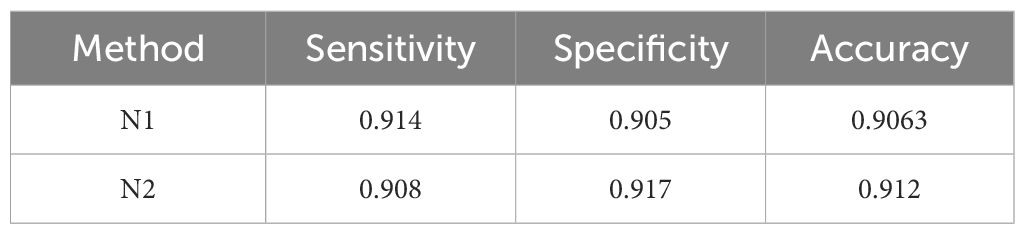
Table 7 Evaluation metric values of the Nassau grouper sub-model.
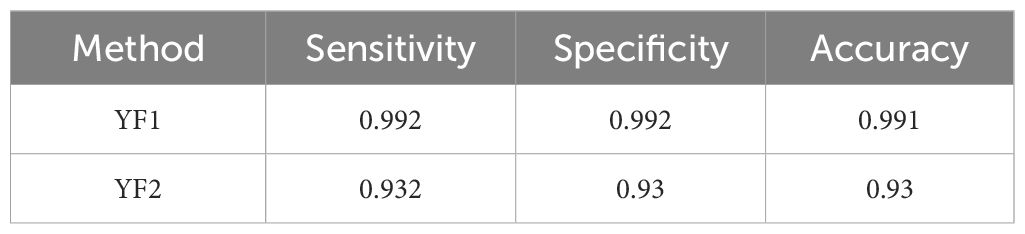
Table 8 Results of the Yellowfin grouper sub-model.
A second evaluation of FADAR was conducted on datasets and data not used in the previous testing steps. It consisted of an unbiased evaluation of the algorithm by testing FADAR on an equal number of samples (600) for each species, ensuring balanced representation across locations including Cayman Islands, St. Thomas (Grammanik Bank), St Croix (Lang Bank), and the Florida Keys. Notably, particular attention is directed towards mitigating potential sources of acoustic interference, particularly at locations such as the Cayman Islands, Puerto Rico and the Virgin Islands, where background noise originating from other fish sounds and vessel activity, as well as the coexistence of marine mammals with overlapping frequency ranges, present significant challenges to call type and species classification. These systematic evaluations, encapsulated in the sensitivity, specificity, and accuracy measures, allow for a rigorous examination of FADAR’s performance in species detection while considering the influence of environmental factors across diverse marine ecosystems. The results are shown in Table 9 and confirm the robustness of FADAR classification skills across locations for all classes. The sensitivity lowest score (0.897) is obtained for the Cayman Islands squirrelfish sound although the accuracy remains above 0.9. For all the other species and locations including the Cayman Islands the sensitivity, specificity, and accuracy scores are above 0.9. Again, this unbiased analysis suggest that location, which encompasses three Caribbean regions, the Florida Keys in the Gulf of Mexico, Grammanik and Lang Bank in the Northern central Caribbean and the Cayman Islands in the western Caribbean is not a factor in the accuracy of FADAR, nor is the instrument type. Loggerhead Instruments DSGs were used in the northern central Caribbean and Soundtrap recorders in the Cayman Island and the Florida Keys.
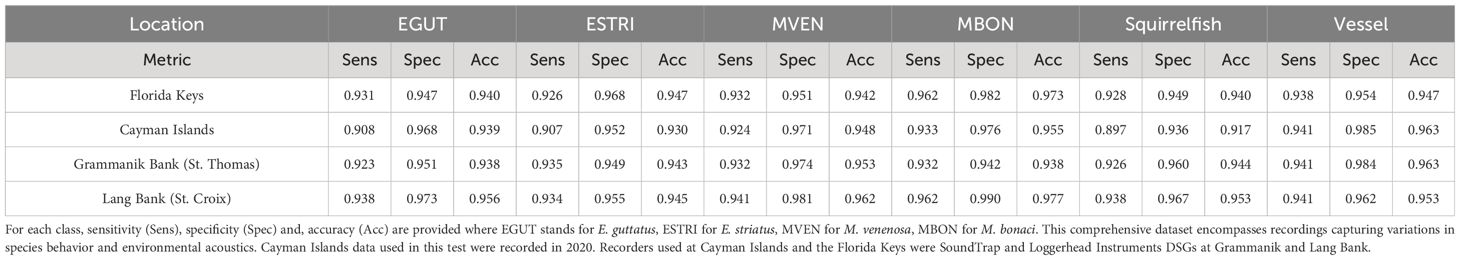
Table 9 Performance metrics for different acoustic datasets across three distinct regions: the Florida Keys (Gulf of Mexico), the Cayman Islands (Western Caribbean), Grammanik Bank (St. Thomas, USVI) and Lang bank (St. Croix, USVI) in the northern central Caribbean.
5 FADAR application input and output structure
A Windows app, known as FADAR, was created to provide an efficient solution for classifying and categorizing different types of grouper fish sounds using the proposed algorithms. FADAR windows app is a Matlab™ Runtime app that is run without installing Matlab™. Two choices are available to install FADAR: either a standalone executable that does not require Matlab™ Runtime libraries or an app installer that includes Matlab™ Runtime libraries that will create the executable. With our user-friendly application, individuals can easily upload either a single sound file or an entire directory containing multiple sound files. The app offers four primary classification options: first, ‘Classify Grouper’ which offers a broad identification of the input sounds as grouper species or vessel or squirrelfish; second, ‘Classify Specific Grouper Types’ that allows users to select exact grouper sound categories such as ‘Red Hind Call Types,’ ‘Nassau Call Types,’ or ‘Yellowfin Call Types.’ To further improve user experience, FADAR provides versatile output formats. Users have the option to view classification results as in-app tables, allowing for quick and easy reference. For those who require external analysis or wish to share the data, the app can export classification outcomes as CSV (Comma-Separated Values) files, compatible with spreadsheet software like Microsoft Excel. Additionally, the application is equipped to generate video files displaying spectrograms annotated with the species name, offering a visual representation of the sound classifications for verification purposes. Finally, the app can also create folders of the 2s spectrograms in the 0–500 Hz range for each class, of all the calls detected for further verification. FADAR is also an efficient algorithm that can classify ten thousand 20-s files in 2.5 hours on a GPU powered laptop.
FADAR app can be downloaded at the following link: https://github.com/Aliklawat/-Fish-Acoustic-Detection-Algorithm-Research. Two files are present in the folder, namely FADAR executable and a zipped app installer. Requirements to operate FADAR are 64-bit processor and a minimum sampling rate of 10 kHz for the data. It is recommended to download the app installer, unzip and run it. It will provided instruction during the installation process of Matlab™ Runtime and FADAR. Once installed, FADAR is ready to operate by a simple click on the FADAR icon. All of the installation steps and operation guidance are provided on the Github page. In summary, our Windows app “FADAR”, streamlines the process of identifying and categorizing grouper fish sounds, catering to both general classification and specific call type recognition needs. Whether users are a marine biologist, researcher, or enthusiast seeking to understand and differentiate various grouper fish sounds, FADAR application serves as a valuable and user-friendly tool to meet their requirements. FADAR has been shared with multiple groups, including Florida Fish and Wildlife Commission, NOAA (Taylor et al., 2020), the NGO COBI in Mexico, and the Grouper Moon Project at Scripps Institution of Oceanography (van Horn et al., 2024). Training sessions were also setup for our potential users. COBI in Mexico has trained fishermen and fisheries managers to use the FADAR for Nassau grouper spawning aggregation monitoring.
6 Discussion
Machine learning methods have become effective tools for classification of often-extremely large passive acoustic datasets with a focus on marine mammals (Frasier, 2021; White et al., 2022). Existing work increasingly employs spectrogram representations of sound across a limited frequency range, which is selected according to the species (or signal) of interest. Using the full frequency band that include the signal of sources of interest, would indeed hinder the performance for the classification process because the ratio between pixels containing the signal to be classified would be quite low compared to an image with limited bandwidth as suggested by White et al. (2022). FADAR is the first machine learning package developed specifically for fish calls identification within a specific frequency range (0 -500 Hz) that encompasses all of the known species’ calls targeted in this study. We proposed an approach for classifying grouper sound calls in FSA sites using the concept of DL. We used the concept of ensemble DL for the main model to classify six different sounds, five fishes and one anthropogenic, heard in FSAs. Additionally, we proposed three submodels to classify each species call types. Furthermore, FADAR provides an integrated system consisting of DL models for both feature extraction and classification of fish species using their sounds.
For the detection and classification of marine mammals signals, CNNs have become the most common architectures Belghith et al. (2018); White et al. (2022). This work builds upon the evaluation of various architectures for each species that were presented in a series of studies such as CNN and LSTM (Ibrahim et al., 2018b), transfer learning with CNN (Ibrahim et al., 2020), stack auto encoders (Ibrahim et al., 2019), and multimodel DL (Ibrahim, 2019; Ibrahim et al., 2021), which have paved the way for the FADAR algorithm presented herein. These studies provided the baseline to identify the best methods for the different applications, especially the call type classification. They also showed that the performance of the different architectures was species dependent. So FADAR is the results of what gave the best results for all species calls overall and for species specific call types. Another selection of architectures would certainly work as well.
Our results demonstrate the ability of a CNN to extract higher level components of the soundscape for an assessment of the species present, beneficial to marine management, policy and stakeholders. However, as shown in White et al. (2022), a single CNN model appears to be unsuitable for all bioacoustic research needs. At the species level, understanding species acoustic behavior in the spawning aggregation context requires not only models which incorporate soundscape elements but also, in tandem, complex species call type-level classifiers to meet the desired research needs. In Woodward et al. (2023), the authors show that the acoustic propagation characteristics between RH1 and RH2 are different, because mostly RH2 call type were recorded the near the surface, despite both call types being present at depth at the same source level. Using both tonal and impulsive call types of grouper calls allows for a more refined determination of their spawning behavior (territory defense, mate attraction, call to migrate to the aggregation site) over single call type approaches. Male red hind form territories with harems of one or more females during spawning aggregations (Shapiro et al., 1993) that may be associated with variations in combinations or structure of call types associated with sex-specific interactions. The methodology described here could be applied to other soniferous species with similar complex repertoires as the grouper species analyzed in this study.
Many FSAs are multi-species hot spots where several grouper species can be found (Wilson et al., 2020; Woodward et al., 2023). They are noisy environments where geophony, anthropophony, and biophony overlap and hinder the transmission, detection, and discrimination of species specific sounds. Understanding how fish and other marine animals adapt their communication strategy while sharing the acoustic space (both in frequency and space) can offer insight into the differences among species sounds (Wilson et al., 2020). To assess the possibility of acoustic partitioning between the four grouper species that FADAR can detect and classify, Wilson et al. (2020) analyzed their spectral and temporal features and their individual sound segments in their study. They measured the following acoustic features for a subset of high signal to noise ratio calls and their segments: duration, peak frequency, 3 dB bandwidth, received level, and (if applicable) inter-pulse period (IPP). The spectral and temporal characteristics of calls themselves were partitioned. And they investigated the use of the acoustic features of calls and segments for discriminating between species and call types using a random forest of multiple classification and regression trees (Breiman et al., 1984; Breiman, 2001). Their analysis revealed that IPP and duration were the most important predictors for random forests, influencing both call and segment classification more strongly than spectral features. In the study herein, the grouper calls are detected and classified based on the spectrogram images. Hence, the detection and discrimination of the grouper calls by FADAR is done through the time-frequency features contained in the images. While the Grad-CAM measure showed overlapping features among the tonal calls of red hind, Nassau and yellowfin groupers, more discriminating features were revealed by the LIME and Occlusion Sensitivity measures. Features such as the slope of the energy bands of lesser energy, proximity of the bands to each other were identified. This type of spectrogram feature separation also extends in the classification of call types.
Work that incorporates multi-sound sources has become important to investigate variations in ambient sound characteristics and monitor biodiversity to infer ecological information. There are a variety of tools and studies on multi-sound classification in terrestrial systems such as BirdNET (Kahl et al., 2021) and others (Potamitis, 2014; Denton et al., 2021; Ghani et al., 2023). In the marine environment Belghith et al. (2018) demonstrate how custom CNNs can discriminate between baleen whale calls, odontocete echolocation clicks and anthropogenic noise sources, achieving overall accuracy scores of 66.4% with a site-specific training set. In White et al. (2022) they implement, on small training sets, a transfer learning of a high performing architecture combined with multi-channel spectrograms as input for the detection of multi-sound sources. They report a higher accuracy with an overall macro-average of 94% on the test set. Using ROC curves alongside confusion matrices to measure per-class performance they assess the effect of regional soundscape variation on performance metrics for specific sound types. A signal classification pipeline involving supervised and unsupervised learning was used by Frasier (2021) to identify and classify seven classes including five distinct cetacean sounds. This framework enables expert oversight to label signals of interest, some of which are known, and others which are not yet well characterized or matched to a known source. The intent of this framework is, however, to provide a viable solution for efficiently generating the large, representative training sets needed for applications of DL in passive acoustics. Accuracy scores were also high, above 98% on their balanced evaluation dataset of one thousand samples. Accuracy was much lower on their unbalanced, manually labeled independent dataset. Mahale et al. (2023) employed unsupervised classification through a hybrid technique comprising principal component analysis and K-means clustering for data features of four fish sound types. They were able to classify the chorus of four fish species with accuracies varying between 76.81% and 100.00%, and they classified vessel sound with 100% accuracy. However, comparison between studies is not straightforward due to differing test metrics and training sets which cannot be compared (Hildebrand et al., 2022).
In the study herein, sensitivity and specificity scores remain consistent between the unbalanced and balanced testing dataset for each class. An approach similar to Frasier (2021) was used to detect fish chorus in a large acoustic database of 5.3 years of raw acoustic data by Kim et al. (2023). First a clustering method was used to create distinct classes of chorus and noise. Then a deep neural network was trained to distinguish between noise and chorus classes as aggregated by the unsupervised clustering process. The neural network classified chorus and noise on testing data with an overall 94.6% accuracy, in which signal intensity impacted classification accuracy. This type of approach alleviates the tedious labeling tasks of the dataset and could be considered as new development for FADAR in order to increase the number of sound sources that can be detected. However it would not allow for the detection algorithm refinement that might be necessary as previously shown for call types of the same species that present separate spectral features as shown by the red hind grouper calls for example. Supervised clustering though, could be used to account for slight changes in fish sounds due to environmental changes such as temperature increase, by manually adjusting the labeling of the clusters. A review of the most recent fish sounds detection and classification methods is provided in Barroso et al. (2023). The main challenge remain the identification of the sound sources, which can be achieved through supervised or unsupervised clustering methods (Huang et al., 2023; Mahale et al., 2023). Then a conventional machine learning algorithm based on feature extraction (Mcloughlin et al., 2019) or a DL (Mishachandar and Vairamuthu, 2021) is applied to the classes of the clustering analysis.
One could assume that the datasets used in this study, hence the performance of FADAR is biased toward the seasonal timing of the FSAs. Therefore, the ambient noise and sounds sources other than the fish calls remain relatively similar across recording periods, although there is some environmental variability associated with the interannual variability. However, the soundscape can be significantly different between locations, hence masking of fish calls by ambient noise or other biophony. In their study of marine soundscapes in the Lesser Antilles, Heenehan et al. (2019) found that they were significantly different between the northern Antilles, the Windward and the Leeward Islands. The northern and Windward Islands soundscape was dominated by ship traffic and Humpback whale song that occurred on 49–93% of recording days. In the Leeward Islands, diurnal vessel patterns were observed with few to no vessels present during night time hours, possibly reflecting the activity of recreational craft and fishing vessels. Indeed the recordings from Puerto Rico and Virgin Islands contain a significant proportion of Humpback whale calls (Figure 14) that are in the same frequency band as the grouper calls (0–500Hz), which can affect the detection of the calls (Mooney et al., 2020). As shown in Wilson et al. (2020), Little Cayman is not affected by vessel noise or marine mammal sounds like its eastern counterparts. Thus, our training data through its diverse location with unique soundscapes, its diversity of recorders, gain settings and hydrophone sensitivities encompasses the diversity of the ambient conditions in the Caribbean region, hence of data quality, including low and high signal detectability. The results of the assessment of the model’s ability to generalize to unseen data across temporal and spatial scales within the region illustrate the reliability of the model output for other Caribbean regions and the resilience of FADAR DL architecture to noisy conditions as shown by Mooney et al. (2020).
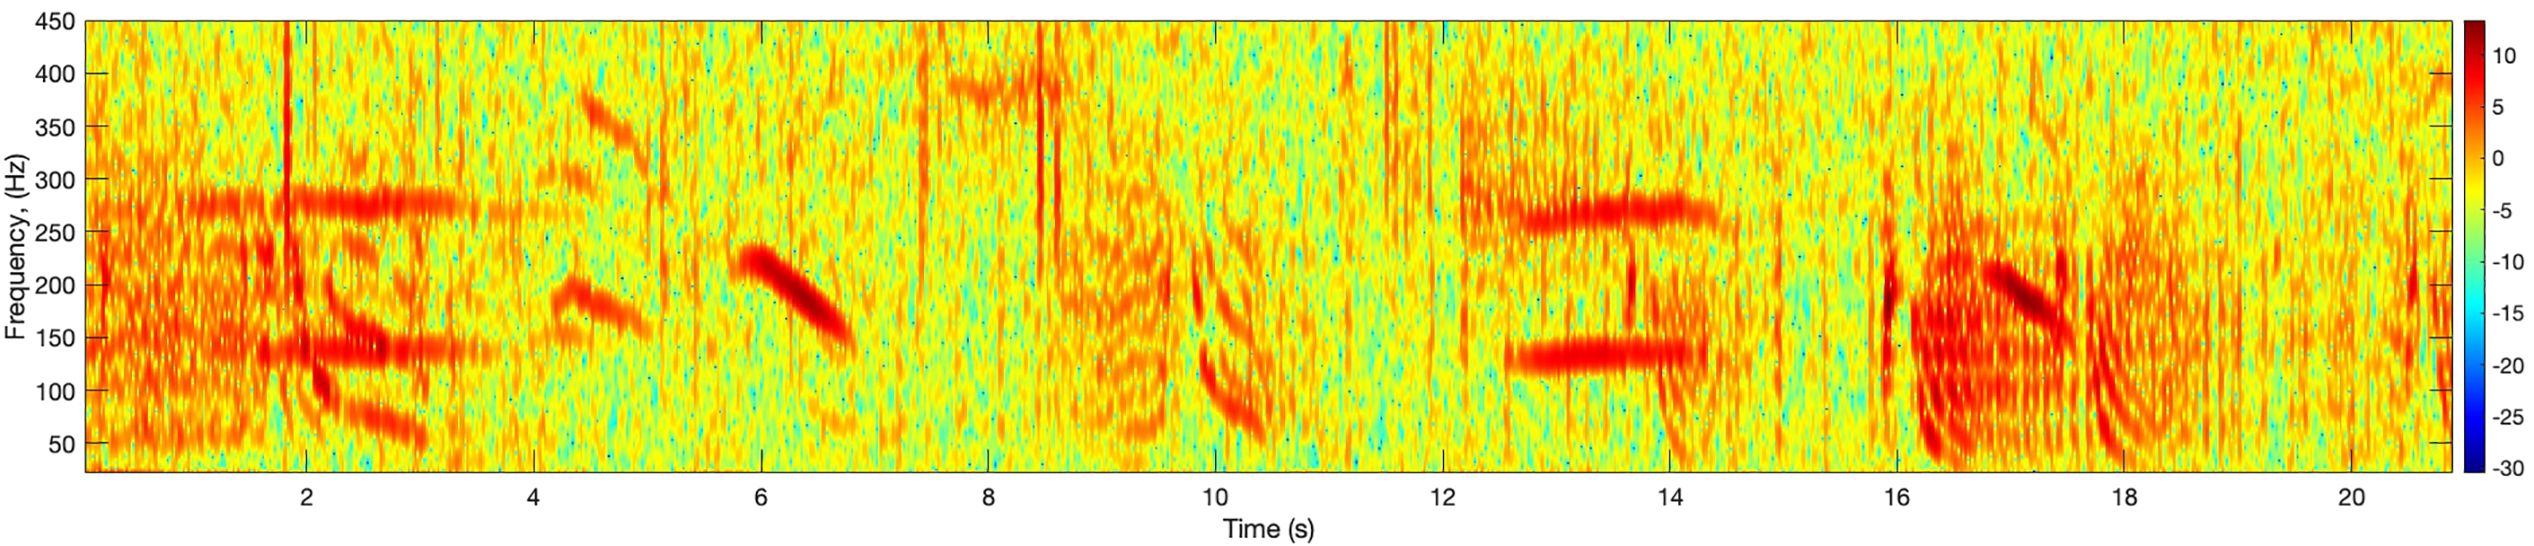
Figure 14 Example spectrogram of overlapping humpback whale song (thick brush-like strokes) and red hind calls (at 0–3s, 8.5–10.5s, 14s, 16–19s) recorded on February 2015 near Abrir La Sierra off the west coast of Puerto Rico. The spectrogram was calculated with a FFT size of 4096 points.
Despite the great potential shown by FADAR on the curated and diverse dataset used in this study, there remain some challenges that FADAR is not designed to cope with. Recording errors in the recorders associated for example with an electric noise in the hydrophone can significantly modify the image of the sound in the spectrogram making it unrecognizable by the classifier. This type of error is not uncommon and was present in two of the data records from the Cayman Islands. Their impact on FADAR’s accuracy is discussed in van Horn et al. (2024). Therefore significant changes in the characteristics of the calls could significantly affect the performance of FADAR. Of the four grouper species classified by FADAR, red hind is the only known species to form choruses, which occur when multiple calls overlap to the point that they become indistinguishable in a spectrogram. FADAR failed to detect choruses of red hind at the peak of their spawning activity in the dataset used in this study (Appeldoorn-Sanders et al., 2023). To accurately assess spawning dynamics based on call types production and to better take advantage of FADAR it is necessary to also understand the phenomenology of the call types sound production, their relative evolution, and their role in the mating dynamics. The next improvement to FADAR would thus be the identification of fish choruses as done in Kim et al. (2023).
7 Conclusion
This conservation informatics approach combined with large datasets, will allow researchers and managers throughout the tropical western Atlantic to generate high-resolution time series of each species’ reproductive activity at multiple aggregation sites simultaneously, and thus produce metrics for species presence/absence and relative abundance in a fishery-independent monitoring context. Collectively, these data and machine learning performance metrics allow for studies of reproductive phenology throughout the region, and it is now possible to analyze recordings to characterize region-wide patterns in reproduction, as well as identify location-specific call patterns (i.e. dialects) in support of defining FSA specific protection measures that suite each site Sadovy de Mitcheson et al. (2020). Creating a region-wide professional network, coupled with our recent machine learning advances, will allow us to collaborate across borders and leverage the strength of a multitude of individual datasets. FADAR has been made available to fisheries and MPA managers as well as conservation practitioners throughout the region.
Data availability statement
The raw data supporting the conclusions of this article will be made available by the authors, without undue reservation.
Author contributions
AI: Conceptualization, Data curation, Investigation, Methodology, Software, Supervision, Validation, Visualization, Writing – original draft, Writing – review & editing. HZ: Conceptualization, Investigation, Methodology, Resources, Supervision, Visualization, Writing – review & editing. MS: Data curation, Formal analysis, Funding acquisition, Investigation, Resources, Writing – review & editing. CW: Data curation, Investigation, Validation, Writing – review & editing. NE: Writing – review & editing. LC: Conceptualization, Formal analysis, Funding acquisition, Investigation, Methodology, Resources, Supervision, Validation, Visualization, Writing – review & editing.
Funding
The author(s) declare financial support was received for the research, authorship, and/or publication of this article. This work was supported by the Harbor Branch Oceanographic Institute Foundation; the National Science Foundation’s Virgin Islands Established Program to Stimulate Competitive Research (VI-EPSCoR, #1355437). LC, AI, and MS were also supported in part by NOAA Saltonstall-Kennedy grant (NA15NMF4270329).
Acknowledgments
The authors are thankful to all the collaborators that provided data from the different Caribbean region, including R. Nemeth at University of the Virgin Islands, B. Semmens, S. Heppel and C. van Horn at University of California San Diego Scripps Institution of Oceanography, J. Keller and A. Acosta at Florida Fish and Wildlife Conservation Commission in the Florida Keys. Datasets from Puerto Rico and USVI were made available by the Southeast Area Monitoring and Assessment Program-Caribbean, Caribbean Fishery Management Council and the Caribbean Coral Reef Institute of the University of Puerto Rico under research permits provided by the Puerto Rico Department of Natural and Environmental Resources. Data collection in the Cayman island was in part supported by NOAA International Fisheries Science Research Program.
Conflict of interest
The authors declare that the research was conducted in the absence of any commercial or financial relationships that could be construed as a potential conflict of interest.
Publisher’s note
All claims expressed in this article are solely those of the authors and do not necessarily represent those of their affiliated organizations, or those of the publisher, the editors and the reviewers. Any product that may be evaluated in this article, or claim that may be made by its manufacturer, is not guaranteed or endorsed by the publisher.
References
Allen A. N., Harvey M., Harrell L., Jansen A., Merkens K. P., Wall C. C., et al. (2021). A convolutional neural network for automated detection of humpback whale song in a diverse, long-term passive acoustic dataset. Front. Mar. Sci. 8, 607321. doi: 10.3389/fmars.2021.607321
Appeldoorn-Sanders E., Zayas-Santiago C., Schärer-Umpierre M. (2023). Characterization and temporal patterns of red hind grouper, epinephelus guttatus, choruses at a single aggregation site over a 10-year period. Environ. Biol. Fishes 106, 1953–1969. doi: 10.1007/s10641-023-01476-0
Bahoura M., Simard Y. (2010). Blue whale calls classification using short-time fourier and wavelet packet transforms and artificial neural network. Digital Signal Process. 20, 1256–1263. doi: 10.1016/j.dsp.2009.10.024
Barroso V. R., Xavier F. C., Ferreira C. E. L. (2023). Applications of machine learning to identify and characterize the sounds produced by fish. ICES J. Mar. Sci. 80, 1854–1867. doi: 10.1093/icesjms/fsad126
Baumgartner M. F., Mussoline S. E. (2011). A generalized baleen whale call detection and classification system. J. Acoustical Soc. America 129, 2889–2902. doi: 10.1121/1.3562166
Belghith H. E., Rioult F., Bouzidi M. (2018). “Acoustic diversity classifier for automated marine big data analysis,” in 2018 IEEE 30th International Conference on Tools with Artificial Intelligence (ICTAI), Volos, Greece. 130–136. doi: 10.1109/ICTAI.2018.00029
Bengio Y., Simard P., Frasconi P. (1994). Learning long-term dependencies with gradient descent is difficult. IEEE Trans. Neural Networks 5, 157–166. doi: 10.1109/TNN.72
Bergler C., Schröter H., Cheng R. X., Barth V., Weber M., Nöth E., et al. (2019). Orca-spot: An automatic killer whale sound detection toolkit using deep learning. Sci. Rep. 9, 10997. doi: 10.1038/s41598-019-47335-w
Berk I. M. (1998). Sound production by white shrimp (Panaeus Setiferus), analysis of another crustacean-like sound from the gulf of Mexico, and applications for passive sonar in the shrimp industry. J. Shellfish Res. 17, 1497–1500.
Bermant P. C., Bronstein M. M., Wood R. J., Gero S., Gruber D. F. (2019). Deep machine learning techniques for the detection and classification of sperm whale bioacoustics. Sci. Rep. 9, 12588. doi: 10.1038/s41598-019-48909-4
Binder C. M., Hines P. (2012). “Applying automatic aural classification to cetacean vocalizations,” in Proceedings of Meetings on Acoustics ECUA2012 (Acoustical Society of America), Edinburgh, Scotland, Vol. 17. 070029.
Bohnenstiehl D. R. (2023). Automated cataloguing of american silver perch (bairdiella chrysoura) calls using machine learning. Bioacoustics 32, 453–473. doi: 10.1080/09524622.2023.2197863
Bravo Sanchez F. J., Hossain M. R., English N. B., Moore S. T. (2021). Bioacoustic classification of avian calls from raw sound waveforms with an open-source deep learning architecture. Sci. Rep. 11, 15733. doi: 10.1038/s41598-021-95076-6
Breiman L., Friedman J. H., Olshen R. A., Stone C. (1984). Classification and regression trees (New York: John Hopkins Press).
Chérubin L., Nemeth R., Idrisi N. (2011). Flow and transport characteristics at an Epinephelus Guttatus (red hind grouper) spawning aggregation site in st. thomas (US Virgin Islands). Ecol. Model. 222, 3132–3148. doi: 10.1016/j.ecolmodel.2011.05.031
Chérubin L. M., Dalgleish F., Ibrahim A. K., Schärer-Umpierre M., Nemeth R. S., Matthews A., et al. (2020). Fish spawning aggregations dynamics as inferred from a novel, persistent presence robotic approach. Front. Mar. Sci. 6, 779. doi: 10.3389/fmars.2019.00779
Choi J., Choo Y., Lee K. (2019). Acoustic classification of surface and underwater vessels in the ocean using supervised machine learning. Sensors 19, 3492. doi: 10.3390/s19163492
Claro R., Lindeman K. C. (2003). Spawning aggregation sites of snapper and grouper species (Lutjanidae and Serranidae) on the insular shelf of Cuba. Gulf Caribbean Res. 14, 91–106. doi: 10.18785/gcr.1402.07
Clink D. J., Klinck H. (2021). Unsupervised acoustic classification of individual gibbon females and the implications for passive acoustic monitoring. Methods Ecol. Evol. 12, 328–341. doi: 10.1111/2041-210X.13520
Denton T., Wisdom S., Hershey J. R. (2021). Improving bird classification with unsupervised sound separation. arXiv eess.AS 2110.03209. doi: 10.48550/arXiv.2110.03209
Domeier M. L., Colin P. L. (1997). Tropical reef fish spawning aggregations: defined and reviewed. Bull. Mar. Sci. 60, 698–726.
Eklund A.-M., McClellan D. B., Harper D. E. (2000). Black grouper aggregations in relation to protected areas within the Florida Keys National Marine Sanctuary. Bull. Mar. Sci. 66, 721–728.
Erisman B. E., Rowell T. J. (2017). A sound worth saving: acoustic characteristics of a massive fish spawning aggregation. Biol. Lett. 13, 20170656. doi: 10.1098/rsbl.2017.0656
Fish J. F. (1966). Sound production in the american lobster, Homarus Americanus H. Milne Edwards (Decapoda Reptantia). Crustaceana 11, 105–106. doi: 10.1163/156854066X00504
Fish M., Kelsey A. S. Jr., Mowbray W. H. (1952). Studies on the production of underwater sound by North Atlantic coastal fishes. J. Mar. Res. 52, 180–193.
Fish M., Mowbray W. H. (1970). Sounds of western North Atlantic fishes (Baltimore, Mariland, USA: Johns Hopkins Press). doi: 10.2307/1441636
Fish M. P. (1964). “Biological sources of sustained ambient sea noise,” in Marine bioacoustics, vol. 1 . Ed. Tavolga W. N. (New York: Pergamon Press), 175–194.
Frasier K. E. (2021). A machine learning pipeline for classification of cetacean echolocation clicks in large underwater acoustic datasets. PloS Comput. Biol. 17, 1–26. doi: 10.1371/journal.pcbi.1009613
Ghani B., Denton T., Kahl S., Klinck H. (2023). Global birdsong embeddings enable superior transfer learning for bioacoustic classification. Sci. Rep. 13, 22876. doi: 10.1038/s41598-023-49989-z
He K., Zhang X., Ren S., Sun J. (2016). “Deep residual learning for image recognition,” in Proceedings of the IEEE conference on computer vision and pattern recognition, Las Vegas, NV, USA. 770–778.
Heenehan H., Stanistreet J. E., Corkeron P. J., Bouveret L., Chalifour J., Davis G. E., et al. (2019). Caribbean sea soundscapes: Monitoring humpback whales, biological sounds, geological events, and anthropogenic impacts of vessel noise. Front. Mar. Sci. 6, 347. doi: 10.3389/fmars.2019.00347
Henninger H. P., Watson I., Winsor H. (2005). Mechanisms underlying the production of carapace vibrations and associated waterborne sounds in the American lobster, Homarus Americanus. J. Exp. Biol. 208, 3421–3429. doi: 10.1242/jeb.01771
Heyman W. D., Kjerfve B. (2008). Characterization of transient multi-species reef fish spawning aggregations at gladden spit, Belize. Bull. Mar. Sci. 83, 531–551.
Hildebrand J. A., Frasier K. E., Helble T. A., Roch M. A. (2022). Performance metrics for marine mammal signal detection and classification. J. Acoustical Soc. America 151, 414–427. doi: 10.1121/10.0009270
Howard A. G., Zhu M., Chen B., Kalenichenko D., Wang W., Weyand T., et al. (2017). Mobilenets: Efficient convolutional neural networks for mobile vision applications. arXiv cs.CV 1704.04861. doi: 10.48550/arXiv.1704.04861
Huang C.-J., Yang Y.-J., Yang D.-X., Chen Y.-J. (2009). Frog classification using machine learning techniques. Expert Syst. Appl. 36, 3737–3743. doi: 10.1016/j.eswa.2008.02.059
Huang X., Hu Z., Lin L. (2023). Deep clustering based on embedded auto-encoder. Soft Computing 27, 1075–1090. doi: 10.1007/s00500-021-05934-8
Ibrahim A. K. (2019). Multi-model deep learning for grouper sound clas- sification and seizure prediction. Florida Atlantic University, Boca Raton, FL.
Ibrahim A. K., Chérubin L. M., Zhuang H., Schärer Umpierre M. T., Dalgleish F., Erdol N., et al. (2018a). An approach for automatic classification of grouper vocalizations with passive acoustic monitoring. J. Acoustical Soc. America 143, 666–676. doi: 10.1121/1.5022281
Ibrahim A. K., Zhuang H., Chérubin L. M., Erdol N., O’Corry-Crowe G., Ali A. M. (2021). A multimodel deep learning algorithm to detect north atlantic right whale up-calls. J. Acoustical Soc. America 150, 1264–1272. doi: 10.1121/10.0005898
Ibrahim A. K., Zhuang H., Chérubin L. M., Schärer Umpierre M. T., Ali A. M., Nemeth R. S., et al. (2019). Classification of red hind grouper call types using random ensemble of stacked autoencoders. J. Acoustical Soc. America 146, 2155–2162. doi: 10.1121/1.5126861
Ibrahim A. K., Zhuang H., Chérubin L. M., Schärer-Umpierre M. T., Erdol N. (2018b). Automatic classification of grouper species by their sounds using deep neural networks. J. Acoustical Soc. America 144, EL196–EL202. doi: 10.1121/1.5054911
Ibrahim A. K., Zhuang H., Chérubin L. M., Schärer-Umpierre M. T., Nemeth R. S., Erdol N., et al. (2020). Transfer learning for efficient classification of grouper sound. J. Acoustical Soc. America 148, EL260–EL266. doi: 10.1121/10.0001943
Iversen R. T., Perkins P. J., Dionne R. D. (1963). An indication of underwater sound production by squid. Nature 199, 250–251. doi: 10.1038/199250a0
Kahl S., Wood C. M., Eibl M., Klinck H. (2021). Birdnet: A deep learning solution for avian diversity monitoring. Ecol. Inf. 61, 101236. doi: 10.1016/j.ecoinf.2021.101236
Kasumyan A. (2008). Sounds and sound production in fishes. J. Ichthyol. 48, 981–1030. doi: 10.1134/S0032945208110039
Kim E. B., Frasier K. E., McKenna M. F., Kok A. C. M., Peavey Reeves L. E., Oestreich W. K., et al. (2023). SoundScape learning: An automatic method for separating fish chorus in marine soundscapesa). J. Acoustical Soc. America 153, 1710–1722. doi: 10.1121/10.0017432
Kobara S., Heyman W. D. (2008). Geomorphometric patterns of nassau grouper (Epinephelus Striatus) spawning aggregation sites in the Cayman Islands. Mar. Geodesy 31, 231–245. doi: 10.1080/01490410802466397
Kobara S., Heyman W., Pittman S., Nemeth R. (2013). “Biogeography of transient reef-fish spawning aggregations in the Caribbean: a synthesis forfuture research and management,” in Oceanography and Marine Biology, An Annual Review, vol. 51 . Eds. Hughes D. J. R. N., Hughes, Smith I. P. (Boca Raton: CRC Pres), 281–325.
Kottege N., Jurdak R., Kroon F., Jones D. (2015). Automated detection of broadband clicks of freshwater fish using spectro-temporal featuresa). J. Acoustical Soc. America 137, 2502–2511. doi: 10.1121/1.4919298
Ladich F. (2004). “Sound production and acoustic communication,” in The senses of fish (Dordrecht: Springer), 210–230.
Laplante J.-F., Akhloufi M. A., Gervaise C. (2021). “Fish recognition in underwater environments using deep learning and audio data,” in Ocean Sensing and Monitoring XIII, vol. 11752 . Ed. Hou W. W. (Florida, USA: International Society for Optics and Photonics (SPIE), 117520G.
Laplante J.-F., Akhloufi M. A., Gervaise C. (2022). “Deep learning for marine bioacoustics and fish classification using underwater sounds,” in 2022 IEEE Canadian Conference on Electrical and Computer Engineering (CCECE), Halifax, NS, Canada. 288–293. doi: 10.1109/CCECE49351.2022.9918242
Liu J., Yang X., Wang C., Tao Y. (2018). “A convolution neural network for dolphin species identification using echolocation clicks signal,” in 2018 IEEE International Conference on Signal Processing, Communications and Computing (ICSPCC), Qingdao, China. 1–4. doi: 10.1109/ICSPCC.2018.8567796
Locascio J. V., Mann D. A. (2008). Diel periodicity of fish sound production in charlotte harbor, florida. Trans. Am. Fisheries Soc. 137, 606–615. doi: 10.1577/T06-069.1
Looby A., Cox K., Bravo S., Rountree R., Juanes F., Reynolds L. K., et al. (2022). A quantitative inventory of global soniferous fish diversity. Rev. Fish Biol. Fisheries 32, 581–595. doi: 10.1007/s11160-022-09702-1
Luczkovich J. J., Keusenkothen M. (2007). “Behavior and sound production by longspine squirrelfish holocentrus rufus during playback of predator and conspecific sounds,”. in Diving for Science 2007. Proceedings of the American Academy of Underwater Sciences 26th Symposium. Eds. Pollock N. W., Godfrey J. M. (Dauphin Island, AL: AAUS).
Luczkovich J. J., Mann D. A., Rountree R. A. (2008). Passive acoustics as a tool in fisheries science. Trans. Am. Fisheries Soc. 137, 533–541. doi: 10.1577/T06-258.1
Luczkovich J. J., Sprague M. W., Johnson S. E., Pullinger R. C. (1999). Delimiting spawning areas of weakfish Cynoscion Regalis (family Sciaenidae) in Pamlico Sound, North Carolina using passive hydroacoustic surveys. Bioacoustics 10, 143–160. doi: 10.1080/09524622.1999.9753427
Mahale V. P., Chanda K., Chakraborty B., Salkar T., Sreekanth G. B. (2023). Biodiversity assessment using passive acoustic recordings from off-reef location—Unsupervised learning to classify fish vocalization. J. Acoustical Soc. America 153, 1534–1553. doi: 10.1121/10.0017248
Mann D., Locascio J., Coleman F., Koenig C. (2009). Goliath grouper Epinephelus Itajara sound production and movement patterns on aggregation sites. Endangered Species Res. 7, 229–236. doi: 10.3354/esr00109
Mann D., Locascio J., Schärer M., Nemeth M., Appeldoorn R. (2010). Sound production by red hind epinephelus guttatus in spatially segregated spawning aggregations. Aquat. Biol. 10, 149–154. doi: 10.3354/ab00272
Matthews C. A., Beaujean P.-P. (2016). Edge detection of red hind grouper vocalizations in the littorals. In Detection and Sensing of Mines, Explosive Objects, and Obscured Targets XXI Vol. 9823. Eds. Bishop S. S., Isaacs J. C. (Baltimore, Mariland, USA: International Society for Optics and Photonics (SPIE), 98231W.
Mcloughlin M. P., Stewart R., McElligott A. G. (2019). Automated bioacoustics: methods in ecology and conservation and their potential for animal welfare monitoring. J. R. Soc. Interface 16, 20190225. doi: 10.1098/rsif.2019.0225
Mehyadin A. E., Abdulazeez A. M., Hasan D. A., Saeed J. N. (2021). Birds sound classification based on machine learning algorithms. Asian J. Res. Comput. Sci. 9, 1–11. doi: 10.9734/ajrcos/2021/v9i430227
Meng Z., Zhao Y., Li J., Gong Y. (2019). “Adversarial speaker verification,” in ICASSP 2019-2019 IEEE International Conference on Acoustics, Speech and Signal Processing (ICASSP). 6216–6220 (Brighton, UK: IEEE).
Mishachandar B., Vairamuthu S. (2021). Diverse ocean noise classification using deep learning. Appl. Acoustics 181, 108141. doi: 10.1016/j.apacoust.2021.108141
Mooney T. A., Di Iorio L., Lammers M., Lin T.-H., Nedelec S. L., Parsons M., et al. (2020). Listening forward: approaching marine biodiversity assessments using acoustic methods. R. Soc. Open Sci. 7, 201287. doi: 10.1098/rsos.201287
Moreno-Seco F., Iñesta J. M., de León P. J. P., Micó L. (2006). “Comparison of classifier fusion methods for classification in pattern recognition tasks,” in Structural, Syntactic, and Statistical Pattern Recognition. Eds. Yeung D.-Y., Kwok J. T., Fred A., Roli F., de Ridder D. (Springer Berlin Heidelberg, Berlin, Heidelberg), 705–713.
Moulton J. M. (1957). Sound production in the spiny lobster Panulirus Argus (latreille). Biol. Bull. 113, 286–295. doi: 10.2307/1539086
Moulton J. M. (1958). The acoustical behavior of some fishes in the bimini area. Biol. Bull. 114, 357–374. doi: 10.2307/1538991
Mumby P. J., Dahlgren C. P., Harborne A. R., Kappel C. V., Micheli F., Brumbaugh D. R., et al. (2006). Fishing, trophic cascades, and the process of grazing on coral reefs. Science 311, 98–101. doi: 10.1126/science.1121129
Nam J., Choi K., Lee J., Chou S.-Y., Yang Y.-H. (2018). Deep learning for audio-based music classification and tagging: Teaching computers to distinguish rock from bach. IEEE Signal Process. magazine 36, 41–51. doi: 10.1109/MSP.79
National Centers for Coastal Ocean Science (NCCOS); Southeast Fisheries Science Center (SEFSC). (2020). Data from: National Coral Reef Monitoring Program: Assessment of coral reef fish communities in Puerto Rico from 2019-07-18 to 2019-12-29 (NCEI Accession 0218548). Puerto Rico: NOAA National Centers for Environmental Information. Available at: https://www.ncei.noaa.gov/archive/accession/0218548 (Accessed January 5, 2024).
Nelson M., Koenig C., Coleman F., Mann D. (2011). Sound production of red grouper Epinephelus Morio on the west florida shelf. Aquat. Biol. 12, 97–108. doi: 10.3354/ab00325
Nemeth R. S. (2009). Dynamics of Reef Fish and Decapod Crustacean Spawning Aggregations: Underlying Mechanisms, Habitat Linkages, and Trophic Interactions (Dordrecht: Springer Netherlands), 73–134.
Nemeth R. (2012). “Ecosystem aspects of spawning aggregations,” in Reef fish spawning aggregations: biology, research and management (Springer, New York, NY), 21–55.
Nemeth R. S., Blondeau J., Herzlieb S., Kadison E. (2007). Spatial and temporal patterns of movement and migration at spawning aggregations of red hind, epinephelus guttatus, in the u.s. virgin islands. Environ. Biol. Fishes 78, 365–381. doi: 10.1007/s10641-006-9161-x
Noda J., Travieso C., Sánchez-Rodríguez D. (2016). Automatic taxonomic classification of fish based on their acoustic signals. Appl. Sci. 6, 443. doi: 10.3390/app6120443
O’Mahony N., Campbell S., Carvalho A., Harapanahalli S., Hernandez G. V., Krpalkova L., et al. (2019). “Deep learning vs. traditional computer vision,” in Advances in Computer Vision Proceedings of the 2019 Computer Vision Conference (CVC). (Switzerland AG: Springer Nature), 128–144.
Pace F. (2008). Comparison of feature sets for humpback whale song classification. Southampton, United Kingdom: University of Southampton.
Pandeya Y. R., Lee J. (2018). Domestic cat sound classification using transfer learning. Int. J. Fuzzy Logic Intelligent Syst. 18, 154–160. doi: 10.5391/IJFIS.2018.18.2.154
Parmentier E., Vandewalle P., Brié C., Dinraths L., Lecchini D. (2011). Comparative study on sound production in different holocentridae species. Front. Zool. 8, 12. doi: 10.1186/1742-9994-8-12
Parsons S., Jones G. (2000). Acoustic identification of twelve species of echolocating bat by discriminant function analysis and artificial neural networks. J. Exp. Biol. 203, 2641–2656. doi: 10.1242/jeb.203.17.2641
Patek S. N. (2002). Squeaking with a sliding joint: mechanics and motor control of sound production in palinurid lobsters. J. Exp. Biol. 205, 2375–2385. doi: 10.1242/jeb.205.16.2375
Potamitis I. (2014). Automatic classification of a taxon-rich community recorded in the wild. PloS One 9, 1–11. doi: 10.1371/journal.pone.0096936
Reglero P., Balbín R., Abascal F. J., Medina A., Alvarez-Berastegui D., Rasmuson L., et al. (2018). Pelagic habitat and offspring survival in the eastern stock of Atlantic bluefin tuna. ICES J. Mar. Sci. 76, 549–558. doi: 10.1093/icesjms/fsy135
Ribeiro M. T., Singh S., Guestrin C. (2016). “why should i trust you?” explaining the predictions of any classifier,” in Proceedings of the 22nd ACM SIGKDD international conference on knowledge discovery and data mining, San Francisco, USA. 1135–1144.
Ricci S. W., Bohnenstiehl D. R., Eggleston D. B., Kellogg M. L., Lyon R. P. (2017). Oyster toadfish (opsanus tau) boatwhistle call detection and patterns within a large-scale oyster restoration site. PloS One 12, 1–18. doi: 10.1371/journal.pone.0182757
Rice A. N., Farina S. C., Makowski A. J., Kaatz I. M., Lobel P. S., Bemis W. E., et al. (2022). Evolutionary patterns in sound production across fishes. Ichthyol. Herpetol. 110, 1–12. doi: 10.1643/i2020172
Rountree R. A., Gilmore R. G., Goudey C. A., Hawkins A. D., Luczkovich J. J., Mann D. A. (2006). Listening to fish: applications of passive acoustics to fisheries science. Fisheries 31, 433–446. doi: 10.1577/1548-8446(2006)31[433:LTF]2.0.CO;2
Rowell T. J., Appelldoorn R., Rivera J. A., Mann D. A., Kellison T., Nemeth M., et al. (2011). Use of passive acoustics to map grouper spawning aggregations, with emphasis on red hind, Epinephelus Guttatus, off western Puerto Rico. Proc. Gulf. Caribb. Fish Inst. 63, 139–142.
Rowell T. J., Schärer M. T., Appeldoorn R. S. (2018). Description of a new sound produced by nassau grouper at spawning aggregation sites. Gulf Caribbean Res. 29, GCFI22–GCFI26. doi: 10.18785/gcr.2901.12
Rudin C., Radin J. (2019). Why are we using black box models in AI when we don’t need to? A lesson from an explainable AI competition. Harvard Data Sci Rev. 1 (2). doi: 10.1162/99608f92.5a8a3a3d
Sadovy Y. (1997). The case of the disappearing grouper: Epinephelus striatus (pisces: Serranidae). J. Fish Biol. 46, 961–976.
Sadovy D. M. Y., Cornish A., Domeier M., Colin P. L., Russell M., Lindeman K. C. (2008). A global baseline for spawning aggregations of reef fishes. Conserv. Biol. 22, 1233–1244. doi: 10.1111/j.1523-1739.2008.01020.x
Sadovy de Mitcheson Y., Prada M., Azueta J., Lindeman K. (2020). Regional fish spawning aggregation fishery management plan Vol. 96 (Hato Rey, Puerto Rico: Report to the Caribbean Fishery Management Council).
Sala E., Ballesteros E., Starr R. M. (2001). Rapid decline of nassau grouper spawning aggregations in Belize: fishery management and conservation needs. Fisheries 26, 23–30. doi: 10.1577/1548-8446(2001)026<0023:RDONGS>2.0.CO;2
Sattar F., Cullis-Suzuki S., Jin F. (2016a). Acoustic analysis of big ocean data to monitor fish sounds. Ecol. Inf. 34, 102–107. doi: 10.1016/j.ecoinf.2016.05.002
Sattar F., Cullis-Suzuki S., Jin F. (2016b). Identification of fish vocalizations from ocean acoustic data. Appl. Acoustics 110, 248–255. doi: 10.1016/j.apacoust.2016.03.025
Schärer M. T., Nemeth M. I., Mann D., Locascio J., Appeldoorn R. S., Rowell T. J. (2012a). Sound production and reproductive behavior of yellowfin grouper, Mycteroperca Venenosa (Serranidae) at a spawning aggregation. Copeia, 1, 135–144. doi: 10.1643/CE-10-151
Schärer M. T., Nemeth M. I., Rowell T. J., Appeldoorn R. S. (2014). Sounds associated with the reproductive behavior of the black grouper (Mycteroperca Bonaci). Mar. Biol. 161, 141–147. doi: 10.1007/s00227-013-2324-3
Schärer M. T., Rowell T. J., Nemeth M. I., Appeldoorn R. S. (2012b). Sound production associated with reproductive behavior of nassau grouper Epinephelus Striatus at spawning aggregations. Endangered Species Res. 19, 29–38. doi: 10.3354/esr00457
Selvaraju R. R., Cogswell M., Das A., Vedantam R., Parikh D., Batra D. (2019). Grad-cam: Visual explanations from deep networks via gradient-based localization. Int. J. Comput. Vision 128, 336–359. doi: 10.1007/s11263-019-01228-7
Shapiro D. Y., Sadovy Y., McGehee M. A. (1993). Size, composition, and spatial structure of the annual spawning aggregation of the red hind, Epinephelus Guttatus (Pisces: Serranidae). Copeia 1993, 399–406. doi: 10.2307/1447138
Shiu Y., Palmer K., Roch M. A., Fleishman E., Liu X., Nosal E.-M., et al. (2020). Deep neural networks for automated detection of marine mammal species. Sci. Rep. 10, 1–12. doi: 10.1038/s41598-020-57549-y
Shorten C., Khoshgoftaar T. M. (2019). A survey on image data augmentation for deep learning. J. big Data 6, 1–48. doi: 10.1186/s40537-019-0197-0
Siddagangaiah S., Chen C.-F., Hu W.-C., Pieretti N. (2019). A complexity-entropy based approach for the detection of fish choruses. Entropy 21, 97. doi: 10.3390/e21100977
Silva D. F., De Souza V. M., Batista G. E., Keogh E., Ellis D. P. (2013). “Applying machine learning and audio analysis techniques to insect recognition in intelligent traps,” in 2013 12th International conference on machine learning and applications, Vol. 1. 99–104 (Miami, FL, USA: IEEE).
Smith C. L. (1972). A spawning aggregation of nassau grouper, epinephelus striatus (bloch). Trans. Am. Fisheries Soc. 101, 257–261. doi: 10.1577/1548-8659(1972)101<257:ASAONG>2.0.CO;2
Tan M., Le Q. V. (2020). Efficientnet: Rethinking model scaling for convolutional neural networks. arXiv cs.LG 1905.11946. doi: 10.48550/arXiv.1905.11946
Tavolga W. N., Popper A. N., Fay R. R. (2012). Hearing and sound communication in fishes (New York: Springer Science & Business Media).
Taylor J., Karnauskas M., Chérubin L. M., Schärer-Umpierre M., Michaels W. L., Caillouet R., et al. (2020). Emerging science and technology to improve monitoring and assessments of fish spawning aggregations. Report from the 2019 Gulf and Caribbean Fisheries Institute Workshop (NOAA Tech. Memo. NMFS-F/SPO-207), 74.
Urazghildiiev I. R., Van Parijs S. M. (2016). Automatic grunt detector and recognizer for Atlantic cod (Gadus morhua). J. Acoustical Soc. America 139, 2532–2540. doi: 10.1121/1.4948569
van Horn C. J., Ibrahim A. K., Candelmo S. A. ,. A., Heppell, McCoy C. R. M., Pattengill-Semmens C. V., Waterhouse L., et al. (2024). Hydrophone placement yields high variability in detection of epinephelus striatus calls at a spawning site. In revision Ecol. Appl.
Vasconcelos R. O., Fonseca P. J., Amorim M. C. P., Ladich F. (2011). Representation of complex vocalizations in the lusitanian toadfish auditory system: evidence of fine temporal, frequency and amplitude discrimination. Proc. R. Soc. B: Biol. Sci. 278, 826–834. doi: 10.1098/rspb.2010.1376
Vickers W., Milner B., Risch D., Lee R. (2021). Robust north atlantic right whale detection using deep learning models for denoising. J. Acoustical Soc. America 149, 3797–3812. doi: 10.1121/10.0005128
Vieira M., Fonseca P. J., Amorim M. C. P., Teixeira C. J. C. (2015). Call recognition and individual identification of fish vocalizations based on automatic speech recognition: An example with the lusitanian toadfish. J. Acoustical Soc. America 138, 3941–3950. doi: 10.1121/1.4936858
Wall C. C., Mann D. A., Lembke C., Taylor C., He R., Kellison T. (2017). Mapping the soundscape off the southeastern usa by using passive acoustic glider technology. Mar. Coast. Fisheries 9, 23–37. doi: 10.1080/19425120.2016.1255685
Walters S., Lowerre-Barbieri S., Bickford J., Mann D. (2009). Using a passive acoustic survey to identify spotted seatrout spawning sites and associated habitat in tampa bay, florida. Trans. Am. Fisheries Soc. 138, 88–98. doi: 10.1577/T07-106.1
White E. L., White P. R., Bull J. M., Risch D., Beck S., Edwards E. W. J. (2022). More than a whistle: Automated detection of marine sound sources with a convolutional neural network. Front. Mar. Sci. 9. doi: 10.3389/fmars.2022.879145
Wiggins S. M., Roch M. A., Hildebrand J. A. (2010). Triton software package: Analyzing large passive acoustic monitoring data sets using matlab. J. Acoustical Soc. America 128, 2299–2299. doi: 10.1121/1.3508074
Wilson K., Semmens B., Pattengill-Semmens C., McCoy C., Sirović A. (2020). Potential for grouper acoustic competition and partitioning at a multispecies spawning site off little cayman, Cayman Islands. Mar. Ecol. Prog. Ser. 634, 127–146. doi: 10.3354/meps13181
Winn H. E., Marshall J. A. (1963). The acoustical behavior of some fishes in the bimini area. Physiol. Zool. 36, 34–44. doi: 10.1086/physzool.36.1.30152736
Winn H. E., Marshall J. A., Hazlett B. (1964). Behavior, diel activities, and stimuli that elicit sound production and reactions to sounds in the longspine squirrelfish. Copeia 1964, 1–12. doi: 10.2307/1441036
Woodward C., Schärer-Umpierre M., Nemeth R. S., Appeldoorn R., Chérubin L. M. (2023). Spatial distribution of spawning groupers on a caribbean reef from an autonomous surface platform. Fisheries Res. 266, 106794. doi: 10.1016/j.fishres.2023.106794
Yamashita R., Nishio M., Do R. K. G., Togashi K. (2018). Convolutional neural networks: an overview and application in radiology. Insights into Imaging 9, 611–629. doi: 10.1007/s13244-018-0639-9
Yang W., Luo W., Zhang Y. (2020). Classification of odontocete echolocation clicks using convolutional neural network. J. Acoustical Soc. America 147, 49–55. doi: 10.1121/10.0000514
Zayas S. C. M., Appeldoorn R. S., Schärerer-Umpierre M. T., Cruz-Motta J. J. (2020). Red hind epinephelus guttatus vocal repertoire characterization, behavior and temporal patterns. Gulf Caribbean Res. 31, GCFI31–GCFI41. doi: 10.18785/gcr.3101.17
Zelick R., Mann D. A., Popper A. N. (1999). “Acoustic communication in fishes and frogs,” in Comparative hearing: fish and amphibians (New York: Springer), 363–411.
Zhang X., Zhou X., Lin M., Sun J. (2017). Shufflenet: An extremely efficient convolutional neural network for mobile devices. arXiv cs.CV 1707.01083. doi: 10.48550/arXiv.1707.01083
Zhao Z.-Q., Zheng P., Xu S.-t., Wu X. (2019). Object detection with deep learning: A review. IEEE Trans. Neural Networks Learn. Syst. 30, 3212–3232. doi: 10.1109/TNNLS.5962385
Keywords: grouper sounds, FADAR app, deep learning, CNN ensemble, spawning aggregation
Citation: Ibrahim AK, Zhuang H, Schärer-Umpierre M, Woodward C, Erdol N and Chérubin LM (2024) Fish Acoustic Detection Algorithm Research: a deep learning app for Caribbean grouper calls detection and call types classification. Front. Mar. Sci. 11:1378159. doi: 10.3389/fmars.2024.1378159
Received: 29 January 2024; Accepted: 13 June 2024;
Published: 22 July 2024.
Edited by:
DelWayne Roger Bohnenstiehl, North Carolina State University, United StatesReviewed by:
Aaron N. Rice, Cornell University, United StatesXuebo Zhang, Northwest Normal University, China
Copyright © 2024 Ibrahim, Zhuang, Schärer-Umpierre, Woodward, Erdol and Chérubin. This is an open-access article distributed under the terms of the Creative Commons Attribution License (CC BY). The use, distribution or reproduction in other forums is permitted, provided the original author(s) and the copyright owner(s) are credited and that the original publication in this journal is cited, in accordance with accepted academic practice. No use, distribution or reproduction is permitted which does not comply with these terms.
*Correspondence: Ali K. Ibrahim, YWlicmFoaW0yMDE0QGZhdS5lZHU=