 Ting Huang1,2
 Feng Zhou1,2,3*
 Xiao Ma2
 Dingyong Zeng2Yong Tang4Yunlong Ma2Andre Emidio Raul5Ruibin Ding6Jorge Mario Mafuca5
 Ruijie Ye2
 Daji Huang1,2
- 1School of Oceanography, Shanghai Jiao Tong University, Shanghai, China
- 2State Key Laboratory of Satellite Ocean Environment Dynamics, Second Institute of Oceanography, Ministry of Natural Resources, Hangzhou, China
- 3Observation and Research Station of Yangtze River Delta Marine Ecosystems, Ministry of Natural Resources, Zhoushan, China
- 4Key Laboratory of Submarine Geosciences, Second Institute of Oceanography, Ministry of Natural Resources, Hangzhou, China
- 5National Institute for Fisheries Research, Ministry of Sea, Inland Waters and Fisheries, Maputo, Mozambique
- 6Institute of Polar and Ocean Technology, Second Institute of Oceanography, Ministry of Natural Resources, Hangzhou, China
The discovery of cyclonic and dipole eddies in the Mozambique Channel (MC) indicates that the understanding of the mesoscale eddy characteristics in the MC is incomplete. The distributions of anticyclonic, cyclonic, and dipole eddies along the MC were elucidated in this study using satellite observations. It was observed that these eddies exhibit a preference for emergence and movement in the western MC. The occurrence frequencies of anticyclonic and cyclonic eddies are four and three times per year, respectively, in the narrowest section of the MC. In contrast, the frequency of mesoscale eddies reaches its peak at nine times per year in the central region of the MC. The occurrence of dipole eddies also reaches its peak twice per year in the middle MC. Dipole eddies are more prevalent in the MC and exhibit larger dimensions and shorter lifespans compared to anticyclonic and cyclonic eddies. Mesoscale eddies, which traverse the narrowest section of the MC and propagate southward, are predominantly generated within the western Comoros Basin due to barotropic instability. The southward branch of the Northeast Madagascar Current (NEMC) plays a crucial role in transporting these eddies to the middle MC. The eastern middle MC is also a generation site for mesoscale eddies in addition to the Comoros Basin, where cyclonic eddies are generated twice per year. These cyclonic eddies are also generated due to barotropic instability.
1 Introduction
Mesoscale eddies are prevalent in the global ocean (Fu et al., 2010) and significantly influence the heat and material transport in ambient water (Zhang et al., 2014). Abundant mesoscale eddies have been observed in the Mozambique Channel (MC; Figure 1; De Ruijter et al., 2002; Schouten et al., 2003; Swart et al., 2010; Halo et al., 2014; Hancke et al., 2014). The MC is characterized by a high occurrence frequency of mesoscale eddies (Ridderinkhof and De Ruijter, 2003; Schouten et al., 2003; Ridderinkhof et al., 2010), which exhibit distinctive levels of eddy kinetic energy (EKE) compared to other regions in the global ocean (Penven et al., 2014). Additionally, these eddies can propagate into the Agulhas Retroflection region south of Africa and regulate the frequency of Agulhas ring shedding events (Schouten et al., 2002; Penven et al., 2006; Biastoch et al., 2008), thereby influencing heat and salt exchange between the Indian and Atlantic Oceans (Reason et al., 2003), as well as impacting global meridional overturning oceanic circulation (De Ruijter et al., 1999) as well as the global climate (Beal et al., 2011).
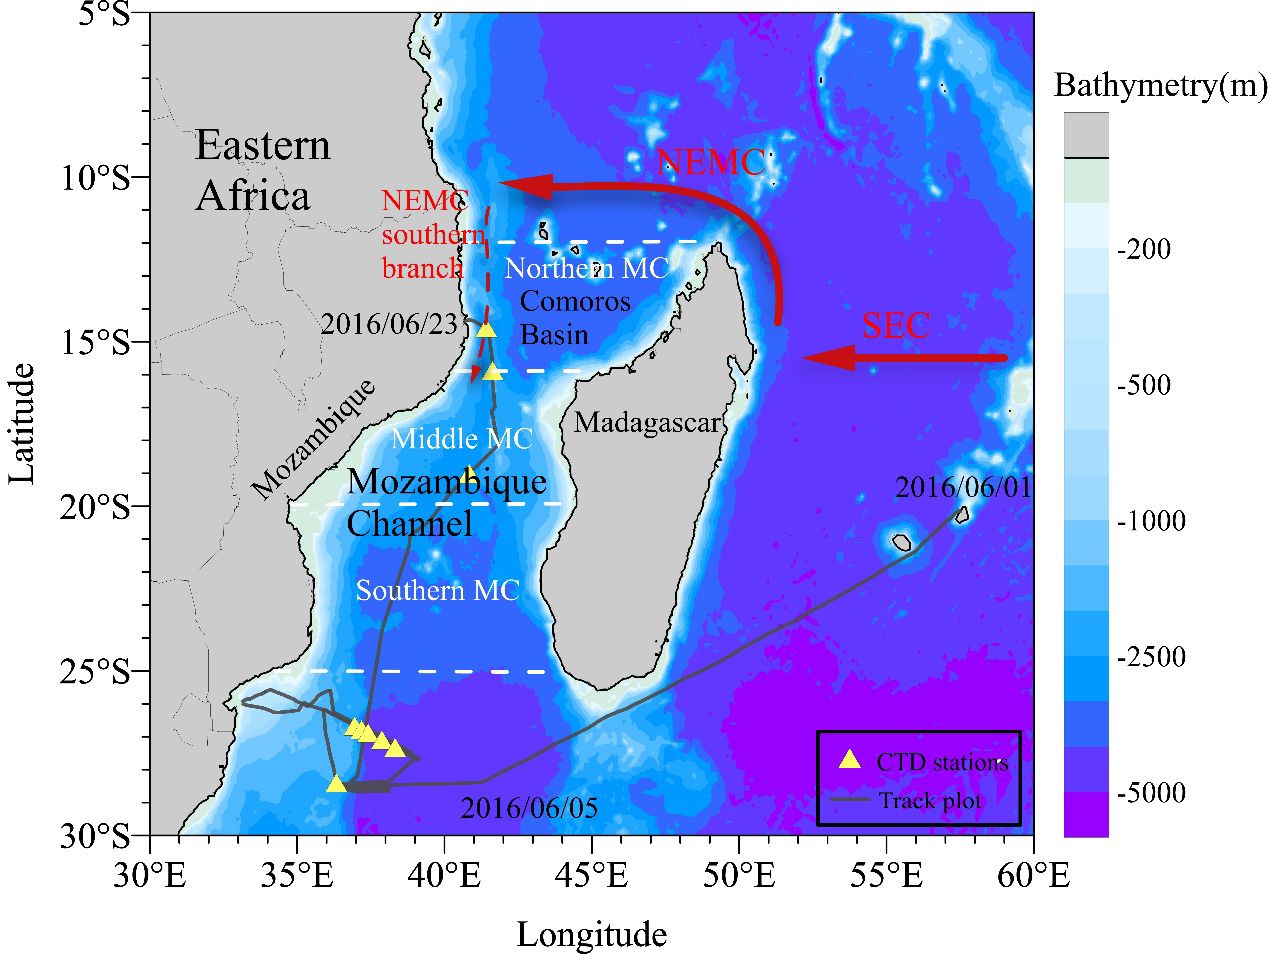
Figure 1 Bathymetry of the investigation region around the Mozambique Channel and Madagascar. The main circulation features are redrawn after Schott et al. (2001) to show the South Equatorial Current (SEC), the Northeast Madagascar Current (NEMC), and the southern branch of the NEMC. The dashed line means that its existence and nature are unclear. The black curve denotes the navigation track of the China–Mozambique International Joint Cruise involving R/V Xiang Yang Hong 10 from June 1 to 23, 2016. Here, following the practice of Schouten et al. (2003), we define three sections, i.e., northern MC (12°S–16°S), middle MC (16°S–20°S) and southern MC (20°S–25°S).
The characteristics of anticyclonic eddies in the MC have been extensively documented (De Ruijter et al., 2002; Ridderinkhof and De Ruijter, 2003; Schouten et al., 2003). Through moored current measurements, it has been estimated that anticyclonic eddies occur approximately 4–5 times per year in the narrowest part of the MC (Ridderinkhof and De Ruijter, 2003; Schouten et al., 2003; Ridderinkhof et al., 2010; Ullgren et al., 2012). These eddies typically have a diameter of around 300 km and can reach the channel’s bottom (De Ruijter et al., 2002; Ridderinkhof and De Ruijter, 2003). They would move southward along the western side of the MC (Schouten et al., 2003; Quartly and Srokosz, 2004; Quartly et al., 2013). The southward movement speed of these eddies was approximately 6 km per day between 12°S and 27°S, except for the region between 18°S and 21°S where the average speed was only 3–4 km per day. Further southward, the southward movement speed of these eddies increases to 8–10 km per day between 27°S and 35°S, similar to those in Schouten et al., (2003). To investigate the variation in the occurrence frequency of anticyclonic eddies during their southward propagation, Schouten et al. (2003) computed the mean power spectra of sea surface height anomalies (SSHA) across all individual points in the northern, middle, and southern MC sections, indicating an approximate occurrence rate of seven, five, and four times per year respectively for eddies.
In contrast, cyclonic eddies in the MC have received less attention. Based on early ship drift and XBT-observations, which suggested cyclonic eddies to be either non-existent or significantly weaker, De Ruijter et al. (2002) attributed the negative SSHA observed from altimetry to artifacts in the data processing resulting from the employed averaging process for defining a mean SSH-field. They argued that a negative SSHA should be interpreted as indicative of the absence of an anticyclonic eddy. Recently, the presence of cyclonic eddies in the MC has been confirmed by surface drifter and in situ ADCP measurements (Hancke et al., 2014; Ternon et al., 2014). The analysis suggests that the power spectra of SSHA derived by Schouten et al. (2003) may not only solely represent anticyclonic eddies but also include cyclonic eddies. Furthermore, observational evidence of dipole eddies in the MC implies that anticyclonic and cyclonic eddies can coexist for a certain period (Kolasinski et al., 2012; Malauene et al., 2014; Roberts et al., 2014). However, knowledge of the properties of cyclonic and dipole eddies in the MC is still limited due to insufficient in situ measurements and studies. The presence of dipole eddies suggests that the approach based on the power spectra of SSHA may underestimate or misrepresent the occurrence frequency of mesoscale eddies, as the SSHA induced by dipole eddies could differ from that induced by single cyclonic or anticyclonic eddies. For instance, while power spectra analysis showed maximum occurrence frequency for eddy events in northern MC (Schouten et al., 2003), the EKE levels were found to be highest in the middle MC (José et al., 2014; Penven et al., 2014). Eddy statistics derived from eddy detection and tracking algorithms have the potential to address these issues. Halo et al. (2014) conducted an analysis of satellite altimeter data and model data, revealing that anticyclonic eddies are predominantly found in the western part of the MC, while cyclonic eddies appear to be more widespread with less defined distribution. They also found cyclonic eddies are comparatively more abundant and smaller in size compared to anticyclonic eddies. However, their frequency distribution of eddy occurrences reveals a higher number of anticyclonic eddies (more than 4–5 times per year) in the narrowest section of the MC. This discrepancy may arise due to the processing of identified eddies. Halo et al. (2014) demonstrated the frequency of eddy occurrence on a 1/2° × 1/2° grid; however, it is important to note that an eddy can traverse this grid over multiple days, leading to repetitive counts.
The origin of mesoscale eddies in the MC has also attracted much attention. Mesoscale eddies are believed to have been generated in the narrowest part of the MC (Backeberg and Reason, 2010), at the northern tip of Madagascar Island (Collins et al., 2014), and on both sides of the westward NEMC after NEMC separates from the northern tip of Madagascar Island (LaCasce and Isachsen, 2007). It can be inferred that some eddies generated in the north of the MC could pass through the narrows of the MC. Collins et al. (2014) estimated that only 30% of mesoscale eddies generated in the Comoros Basin could pass through this narrow region. However, it needs to be clarified whether the number of eddies passing through the narrow MC is consistent with that reported by Schouten et al. (2003).
The NEMC plays a significant role in transporting vorticity anomalies (Backeberg and Reason, 2010) or mesoscale eddies in the northern MC (LaCasce and Isachsen, 2007; Collins et al., 2014). The formation of the NEMC occurs north of Madagascar when the South Equatorial Current (SEC) bifurcates off the eastern coast of Madagascar near 17°S (Schott and McCreary, 2001) (Figure 1). As the westward NEMC reaches the East African coast, it bifurcates with a southward branch flowing along the African coastline. However, the characteristics of the southern branch of NEMC remains elusive. The relationship between this southward branch and mesoscale eddies remains uncertain, as does its potential extension towards the middle MC.
The statistical processing of identified mesoscale eddies was enhanced in this study by eliminating repeated counts based on their unique identities. The refined approach effectively ensures accurate quantification of anticyclonic, cyclonic, and dipole eddies in the MC. Subsequently, we investigated the characteristics of cyclonic and dipole eddies. We then identified specific regions from which mesoscale eddies capable of traversing through the narrowest part of the MC originate. Furthermore, we investigated the nature of the southern branch of NEMC and diagnosed the energy conversion between this branch and mesoscale eddies.
2 Data and methods
2.1 Mesoscale eddy trajectory atlases
The analysis of mesoscale eddies in the MC was conducted using the Mesoscale Eddy Trajectory Atlas Product (version 2.0, METAP), which is produced in delayed time by the SSALTO/DUACS multimission altimeter data processing system and distributed by AVISO+ (https://www.aviso.altimetry.fr/) following the methodology developed by Schlax and Chelton (2016). This product, which is reliable for recognizing mesoscale eddies and has been successfully applied in many studies (Dong et al., 2017; Sandalyuk et al., 2020), provides the daily cyclonic/anticyclonic type, central position, and radius of mesoscale eddies from 1993 to 2017 to facilitate the analysis of mesoscale eddies. The mesoscale eddy center is defined as the location of a Sea Level Anomaly (SLA) extremum within a predefined eddy area. The SLA field encompasses a broad spectrum of features, ranging from small to large-scale ones. Eddies are identified as features with diameters of 100-300 km; therefore, the initial step involves eliminating larger-scale variability (~1000 km) through the application of a low pass filter before detecting eddy centers. To compute large-scale variability, smoothing was performed using a Lanczos filter with a 1000 km half-power cutoff wavelength in both latitude and longitude dimensions. The resultant output was then subtracted from the original SLA data to generate a high-pass filtered grid exclusively containing mesoscale variability. Eddy radius is defined as the radius of a circle whose area matches that enclosed by the contour of the maximum circum-average geostrophic speed. In consideration of the ~35-day decorrelation time scale in the AVISO optimal interpolation procedure, METAP removes mesoscale eddies with lifetimes shorter than 28 d to prevent sporadic eddy events perhaps resulting from potential artifacts associated with the interpolation procedure.
An improved statistical processing of mesoscale eddies was established to avoid counting the same eddies repeatedly. The MC (34–49°E, 10–25°S) was first homogeneously divided into 1/2° grid meshes, the same as Halo et al. (2014). Then, the number of different types of eddies in each grid mesh was accumulated based on their identification. Note that each eddy has a unique identification, which is labeled as a serial number so that it would not be counted repeatedly.
Dipole eddies in the MC were extracted from METAP. Here, two adjacent eddies with eddy-center distances smaller than the sum of their radii are determined to be dipole eddies. The first step to extract dipole eddies from cyclonic eddies and anticyclonic eddies of METAP is to gain eddy information on each day. Subsequently, we conduct a comparison of the distances between eddy centers and the summation of their radii for each pair of eddies observed on the same day. Two eddies with eddy-center distances smaller than the sum of their radii are determined to be dipole eddies. The identity information of these two eddies and the day they form a dipole eddy is recorded as a dipole eddy record. By iteratively following this procedure, all dipole eddies in the MC will be found. Dipole eddies with the two eddies exhibiting consistent identity information on different days were identified as the same dipole eddy.
2.2 Satellite altimetry data
To investigate the characteristics of the southward branch of the NEMC, surface geostrophic velocity data processed by the SSALTO/DUACS multimission altimeter data processing system is used, which is provided by AVISO+ and distributed by the Copernicus Marine Environment Monitoring Service (CMEMS). The data have a homogeneous resolution of 0.25° in each direction.
To investigate the potential reach of the southward branch of the NEMC towards the middle MC, a methodology based on Ambe et al. (2004) was employed to precisely delineate the current axis of this southward branch by tracking and analyzing its maximum surface velocity. The schematic of this methodology is illustrated in Figure 2. The initial subsidiary line was established at 14°S and 40°–42°E, intersecting the upstream of the NEMC southward branch in a nearly perpendicular manner. The first point along the current axis was determined by identifying the maximum velocity along this subsidiary line. The subsidiary line was then repositioned to search for the second point of the current axis. Prior to this, the subsidiary line underwent a rotation around the point to ensure its perpendicularity with respect to the mean flow direction. The determination of the mean flow direction involved averaging the flow direction of each point along the subsidiary line. Subsequently, the adjusted line was shifted southward along this mean flow direction by a displacement of Δr (20 km). The width of the new subsidiary line is 120 km, encompassing seven points whose velocities can be determined through interpolation. The second point of the current axis can be derived based on the maximum velocity observed along the new subsidiary line. By iteratively following this procedure, the concatenation of all points on the current axis may be considered as constituting the current axis of the southward branch of NEMC. The velocity threshold along the current axis was set to 60 cm/s, as this value corresponds to the maximum climatological mean velocity (based on AVISO data from 1993–2017) of the southward branch of the NEMC. Modifying this threshold would not impact the position of the current axis, but it could potentially alter its length by including more or less would be added to the current axis.
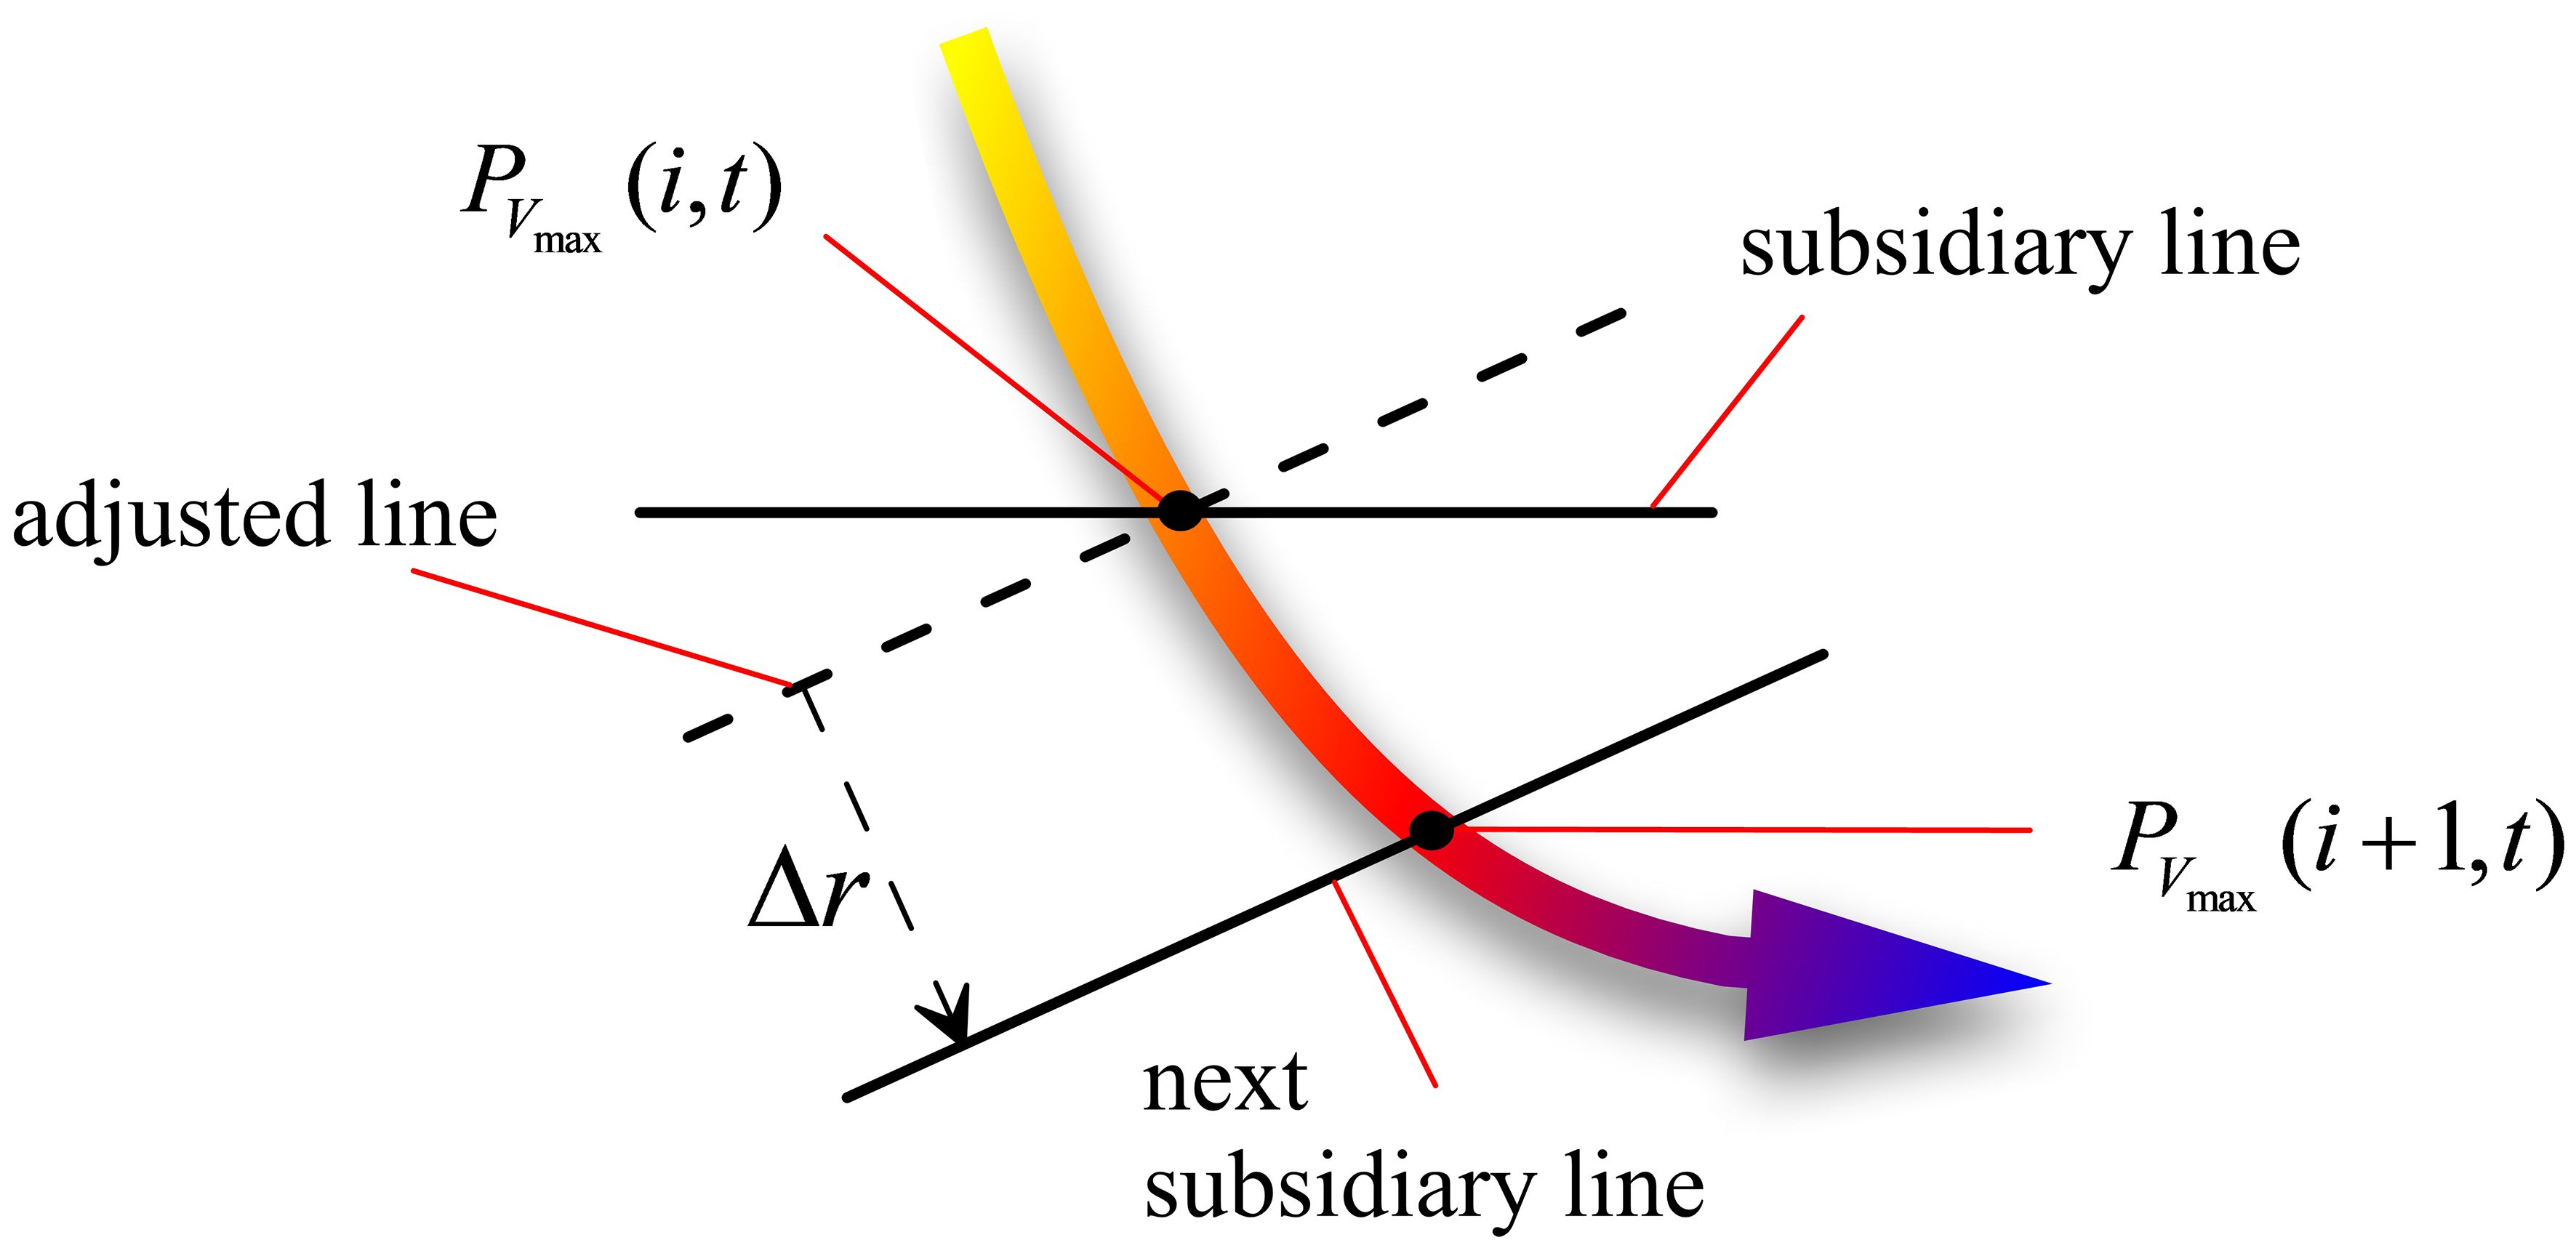
Figure 2 Schematic diagram illustrating the technique for detecting the current axis of the southward branch of the NEMC. A subsidiary line is employed to identify the current axis by identifying the maximum velocity. represents the ith point of the current axis at time t. denotes the neighboring point of the current axis adjacent to at time t. Δr is the straight-line distance between the adjusted line and the next subsidiary line. Further details can be found in the accompanying text.
2.3 In situ data
A hydrographic survey was conducted by the China–Mozambique International Joint Cruise involving R/V Xiang Yang Hong 10 from June 1 to 23, 2016. The CTD measurements of Seabird 911 at nine sampling stations (Figure 1) and Acoustic Doppler Current Profiler (ADCP) data were used to verify the reliability of the HYCOM data before its application. Along the cruise track (Figure 1), the current profile was measured via a Shipboard ADCP, namely, a 38-kHz Ocean Surveyor (OS38). The ADCP parameter settings were configured as follows: the data-sampling rate was set to one ping per 3 s, bin length was set to 24 m, and bin number was set to 40. The depth of the first ADCP bin is approximately 41 m (=sensor depth (7 m) + blank distance (22 m) + half of the bin length (24 m/2). The blank distance is set to 22m, which exceeds the default setting of the ADCP (16 m), effectively mitigating potential ship noise interference. To obtain the true currents, the navigation trajectory was used as the velocity reference for post-processing, which was provided by the NavCom SF-3050 DGPS system. Abnormal records exceeding three times the standard deviation of the mean current was excluded. The current profile was derived by averaging over 3 km intervals (not shown) to reduce the influence of noise. No specific tidal correction was applied to the ADCP data because tidal noise is less than 4–7 cm s-1 (Di Marco et al., 2002). The associated error in current calculations, when not accounting for tidal effects, is approximately 10%, as we utilize a reference velocity of 60 cm s-1 for the southward branch of the NEMC.
2.4 Model analysis data
The global 1/12° reanalysis data from HYCOM (Bleck, 2002) was utilized to diagnose the energy conversion between the southward branch of the NEMC and mesoscale eddies, providing three-dimensional temperature, salinity, and current data at three-hour intervals. Baroclinic energy conversion terms as well as barotropic energy conversion terms were defined in accordance with Equations 1 and 2 (Böning and Budich, 1992):
Here and , and denote the mean velocity components computed by averaging over the time period from January 1993 to December 2017. , is the background density computed by temporally averaging over the same time period above and horizontally averaging over the domain in (34°E–52°E, 10°S–25°S), is the temporal mean value of over the same averaging period, and is the annual and horizontal mean potential density (Böning and Budich, 1992; Biastoch and Krauss, 1999; Collins et al., 2014). PeKe is the conversion between the mean potential energy (MPE) and eddy potential energy (EPE). Positive values for PeKe correspond to baroclinic instability. KmKe is the conversion between the mean kinetic energy (MKE) and EKE. Positive values for KmKe correspond to barotropic instability owing to the work of Reynolds stresses against the mean shear. Given the substantial disparity in current velocity between the deep ocean (~0.1 m/s) and the upper ocean (~1 m/s), the energy budget was calculated only for the upper 1500 m. We compared the model simulated results with the in-situ ADCP and CTD data to verify the simulation ability of the HYCOM. The results show that the HYCOM outputs well reproduced the velocities of the ADCP observation at 100 m with correlation coefficient reaching 0.56 for the zonal velocity and 0.71 for the meridional velocity (Figures 3A, B). Temperature and salinity simulated by HYCOM displays high agreement with that of CTD observation with their determination coefficients keeping over than 0.95 (Figures 3C, D).
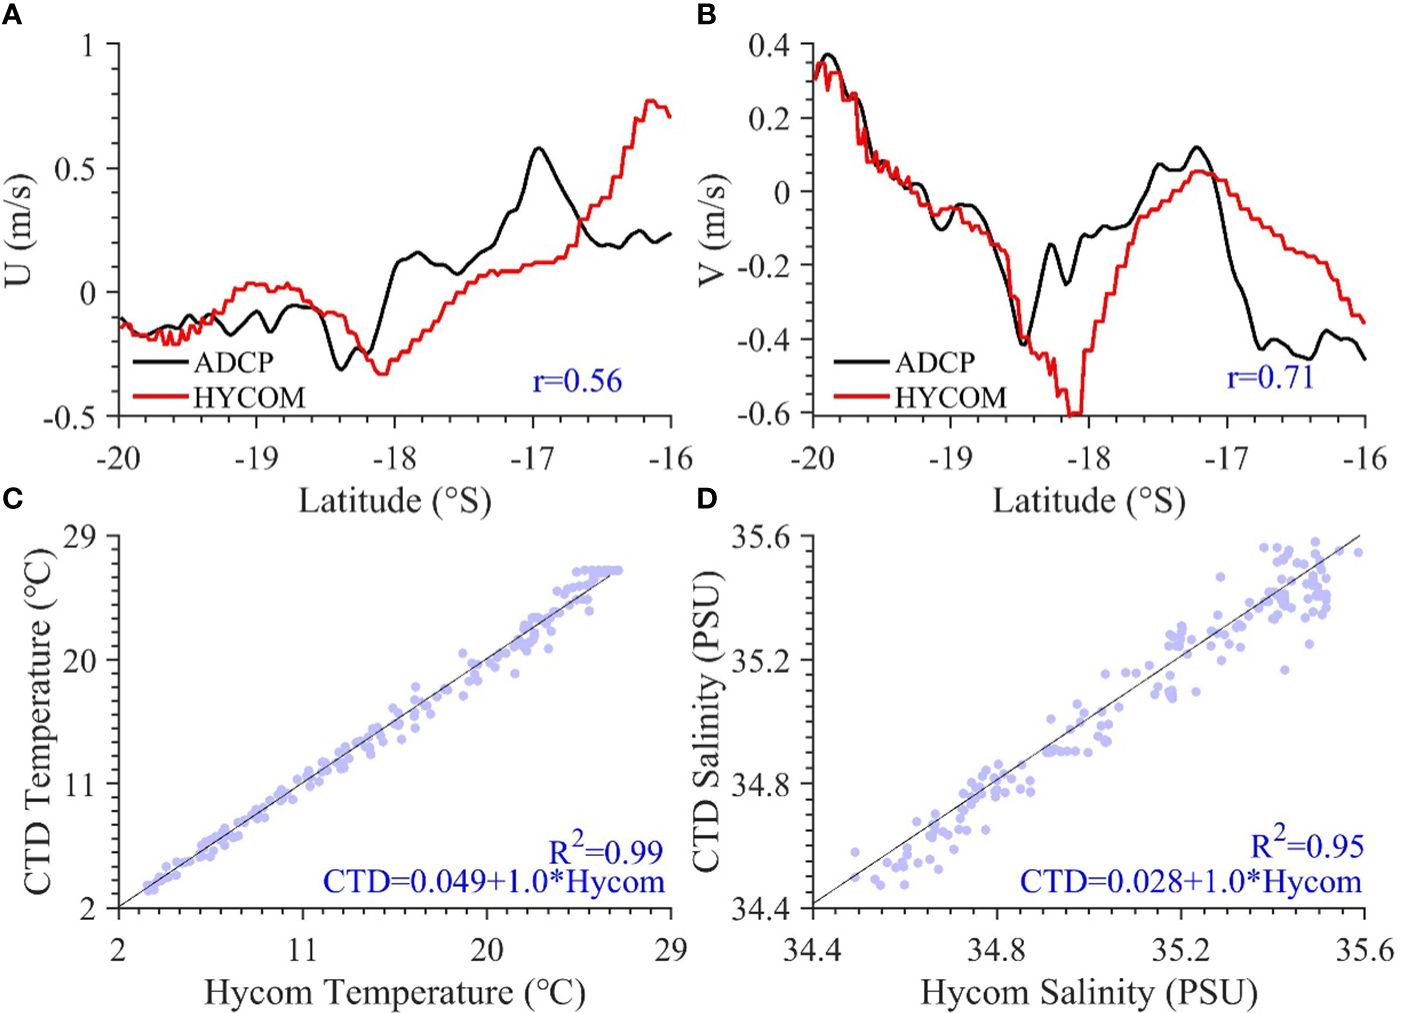
Figure 3 The zonal (A, B) meridional velocity of the ADCP observation (black line) and Hybrid Coordinate Ocean Model (HYCOM) outputs (red line) at 100 m along the cruise track between 16°S and 20°S. r denotes the correlation coefficients between the ADCP observation and HYCOM outputs; The Linear regression of temperature (C) and salinity (D) between HYCOM outputs and CTD observation. R2 denotes the determination coefficient of the linear regression analysis.
3 Results
3.1 Characteristics of mesoscale eddies
After eliminating duplicate counts, the distribution of anticyclonic and cyclonic eddies was obtained, as shown in Figure 4. Both anticyclonic and cyclonic eddies are more active in the western MC section (Figures 4B, C) than in the eastern part. Anticyclonic and cyclonic eddies with occurrence frequencies higher than once per year mostly emerge in the western MC, which exhibits a northeast-southwest distribution. The northeast-southwest distribution covers the region from 15°S to 25°S and indicates a southward movement trend for both cyclonic eddies and anticyclonic eddies. In addition to the western MC, anticyclonic eddies are also observed in proximity to 20°S and 43°E, while cyclonic eddies occur near 23°S and 42°E, as previously reported by Halo et al. (2014). Both cyclonic and anticyclonic eddies are also observed in the Comoros Basin, which was not reported by Halo et al. (2014) because their study did not include this area.
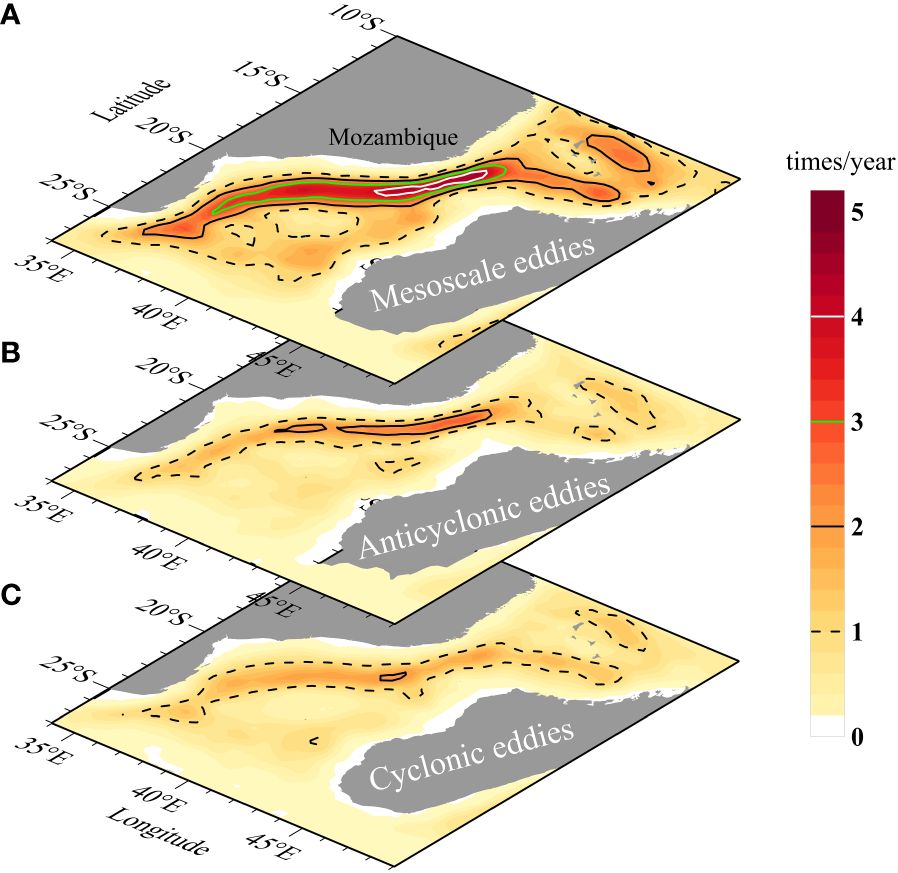
Figure 4 Occurrence frequencies of (A) all mesoscale eddies, (B) anticyclonic eddies, and (C) cyclonic eddies in the MC.
The variations in the occurrence frequency of mesoscale eddies during their southward movement in the western MC are shown in Figure 5. The occurrence frequencies of anticyclonic and cyclonic eddies are four (Ridderinkhof and De Ruijter, 2003; Schouten et al., 2003; Ridderinkhof et al., 2010) and three times per year, respectively, at 15°S (Figure 5) in the MC. The occurrence frequency of anticyclonic eddies in the region between 15°S and 20°S is approximately four times per year, peaking at around five times per year at 18.5°S, and subsequently decreasing to approximately two times per year at 25°S (Figure 5). In comparison, the frequency of cyclonic eddies first decreases to approximately two times per year at 17°S, then increases to approximately five times per year at 18.5°S, and then again decreases to approximately two times per year at 25°S.
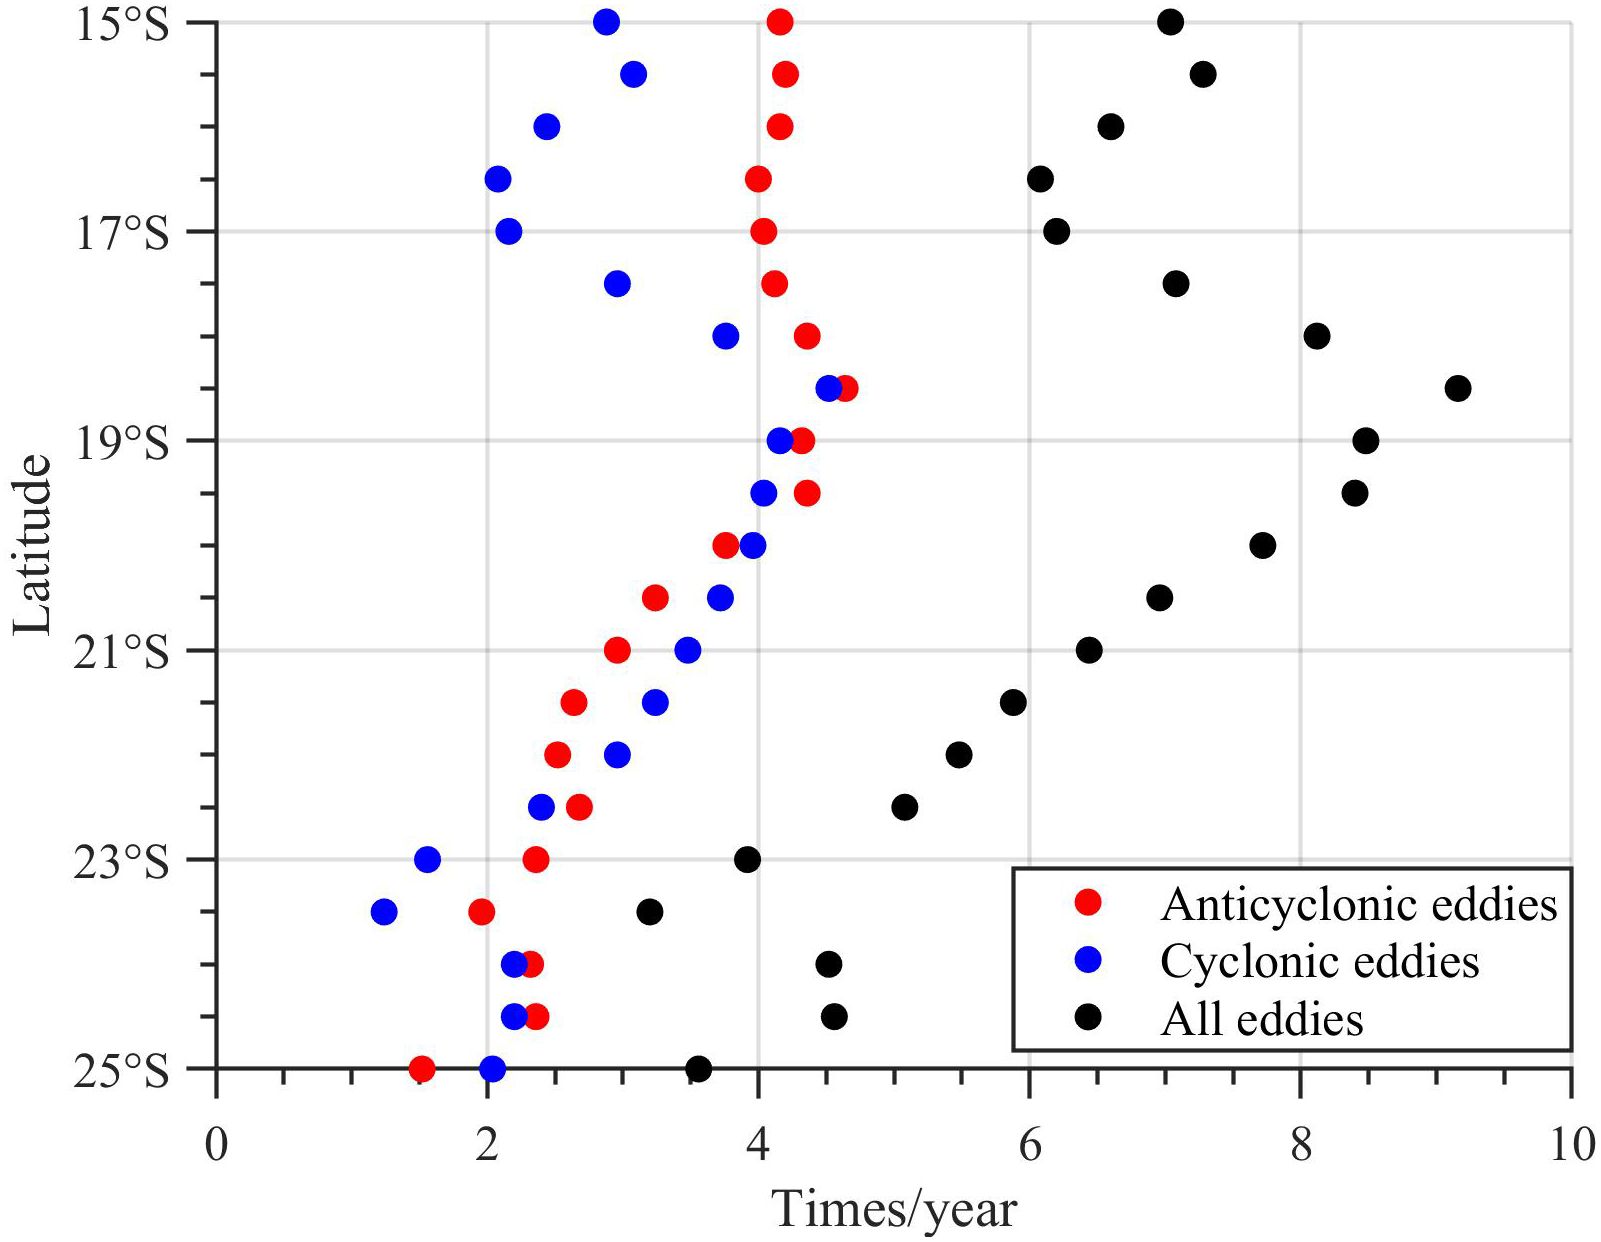
Figure 5 The variations in the occurrence frequency of mesoscale eddies during their southward movement in the western MC, which was generated by counting the mesoscale eddies within the black dashed contour lines between 15°S and 25°S in Figure 4b and Figure 4c.
The radius and lifespans of these southward-propagating mesoscale eddies in the western MC are depicted in Figure 6. Notably, anticyclonic eddies in this region exhibit larger sizes compared to cyclonic eddies. Specifically, a majority of anticyclonic eddies have radii ranging from 90 to 140 km, while most cyclonic eddies have radii between 60 and 110 km (Figures 6A, C). Furthermore, the number of cyclonic eddies surpasses that of anticyclonic ones. Both types of eddies demonstrate similar lifespan distributions within the range of 30–80 days (Figures 6B, D). Overall, these findings align with Halo et al. (2014), indicating that cyclonic eddies in the western MC are more abundant but smaller in size than anticyclonic eddies.
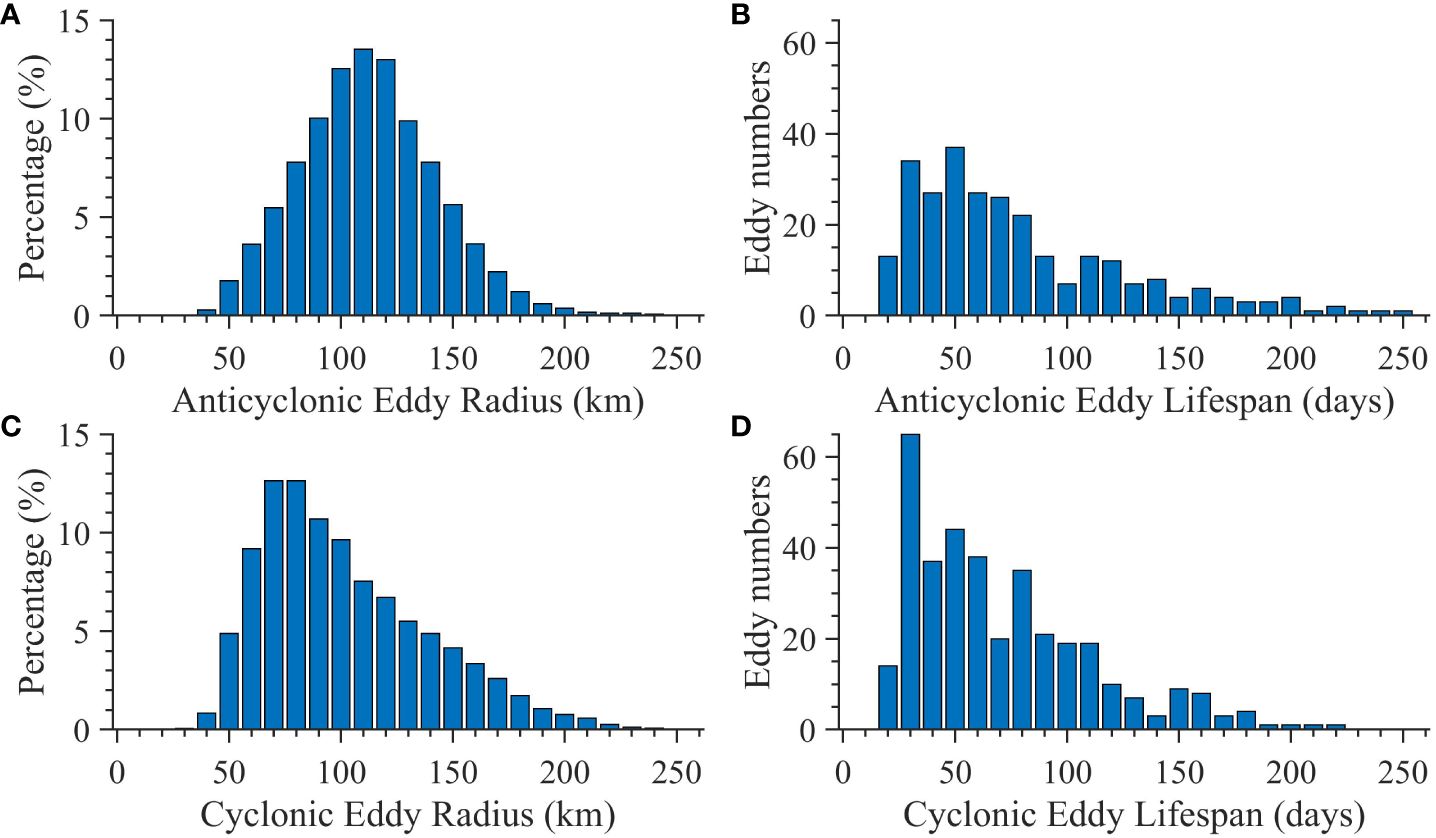
Figure 6 The frequency distribution of eddy radius and eddy lifespans for these southward-propagating anticyclonic (A, B) and cyclonic (C, D) eddies in the western MC. The extraction of southward-propagating eddies was performed using the same methodology as illustrated in Figure 5.
Due to the similarity in spatial distributions of anticyclonic and cyclonic eddies in the MC (Figure 4), dipole eddies may form, as observed by Kolasinski et al. (2012); Malauene et al. (2014); Roberts et al. (2014), and Lamont and Barlow (2017). The distribution of dipole eddies is shown in Figure 7. Here, two adjacent eddies with eddy-center distances smaller than the sum of their radii are determined to be dipole eddies. Dipole eddies are predominantly observed in the middle MC between 17°S and 20°S, with a frequency of occurrence approximately twice per year. The highest frequency of occurrence is found around 18°S, with three events per year. Ninety-five percent of these dipole eddies consist of an anticyclonic eddy and a cyclonic eddy. The remaining dipole eddies are comprised of two anticyclonic eddies or two cyclonic eddies.
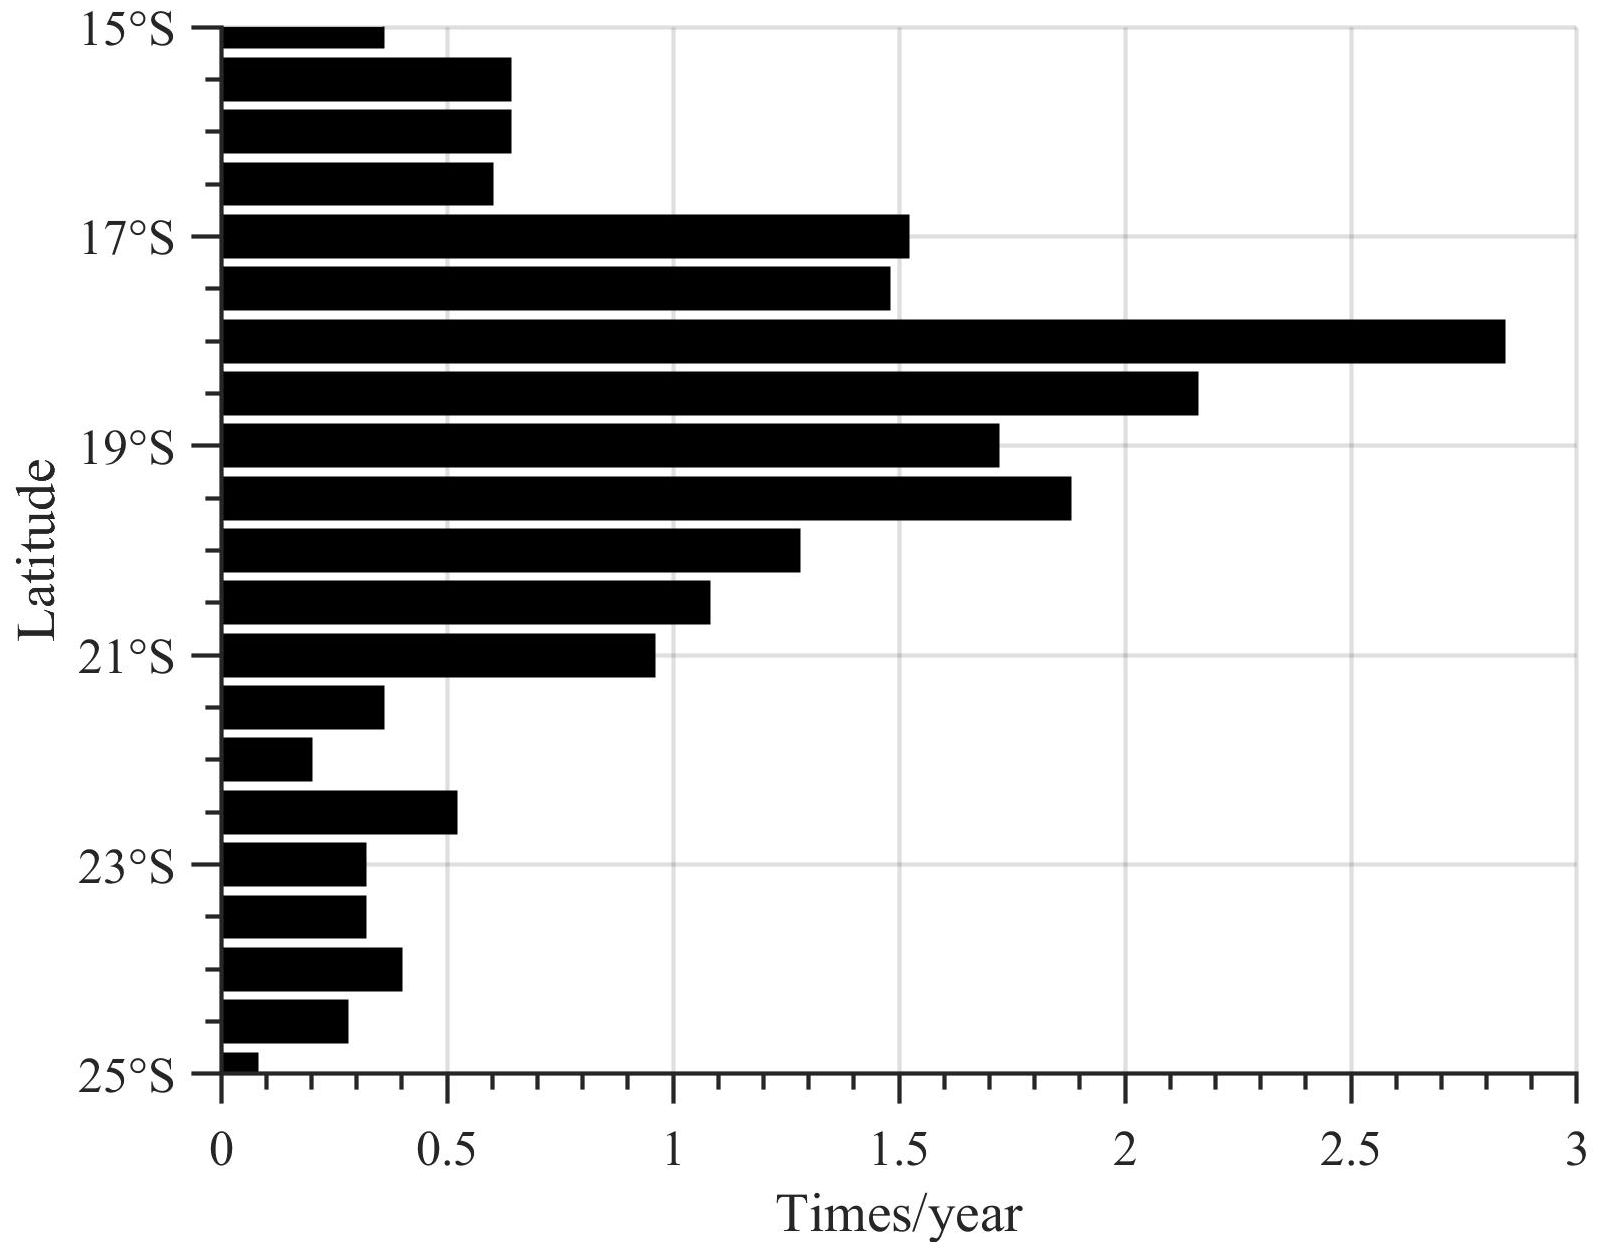
Figure 7 Occurrence frequencies of dipole eddies in the MC. Here, two adjacent eddies with eddy-center distances smaller than the sum of their radii are determined to be dipole eddies. This definition was utilized to extracted dipole eddies from METAP.
The radius and lifespans of dipole eddies in the MC are depicted in Figure 8. As almost all dipole eddies consist of an anticyclonic eddy and a cyclonic eddy, we utilized the extracted radii of these individual components to represent the radius properties of dipole eddies. Both anticyclonic and cyclonic eddies predominantly exhibit radii ranging from 110–160 km (Figures 8A, B). A substantial number of dipole eddies have been observed in the MC (Figure 8C). Although most dipole eddies have lifespans shorter than 30 days, there still exists a considerable proportion with lifespans exceeding 30 days.
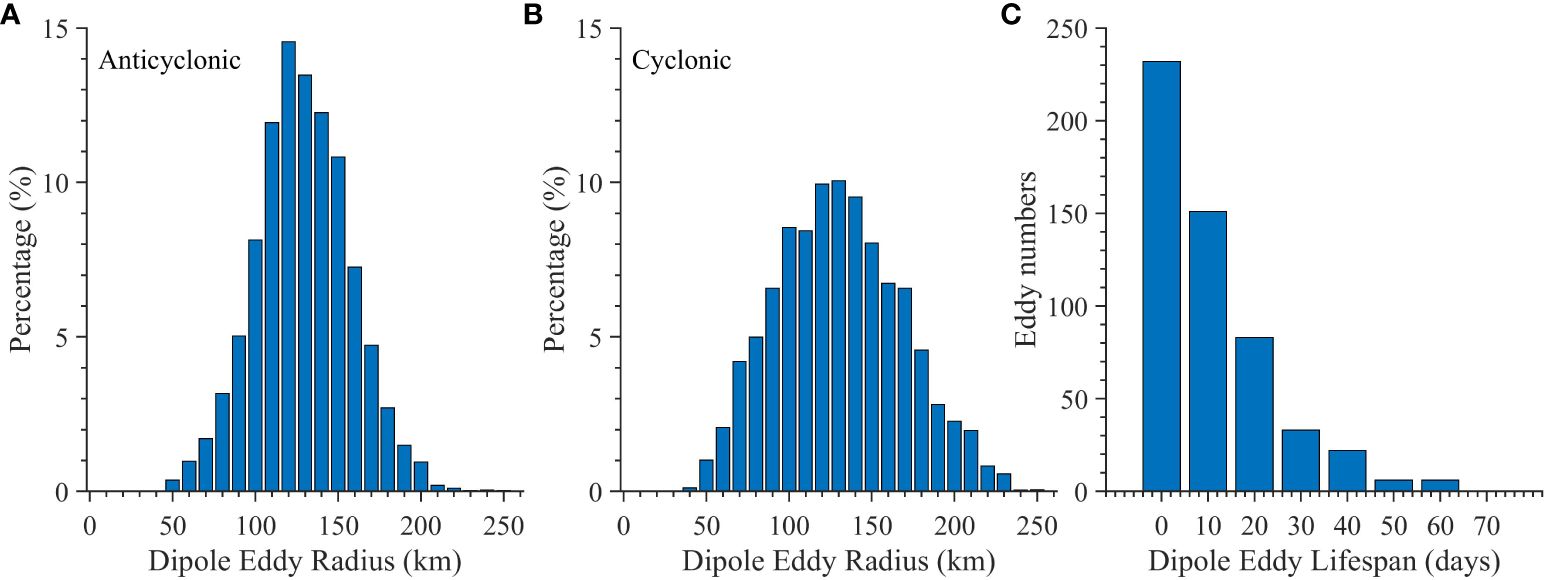
Figure 8 The frequency distribution of eddy radius (A, B) for anticyclonic and cyclonic eddies extracted from dipole eddies; (C) the frequency distribution of eddy lifespans for dipole eddies.
3.2 Generation of mesoscale eddies
The sources of mesoscale eddies passing through the narrowest part of the MC were investigated using METAP (Figure 9A). Here we define the region between 15°S and 16°S in the MC as the narrowest part of the MC. The results indicate that these mesoscale eddies are all generated in the Comoros Basin, with a majority of approximately 70% originating in the western Comoros Basin, specifically west of 44°E. It is noteworthy that while numerous mesoscale eddies are observed in the Comoros Basin, most fail to traverse through the narrowest section of the MC. Only around 43% of mesoscale eddies generated within the Comoros Basin successfully pass through this narrow region. Among those unable to do so, an overwhelming majority of approximately 90% are formed east of 44°E in the Comoros Basin. Consequently, it can be inferred that the current field prevailing in the western Comoros Basin plays a crucial role in both generation and propagation processes associated with mesoscale eddies within the MC. The speed of mesoscale eddies in the Comoros basin is significantly higher compared to those located south of the Comoros basin, providing further evidence (Figure 9B). In addition, the disparity in velocity may facilitate the convergence of mesoscale eddies within the Comoros basin with those located to its south, subsequently giving rise to dipole eddies. A significant proportion of anticyclonic eddies (86%) and cyclonic eddies (77%), capable of traversing the narrowest section of the Channel and transporting southward, subsequently develop into dipole eddies.
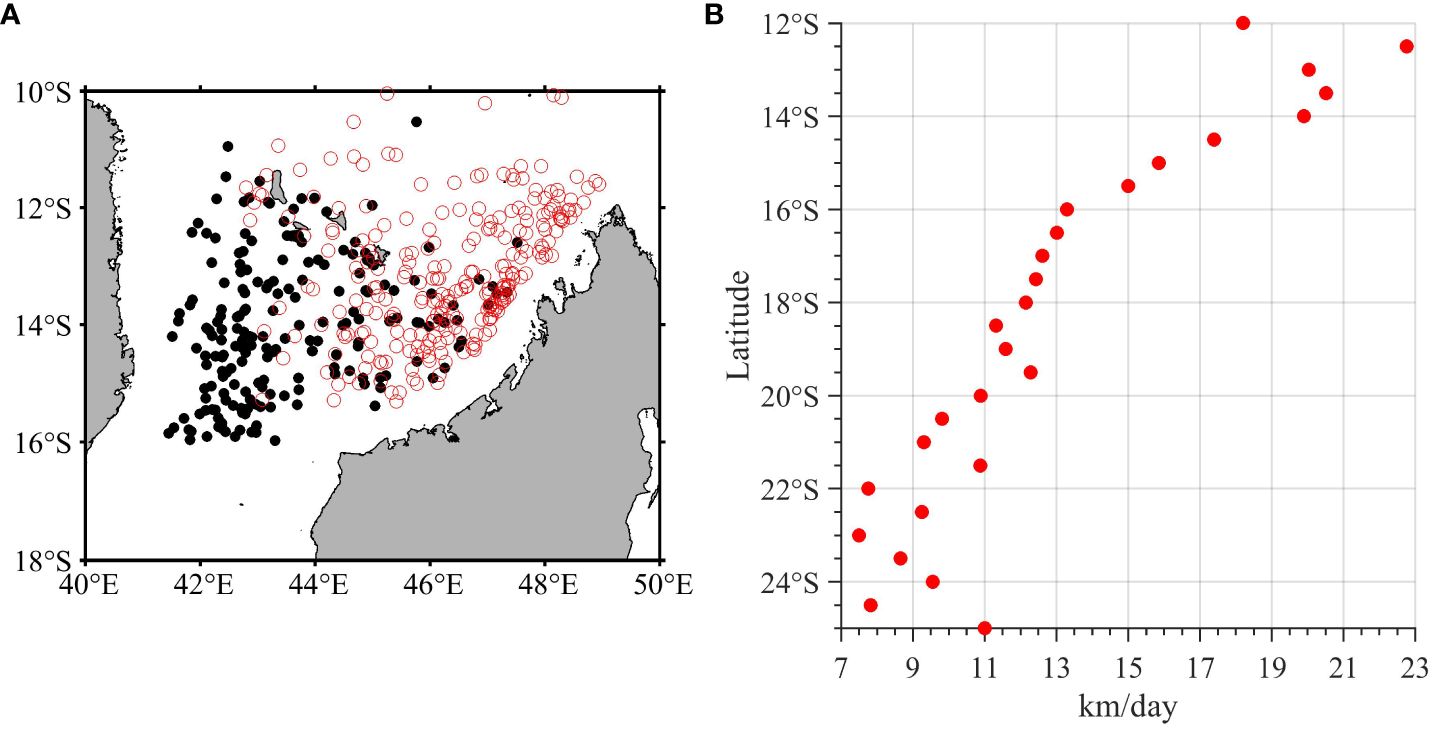
Figure 9 (A) Birthplace of mesoscale eddies capable of passing through the narrowest part of the MC (depicted as black solid circles) and other mesoscale eddies generated within the Comoros Basin (represented by red hollow circles); (B) The speed of mesoscale eddies capable of passing through the narrowest part of the MC when they move southward along the western MC.
The current field in the western Comoros Basin was investigated using the AVISO geostrophic velocity data (Figure 10). From a climatological perspective, the southward branch of the NEMC is the main ocean current in the western Comoros Basin (Figure 10A). However, this branch is not a persistent and steady current, as its velocity ranges from 0 to 0.9 m/s, and it sometimes flows northward (Figure 10C). The velocity of the southward branch of the NEMC exhibits a 50-day oscillation period (Figure 10B). A similar 50-day oscillation period is also found for the NEMC (Quadfasel and Swallow, 1986). A countercurrent is located east of the southward branch of the NEMC (red box; Figure 10A). Once the southward branch of the NEMC is strengthened, the current amplitude of the countercurrent increases (Figure 10C). This countercurrent is not caused by the presence of eddies since the velocity of the countercurrent is always much lower than the NEMC southward branch (Figure 10C). The correlation coefficient between the southward branch of the NEMC and the countercurrent reaches -0.7 with a lag of 5 days. The countercurrent also exhibits a 50-day oscillation period, which is the same as that of the southward branch of the NEMC.
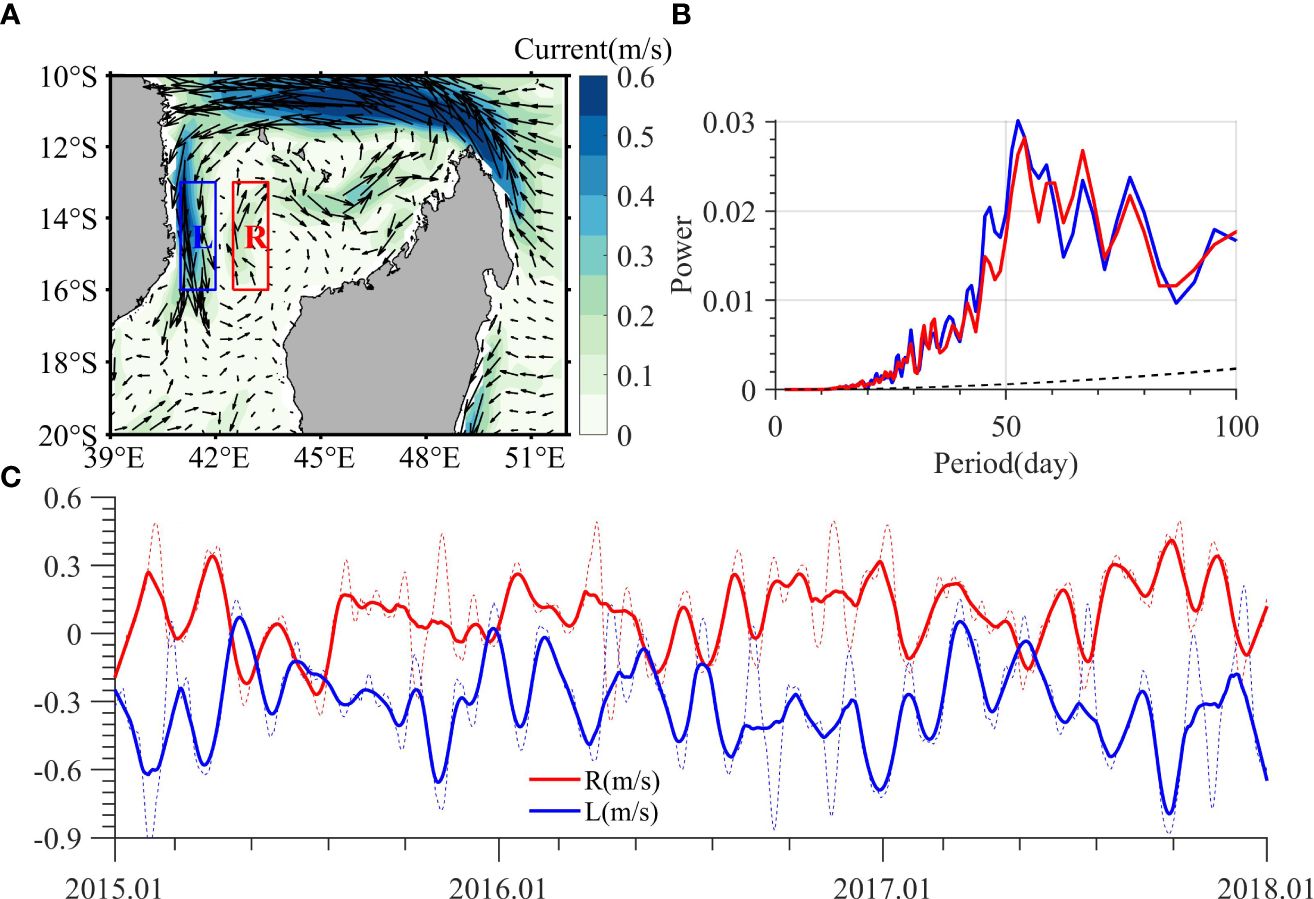
Figure 10 (A) Climatologic mean current extracted from the AVISO. (B) Spectrum of the mean meridional currents in Boxes L (NEMC southward branch) and R (countercurrent). (C) Variation in the mean meridional currents in Boxes L and R. The dotted curve denotes the raw time series, and the solid curve denotes the 30-day moving average of the raw time series.
The energy conversion when these mesoscale eddies generated is shown in Figures 11A, B. The vertically integrated values of PeKe and KmKe were computed during the periods when mesoscale eddies generated. Subsequently, these results were averaged to obtain the mean values of PeKe and KmKe. The results depicted in Figure 11 demonstrate that both PeKe and KmKe exhibited positive values along the Mozambique coast below 14°S, which corresponds to the downstream region of the southward branch of NEMC. Furthermore, it is noteworthy that KmKe displayed a greater magnitude compared to PeKe. The findings demonstrate the prevalence of barotropic instabilities in the generation of mesoscale eddies, while also highlighting the significance of baroclinic instabilities.
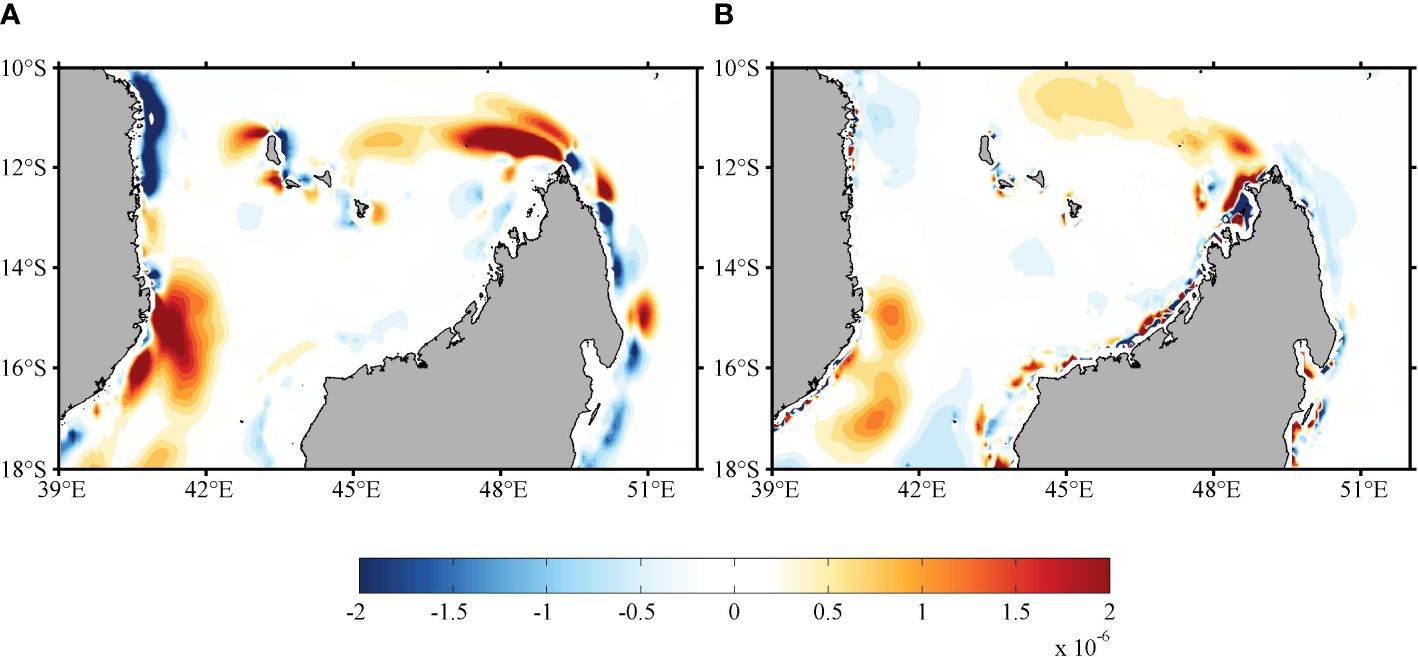
Figure 11 (A) The spatial distribution of vertically-integrated KmKe (m2s-3) over the upper 1500 m when mesoscale eddies at 15°S are generated in the Comoros Basin. (B) The spatial distribution of vertically-integrated PeKe (m2s-3) over the upper 1500 m.
The formation of mesoscale eddies is likely influenced by another process, as depicted in Figure 5, occurring between 17°S and 19°S. Notably, there is an observed increase in the frequency of cyclonic eddies from two to four occurrences per year. The cyclonic eddies are predominantly generated in the eastern middle MC (Figure 12A) and initially propagate westward before turning southward along the Mozambique coast. The current axis of the southward branch of the NEMC during cyclonic eddy generation is depicted in Figure 12A to elucidate the potential relationship between the eddies in the middle MC and the southern branch of NEMC. When the southward branch of NEMC exhibits sufficient intensity, it has the potential to extend further towards the southern region and exert influence on dynamic processes within the middle MC. Given the prevalence of dipole eddies in the middle MC, we investigated the relationship between dipole eddies and the generation of cyclonic eddies by normalizing cyclonic eddy positions to the coordinate origin (Figure 12B). Subsequently, we identified the nearest anticyclonic eddies on the same day. Cyclonic eddies are predominantly generated in the vicinity of anticyclonic eddies located within a distance of less than 2°. Moreover, 26% of these cyclonic eddies exhibit dipole structures with adjacent anticyclonic eddies upon their formation, while 98% of these cyclonic eddies persist as dipole structures throughout their lifespans.
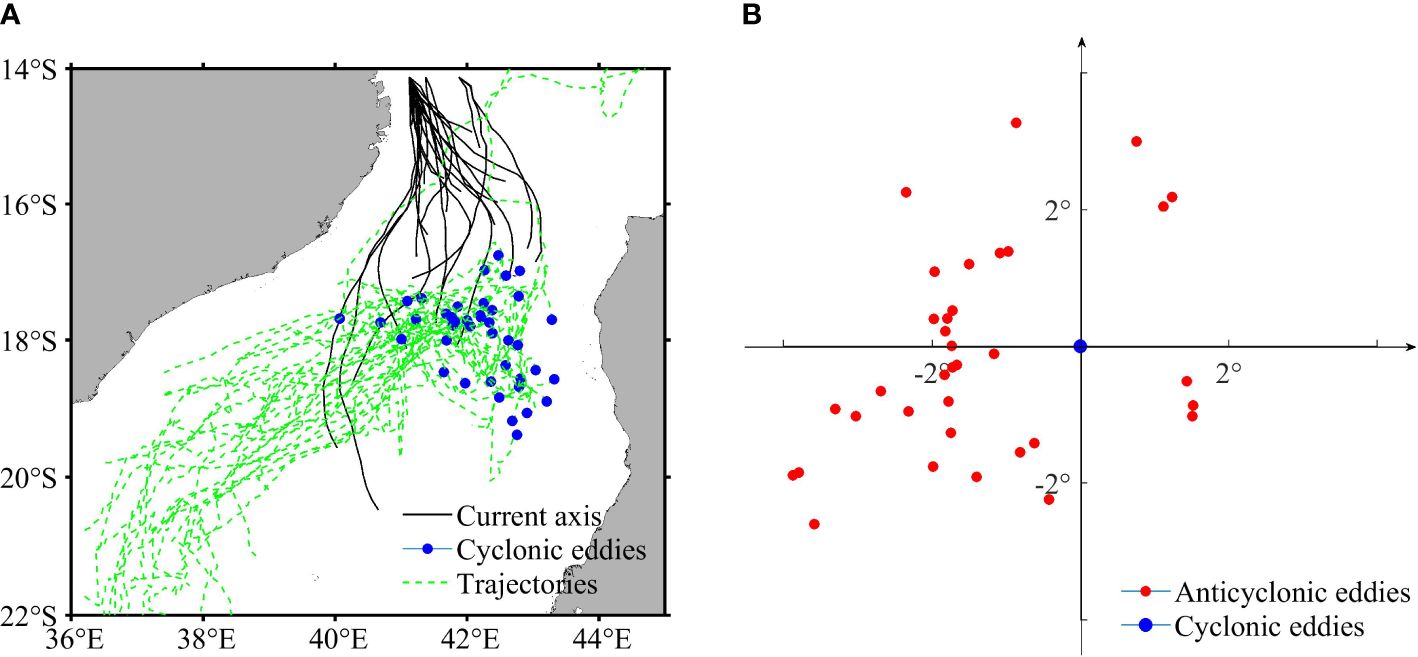
Figure 12 (A) Current axis of the NEMC southward branch and birthplace, trajectories of cyclonic eddies generated between 17°S and 19°S. (B) Distribution of cyclonic eddies and neighboring anticyclonic eddies when cyclonic eddies generated between 17°S and 19°S, and note that positions of these cyclonic eddies were all normalized to the coordinate origin.
The energy conversion when cyclonic eddies generated between 17°S and 19°S was diagnosed in Figures 13A, B. The magnitudes of both PeKe and KmKe in the middle MC are comparable to those observed in the Comoros Basin (Figure 11), indicating a same strong interaction between eddies and mean flow within the middle MC. Positive KmKe dominates the region between 17°S and 19°S, suggesting that the generation of cyclonic eddies is mainly influenced by barotropic instability.
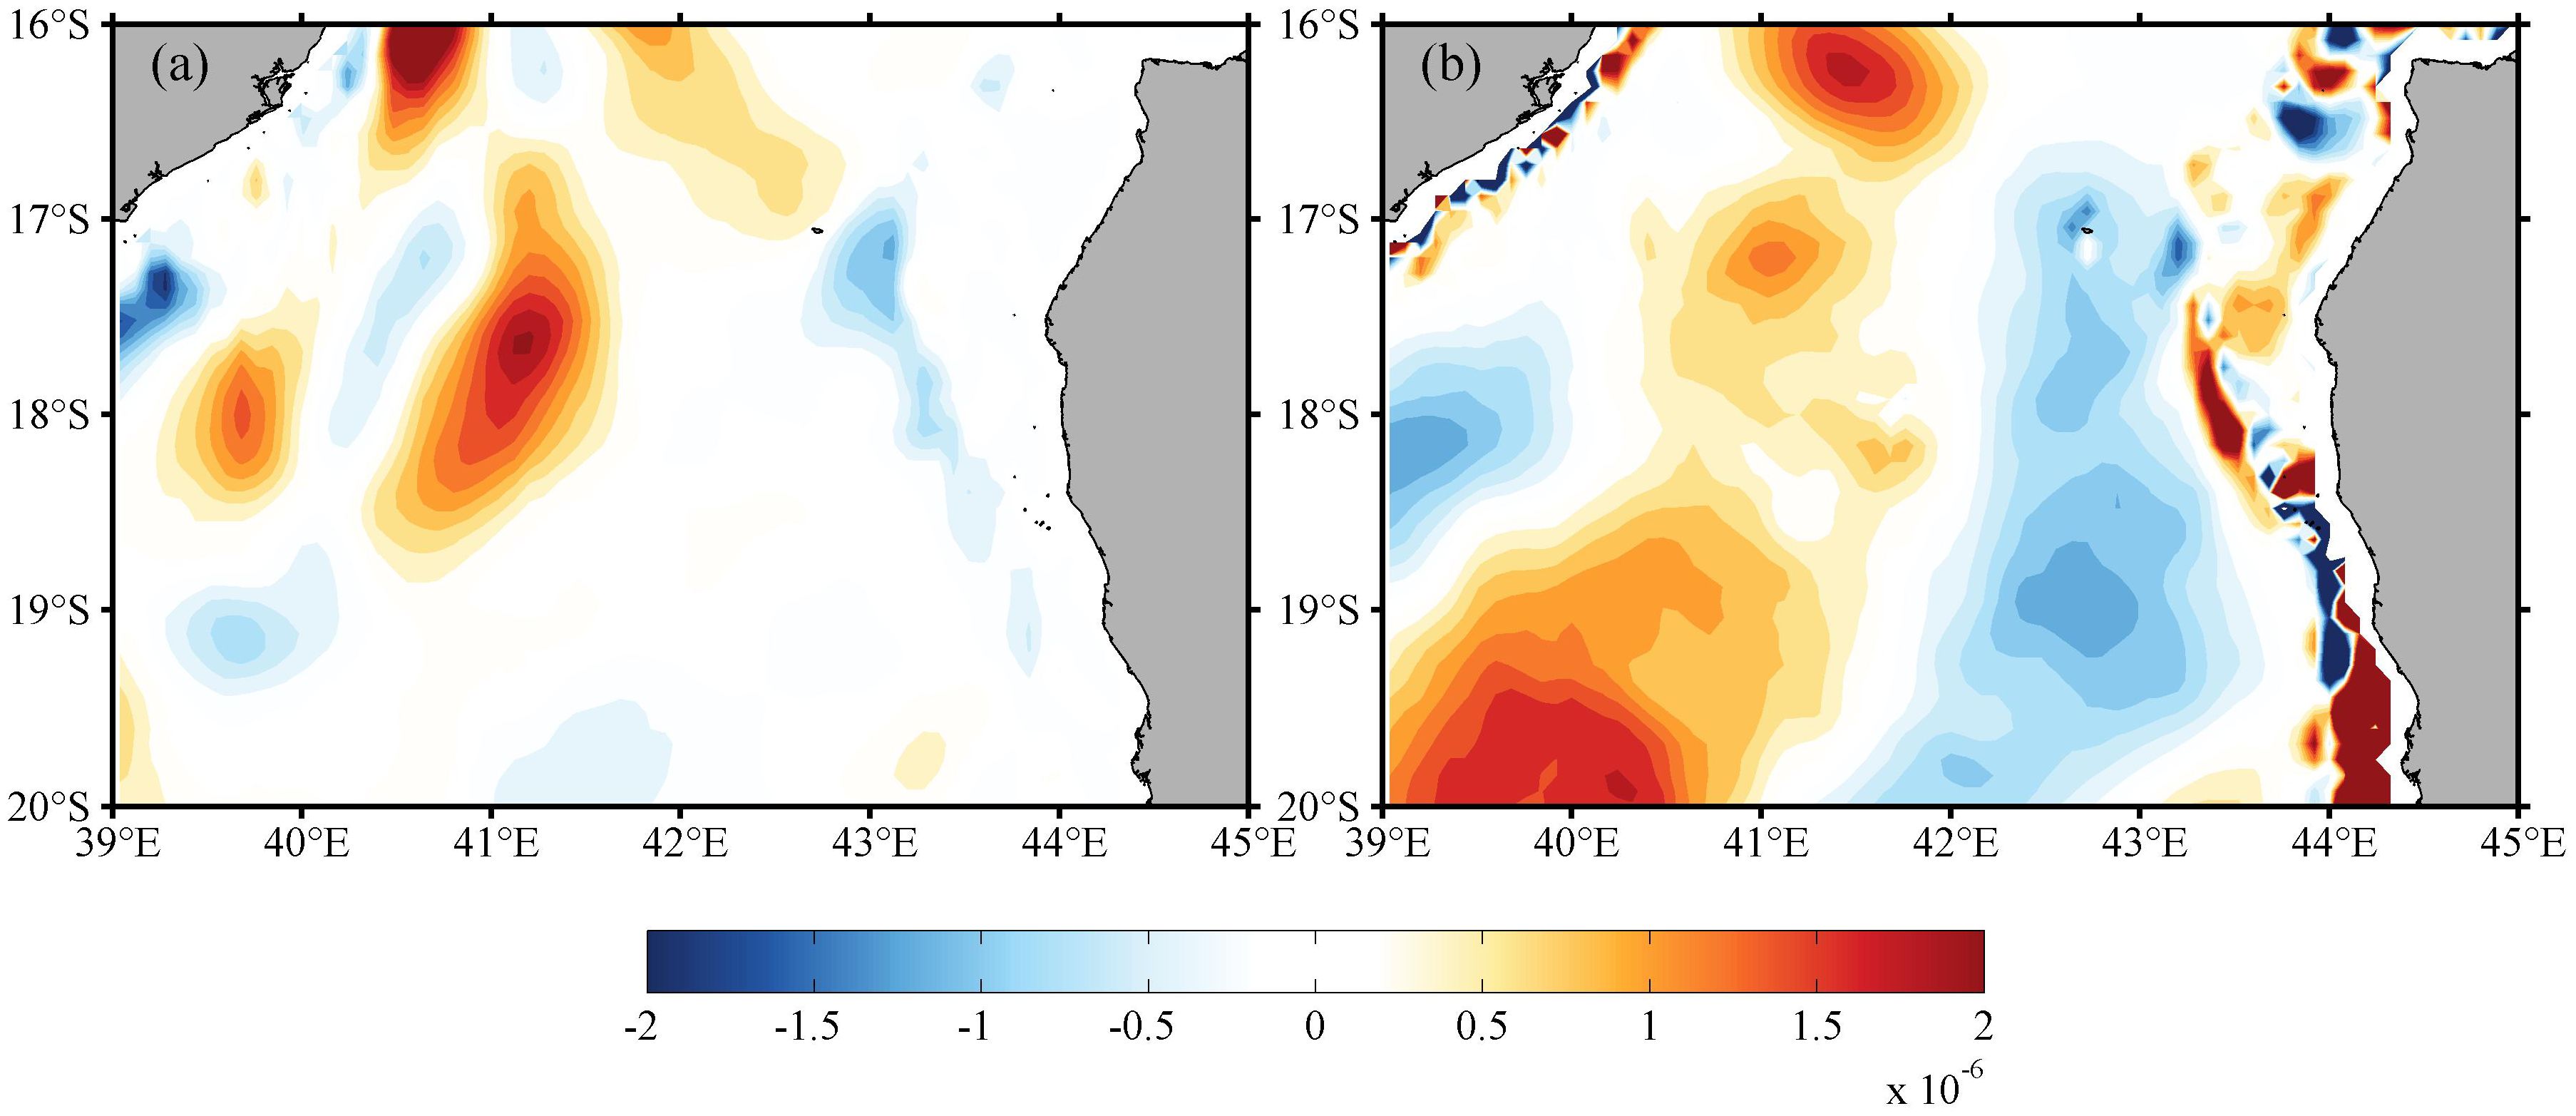
Figure 13 (A) The spatial distribution of vertically-integrated KmKe (m2s-3) over the upper 1500 m when increasing cyclonic eddies between 17°S and 18°S are generated. (B) The spatial distribution of vertically-integrated PeKe (m2s-3) over the upper 1500 m.
4 Discussion
After eliminating duplicate counts, the distribution of anticyclonic and cyclonic eddies (Figure 4) exhibited enhanced consistency with the distribution of standard deviation in SSHA and annual mean EKE, as previously reported by Palastanga et al. (2006); José et al. (2014), and Penven et al. (2014). This implies cyclonic eddies is more active in the western MC, similar to anticyclonic eddies. Correspondingly, dipole eddies, consisting of both anticyclonic and cyclonic eddies, also exhibit higher activity levels in the western MC. Furthermore, Figure 4 fails to demonstrate the presence of 4–5 anticyclonic eddies per year in the narrowest part of the MC. Figure 4 is composed of 1/2° bins, which implies that multiple anticyclones (4–5) may be distributed across different bins. Therefore, it becomes necessary to combine eddies from various bins at the same latitude in order to accurately determine the occurrence frequency of eddies. The obtained results (Figure 5) demonstrate a strong concurrence with moored current measurements conducted by Ridderinkhof and De Ruijter, 2003; Schouten et al. (2003); Ridderinkhof et al. (2010) and Ullgren et al. (2012).
Figure 5 show good agreement with power spectra analysis of SSHA (Schouten et al., 2003) in the northern and southern MC sections, which reveal seven and four mesoscale eddies per year, respectively. However, the presence of nine mesoscale eddies per year shown in Figure 5 in the middle MC exceeds the analysis of SSHA power spectra, thereby supporting our hypothesis that dipole eddies influence the pattern of SSHA power spectra. Numerous dipole eddies occur in the middle MC with an occurrence frequency of twice per year (Figure 7), predominantly consisting of an anticyclonic and a cyclonic eddy. Dipole eddies can also be identified in the first two modes of EOF analysis based on SSH or SLA (Schouten et al., 2003; Tew-Kai and Marsac, 2009), exhibiting a sequence of three mesoscale eddies with alternating polarities in the middle MC. Compared to normal anticyclonic and cyclonic eddies, dipole eddies are more prevalent in the MC and exhibit larger dimensions and shorter lifespans (Figure 8).
The eddies passing through the narrows of the channel were exclusively generated within the Comoros Basin (Figures 9). It can be inferred that the eddies at the northern tip of Madagascar Island (Collins et al., 2014), and on both sides of the westward NEMC after NEMC separates from the northern tip of Madagascar Island (LaCasce and Isachsen, 2007) can be attributed to positive vorticity anomalies. The NEMC would transport these vorticity anomalies into the Comoros Basin, where eddies are generated. The eastern middle MC is also a generation site for mesoscale eddies in addition to the Comoros Basin, where cyclonic eddies are generated twice per year (Figure 12). The main energy sources of eddy generation in the MC should be the NEMC as this current is active in eddy generation sites (Comoros Basin and middle MC) where exhibits significant barotropic instabilities and baroclinic instabilities (Figures 11, 13). The southern branch of NEMC in the western Comoros Basin shows instability with velocities ranging from 0 to 0.9 m/s (Figure 10). In some cases, it can even intrude into the middle MC when its intensity is sufficient (Figure 12). Therefore, the instabilities of NEMC play a crucial role in mesoscale eddy formation within the MC. Furthermore, the primary internal oceanic instability in the MC region is attributed to barotropic instability, which surpasses baroclinic instabilities in magnitude, aligning with previous studies by Biastoch and Krauss (1999) and Collins et al. (2014) (Figures 11, 13). In the western Comoros Basin, the southward branch of the NEMC and its countercurrent exhibit significant horizontal velocity shear and thus enhanced barotropic instability (Figure 10). However, it is unknow the mechanisms underlying barotropic instability in the middle MC.
Furthermore, it was found that the southward branch of NEMC plays a crucial role in transporting mesoscale eddies from the Comoros Basin to the middle MC (Figure 9). The transported mesoscale eddies could also be observed in the first two EOFs of the velocity perpendicular to the cross-section at the narrowest part of the MC (Harlander et al., 2009; van der Werf et al., 2010), which exhibits opposite velocity structures, indicating the coexistence of anticyclonic and cyclonic eddies. Mesoscale eddies transported by the NEMC southward branch are much faster than those moving independently southward (Figure 9). This finding is consistent with Schouten et al. (2003), which reported that the moving speed of eddies north of 18°S is higher than that between 18°S and 21°S. The difference in speed may facilitate the convergence of mesoscale eddies north of 18°S with those located between 18°S and 21°S, and subsequently resulting in the formation of dipole eddies.
5 Summary
This study examined the distribution and generation of mesoscale eddies in the MC based on composite data of in situ measurements, satellite observations, and model outputs. Cyclonic eddies and dipole eddies are more active in the western MC, similar to anticyclonic eddies. Mesoscale eddies exhibit a highest frequency of occurrence in the middle MC, with an average of nine events per year. The highest frequency of dipole eddies also occurs in this region, with approximately two occurrences annually. Dipole eddies are more prevalent in the MC and exhibit larger dimensions and shorter lifespans compared to anticyclonic and cyclonic eddies. The Comoros Basin and the eastern middle MC are two generation sites for mesoscale eddies in the MC. The generation of eddies in these two regions is primarily driven by barotropic instability. The utilization of mesoscale eddy statistics has proven valuable in enhancing the comprehension of mesoscale eddies within a specific region. Further refinement of these statistical measures is anticipated to enhance our understanding of mesoscale eddies across diverse global regions.
Data availability statement
The datasets presented in this study can be found in online repositories. The names of the repository/repositories and accession number(s) can be found below: https://www.scidb.cn/s/aIfiie.
Author contributions
TH: Writing – original draft, Writing – review & editing. FZ: Project administration, Resources, Writing – review & editing. XM: Writing – review & editing. DZ: Data curation, Writing – review & editing. YT: Data curation, Writing – review & editing. YM: Data curation, Writing – review & editing. AR: Data curation, Writing – review & editing. RD: Writing – review & editing. JM: Data curation, Writing – review & editing. RY: Writing – review & editing. DH: Writing – review & editing.
Funding
The author(s) declare financial support was received for the research, authorship, and/or publication of this article. This study was supported by the Joint Advanced Marine and Ecological Studies (JAMES) project of the Global Change and Air–Sea Interaction II Program (Grant Nos. GASI-01-EIND-STwin and GASI-04-WLHY-03), Scientific Research Fund of the Second Institute of Oceanography, Ministry of Natural Resources (No. SZ1901), China Oceanic Development Foundation (Grant No. GJ0219304), Zhejiang Provincial Ten Thousand Talents Program (Grant No. 2020R52038), and a Project of the State Key Laboratory of Satellite Ocean Environment Dynamics (Grant No. SOEDZZ1702).
Conflict of interest
The authors declare that the research was conducted in the absence of any commercial or financial relationships that could be construed as a potential conflict of interest.
Publisher’s note
All claims expressed in this article are solely those of the authors and do not necessarily represent those of their affiliated organizations, or those of the publisher, the editors and the reviewers. Any product that may be evaluated in this article, or claim that may be made by its manufacturer, is not guaranteed or endorsed by the publisher.
References
Ambe D., Imawaki S., Uchida H., Ichikawa K. (2004). Estimating the Kuroshio axis south of Japan using combination of satellite altimetry and drifting buoys. J. Oceanography 60, 375–382. doi: 10.1023/B:JOCE.0000038343.31468.fe
Backeberg B. C., Reason C. J. C. (2010). A connection between the South Equatorial Current north of Madagascar and Mozambique Channel Eddies. Geophysical Res. Lett. 37, L04604. doi: 10.1029/2009GL041950
Beal L. M., Ruijter W. P. M. D., Biastoch A., Zahn R. (2011). On the role of the Agulhas System in ocean circulation and climate. Nature 472, 429–436. doi: 10.1038/nature09983
Biastoch A., Krauss W. (1999). The role of mesoscale eddies in the source regions of the Agulhas Current. J. Phys. Oceanography (d) 29, 2303–2317. doi: 10.1175/1520-0485(1999)029<2303:TROMEI>2.0.CO;2
Biastoch A., Lutjeharms J. R. E., Böning C. W., Scheinert M. (2008). Mesoscale perturbations control inter-ocean exchange south of Africa. Geophysical Res. Lett. 35, L20602. doi: 10.1029/2008GL035132
Bleck R. (2002). An oceanic general circulation model framed in hybrid isopycnic-Cartesian coordinates. Ocean Model. 4, 55–88. doi: 10.1016/S1463-5003(01)00012-9
Böning C. W., Budich R. G. (1992). Eddy dynamics in a primitive equation model—Sensitivity to horizontal resolution and friction. J. Phys. Oceanography 22, 361–381. doi: 10.1175/1520-0485
Collins C., Hermes J. C., Reason C. J. C. (2014). Mesoscale activity in the Comoros Basin from satellite altimetry and a high-resolution ocean circulation model. J. Geophysical Research: Oceans 119, 4745–4760. doi: 10.1002/2014JC010008
De Ruijter W. P. M., Biastoch A., Drijfhout S. S., Lutjeharms J. R. E., Matano R. P., Pichevin T., et al. (1999). Indian-Atlantic interocean exchange: dynamics, estimation and impact. J. Geophysical Research: Atmospheres. 104, 20885–20910. doi: 10.1029/1998JC900099
De Ruijter W. P. M., Ridderinkhof H., Lutjeharms J. R. E., Schouten M. W., Veth C. (2002). Observations of the flow in the Mozambique channel. Geophysical Res. Lett. 29, 140–1-140-3. doi: 10.1029/2001GL013714
Di Marco S. F., Chapman P., Nowlin W. D. Jr., Hacker P., Donohue K., Luther M., et al. (2002). Volume transport and property distributions of the Mozambique Channel. Deep Sea Res. Part II: Topical Stud. Oceanography 49, 1481–1511. doi: 10.1016/S0967-0645(01)00159-X
Dong D., Brandt P., Chang P., Yang X., Yan J., Zeng J. (2017). Mesoscale eddies in the NorthwesternPacific Ocean: Three-dimensional eddystructures and heat/salt transports. J. Geophysical Research: Oceans 122, 9795–9813. doi: 10.1002/2017JC0133
Fu L., Chelton D. B., LeTraon P. Y., Morrow R. (2010). Eddy dynamics from satellite altimetry. Oceanography 23, 14–25. doi: 10.5670/oceanog.2010.02
Halo I., Backeberg B., Penven P., Ansorge I., Reason C., Ullgren J. E. (2014). Eddy properties in the Mozambique Channel: A comparison between observations and two numerical ocean circulation models. Deep Sea Res. Part II: Topical Stud. Oceanography 100, 38–53. doi: 10.1016/j.dsr2.2013.10.015
Hancke L., Roberts M. J., Ternon J. F. (2014). Surface drifter trajectories highlight flow pathways in the Mozambique Channel. Deep Sea Res. Part II: Topical Stud. Oceanography 100, 27–37. doi: 10.1016/j.dsr2.2013.10.014
Harlander U., Ridderinkhof H., Schouten M. W., De Ruijter W. P. M. D. (2009). Long-term observations of transport, eddies, and Rossby waves in the Mozambique Channel. J. Geophysical Research: Oceans 114, C02003. doi: 10.1029/2008JC004846
José Y. S., Aumont O., Machu E., Penven P., Moloney C. L., Maury O. (2014). Influence of mesoscale eddies on biological production in the Mozambique Channel: Several contrasted examples from a coupled ocean-biogeochemistry model. Deep Sea Res. Part II: Topical Stud. Oceanography 100, 79–93. doi: 10.1016/j.dsr2.2013.10.018
Kolasinski J., Kaehler S., Jaquemet S. (2012). Distribution and sources of particulate organic matter in a mesoscale eddy dipole in the Mozambique Channel (south-western Indian Ocean): Insight from C and N stable isotopes. J. Mar. Syst. 96-97, 122–131. doi: 10.1016/j.jmarsys.2012.02.015
LaCasce J., Isachsen P. (2007). On Sverdrup discontinuities and vortices in the southwest Indian Ocean. J. Phys. Oceanography. 37, 2940–2950. doi: 10.1175/2007JPO3652.1
Lamont T., Barlow R. G. (2017). Contrasting hydrography and phytoplankton distribution in the upper layers of cyclonic eddies in the Mozambique Basin and Mozambique Channel. Afr. J. Mar. Sci. 39, 293–306. doi: 10.2989/1814232X.2017.1367722
Malauene B. S., Shillington F. A., Roberts M. J., Moloney C. L. (2014). Cool, elevated chlorophyll-a waters off northern Mozambique. Deep Sea Res. Part II: Topical Stud. Oceanography 100, 68–78. doi: 10.1016/j.dsr2.2013.10.017
Palastanga V., van Leeuwen P. J., de Ruijter W. P. M. (2006). A link between low-frequency mesoscale eddy variability around Madagascar and the large-scale Indian Ocean variability. J. Geophysical Res. 111, C09029. doi: 10.1029/2005JC003081
Penven P., Halo I., Pous S., Marié L. (2014). Cyclogeostrophic balance in the Mozambique channel. J. Geophysical Research: Oceans 119, 1054–1067. doi: 10.1002/2013JC009528
Penven P., Lutjeharms J. R.E., Florenchie P. (2006). Madagascar: A pacemaker for the Agulhas Current system? Geophysical Research Letters 33, L17609. doi: 10.1029/2006GL026854
Quadfasel D. R., Swallow J. C. (1986). Evidence for 50-day period planetary waves in the South Equatorial Current of the Indian Ocean. Deep Sea Res. Part I: Oceanographic Res. Papers 33, 1307–1312. doi: 10.1016/0198-0149(86)90037-3
Quartly G. D., de Cuevas B. A., Coward A. C. (2013). Mozambique Channel eddies in GCMs: A question of resolution and slippage. Ocean Model. 63, 56–67. doi: 10.1016/j.ocemod.2012.12.011
Quartly G. D., Srokosz M. A. (2004). Eddies in the southern Mozambique channel. Deep Sea Res. Part II: Topical Stud. Oceanography 51, 69–83. doi: 10.1016/j.dsr2.2003.03.001
Reason C. J. C., Lutjeharms J. R. E., Hermes J., Biastoch A., Roman R. (2003). Inter-ocean fluxes south of Africa in an eddy-permitting model. Deep Sea Res. Part II: Topical Stud. Oceanography 50, 281–298. doi: 10.1016/S0967-0645(02)00385-5
Ridderinkhof H., De Ruijter W. P. M. (2003). Moored current observations in the Mozambique Channel. Deep-Sea Res. Part II: Topical Stud. Oceanography 50, 1933–1955. doi: 10.1016/S0967-0645(03)00041-9
Ridderinkhof H., van der Werf P. M., Ullgren J. E., van Aken H. M., van Leeuwen P. J., De Ruijter W. P. M. (2010). Seasonal and interannual variability in the Mozambique Channel from moored current observations. J. Geophysical Research: Oceans 115, C06010. doi: 10.1029/2009JC005619
Roberts M. J., Ternon J., Morris T. (2014). Interaction of dipole eddies with the western continental slope of the Mozambique Channel. Deep Sea Res. Part II: Topical Stud. Oceanography 100, 54–67. doi: 10.1016/j.dsr2.2013.10.016
Sandalyuk N. V., Bosse A., Belonenko T. V. (2020). The 3-Dstructure of mesoscale eddies in the Lofoten Basin of the Norwegian Sea: Acomposite analysis from altimetry and in situ data. J. Geophysical Research: Oceans 125, e2020JC016331. doi: 10.1029/2020JC01633
Schlax M. G., Chelton D. B. (2016). The “Growing Method" of eddy identification and tracking in two and three dimensions (Corvallis, Oregon: College of Earth, Ocean and Atmospheric Sciences, Oregon State University). Available at: https://www.aviso.altimetry.fr/fileadmin/documents/data/products/value-added/Schlax_Chelton_2016.pdf.
Schott F. A., McCreary J. P. (2001). The monsoon circulation of the Indian Ocean. Prog. Oceanography 51, 1–123. doi: 10.1016/S0079-6611(01)00083-0
Schouten M. W., De Ruijter W. P. M., van Leeuwen P. J. (2002). Upstream control of Agulhas Ring shedding. J. Geophysical Research: Oceans 107, 3109. doi: 10.1029/2001JC000804
Schouten M. W., De Ruijter W. P. M., van Leeuwen P. J., Ridderinkhof H. (2003). Eddies and variability in the Mozambique channel. Deep Sea Res. Part II: Topical Stud. Oceanography 50, 1987–2003. doi: 10.1016/S0967-0645(03)00042-0
Swart N. C., Lutjeharms J. R. E., Ridderinkhof H., de Ruijter W. P. M. (2010). Observed characteristics of Mozambique Channel eddies. J. Geophysical Res. 115, C09006. doi: 10.1029/2009JC005875
Ternon J. F., Roberts M. J., Morris T., Hancke L., Backeberg B. (2014). In situ measured current structures of the eddy field in the Mozambique Channel. Deep Sea Res. Part II: Topical Stud. Oceanography 100, 10–26. doi: 10.1016/j.dsr2.2013.10.013
Tew-Kai E., Marsac F. (2009). Patterns of variability of sea surface chlorophyll in the Mozambique Channel: A quantitative approach. J. Mar. Syst. 77, 77–88. doi: 10.1016/j.jmarsys.2008.11.007
Ullgren J. E., van Aken H. M., Ridderinkhof H., de Ruijter W. P. M. (2012). The hydrography of the Mozambique Channel from six years of continuous temperature, salinity, and velocity observations. Deep Sea Res. Part I: Oceanographic Res. Papers 69, 36–50. doi: 10.1016/j.dsr.2012.07.003
van der Werf P. M., van Leeuwen P. J., Ridderinkhof H., de Ruijter W. P. M. (2010). Comparison between observations and models of the Mozambique Channel transport: seasonal cycle and eddy frequencies. J. Geophysical Res. 115, C02002. doi: 10.1029/2009JC005633
Keywords: mesoscale eddies, dipole eddies, Mozambique Channel, Eddy generation, NEMC
Citation: Huang T, Zhou F, Ma X, Zeng D, Tang Y, Ma Y, Raul AE, Ding R, Mafuca JM, Ye R and Huang D (2024) Characteristics and generation mechanisms of anticyclonic eddies, cyclonic eddies and dipole eddies in the Mozambique Channel. Front. Mar. Sci. 11:1375367. doi: 10.3389/fmars.2024.1375367
Received: 23 January 2024; Accepted: 15 March 2024;
Published: 01 May 2024.
Edited by:
Francisco Machín, University of Las Palmas de Gran Canaria, SpainReviewed by:
Marcelo Dottori, Instituto Oceanográfico da Universidade de São Paulo, BrazilDavid Alberto Salas Salas De León, National Autonomous University of Mexico, Mexico
Ren Qiang, Chinese Academy of Sciences (CAS), China
Copyright © 2024 Huang, Zhou, Ma, Zeng, Tang, Ma, Raul, Ding, Mafuca, Ye and Huang. This is an open-access article distributed under the terms of the Creative Commons Attribution License (CC BY). The use, distribution or reproduction in other forums is permitted, provided the original author(s) and the copyright owner(s) are credited and that the original publication in this journal is cited, in accordance with accepted academic practice. No use, distribution or reproduction is permitted which does not comply with these terms.
*Correspondence: Feng Zhou, emhvdWZlbmdAc2lvLm9yZy5jbg==