 Jin Li
 Ya Ping Wang
 Shu Gao
- 1Ministry of Education Key Laboratory for Coast and Island Development, School of Geographic and Oceanic Sciences, Nanjing University, Nanjing, Jiangsu, China
- 2State Key Laboratory of Estuarine and Coastal Research, School of Marine Sciences, East China Normal University, Shanghai, China
Waves and currents are responsible for sediment movement around and off coral reefs, affecting reef growth at both geological and modern timescales. Given the wide distribution and limited hydrodynamic information of reefs in the South China Sea, we carried out observations on tidal-cycle hydrodynamics in the Nansha Islands with tripod stationary instruments on the seafloor in order to fill the gap in our understanding of these processes. It was found that the magnitudes of near-bed orbital velocity were comparable with that of the mean tidal current, despite generally calm wave conditions. Waves dominated the combined wave-current skin-friction shear velocities acting on reef sediment, which were significantly higher than those generated by currents alone. Due to the large physical roughness of reef, drag coefficient and hydrodynamic roughness length estimated from logarithmic velocity profiles were two orders of magnitude higher than that in macro-tidal-estuary or inner shelf areas covered with siliceous muds or sands. The combined sinusoidal wave and asymmetric tidal current, along with the physical reef roughness, shaped velocity profile structures in the bottom boundary layer, which exhibited a logarithmic profile during the flood tide and a potential flow during the ebb. In absence of wave breaking, strong turbulence dissipation was observed across the rough reef, promoting strong mixing of water, which is crucial for delivering nutrients for coral growth. These findings imply the need to consider the unique characteristics of rough reef structure and combined effects of waves and currents to model the hydrodynamics in reef environment correctly. This understanding is critical for predicting energy and material transport in reef environments, which is essential for maintaining healthy coral ecosystems, and opens new paths for managing and preserving coral reefs in the face of environmental change.
1 Introduction
Although coral reefs occupy less than 1% of the total seabed area globally, they play a crucial role by providing habitat and resources for nearly a quarter of marine species and over four hundred million people with their rich biodiversity and high productivity (Pandolfi et al., 2011). Reef accretion reflects a balance between the constructive processes of framework building coral and other carbonate producers’ growth, and the destructive processes of bioerosion and mechanical wave abrasion and transport (Toomey et al., 2013; Woodroffe and Webster, 2014). Sediment is produced mainly on the fore reef and reef flat and then transported across the reef by hydrodynamic processes either to the beach or oceanward to the outside ocean. The transported sediment can be deposited in the inner part of reef flat (Harney and Fletcher, 2003; Storlazzi et al., 2009) and back reef sand apron (Harris et al., 2014), into lagoons at the atoll center (Kennedy and Woodroffe, 2002), or exported via reef channels offshore (Pomeroy et al., 2018).
Previous studies elsewhere of hydrodynamics across coral reefs mainly focused on the hydrodynamic and morphodynamic processes on fore reefs and reef flats (usually 0-2 m within mean low tide), and subaerial reef islands (<5 m above mean sea level), with an emphasis on sea-swell wave transformation and breaking in shallow waters (Kench and Brander, 2006; Masselink et al., 2019; Ortiz and Ashton, 2019). Due to the shallow reef morphology and reef community canopy structure that create large bottom roughness, incident sea-swell waves transform and break on the fore-reef slope and at the reef crest, dissipating wave energy vigorously while generating infragravity waves and mean wave-driven currents, based on observations across many reef systems in the Pacific and Indian Ocean (Lowe et al., 2005; Lowe and Falter, 2015; Davis et al., 2021). Both the infragravity waves and smaller incident sea-swell waves that do not break in the surf zone propagate shoreward across the reef flat (Pomeroy et al., 2012; Monismith et al., 2013). The wave energy partition between high-frequency (sea-swell wave, short-to-medium period of 5-25 s) and low-frequency (infragravity wave, long period of 25-250 s) wave bands results in a distinct bimodal spectrum of wave conditions on many reef flats (Hardy and Young, 1996; Van Dongeren et al., 2013).
Cross-reef mean currents are generated by wave setup that is induced by the radiation stress spatial gradients (Longuet-Higgins and Stewart, 1964) as the incident sea-swell waves break in the surf zone (Symonds et al., 1995; Hench et al., 2008; Lowe et al., 2009). The magnitudes of cross-reef mean currents and the proportion between sea-swell and infragravity wave energy also change with fore-reef slope, reef flat width, water depth, and reef bottom roughness (Symonds et al., 1995; Hearn, 1999; Gourlay and Colleter, 2005). The distinct bimodal spectral wave that is composed of sea-swell and infragravity waves, mean flow conditions, sediment availability and grain size determine the magnitude and direction of sediment transport and ripple migration rate (Cuttler et al., 2018; Rosenberger et al., 2020), and suspended sediment concentration and flux (Pomeroy et al., 2018, Pomeroy et al., 2021). Other morphologic influences of hydrodynamics on reef development include sediment-driven abrasion of corals (Storlazzi et al., 2005; Bramante et al., 2020), interruption of coral polyps’ recruitment and settlement thus the initiation of reef-building since submergence of the basement in the deglaciation (Montaggioni, 2005), as well as the nutrient uptake of coral colonies through mass transfer that is dependent on wave frictional dissipation (Falter et al., 2004; Monismith, 2007).
In the South China Sea, extensive atolls——circular coral reef as characterized by central lagoons and one of the three major reef types alongside fringing reefs and barrier reefs——as well as a vast array of underwater reef banks, collectively constitute approximately 15% of the global atoll area, which mainly distribute in the Xisha, Zhongsha and Nansha Islands (Figure 1). Among these, the Nansha Islands are the largest atoll archipelago. A large portion of the atoll rims here remain as deep as 5-20 m below sea level, in contrast to typical atolls in the Pacific and Indian Ocean whose rims, or reef flats, have grown up 0-2 m below sea level and often contain reef islands (Purdy and Gischler, 2005; Kench et al., 2014). These deep-seated reef flats are commonly covered by patchy reefs of living coral colonies with reef rubble and fragments covering the remnant seabed, indicating an active instead of relict reef. The deep-seated flats are supposed as the counterpart of the inner shelf, which is defined as a region from the seaward of outer break point, i.e. the seaward boundary of the surf zone, ranging from roughly 2 to 3 m depth to approximately 20 to 30 m depth, which is the deep-water limit of significant wave and current effect [e.g (Scandura and Foti, 2011)]. During severe coastal storms some material removed from the silicate beach is carried offshore and deposited on the inner shelf in depths at which, the material is not resuspended under normal wave conditions. Yet, direct observational information on hydrodynamics in reef environment in the South China Sea, particularly on these deep-seated reef flats, is severely limited.
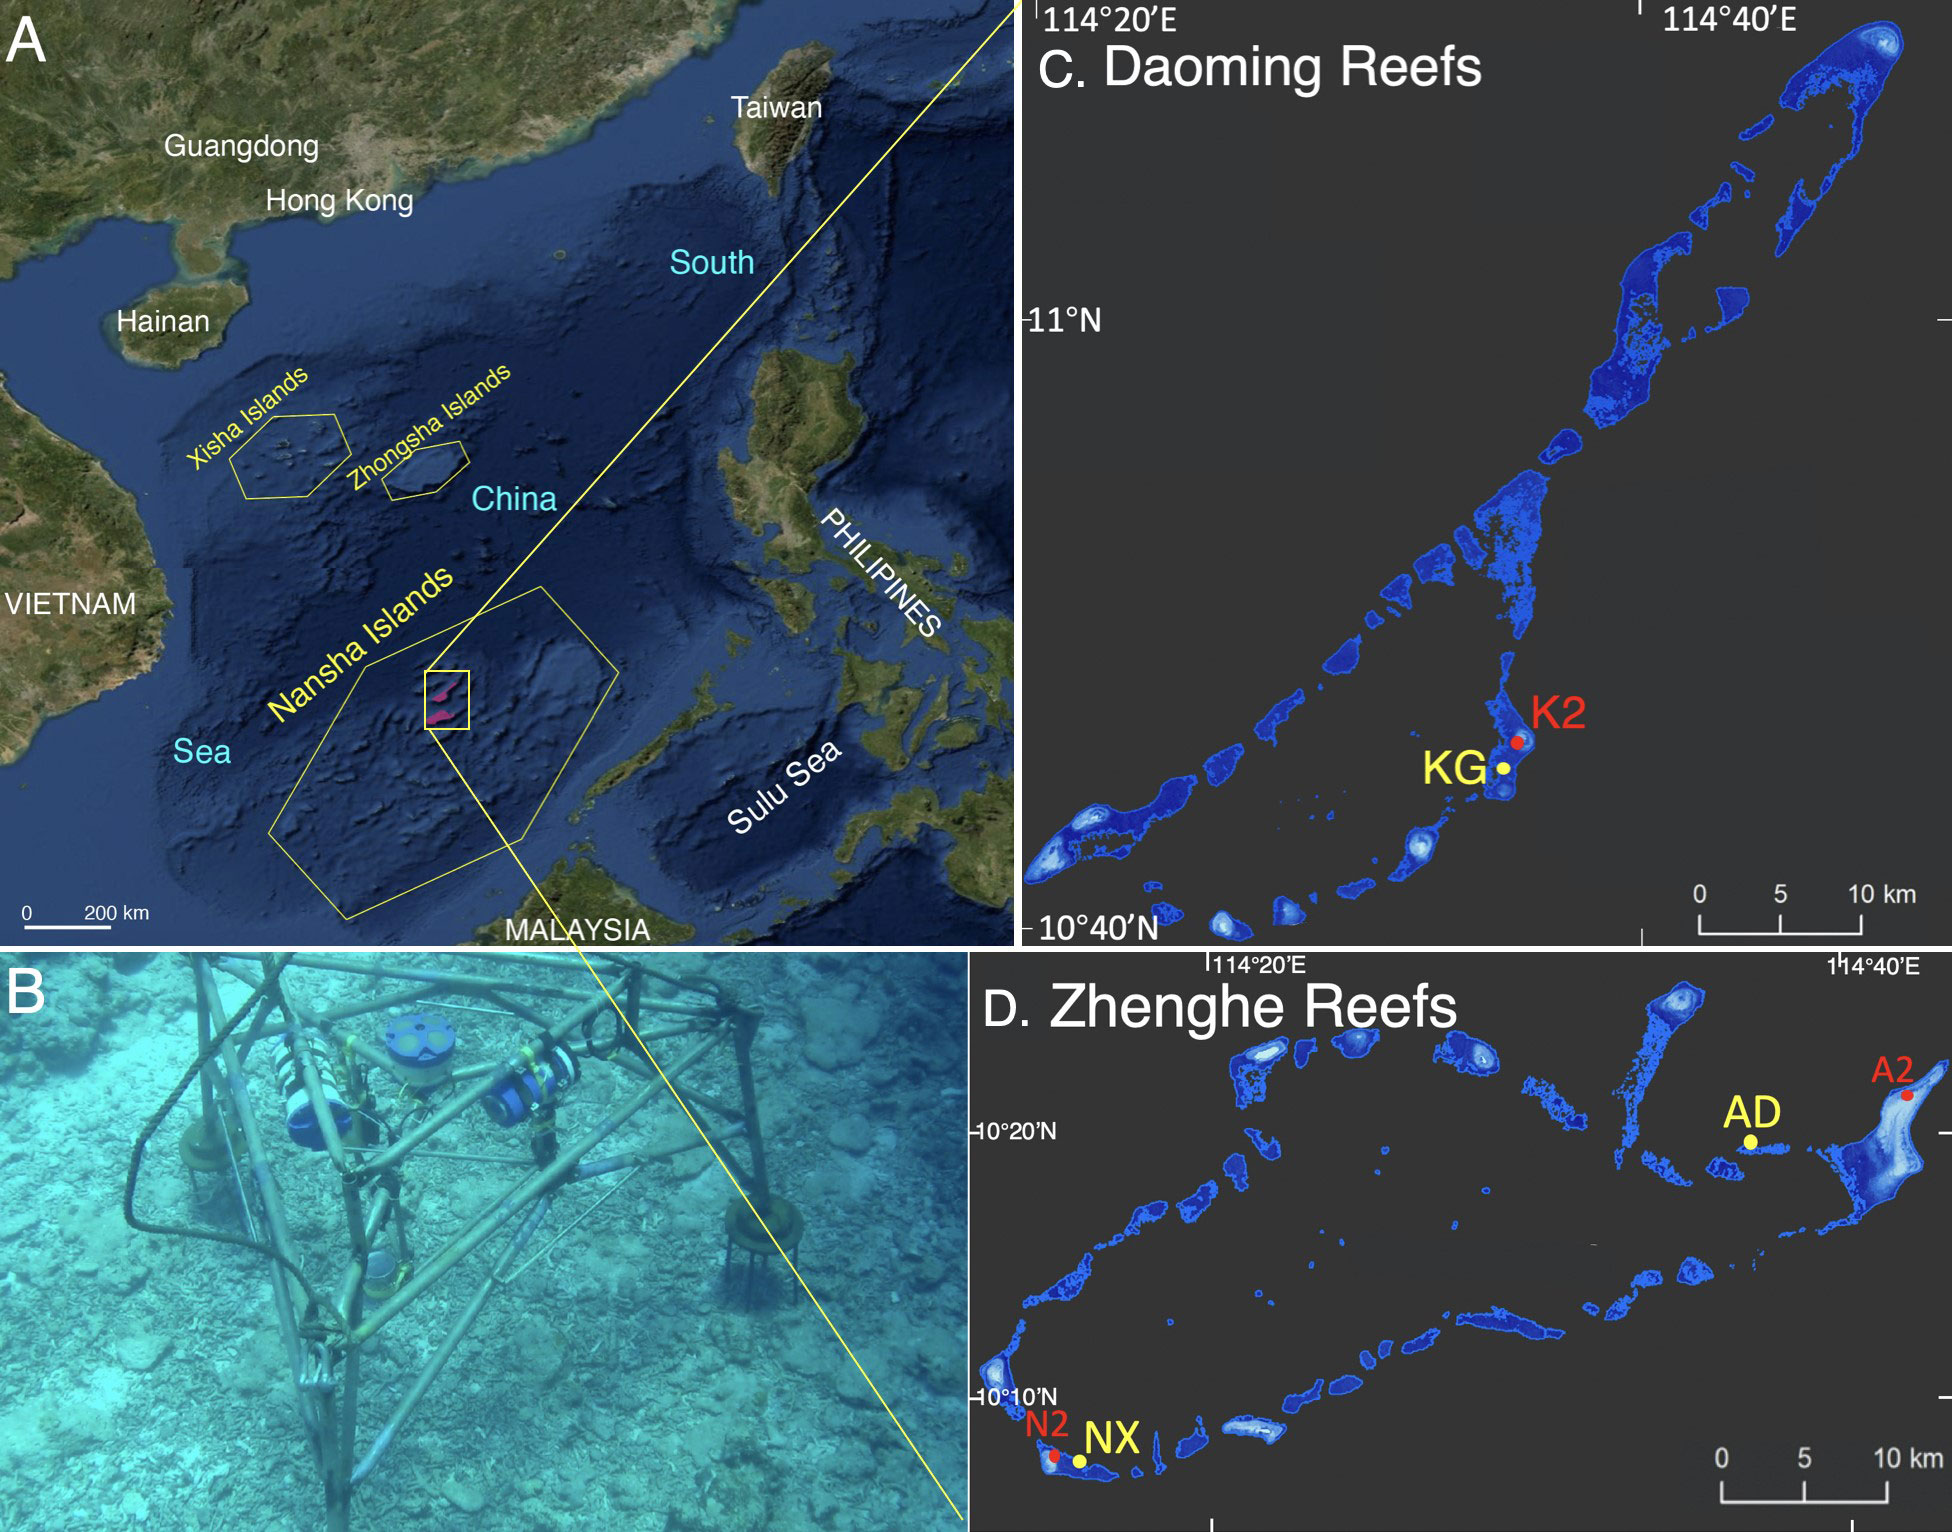
Figure 1 Satellite image (from the website earthexplorer.usgs) of: (A) atolls and submerged reef banks distribution in the South China Sea, mainly in the Zhongsha, Xisha and Nansha Islands, as outlined by yellow polygons (the two large reef groups in the northern part of Nansha Islands that are involved in the study are shaded by pink colors and outlined by yellow rectangular box: from north to south are the Daoming Reefs and Zhenghe Reefs); (B) Underwater photo of the instrumented bottom mounted tripod at site AD in the Anda Reef, Zhenghe Reefs. (C) study site KG in the Kugui Reef, Daoming Reefs; and (D) site NX in the Xiaonanxun Reef and site AD in the Anda Reef, Zhenghe Reefs, where in situ mooring hydrodynamic observation and sediment sample collections were conducted in this study, as denoted by yellow and red dots in the panels. These figures are modified from (Dong et al., 2019), where the frequency of coral reefs from high to low values is displayed as a color gradient (from light-blue to dark-blue) in order to depict the actual variation of the bathymetry; the dark blue boundaries surrounding the coral reefs represent the extent of maximum inundation.
In this study, the central focus is to present wave and current conditions under normal weathers on atolls in the South China Sea, based on in situ hydrodynamic measurements for one to one and a half tidal cycle on three typical deep-seated flats of 15-18 m depth in the northern part of the Nansha Islands. Frictional forces exerted by the fluid and consequent bed shear velocities on coral colonies and sediment particles, which are important to coral growth and mobilize sediment, respectively, were calculated. In the remaining of the paper, we describe the study sites and the sedimentary and hydrodynamic settings of atolls in the Nansha Islands (section 2), methods of data collection (section 3) and data processing and analysis (section 4). The results are presented in section 5. A discussion of the findings and final conclusion are presented in sections 6 and 7.
2 The study area
2.1 Sedimentary features of atolls in the Nansha Islands
Hydrodynamic observations were conducted in this study on reef flats of Kugui Reef, Xiaonanxun Reef, and Anda Reef, which belong to the Daoming Reefs and Zhenghe Reefs, respectively——the two typical atoll groups in the northern part of the Nansha Islands (Figures 1B, C). In contrast to the typical atolls in the Indo-Pacific province that are commonly developed on the volcanic basement (Oceanic crust), the bulk of atoll deposition in the Nansha and Xisha Islands develop mainly on the basis of continental slope. The karst cave and freshwater layers within the cores indicate the multiple periodic exposures of the atolls to the air (Zeng, 1984). Atolls in the Nansha Islands are generally ellipse-shaped with a longer axis extending in the southwest- northeast (SW-NE) direction and a wider southwest reef platform than the northeast platform. Possible explanations for such features include the tectonic-driven, which stated that the structural line in the SW-NE direction determined the SW-NE basal structure underlying the atolls. The other hypothesis suggested that monsoon circulation: NE and SW monsoons blow alternatively in winter and summer over the South China Sea, promoting the atolls extension in SW-NE direction to form a series of parallel rows of ellipse-shaped atolls in the region (Zeng, 1984).
Although reef-building corals comprise of the skeleton of the modern coral reefs in the Nansha Islands, the bulk deposition of atolls, or the frame supporting the whole reef, are dominated by coral skeletal rubble, gravel, and rudstone as well as crustose coralline algae, which account for over 60% of the uncemented Holocene reef deposition, as revealed by the two cores drilled on the Yongshu Reef in the Nansha Islands (Zhao et al., 1992, Zhao et al., 1999). This is consistent with the prominent contribution of reef detritus over the in situ stony corals to the total volume in the 53 cores as compiled by Montaggioni (2005) out of the 684 available drilled-cores on the Indo-Pacific reefs.
2.2 Physical oceanographic settings
2.2.1 Tide and tidal dynamics
Based on the observation of current and wind by multidisciplinary oceanographic expeditions over the past decades, tide in the Yongshu Reef (the best-studied reef that serve as a representative for reefs in the Nansha Islands and the whole South China Sea) (Zhu et al., 2005) is characterized by irregular diurnal tide, which is composed of a primary diurnal tide K1 and O1 and a secondary semi-diurnal tide M2. The tidal characteristic index equals to 3.5. The maximum tide range varies from 196 cm in July to 126 cm in September. The observed current velocity is marked as irregular diurnal tidal current that exhibits a high variability from 1 cm/s to the maximum current velocity of 75 cm/s in the observation. With the increase of water depth, the diurnal tidal current decreases. At the Yongshu Reef, the major axis of K1 diurnal constituent current ellipse is more obvious and located along the directions of NW and SE. The major diurnal constituent currents rotate clockwise whereas the major semi-diurnal constituent currents rotate counterclockwise. The residual currents turn out to be stable at about 10 cm/s in spring, although the result might be limited by observation duration (Zhu et al., 2005).
More details about tide that is closest to the three reefs in the Nansha Islands in this study were derived from the modeling study of tidal processes in the South China Sea by Zu et al. (2008). Their results indicate that the amplitude of the semi-diurnal tide M2 decreases, while the amplitude of the diurnal tide K1 increases, with the tidal waves propagating southwestward along the axis of the South China Sea basin from the western Pacific into the South China Sea through the Luzon Strait. The M2 amplitude is calculated as ca. 0.2 m and K1 amplitude ca. 0.4 m in the region of Nansha Islands. Such an energy dissipation difference is attributed to the bottom topography of the basin, which favors the transmission of K1 yet impedes the M2 propagation, although both M2 and K1 tidal energies are dissipated by the sharply varied bottom topography in the Luzon Strait. Strong M2 tidal dissipation also occurs in the Taiwan Strait. The work rate is negative for M2 while being positive for K1 from the tidal generating force in the South China Sea basin (Zu et al., 2008).
2.2.2 Wind, wind wave and storm characteristics
The climate of whole South China Sea is dominated by the East Asian Monsoon, plus the influence of some synoptic systems such as fronts and tropical cyclones (Chu et al., 1999, Chu et al., 2000). As a result, the regional hydrodynamics along with physical oceanographic features such as sea surface temperature and salinity in the upper water exhibits significantly seasonal variabilities. From November to April, the NE winter monsoon winds prevail this region with larger intensity and longer duration (monthly mean wind speeds of nearly 10 m/s for January 2000) than the SW summer monsoon that blows from May to August (monthly mean wind speeds of approximate 8 m/s at 10 m above mean sea level in the southern South China Sea and 4 m/s in the northern part for July 2000). The monthly mean winds are typical for monsoon winds, although synoptic systems often pass by the region and cause temporally and spatially varying wind fields. Monthly mean significant wave heights all over the South China Sea are ca. 2 m in winter (January, 2000) and 1-1.5 m in summer (July, 2000) based on the TOPEX/Poseidon satellite data. Wind-wave models have been implemented to simulate and study in-depth the wind-wave characteristics in the South China Sea (e.g. Wavewatch-III, a full-spectral ocean wind-wave model by Chu et al. (2004)).
In situ observations from 1999 to 2008 at the Yongshu Reef hydrological-meteorological station reveal four characteristic periods of wave dynamics in the area of Nansha Islands, including NE wave stage (November to mid-March in the next year; winter), SW wave stage (late-May to September; summer), and the two transitional stages between them (Li and Zhao, 2010). The highest wave appears in December within the “NE wave stage” and the secondary highest wave in July and August. Wave heights in the transitional stages are lowest and usually in April and October. This monthly distribution of wave heights corresponds to the fact that typhoon occurs most frequently from November to January in the next year as well as August in the South China Sea (Li and Zhao, 2010). According to the 22-year wave observation data in the Yongshu Reef (1988 –2009), storms, mainly typhoons, or intensified tropical cyclone hit the Nansha Islands 2.2 times and each tropical cyclone lasted for two days in average each year (Wang et al., 2012).
3 Field observation
This study is focused on the deep-seated reef flats in water depths greater than 10 m, where the seafloor is covered by loose calcareous sediments and coral reef structures. We deployed three separate tripod mooring observations on Daoming and Zhenghe Reefs in order to maintain spatial representation of stations on, i.e., the southeast part of Xiaonanxun Reef, southwest of Anda Reef and southwest of Kugui Reef (sites NX, AD and KG) in approximately 16 - 18 m depth in September, 2017 (Figure 1). A 6 MHz Nortek Vector ADV (made by Nortek company, Norway) was installed at approximately 0.4-0.7 m above seabed to measure the near-bottom current velocity. ADV burst duration was 10 min and sampling frequency was 16 Hz, i.e., 8192 data points per burst. An acoustic Doppler current profiler (ADCP, 1,200 kHz, made by TRDI company, the US) was uplooking installed at 1.5-1.7 m above seabed to derive the current velocity profile. The ADCP burst duration was 1 min and sampling frequency was 2 Hz with a vertical resolution (bin size) of 0.25 m. Time series of turbidity, temperature, and salinity were obtained at ca. 1 m above the bed utilizing SD204 (made by SAIV A/S company, Norway) with a burst duration of 1 min and sampling frequency of 1 Hz. Details of the field experiment instrumentation for each site was explicated in Table 1.
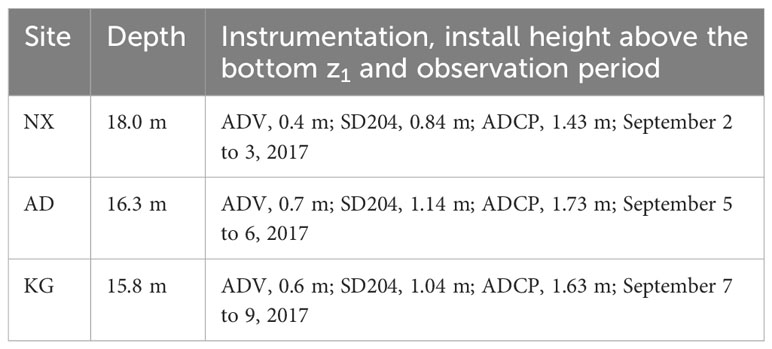
Table 1 Experiment instrumentations.
Water turbidity data throughout the water column was also collected hourly with a profiling system that consists of a nephelometer (OBS-3A, made by D&A Instrument Company). The profiling data were augmented with water samples (approximately 2 L) collected hourly from 3 layers (surface, middle and bottom) within the water column.
Six representative reef sediment samples were collected on the sites of hydrodynamic observations and 0-2 m shallow reef flats of Xiaonanxun Reef, Anda Reef and Kugui Reef (Figures 1B, C). Grain size analysis was performed with the sonic vibrating automatic screening granulometer (Type SFY-D, a product made by Nanjing Institute of Geography and Limnology, Chinese Academy of Sciences, China).
4 Data processing and analysis
4.1 Wave parameters estimation
Based on the linear wave theory, the high-frequency pressure spectrum recorded by ADV is converted to surface wave spectrum with Equation 1 (Gordon and Lohrmann, 2002).
where Sη(f) refers to the spectral density of water surface elevation η, Sp(f) refers to the density of water pressure spectrum, both of which are a function of wave frequency f, k is wave number (k=2π/L, L is wave length), h referrs to water depth and z1 represented the depth of ADV pressure sensor.
Assuming surface-wave height – the mean wave height of the highest third of waves within each ADV burst when arranging the time series of wave heights in descending order (Longuet-Higgins, 1963; Dean and Dalrymple, 1991) – generally followed a Rayleigh distribution, significant wave height (HS) is calculated by Equation 2:
where the summation is taken over frequency bins (0.04-0.2 Hz) of sea-swell waves in the surface water elevation spectrum Sη.
Following Wiberg and Sherwood (2008), a representative bottom orbital velocity (ubr) is estimated from the near-bed current velocity measurements and spectra by ADV. The spectra Suu and Svv, for the u and v components of velocity are estimated using the Welch method (Press et al., 1992); ubr is calculated as the summation of contributions from each frequency component (Suv,i=Su,i+Sv,i) that ranged from 0.04 to 0.2 hertz, which is the dominating range of swell wave motions in the near-bed velocity spectrum with Equation 3:
It should be noted that the near-bottom velocities recorded by ADV are a combination of a variety of water motions ranging from low frequencies (tides, wind-driven currents, shelf waves) to very high frequencies (turbulence). Despite the necessity to remove turbulence influence from this algorithm by energy spectrum analysis (Soulsby and Humphery, 1990; Zhu et al., 2016), the influence of turbulence is not eliminated completely due to the limitation of analyze methods, because of the coincidence of turbulence and wave frequencies to a certain extent (Bricker and Monismith, 2007).
4.2 Bottom shear velocities estimation
The near-bed Reynolds shear velocity is derived from ADV records with Equation 4
where and are the fluctuating parts of the mainstream horizontal velocity component and the vertical velocity component , respectively. The overbar referred to the burst-mean part of the velocity component.
Skin-friction wave shear velocity u*ws, current shear velocity u*cs, and combined-wave-current shear velocity u*cws, which are exerted directly on sediment grains, are calculated with wave and current parameters, using the Grant and Madsen (1986) and Madsen (1994) bottom boundary layer model for combined wave and current, as generally described below. The subscripts c and w denote variables associated with currents and waves, respectively. The equivalent Nikuradse sand grain roughness (kbs = 2.5d50, hydraulic roughness z0s=kbs/30). Subscript s denote variables associated with skin-friction associated with sediment grains.
An arbitrary value is firstly assumed for the ratio of wave-current shear velocity to current shear velocity as with Equation 5a
where ϕcw is the angle between the directions of wave propagation and tidal current. fcws is the combined-wave-current skin-friction factor that is related to sediment grain, which is then obtained iteratively from Equation 5b,
The wave friction factor related to sediment grains fws is also approximated initially using the equivalent Nikuradse sand grain roughness kbs and the near-bed horizontal wave-orbital excursion length Ab with Equation 5c (Soulsby, 1997),
The timing of sediment mobilization is determined by comparing the maximum combined skin friction shear velocity u*cws and critical shear velocity u*cr,. The critical shear velocity u*cr for the initiation of bedload transport is calculated with the threshold Shields parameter (Equations 6a-c; Soulsby, 1997; Soulsby and Whitehouse, 1997),
where D* is the dimensionless grain size, g is the acceleration due to gravity, and is the kinematic viscosity of water. The sediment density ρs is measured as 1750-1850 kg/m3 for the samples at the three sites based on dry weight and volume, which is similar to the estimates in other reef environments by Cuttler et al. (2018) and Pomeroy et al. (2021). Here, sediment density ρs =1850 kg/m3, and seawater density ρo =1025 kg/m3 are used to calculate critical shear velocities to initiate sediment u*cr on the three reefs, according to the grain size analysis results (for details please see below).
4.3 Logarithmic profile fitting and internal consistency analysis
Velocity profile time series is collected with the 1,200 kHz broadband ADCP that is held by the tripod sitting motionless on seabed. The obtained profiling range is broken up into uniform segments with 0.25 m vertical spacing (vertical velocity bins). The 10-minute mean horizontal velocities are derived from the along-beam velocities. The contribution from Doppler noise to the statistical uncertainty in the mean velocity is negligible. There are two blind areas vertically associated with the ADCP mooring observations at the seabed. The lower blind area forms because of the near-field effects surrounding the transducer and extends upwards for approximately 0.82 m from the transducer installing height above seabed. The upper blind area forms at the farthest distance to the transducer, owing to the side-lobe effect. For the case of upward-looking ADCP installed near the seabed in this study, the upper blind area is close to sea surface, that is, an invalidity of data existed for the uppermost 6% water depth. Consequently, a total of approximately 26 hours’ observation provide 153 and 152 ensembles of 10-min mean velocity profile at sites NX and AD, respectively, and 252 ensembles in site KG with the 40 hours’ observation. Also, the current velocity time series derived from ADV records are added to each velocity profile (ensemble) of all the three sites, as a supplementary point for the subsequent boundary layer parameters calculations. The calculations are based on the two horizontal velocity components, although each ensemble contained profiles of three components.
The ‘idealized’ logarithmic velocity distribution is universally expressed by the von Karman-Prandtl equation (Dyer, 1986; Fredsøe and Deigaard, 1992) as:
where U(z) represents the current speed at height z above seabed. u*c and z0 represent the apparent boundary layer parameters: the mean current shear velocity and the hydrodynamic roughness length, respectively. κ is von Karman constant and usually taken as 0.4 for seawater. The 10-minute mean current speeds in each profile U(z) recorded by the ADCP are regressed against logarithm of height above the seabed (lnz) in order to establish a best-fit line. The critical correlation coefficients to a 90% confidence level in the Pearson correlation table are used as the first step to determine whether the derived linear relationship with the slope and the intercept of the line by incorporating how many velocity bins (i.e. to what height upward from the seabed) would be potentially valid to estimate the apparent boundary layer parameters u*c-LP and z0 from each of the velocity ensemble.
Further verifications are performed subsequently with the internal consistency analysis proposed by Collins et al. (1998). Linear regression (Gao, 1997) is performed for the mean shear velocity u*c with the current speed within the bottom boundary layer, i.e., the observed current velocity at 0.4 m height above seabed U40 at NX (Equation 8a), current velocity at 0.7 m U70 at AD and at 0.6 m U60 at KG, respectively. For a verified current velocity logarithmic profile and thus valid estimations of apparent bottom boundary layer parameters from the significantly correlated linear relationship between U(z) and lnz, the statistical relationship between u*c derived from the logarithmic profile fitting and U40 at NX (corresponding to U70 at AD and U60 at KG) must satisfy the following four conditions: (i) the linear correlation coefficient between u*c and U40 is larger than the critical value in the Pearson coefficient table to a 90% confidence level (Equation 8a); (ii) intercept b of the regression line should be much smaller than the value of u*c; (iii) an average value of z0 estimated from the slope of this regression line (Equation 8b) should be approximate to that derived from the logarithmic profile fitting (Equation 7); (iv) the value of drag coefficient C40 for NX derived from the slope a (Equation 8c) should be consistent to the average of the C40 data series estimated from the u*c in the logarithmic profile fitting (Equation 8d), C40 is replaced by C70 for AD and C60 for KG.
The verification process of the logarithmic profile fitting with the internal consistency analysis could be an iterative process. Once any of the four conditions outlined above is not met, the extreme z0 values from the potential logarithmic profile fitting are filtered out of the data sets. For instance, values on or over the order of 10 m would be abandoned, given that the grain-related roughness length could be in the order of millimeters and roughness due to wave-induced ripples (Van Rijn, 2007) and coral colonies could be in the order of centimeters or even decimeters. Correspondingly, the associated U(z)-lnz linear relationship along with the estimated values of u*c were removed, until finally all the four conditions are satisfied by the filtered data of mean-current shear velocity and roughness length derived from the logarithmic profile fitting.
5 Results
5.1 Hydrodynamic conditions
Based on the NCEP reanalysis data and observation results, during the observation period from September 2 to 9, 2017, southerly winds dominated the study area, with by several brief episodes of northerly winds (Figure 2). The southerly wind speed at 10 m above sea surface (U10) typically ranged from 3 to 5 m/s, with maximum speeds reaching 10 m/s (Figure 2A). In contrast, the speeds of northerly winds were less than 3 m/s. A comparison with the observational data for years 1989-2009 from Yongshu Reef (Zhou et al., 2012) revealed that the observation period in September 2017 corresponded to the late stage of the SW summer monsoon, and experienced relatively calm weather conditions with wind speeds below the multi-year average of 6.6 m/s.
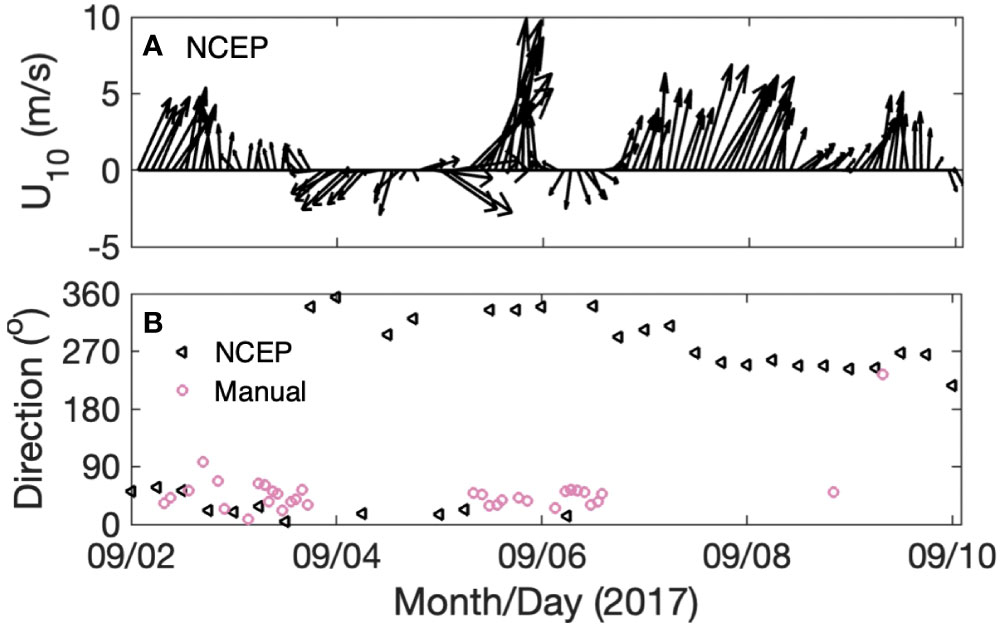
Figure 2 Wind conditions during the observation period in September 2017. (A) Standard wind speed U10 (m/s), and (B) wind direction (degree) in earth coordinate.
The tidal ranges were observed to be approximately 1.0-1.2 m at the three sites (Figures 3A, E, I), indicating a weak-tide environment, as similar to that of the Yongshu Reef and Xuande Reefs in the Xisha Islands (Zhu et al., 2005; He et al., 2021). The study sites exhibited an irregular diurnal tide, overlaid by the characteristics of semidiurnal tide, particularly at site KG (Figure 3I), where variable water level fluctuations might be attributed to the topographical influence. Considering the observations from September 2-9 in 2017 as a whole, the transition from diurnal tide, i.e. one high tide and one low tide per day at site NX on September 2-3, evolved into semi-diurnal tide, i.e. two high tides and two low tides per day at site KG from September 7-9. The site NX experienced approximately 15 and 9 hours of flood and ebb tide, respectively, on September 2-3, displaying tidal asymmetry, whereas mean durations of flood and ebb tides were approximately 5.9 and 6.2 hours, respectively, on September 7-9, at site KG.
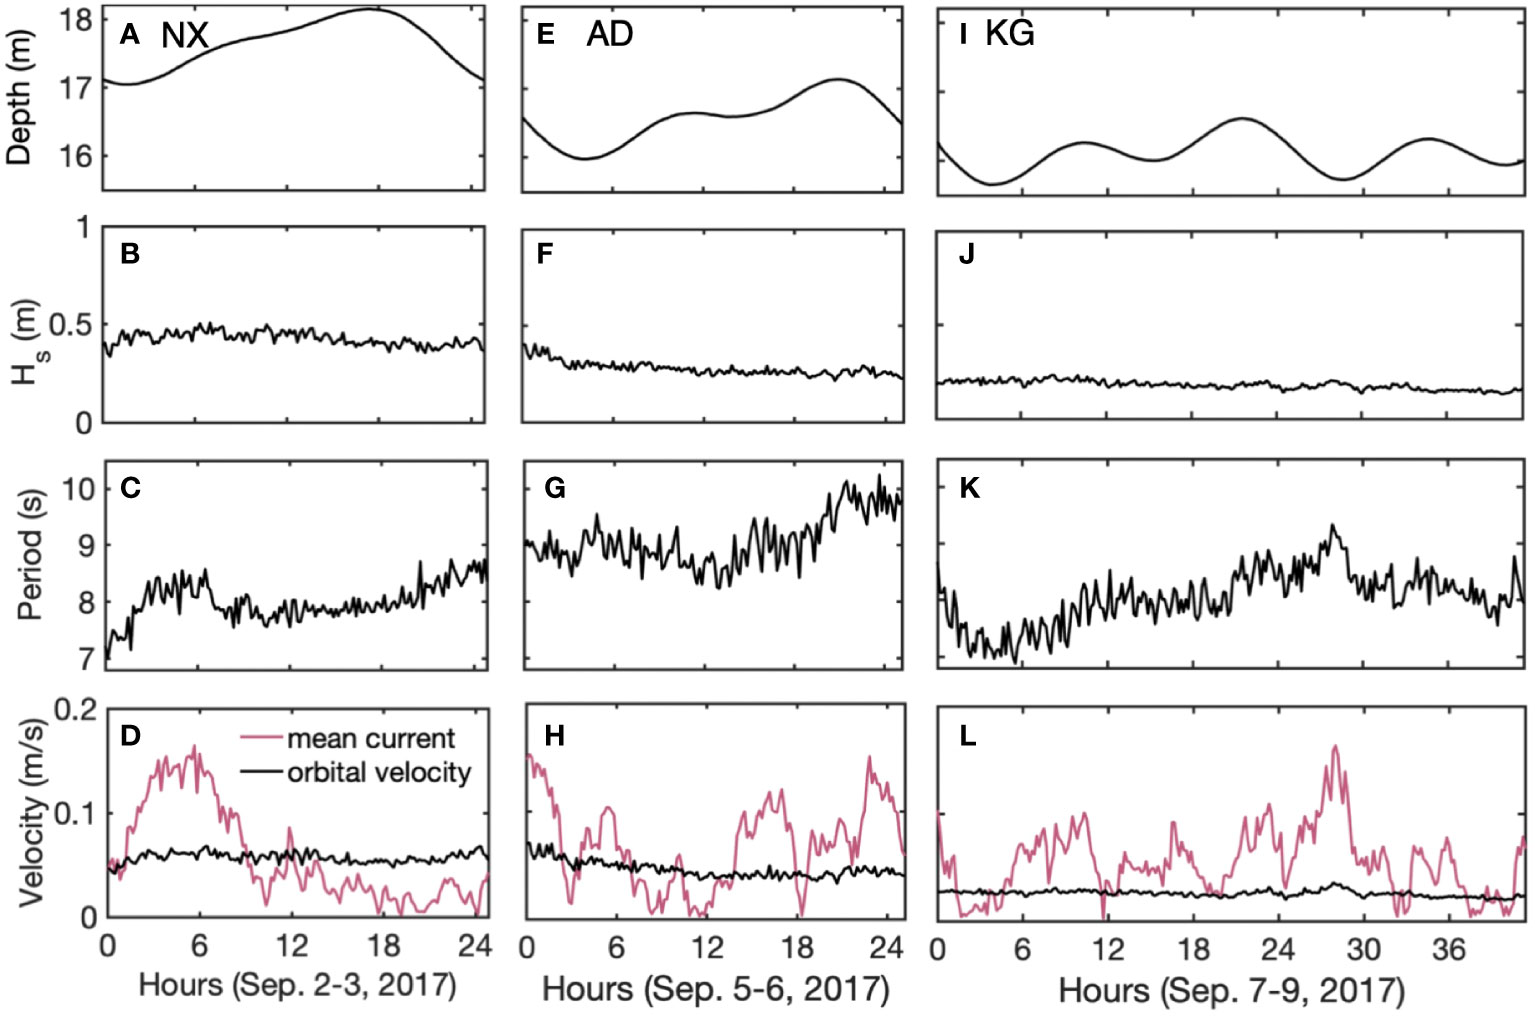
Figure 3 Hydrodynamic observations for approximately one tidal cycle at sites (A–D) NX, (E–H) AD and (I–L) KG in September 2017.
Due to large fetch within the expansive reef region, the observed waves were a combination of swell from the open ocean and locally generated sea waves. Significant wave height ranged from 0.2 to 0.5 m (Figures 3B, F, J), and the wave period varied between 7 and 10 s (Figures 3C, G, K) from September 3 to 9, 2017. The significant wave height during the observation period was considerably smaller than the multi-year average of 1.2 m observed at water depth of approximately 20 m close to the Yongshu Reef (Zhou et al., 2012), indicating a period of calm hydrodynamic conditions.
The near-bed mean currents exhibited tidal periodic characteristics that were associated with the change of water level. Strong currents occur at the beginning of the flood tide (Figures 3A, D) and the beginning of the ebb tide (Figures 3E, H), reaching a maximum velocity of 0.16 m/s. The near-bed mean current velocities during the flood and ebb tides at sites NX, AD, and KG were 0.05, 0.07, and 0.05 m/s, respectively, with a generally southward current during flood tide and a northward current during ebb tide. They exhibit significant reciprocal flow characteristics. Within the tidal cycles, the residual currents at sites NX, AD, and KG were 0.031, 0.006, and 0.015 m/s, with directions of 255, 50, and 172 degrees, respectively, indicating a net flow towards inner reef flat and/or lagoon.
Wave skewness and asymmetry were quantified by the Ursell number, which were computed using significant wave height, wave period and water level change (Ruessink et al., 2012). The results indicated that wave skewness and asymmetry were on the order of magnitude of 10-9 at the three sites, supporting the sinusoidal (linear) waves. The near-bed representative orbital velocities ubr were generally stable at 0.03-0.05 m/s throughout the tidal cycles (Figures 3D, H, L), similar to the magnitude of mean near-bed currents at all the sites. As orbital motions were associated with high-frequency characteristics, waves contributed significantly to maintaining good water quality in coral reef areas, facilitating the removal of fine particles. The observations also indicated extremely low suspended sediment concentrations and a lack of viscous fine sediment deposition components (described in sections 5.2 and 5.4), highlighting the key role of wave dynamics in preserving a transparent environment, which was a preconditioned key to heathy coral reef development. This suggested that, under relatively low-energetic conditions, non-breaking wave activities were at least comparable to the tidal influences and should not be neglected, in spite of the depths of 16-18 m.
5.2 Seabed sediment and near-bed shear velocities
Grain size distributions were similar for the loose sediment samples collected from the deep-seated reef flats and the shallow reef flats, indicating a generally uniform sediment source. Overall, there was a prevalence of components with grain sizes around 0 phi, with a mean grain size ranging from -0.4 to 0.7 phi, although sediments on the Xiaonanxun and Kugui Reef (sites NX and KG, median grain size d50 = 1.0 mm) (Figures 4A, C, D, F) were slightly coarser, compared to that on the Anda Reef (site AD, d50 = 0.5 mm) (Figures 4B, E).
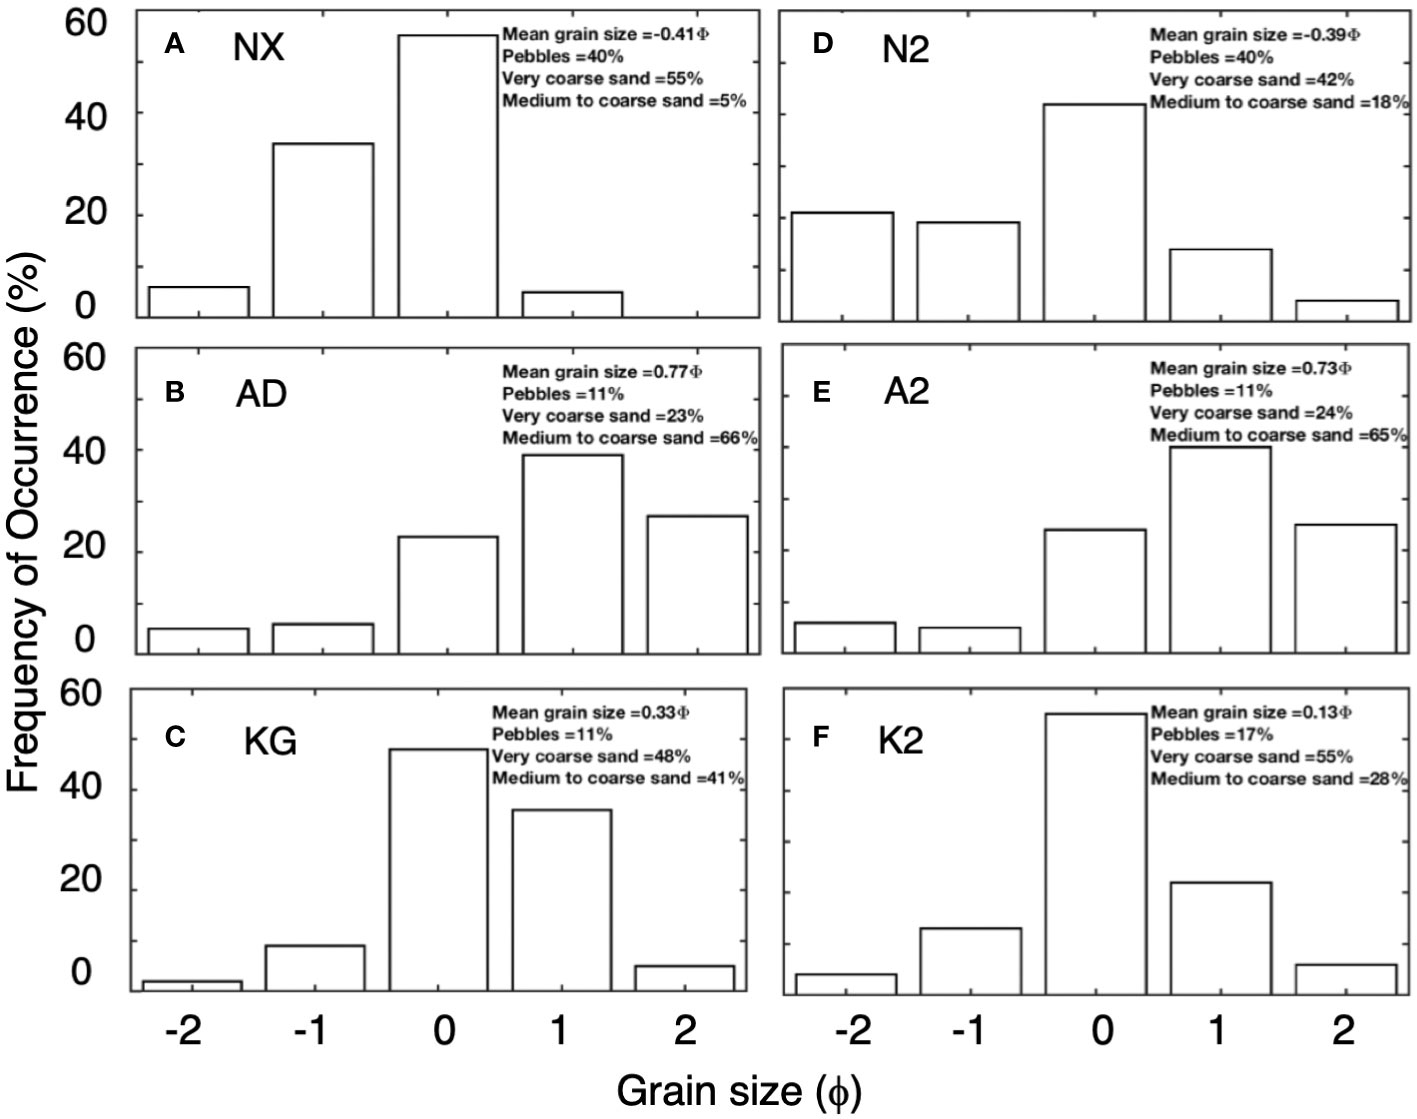
Figure 4 Grain size distribution of reef sediment in (A–C) deep-seated flats and (D–F) shallow reef flats.
The skin-friction shear velocities exerted on individual sediment particles by waves (u*ws), currents (u*cs), and wave-current combinations (u*cws) exhibited tide-driven periodic variations, although the absolute magnitudes were all smaller than the threshold value of sediment initiation u*cr so that sediment was not mobilized during the observation period (Figure 5). The mean values for wave-current combined skin-friction shear velocities u*cws at sites NX, AD, and KG were 0.0081, 0.0073, and 0.0053 m/s, respectively, whereas the mean wave-alone-induced u*ws and current-alone-induced skin-friction shear velocities u*cs were 0.0072 and 0.0035 m/s at site NX, 0.0064 and 0.0034 m/s at site AD, and 0.0050 and 0.0028 m/s at site KG, respectively. The shear velocities acting on individual sediment grains was predominantly driven by wave dynamics, as the values of u*cws were close to u*ws, both of which were much larger than u*cs.
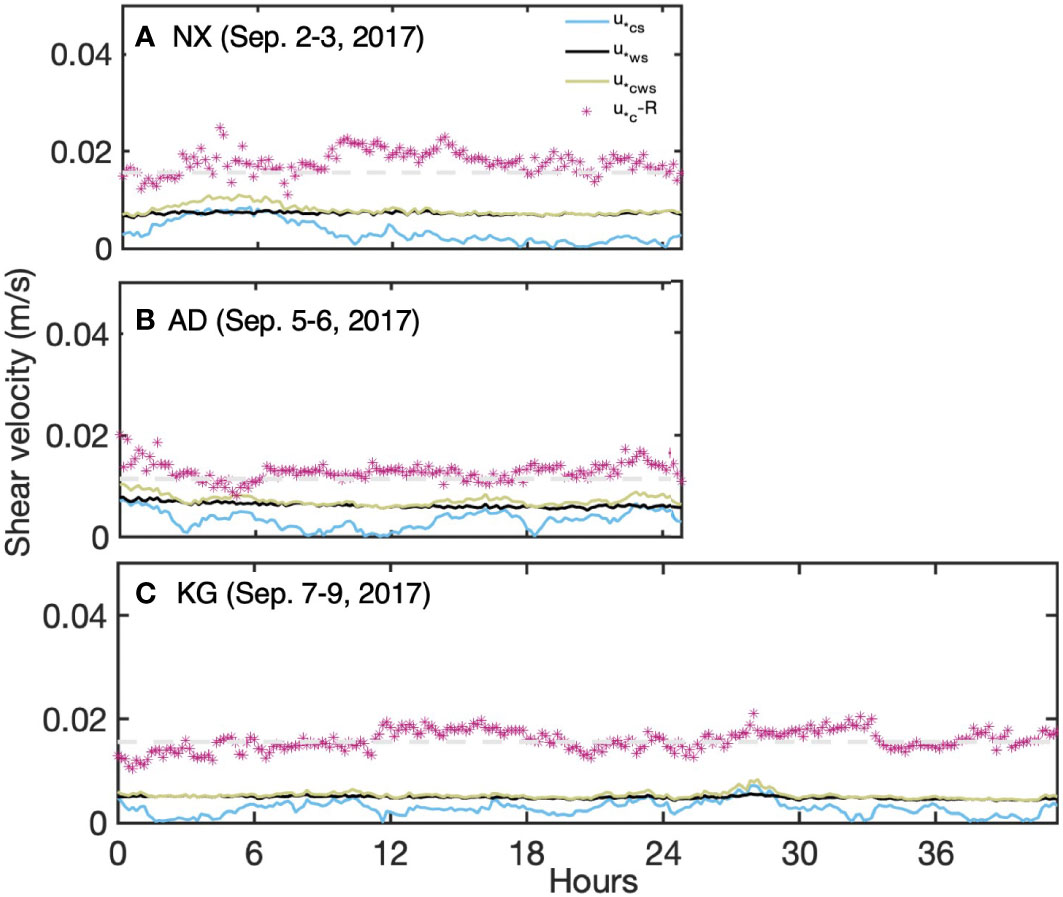
Figure 5 Skin-friction shear velocities exerted on sediment particles by wave, current and their combination, in comparison with Reynolds stress that represented apparent shear velocity associated with reef canopy structure, at site (A) NX (d50 = 1 mm), (B) AD (d50 = 0.5 mm), and (C) KG (d50 = 1 mm). Threshold shear velocities of sediment initiation u*cr as denoted by dashed grey lines were not reached by skin-frictions.
The Reynolds shear velocities u*c-R that were calculated from the high-frequency ADV velocity records were 0.018, 0.013, and 0.016 m/s at the sites NX, AD, and KG, respectively (Figure 5). These values are two to three times those of the wave-current combined skin-friction shear velocities u*cws, which were exerted on individual reef sediments directly by the fluid motions as described above. The Reynolds shear velocities reflected the shear velocities generated by hydrodynamics on the surface of the reef canopy structure. The physical seabed roughness on a reef bed, particularly the immobile canopy structure on the reef flat, can vary significantly and was usually much larger than that is associated with the individual sediment particles. The reported values of wave friction factor for coral colonies ranged from 10-1 to 100. This was in contrast to the values of 10-3 or smaller used to describe the skin friction of sediment particles (Lowe et al., 2005; Monismith et al., 2013, Monismith et al., 2015; Harris et al., 2018). The resultant shear stresses reflected the stress acting on the coral colonies, resembling the form drag exerted on the surface of mobile ripples, and could be much larger than that acting on individual mobile sediment particles (Storlazzi et al., 2009; Pomeroy et al., 2017).
5.3 Velocity profiles and boundary layer parameters (u*c and z0a) estimation
The10-minute averaged velocity profiles across the entire water columns supported the primary influence of tides on the ocean currents in the study area (Figure 6). Prominent progressive wave characteristics were observed at sites AD and KG, with the maximum current velocity occurring at the peak-tide period. Yet, such a feature was not observed at the site NX. The rapid attenuation of vertical velocity component with increasing depth was attributed mainly to bottom friction. The surface currents were the strongest, with the surface flow reaching up to 1 m/s at site AD (Figure 6B), and approximately 0.5 m/s at sites NX and KG (Figures 6A, C). The tidal currents throughout the whole water column at sites NX and AD were relatively stronger than that at KG.
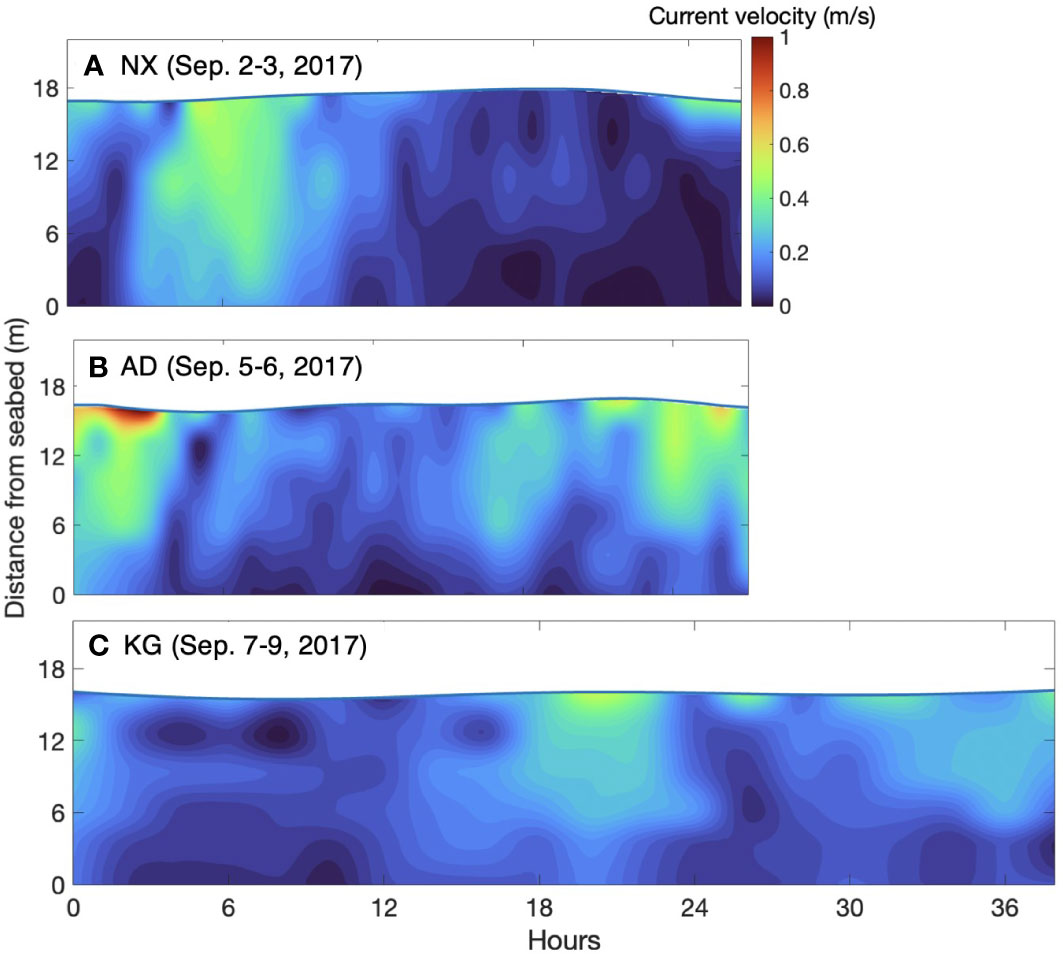
Figure 6 Current velocity profiles recorded by ADCP at sites (A) NX, (B) AD and (C) KG in September 2017.
The middle to lower layers of water columns at many times of the observation duration exhibited a pronounced logarithmic profile distribution, suggesting that the near-bed current in this area was mainly influenced by bottom friction. To obtain reliable logarithmic profiles for apparent boundary layer parameters estimation, internal consistency analysis were performed on ADCP velocity profile data, where 35, 64, and 71 current velocity profiles were supposed as qualified logarithmic profiles out of the total velocity ensembles of 153, 155, and 252 at sites NX, AD, and KG, respectively (Figure 7).
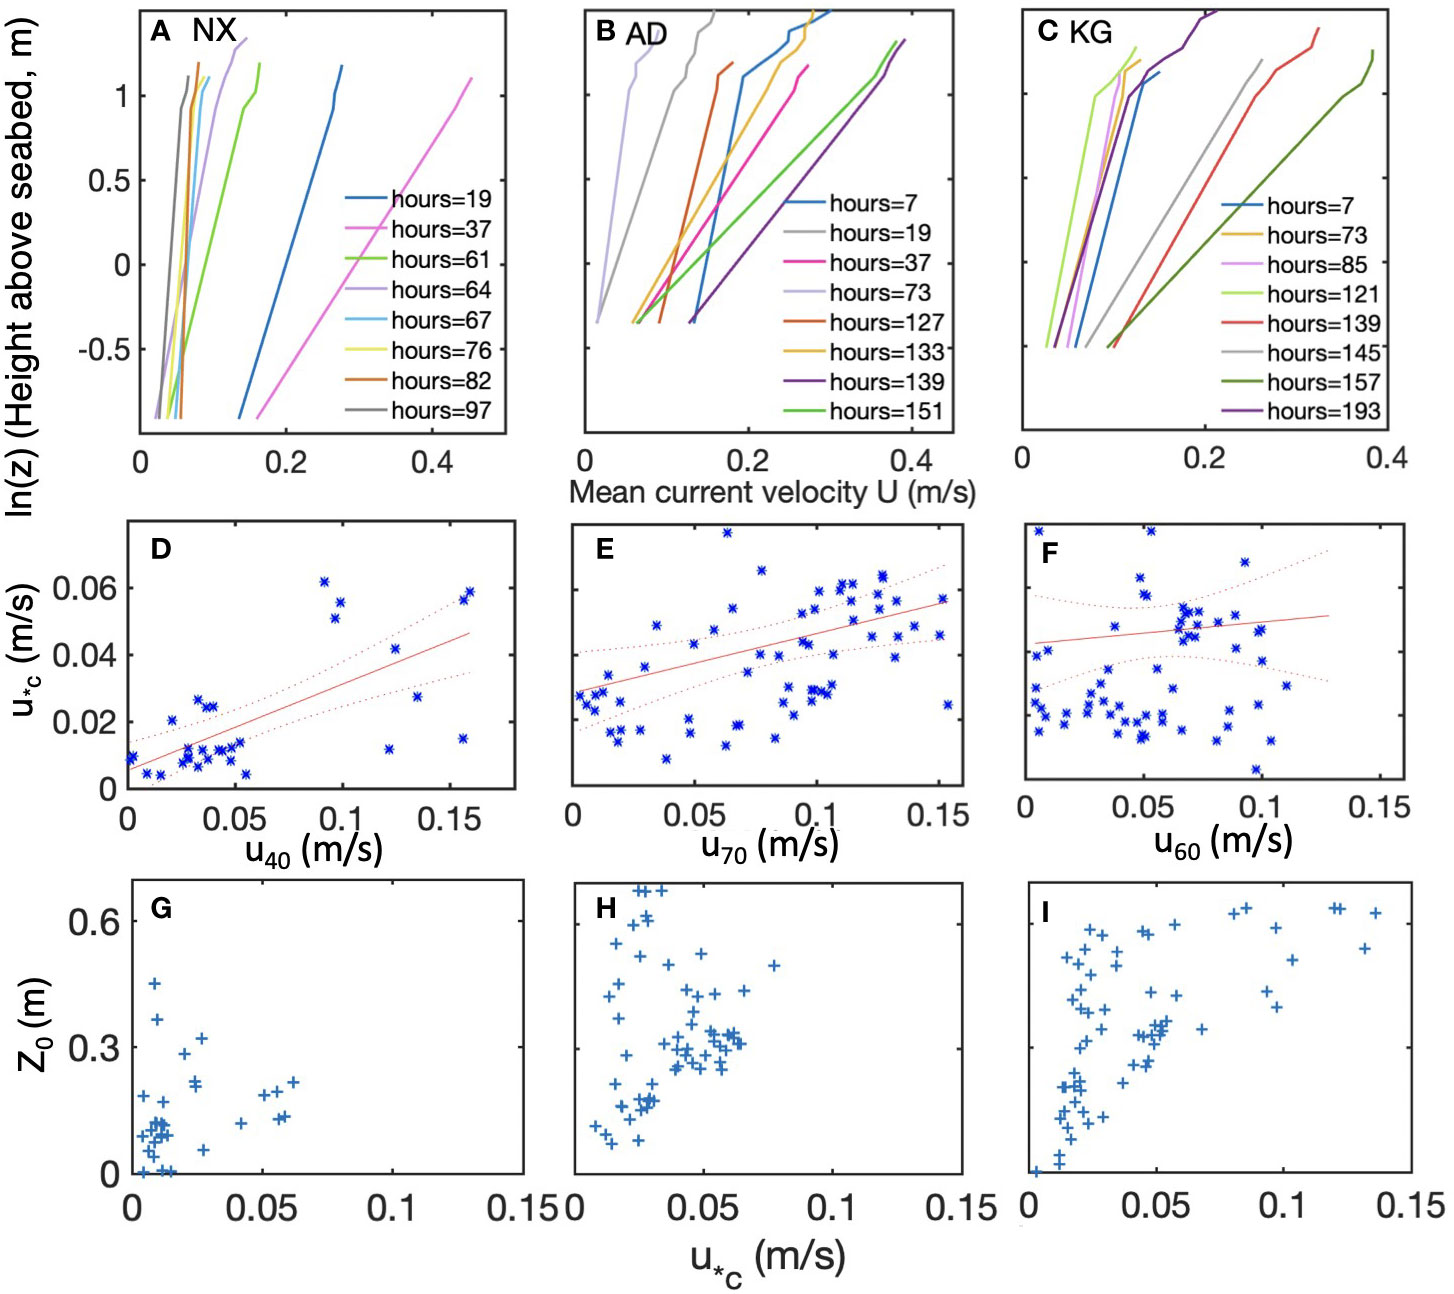
Figure 7 Examples of qualified current logarithmic profile at nine ebb and flooding time points at sites (A) NX, (B) AD, and (C) KG. Relationship between near-bed current and mean shear velocity estimated from (D) 35 qualified current logarithmic profiles at site NX (u40 and u*c), (E) 64 at site AD (u70 and u*c), and (F) 71 at site KG (u60 and u*c). Apparent roughness length z0 estimated from the qualified logarithmic profiles at site (G) NX, (H) AD and (I) KG.
The apparent near-bed shear velocities estimated from the logarithmic profile u*c-LP exhibited characteristics of tidal periodic variations, ranging from 0.01 to 0.10 m/s. The mean values of u*c-LP were 0.021, 0.043, and 0.046 m/s at sites NX, AD, and KG, respectively (Figure 8). These values were comparable in terms of the order of magnitude to the estimations of Reynolds shear velocities u*c-R of 0.018, 0.013, and 0.016 m/s, at sites NX, AD, and KG, respectively, although the absolute values of the former were larger than the latter. Due to the wider scale of water column covered by the ADCP velocity profiles compared to the single site of ADV, the results of u*c-LP might reflect the total roughness of reef structures and coral branches on the seabed better than the Reynolds shear velocities. The lower limit of apparent shear velocities obtained through the logarithmic profile method u*c-LP was consistent with the results of Reynolds shear velocities u*c-R. Both u*c-LP and u*c-R were much larger than the wave-current combined skin-friction shear velocities u*cws (approximately 0.005-0.008 m/s in average as mentioned above), which represented the fluid shear stresses exerted on individual sediment grains and involved in sediment transport estimation (Pomeroy et al., 2017).
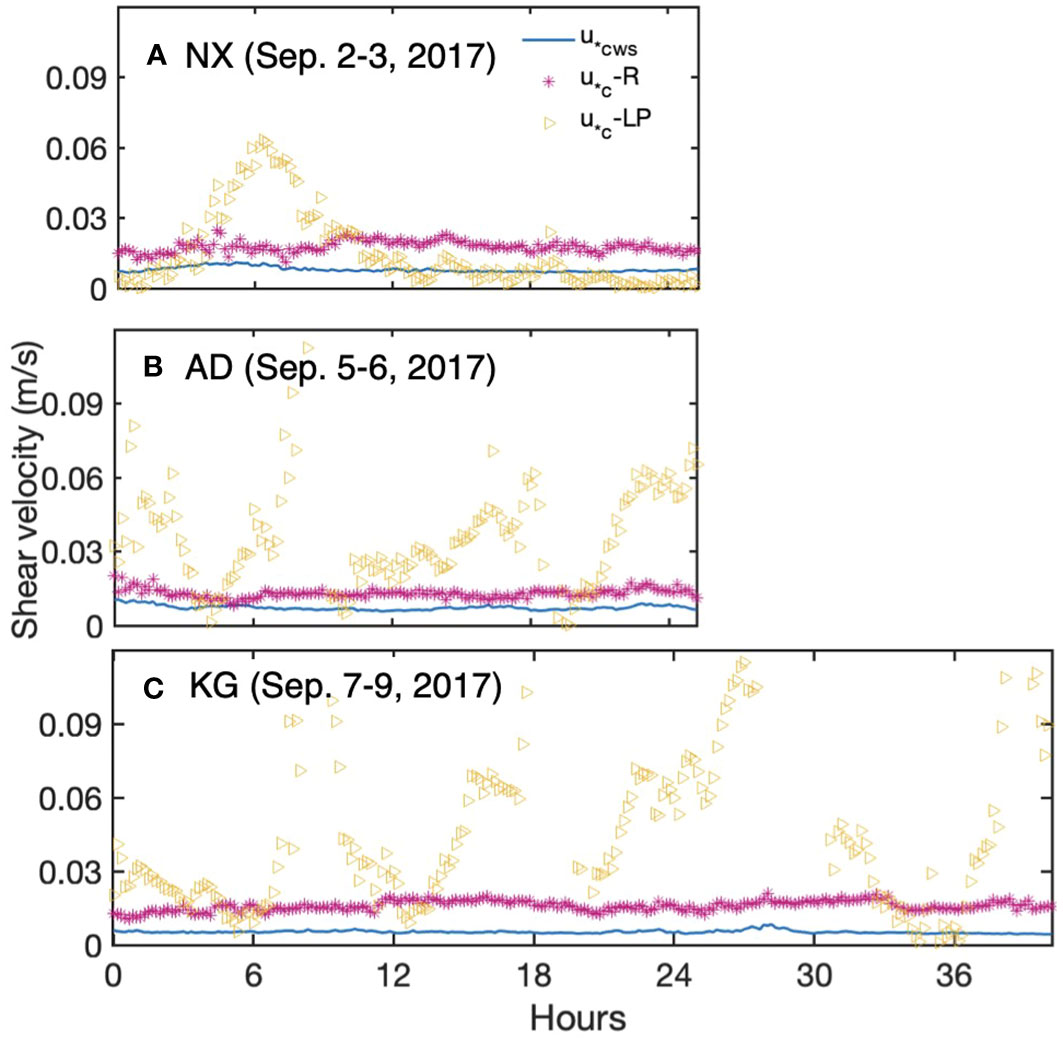
Figure 8 Comparison of mean shear velocity estimated by quantified current logarithmic profile and Reynolds stress measured by ADV, and the estimations of wave-current-combined skin friction on sediment grains at sites (A) NX, (B) AD and (C) KG.
Logarithmic profile analysis revealed that the mean apparent roughness lengths at all the three sites were in the range of 0.1-0.3 m (Table 2). These results were roughly equivalent to the sizes of coral rubble and branches, as well as small coral colonies on the seabed, whereas being much larger than the Nikuradse’s equivalent sand roughness on the magnitude order of 10-4 m (d50 = 0.5-1.0 mm), which was calculated from median grain size as d50/12 and used to calculate the skin-friction directly exerted on individual sediment particles (u*cws, u*ws, and u*cs, Figure 5). Similarly, the drag coefficients at the three sites were approximately 0.17-0.35, which was about two orders of magnitude larger than the average value of 0.0025 for sandy and muddy flat seabeds. The reef canopy structure roughness features of seabed contributed to the formation of apparent large shear velocities (u*c-LP and u*c-R) and significant turbulence effects (section 6).
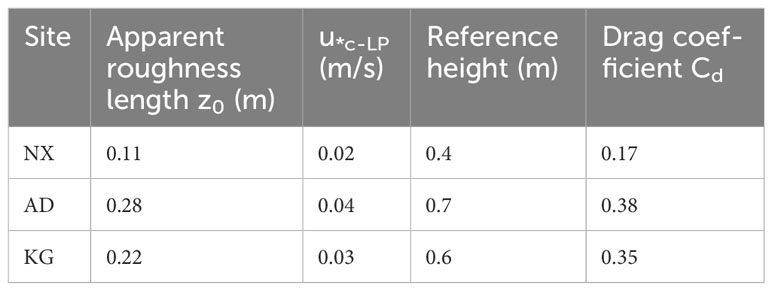
Table 2 Mean of the apparent bottom boundary parameters as derived from the 35, 64 and 71 logarithmic current profiles at sites NX, AD, and KG, respectively.
5.4 Suspended sediment concentrations
The SD204 CTD, equipped with a high-accuracy turbidity sensor on the tripod at the three sites, showed low water turbidity of less than 0.2 FTU near the bottom (Figure 9). Twenty-one water samples were measured with Optical Backscatter Sensors (OBS) profiles at sites NX, AD, and KG in September 2017. Filtration of the water samples revealed that thirteen samples had zero suspended sediment concentration, where no suspended sediment was detected. The remnant samples had suspended sediment concentrations less than 1 mg/L, except for one sample with 10 mg/L and two with 1-2 mg/L. Shipboard profiling of water turbidity using OBS3A indicated all zero values in the water column at all the three sites, suggesting that the suspended sediment concentrations were smaller than the lower limitation of the OBS3A turbidity sensor measurement. Thus, both turbidity calibration and water samples confirmed low suspended sediment concentrations, with many zero values during the observation periods (Table 3). Such low suspended sediment concentrations in the study area, which might be owing to the limiting supply of fine sediment, contributed to maintaining good light conditions and would be thus beneficial to zooxanthella photosynthesis and thus coral growth.
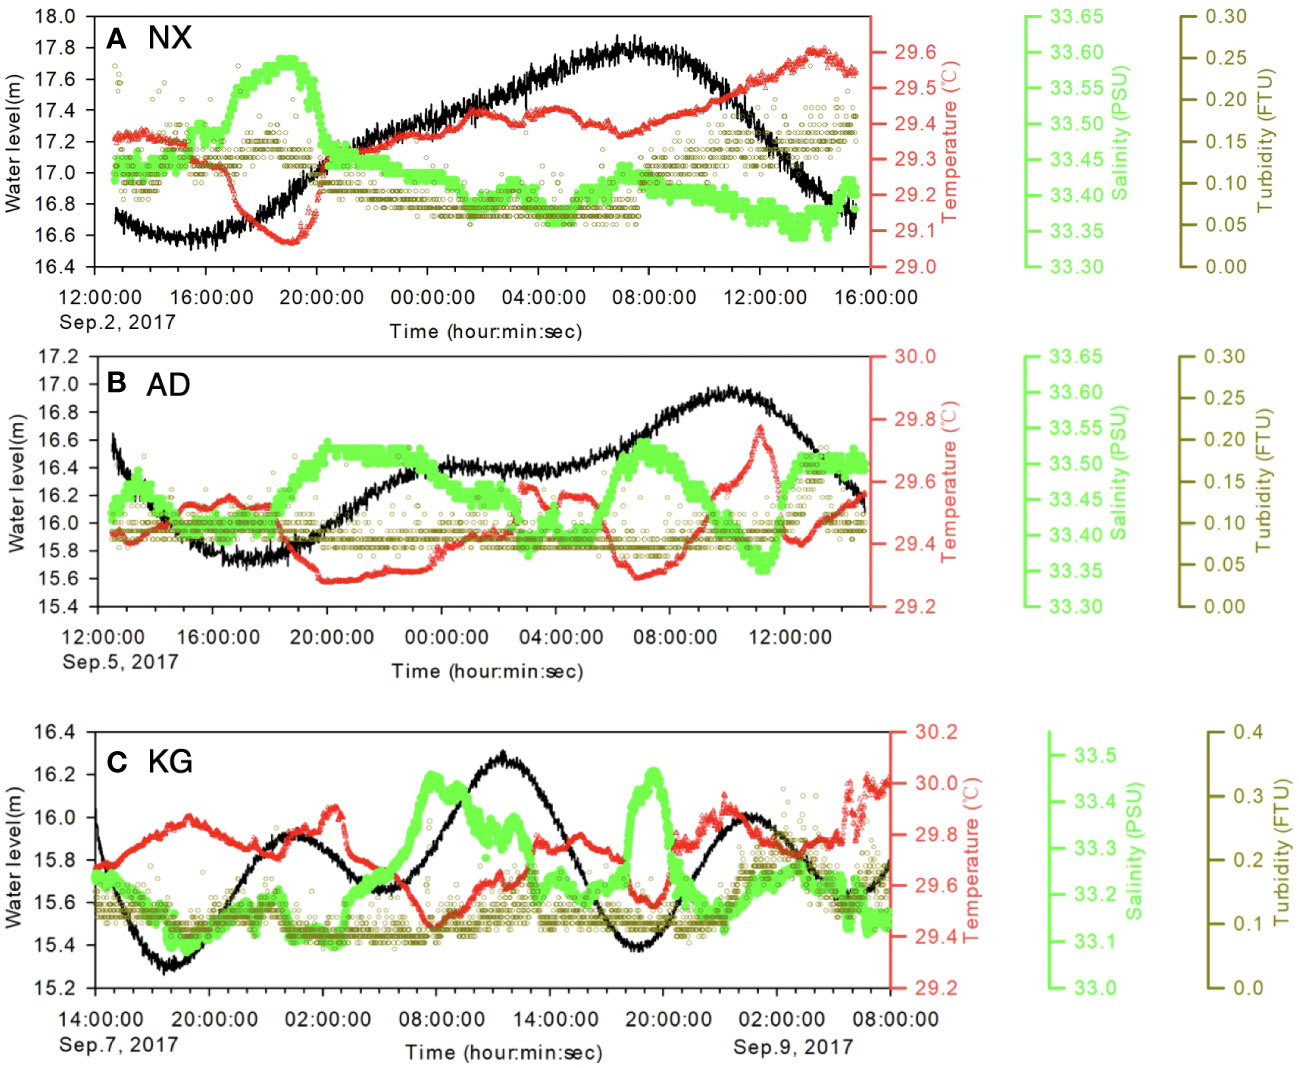
Figure 9 Temperature, salinity, and turbidity observed with SD204 CTD installed at tripod with (A) sensors 0.8 m above seabed at site NX, (B) sensors 1.2 m above seabed at site AD, and (C) 1.0 m above seabed at site KG.
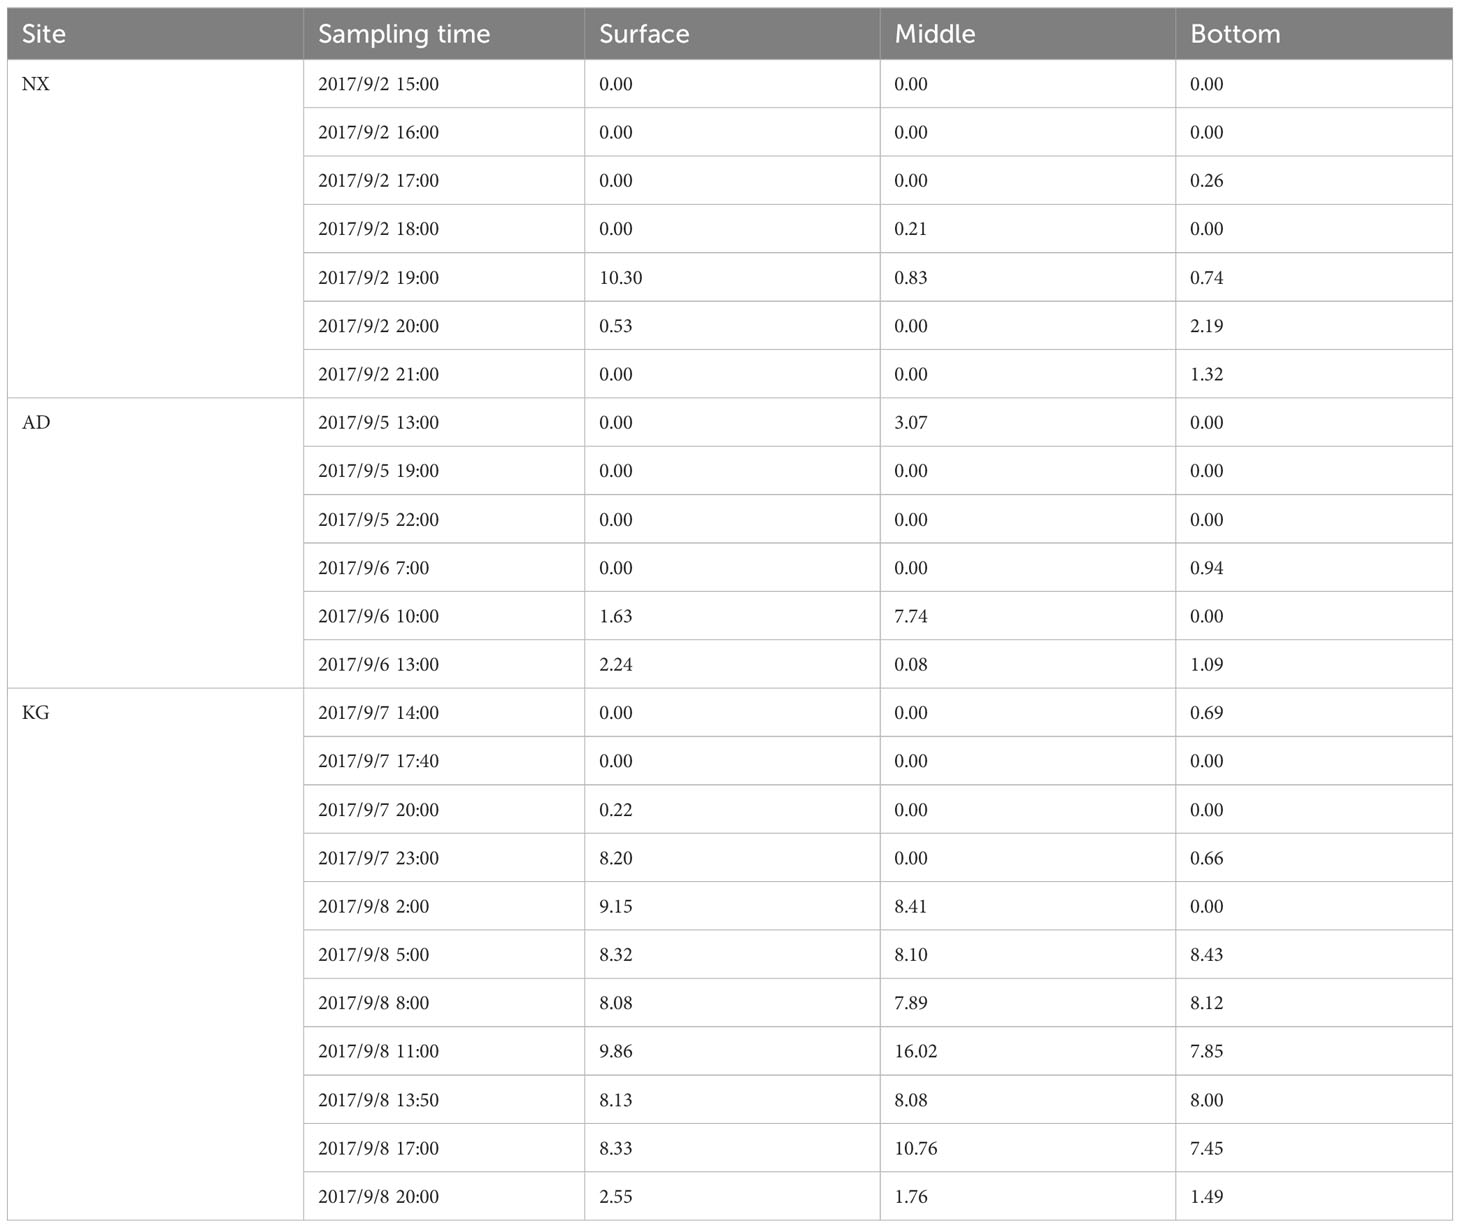
Table 3 Suspended sediment concentration (mg/L) obtained from water sampling in the surface, middle, and bottom water layers at three reef sites.
6 Discussion
The hydrodynamics at the three sites on the reef flats of 16-18 m depth were characterized by non-breaking sea-swell waves and asymmetric tidal currents, unlike the typical shallow reef flats at depths of 0-3 m in the Pacific and Indian Ocean, where cross-reef currents are generated by radiation stress gradients induced by incident sea-swell waves breaking and the associated mean water level gradients in the surf zone [e.g (Masselink et al., 2019)]. The irregular, branching morphologies and canopy structure of living coral colonies (about 0.5 m high in average) and coral rubble (sized 1-10s cm) observed at the three sites were analogous to that on shallow coral reef flats. Under the combined influence of sinusoidal waves and asymmetric tidal currents, along with the reef roughness, distinct variations in the velocity profile within bottom boundary layer were observed during flood and ebb tides. The bottom boundary layer was defined as near-bed water column extending to about 3-4 m above seabed, under the roughness influence of reef canopy structure at the three sites. During the flood tide, tidal-dominant velocity logarithmic profiles were observed in the lower water columns between 0.5 m and 3 m above seabed (water column just above the height of reef roughness) at sites NX and AD (Figures 10A, B). In contrast, during the ebb tide, wave-dominant potential flows were found at sites NX and AD. That is, current velocity did not change much with depth at the upper bottom boundary layer, but was reduced rapidly within the thin layer at the surface of the reef roughness. At site KG, tidal-dominant logarithmic profiles were observed within the water columns of 0.6-3 m above seabed at both the flood and ebb tides (Figure 10C).
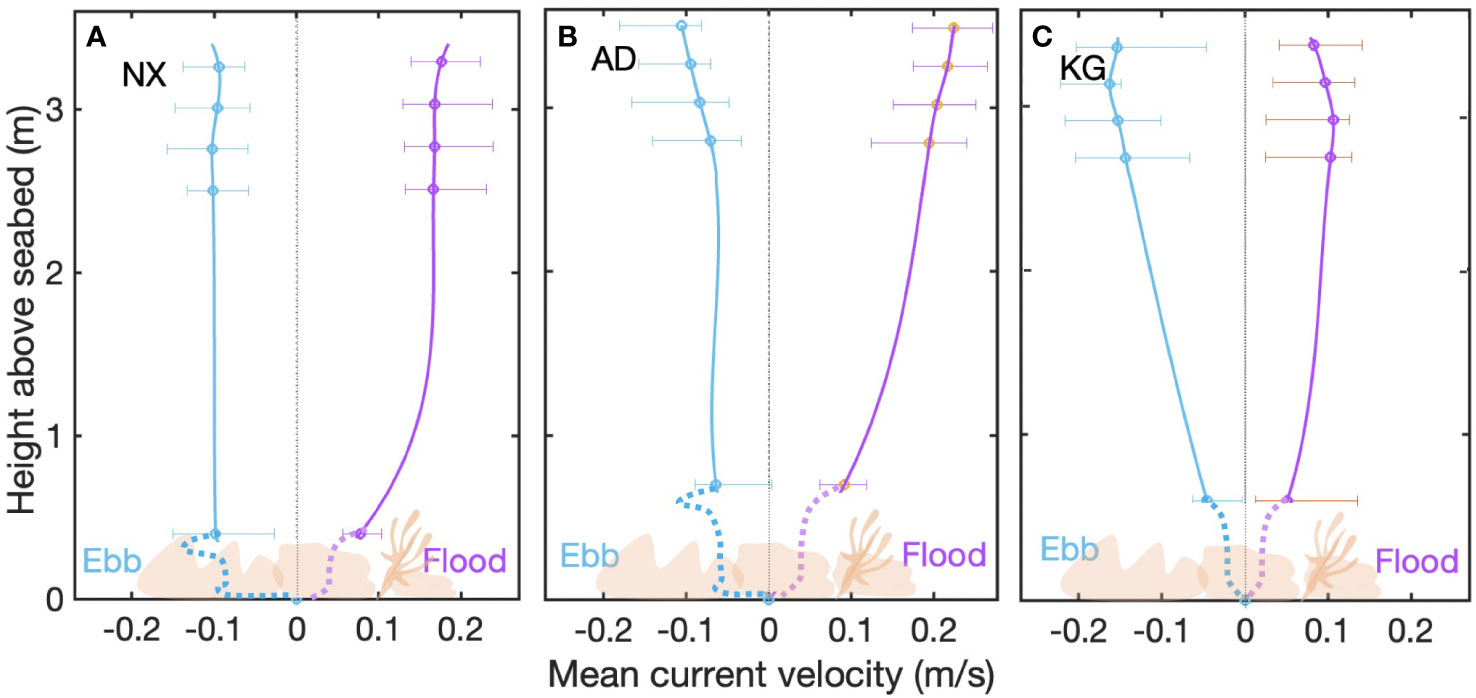
Figure 10 Mean velocity profiles during ebb and flood period, respectively, at site (A) NX, (B) AD and (C) KG. Dashed curves represent the possible extension of the current profiles to the seabed.
In addition to the impact on the mean current velocity structure, the large reef roughness also resulted in the enhanced hydraulic resistance on the overlying flow and increased energy dissipation, although quantitative connection was not well determined between the physical roughness of reef and the hydrodynamic roughness acting on fluids, which was parameterized as hydraulic roughness length scale z0 and drag coefficient Cd at a certain reference height (Rosman and Hench, 2011; Pomeroy et al., 2017). The hydraulic roughness lengths z0 typically ranged from 0.002 to 0.07 cm on bare muddy and sandy seabed, and increased to 0.3-0.6 cm on rippled sandy or gravelly seabeds. The corresponding drag coefficients at 1 m above the seabed ranged from 0.0014 to 0.0030 and 0.0047-0.0061 (Dyer, 1986; Soulsby, 1997; Wang et al., 2004; Li et al., 2022). Both hydrodynamic roughness parameters significantly increased with the presence of reef canopy structure, with drag coefficients ranging from 0.021 to 0.1 and seabed roughness lengths ranging from 0.01 to 0.41 mm (Hearn, 1999; Kunkel et al., 2006). The results from this study at the three reef flats in the Nansha Islands (Cd of 0.2-0.4 at reference heights of 0.4-0.7 m above seabed and z0 of 0.1-0.3 m, Table 2) were closely aligning with the upper limits of these results. The apparent shear velocities on top of the reef roughness was reduced significantly within the roughness, as the shear velocities as inferred from law-of-the-wall fitting of the velocity profile u*c-LP and Reynolds stress derived from ADV installed above the reef roughness u*c-R was about 2-3 times larger than the skin-friction shear velocities directly exerted on individual sediment particles at the base of reef roughness (u*cws and u*cs, Figure 5). This was in line with the findings that Reynolds stresses were enhanced at top of the reef roughness and then decrease toward zero within the reef canopy before they increase again near the bed (Lowe et al., 2008).
Wave and current energy was dissipated significantly due to bottom frictional effects across the surface of reef roughness features, in spite of the absence of wave breaking at the depths of 16-18 m and the relatively weak near-bottom mean currents and orbital velocities in the study area (<0.2 m/s). Based on the high-frequency ADV records of the three sites at the depths of 16-18 m, the values of turbulent kinetic energy and turbulent kinetic energy dissipation rate (ϵ) ranged from 10-3 to 10-1 m²/s² and 10-8 to 10-4 W/kg, respectively, with mean values of approximately 0.005 m²/s² and ~10-5 W/kg, respectively (Figure 11). These values were comparable to that of the high-energetic areas, such as the strong-tide-dominated Yangtze River estuary where the mean flow velocity could exceed 1 m/s (Li et al., 2022). As mass transfer between the corals and the overlying water column is proportional to the one-third power of the wave frictional dissipation rate across the reef surface (Falter et al., 2004), the intense near-bed energy dissipation was crucial for corals to efficiently uptake nutrients from nutrient-depleted tropical waters, thereby supporting coral growth at the reef flats of 16-18 m deep. As stated by Falkowski et al. (1991) and Ruiz et al. (2004), significant turbulence can increase nutrient availability in the photic zone, leading to enhanced primary production.
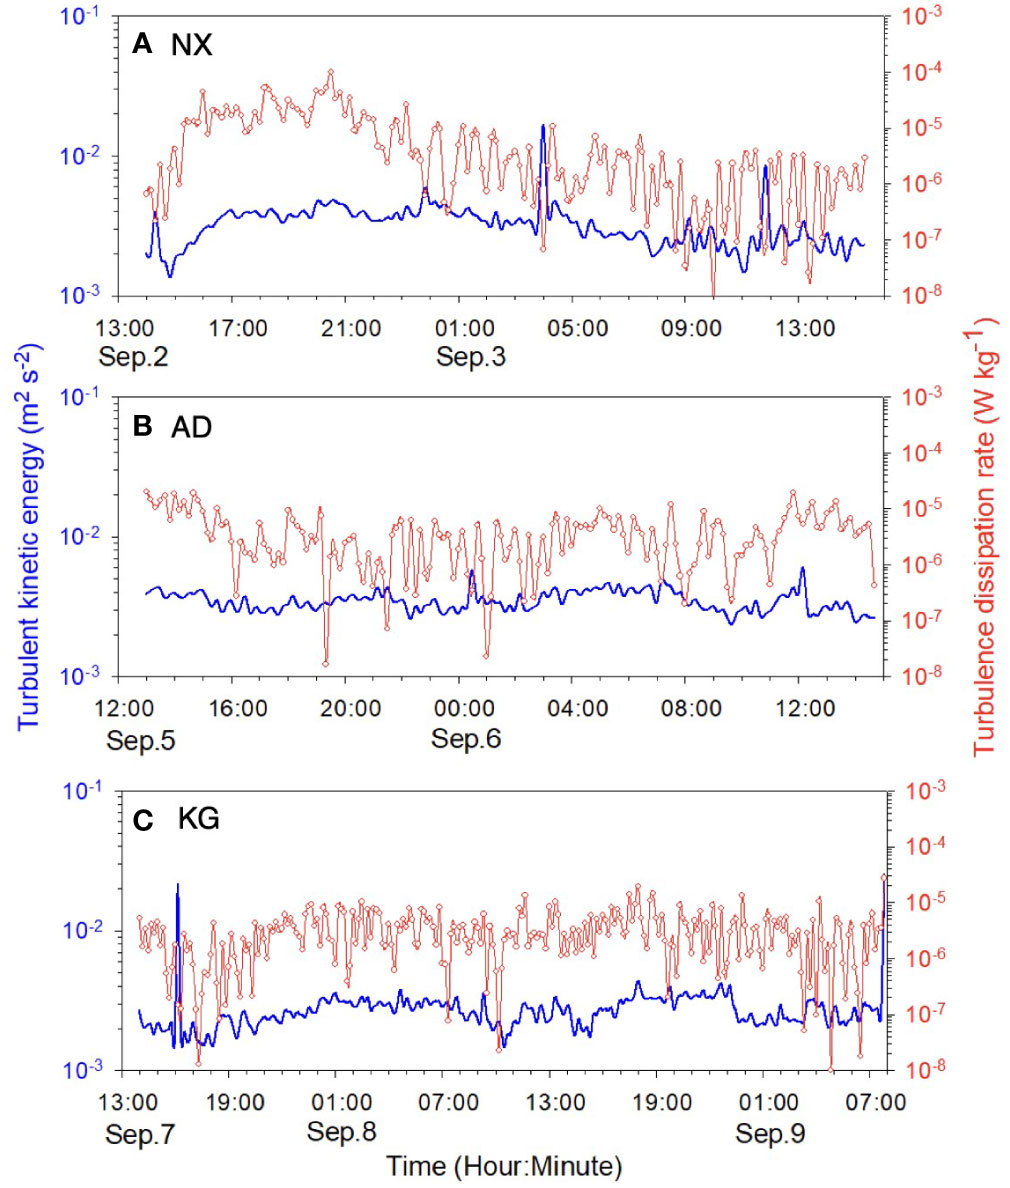
Figure 11 Turbulent kinetic energy and turbulent kinetic energy dissipation rate ϵ measured by ADV at sites (A) NX, (B) AD and (C) KG.
It was noted that the results of this study were limited to one tidal cycle under calm weather conditions, from which the processes associated with seasonal variations of wave dynamics under the predominant control of monsoon. The observed wave activities were too weak to initiate and transport the coarse reef sediment as shown by the skin-friction combined wave-current shear velocities being were smaller than u*cr (Figure 4). The observations could not represent waves during high-energetic times, during which remarkable sediment transport would be likely to occur (Hopley et al., 1997). In another 8-month hydrodynamic observation study in the Nansha Islands, it was found that the significant seasonal wave activities dominated a 12-m-deep reef flat, with a mean significant wave height of 1.3 m and a mean orbital velocity of 0.22 m/s from June to August, indicative of energetic hydrodynamic conditions. Such strong waves have the capacity to mobilize the bottom calcareous coral sands, leading to the formation and movement of ripples. Therefore, additional observation and modeling works are necessary for further investigations into the hydrodynamic processes across the reef environment in the South China Sea.
7 Conclusion
To investigate the reef hydrodynamics in the South China Sea, we conducted tidal-cycle observations using a bottom tripod on three reef flats at depth of 16-18 m in the Nansha Islands in September 2017. The study areas were characterized by an irregular diurnal tide with tidal ranges of 1.0-1.2 m. With the relatively calm weather, the significant wave heights were weak, ranging from 0.2 to 0.5 m, significantly lower than the multi-year average of 1.2 m reported previously. The representative bottom orbital velocities remained relatively stable at 0.03-0.05 m/s. The mean currents at 0.4-0.7 m above seabed were dominated by tides, with a maximum velocity of 0.16 m/s and mean velocity of ca. 0.05 m/s, in contrast to the significant wave-driven currents as reported widely on reef flats in the Indo-Pacific region. Under the influence of combined waves and currents, and the high roughness associated with reef canopy structure, distinct variations in the velocity profile in the bottom boundary layer (ca. 0.5-3 m above seabed) were observed, with tidal-dominant logarithmic profiles during the flood tide and wave-dominant potential flows during the ebb tide. This asymmetrical flow profile is conducive to generating net material transport and maintaining a great water quality cycle.
Owing to the high roughness associated with the reef canopy structure, large Reynolds shear velocities (ca. 0.02 m/s in average) were exerted on fluids flowing on the rough reef surface, which were also demonstrated by the apparent shear velocities derived from the logarithmic fitting of velocity profile. Both results were much larger than the skin-friction acting on individual mobile sediment particles (0.005-0.008 m/s in average), which was interspersed both within these immobile reef roughness and on the remnant bare seabed between the rough reef structures, with a median grain size of 0.5-1.0 mm. Logarithmic profile analysis further revealed the apparent hydrodynamic roughness lengths and drag coefficients at the three reef sites in the range of 0.1-0.3 m and 0.17-0.35, respectively, owing to the high reef roughness. Both were two orders of magnitude larger than those observed on siliceous muddy and sandy seabeds.
The turbulent kinetic energy and its dissipation rate were also found as high as 10-1 m²/s² and 10-4 W/kg, respectively, indicating strong mixing and efficient nutrient uptake in the water columns above the reef canopy structure. This, along with the low suspended sediment concentrations (< 1 mg/L), provide a good condition for health coral growth.
Additional observation and modeling works are necessary for further investigations into the hydrodynamic processes across the reef environment in the South China Sea, in particular, the sediment dynamics under high-energy conditions, as well as to parameterize the size and shape of coral rubble and branches. This discovery suggests that when creating large-scale models of coastal and marine environments, it’s crucial to account for these differences by assigning varied levels of drag coefficient to coral reefs versus sandy estuarine coasts and shelves. Incorporating these distinct characteristics is essential for accurately predicting hydrodynamics, nutrients and sediment transport in models that include both coral reefs and other coastal systems.
Data availability statement
The original contributions presented in the study are included in the article/supplementary material. Further inquiries can be directed to the corresponding authors.
Author contributions
JL: Conceptualization, Data curation, Formal analysis, Investigation, Methodology, Validation, Visualization, Writing – original draft, Writing – review & editing. YW: Formal analysis, Investigation, Project administration, Resources, Software, Supervision, Validation, Visualization, Writing – original draft, Writing – review & editing. SG: Conceptualization, Funding acquisition, Investigation, Project administration, Resources, Supervision, Validation, Visualization, Writing – review & editing.
Funding
The author(s) declare that financial support was received for the research, authorship, and/or publication of this article. This study was supported by a grant from the National Science Foundation of China (NSFC No. 41530962).
Acknowledgments
We thanked Xianpei Su, Yongzhan Zhang, Shaowen Liu, Jieping Tang, Hao Wu, and Tingfei Lan for their help in the field work.
Conflict of interest
The authors declare that the research was conducted in the absence of any commercial or financial relationships that could be construed as a potential conflict of interest.
Publisher’s note
All claims expressed in this article are solely those of the authors and do not necessarily represent those of their affiliated organizations, or those of the publisher, the editors and the reviewers. Any product that may be evaluated in this article, or claim that may be made by its manufacturer, is not guaranteed or endorsed by the publisher.
References
Bramante J. F., Perron J. T., Ashton A. D., Donnelly J. P. (2020). Experimental quantification of bedrock abrasion under oscillatory flow. Geology 48, 541–545. doi: 10.1130/G47089.1
Bricker J. D., Monismith S. G. (2007). Spectral wave–turbulence decomposition. J. Atmospheric Oceanic Technol. 24, 1479–1487. doi: 10.1175/JTECH2066.1
Chu P. C., Edmons N. L., Fan C. (1999). Dynamical mechanisms for the South China Sea seasonal circulation and thermohaline variabilities. J. Phys. Oceanography 29, 2971–2989. doi: 10.1175/1520-0485(1999)029<2971:DMFTSC>2.0.CO;2
Chu P. C., Qi Y., Chen Y., Shi P., Mao Q. (2004). South China sea wind-wave characteristics. part I: validation of WAVEWATCH-III using TOPEX/Poseidon data. J. atmospheric oceanic Technol. 21, 1718–1733. doi: 10.1175/JTECH1661.1
Chu P. C., Veneziano J. M., Fan C., Carron M. J., Liu W. T. (2000). Response of the South China Sea to tropical cyclone Ernie 1996. J. Geophysical Research: Oceans 105, 13991–14009. doi: 10.1029/2000JC900035
Collins M., Ke X., Gao S. (1998). Tidally-induced flow structure over intertidal flats. Estuarine Coast. Shelf Sci. 46, 233–250. doi: 10.1006/ecss.1997.0260
Cuttler M., Hansen J., Lowe R., Drost E. J. F. (2018). Response of a fringing reef coastline to the direct impact of a tropical cyclone. Limnology Oceanography Lett. 3, 31–38. doi: 10.1002/lol2.10067
Davis K. A., Pawlak G., Monismith S. G. (2021). Turbulence and coral reefs. Annu. Rev. Mar. Sci. 13. doi: 10.1146/annurev-marine-042120-071823
Dean R. G., Dalrymple R. A. (1991). Water wave mechanics for engineers and scientists (World Scientific Publishing Co. Pte. Ltd. 5 Toh Tuck Link, Singapore 596224: world scientific publishing Co Inc). doi: 10.1142/1232
Dong Y., Liu Y., Hu C., Xu B. (2019). "Coral reef geomorphology of the Spratly Islands: A simple method based on time-series of Landsat-8 multi-band inundation maps." ISPRS Journal of Photogrammetry and Remote Sensing 157, 137–154. doi: 10.1016/j.isprsjprs.2019.09.011
Dyer K. (1986). Coastal and estuarine sediment dynamics Vol. 1986 (chichesteR, Sussex(UK: John wiley and sons), 358.
Falkowski P. G., Ziemann D., Kolber Z., Bienfang P. K. (1991). Role of eddy pumping in enhancing primary production in the ocean. Nature 352, 55–58. doi: 10.1038/352055a0
Falter J. L., Atkinson M. J., Merrifield M. A. (2004). Mass-transfer limitation of nutrient uptake by a wave-dominated reef flat community. Limnology Oceanography 49, 1820–1831. doi: 10.4319/lo.2004.49.5.1820
Fredsøe J., Deigaard R. (1992). Mechanics of coastal sediment transport (World Scientific Publishing Co. Pte. Ltd. 5 Toh Tuck Link, Singapore 596224: World Scientific). doi: 10.1142/1546
Gao S. (1997). A solution to the third type of linear relationships between two variables in earth sciences. J. Ocean Univ. Qingdao 27, 373–381. doi: 10.16441/j.cnki.hdxb.1997.03.016
Gordon L., Lohrmann A. (2002). “Near-shore Doppler current meter wave spectra,” in Ocean Wave Measurement and Analysis, (2001) (Alexander Bell Drive Reston, VA 20191-4400), 33–43. doi: 10.1061/9780784406045
Gourlay M. R., Colleter G. (2005). Wave-generated flow on coral reefs—an analysis for two-dimensional horizontal reef-tops with steep faces. Coast. Eng. 52, 353–387. doi: 10.1016/j.coastaleng.2004.11.007
Grant W. D., Madsen O. S. (1986). The continental-shelf bottom boundary layer. Annu. Rev. Fluid Mechanics 18, 265–305. doi: 10.1146/annurev.fl.18.010186.001405
Hardy T. A., Young I. R. (1996). Field study of wave attenuation on an offshore coral reef. J. Geophysical Research: Oceans 101, 14311–14326. doi: 10.1029/96JC00202
Harney J., Fletcher C. I. I. I. (2003). A budget of carbonate framework and sediment production, Kailua Bay, Oahu, Hawaii. J. Sedimentary Res. 73, 856–868. doi: 10.1306/051503730856
Harris D. L., Rovere A., Casella E., Power H., Canavesio R., Collin A., et al. (2018). Coral reef structural complexity provides important coastal protection from waves under rising sea levels. Sci. Adv. 4, eaao4350. doi: 10.1126/sciadv.aao4350
Harris D. L., Vila-Concejo A., Webster J. M. (2014). Geomorphology and sediment transport on a submerged back-reef sand apron: One Tree Reef, Great Barrier Reef. Geomorphology 222, 132–142. doi: 10.1016/j.geomorph.2014.03.015
He Q., Liu G., Wang X., Zheng Z., Duan K., Han X., et al. (2021). Submarine geomorphologic features and genetic mechanism in the Xuande atoll, Xisha Islands. Haiyang Xuebao 43, 81. doi: 10.12284/hyxb2021078
Hearn C. J. (1999). Wave-breaking hydrodynamics within coral reef systems and the effect of changing relative sea level. J. Geophysical Research: Oceans 104, 30007–30019. doi: 10.1029/1999JC900262
Hench J. L., Leichter J. J., Monismith S. G. (2008). Episodic circulation and exchange in a wave-driven coral reef and lagoon system. Limnology Oceanography 53, 2681–2694. doi: 10.4319/lo.2008.53.6.2681
Hopley D., Graham T., Rasmussen C. (1997). “Submerged shelf-edge reefs, coral reefs, Great Barrier Reef Australia, PACON 96,” in Recent Advances in Marine Science and Technology (Honolulu, HI: PACON International P.O. Box 11568), 305–315.
Kench P. S., Brander R. W. (2006). Wave processes on coral reef flats: implications for reef geomorphology using Australian case studies. J. Coast. Res. 2006, 209–223. doi: 10.2112/05A-0016.1
Kench P. S., Chan J., Owen S., McLean R. (2014). The geomorphology, development and temporal dynamics of Tepuka Island, Funafuti atoll, Tuvalu. Geomorphology 222, 46–58. doi: 10.1016/j.geomorph.2014.03.043
Kennedy D., Woodroffe C. (2002). Fringing reef growth and morphology: a review. Earth-Science Rev. 57, 255–277. doi: 10.1016/S0012-8252(01)00077-0
Kunkel C. M., Hallberg R. W., Oppenheimer M. (2006). Coral reefs reduce tsunami impact in model simulations. Geophysical Res. Lett. 33. doi: 10.1029/2006GL027892
Li R., Voulgaris G., Wang Y. P. (2022). Turbulence structure and burst events observed in a tidally induced bottom boundary layer. J. Geophysical Research: Oceans 127, e2021JC018036.
Li W., Zhao J. (2010). Characteristics of wave seasonal variations in the Spratly islands, South China Sea. Guangdong Meteorology 32, 24–26.
Longuet-Higgins M. S. (1963). The effect of non-linearities on statistical distributions in the theory of sea waves. J. fluid mechanics 17, 459–480. doi: 10.1017/S0022112063001452
Longuet-Higgins M. S., Stewart R. (1964). Radiation stresses in water waves; a physical discussion, with applications. Deep sea Res. oceanographic abstracts 11 (4), 529–562. doi: 10.1016/0011-7471(64)90001-4
Lowe R. J., Falter J. L. (2015). Oceanic forcing of coral reefs. Annu. Rev. Mar. Sci. 7, 43–66. doi: 10.1146/annurev-marine-010814-015834
Lowe R. J., Falter J. L., Bandet M. D., Pawlak G., Atkinson M. J., Monismith S. G., et al. (2005). Spectral wave dissipation over a barrier reef. J. Geophysical Research: Oceans 110.
Lowe R. J., Falter J. L., Monismith S. G., Atkinson M. J. (2009). Wave-driven circulation of a coastal reef–lagoon system. J. Phys. Oceanography 39, 873–893. doi: 10.1175/2008JPO3958.1
Lowe R. J., Shavit U., Falter J. L., Koseff J. R., Monismith S. G. (2008). Modeling flow in coral communities with and without waves: A synthesis of porous media and canopy flow approaches. Limnology Oceanography 53, 2668–2680. doi: 10.4319/lo.2008.53.6.2668
Masselink G., Tuck M., McCall R., van Dongeren A., Ford M., Kench P. (2019). Physical and numerical modeling of infragravity wave generation and transformation on coral reef platforms. J. Geophysical Research: Oceans 124, 1410–1433. doi: 10.1029/2018JC014411
Monismith S. G. (2007). Hydrodynamics of coral reefs. Annu. Rev. Fluid Mech. 39, 37–55. doi: 10.1146/annurev.fluid.38.050304.092125
Monismith S. G., Herdman L. M., Ahmerkamp S., Hench J. L. (2013). Wave transformation and wave-driven flow across a steep coral reef. J. Phys. Oceanography 43, 1356–1379. doi: 10.1175/JPO-D-12-0164.1
Monismith S. G., Rogers J. S., Koweek D., Dunbar R. B. (2015). Frictional wave dissipation on a remarkably rough reef. Geophysical Res. Lett. 42, 4063–4071. doi: 10.1002/2015GL063804
Montaggioni L. F. (2005). History of Indo-Pacific coral reef systems since the last glaciation: development patterns and controlling factors. Earth-Science Rev. 71, 1–75. doi: 10.1016/j.earscirev.2005.01.002
Ortiz A. C., Ashton A. D. (2019). Exploring carbonate reef flat hydrodynamics and potential formation and growth mechanisms for motu. Mar. Geology 412, 173–186. doi: 10.1016/j.margeo.2019.03.005
Pandolfi J. M., Connolly S. R., Marshall D. J., Cohen A. L. (2011). Projecting coral reef futures under global warming and ocean acidification. science 333, 418–422. doi: 10.1126/science.1204794
Pomeroy A., Lowe R. J., Ghisalberti M., Storlazzi C., Symonds G., Roelvink D. (2017). Sediment transport in the presence of large reef bottom roughness. J. Geophysical Research: Oceans 122, 1347–1368. doi: 10.1002/2016JC011755
Pomeroy A., Lowe R. J., Ghisalberti M., Winter G., Storlazzi C., Cuttler M. (2018). Spatial variability of sediment transport processes over intratidal and subtidal timescales within a fringing coral reef system. J. Geophysical Research: Earth Surface 123, 1013–1034. doi: 10.1002/2017JF004468
Pomeroy A., Lowe R., Symonds G., Van Dongeren A., Moore C. (2012). The dynamics of infragravity wave transformation over a fringing reef. J. Geophysical Research: Oceans 117 (C11), 1–17. doi: 10.1029/2012JC008310
Pomeroy A., Storlazzi C. D., Rosenberger K. J., Lowe R. J., Hansen J. E., Buckley M. L. (2021). The contribution of currents, sea-swell waves, and infragravity waves to suspended-sediment transport across a coral reef-lagoon system. J. Geophysical Research: Oceans 126, e2020JC017010. doi: 10.1029/2020JC017010
Press W. H., Flannery B. P., Teukolsky S. A., Vetterling W. T. (1992). Numerical Recipes in Fortran 77: The Art of Scientific Computing 2nd Edition-Volume 1 of Fortran Numerical Recipes (Cambridge university press).
Purdy E. G., Gischler E. (2005). The transient nature of the empty bucket model of reef sedimentation. Sedimentary Geology 175, 35–47. doi: 10.1016/j.sedgeo.2005.01.007
Rosenberger K. J., Storlazzi C. D., Cheriton O. M., Pomeroy A. W., Hansen J. E., Lowe R. J., et al. (2020). Spectral wave-driven bedload transport across a coral reef flat/lagoon complex. Front. Mar. Sci. 7, 875. doi: 10.3389/fmars.2020.513020
Rosman J. H., Hench J. L. (2011). A framework for understanding drag parameterizations for coral reefs. J. Geophysical Research: Oceans 116, 1–15. doi: 10.1029/2010JC006892
Ruessink B., Ramaekers G., Van Rijn L. (2012). On the parameterization of the free-stream non-linear wave orbital motion in nearshore morphodynamic models. Coast. Eng. 65, 56–63. doi: 10.1016/j.coastaleng.2012.03.006
Ruiz J., Macías D., Peters F. (2004). Turbulence increases the average settling velocity of phytoplankton cells. Proc. Natl. Acad. Sci. 101, 17720–17724. doi: 10.1073/pnas.0401539101
Scandura P., Foti E. (2011). Measurements of wave-induced steady currents outside the surf zone. J. Hydraulic Res. 49, 64–71. doi: 10.1080/00221686.2011.591046
Soulsby R. L. (1997). Dynamics of marine sands:A manual for practical applications (Oxon, UK: Thomas Telford Publications).
Soulsby R., Humphery J. (1990). Field observations of wave-current interaction at the sea bed, Water wave kinematics. Springer pp, 413–428.
Soulsby R. L., Whitehouse R. (1997). Threshold of sediment motion in coastal environments. Australasian Port and Harbour Conference (Center for Advanced Engineering, University of Canterbury) (6th: 1997: Christchurch, NZ), Christchurch, NZ: Centre for Advanced Engineering, University of Canterbury 145–150.
Storlazzi C. D., Brown E., Field M., Rodgers K., Jokiel P. (2005). A model for wave control on coral breakage and species distribution in the Hawaiian Islands. Coral Reefs 24, 43–55. doi: 10.1007/s00338-004-0430-x
Storlazzi C. D., Field M. E., Bothner M. H., Presto M., Draut A. E. (2009). Sedimentation processes in a coral reef embayment: Hanalei Bay, Kauai. Mar. Geology 264, 140–151. doi: 10.1016/j.margeo.2009.05.002
Symonds G., Black K. P., Young I. R. (1995). Wave-driven flow over shallow reefs. J. Geophysical Research: Oceans 100, 2639–2648. doi: 10.1029/94JC02736
Toomey M. R., Ashton A. D., Perron J. T. (2013). Profiles of ocean island coral reefs controlled by sea-level history and carbonate accumulation rates. Geology 41, 731–734. doi: 10.1130/G34109.1
Van Dongeren A., Lowe R., Pomeroy A., Trang D. M., Roelvink D., Symonds G., et al. (2013). Numerical modeling of low-frequency wave dynamics over a fringing coral reef. Coast. Eng. 73, 178–190. doi: 10.1016/j.coastaleng.2012.11.004
Van Rijn L. C. (2007). Unified view of sediment transport by currents and waves. I: Initiation of motion, bed roughness, and bed-load transport. J. Hydraulic Eng. 133, 649–667. doi: 10.1061/(ASCE)0733-9429(2007)133:6(649)
Wang Y., Gao S., Ke X. (2004). Observations of boundary layer parameters and suspended sediment transport over the intertidal flats of northern Jiangsu, China. Acta Oceanologica Sin. 23, 437–448.
Wang T., Liang G., Zhou Z., Cui D., Wen A. (2012). Analysis of the wave characteristics at Yongshu Reef. Mar. Sci. Bull. 31, 278–282.
Wiberg P. L., Sherwood C. R. (2008). Calculating wave-generated bottom orbital velocities from surface-wave parameters. Comput. Geosciences 34, 1243–1262. doi: 10.1016/j.cageo.2008.02.010
Woodroffe C. D., Webster J. M. (2014). Coral reefs and sea-level change. Mar. Geology 352, 248–267. doi: 10.1016/j.margeo.2013.12.006
Zeng Z. (1984). Geomorphological features of atolls in the south China sea. Mar. Sci. Bull. 3, 40–45.
Zhao H., Sha Q., Zhu Y. (1992). Quaternary Coral Reef Geology of Yongshu Reef, Nansha Islands (Beijing: Ocean Press).
Zhao H., Zhang Q., Song C., Qiu Z., Lin X., Yuan J. (1999). Geomorphology and environment of the south China coast and the south China sea islands (Beijing: Science Press).
Zhou Z., Li S., Liang G. (2012). Characteristic analysis of near surface wind around fiery cross reef of Nansha Islands. Guangdong Meteorology 34, 14r17.
Zhu L., Chen X., Qiu Z. (2005). Characteristics analysis of tide and current at yongshu reef. Mar. Sci. Bull. 24, 1–7.
Zhu Q., van Prooijen B., Wang Z., Ma Y., Yang S. (2016). Bed shear stress estimation on an open intertidal flat using in situ measurements. Estuarine Coast. Shelf Sci. 182, 190–201. doi: 10.1016/j.ecss.2016.08.028
Keywords: bottom boundary layer, waves-current interactions, shear stress, coral reef, South China Sea
Citation: Li J, Wang YP and Gao S (2024) In situ hydrodynamic observations on three reef flats in the Nansha Islands, South China Sea. Front. Mar. Sci. 11:1375301. doi: 10.3389/fmars.2024.1375301
Received: 23 January 2024; Accepted: 19 February 2024;
Published: 21 March 2024.
Edited by:
Yifei Zhao, Nanjing Normal University, ChinaReviewed by:
Zhiyuan Wu, Changsha University of Science and Technology, ChinaJun Cheng, Kean University, United States
Copyright © 2024 Li, Wang and Gao. This is an open-access article distributed under the terms of the Creative Commons Attribution License (CC BY). The use, distribution or reproduction in other forums is permitted, provided the original author(s) and the copyright owner(s) are credited and that the original publication in this journal is cited, in accordance with accepted academic practice. No use, distribution or reproduction is permitted which does not comply with these terms.
*Correspondence: Jin Li, amlubGk2MDU5QGdtYWlsLmNvbQ==; Shu Gao, c2h1Z2FvQG5qdS5lZHUuY24=