 Riccardo Gerin1
 Riccardo Martellucci1
 Gilda Savonitto1*
 Giulio Notarstefano1
 Cinzia Comici1Nevio Medeot1
 Rade Garić2
 Mirna Batistić2
 Carlotta Dentico1,3Vanessa Cardin1
 Piero Zuppelli1Antonio Bussani1Massimo Pacciaroni1Elena Mauri1
- 1National Institute of Oceanography and Applied Geophysics – OGS, Trieste, Italy
- 2Institute for Marine and Coastal Research, University of Dubrovnik, Dubrovnik, Croatia
- 3Department of Environmental Sciences, Informatics and Statistics (DAIS), University Ca’ Foscari of Venice, Venezia, Italy
Dissolved oxygen (DO) is one of the most important drivers of ocean biogeochemical cycles and marine life, and in many areas its concentration has declined due to climate change. In recent decades, a growing number of autonomous oceanographic platforms has been equipped with sensors for direct in situ measurements of oxygen levels. However, to ensure high quality and comparable data, these observations need to be validated or, if necessary, corrected. In this paper, we compiled all the available DO data collected by Argo floats and gliders in the South Adriatic Pit (Mediterranean Sea) between 2014 and 2020. This dataset includes data for which it was not possible to apply conventional quality-control methods. Therefore, we had to apply tailored procedures based on well-established best practices for correction. The aim is to showcase how these tailored procedures allowed us to achieve the best possible quality of data and generate consistent datasets. The drift of the glider DO sensors related to storage was also estimated. The described procedure could be useful in similar cases where the conventional methods are not viable, thus making available potentially useful data.
1 Introduction
Dissolved oxygen (DO) is one of the key drivers of ocean biogeochemical cycles and marine life. In a global warming scenario, the strong negative correlation between the DO concentration and temperature has led to a decreasing trend of oxygen content in the ocean (Garcia-Soto et al., 2021 and references therein). Reduced ventilation of deeper waters due to the increased stratification of upper waters and additional complex mechanisms have further exacerbated this decline (e.g., Deutsch et al., 2014; Schmidtko et al., 2017; Oschlies et al., 2018). Thus, the study of DO concentration is fundamental to understand the ocean’s feedback to climate change (e.g., Joos et al., 2003; Song et al., 2019; Garcia-Soto et al., 2021).
The oceanographic community has made great efforts to collect oxygen data and develop appropriate technologies for their acquisition. DO content can be quantified directly by an analytic procedure, i.e., Winkler titration (Carpenter, 1965). This allows an accurate estimate of DO concentration in water from discrete samples, but requires a research vessel for sample collection and subsequent laboratory analyses.
In the past decades, a growing number of autonomous platforms [Argo floats (Wong et al., 2020) and gliders] has been equipped with sensors for in situ measurements of DO by electrochemistry or optics. Although the potential for data acquisition is surging thanks to the growing deployment of these platforms, the quality and accuracy of the collected data are often suboptimal (Bittig et al., 2018). In particular, optical sensors (or Optodes) can undergo a drift in oxygen sensitivity (i.e., reduced quenching of the luminophore) during both deployment at sea and storage (Johnson et al., 2015; Bittig et al., 2018). However, while the Optodes can drift within a few tenths of a percent per year during their usage at sea, most of the drift takes place when they are stored in the air, resulting in a decrease in oxygen sensitivity of approximately 5% per year for recently manufactured sensors, while the older ones tend to drift less markedly (approximately 1% per year or less). Moreover, Aanderaa DO sensors have shown a loss of sensitivity of 3%–8% per year prior to deployment (Bushinsky et al., 2017). All these issues make it necessary to investigate ways to correct and validate DO records. Specifically, as summarized by Bittig et al. (2018), quality assessment and correction of DO data from autonomous platforms (i.e., Argo floats, moorings, gliders) can be done in the following several ways:
(i) By comparison with discrete in situ Winkler samples collected along the water column. This is the optimal and recommended method, but it is not always possible, as such analytical measurements can only be performed during dedicated oceanographic cruises, which are rare compared to the continuous sampling offered by autonomous platforms.
(ii) By Optode in-air calibration at the surface together with hydrographic data on a deep isopycnal (to allow a two-point correction). To apply this method, the manufacturers were induced to rethink the Argo float design changing the position of the oxygen sensor, by raising it to allow direct contact with the air when the platform is at the sea surface. However, in-air calibration is unusable for old-design Argo floats or other platforms. In addition, this method may be time consuming and difficult to use while underway, as it requires the instrument to be in free air logging data for several hours (Aanderaa Data Instruments, 2018).
(iii) By calibration on the ship or in a laboratory at 0% and 100% oxygen saturation (preferably in the temperature range in which the sensor is to be used). This method provides high-quality adjustments, but—like the previous one—it can be time consuming and difficult to apply during expeditions, and it requires dedicated equipment (Aanderaa Data Instruments, 2018).
(iv) By comparison with climatological data. This last method has been proposed by Takeshita et al. (2013), for instance, for the correction of DO measurements obtained from old-design Argo floats (i.e., before 2018). However, for some areas, it might not be possible to obtain a significant and up-to-date climatology for comparison.
The abovementioned quality-control methodologies, in concert with recent efforts to decrease the drift and increase the sensor accuracy, have led and are leading to an ever-increasing quality of datasets. For example, after 2016, the sensing foils of the Optodes are subjected at the factory to a pre-conditioning, the so-called “burn-in period,” which has been found to significantly reduce the drift that used to occur prior to the deployment in previously manufactured Optodes (Tengberg and Hovdenes, 2014; López-García et al., 2022). Also, the introduction of the sensors’ multipoint calibration currently ensures a higher accuracy of DO measurements (Tengberg and Hovdenes, 2014; Bittig et al., 2018). However, there still remain cases in which these procedures are not viable; therefore, it is necessary to employ tailored correction procedures possibly combining the conventional ones. The aim of this study is to provide the scientific community with a case study of correction of DO data from autonomous platforms for which the conventional correction methods were not applicable.
We considered the available DO data collected by autonomous platforms in the South Adriatic Pit (thereafter referred to as “SAP”; Southern Adriatic Sea, Central–North Mediterranean Sea) between 2014 and 2020. In this period, only a few Winkler samplings were available; the Argo float data were mainly from old-design floats (i.e., with the Optode always remaining underwater even when the Argo float reached the surface, thus impeding the in-air calibration), and the glider missions were launched from small ships of opportunity and carried out without following the actually suggested pre-deployment best practices (e.g., air saturation quality check and two-point calibration; López-García et al., 2022). Besides, the study area is known to be a complex area where the climatology cannot resolve the fast-evolving dynamics properly (Zavatarelli et al., 1998; Jeffries and Lee, 2007; Lipizer et al., 2014; Mavropoulou et al., 2020; Pranić et al., 2021; Šepić et al., 2022). The “Materials and Equipment” and “Methods” sections contain a description of the study area and the available data therein in the selected period, followed by a description of how these data have been validated and corrected following tailored procedures. The “Results” and “Discussion” sections highlight that the corrected data from all the autonomous platforms are consistent with each other, thus constituting a robust and reliable dataset, and provide perspectives for the use of this procedure. Moreover, the storage-related drift of the glider DO sensors was also estimated.
The corrected DO concentration dataset has been made available on a public repository at https://doi.org/10.13120/6sbs-2v29.
2 Materials and equipment
2.1 Study area
The Adriatic Sea is commonly known as the main dense water source of the Eastern Mediterranean (Orlić et al., 1992; Mauri et al., 2016). Its southern part is characterized by the SAP, a large depression more than 1,200 m deep (Figure 1A). The water exchange with the Mediterranean Sea takes place through the Otranto Channel, whose sill is approximately 800 m deep.
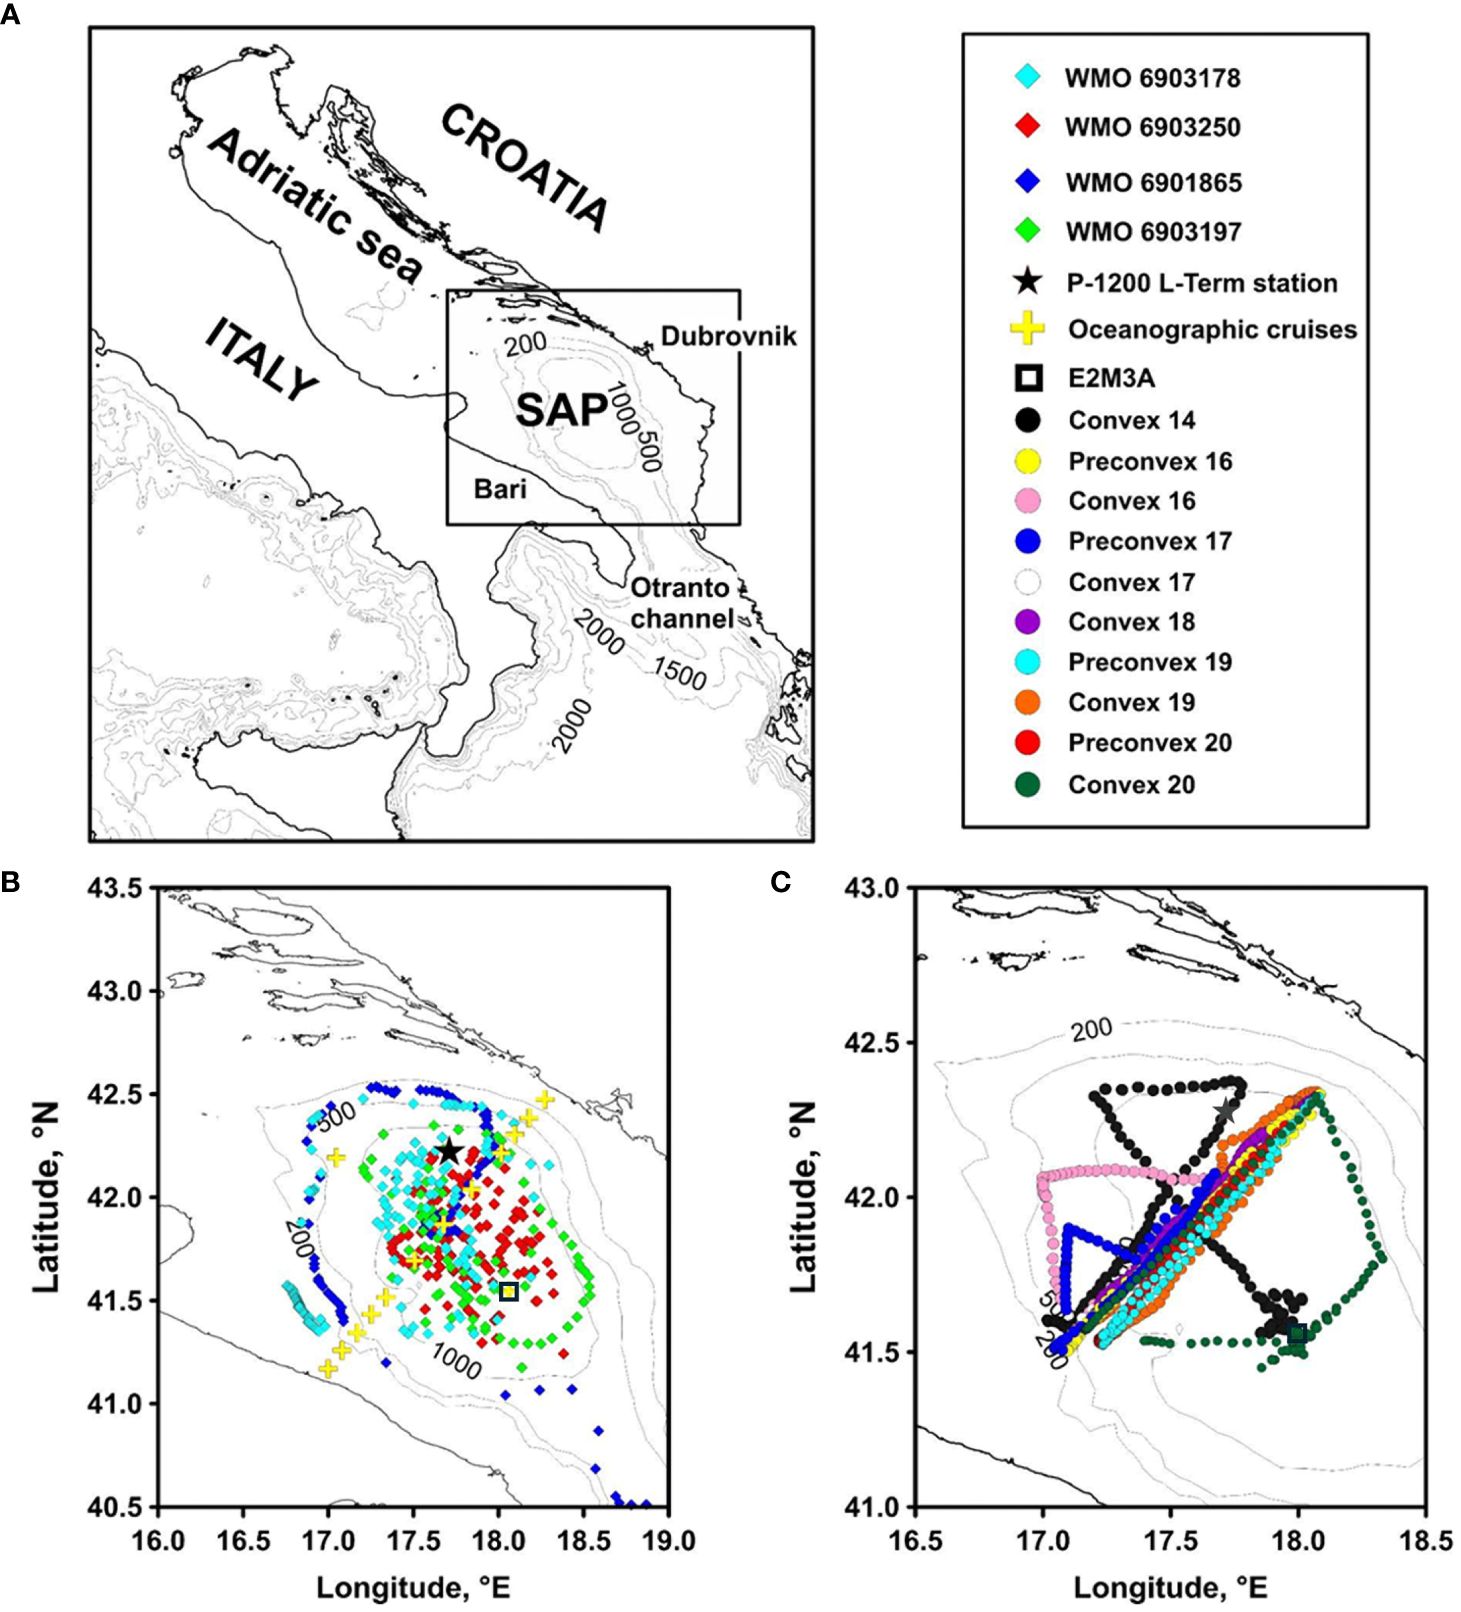
Figure 1 Maps of the study area. The gray lines depict the bathymetry at 200-, 500-, 1,000-, 1,500-, and 2,000-m depth. (A) Adriatic Sea with bathymetry. The square indicates the area of the Southern Adriatic Pit (SAP). (B) Representation of the available Argo float profiles’ locations and oceanographic cruise stations (ADREX_2014, ESAW-1, Fix08, and Fix09) in the period 2014–2020 and of the fixed stations’ position (P-1200 L-Term and E2M3A). (C) Surface positions of the gliders during the missions performed in the SAP in the period 2014–2020.
The SAP exhibits a strong seasonal and interannual variability triggered by the advection of water masses with different physical and biogeochemical properties (Gačić et al., 2011; Mihanović et al., 2021; Menna et al., 2022; Civitarese et al., 2023). The Bi-modal Oscillating System (known as BiOS; Gačić et al., 2010; Civitarese et al., 2023) plays a role in this regard, as it influences the exchange between the Adriatic and Ionian Seas by driving decadal oscillations in the Northern Ionian Gyre.
The general circulation in the SAP involves a counterclockwise rotation of the middle and upper water column (Poulain and Cushman-Roisin, 2001; Zonn and Kostianoy, 2016). This fact, together with the SAP bathymetry, allows Lagrangian platforms (such as Argo floats) to remain in this area for long periods of time and eventually to be recovered given the small dimension of the sub-basin (Gonzalez-Santana et al., 2023).
The SAP is also well-oxygenated due to the inflow of the oxygen-rich dense water that forms every year in the Northern Adriatic and reaches the Southern Adriatic after a few months. In spring and summer, an oxygen subsurface maximum is formed in the euphotic zone, approximately between 10 and 50 m depth. In autumn and winter, surface ventilation and mixing of the water column ensure a more homogeneous oxygen distribution (Bensi et al., 2013; Mauri et al., 2016; Di Biagio et al., 2022).
2.2 DO unit
In this work, the DO concentration is expressed in μmol/kg, i.e., the unit recommended for oceanographic applications and used by the most widespread ocean-observing systems (e.g., GO-SHIP and Biogeochemical-Argo, Hood et al., 2010 and Thierry et al., 2022). Normally, DO sensors measure in μmol/l or ml/l, then the conversion to the unit μmol/kg is carried out according to Thierry et al. (2022). This unit is indeed independent of temperature and pressure/depth, which would modify the concentration if expressed in a volumetric unit, even if no oxygen is produced or consumed.
2.3 Data from autonomous platforms
While the physical component of the SAP has been deeply explored, the study of its biogeochemical processes has been limited by the lack of prolonged and densely distributed data (Mavropoulou et al., 2020). To fill this knowledge gap and better understand the SAP variability, extensive sampling with autonomous instruments (Argo floats and gliders; Figures 1B, C) has been conducted over the past decade in addition to the sporadic traditional oceanographic campaigns.
For the present study, Argo float data were retrieved from the Argo Coriolis Global Data Assembly Center (GDAC) (Argo, 2023). In the period 2014–2020, the SAP was explored by four autonomous Argo floats equipped with DO sensors (colored diamonds in Figures 1B, 2). Argo floats profiled the water column from the sea bottom to the sea surface with a frequency of 1–5 days. Each float was identified with a World Meteorological Organization (WMO) number. Argo float WMO 6903178 was equipped with a SBE63 oxygen sensor (accuracy better than ± 3 µmol/kg or ± 2%), while WMO 6901865, 6903197, and 6903250 with an Aanderaa Optode 4330 (accuracy smaller than ± 8 μmol/l or ± 5%, whichever is greater). The latter was equipped with a last generation DO sensor that allowed it to perform the in-air calibration (Johnson et al., 2015; Bittig et al., 2018). In particular, we considered the variable “DOXY,” which is already compensated for the effects of temperature, salinity, and pressure, and the variable “DOXY_ADJUSTED,” which is post-corrected for the climatology starting from “DOXY” (Thierry et al., 2022).
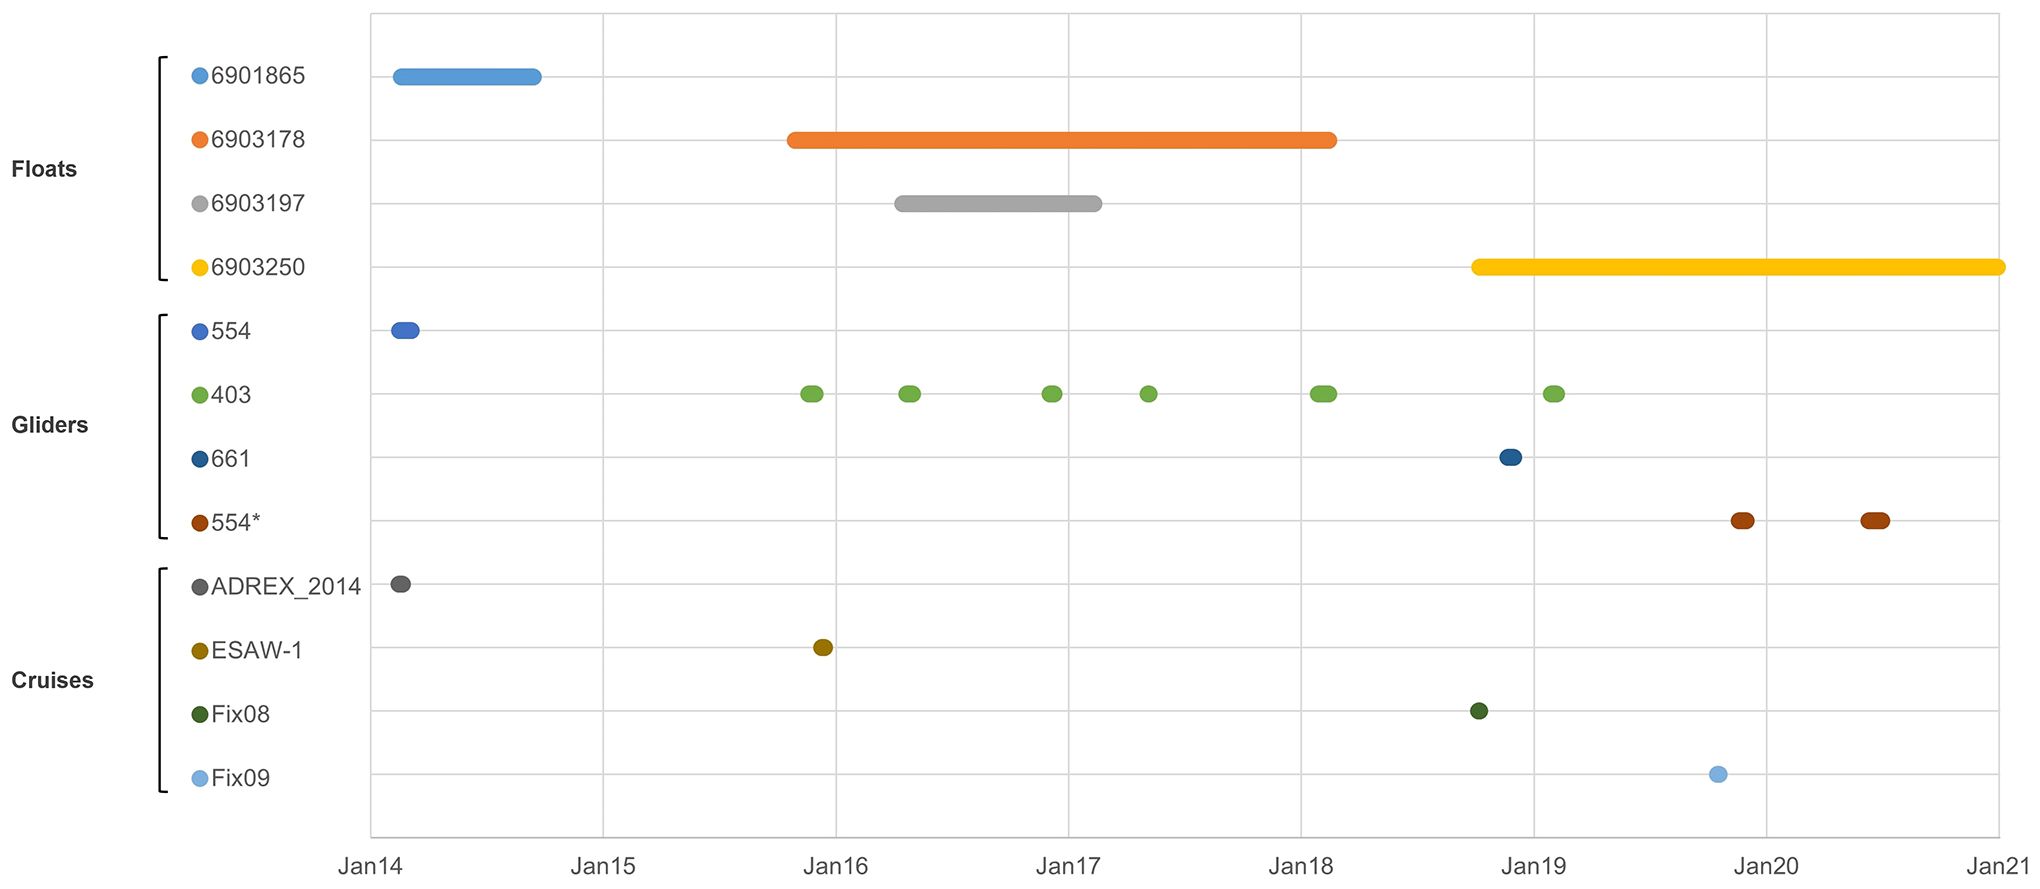
Figure 2 Temporal coverage of the available DO data in the SAP between 2014 and 2020 collected by Argo floats, gliders, and cruises. Ancillary data/fixed stations are not shown.
As for gliders, the raw data (DO, temperature, salinity, and pressure) were obtained from the internal database of the National Institute of Oceanography and Applied Geophysics (OGS). During the period under consideration, the SAP was investigated with three gliders during 10 short-term missions, mainly along the Bari-Dubrovnik transect (colored dots in Figures 1C, 2). The gliders were piloted to continuously acquire data from the sea surface down to a depth of approximately 950 m depth. Two different models were used: the Teledyne Slocum glider (serial number 403) equipped with the Aanderaa Oxygen Optode 4831 and the Kongsberg Seagliders (serial numbers 554 and 661) equipped with the Aanderaa Oxygen Optodes 4330 and 4831, respectively. These Optodes are equipped with a standard foil, whose response time is <25 s (Aanderaa Data Instruments, 2017), and are positioned at a certain distance from the CTD (approximately 1 m for Slocum and a few centimeters for Seaglider; Moat et al., 2016; Gerin, 2021). The accuracy of both sensors is smaller than ±8 μmol/l or ±5%, whichever is greater. The Seaglider 554 was updated and recalibrated in 2015. Since its parameters were changed, it was subsequently referred to as the 554* and considered as a different glider. Noteworthy, at the factory, the DO sensors of the 554 and 661 gliders were only subject to a batch calibration, while the sensors of the 403 and 554* gliders were subject to a two-point calibration (Aanderaa Data Instruments, 2017). During storage, all the sensors were stored wet and with the cap on, as recommended by the manufacturer.
2.4 Reference data
DO data from discrete in situ Winkler samples (yellow cross symbol in Figure 1B, and "Cruises" in Figure 2) of four oceanographic cruises conducted in the area while the autonomous platforms were in operation (i.e., ADREX_2014, ESAW-1, Fix08, and Fix09) were used to correct the DO data from the autonomous platforms when possible. In all the other cases, the Winkler-corrected data of these platforms were used as reference to correct DO data of further platforms, as described in Section 3 “Methods.”
2.5 Ancillary data
DO profiles collected with an SBE43 DO sensor during daily oceanographic cruises at the P-1200 L-term station close to the Croatian coast (42°13′01.0′′ N, 17°42′50.0′′ E; black star in Figures 1B, C) from August 2016 to December 2018 (Mauri et al., 2021; Hure et al., 2022; Jasprica et al., 2022) were used as independent data for comparing them qualitatively with our corrected DO data from the autonomous platforms in the same area.
Additionally, the meteorological data (i.e., air temperature, pressure, and relative humidity) collected from the EMSO South Adriatic Regional Facility’s oceanographic buoy E2M3A (41°31′39.72″ N, 18°4′56.70″ E; Cardin et al., 2020; black square symbol in Figures 1B, C) were used for the a posteriori in-air calibration of the DO sensor of Argo float 6903250 following Johnson et al. (2015). Only the meteorological data corresponding to a relative humidity greater or equal to 50% near the sea surface were considered.
3 Methods
Oxygen sensors undergo several issues, depending on their working principle, their installation position and the way they are operated, which can ultimately lead to dynamic and geometric errors. They can have a slow response time, which causes a significant lag in temperature and raw phase measurements (Bittig et al., 2014; Bittig and Körtzinger, 2017; López-García et al., 2022).
DO sensors are also affected by temperature, salinity, and pressure, which modify the hardware response of the sensors themselves (Bittig et al., 2015; Aanderaa Data Instruments, 2017; Sea-Bird Scientific, 2017; Bittig et al., 2018). To overcome this problem, Aanderaa and Seabird DO sensors are equipped with an integrated temperature sensor that allows instantaneous correction of the DO concentration, while a reference salinity value—set prior to the deployment—can be used to provide an initial automatic salinity compensation. This method guarantees reasonable DO readings for waters with conductivity variations of less than 1 mS/cm (corresponding to a salinity of approximately 0.8 at 20°C). In contrast to temperature and salinity, pressure compensation is usually not considered in the DO sensor, as its effect reduces the DO reading by 3%–4% every 1,000 dbar (Bittig et al., 2015). In the Southern Adriatic Sea, which is characterized by a widely ranging salinity, the DO Argo float data must therefore be corrected during post-processing. In our case, the Argo float DO data (variable “DOXY”) had already been corrected by the GDAC (Racape et al., 2022).
Instead, a post-processing correction was necessary for glider data. For each cast, a time shift was calculated for correcting the response time and geometric lag and then applied to the data, following the routine proposed by IMOS (Woo and Gourcuff, 2021; López-García et al., 2022). Pressure, temperature, and salinity collected by the glider CTD were then used with the time-shifted phases to finally compute the compensated DO concentrations, following Garcia and Gordon (1992). Particular attention was paid to the factory-set salinity reference values (35 for Slocum glider and 0 for Seaglider).
A further correction then had to be applied to all data (i.e., from Argo floats and gliders) to account for sensor drift. The DO data were interpolated with a vertical resolution of 1 m, and the pairs of record platform-Winkler that were spatially and temporally close within certain thresholds were then extracted from the dataset. Some studies indicate that spatial decorrelation in the Adriatic and Mediterranean Sea is generally 15–25 km or more (Russo et al., 1993; Lermusiaux and Robinson, 2001; Waldman et al., 2017; Tzortzis et al., 2021), while the temporal decorrelation scale is 72 h or more (Russo et al., 1993; Poulain, 2001; MERSEA, 2008; Waldman et al., 2017). Therefore, to maximize the number of pairs and minimize the potential bias due to spatiotemporal variability in DO concentration, we chose 25 km and 72 h as the spatial threshold and temporal distance from the Winkler sampling points, respectively.
When it was not possible to assign a Winkler sampling to the platform measurement, as previously done by Queste et al. (2015), we searched for the pairs between these platforms and the previously Winkler-corrected data, and then we performed the same correction procedure. To exclude surface layer variability, we only considered the data below 100 m depth, namely the data under the thermocline in most of our cases in the Adriatic Sea. Given the high complexity of the dynamics at the SAP margins, the profiles collected in the proximity of the slope (i.e., where the bathymetry is less than 500 m) were excluded.
For all the resulting pairs of each Argo float and of each glider mission, we computed a slope correction, as recommended by Thierry et al. (2021). A least square minimization (LSM) between the reference and the data to be corrected was performed using the following linear regression model:
where Y is the DO reference, m is the slope to be optimized, and X is the DO measurement to be corrected.
The goodness of the LSM fit was evaluated by computing the coefficient of determination (R2). Pairs with an R2 of less than 0.65 were discarded, and the slope was recalculated by repeating the LSM procedure with all the remaining pairs. The DO data were then corrected by the corresponding slope (hereafter referred to as “corrected DO”).
Besides, for gliders 403 and 554*, which had been subject to the two-point factory calibration, we estimated the drift over time of the DO sensor related to storage (the deployment drift was considered negligible due to the short duration of the glider missions, i.e., from 4 to 20 days). In particular, we performed a linear regression between the slopes obtained for these gliders during different missions and the number of days after the calibration, which had been performed on 11 April 2013 and 2 November 2018, for gliders 403 and 554*, respectively. In this way, it was possible to extrapolate from the regression a slope for the missions for which no pair had been found for the correction. This calculation was not done for Argo floats, as their drift is considered negligible since they always operate at sea. For each regression, uncertainty was computed as the standard deviation from the regression. Figure 3 depicts an overview of the procedure applied to correct DO data from Argo floats and gliders.
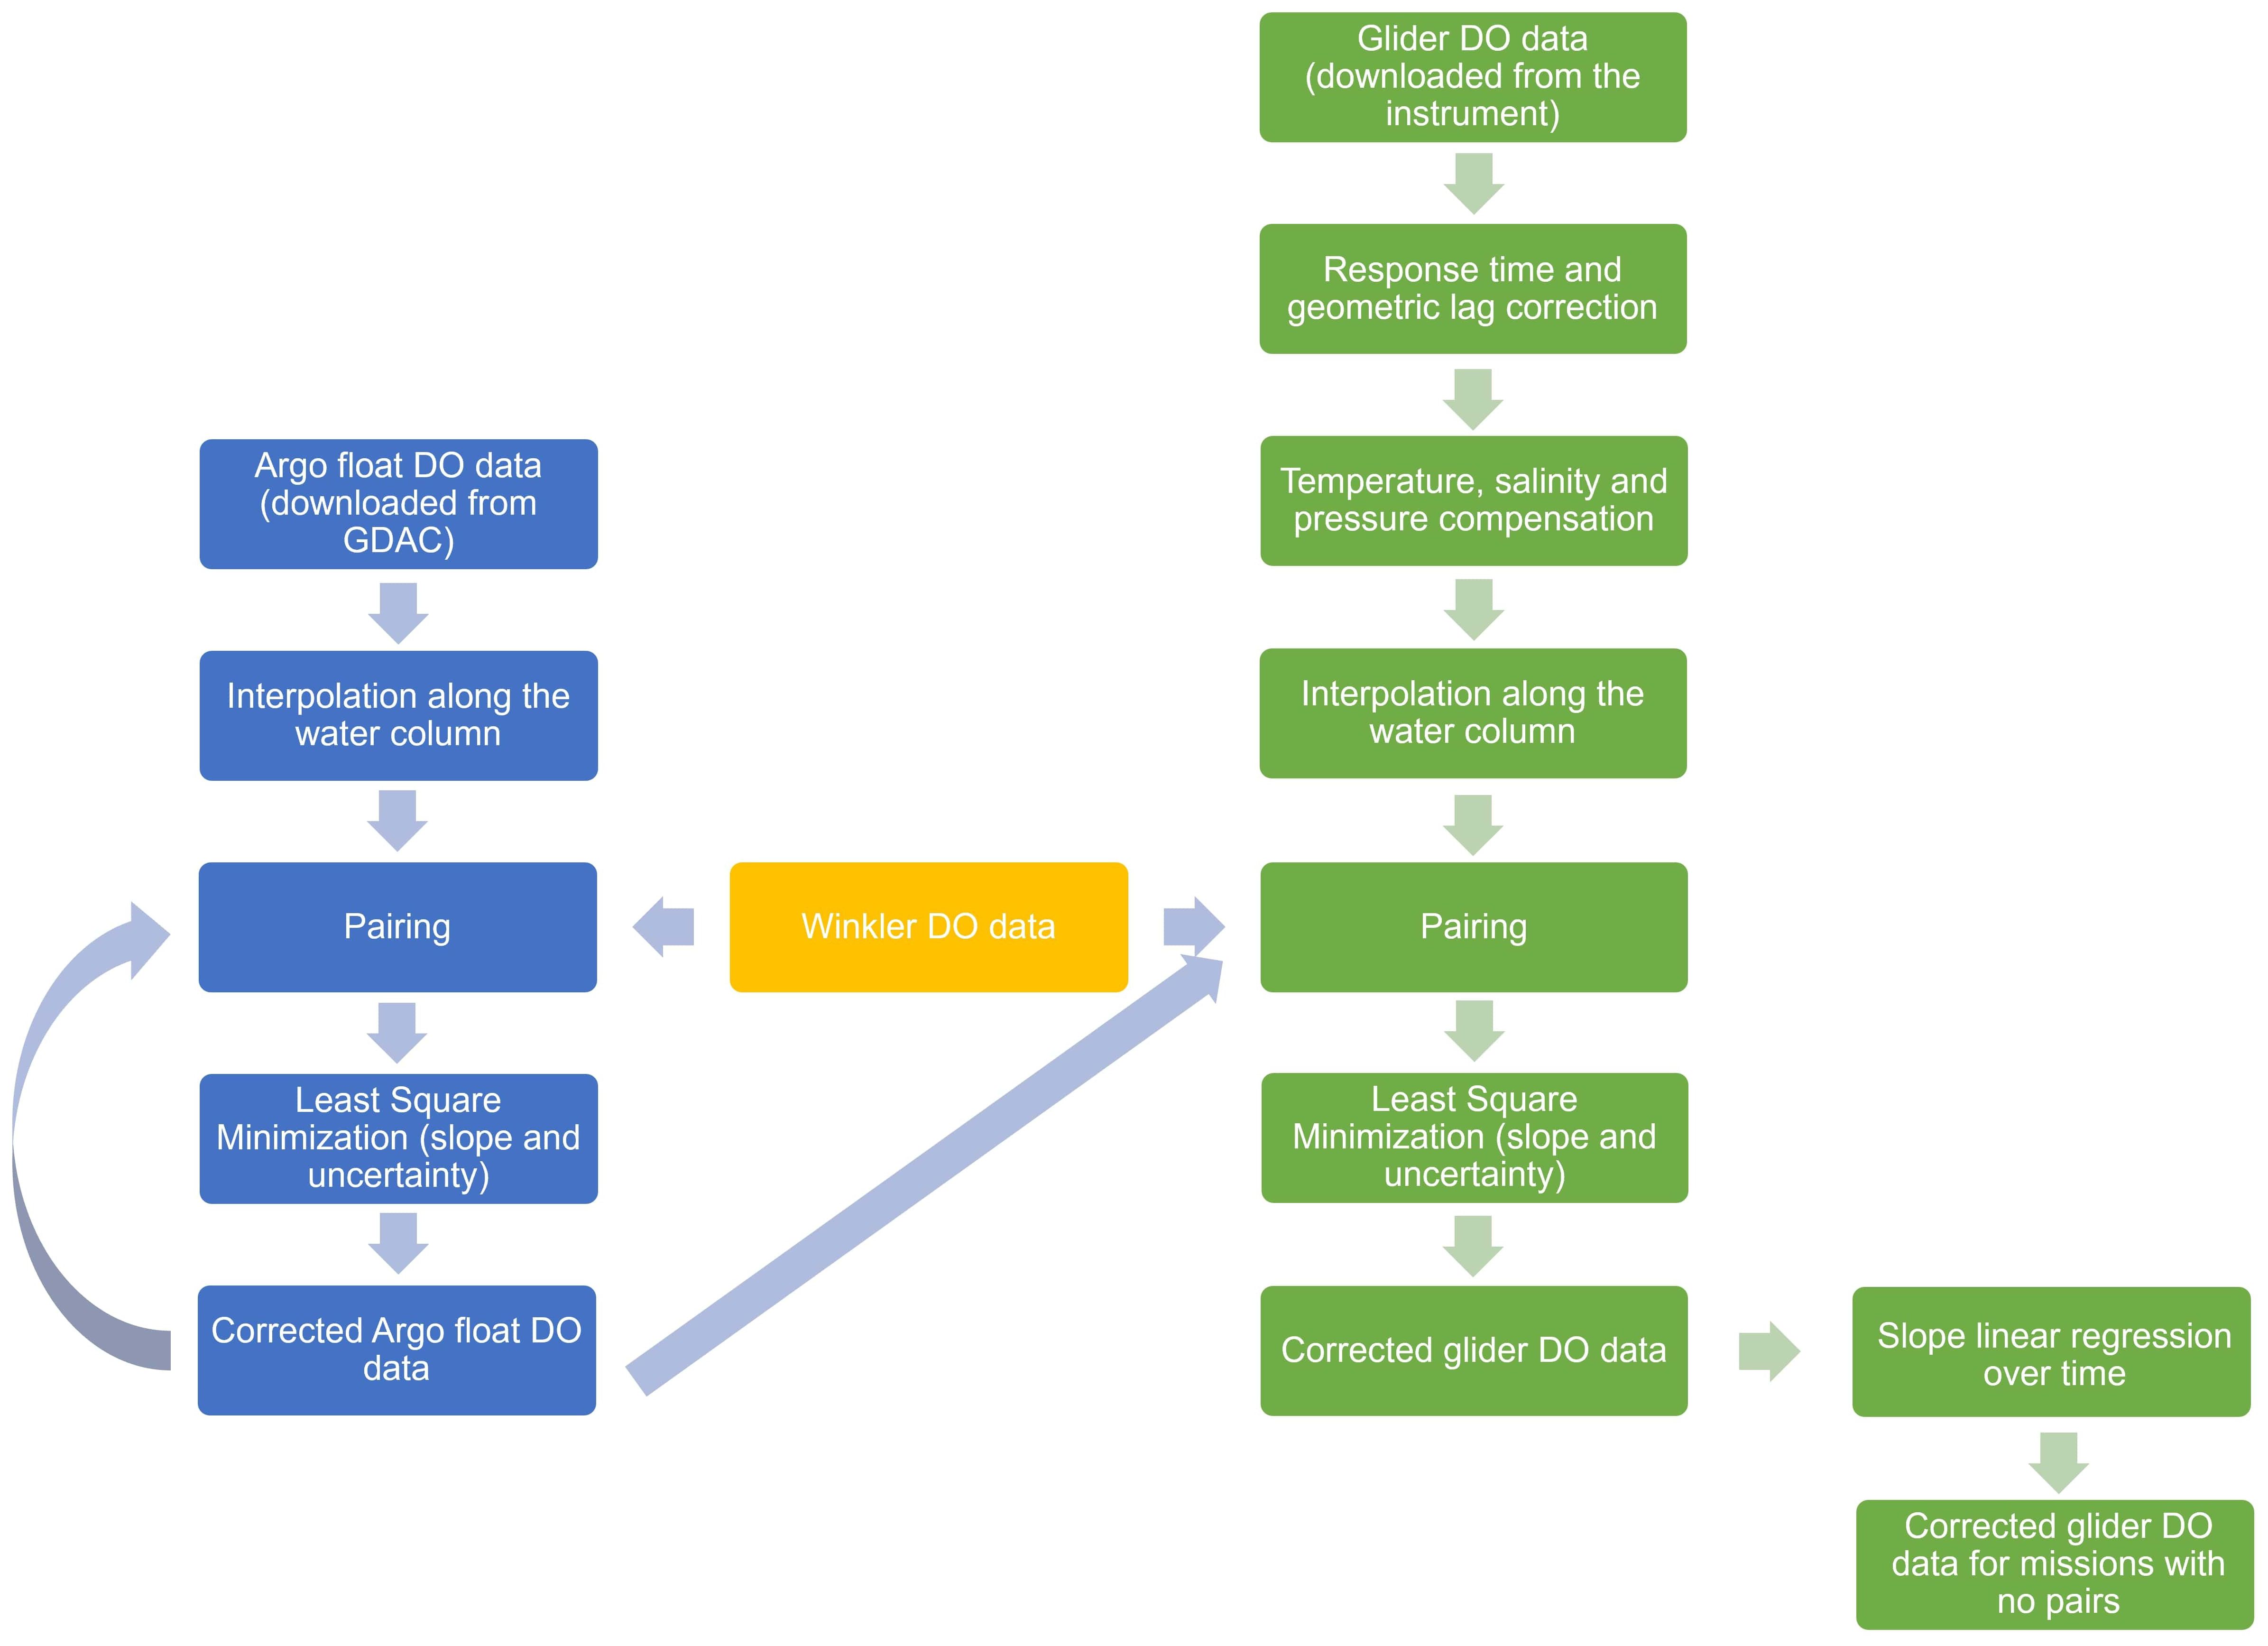
Figure 3 Workflow of the procedure applied to correct DO data from Argo floats and gliders.
Finally, the DO data of the P-1200 station were used as independent data for an additional check of the corrected Argo float and glider DO values falling within the spatiotemporal threshold of 25 km and 72 h from the data of the station itself.
All the analyses and computations were performed with Matlab R2017B software (The MathWorks Inc, 2017).
4 Results
4.1 Argo float data
With the set thresholds of 25 km and 72 h, four float-Winkler pairs were obtained: Argo float 6901865 with Winkler sampling of ADREX_2014 and Argo float 6903250 with Fix08 (Table 1). To find pairs for the remaining floats, we doubled the spatial threshold. Two new pairs were found at 34- and 37-km distance, respectively (Table 1). The first couple was between Argo float 6903178 and ESAW-1 Winkler sampling, while the second one was between Argo float 6903250 and Fix09. These pairs were considered valid because the Winkler DO values along the water column followed the same trend as the floats, indicating a horizontal homogeneity of the water masses in the area considered, despite the increased distance radius. Qualitatively, all Argo float data followed the shape of the Winkler profile over the entire water column and underestimated the DO concentration of approximately 10 μmol/kg (Figures 4A, B, 5A, B). In quantitative terms, the LSM confirmed that an underestimation of the Argo float oxygen data with a slope between 1.052 and 1.061 showed very high R2 values between 0.82 and 0.98, and the uncertainty spanned between 1.04 and 1.94 μmol/kg (Figures 4C, D, 5C). The DO values were therefore corrected by applying the corresponding slopes.
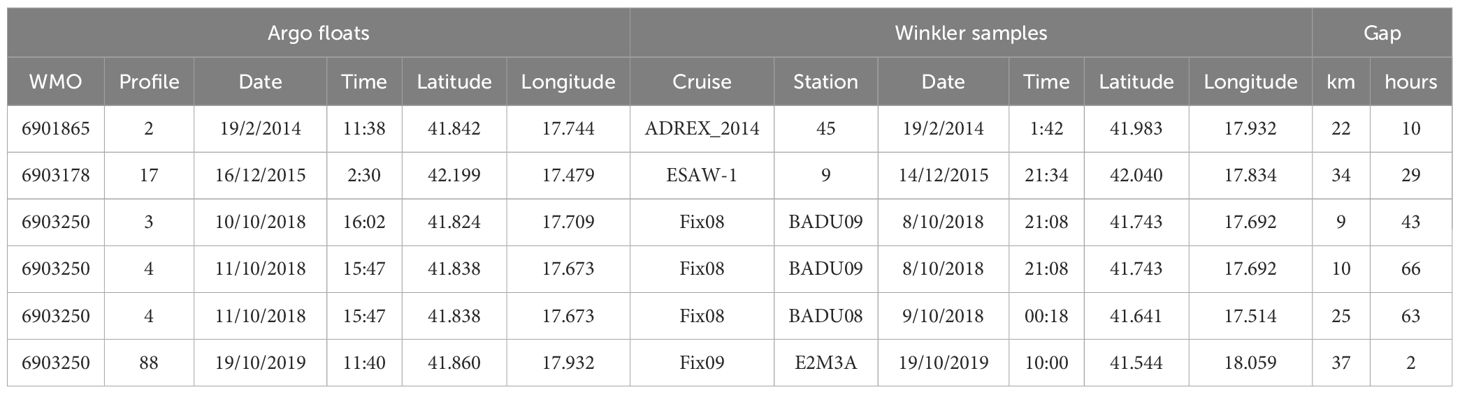
Table 1 Information on the selected pairs of Argo float profiles and Winkler samples: profile/station number, time (UTC), position (WGS-84, degrees and decimal degrees), and spatial and temporal gaps.
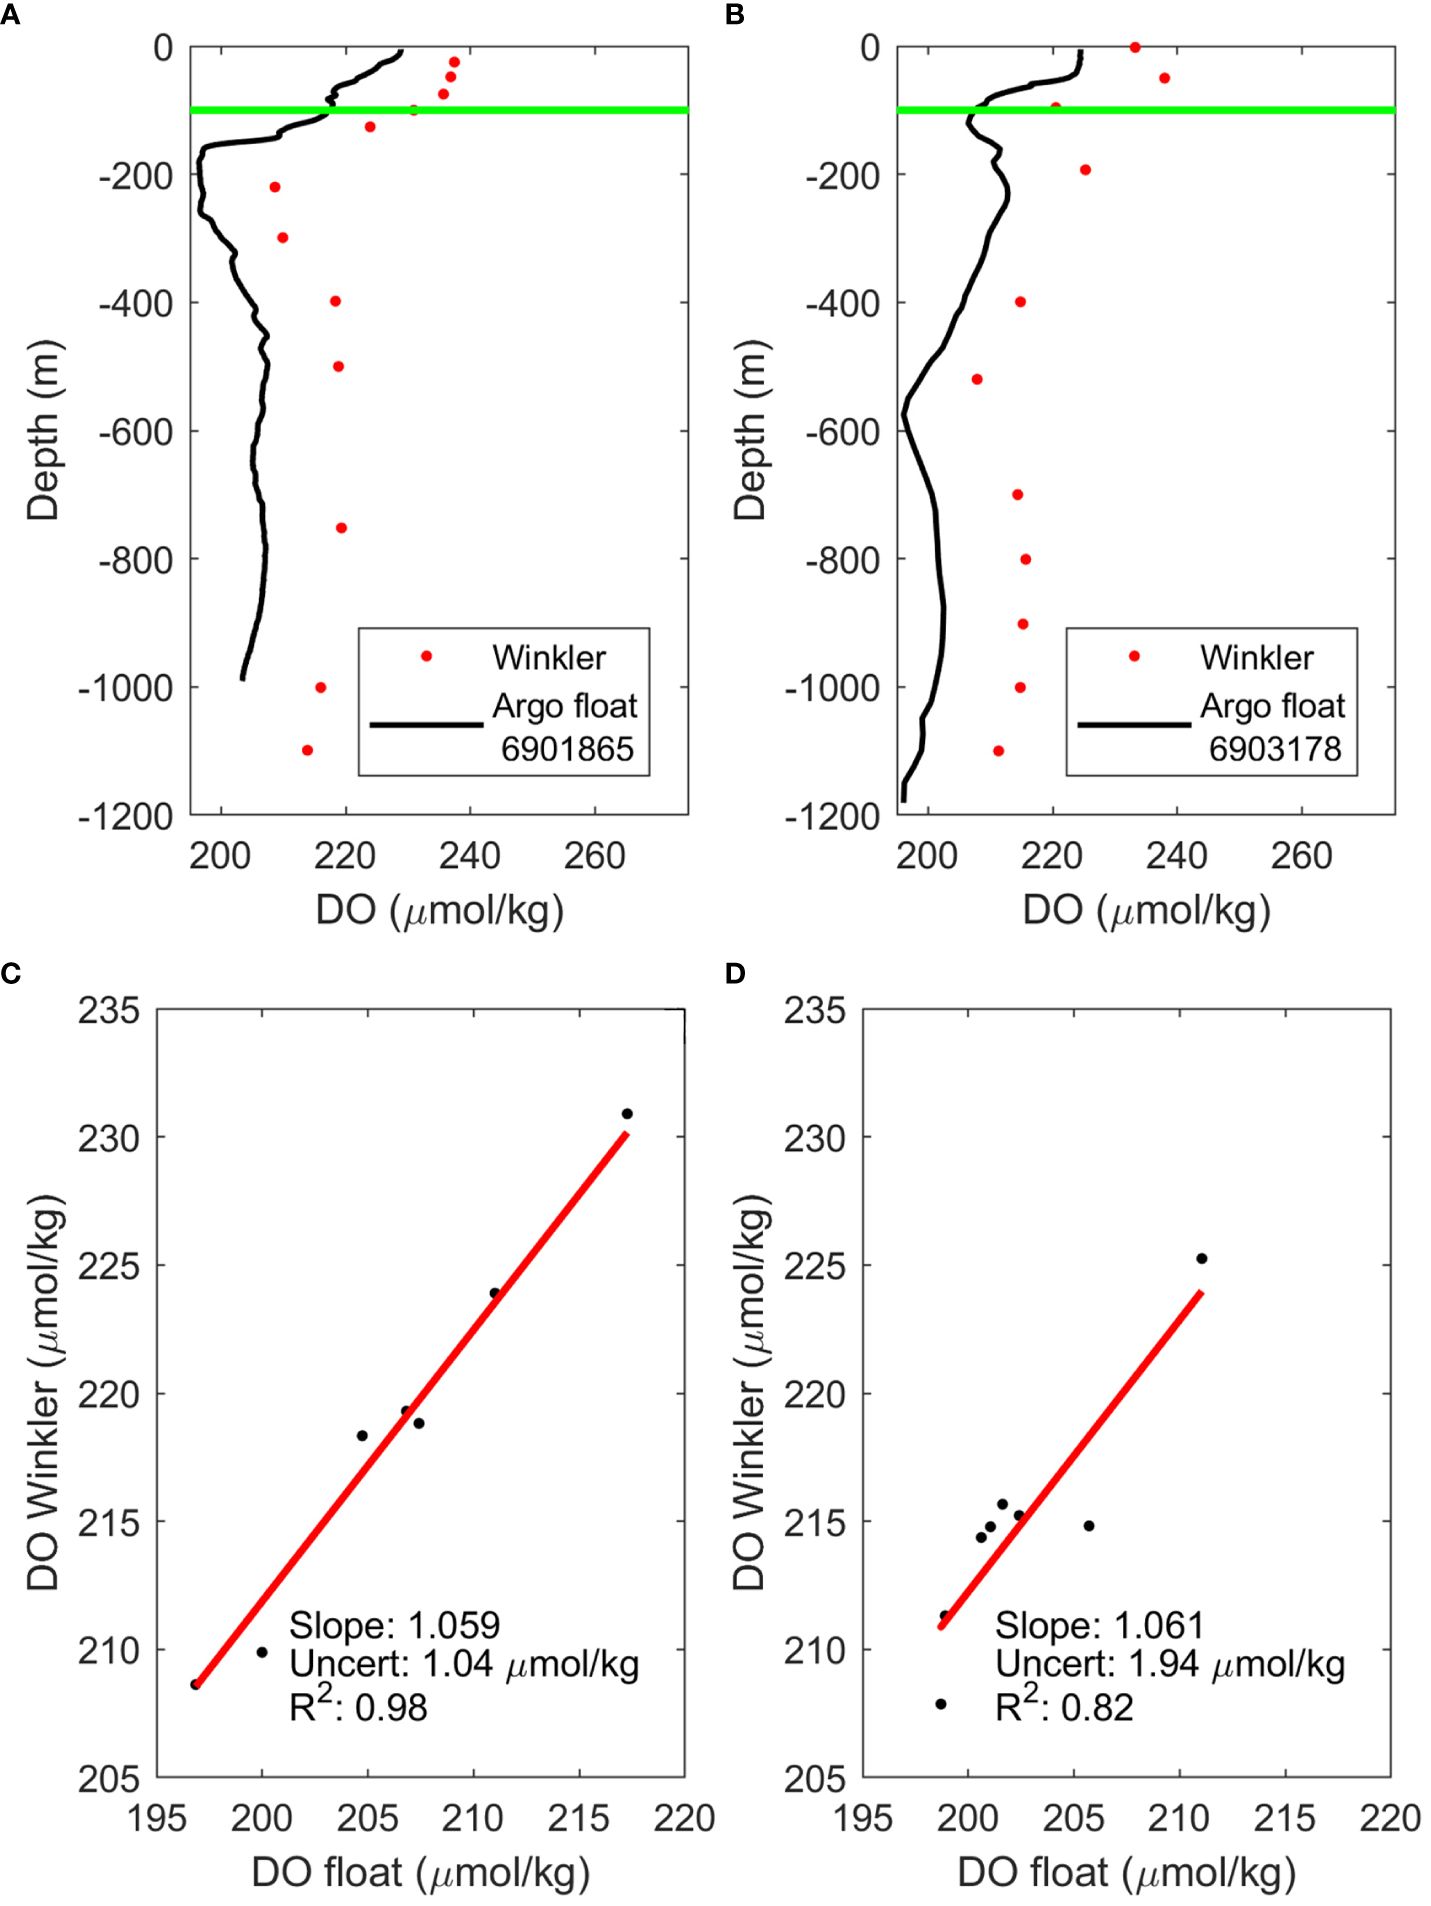
Figure 4 (A, B) DO measurements from Argo floats 6901865 and 6903178 (black dots) and Winkler data (red dots) for two selected cases. The green line refers to the minimum depth (100 m) considered for the LSM computations. (C, D) The respective LSM graphs with slope, uncertainty, and R2 values.
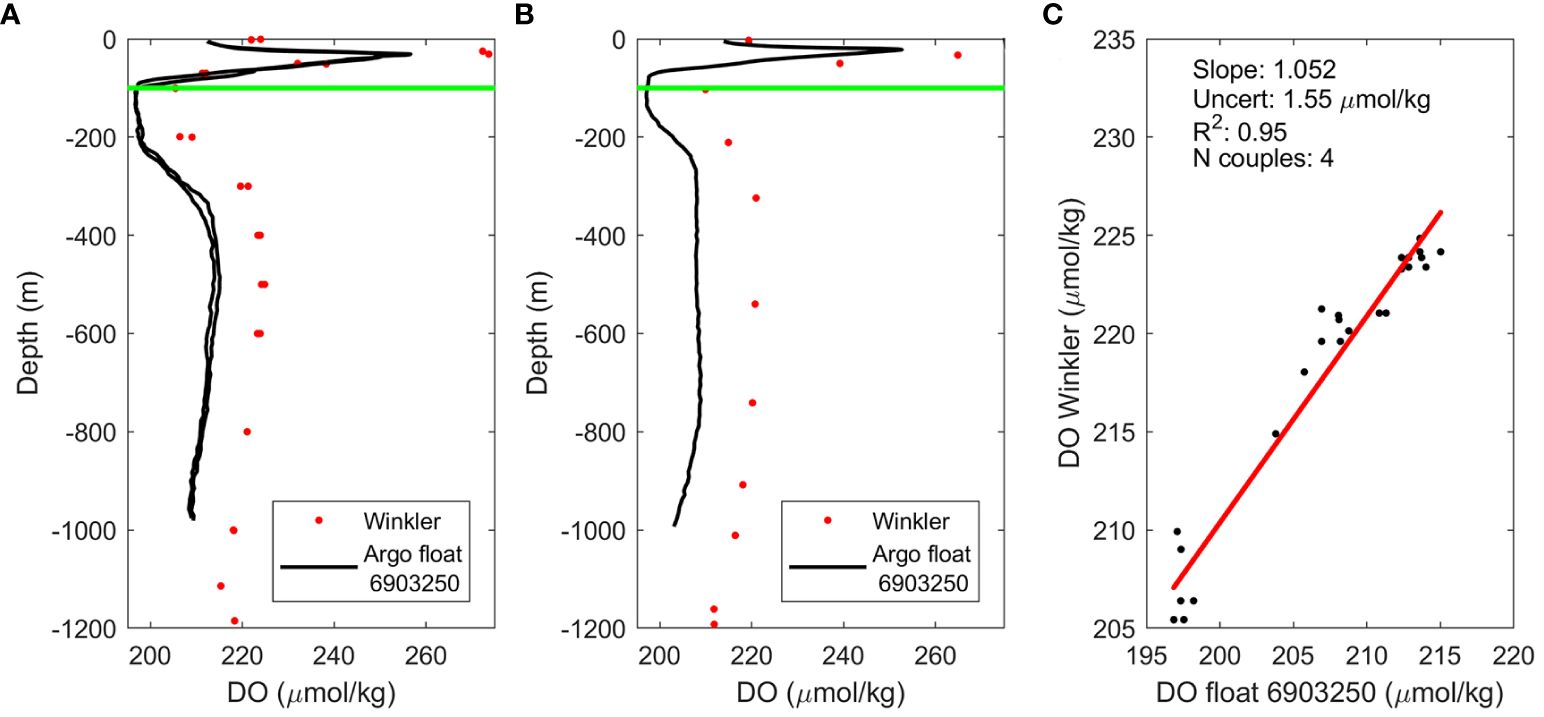
Figure 5 DO measurements of Argo float 6903250 (black dots) and Winkler data (red dots) of (A) the Fix08 and (B) Fix09 cruises. The green line refers to the minimum depth (100 m) considered for the LSM computations. (C) LSM graph with slope, uncertainty, and R2 values.
As for float 6903197, it was not possible to assign a Winkler sample, even doubling the thresholds. Therefore, we searched for possible pairs with the previously corrected DO Argo float data (i.e., 6901865, 6903178, and 6903250) applying the initially established thresholds (25 km and 72 h). Three profiles of Argo float 6903178 met the requirements, thus were used as reference (Table 2). Figures 6A–C again showed very similar patterns of the DO profiles measured by the two Argo floats. Anew, the profile to be validated underestimated the DO concentration compared to the reference by roughly 5 μmol/kg. The calculated DO slope was lower than before (1.022); the uncertainty was 1. 50 μmol/kg, and the R2 remained very high (0.96; Figure 6D).
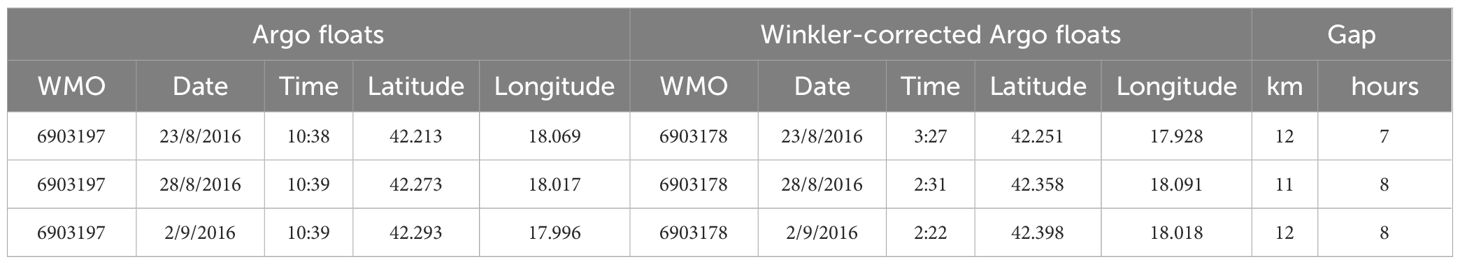
Table 2 Information on the selected pairs of profiles between Argo float 6903197 and Winkler-corrected Argo float 6903178: profile/station number, time (UTC), position (WGS-84, degrees, and decimal degrees), and spatial and temporal gaps.
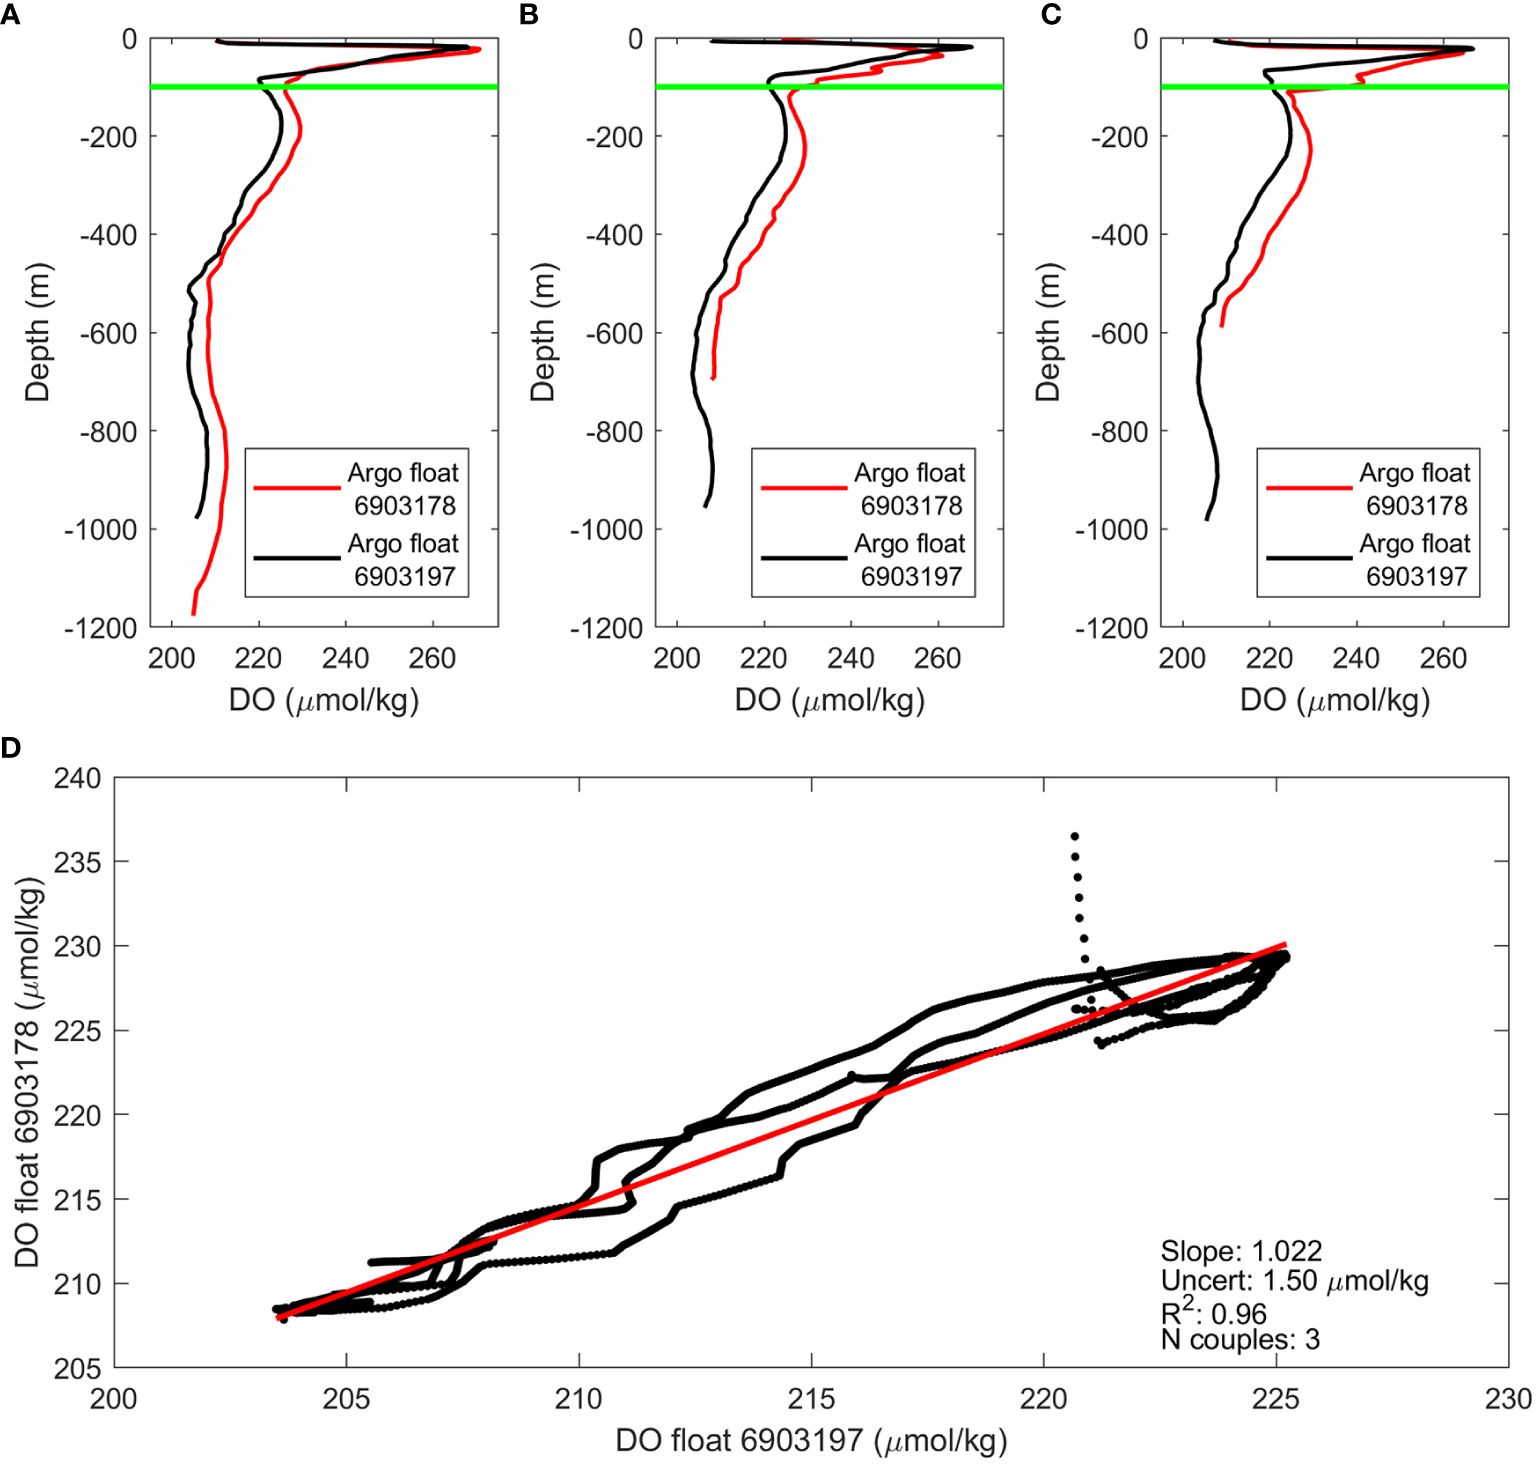
Figure 6 (A–C) Oxygen profiles of Argo floats 6903197 (black dots) and 6903178 (red dots) for the profiles selected above. (D) LSM graph with slope, uncertainty, and R2 values.
Argo float 6903250 was equipped with the latest generation DO sensor that enabled the in-air calibration. Twenty-six in-air measurements of this Argo float were found in the area near to the E2M3A (i.e., within the 25-km threshold); they spanned the period between 10 October 2018 and 09 August 2020. Nineteen coincident meteorological data from the oceanographic buoy E2M3A were available, and the computed mean gain was 1.053. Comparing the timeseries of the corrected DO and the in-air calibrated values at a depth of 211 m at which a Winkler sampling was performed, nearly null differences were found (Figure 7A). The DO post-corrected for climatology (“DOXY_ADJUSTED” downloaded from GDAC) differed from the in-air calibrated DO, following an increasing trend between −2 and +4 μmol/kg, underestimating the DO values in the first half of the float lifetime and overestimating them during the second half. The observed patterns and value differences were also confirmed at the other Winkler depths (not shown), with a minimal variation in differences of approximately 1 μmol/kg.
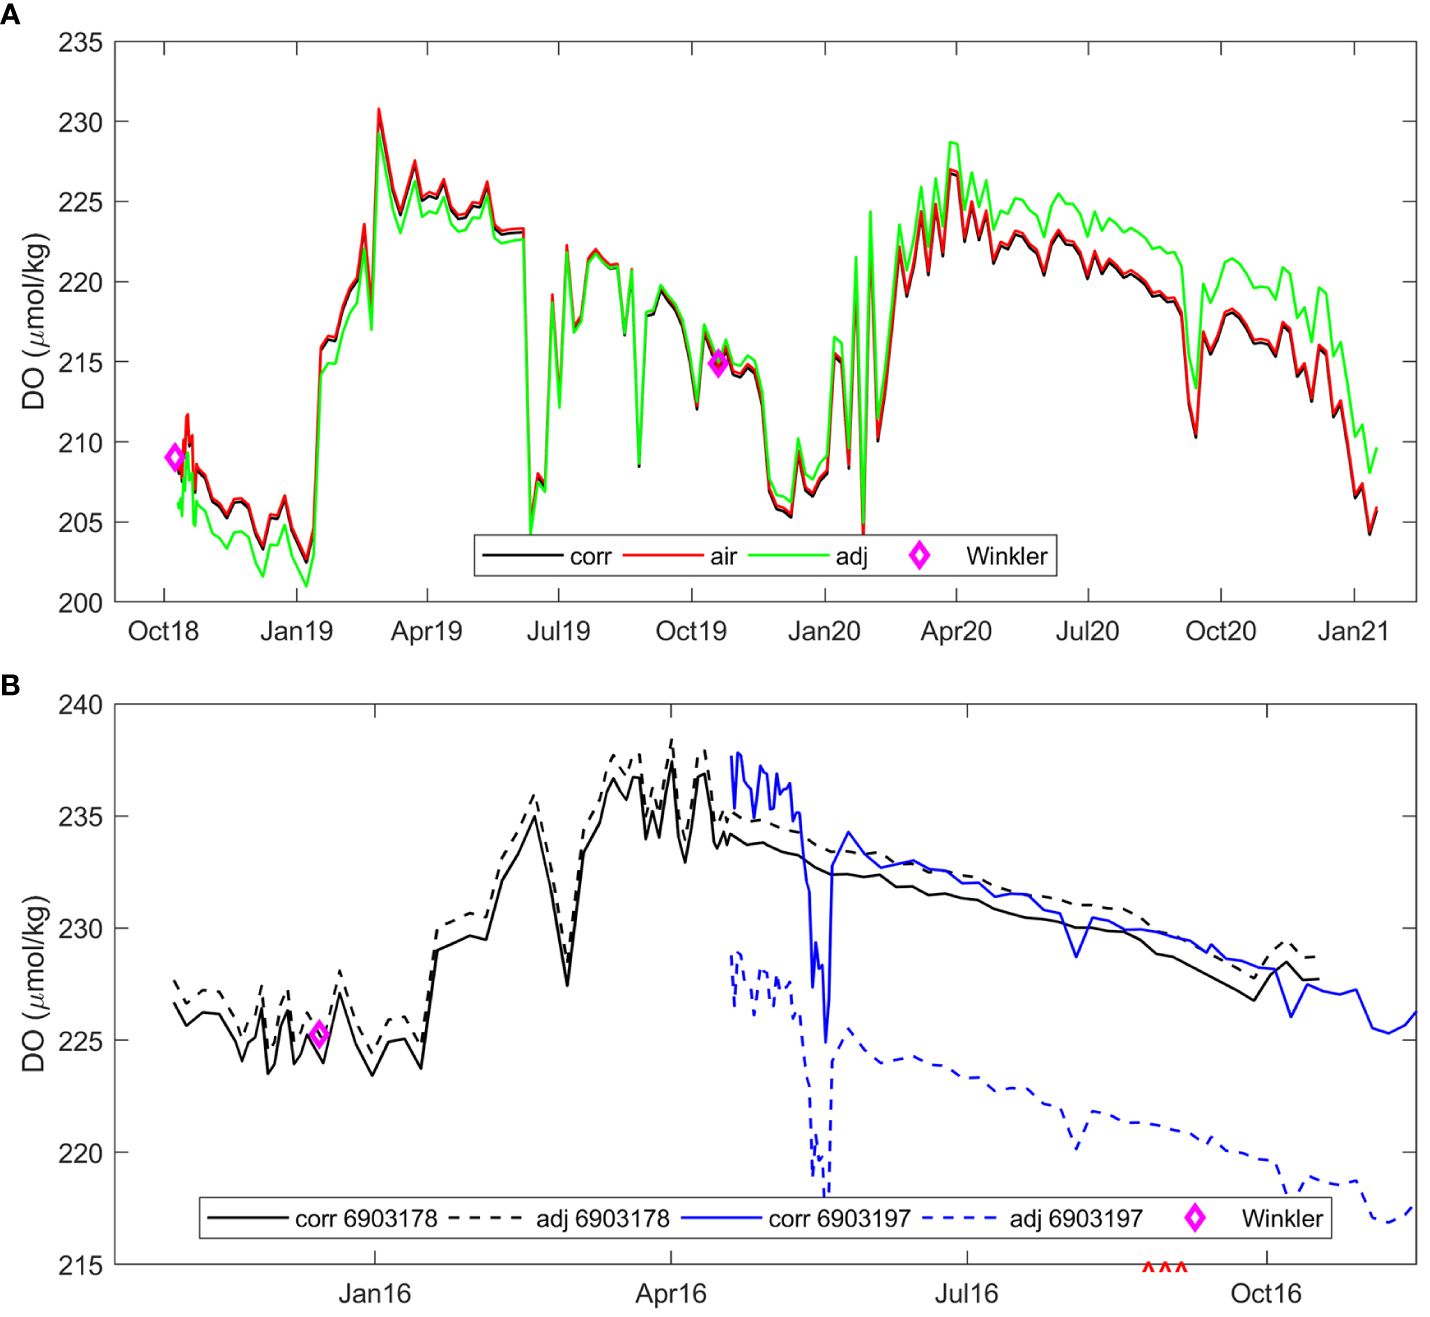
Figure 7 (A) DO from Argo float 6903250 after the correction with the method used in this paper (black line), the in-air calibration (red line), “DOXY_ADJUSTED” variable (green line), DO from Winkler sample (magenta diamond); data are referred to 200-m depth. (B) Corrected DO (solid lines) and the “DOXY_ADJUSTED” variable (dashed lines) from Argo floats 6903178 (black lines) and 6903197 (blue lines). The ^ red symbols on the x-axis indicate the time of the three pairs that were used to obtain the slope for Argo float 6903197.
As for Argo floats 6903178 and 6903197, they were in the same area during the same period in three subsequent profiles. The timeseries of the corrected DO and the “DOXY_ADJUSTED” variable at a depth of 193 m at which a Winkler sampling was performed displayed very small differences in the case of Argo float 6903178 and larger differences between them in the case of Argo float 6903197 (up to 9 μmol/kg) (Figure 7B). Besides, DO data of both floats displayed quite stable values in the SAP starting from April 2016 and May 2016 (floats 6903178 and 6903197, respectively). As in the case of Argo float 6903250, there were only minimal variations also at the other depths (not shown).
4.2 Glider data
No glider-Winkler data combinations were possible within the originally set thresholds of 25 km and 72 h and neither when doubling the thresholds. Therefore, we looked for the possible combinations between glider profiles and corrected Argo float profiles by assuming the originally set thresholds.
For some glider missions (i.e., Convex 20 by Seaglider 554* and Convex 17 and Convex 18 by Slocum glider 403), pairs were not found. Instead, several pairs resulted for the remaining glider missions (minimum 3, maximum 78; Table 3; Figure 8). The qualitative comparison between the DO measurements from the gliders and the corrected DO data from Argo floats showed a similar trend along the water column. Overall, the LSM indicated that gliders underestimated DO concentrations, with slopes ranging between 1.088 and 1.260 and uncertainties between 1.29 and 3.11 μmol/kg, and the values of R2 were between 0.64 and 0.90 (Figure 8).
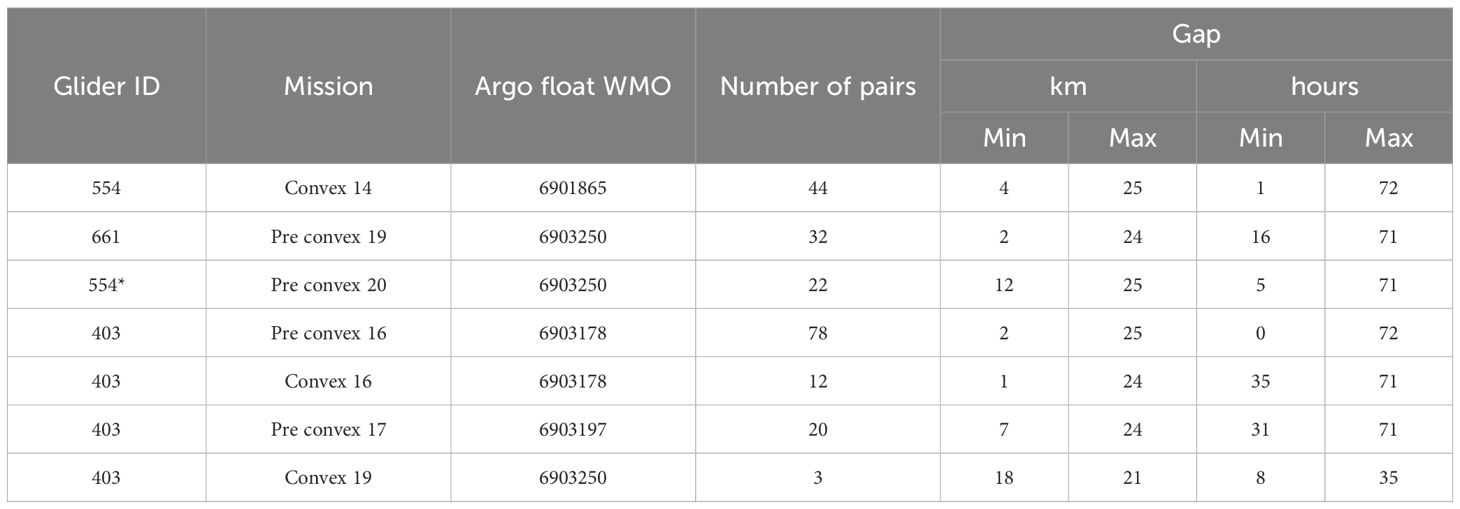
Table 3 Summary information on the selected glider—Argo float pairs used for the determination of the DO glider slopes, with the minimum and maximum spatiotemporal gaps (Seaglider 554* corresponds to Seaglider 554 after being updated and recalibrated in 2015).
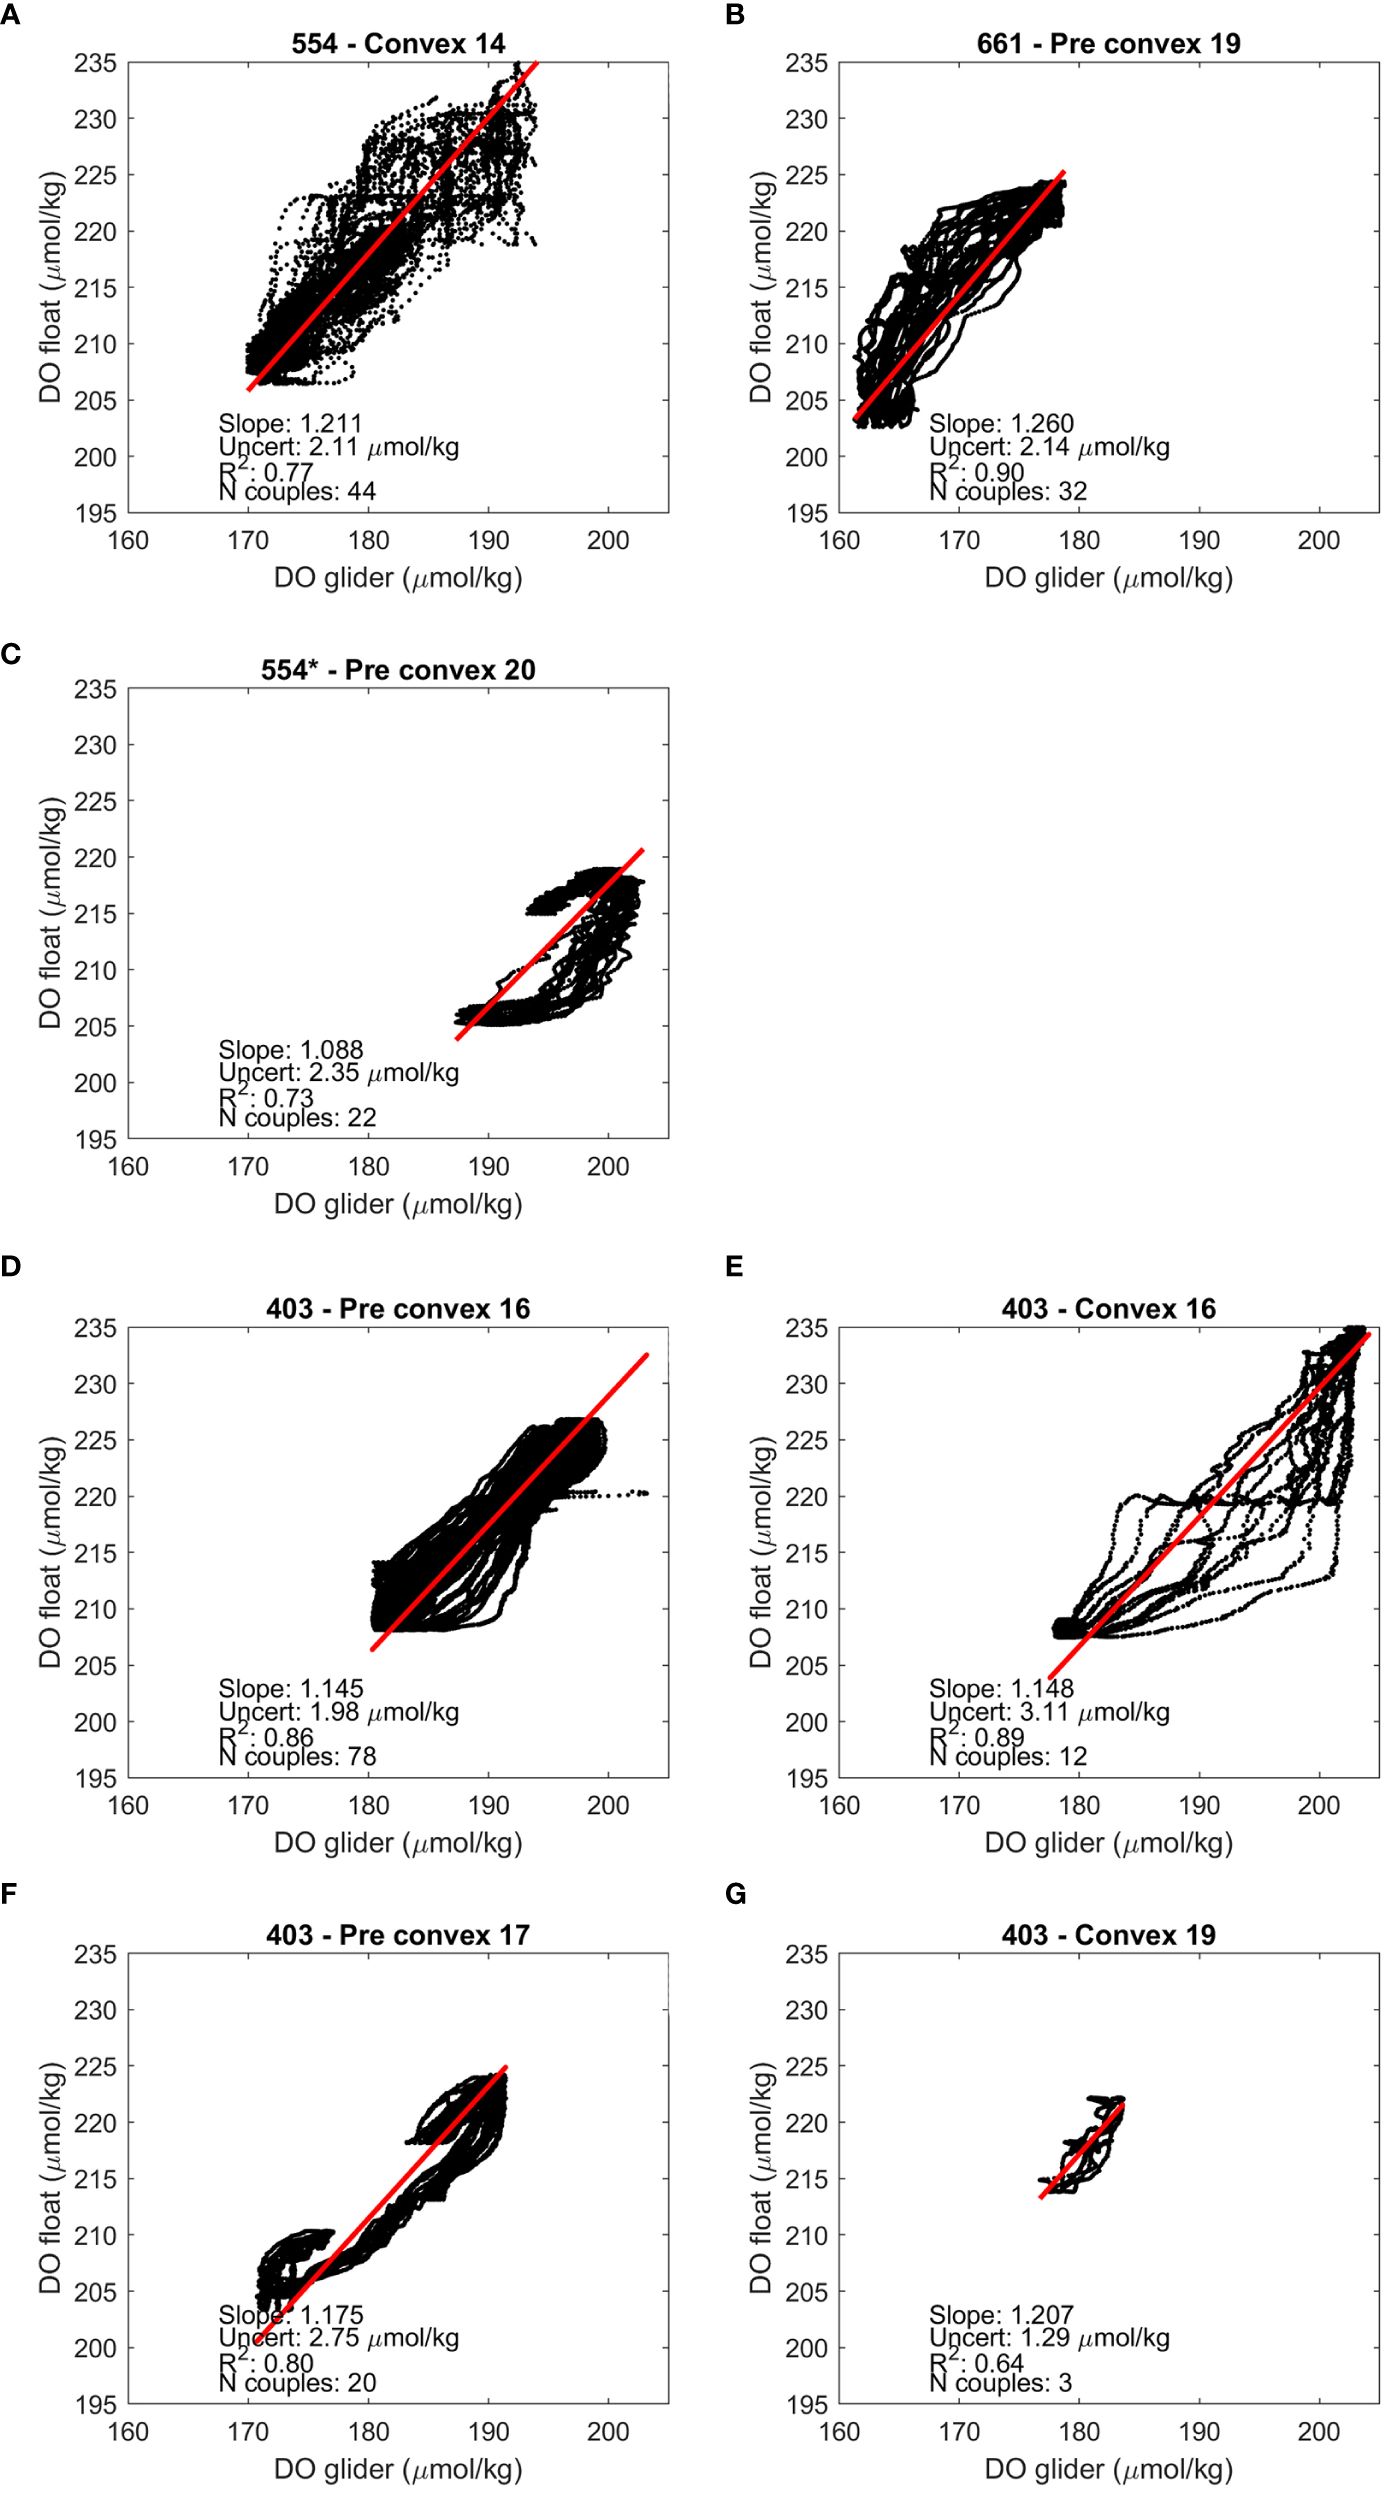
Figure 8 (A–C) LSM between the DO data from gliders 554, 661, 554* and the corrected DO from the Argo floats profiles. (D–G) The same for glider 403.
The linear regression of the slopes of the four missions of the Slocum glider 403 and that of the Seaglider 554* over time (considered altogether because the sensors of both gliders had been subject to the two-point factory calibration), starting from the calibration date at the factory, showed a positive linear trend, with a slope of 0.0001, offset of 1.072 and a very high R2 of 0.947. The uncertainty was 0.009 (Figure 9).
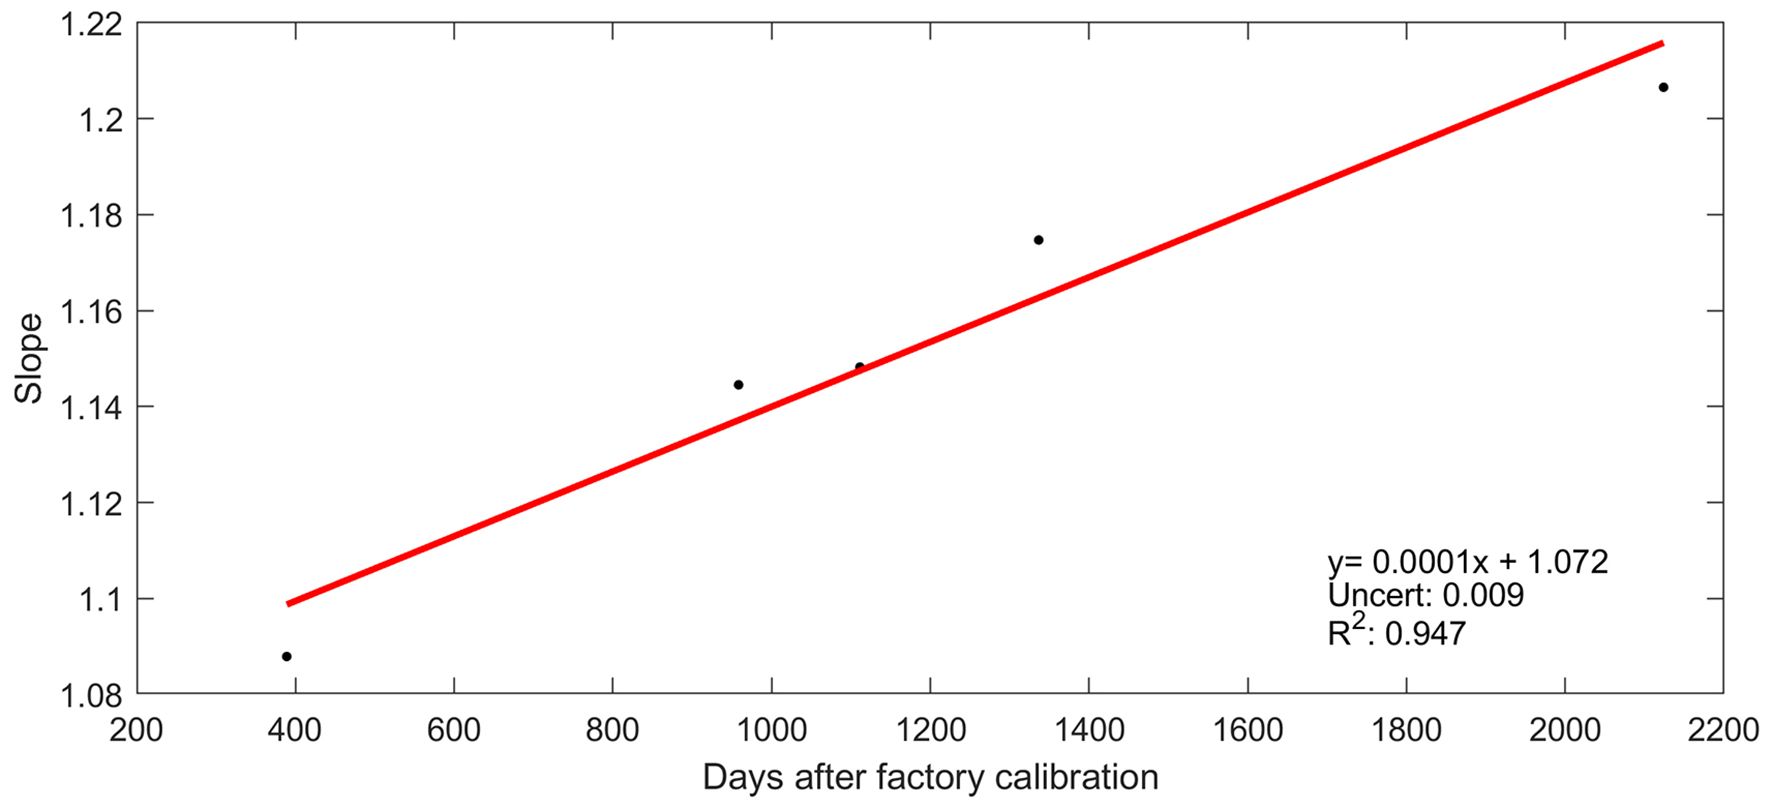
Figure 9 Regression of the slopes of Slocum glider 403 and Seaglider 554* over time after factory calibration.
Finally, the extrapolation of the slopes for the glider missions Convex 20, Convex 17, and Convex 18 from the previous diagram showed that these were 1.113, 1.173, and 1.191 μmol/kg, respectively.
The DO Argo float and glider data appeared quite sparse before applying the correction and underestimated DO concentration up to approximately 10 μmol/kg (Argo floats) and 35 μmol/kg (gliders) (Figure 10A). Contrarily, after the correction, they appeared consistent along the water column (Figure 10B), with the Winkler samples scattered within the variability of the Argo float and glider data. The “DOXY_ADJUSTED” data of Argo floats were similar to the corrected Argo float ones, but more widespread and with an underestimating tendency (Figures 10A, B). Further, the comparison between the DO data of the P-1200 station and the corrected Argo float and glider DO data nearby revealed negligible differences, especially deeper than 600 m (approximately 3 μmol/kg; Figures 11A, B).
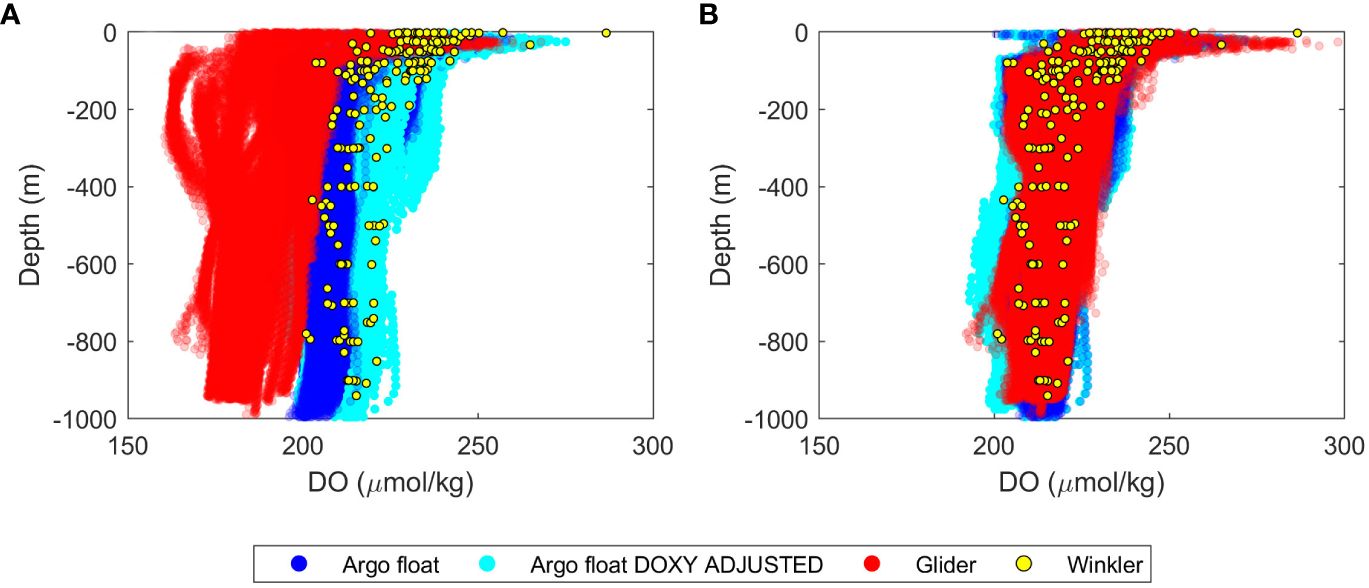
Figure 10 Overview of the Argo float (blue dots) and glider (red dots) DO data (A) before and (B) after the correction. The yellow dots represent the Winkler samples, while the cyan dots represent the “DOXY_ADJUSTED” values of Argo floats downloaded from GDAC. Glider data in (A) are already corrected for the response time and geometric lag and compensated for temperature, salinity, and pressure.
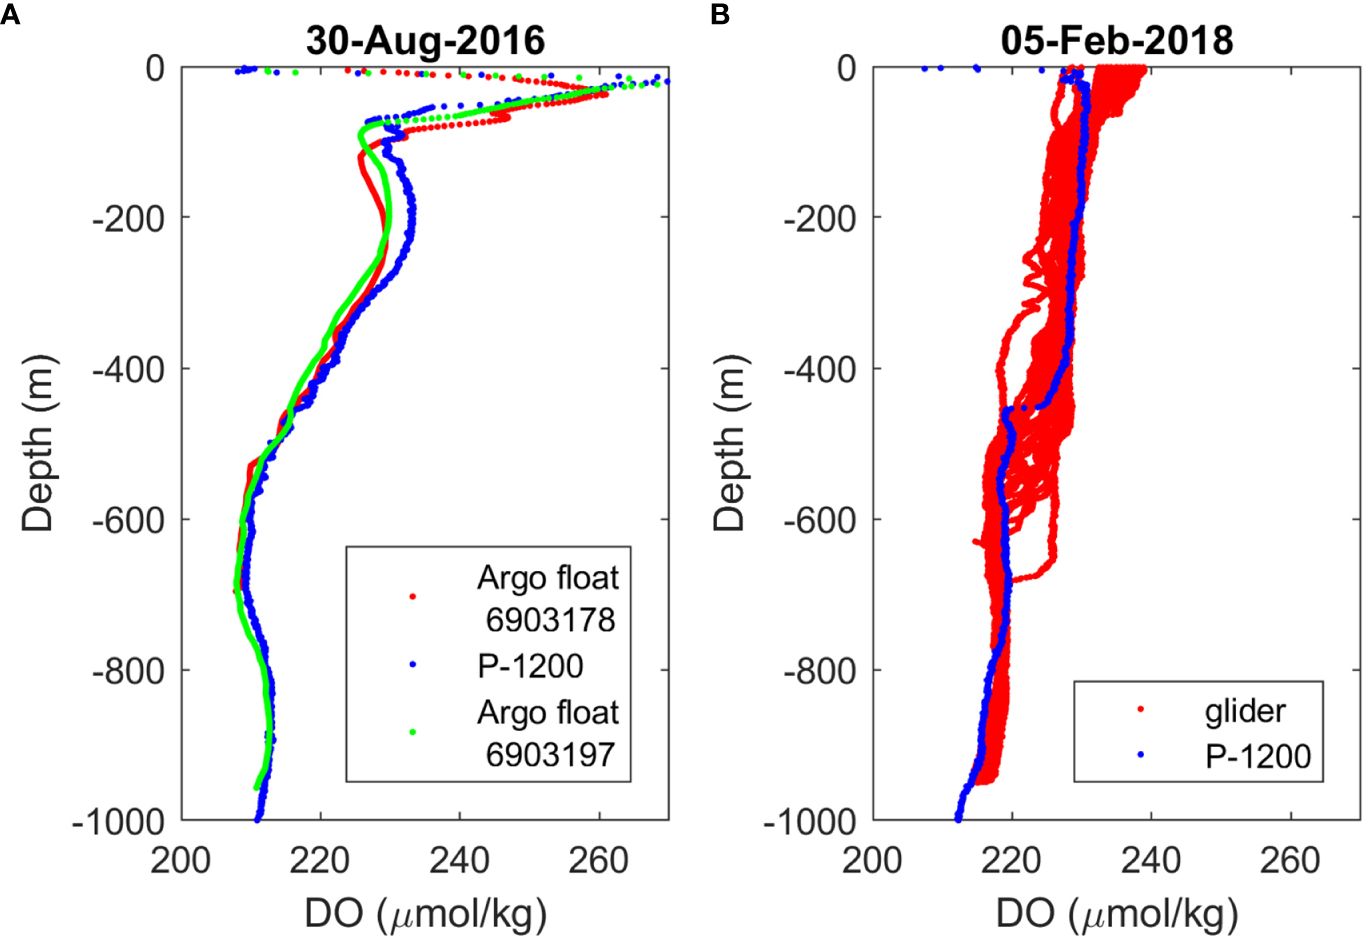
Figure 11 (A) Corrected DO profiles of Argo floats 6903178 (red dots) and 6903197 (green dots) and DO profile at station P-1200 (blue dots); (B) corrected DO profiles of glider 403 during the mission Convex 18 (red dots) and DO profile at station P-1200 (blue dots).
5 Discussion
Observations constitute the cornerstone of marine research and, against the backdrop of global and climate changes, are crucial for understanding observed trends, predicting future scenarios, and ultimately meeting societal needs. However, for the collected observations to become useful, trustworthy, and shareable information that can be exploited by the scientific community, their highest possible quality must be ensured. This is possible by sharing best practices and (rigorous) quality control methodologies that are recognized and routinely applied by the scientific community. In this way, the fragmentation and scarcity of cross-community communication that are still endemic to marine research could be overcome (Nair et al., 2023).
In recent years, numerous important improvements have been made, and operational best-practices have been proposed for DO sensors (e.g., Thierry et al., 2021; López-García et al., 2022). These are gradually improving the quality of the collected data and will hopefully lead to an ever-decreasing need to correct data in post-processing. Nonetheless, for datasets collected in the past or for which best practices have not been applied, there may still be a need to find alternative correction procedures.
In this paper, we have showcased the procedure applied for correcting DO data from Argo floats and gliders collected in the SAP during the period 2014–2020, for which the standard correction methods were not applicable.
The main findings have been that all the DO profiles to be corrected for both the Argo floats and the gliders underestimated the DO concentration compared to the reference value. The slopes calculated for the four Argo floats were between 1.052 (approximately 5%) and 1.061 (approximately 6%) for three of them (6903178, 6903250, and 6903865) and 1.022 (approximately 2%) for the remaining one (6903197). This difference is most likely due to the different storage time after factory calibration (Argo float 6903197 was stored for approximately 4 months, whereas the other three were stored for 6 months) and is comparable to the percentages indicated by Bushinsky et al. (2017) and Bittig et al. (2018). In the case of Argo float 6903250, the corrected DO values followed the same trend as the in-air calibrated values with negligible differences (Figure 7A), indicating that the correction method proposed in this work provides results comparable to the well-established best practice of the in-air calibration; indeed, the calculated slope and the gain from the in-air calibration were almost identical (1.052 vs. 1.053). The “DOXY_ADJUSTED” variable downloaded from GDAC was quite similar to the previous two, but tended to underestimate and then overestimate the in-air calibrated DO values. We can speculate that this difference could be due to the different computation methods: while the in-air calibration relies on the oxygen measurement taken in air by the instrument itself and on the air humidity, the “DOXY_ADJUSTED” from GDAC is calculated using the climatology.
Nonetheless, the differences remained within the accuracy declared by the manufacturer. In addition, the consistency between the two Winkler samples recorded at different times with the corrected DO values highlights that this Argo float exhibited negligible drift once at sea, which is consistent with the existing literature stating that the in situ drift can be one order of magnitude smaller than the storage-related one (Körtzinger et al., 2005; Tengberg et al., 2006; Tengberg and Hovdenes, 2014; Johnson et al., 2015; Bittig et al., 2018).
The corrected DO concentrations of Argo floats 6903178 and 6903197 were quite similar over several months (from June to early October 2016) even if their distance reached up to 80 km, suggesting a period in which the SAP had lower variability. On the contrary, the “DOXY_ADJUSTED” variable downloaded from GDAC of the two Argo floats differed by approximately 9 μmol/kg, slightly higher than the instrumental accuracy. This could be likely due to the fact that, at least in the case of Argo float 6903197, the climatological data were not yet complete and of sufficient resolution to optimally solve the complex dynamics of the area, as already found by previous works (Zavatarelli et al., 1998; Jeffries and Lee, 2007; Lipizer et al., 2014; Mavropoulou et al., 2020; Pranić et al., 2021; Šepić et al., 2022).
The slopes computed for the gliders ranged from 1.088 to 1.260 (approximately 9%–26%) and were thus higher than the values observed for the Argo floats. This discrepancy can be attributed to the operational differences of these autonomous platforms in the Southern Adriatic Sea. The Argo floats spend almost all their lifespan in the water, and, after the initial drift prior to deployment, they tend to drift a few tenth of percent per year (Bittig et al., 2018). Contrarily, the gliders considered in this study were deployed for short periods (from 4 to 20 days only) and then stored for months between missions; thus, we can speculate that the observed drift could be attributed completely to storage. By plotting the slopes of gliders 554* and 403 recorded over time after factory calibration, it was possible to estimate this storage-related degradation of the DO sensors, obtaining an excellent linear correlation. The slope at instant zero showed a value of about 1.07 (approximately 7%); this value is well within the 3%–8% indicated in the literature and confirms that the sensor underwent degradation immediately after factory calibration. In addition, there was a constant degradation due to storage of approximately 4%/year (0.0001%/day × 365 days/year), which is within the percentage reported by Bittig et al. (2018). This estimate was very useful as it allowed us to obtain the slopes for correcting also the DO data of the missions for which it was not possible to find validated float data, as in the case of Convex 20 of Seaglider 554* and Convex 17 and Convex 18 missions of glider 403. The uncertainties of the LSM for correcting the glider data (Figure 8) were mostly greater than those calculated for correcting the Argo float data (Figures 4–6), yet they always remained within the sensor accuracy. These differences could be ascribed to the intrinsic errors deriving from the application of any correction method, but we speculate that they were mostly due to the elevated spatiotemporal variability of the SAP area with gradients that could cause a mismatch between the glider and the reference data, and likely also to the different working principles of the two kinds of platforms. The lack of pairs between gliders and other validating data sources observed in this study, in concert with high heterogeneity of the study area, suggests that, in cases where the existing best practices could not be followed, gliders should be piloted near known fixed stations or validated platforms. This would allow to correct the data collected with the gliders more easily, thus also minimizing the slope uncertainty related to the spatial and temporal variability of DO in the study area.
We are aware that the slopes proposed in this work are valid only in the range of values used for the minimization and that they may lead to erroneous results in other ranges; nevertheless, the high values of R2 and the estimated uncertainties (well within the instrumental accuracy) found for all the LSMs guarantee the statistical reliability of the results. Furthermore, we are supported by the fact that the corrected DO values of the different platforms are superimposable to the Winkler DO values and in overall agreement with each other (Figures 10A, B) and with independent observations from DO probes (Figures 11A, B), and fall well within the expected DO range in the SAP (Zavatarelli et al., 1998; Manca et al., 2004; Lipizer et al., 2014).
The procedure proposed in this study allowed us to achieve the best possible quality of data and to make sure that the datasets from different autonomous platforms and missions were consistent with each other.
The same procedure could be applied in similar cases, for example, when autonomous platforms have not been operated at sea from oceanographic vessels, but have been launched from ships of opportunity by non-trained personnel (i.e., crew) and without pre-deployment operations and calibrations. A further plausible case would be that of data collected from old-design Argo floats. Indeed, the in-air calibration was not possible for the Argo floats manufactured before 2018 because the Optode was located in a position that remained always underwater, even when the Argo float reached the sea surface for communicating with the satellite system. Another viable application of this procedure could be the case for areas with complex dynamics similar to the SAP, where the elevated variability is not sufficiently represented by the climatology.
The application of the procedure proposed in this study could allow to recover otherwise unusable data, thus ultimately contributing to the advancement of the knowledge of our oceans.
Data availability statement
The dataset presented in this study can be found in the online repository: "Validated dissolved oxygen data from autonomous platform in the South Adriatic Sea in the period 2014-2020" https://doi.org/10.13120/6sbs-2v29.
Author contributions
RGe: Data curation, Investigation, Validation, Visualization, Writing – original draft, Writing – review & editing, Conceptualization, Formal analysis, Methodology, Software, Supervision, Funding acquisition. RM: Data curation, Investigation, Validation, Visualization, Writing – original draft, Writing – review & editing, Conceptualization, Formal analysis, Methodology, Software. GS: Data curation, Formal analysis, Investigation, Software, Validation, Visualization, Writing – original draft, Writing – review & editing. GN: Validation, Writing – review & editing, Data curation. CC: Validation, Writing – review & editing, Investigation. NM: Validation, Writing – review & editing, Investigation. RGa: Data curation, Writing – review & editing, Investigation, Funding acquisition. MB: Data curation, Writing – review & editing, Investigation. CD: Data curation, Writing – review & editing. VC: Writing – review & editing, Data curation, Funding acquisition. PZ: Writing – review & editing, Investigation. AB: Writing – review & editing, Investigation, Validation. MP: Writing – review & editing, Investigation. EM: Writing – review & editing, Funding acquisition, Investigation, Project administration, Resources.
Funding
The author(s) declare financial support was received for the research, authorship, and publication of this article. The collection of Argo float data was funded by the Italian Ministry for University and Research (MUR) as part of the Argo—Italy program and contribution to EuroArgo ERIC. The collection of glider data was partially funded by the MUR as well. Besides, the study was partially funded by the Croatian Science Foundation under projects AdMedPlan (IP-2014–09-2945), DiVMaD (IP-2019–04-9043), and SpaTeGen (UIP-2020–02-3907). This research was also partially funded within the European Union Seventh Framework Programme (FP7/2007–2013) under grant agreement n (312453), (FixO3), the Italian Ministry for Education, Universities and Research (MIUR) under the RITMARE (Ricerca ITaliana per il MARE) project, and OGS internal funds. Additionally, this study was partly developed in the framework of the project “CIR01_00018—IPANEMA HR—Implementazione del Laboratorio Naturale ECCSEL di Panarea e Dell’osservatorio Marino—Rafforzamento del Capitale umano,” financed by the MUR—Development and Cohesion Fund (FSC) under the “PNIR—Programma Nazionale Infrastrutture di Ricerca”—DD 2595 24/12/2019—”Rafforzamento del Capitale umano delle Infrastrutture di Ricerca.” The publication was funded by the project “ITINERIS” - ITalian INtegrated Environmental Research Infrastructures System (IR0000032) by MUR within the PIANO NAZIONALE DI RIPRESA E RESILIENZA (PNRR) MISSIONE 4 “Istruzione e ricerca”, COMPONENTE 2 “Dalla ricerca all’impresa”, INVESTIMENTO 3.1.1 "Fondo per la realizzazione di un sistema integrato di infrastrutture di ricerca e innovazione" (Infrastrutture di ricerca).
Acknowledgments
The authors thank Giuseppe Civitarese, Vedrana Kovacevic, and Manuel Bensi for supplying the Winkler data. The authors are grateful for the Argo float data (doi: 10.17882/42182) collected and made freely available by the international Argo project and the national programs that contribute to it. The authors also thank the reviewers for their suggestions and constructive comments that greatly improved the manuscript.
Conflict of interest
The authors declare that the research was conducted in the absence of any commercial or financial relationships that could be construed as a potential conflict of interest.
Publisher’s note
All claims expressed in this article are solely those of the authors and do not necessarily represent those of their affiliated organizations, or those of the publisher, the editors and the reviewers. Any product that may be evaluated in this article, or claim that may be made by its manufacturer, is not guaranteed or endorsed by the publisher.
References
Aanderaa Data Instruments (2017). TD 269 OPERATING MANUAL OXYGEN OPTODE 4330, 4831, 4835. Available online at: https://www.aanderaa.com/media/pdfs/oxygen-optode-4330-4835-and-4831.pdf (Accessed January 17, 2024).
Aanderaa Data Instruments (2018). Aanderaa Oxygen Optodes: Best Practices for Maintaining High Data Quality. Bergen (Norway), Aanderaa Data Instruments AS. doi: 10.25607/OBP-868
Argo (2023). Data from: Argo float data and metadata from Global Data Assembly Centre (Argo GDAC) (SEANOE). doi: 10.17882/42182
Bensi M., Cardin V., Rubino A., Notarstefano G., Poulain P. M. (2013). Effects of winter convection on the deep layer of the Southern Adriatic Sea in 2012. J. Geophys. Res. Oceans 118, 6064–6075. doi: 10.1002/2013JC009432
Bittig H. C., Fiedler B., Fietzek P., Körtzinger A. (2015). Pressure response of Aanderaa and Sea-Bird oxygen optodes. J. Atmos. Ocean. Technol. 32, 2305–2317. doi: 10.1175/JTECH-D-15-0108.1
Bittig H. C., Fiedler B., Scholz R., Krahmann G., Körtzinger A. (2014). Time response of oxygen optodes on profiling platforms and its dependence on flow speed and temperature. Limnol. Oceanogr. Methods 12, 617–636. doi: 10.4319/lom.2014.12.617
Bittig H. C., Körtzinger A. (2017). Update on response times, in-air measurements, and in situ drift for oxygen optodes on profiling platforms. Ocean Sci. 13, 1–11. doi: 10.5194/os-13-1-2017
Bittig H. C., Körtzinger A., Neill C., Van Ooijen E., Plant J. N., Hahn J., et al. (2018). Oxygen optode sensors: principle, characterization, calibration, and application in the ocean. Front. Mar. Sci. 4. doi: 10.3389/fmars.2017.00429
Bushinsky S. M., Hamme R. C., Nicholson D. P., Johnson K. S. (2017). “Oxygen Measurements from Autonomous Vehicles: Applications and Challenges,” in ALPS II - Autonomous and Lagrangian Platforms and Sensors. Eds. Rudnick D., Costa D., Johnson K., Lee C., Timmermans M.-L. (La Jolla, CA). Available at: https://geo-prose.com/pdfs/alps/Bushinsky.pdf.
Cardin V., Ursella L., Siena G., Brunetti F., Küchler S., Partescano E. (2020). Data from: E2M3A-2017-2019-time-series-SouthAdriatic. Natl. Oceanogr. Data Centre. doi: 10.6092/D0D50095-BD30-4FF7-8D0A-A12121E72F78
Carpenter J. H. (1965). The accuracy of the winkler method for dissolved oxygen analysis. Limnol. Oceanogr. 10, 135–140. doi: 10.4319/lo.1965.10.1.0135
Civitarese G., Gačić M., Batistić M., Bensi M., Cardin V., Dulčić J., et al. (2023). The BiOS mechanism: history, theory, implications. Prog. Oceanogr. 216, 103056. doi: 10.1016/j.pocean.2023.103056
Deutsch C., Berelson W., Thunell R., Weber T., Tems C., McManus J., et al. (2014). Centennial changes in North Pacific anoxia linked to tropical trade winds. Science 345, 665–668. doi: 10.1126/science.1252332
Di Biagio V., Salon S., Feudale L., Cossarini G. (2022). Subsurface oxygen maximum in oligotrophic marine ecosystems: mapping the interaction between physical and biogeochemical processes. Biogeosci 19, 23. doi: 10.5194/bg-19-5553-2022
Gačić M., Borzelli G. E., Civitarese G., Cardin V., Yari S. (2010). Can internal processes sustain reversals of the ocean upper circulation? The Ionian Sea example. Geophys. Res. Lett., 37(9). doi: 10.1029/2010GL043216
Gačić M., Civitarese G., Eusebi Borzelli G. L., Kovačević V., Poulain P. M., Theocharis A., et al. (2011). On the relationship between the decadal oscillations of the northern Ionian Sea and the salinity distributions in the eastern Mediterranean. J. Geophys. Res. Oceans 116, C12002. doi: 10.1029/2011JC007280
Garcia H. E., Gordon L. I. (1992). Oxygen solubility in seawater: Better fitting equations. Limnol. Oceanogr. 37, 1307–1312. doi: 10.4319/lo.1992.37.6.1307
Garcia-Soto C., Cheng L., Caesar L., Schmidtko S., Jewett E. B., Cheripka A., et al. (2021). An overview of ocean climate change indicators: Sea surface temperature, ocean heat content, ocean pH, dissolved oxygen concentration, arctic sea ice extent, thickness and volume, sea level and strength of the AMOC (Atlantic Meridional Overturning Circulation). Front. Mar. Sci. 8. doi: 10.3389/fmars.2021.642372
Gerin R. (2021). OGS Glider Data Quality Control, Rel. 2021/43 Sez. OCE 18 MAOS. Trieste (Italy), OGS. doi: 10.6092/ea0d979a-4043-4cf1-9397-6e097c315591
Gonzalez-Santana A., Oosterbaan M., Clavelle T., Maze G., Notarstefano G., Poffa N., et al. (2023). Analysis of the global shipping traffic for the feasibility of a structural recovery program of Argo floats. Front. Mar. Sci. 10. doi: 10.3389/fmars.2023.1161580
Hood E. M., Sabine C. L., Sloyan B. M. (2010). The GO-SHIP Repeat Hydrography Manual: a collection of expert reports and guidelines, Version 1. (IOCCP Report 14) (ICPO Publication Series 134). doi: 10.25607/OBP-1341
Hure M., Batistić M., Garić R. (2022). Copepod diel vertical distribution in the open southern Adriatic sea (NE Mediterranean) under two different environmental conditions. Water 14, 1901. doi: 10.3390/w14121901
Jasprica N., Čalić M., Kovačević V., Bensi M., Radić I. D., Garić R., et al. (2022). Phytoplankton distribution related to different winter conditions in 2016 and 2017 in the open southern Adriatic Sea (eastern Mediterranean). J. Mar. Syst. 226, 103665. doi: 10.1016/j.jmarsys.2021.103665
Jeffries M. A., Lee C. M. (2007). A climatology of the northern Adriatic Sea’s response to bora and river forcing. J. Geophys. Res. Oceans 112. doi: 10.1029/2006JC003664
Johnson K. S., Plant J. N., Riser S. C., Gilbert D. (2015). Air oxygen calibration of oxygen optodes on a profiling float array. J. Atmos. Ocean. Technol. 32, 2160–2172. doi: 10.1175/JTECH-D-15-0101.1
Joos F., Plattner G. K., Stocker T. F., Körtzinger A., Wallace D. W. (2003). Trends in marine dissolved oxygen: Implications for ocean circulation changes and the carbon budget. EOS Trans. Am. Geophys. Union 84, 197–201. doi: 10.1029/2003EO210001
Körtzinger A., Schimanski J., Send U. (2005). High quality oxygen measurements from profiling floats: A promising new technique. J. Atmos. Ocean. Technol. 22, 302–308. doi: 10.1175/JTECH1701.1
Lermusiaux P. F. J., Robinson A. R. (2001). Features of dominant mesoscale variability, circulation patterns and dynamics in the Strait of Sicily. Deep-Sea Res. Pt. I 48, 1953–1997. doi: 10.1016/S0967-0637(00)00114-X
Lipizer M., Partescano E., Rabitti A., Giorgetti A., Crise A. (2014). Qualified temperature, salinity and dissolved oxygen climatologies in a changing Adriatic Sea. Ocean Sci. 10, 771–797. doi: 10.5194/os-10-771-2014
López-García P., Hull T., Thomsen S., Hahn J., Queste B. Y. (2022). OceanGliders Oxygen SOP, Version 1.0.0 (OceanGliders). Available at: https://oceangliderscommunity.github.io/Oxygen_SOP/sections/authors_SOP_development_process.html. 55pp. doi: 10.25607/OBP-1756
Manca B. B., Burca M., Giorgetti A., Coatanoan C., Garcia M. J., Iona A. (2004). Physical and biochemical averaged vertical profiles in the Mediterranean regions: an important tool to trace the climatology of water masses and to validate incoming data from operational oceanography. J. Mar. Sys. 48, 83–116. doi: 10.1016/j.jmarsys.2003.11.025
Mauri E., Gerin R., Poulain P. M. (2016). Measurements of water-mass properties with a glider in the South-western Adriatic Sea. J. Oper. Oceanogr. 9, s3–s9. doi: 10.1080/1755876X.2015.1117766
Mauri E., Menna M., Garić R., Batistić M., Libralato S., Notarstefano G., et al. (2021). Recent changes of the salinity distribution and zooplankton community in the South Adriatic Pit. Copernicus Marine Service Ocean State Report, 5. J. Oper. Oceanogr. 14, 1–185. doi: 10.1080/1755876X.2021.1946240
Mavropoulou A. M., Vervatis V., Sofianos S. (2020). Dissolved oxygen variability in the Mediterranean Sea. J. Mar. Sys. 208, 103348. doi: 10.1016/j.jmarsys.2020.103348
Menna M., Gačić M., Martellucci R., Notarstefano G., Fedele G., Mauri E., et al. (2022). Climatic, decadal and interannual variability in the upper layer of the Mediterranean Sea using remotely sensed and in-situ data. Remote Sens. 14, 1322. doi: 10.3390/rs14061322
MERSEA (2008). MERSEA Final synthesis Report (IFREMER). Plouzané (France) Available at: https://cordis.europa.eu/docs/projects/files/502/502885/114980191-6_en.pdf.
Mihanović H., Vilibić I., Šepić J., Matić F., Ljubešić Z., Mauri E., et al. (2021). Observation, preconditioning and recurrence of exceptionally high salinities in the Adriatic Sea. Front. Mar. Sci. 8. doi: 10.3389/fmars.2021.672210
Moat B. I., Smeed D. A., Marcinko C., Popinet S., Turnock S. (2016). Flow distortion around underwater gliders and impacts on sensor measurements: a pilot study using large-eddy simulations (Southampton, UK: National Oceanography Centre). National Oceanography Centre Research and Consultancy Report, 5835pp.
Nair R., Waldmann C., Pearlman J. S., Nascimento F., Karstensen J., Ranganathan S., et al. (2023). Relating best practices to standardization in ocean science. OCEANS 1-4. doi: 10.1109/OCEANSLimerick52467.2023.10244310
Orlić M., Gacić M., La Violette P. E. (1992). The currents and circulation of the Adriatic Sea. Oceanol. Acta 15, 109–124.
Oschlies A., Brandt P., Stramma L., Schmidtko S. (2018). Drivers and mechanisms of ocean deoxygenation. Nat. Geosci. 11, 467–473. doi: 10.1038/s41561-018-0152-2
Poulain P. M. (2001). Adriatic Sea surface circulation as derived from drifter data between 1990 and 1999. J. Mar. Syst. 29, 3–32. doi: 10.1016/S0924-7963(01)00007-0
Poulain P. M., Cushman-Roisin B. (2001). “Circulation,” in Physical Oceanography of the Adriatic Sea: Past, Present and Future. Eds. Cushman-Roisin B., Gačić M., Poulain P. M., Artegiani A. (Kluwer Academic Publishing, Dordrecht, NL), 67–109.
Pranić P., Denamiel C., Vilibić I. (2021). Performance of the Adriatic Sea and Coast (AdriSC) climate component – a COAWST V3.3-based one-way coupled atmosphere–ocean modelling suite: ocean results. Geosci. Model. Dev. 14, 5927–5955. doi: 10.5194/gmd-14-5927-2021
Queste B. Y., Heywood K. J., Smith W. O., Kaufman D. E., Jickells T. D., Dinniman M. S. (2015). Dissolved oxygen dynamics during a phytoplankton bloom in the Ross Sea polynya. Antarc. Sci. 27, 362–372. doi: 10.1017/S0954102014000881
Racape V., Schmechtig C., Bernard V. (2022). Adjustment in real time (mode A) of the Coriolis Argo-O2 floats. Argo. doi: 10.13155/76709
Russo A., Lozano C. J., Artegiani A., Robinson A. R., Paschini E., Pinardi N., et al. (1993). Mesoscale dynamics in the middle Adriatic depressions (spring 1993). Geophys. Res. Abs. 1, 391.
Schmidtko S., Stramma L., Visbeck M. (2017). Decline in global oceanic oxygen content during the past five decades. Nature 542, 335–339. doi: 10.1038/nature21399
Sea-Bird Scientific (2017). SBE 63 Optical Dissolved Oxygen Sensor user’s manual. Available online at: https://www.seabird.com/asset-get.download.jsa?code=251379 (Accessed January 17, 2024).
Šepić J., Pasarić M., Međugorac I., Vilibić I., Karlović M., Mlinar M. (2022). Climatology and process-oriented analysis of the Adriatic sea level extremes. Prog. Oceanogr. 209, 102908. doi: 10.1016/j.pocean.2022.102908
Song H., Wignall P. B., Song H., Dai X., Chu D. (2019). Seawater temperature and dissolved oxygen over the past 500 million years. J. Earth Sci. 30, 236–243. doi: 10.1007/s12583-018-1002-2
Takeshita Y., Martz T. R., Johnson K. S., Plant J. N., Gilbert D., Riser S. C., et al. (2013). A climatology-based quality control procedure for profiling float oxygen data. J. Geophys. Res. Oceans 118, 5640–5650. doi: 10.1002/jgrc.20399
Tengberg A., Hovdenes J. (2014). “Information on long-term stability and accuracy of Aanderaa oxygen optodes and information about multipoint calibration system and sensor option overview,” in Aanderaa Data Instruments A. Available at: https://www.aanderaa.com/media/pdfs/2014-04-O2-optode-and-calibration.pdf.
Tengberg A., Hovdenes J., Andersson H. J., Brocandel O., Diaz R., Hebert D., et al. (2006). Evaluation of a lifetime-based optode to measure oxygen in aquatic systems. Limnol. Oceanogr.-Meth. 4, 7–17. doi: 10.4319/lom.2006.4.7
The MathWorks Inc (2017). MATLAB (R2017b). Available online at: https://www.mathworks.com (Accessed January 17, 2024).
Thierry V., Bittig H., Gilbert D., Kobayashi T., Kanako S., Schmid C. (2022). Processing Argo oxygen data at the DAC level. Version 2.3.3 (Villefranche-sur-Mer: IFREMER for Argo BGC Group). doi: 10.13155/39795
Thierry V., Bittig H., The Argo-Bgc Team (2021). Argo quality control manual for dissolved oxygen concentration. Version 2.1 (Villefranche-sur-Mer: IFREMER for Argo BGC Group). doi: 10.13155/46542
Tzortzis R., Doglioli A. M., Barrillon S., Petrenko A. A., d’Ovidio F., Izard L., et al. (2021). Impact of moderately energetic fine-scale dynamics on the phytoplankton community structure in the western Mediterranean Sea. Biogeosciences 18, 6455–6477. doi: 10.5194/bg-18-6455-2021
Waldman R., Herrmann M., Somot S., Arsouze T., Benshila R., Bosse A., et al. (2017). Impact of the mesoscale dynamics on ocean deep convection: The 2012–2013 case study in the northwestern Mediterranean sea. J. Geophys. Res.-Oceans 122, 8813–8840. doi: 10.1002/2016JC012587
Wong A. P., Wijffels S. E., Riser S. C., Pouliquen S., Hosoda S., Roemmich D., et al. (2020). Argo data 1999–2019: Two million temperature-salinity profiles and subsurface velocity observations from a global array of profiling floats. Front. Mar. Sci. 7. doi: 10.3389/fmars.2020.00700
Woo L. M., Gourcuff C. (2021). Ocean Gliders delayed mode QA/QC best practice manual. Version 3.0. Hobart (Tasmania), Integrated Marine Observing System (IMOS), University of Tasmania. doi: 10.26198/5c997b5fdc9bd
Zavatarelli M., Raicich F., Bregant D., Russo A., Artegiani A. (1998). Climatological biogeochemical characteristics of the Adriatic Sea. J. Mar. Syst. 18, 227–263. doi: 10.1016/S0924-7963(98)00014-1
Keywords: Argo float, Glider, Winkler method, dissolved oxygen sensor drift, data validation
Citation: Gerin R, Martellucci R, Savonitto G, Notarstefano G, Comici C, Medeot N, Garić R, Batistić M, Dentico C, Cardin V, Zuppelli P, Bussani A, Pacciaroni M and Mauri E (2024) Correction and harmonization of dissolved oxygen data from autonomous platforms in the South Adriatic Pit (Mediterranean Sea). Front. Mar. Sci. 11:1373196. doi: 10.3389/fmars.2024.1373196
Received: 19 January 2024; Accepted: 14 June 2024;
Published: 04 July 2024.
Edited by:
Johannes Karstensen, Helmholtz Association of German Research Centres (HZ), GermanyReviewed by:
Dariia Atamanchuk, Dalhousie University, CanadaNico Lange, NORCE Norwegian Research Centre, Bjerknes Centre for Climate Research, Norway
Copyright © 2024 Gerin, Martellucci, Savonitto, Notarstefano, Comici, Medeot, Garić, Batistić, Dentico, Cardin, Zuppelli, Bussani, Pacciaroni and Mauri. This is an open-access article distributed under the terms of the Creative Commons Attribution License (CC BY). The use, distribution or reproduction in other forums is permitted, provided the original author(s) and the copyright owner(s) are credited and that the original publication in this journal is cited, in accordance with accepted academic practice. No use, distribution or reproduction is permitted which does not comply with these terms.
*Correspondence: Gilda Savonitto, Z3Nhdm9uaXR0b0BvZ3MuaXQ=