- 1Xinjiang Key Laboratory of New Energy and Energy Storage Technology, Xinjiang Institute of Technology, Aksu, China
- 2College of Information and Communication Engineering, Harbin Engineering University, Harbin, China
- 3State Key Laboratory of Precision Electronic Manufacturing Technology and Equipment, School of Electromechanical Engineering, Guangdong University of Technology, Guangzhou, China
The grain size of sediments is a crucial parameter in sedimentology, with significant implications for submarine engineering and water conservancy projects. In this study, we developed an acoustic reflection measurement system using a self-developed, high-precision, high-frequency shallow stratigraphic profiler. The system's accuracy was validated with standard acrylic samples. Results showed that within the sediment grain size range of 0.3 to 2.5 mm, the acoustic reflection amplitude increased with grain size. However, distinguishing grain sizes between 0.1 and 0.3 mm from those between 1.0 and 1.5 mm based solely on reflection amplitude proved challenging. Notably, the differences in wavefront flare shapes between these grain sizes were readily apparent. Therefore, combining reflection peak amplitude with time-domain waveform analysis enables more precise sediment grain size classification.
1 Introduction
Sediment classification is a prominent research topic in the fields of underwater acoustics and geology. Measuring the acoustic reflection characteristics of sediments serves as a crucial technical approach for investigating sediment classification. Establishing a correlation between the acoustic reflection characteristics of sediments and the types of sedimentation enables the inversion of sediment physical parameters. The process of deriving physical parameters from acoustic parameters to classify sediments holds significant scientific importance for the theory of geoacoustic inversion (Jackson and Richardson, 2007; Li et al., 2021a; Wang J. et al., 2023).
The correlation between the acoustic reflection characteristics and physical properties of substrate sand and gravel has mainly been established through in situ measurements and laboratory studies (Hamilton, 1980; Liu et al., 2013; Zhengyu et al., 2015; Zhang et al., 2017; Li et al., 2021a; Li et al., 2021b). One direct method for obtaining underwater acoustic reflection characteristics is in situ measurement. For example, Zheng et al (2013). calculated seafloor reflection and attenuation coefficients based on seafloor profiles. Additionally, they quantitatively estimated the average grain size and corresponding sediment classification using the Biot model. However, this method can be costly and inefficient since the information about the seafloor only applies to discrete locations. Acoustic waves collected through sonar systems are a low-cost and effective means of detecting substrate structure and sediment type. For instance, the reflection coefficient (RC) estimated from acoustic echoes can be used to infer the mean grain size (Hamilton, 1970). Ji et al (2020) suggested that using acoustic remote sensing to classify seafloor siltation is an attractive method with a high coverage capacity and low cost compared to seafloor sampling. This research focuses on improving the accuracy of seafloor silt classification through backscattering intensity correction, sonar image quality enhancement, and classifier construction. The effectiveness and superiority of the selected optimal random forest (SORF) classifier were verified through comparison with the support vector machine (SVM) and random forest (RF) classifiers. The multi-beam echo sounding system records seafloor backscattering intensity data, which provide information about seafloor geological features. Acoustic inversion estimates the density of surface sediment layers, sediment sound velocity, and medium attenuation (Li et al., 2021b). Numerous studies have been conducted to identify various sediment types using acoustic echoes (Marsh and Brown, 2008; Fonseca et al., 2009). Moreover, there is a body of literature (Cui et al., 2021; Wang H. et al., 2023) utilizing deep learning methods for sediment classification. Anokye et al (2024). proposed a novel method for seafloor sediment classification using a multibeam echo sounder system and a convolutional neural network (CNN), thereby improving classification accuracy. Qin et al (2021). employed side-scanning sonar images in conjunction with different depths of a CNN. Pre-training the model using the greyscale CIFAR-10 dataset enables the transfer of parameters across a wide range of tasks, thereby improving the overall performance of the model and reducing the error rate of classification. However, in these studies (Wang J. et al., 2023; Wendelboe et al., 2023), the common practice is to first measure the acoustic properties of the sediments in situ and then sample them. The physical property parameters of the sediments are measured in the laboratory, and parameters such as the average grain size of the sediments are obtained. The extracted acoustic reflectance characteristics are based on the characteristic information of the mixed sediments. Fewer scholars have paid attention to the acoustic reflection characteristics of the fine distribution of particle sizes. Such research requires specific sediment grain sizes, which can be limited by sampling. Additionally, the use of sonar equipment with higher degrees of refinement is necessary for studying sediments with fine particle sizes. As a result, sediments with fine particle sizes have not been fully explored.
The study of specific sediments requires a sonar instrument capable of supporting refined measurements under laboratory conditions. Our laboratory has developed an in-house sonar that meets these requirements. This sonar instrument emits a very narrow beam, and in the mid- and high-frequency bands, the measurements are free from side-lobe interference. In contrast, general sonar equipment typically generates multipath interference from side lobes, which prevents clear echo distinction and complicates fine measurements in these frequency bands. To address this, we developed a unique transducer to support laboratory fine measurements.
Furthermore, the southern foothills of the Tianshan Mountain, where our study is located, were once a paleo-marine depositional environment (Song et al., 2016; Tao et al., 2023). Some studies suggest this region belongs to the Late Ediacaran-Early Cambrian stratigraphy (Chang et al., 2021), while others propose an Ordovician period (Zhang and Munnecke, 2016). The sandy sediments in this area exhibit good homogeneity of grain size due to natural sorting processes. Based on this, we screened six sandy sediment samples with grain sizes ranging from 0.1 to 2.5 mm using a standard sieve. Under laboratory conditions, we then used a high-frequency submersible sub-bottom profiler (HF-SSBP) to investigate the relationship between the sediments and acoustic reflection signals.
The remainder of this paper is organized as follows: Section 2 outlines the measurement principle and method. The experimental setup and sample preparation are detailed in Section 3. Section 4 presents the analysis and discussion of the data results. Finally, a concise summary is provided in Section 5.
2 Measurement methods
2.1 Measuring device
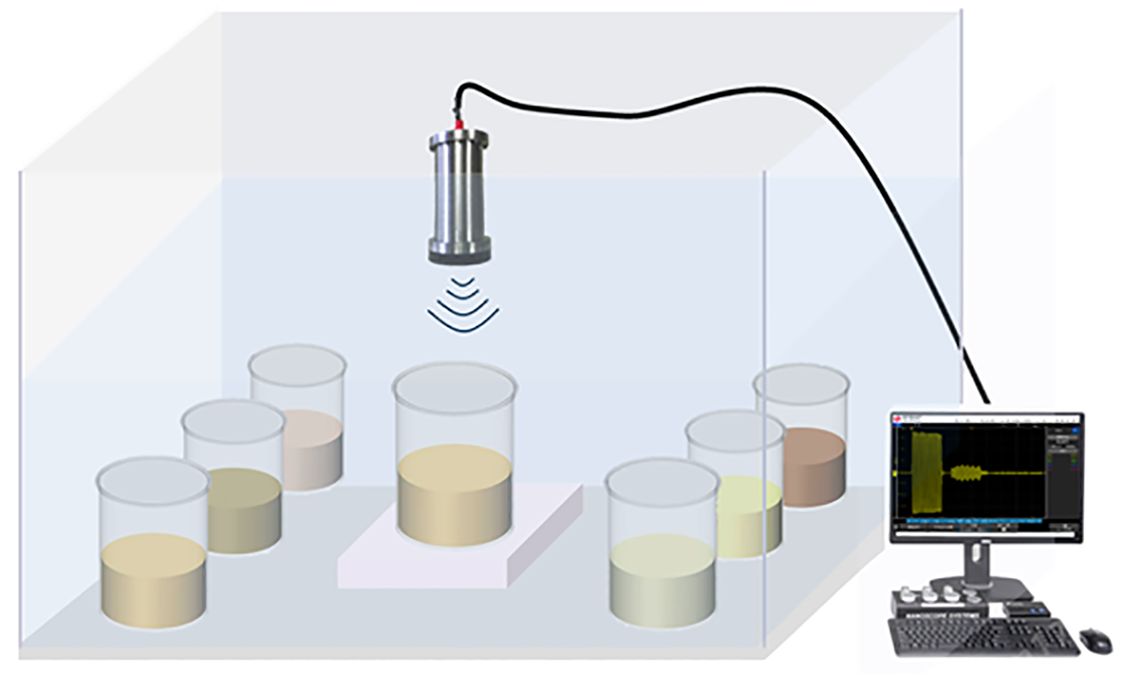
An iron water tank measuring 4 m × 2.5 m × 1.7 m was utilized in the experiment. The bottom of the tank was lined with a 100-mm-thick acrylic plate, which held the sediment samples in acrylic buckets. A small aerial crane was employed to lift the various test samples. The transducer and polyformaldehyde (POM) plate were connected and suspended from the iron frame at the top of the water tank. The POM plate was attached to the center of a fixed axis, allowing the transducer to move vertically and adjust its distance from the sediment surface. During testing, the transducer remained parallel to the sediment surface and was kept suspended directly above it. Figure 1 illustrates the schematic diagram of the measurement setup.
The experimental study is a mechanistic investigation of the relationship between sediment grain size and acoustic reflection. However, field sediments are typically mixtures of multiple grain sizes, complicating mechanistic studies. Therefore, sieving naturally sorted sediment grain sizes in the laboratory to study acoustic reflection at different grain sizes is a fundamental aspect of understanding mixed grain sizes under field conditions.
2.2 Acoustic reflection signal processing
The HF-SSBP device utilizes a linear frequency modulation (LFM) signal as the transmit signal and receives an echo signal that is a superposition of multiple reflection signals in the time domain. This can make it difficult to distinguish between the interfaces of the sediments, acrylic, and water. By processing the raw data obtained using the shallow stratigraphic profiler with a pulse compression algorithm, it is possible to extract the reflection information at the interface between the water and sediment. First, the time-domain signal undergoes orthogonal demodulation. Next, the demodulated result is filtered using a low-pass filter to remove the signal’s carrier frequency. Finally, the signal obtained from the low-pass filter is processed using the LFM signal as a matched filter, resulting in the computation of the interface reflection intensity. The pulse compression algorithm comprises several main steps. For more detailed information on the pulse compression algorithm, please refer to the literature (Curlander and Mcdonough, 1992).
Where: and are quadrature demodulation factors. (Equations 1, 2) are used to perform quadrature demodulation of the time-domain signal to obtain the quadrature demodulation results and of the time-domain signal . Equation 3 represents the computational expression for the complex signal. is the low-pass filter; is the complex signal; and M(t) is the matched filter; V(t) represents the strength of reflection for a multilayer signal. Equation 4 represents the mathematical model for calculating the reflected intensity of the multilayer.
3 Experiments
3.1 Testing equipment
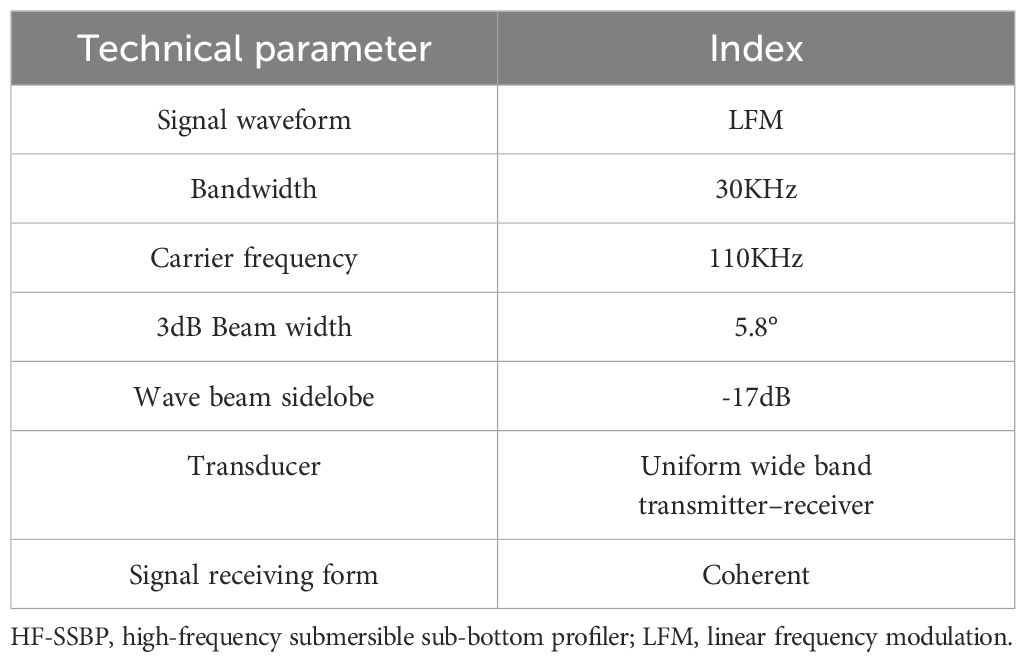
To investigate the acoustic echo signals of specific sediment grain sizes, we utilized an HF-SSBP (Cao et al., 2022). The HF-SSBP uses LFM signals with an operating carrier frequency of 110 kHz, a bandwidth of 30 kHz, and a coherent signal for echo reception. The transducer structure is a transceiver combination that employs a novel broadband design. It also incorporates very low side-lobe technology, resulting in a side-lobe to main-lobe ratio of −17.1 dB. To ensure that the transducer received reflective signals from all sediment surfaces, we selected an acrylic bucket with an appropriate diameter for the sediment samples. During the experiment, it was found that an acrylic bucket with a diameter of 30 cm could fully capture the acoustic signal, whereas buckets with diameters of 20 cm and 40 cm were less effective. Consequently, the experimental tests were conducted using a 30-cm-diameter bucket to ensure that all reflected signals originated from the sediment and not from other spatial reflections. This setup allowed for precise measurements even in confined spaces. Table 1 presents the device parameters.
3.2 Sample preparation
In order to conduct this experiment, samples of sandy sediment were collected from the Kumarik River basin. The sandy sediments in this area are transported by rivers. Due to the natural sorting effects of wind and other environmental factors, it was deemed appropriate to select naturally sorted sandy sediments, which are more representative of those formed in natural environments than man-made sand. However, the grain size of the naturally sorted sediments is not very uniform. Therefore, the sediments were further sieved into six grain sizes: 0.1-0.3 mm, 0.3-0.5 mm, 0.5-1.0 mm, 1.0-1.5 mm, 1.5-2.0 mm, and 2.0-2.5 mm, using a standard sieve in the laboratory. To remove very fine sand particles and clay attachments from the sediments, the sieved sediments were placed in a bucket and mixed with clean water. By repeatedly stirring and decanting the supernatant, most of the clay attached to the sediments was washed away after several repetitions. Finally, the grit was loaded into an acrylic bucket and stirred to settle. The resulting saturated sandy sediments, with a thickness of 8 cm, were placed in an acrylic bucket with a diameter and height of 300 mm. The thickness should not be too thin to avoid an unstable sound field and should not be too thick to prevent internal inhomogeneities and ensure strong echo information from the bottom of the sediment. These considerations help verify and calibrate the measurement results. The sediment samples were prepared in June 2023 and tested in October 2023 after a deposition time of approximately 90 days. Figure 2 shows the surface map of the sediment samples, illustrating the gradual increase in particle size and surface roughness across the six sediments.
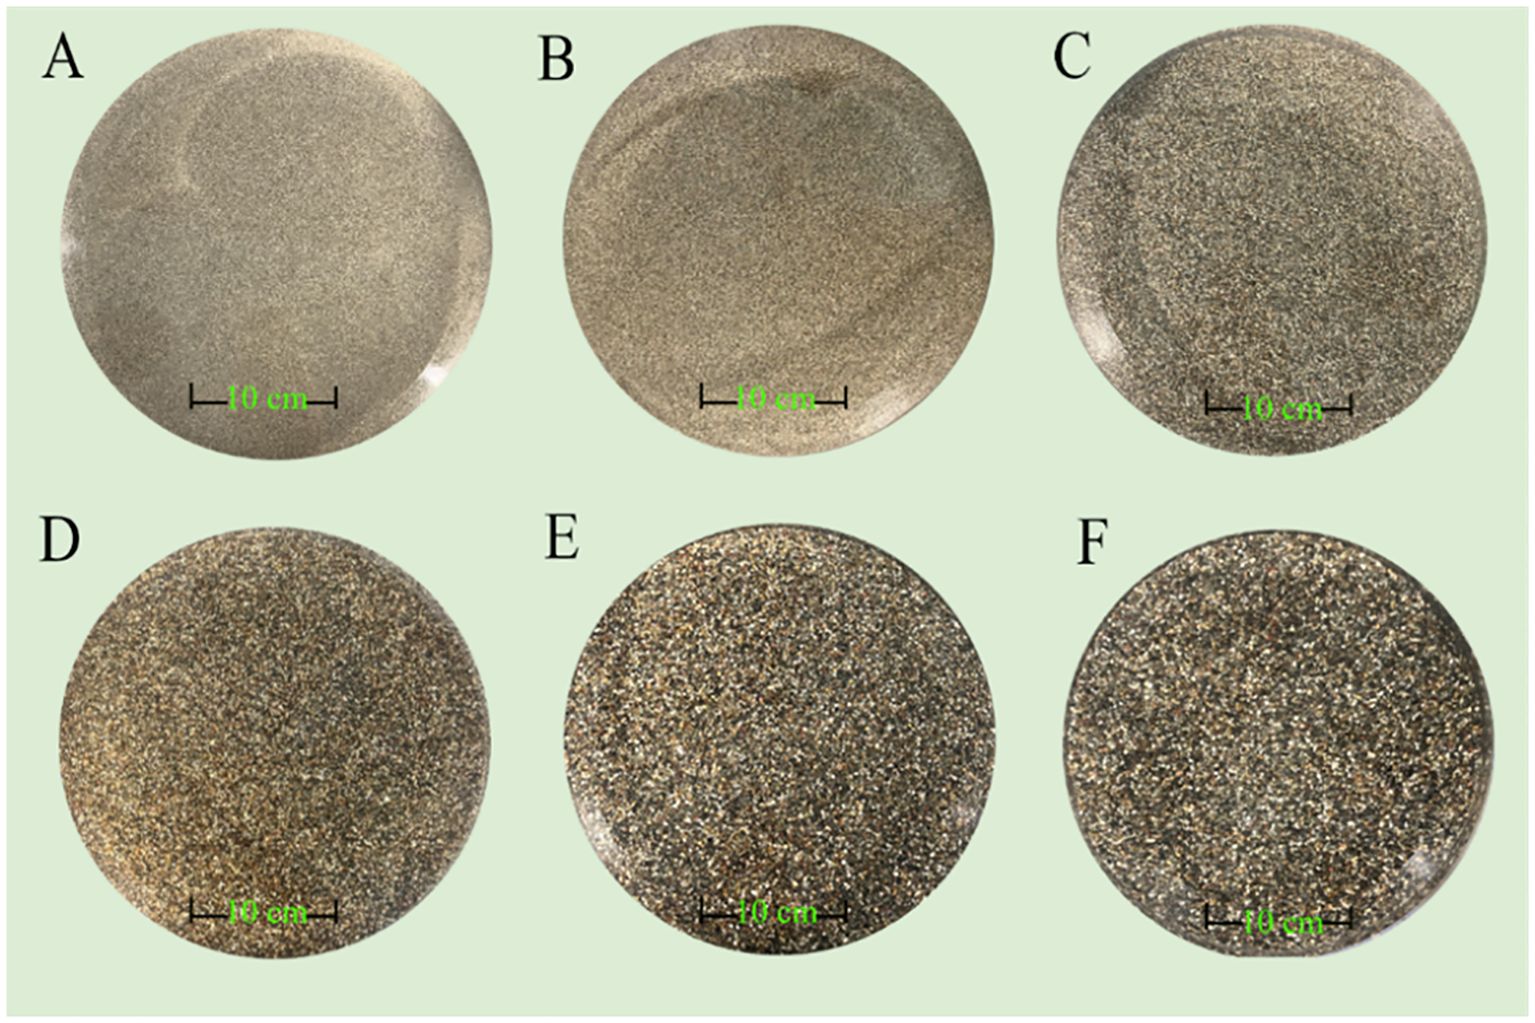
Figure 2. Six grain size sediment samples: (A) 0.1-0.3 mm; (B) 0.3-0.5 mm; (C) 0.5-1.0 mm; (D) 1.0-1.5 mm; (E) 1.5-2.0 mm; (F) 2.0-2.5 mm).
4 Result and analysis
4.1 Test results and data processing
To verify the accuracy and stability of the measurement process, we placed an acrylic bottom with a depth of 10 cm at the bottom of the tank. We then measured the reflection signal from the transducer at intervals of 80 cm, 85 cm, 90 cm, 95 cm, 100 cm, and 105 cm from the surface of the acrylic. The data were processed using the pulse compression algorithm to extract the characteristic peaks. Two reflection peaks were observed: one at the interface between the water and acrylic, and the other at the interface between the acrylic and the bottom of the water tank. However, the amplitude of the reflection peak at the interface between the acrylic and the bottom of the water tank was stronger than that at the interface between the water and acrylic. This may be due to the strong reflection at the bottom of the water tank, resulting in a signal amplitude that exceeded that of the reflection between the water and acrylic interface. The reflected signal amplitude decreased linearly as the transducer moved away from the acrylic surface, indicating good accuracy and stability of the experimental process.
4.2 Time domain analysis
To analyze the effect of sediment grain size on the shape of the acoustic reflection signal echo, we examined the time-domain diagrams of the echo signals at the sediment surface 90 cm from the transducer. The time-domain diagrams of the six grain sizes are shown in Figure 3. The purple area in Figure 3 represents the initial 80 μs segment of the received signal following reflection by the sediment. Variations in the waveform within this region indicate sediment grain size differences. The reflection peak amplitude is relatively large for grain sizes A and F, and it gradually increases with increasing grain size for B, C, D, and E. For particle sizes A and B, the three echoes of the reflected signal are clearer. As particle size increases, the superposition trend of the three interfaces of the reflected echoes becomes more pronounced. The reflected echoes exhibit different wavefront flare shapes, with the angle of the wavefront flare being larger for several grain sizes, except for grain size E. This may be related to the porosity of the sediment and other factors.
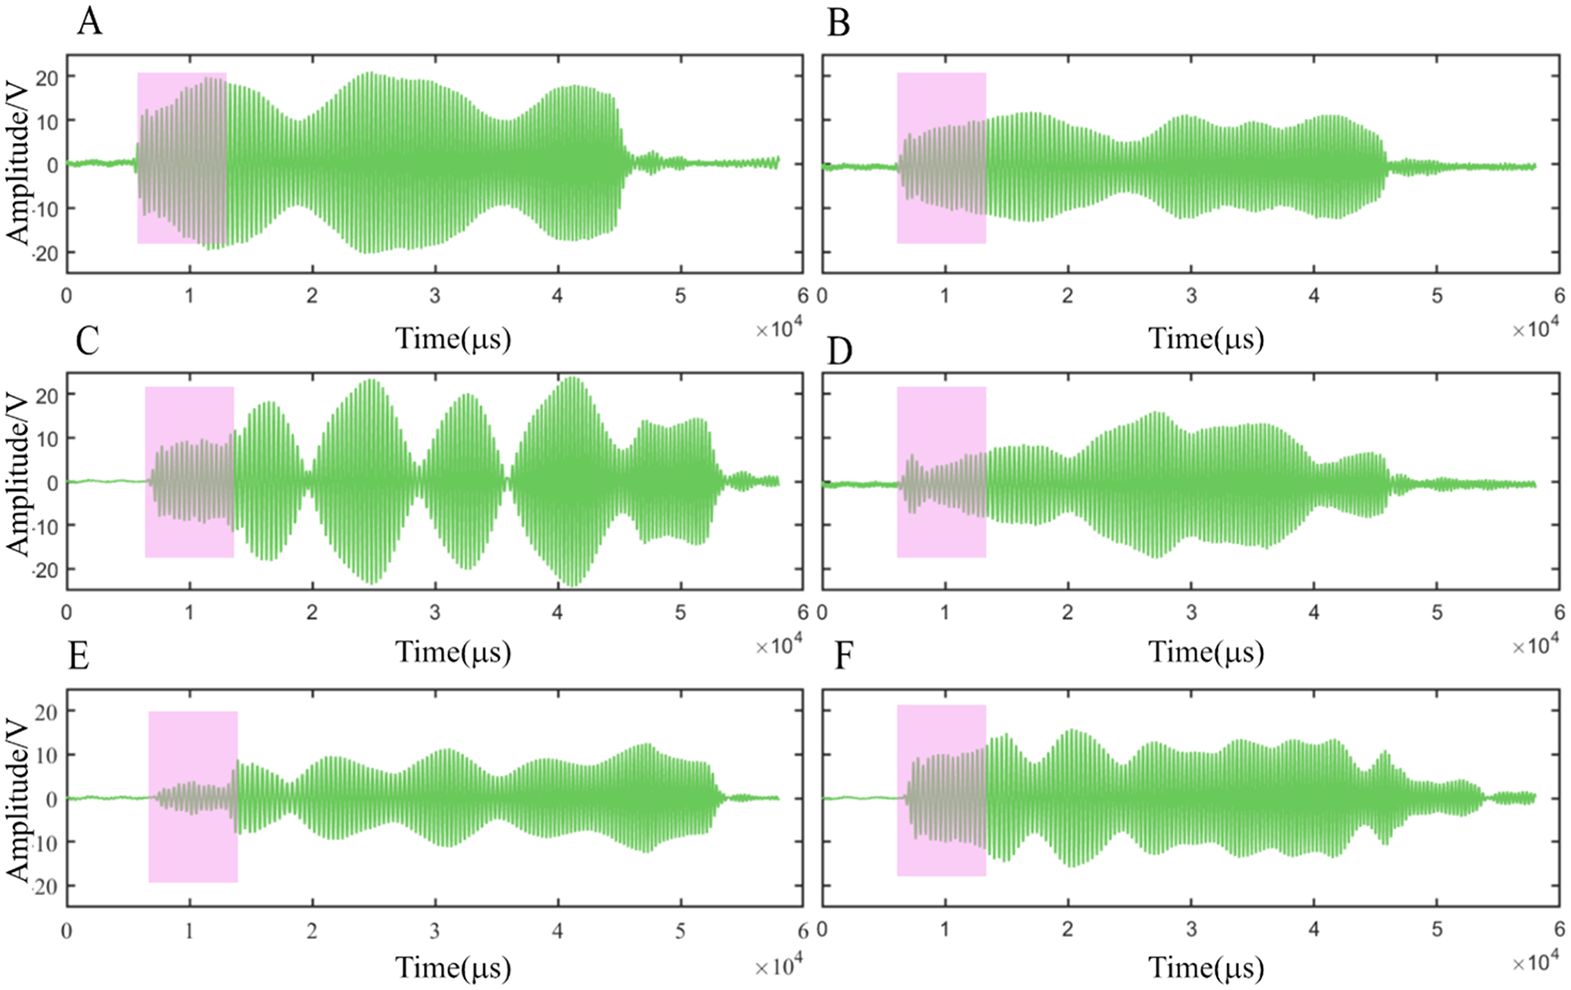
Figure 3. Time domain visualization of six particle sizes. (A) 0.1-0.3 mm; (B) 0.3-0.5 mm; (C) 0.5-1.0 mm; (D) 1.0-1.5 mm; (E) 1.5-2.0 mm; (F) 2.0-2.5 mm).
5 Discussion
5.1 Six sediment reflection peaks
The characteristic reflection peaks of each grain size were extracted from the reflection signals of six sandy sediments using the pulse compression algorithm. The results are presented in Figure 4. The black line represents the first antipodal amplitude, the reflection peak at the water-sediment interface. The blue line represents the second antipodal amplitude, the reflection peak at the interface between the bottom of the sediment and the acrylic bucket. The red line represents the third antipodal amplitude, the reflection peak at the interface between the bottom of the tank and the acrylic bucket. These results are consistent with the pulse compression results shown in Figure 5, which illustrate the clear layering of the three interfaces. The reflection peak amplitude at the water-sediment interface is the strongest. As the distance between the sediment surface and the transducer surface increases, the reflection peaks at the water-sediment interface decrease to varying degrees. Figure 4C shows a situation where the amplitude of the third reflection peak (acrylic and the bottom of the water tank) is higher than those of the first and second reflection peaks. This could be due to the mutual interference between the bottom of the water tank, the acrylic, and the laboratory floor. It should be noted that our water tank was made of iron and was only 5 mm thick. Figures 4A–F show that the amplitude of the second peak is not stable. In Figures 4A, D, the second reflection peak is located between the first and third peaks. In Figures 4B, C, and F, the amplitude of the second reflection peak is the smallest. In Figure 4E, the difference in the amplitudes of the second and third peaks is not noticeable. Therefore, the first reflection peak is particularly valuable for studying sediments.
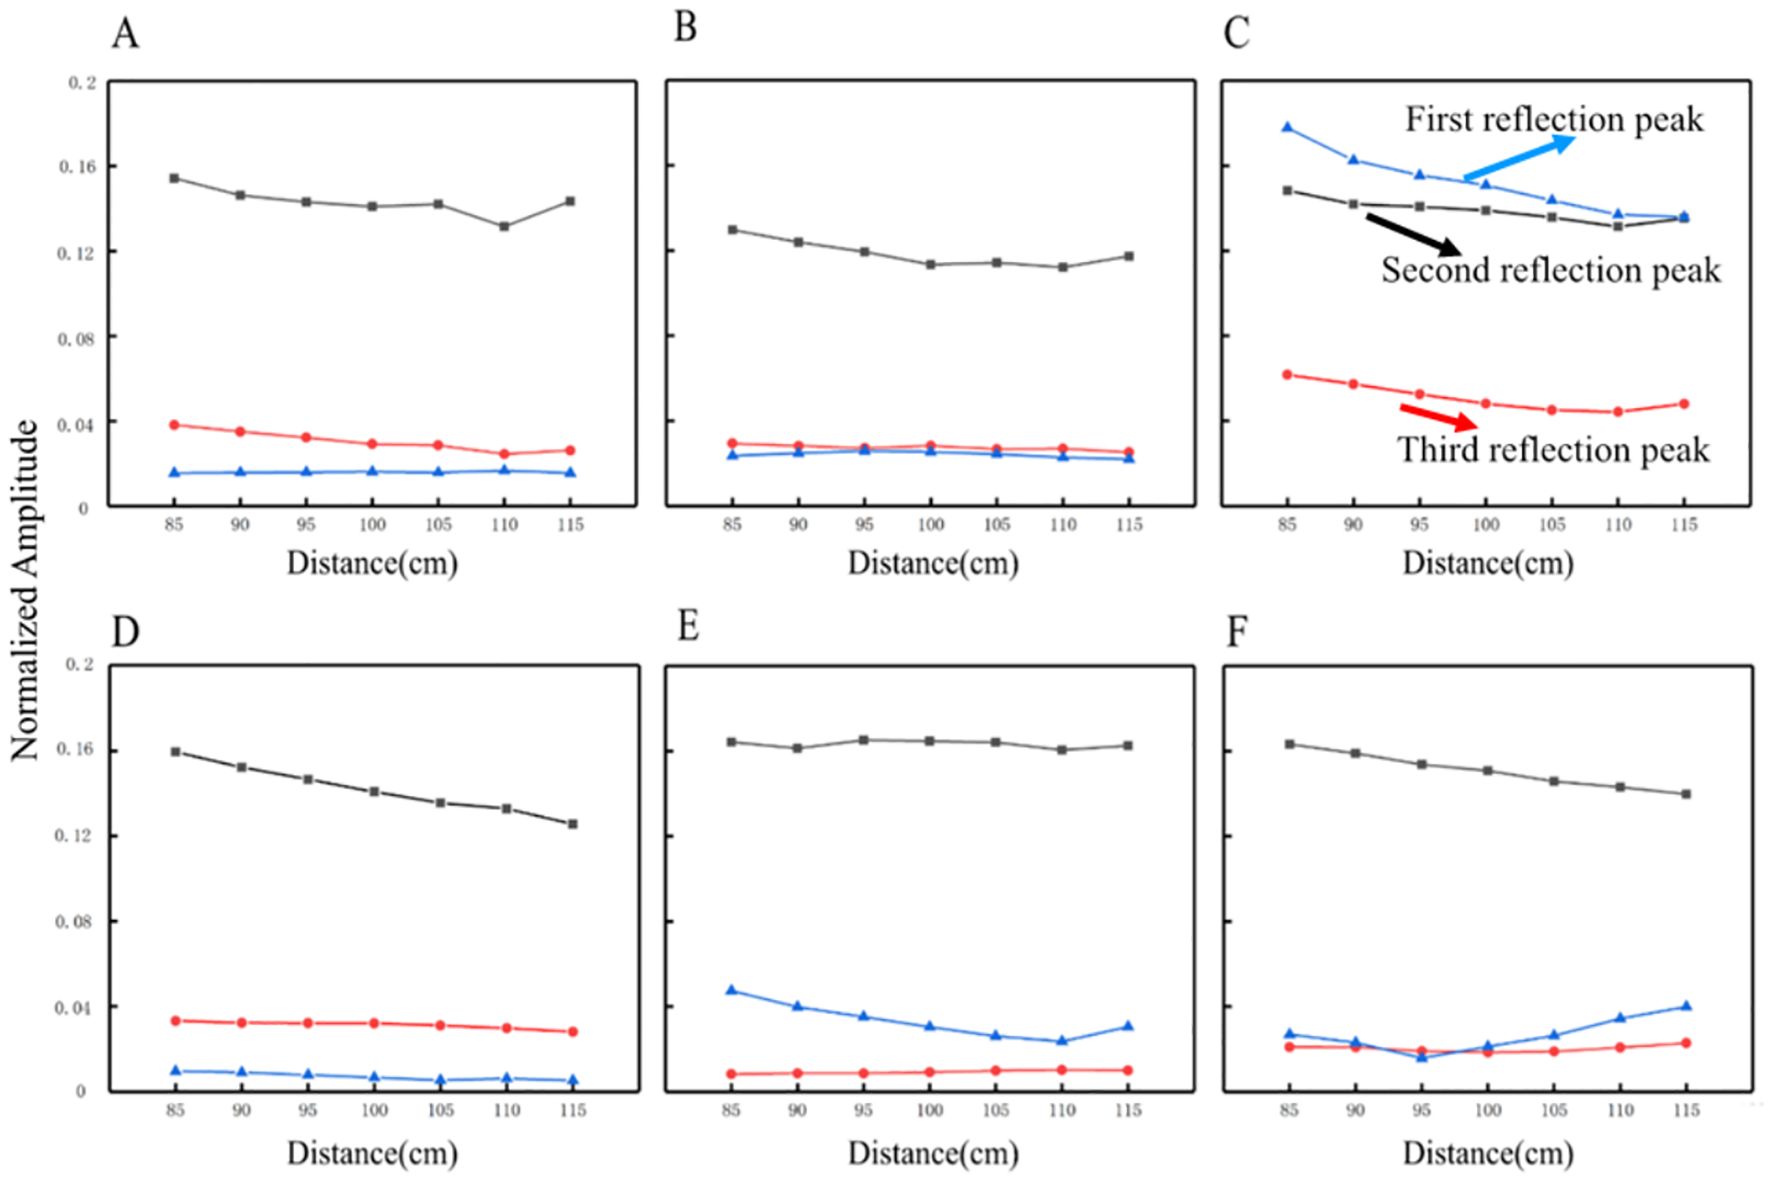
Figure 4. Reflectance peaks in sandy sediments of six grain sizes. (A) 0.1-0.3 mm; (B) 0.3-0.5 mm; (C) 0.5-1.0 mm; (D)1.0-1.5 mm; (E) 1.5-2.0 mm; (F) 2.0-2.5 mm.
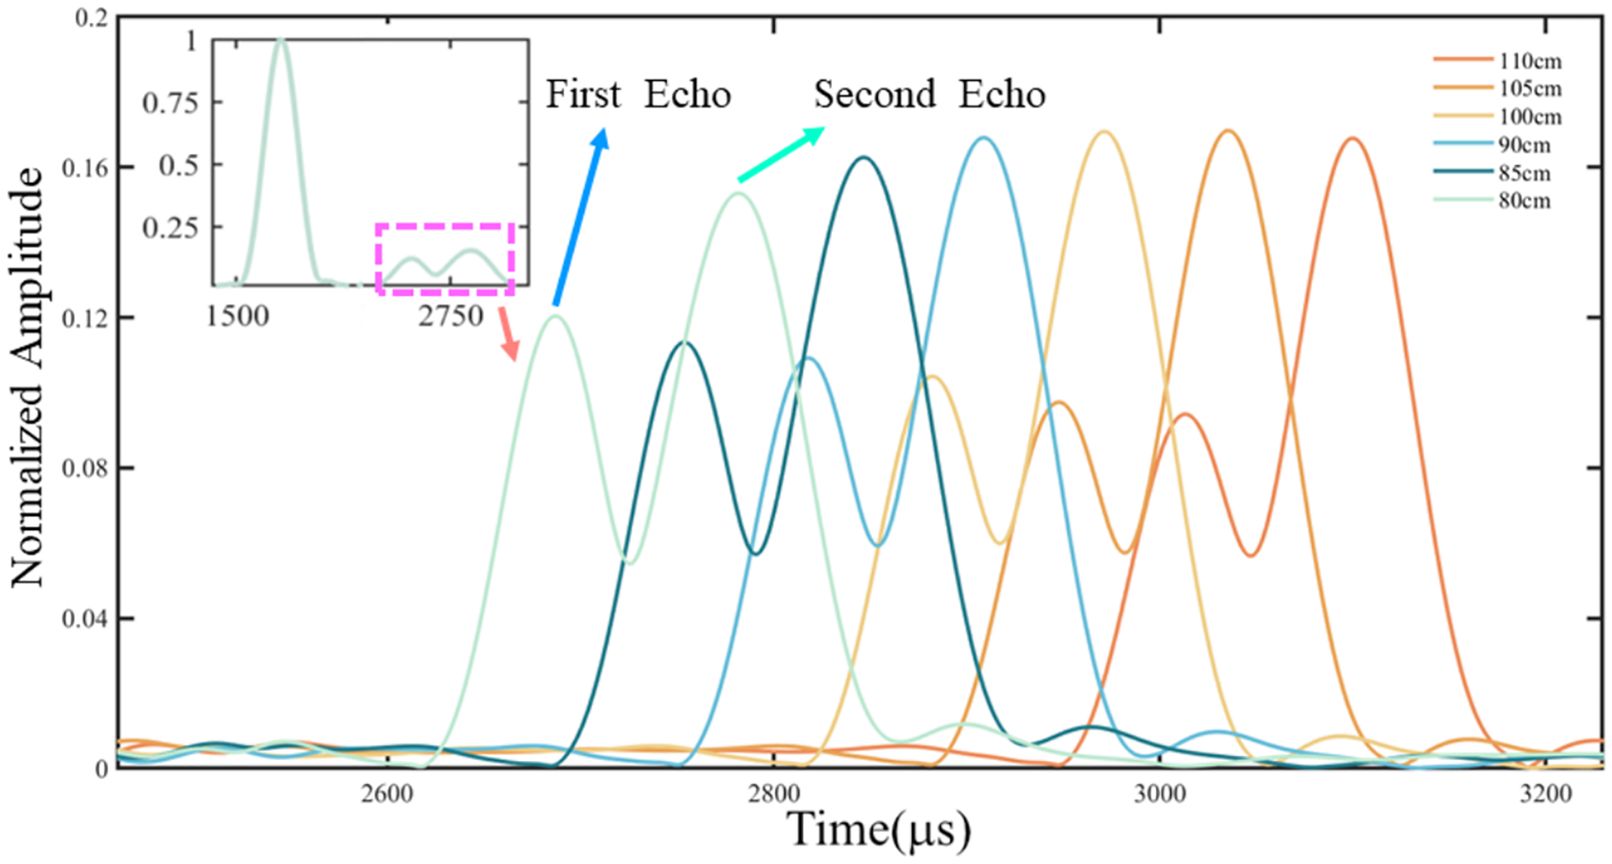
Figure 5. Waveforms of pulse compression of acoustic reflection signals from sandy sediments ranging in size from 1.0-1.5 mm.
5.2 Analysis of the first reflection peak
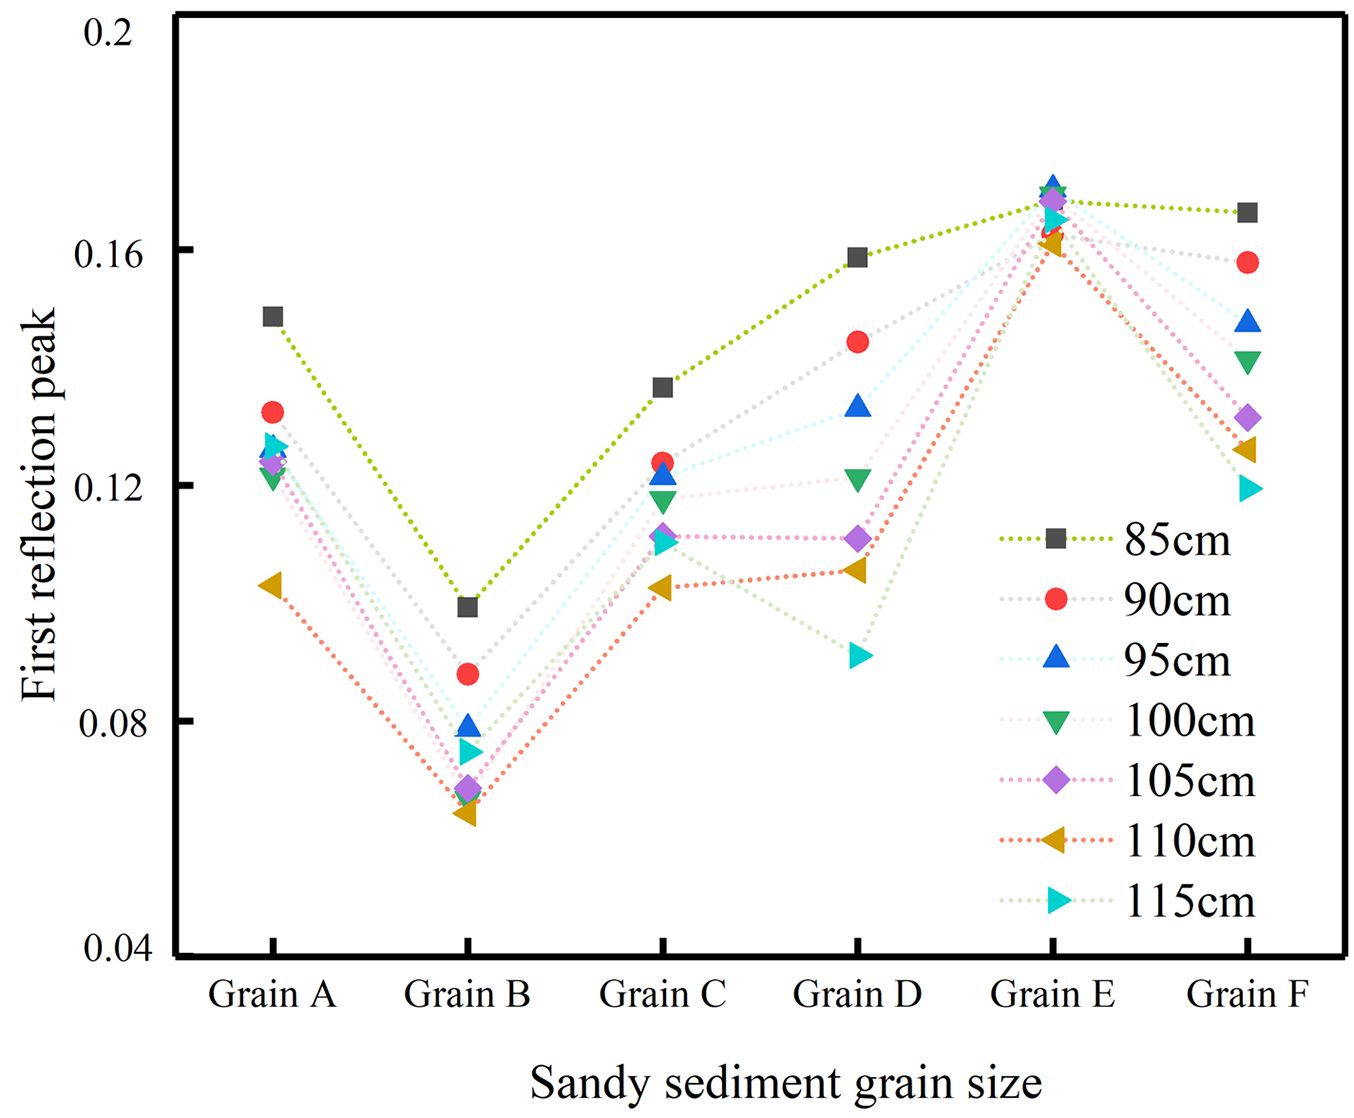
To investigate the relationship between sediment grain size and reflection peak amplitude, we analyzed the extracted values of the first reflection peak amplitude and sediment grain size. The results are presented in Figure 6. In general, the amplitude of the first reflection peak increases with increasing sediment grain size. This trend is consistent with the findings of (Ivakin and Sessarego, 2007, Eleftherakis et al., 2014). in the high-frequency broadband range. However, grain sizes A (0.1–0.3 mm) and F (2.0–2.5 mm) do not exhibit an obvious amplitude correlation. This may be due to the positive correlation between reflection peak amplitude and grain size within a specific range of grain sizes. The findings of Hamilton (1972) are similar, indicating that acoustic attenuation is lower in coarse sand and clay sediments, but higher in fine sand and silt sediments. As the sediment surface moves away from the transducer, the reflection peak amplitudes decrease to varying degrees. For particle size E, the reflection peak amplitude remains relatively stable. This may be because the acoustic emission signal of the sediment surface is less sensitive to distance changes at this particle size. The roughness of the sediment surface is caused by varying degrees of roughness.
5.3 Signal of the first reflection peak histogram
A calculation was performed based on the speed of sound in the sediment as presented in the literature (Park et al., 2023; Tian et al., 2023) and the thickness of the sediment as measured in the laboratory. This calculation yielded a one-way transmission propagation time of the sound wave in the sediment of 80 μs. By calculating the one-way propagation time of the sound wave in the sediment and the propagation time in the water, we can establish the time of the first wave of the signal reflected from the sediment surface. This allows us to determine the return signal of the sediment layer without interference. The mean value of the signal amplitude was plotted after extracting the 80 μs signal. The results are presented in Figure 7, which shows the consistency between the histogram of the 80 μs signal and the trend of the first wave of the time-domain echo signal.
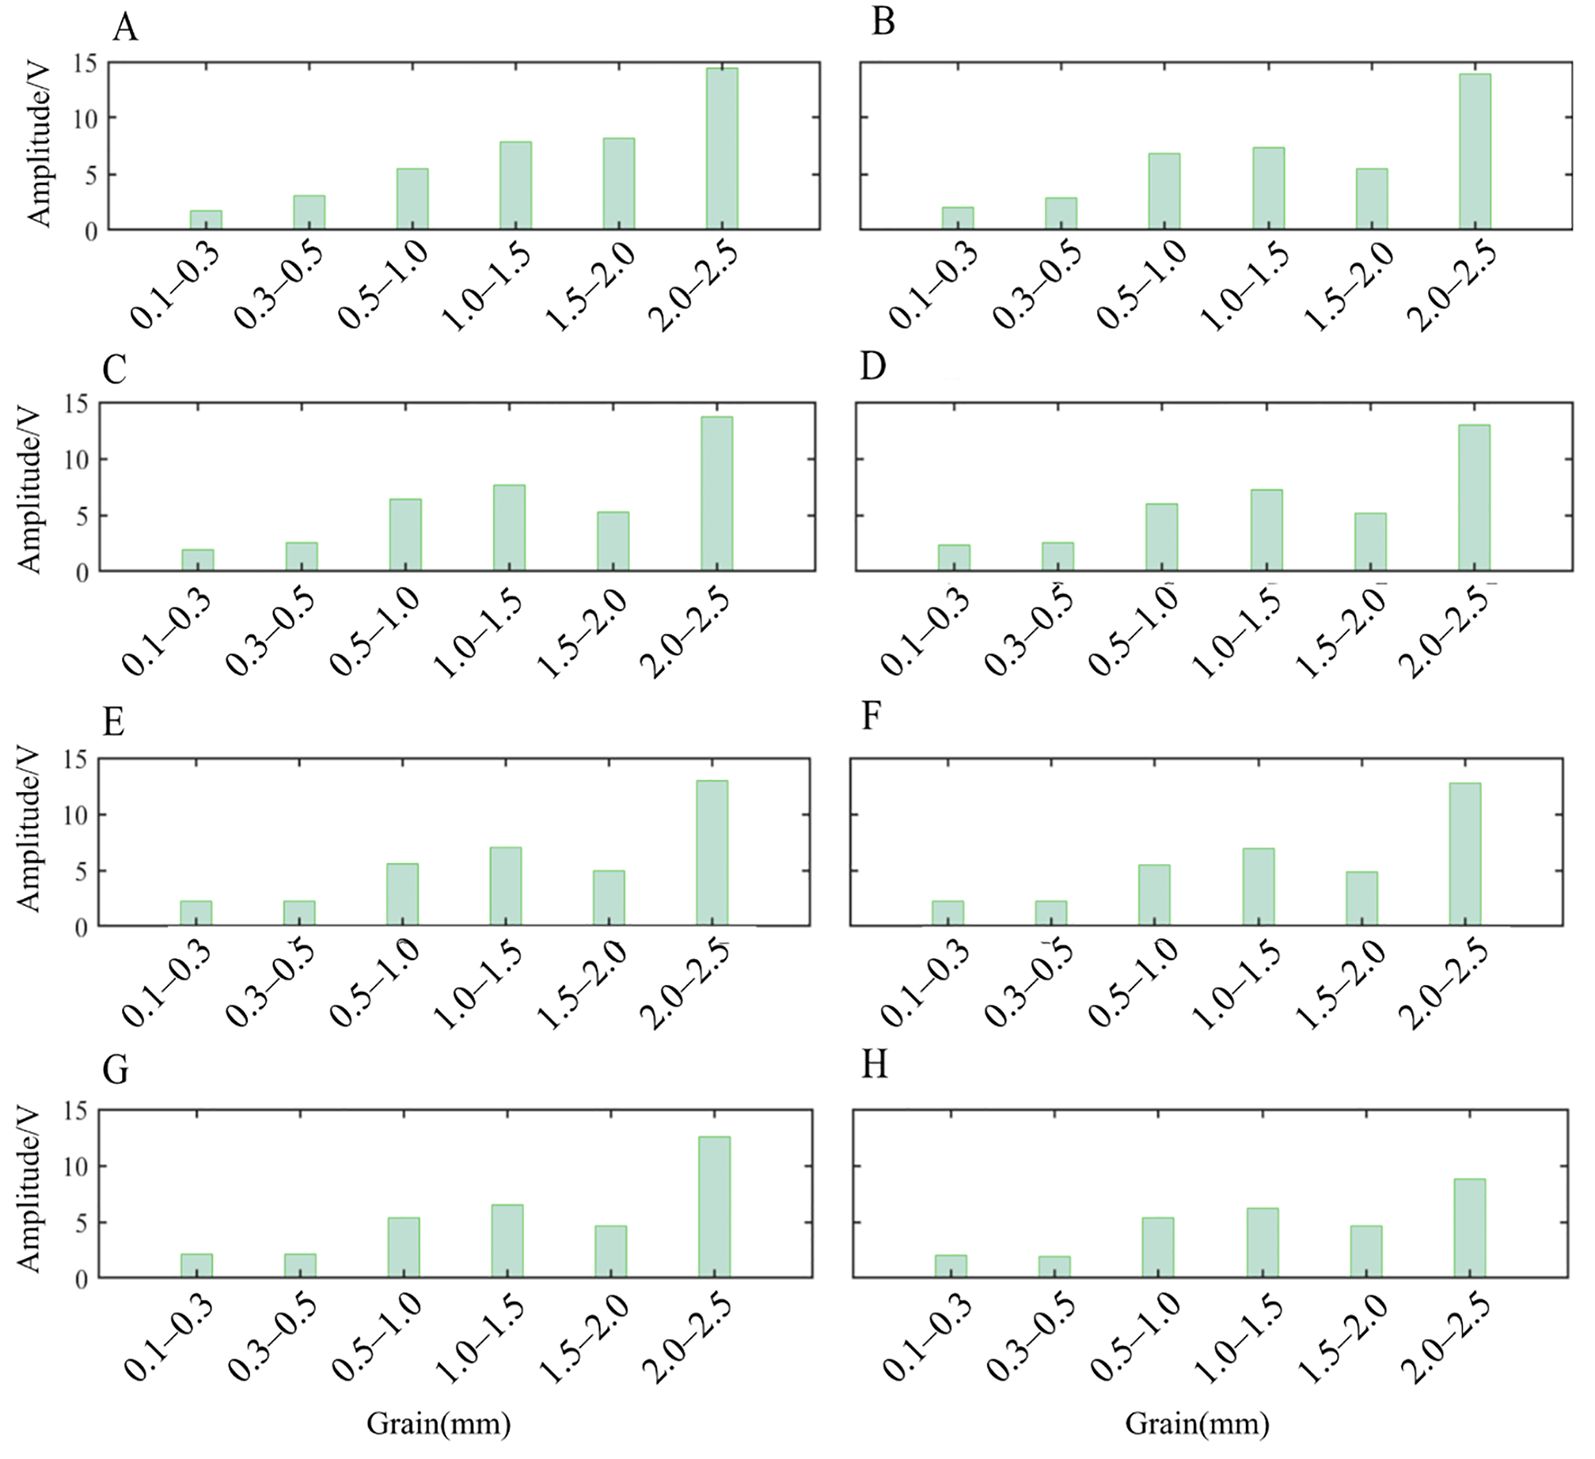
Figure 7. Histograms of 80 μs signals from six sandy sediments. (A) 80 cm; (B) 85 cm; (C) 90 cm; (D) 95 cm; (E) 110 cm; (F) 105 cm; (G) 110 cm; (H) 115 cm.
5.4 Sediment classification
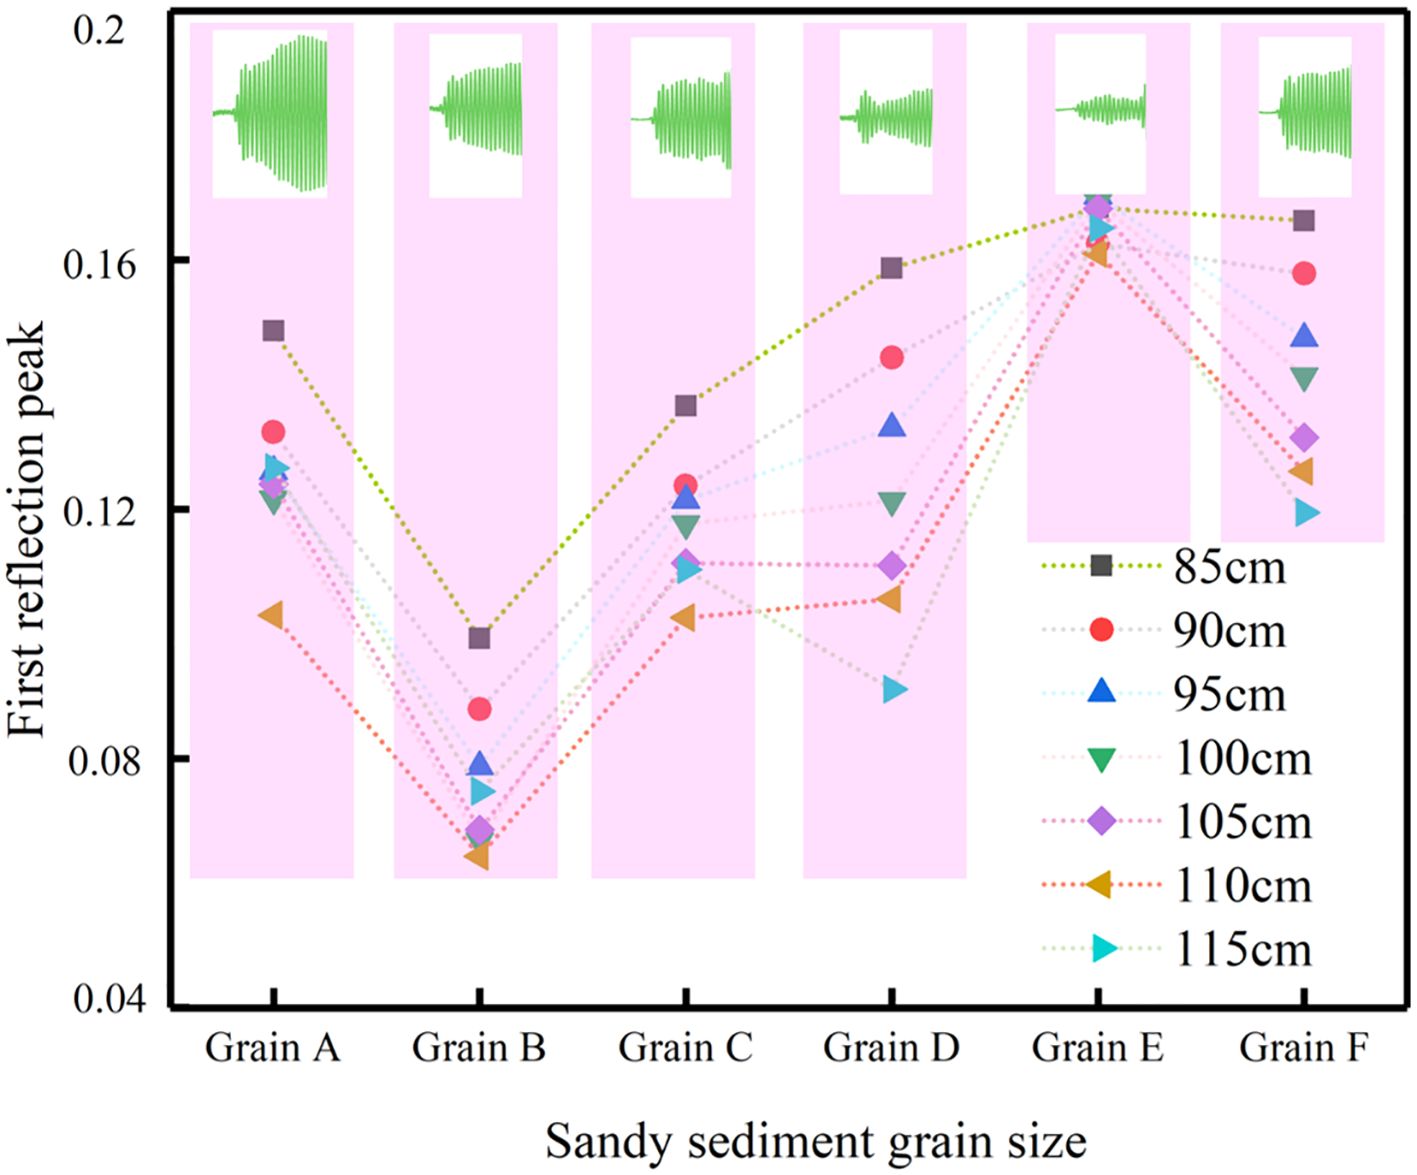
Figure 8 illustrates the first wave amplitude and waveforms of the reflection signals for six grain sizes of sandy sediments at different distances. It can be observed that the grain sizes of the sediments and the amplitude of the first reflection peaks are approximately positively correlated. Furthermore, the amplitude of the first reflection peaks increases gradually with the increase in sediment grain sizes. When the particle sizes are A, C, and D, the amplitude of the sediment reflection peaks exhibits minimal variation, whereas the time-domain waveforms show pronounced differences. As shown in the upper time-domain waveform in Figure 8, the beam opening angle is greater for particle size A. In contrast, particle sizes C and D exhibit smaller beam opening angles than A. The difference in reflected peak amplitude between particle sizes E and F is not particularly large, but the beam opening angle of the reflected waveform for particle size E is relatively small, while that for particle size F is relatively large. Therefore, the combination of acoustic reflection amplitude and echo waveform can be used to more finely distinguish sediment grain sizes.
6 Conclusions
The laboratory research on the acoustic reflection signals of sandy sediments with varying grain sizes revealed that the shallow low-level HF-SSBP is capable of precise measurements. In this study, we utilized this equipment to analyze six sandy sediments with different grain sizes in the laboratory. The following conclusions were reached:
(1) We independently developed the HF-SSBP used in the experiments, and this instrument can accurately and precisely measure sandy sediments in a small space. The equipment is capable of testing the accuracy and stability of the acoustic reflection echoes of sandy sediments in the laboratory.
(2) Six types of sediment with uniform grain sizes were obtained from sandy sediments using standard sieves. Their acoustic reflection echoes were then tested, and it was found that there was a positive correlation between the amplitude and grain size. The amplitude of the reflection peaks increased with increasing grain size.
(3) By analyzing the amplitude of the reflection peaks and echo waveforms, sediment grain sizes can be distinguished in a more precise manner.
This study provides a valuable guide for the fine-grained classification of sediment grain size.
Data availability statement
The original contributions presented in the study are included in the article/supplementary material. Further inquiries can be directed to the corresponding author.
Author contributions
HZ: Data curation, Investigation, Writing – original draft, Writing – review & editing. XC: Funding acquisition, Project administration, Supervision, Writing – review & editing. ZQ: Data curation, Methodology, Software, Writing – review & editing. DZ: Conceptualization, Formal analysis, Supervision, Validation, Writing – review & editing. SX: Data curation, Investigation, Methodology, Writing – review & editing. JS: Data curation, Investigation, Writing – review & editing. HG: Data curation, Formal analysis, Investigation, Visualization, Writing – review & editing.
Funding
The author(s) declare financial support was received for the research, authorship, and/or publication of this article. This research was supported by the Natural Science Foundation of the Xinjiang Uygur Autonomous Region (grant numbers 2022D01C736 and 2022D01C348).
Conflict of interest
The authors declare that the research was conducted in the absence of any commercial or financial relationships that could be construed as a potential conflict of interest.
Publisher’s note
All claims expressed in this article are solely those of the authors and do not necessarily represent those of their affiliated organizations, or those of the publisher, the editors and the reviewers. Any product that may be evaluated in this article, or claim that may be made by its manufacturer, is not guaranteed or endorsed by the publisher.
References
Anokye M., Cui X., Yang F., Fan M., Luo Y., Liu H. (2024). CNN multibeam seabed sediment classification combined with a novel feature optimization method. Math. Geosciences 56, 279–302. doi: 10.1007/s11004-023-10079-5
Cao X., Zou D., Qu Z., Zhen H., Cheng H., Wei Z. (2022). Calibration and application of high-frequency submersible sub-bottom profiler for deep-sea surficial sediment measurement. Mar. Georesources Geotechnology. 41 (6), 671–681. doi: 10.1080/1064119X.2022.2086510
Chang X., Hou M., Woods A., Chen Z. Q., Liu X., Liao Z., et al. (2021). Late Ordovician paleoceanographic change: Sedimentary and geochemical evidence from Northwest Tarim and Middle Yangtze region, China. Palaeogeography Palaeoclimatology Palaeoecol. 562, 110070. doi: 10.1016/j.palaeo.2020.110070
Cui X., Yang F., Wang X., Ai B., Luo Y., Ma D. (2021). Deep learning model for seabed sediment classification based on fuzzy ranking feature optimization. Mar. Geology. 432, 106390. doi: 10.1016/j.margeo.2020.106390
Curlander J. C., Mcdonough R. N. (1992). Synthetic aperture radar: systems and signal processing. Signal Process. 29, 107–107. doi: 10.1016/0165-1684(92)90103-4
Eleftherakis D., Snellen M., Amiri-Simkooei A., Simons D. G., Siemes K. (2014). Observations regarding coarse sediment classification based on multi-beam echo-sounder’s backscatter strength and depth residuals in Dutch rivers. J. Acoust Soc. Am. 135, 3305–3315. doi: 10.1121/1.4875236
Fonseca L., Brown C., Calder B., Mayer L., Rzhanov Y. (2009). Angular range analysis of acoustic themes from Stanton Banks Ireland: a link between visual interpretation and multibeam echosounder angular signatures. Appl. Acoust. 70, 1298–1304. doi: 10.1016/j.apacoust.2008.09.008
Hamilton E. L. (1970). Sound velocity and related properties of marine sediments, North Pacific. J. Geophys Res. 75, 4423–4446. doi: 10.1029/JB075i023p04423
Hamilton E. L. (1972). Compressional wave attenuation in seafloor sediments. Geophysics 37, 620–646. doi: 10.1190/1.1440287
Hamilton E. L. (1980). Geoacoustic modeling of the sea floor. J. Acoust Soc. Am. 68, 1313–1340. doi: 10.1121/1.385100
Ivakin A. N., Sessarego J.-P. (2007). High frequency broad band scattering from water-saturated granular sediments: Scaling effects. J. Acoust Soc Am. 122, 165–171. doi: 10.1121/1.2784534
Jackson D. R., Richardson M. D. (2007). High-frequency seafloor acoustics (Berlin, Germany: Springer Science and Business Media). doi: 10.1007/978-0-387-36945-7
Ji X., Yang B., Tang Q. (2020). Seabed sediment classification using multibeam backscatter data based on the selecting optimal random forest model. Appl. Acoust. 167, 107387. doi: 10.1016/j.apacoust.2020.107387
Li G. B., Hou Z. Y., Wang J. Q., Kan G. M., Liu B. H. (2021a). Empirical equations of p-wave velocity in the shallow and semi-deep sea sediments from the south China Sea. J. Ocean Univ China 20, 532–538. doi: 10.1007/s11802-021-4476-y
Li G. B., Wang J. Q., Meng X. M., Liu B. H., Kan G. M., Han G. Z., et al. (2021b). Relationships between the ratio of sound speed and physical properties of surface sediments in the south yellow Sea. Acta Oceanol Sin. 40, 65–73. doi: 10.1007/s13131-021-1764-8
Liu B., Han T., Kan G., Li G. (2013). Correlations between the in situ acoustic properties and geotechnical parameters of sediments in the yellow Sea, China. J. Asian Earth Sci. 77, 83–90. doi: 10.1016/j.jseaes.2013.07.040
Marsh I., Brown C. (2008). Neural network classification of multibeam backscatter and bathymetry data from Stanton Bank (Area IV). Appl. Acoust 70, 1269–1276. doi: 10.1016/j.apacoust.2008.07.012
Park J., Lee J.-S., Yoon H.-K. (2023). Geoacoustic and geophysical data-driven seafloor sediment classification through machine learning algorithms with property-centered oversampling techniques. Computer-Aided Civil Infrastructure Eng. 39 (14), 1–17. doi: 10.1111/mice.13126
Qin X., Luo X., Wu Z., Shang J. (2021). Optimizing the sediment classification of small side-scan sonar images based on deep learning. IEEE Access 9, 29417–29428. doi: 10.1109/Access.6287639
Song D., Wang T.-G., Deng W., Shi S. (2016). Application of light hydrocarbons (C5–C7) in Paleozoic marine petroleum of the Tarim Basin, NW China. J. Petroleum Sci. Eng. 40, 57–63. doi: 10.1016/j.petrol.2016.01.009
Tao Y., Gao D., He Y., Ngia N. R., Wang M., Sun C., et al. (2023). Carbon and oxygen isotopes of the Lianglitage Formation in the Tazhong area, Tarim Basin: Implications for sea-level changes and palaeomarine conditions. Geological J. 58, 967–980. doi: 10.1002/gj.4637
Tian Y., Chen Z., Mo Y., Xie A., Huang W., Wang S., et al. (2023). Effects of physical properties on the compression wave speed of seafloor sediment in the South China Sea: Comparisons between theoretical models and measured data. Front. Phys. 11. doi: 10.3389/fphy.2023.1122617
Wang J., Kan G., Li G., Meng X., Zhang L., Chen M., et al. (2023). Physical properties and in situ geoacoustic properties of seafloor surface sediments in the East China Sea. Front. Mar. Sci. 10. doi: 10.3389/fmars.2023.1195651
Wang H., Zhou Q., Wei S., Xue X., Zhou X., Zhang X. (2023). Research on seabed sediment classification based on the MSC-transformer and sub-bottom profiler. J. Mar. Sci. Eng. 11, 1074. doi: 10.3390/jmse11051074
Wendelboe G., Hefner T., Ivakin A. (2023). Observed correlations between the sediment grain size and the high-frequency backscattering strength. JASA Express Lett. 3, 026001. doi: 10.1121/10.0017107
Zhang Y. X., Guo C. S., Wang J. Q., Hou Z. Y., Chen W. J. (2017). Relationship between in situ sound volocity and granular characteristics of seafloor sediments in the Qingdao offshore region. J. Oceanol Limnol 35, 704–711. doi: 10.1007/s00343-017-5374-4
Zhang Y., Munnecke A. (2016). Ordovician stable carbon isotope stratigraphy in the Tarim Basin, NW China. Palaeogeography Palaeoclimatology Palaeoecol. 458, 154–175. doi: 10.1016/j.palaeo.2015.09.001
Zheng H. B., Yan P., Chen J., Wang Y-l. (2013). Seabed sediment classification in the northern South China Sea using inversion method. Appl. Ocean Res. 39, 131–136. doi: 10.1016/j.apor.2012.11.002
Keywords: sandy sediments, fine measurement, waveform characteristics, wide-band transducer, pulse compression
Citation: Zhen H, Cao X, Qu Z, Zou D, Xiong S, Song J and Guo H (2024) Sediment classification in the paleo-oceanic environment based on multi-acoustic reflectance characteristics in the Southern Tianshan Mountains. Front. Mar. Sci. 11:1370274. doi: 10.3389/fmars.2024.1370274
Received: 14 January 2024; Accepted: 30 July 2024;
Published: 21 August 2024.
Edited by:
Guangming Kan, Ministry of Natural Resources, ChinaReviewed by:
Vahid Tavakoli, University of Tehran, IranPurna Sulastya Putra, National Research and Innovation Agency (BRIN), Indonesia
Copyright © 2024 Zhen, Cao, Qu, Zou, Xiong, Song and Guo. This is an open-access article distributed under the terms of the Creative Commons Attribution License (CC BY). The use, distribution or reproduction in other forums is permitted, provided the original author(s) and the copyright owner(s) are credited and that the original publication in this journal is cited, in accordance with accepted academic practice. No use, distribution or reproduction is permitted which does not comply with these terms.
*Correspondence: Xinghui Cao, Y2FveGluZ2h1aTE5ODJAMTYzLmNvbQ==
 Huancheng Zhen
 Xinghui Cao1*
 Dapeng Zou
 Shuai Xiong