 Juris Aigars1*
 Natalija Suhareva1
 Daiga Cepite-Frisfelde2
 Ilga Kokorite2,3
 Arvo Iital4
 Māris Skudra1
 Maija Viska1
- 1Latvian Institute of Aquatic Ecology, Riga, Latvia
- 2University of Latvia, Riga, Latvia
- 3Latvian Environment, Geology and Meteorology Centre, Riga, Latvia
- 4Tallinn University of Technology, Riga, Latvia
Over the past decades, changes in the light conditions of coastal waters, induced by darkening due to water browning, has been gaining momentum within the scientific community. Although there is a general agreement that the darkening of coastal water is caused by shifts in climatic conditions, the actual links between trends in light attenuation caused by water browning and drivers are still being debated, as causality relationships are often assessed through the use of indirect evidence. In this study, we employed algorithmically processed remote-sensing and modelled data with substantially higher resolution than in-situ data as well as in-situ data. Two decades (1998–2007 and 2008–2018) were compared to test impact of parameters known to be altered by climate change, such as freshwater runoff, mobilisation of soil dissolved organic carbon, and alteration of freshwater-saline water balance in coastal waters, on darkening of coastal waters of the Gulf of Riga, Baltic Sea. The study results indicated that the most likely cause of the observed darkening of coastal waters in the study region was the mildening of winter conditions. At the same time, the study results highlighted the urgent need for detailed, time-sensitive data, since none of the conclusions drawn from the analyses of available data were unequivocal.
1 Introduction
The light environment is a key habitat characteristic of the freshwater and marine surface water ecosystems alike. Alterations in the light environment impact photoautotroph communities, like macrophytes. The macrophytes provide a wide range of ecosystem services in coastal habitats (Campagne et al., 2015), such as spawning substrates, shelter for fish juveniles and other species, serving as a food source for herbivore organisms, as well as contributing to photosynthesis. Furthermore, the light environment directly affects other organisms and their functions like fish production, abundance, and migration (Aksnes, 2007; Karlsson et al., 2009) or competitive relationship between tactile and visual predators (Haraldsson et al., 2012).
Historically, the changes of light environment have been mostly referred to as a consequence of eutrophication, caused by anthropogenic activities that generate nutrient enrichment of water basins (Dupont and Aksnes, 2013) with subsequent increase of phytoplankton biomass (Fleming-Lehtinen and Laamanen, 2012). More recently, the climate-change effect on marine phytoplankton population and consequently shift in water colour to greener hue (which would increase backscattering at all wavelengths and absorption at shorter wavelengths) has been discussed as a separate topic as well (Cael et al., 2023). However, in coastal areas, intensifying effects of climate change have been manifested as darkening via water colour shift to a browner hue (Monteith et al., 2007), most likely due to changes in the interaction between land and coastal ecosystems (Canuel et al., 2012).
The water browning or brownification is defined as a shift in water colour (Kritzberg et al., 2020) and has been observed in numerous boreal freshwaters (De Wit et al., 2016). The browning has been mainly explained by increase of dissolved organic carbon originating from terrestrial ecosystems (Monteith et al., 2007) and during past decades has been a topic for studies on freshwater ecosystems (Blanchet et al., 2022). At the same time, the water browning studies in marine coastal waters are rather limited, spanning from hypothesised statement that the main component that affects the light attenuation in the Baltic Sea is coloured dissolved organic matter (Fleming-Lehtinen and Laamanen, 2012) to explicit accounting of the freshwater components that causes darkening of coastal waters (Opdal et al., 2023). However, the extent to which the observed darkening of freshwater due to increasing organic carbon (De Wit et al., 2016) contributes to the long-term decline in coastal water clarity (Dupont and Aksnes, 2013) still is not well quantified. Furthermore, the actual processes responsible for mobilisation of soil organic carbon is still debated. For example, it has been argued that climate change would lead to increased precipitation (Hanssen-Bauer et al., 2005). That, in turn, shall enhance the mobilisation of organic carbon from soils to freshwaters (De Wit et al., 2016). Thus, under these circumstances, a subsequent increase of organic carbon loading to coastal waters can be expected, as has been already demonstrated for particulate organic carbon (Frigstad et al., 2023). However, the long-term increase in precipitation and, as a consequence, increased runoff from river drainage basin, is not documented for the Gulf of Riga, Baltic Sea (Apsīte et al., 2013). At the same time, the depth limit at which macrophytes, e.g., Furcellaria lumbricalis, could be encountered (unpublished Latvian national monitoring data) has been decreasing over the last two decades, suggesting an intensification of water darkening in coastal areas so posing a need for alternative explanation.
Use of Secchi disk depth and Forel-Ule (FU) scale (Forel, 1890; Ule, 1892) with the main focus on identification of chlorophyll trends from green hues (Boyce et al., 2012; Wernand et al., 2013b) has a long practice in optical oceanography. Similarly, to other regions, in the coastal waters of the Gulf of Riga, Secchi depth disk and FU water colour have been historically measured in-situ as part of the National monitoring program. However, due to technical restrictions, e.g., limited number of observations at pre-set locations and times, the data have poor temporal and spatial resolution. Due to the high variability of these data, until recently it was not feasible to conclusively ascertain whether the observed changes in coastal benthic community indicate a significant change in light attenuation. The relatively recent findings suggest that “optically complex” waters, where optical components do not correlate with chlorophyll concentration (Lee and Hu, 2006), can be investigated using remote-sensing reflectance for classification of optical water types (Jerlov, 1976; Moore et al., 2001), and hue angle to calculate FU by established algorithms (Wernand et al., 2013a; Pitarch et al., 2019a).
So, in this study, we utilised algorithmically processed remote-sensing data (Pitarch et al., 2019b) with much higher resolution than in-situ data. We tested the hypothesis that shorter periods of soil as well as water freezing periods in both freshwater and marine coastal waters are the primary cause for darkening of coastal waters in the Gulf of Riga. The phenomena is assumed to be a result of milder winters due to climate change (Seinä and Palosuo, 1993; Niskanen et al., 2009; Meier et al., 2022a), as well as clear shift in seasonal river discharge regime (Apsīte et al., 2013). To test the hypothesis, we compared two decades - 1998–2007 and 2008–2018. The analysis was based on remote-sensing data of water optical properties, observed ice days, observations of runoff and nutrient loads from major rivers and the oceanographic model of the Gulf of Riga.
2 Materials and methods
2.1 Study site description
The Gulf of Riga is a relatively shallow, semi-enclosed sub-basin of the Baltic Sea. The average depth of the Gulf of Riga is 26.2 m and water volume is 424 km3 (Yurkovskis et al., 1999; Purina et al., 2018). The river runoff, average annual inflow 32 km3 (Yurkovskis et al., 1999), from a drainage area that more than 8 times exceeds the Gulf of Riga surface area, enters the Gulf of Riga predominantly in the South (Figure 1). The water exchange with the Eastern Gotland Basin of the Baltic Sea occurs through the Irbe Strait in North-East and to Väinameri Archipelago Sea by the Suur Strait in the North of the Gulf ensuring estuarine-like behaviour with an estimated water residence time of 2 to 4 years (Suursaar et al., 2012).
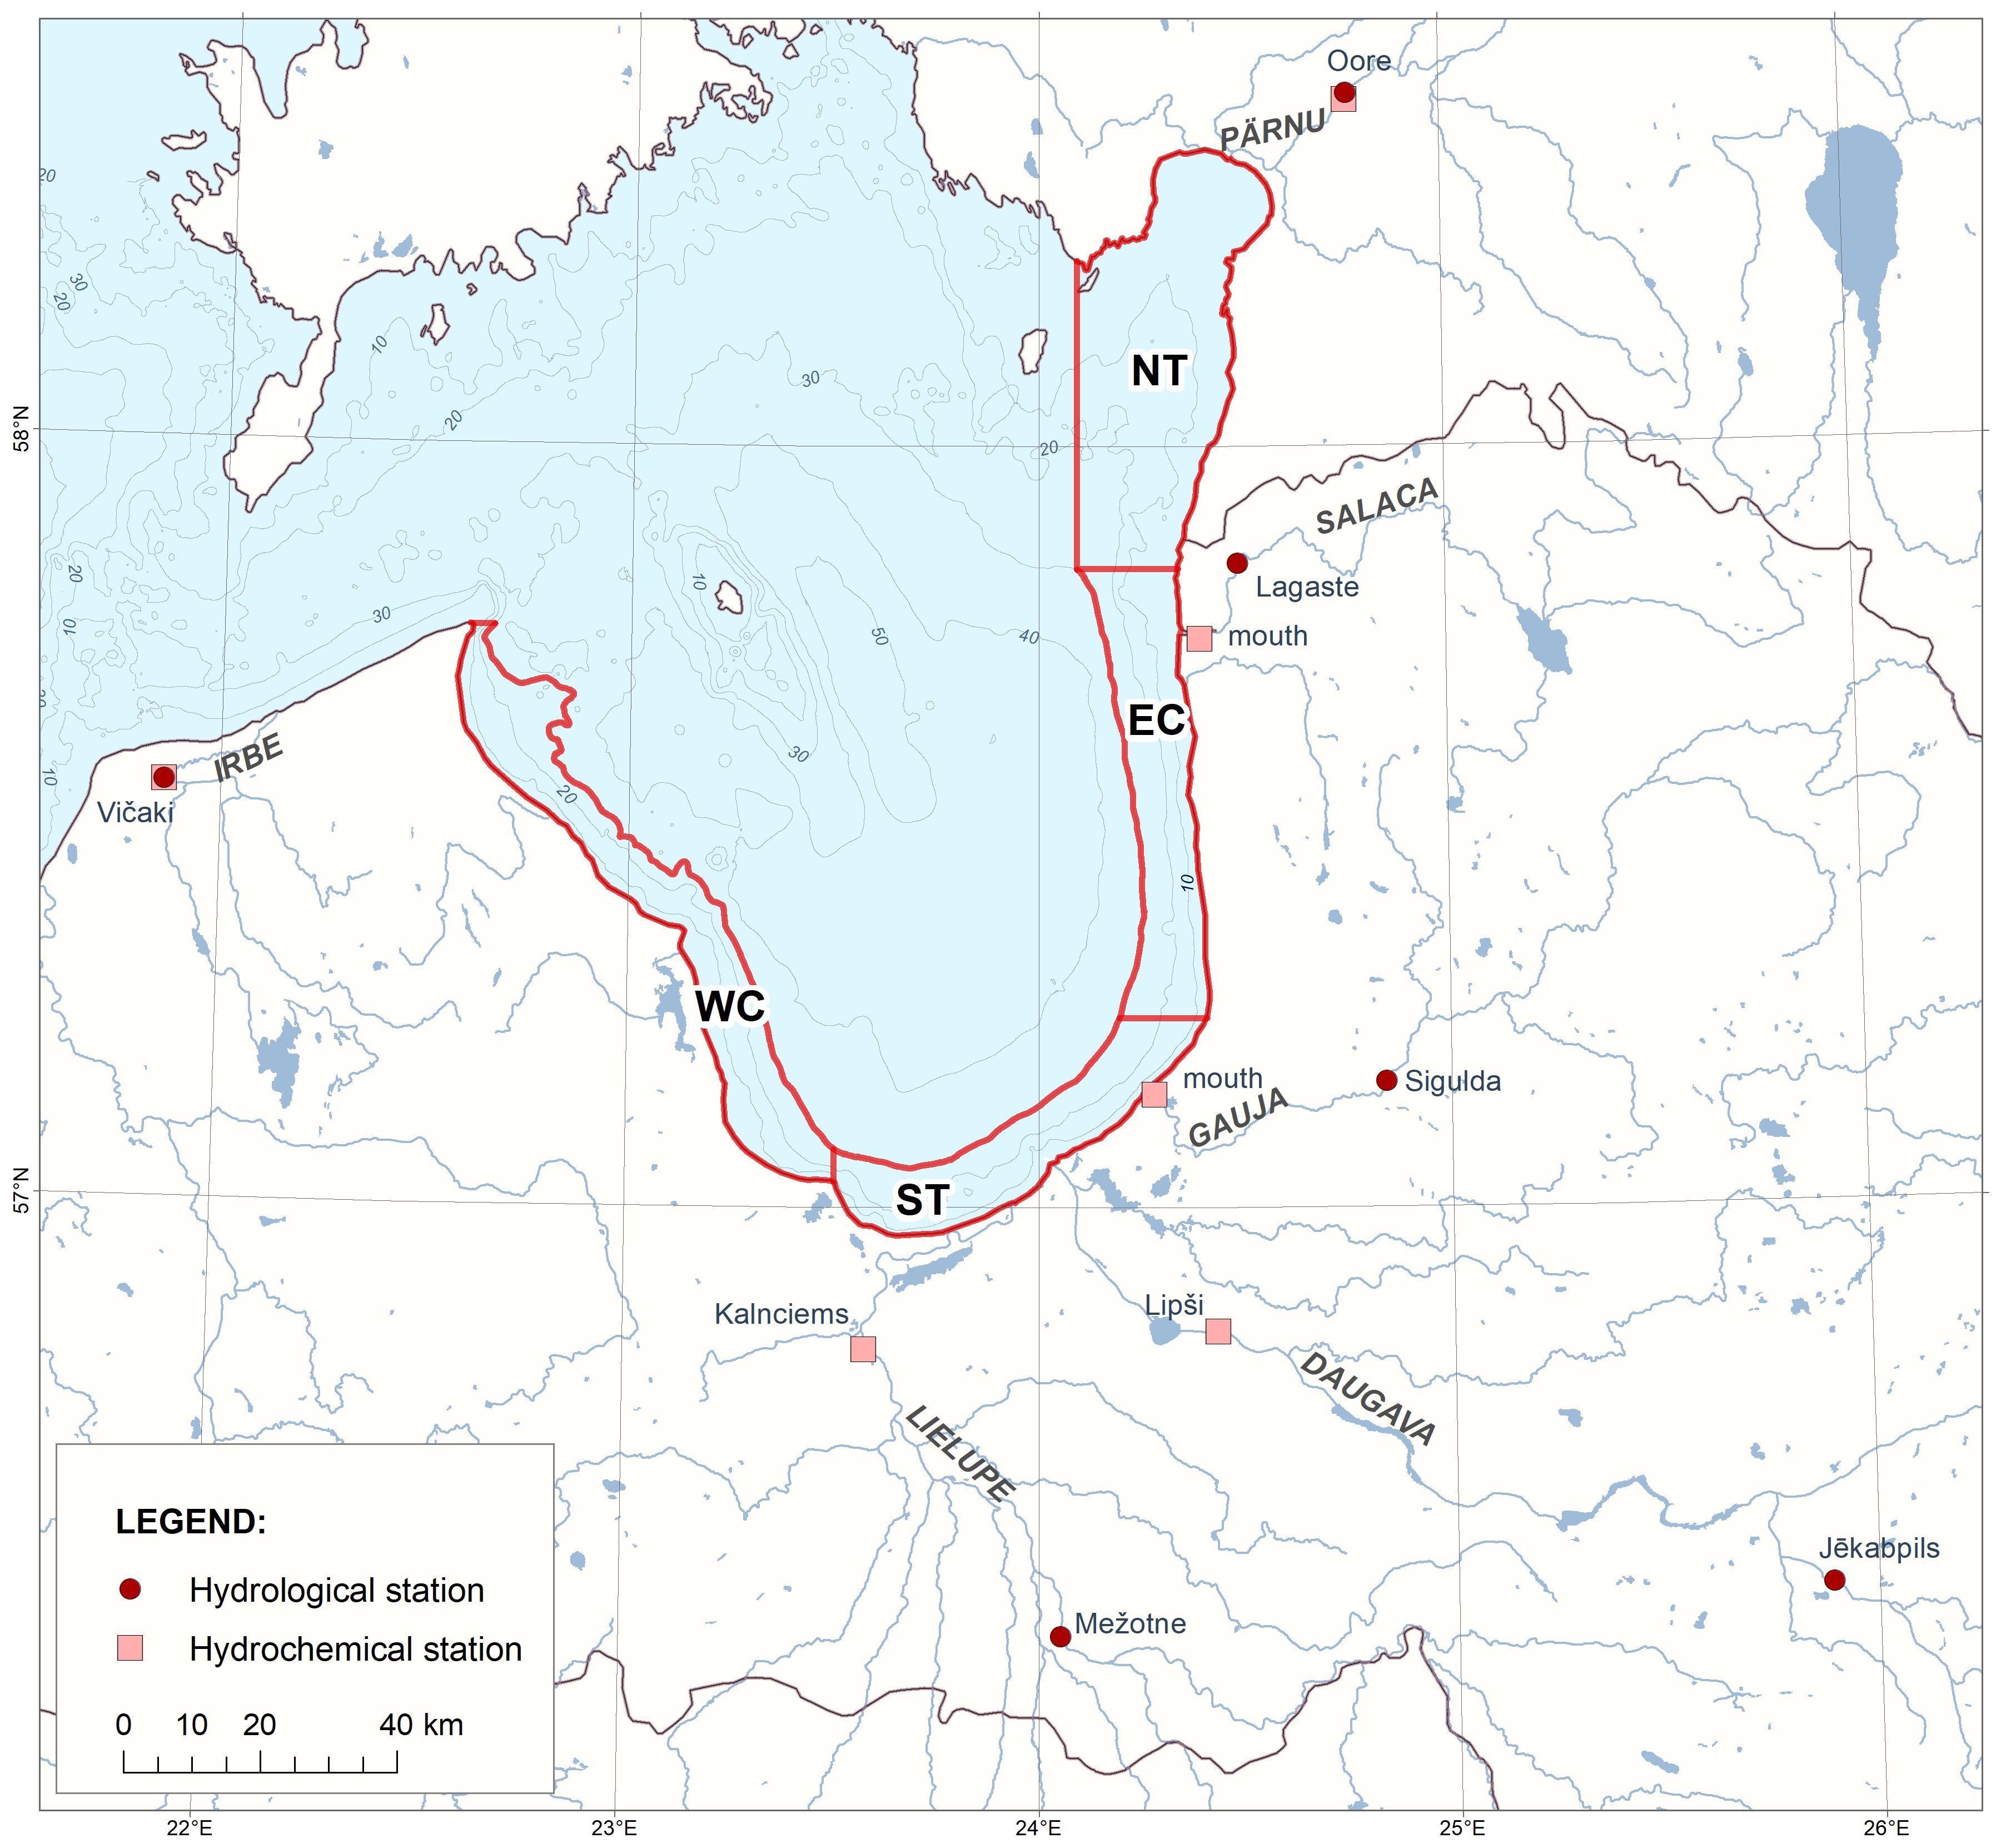
Figure 1 Study site with delineation of coastal zones: NT (north transitional waters), EC (eastern coast), ST (southern transitional waters), and WC (western coast), as well as hydrological and hydro-chemical monitoring stations on rivers Lielupe, Daugava, Gauja, Salaca and Pärnu.
The drainage area of rivers is characterised by flat terrain and consists of limnoglacial or fluvioglacial deposits overlying Quaternary deposits. The substantial proportion of soils encountered in river drainage areas are peat soils (Samariks et al., 2020). Furthermore, notable proportion (52%) of the land is covered by forests (Samariks et al., 2020). The climatic conditions are characterised as humid (mean annual precipitation of 600–850 mm) with main (45–55%) river discharge in spring (Kļaviņš et al., 2002).
For the purposes of this study we used 4 coastal areas (Figure 1) that represent sub-basins of the Gulf of Riga defined by oceanographic parameters (Ojaveer and Akadeemia, 1995). The NT (north transitional waters) represents coastal area influenced by outflow of the Pärnu river, the EC (eastern coast) represents open coastline of the Gulf influenced by river Salaca and several smaller streams, the ST (southern transitional waters) represent coastal waters impacted by three major rivers of the region - Daugava, Lielupe, Gauja, and WC (western coast) represent open coastal waters with no noticeable impact of rivers or small streams.
2.2 Remote sensing data of water transparency and colour
The in situ Secchi depth and water colour data utilised in this study were previously documented and made available by Pitarch et al. (2019b) through The World Data Center Pangea. The remote sensing data for the past two decades (1997 to 2018) were derived from the ESA-OC-CCI v4.0 multi-sensor merged remote-sensing reflectance. Due to the region’s substantial cloudiness and ice coverage during the winter season, the availability of Secchi and water colour data for February and November was constrained and were not available for the investigated area for December and January at all.
The water colour is quantified on the Forel-Ule (FU) scale, employed extensively by oceanographers and limnologists worldwide. This scale comprises a set of 21 standardised colours spanning the spectrum from indigo-blue (1) to cola-brown (21). For enhanced comprehension Table 1 offers a descriptive insight into selected standardised FUS colours within the ranges applicable to this study.
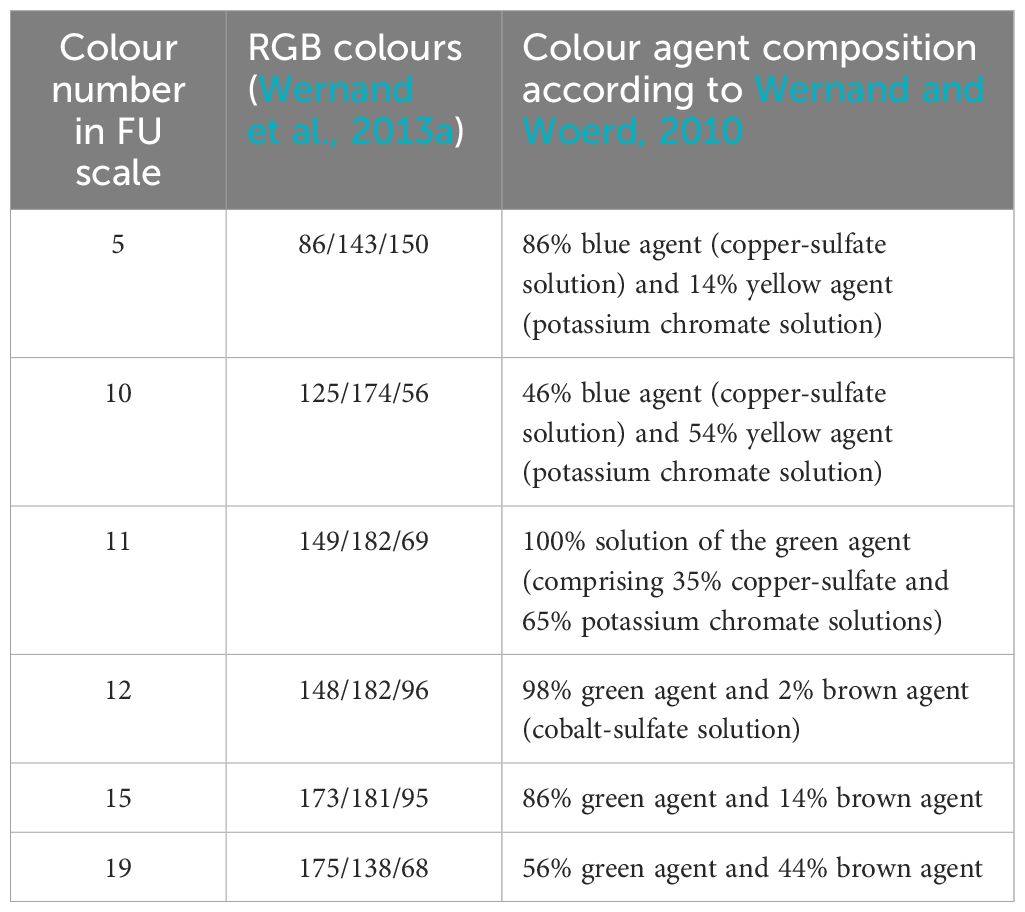
Table 1 A descriptive insight into selected standardised FUS colours within the ranges applicable to this study.
The remote sensing data were compared with in-situ measurements of Secchi depth and water colour measurements at a half Secchi disk measurement (see description at Ceccaroni et al., 2020) available from the National monitoring database (https://latmare.lhei.lv/). For the comparison, the nearest coordinates to the national monitoring stations along the coastline were used. The data were filtered to include mirrored measurements in both data sets (remote sensing and in-situ) for each available year, month and station. However, it must be considered that remote sensing data provide monthly averages, while in-situ data consists of single moment measurements. Furthermore, the in-situ data were limiting the total number of compared pairs (in-situ vs remote) due to lack of measurements, which traditionally focused on specific monitoring months (such as May and August). The comparison between remote sensing and in-situ data was conducted by one-way analysis of variance (ANOVA), where assumptions of normality and variance equality were satisfied. For cases where these assumptions failed, and for ordinal FU colour, Kruskal–Wallis one-way analysis of variance was employed.
The alterations in Secchi depth and water colour across four distinct regions within the Gulf of Riga: EC, NT, ST, and WC were statistically assessed for significance. The assessment included a comparison between two decades: 1998–2007 and 2008–2018. The Wilcoxon signed-rank test was employed to determine the presence of statistically significant shifts. F-test was used in order to discern whether the medians of the different groups could be meaningfully compared, or if the comparison was possible within the context of distributions only. Similarly, differences between coastal zones and months were compared. Prior to conducting the analysis, the data were examined for the presence of outliers, adherence to a normal distribution and homogeneity. Statistical differences were deemed significant at an α=0.05. Data transformation, statistical analysis and visualisation were executed in R software version 4.2.0 (R Core Team, 2022).
2.3 Gulf of Riga model data (sea surface salinity, currents and ice cover)
Sea surface salinity and current data used for the purpose of this study originate from the oceanographic reanalysis of 1993–2021 obtained by UL HIROMB-BOOS model results (Frishfelds et al., 2023). Reanalysis considered the rivers and channels impacting the Gulf: five major rivers - Daugava, Lielupe, Gauja, Salaca and Pärnu as well as smaller rivers and channels - Irbe, Kaņieris, Roja, Mērsrags, Svētupe in Latvia as well as Audru, Häädemeeste, Nasva, Oressaare, Paadrema, Riksu in Estonia. The changes in the sea surface (0–2 m) salinity and surface current u and v components between 1998–2007 and 2008–2018 decade periods for each coastal zone have been analysed by comparing means for the periods and for each month. Mann – Whitney U test was applied to monthly variations and decade averages, comparing 1998–2007 and 2008–2018 separately within each grid cell of the surface layer (0–2 m) with a horizontal resolution of 0.5 nm. The regions with significant changes according to (p<0.05) had been outlined afterwards.
Changes in the sea ice area cover fraction between the periods have been expressed as a percentage relative to the mean of 1998–2007 period. Ice days for each coastal region were determined by averaging the ice area cover fraction data layer in every grid cell for ice seasons from 1998–1999 to 2017–2018.
2.4 River runoff and load data
River runoff of six rivers Lielupe, Daugava, Gauja, Salaca, Irbe and Pärnu was estimated at the hydrological and relevant hydro-chemical stations (Figure 1). Monthly average discharge data and water quality variables were provided by the national monitoring programs carried out by the Latvian Environment, Geology and Meteorology Centre (LEGMC) and Estonian Environment Agency. Thus the monthly concentrations were estimated using internationally standardised methods described in LVS EN ISO 11905–1:1998 and LVS EN 12260:2004 for total nitrogen (TN), LVS EN ISO 6878:2005 part 7 for total phosphorus (TP), LVS EN ISO 11732:2005 and LVS EN ISO 13395:2004 for inorganic nitrogen (DIN), LVS EN ISO 6878:2005 part 4 for phosphorus (DIP), LVS EN 1484:2000 for total organic carbon (TOC) and LVS EN 872:2005 for suspended solids (SS). Yearly loads for the period 1998–2018 were calculated using monthly river runoff and monthly concentration:
where L - annual load (tons), Wi - monthly river runoff (m3); Ci - monthly concentration (mg/L).
Areal extrapolation of river runoff or loads was used to estimate river runoff at the hydro-chemical stations when location of the hydrological station differed from that of the hydro-chemical station.
Data on duration of ice cover for Lielupe, Daugava, Gauja, Salaca and Pärnu hydrological stations (no data for Irbe) were obtained from databases held by the Latvian Environment, Geology and Meteorology Centre and Estonian Environment Agency.
A two-sample t-test assuming equal variances was used to compare average values of the two study periods (1998–2007 and 2008–2018) at a significance level α = 0.05.
3 Results
3.1 Remote sensing data vs. in situ data
Traditional national monitoring months, notably May and August, comprised the longest data rows for Secchi depth, with 128 data pairs (monthly and yearly fit between the remote sensing and in situ data) in May and 124 data pairs in August. For other months, the number of pairs was lower, ranging from 40 pairs in July, 38 in June, 35 in September, and 28 in April; other months were not considered. FU colour data were substantially more limited than Secchi depth data, with a maximum of 50 data pairs in August and only 13 data pairs in July, and even fewer in other months (February, March, September-November), which were not further considered.
For April, May, and July there were no significant differences (p=0.792, p=0.170 and p=0.642, respectively) in Secchi depth between remote sensing and in-situ data sources, with differences between means ranging from 0.07 to 0.13 m. In August and September, the Secchi depth from remote sensing data was, on average, 0.37 m (p<0.001) and 0.49 m (p=0.004), respectively, lower than in the in-situ data. Conversely, in June, Secchi depth from remote sensing data was significantly higher (on average by 0.69 m, p=0.024) than in-situ data.
At the same time, the FU colour data derived from remote sensing data were significantly lower, from 5 to 7 units, than those from in-situ measurements. Therefore, FU colour estimates derived from in-situ observations were not considered in data analysis.
3.2 Water transparency
The ESA-OC-CCI v4.0 multi-sensor-derived remote sensing data exhibited noticeable changes in water transparency within the coastal waters of the Gulf of Riga (Figure 2). Given the pronounced seasonality of the region, the primary focus was directed toward the summer period due to heightened algal activity, extended illumination duration, and elevated temperatures. The first finding indicated a substantial reduction in water transparency (Secchi depth) within the coastal waters during the summer months. Specifically, the spatial median of the Secchi depth across the whole study region decreased from 2.81 m (25% quartile: 2.35 m, 75% quartile: 3.14 m) during the 1998–2007 decade to 2.30 m (25% quartile: 1.99 m, 75% quartile: 2.65 m) during the 2008–2018 decade.
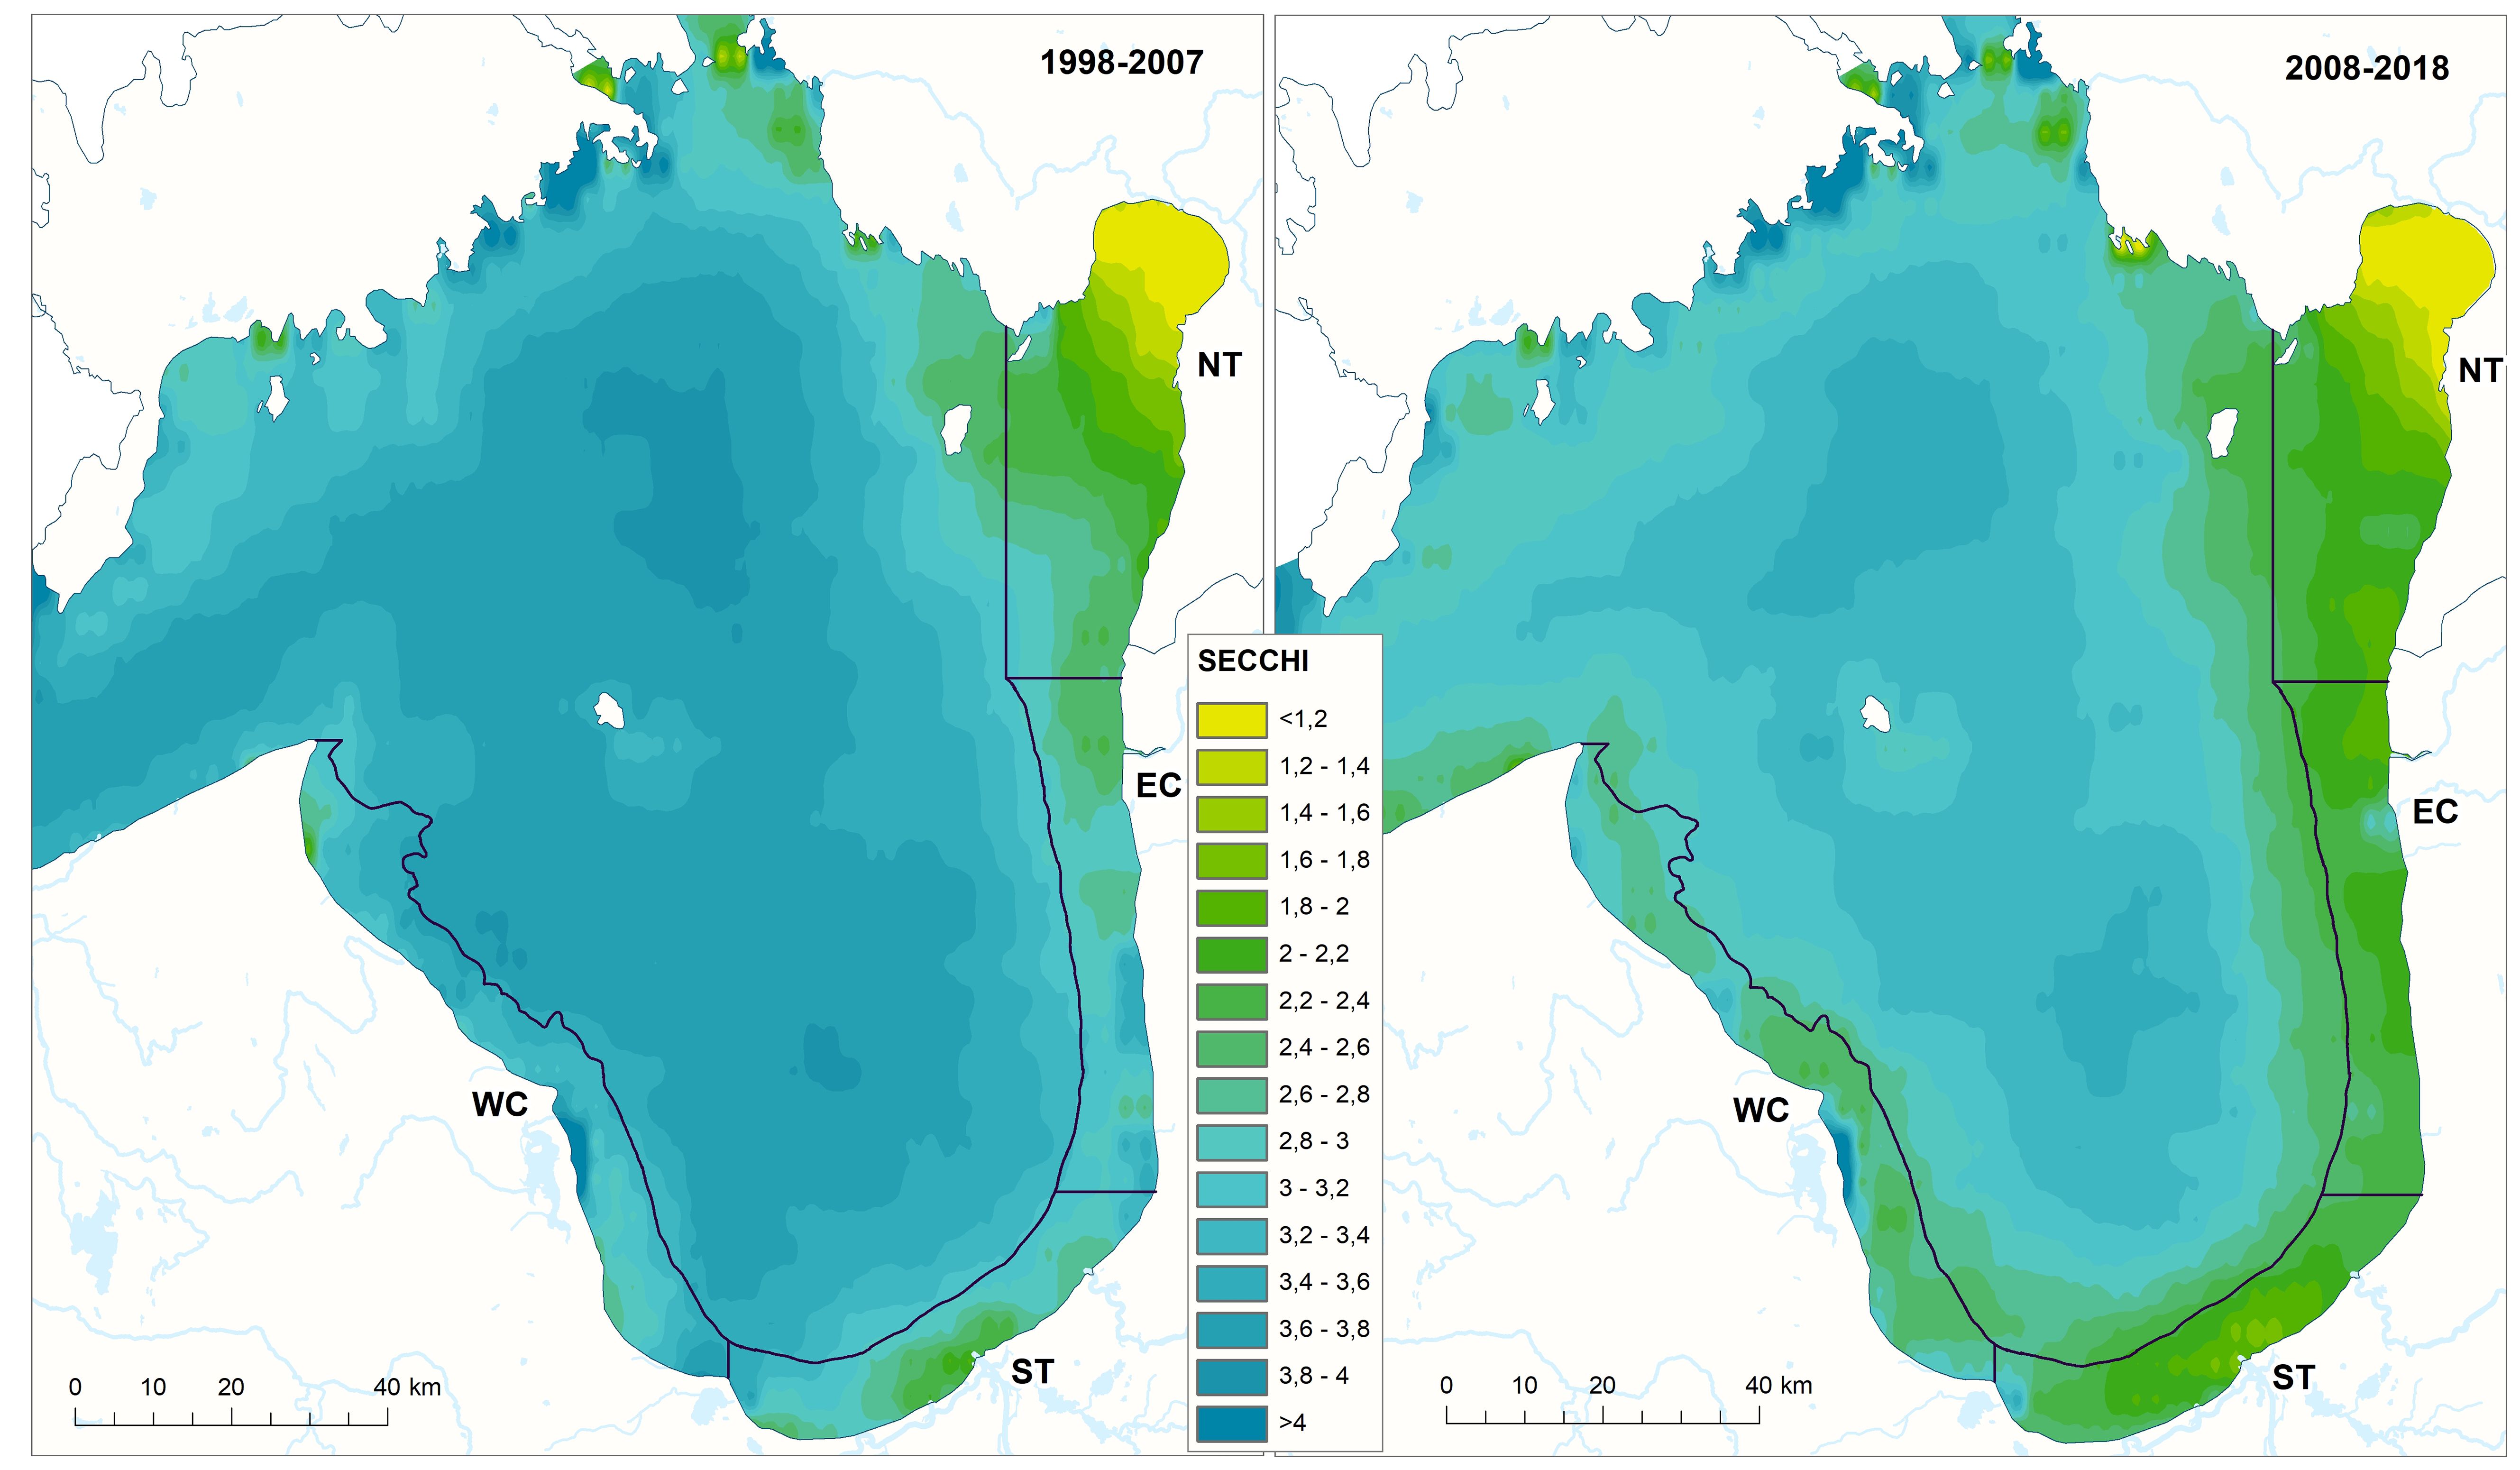
Figure 2 Average water transparency (Secchi depth in m derived from remote sensing observations) in the periods 1998–2007 and 2008–2018 (summer months: June, July, August).
The pronounced seasonality of the region is indicative of high dynamics of the core processes within the Gulf, including variations in precipitation patterns and runoff (Apsīte et al., 2013), water temperatures, nutrient concentrations and biological activity (Purina et al., 2018). Consequently, a comprehensive investigation of water transparency shifts on a month-by-month basis was conducted. Utilising remote sensing data, the Secchi depth values were assessed across the coastal zones of the Gulf of Riga used in this study, spanning from February to November (Figure 3; Supplementary Table S1). The analysis revealed notable downward shifts in water transparency for most of the months across all four regions, except for specific cases, such as February and November in EC, ST and WC (as well as some other anomalies). However, these exceptions require careful consideration due to the limited data availability caused by cloud cover and ice formation during those months. Among the 48 groups examined (4 zones for 12 months), 29 significant downward shifts were identified (p<0.001, for all cases, except for NT in February, where p=0.01).
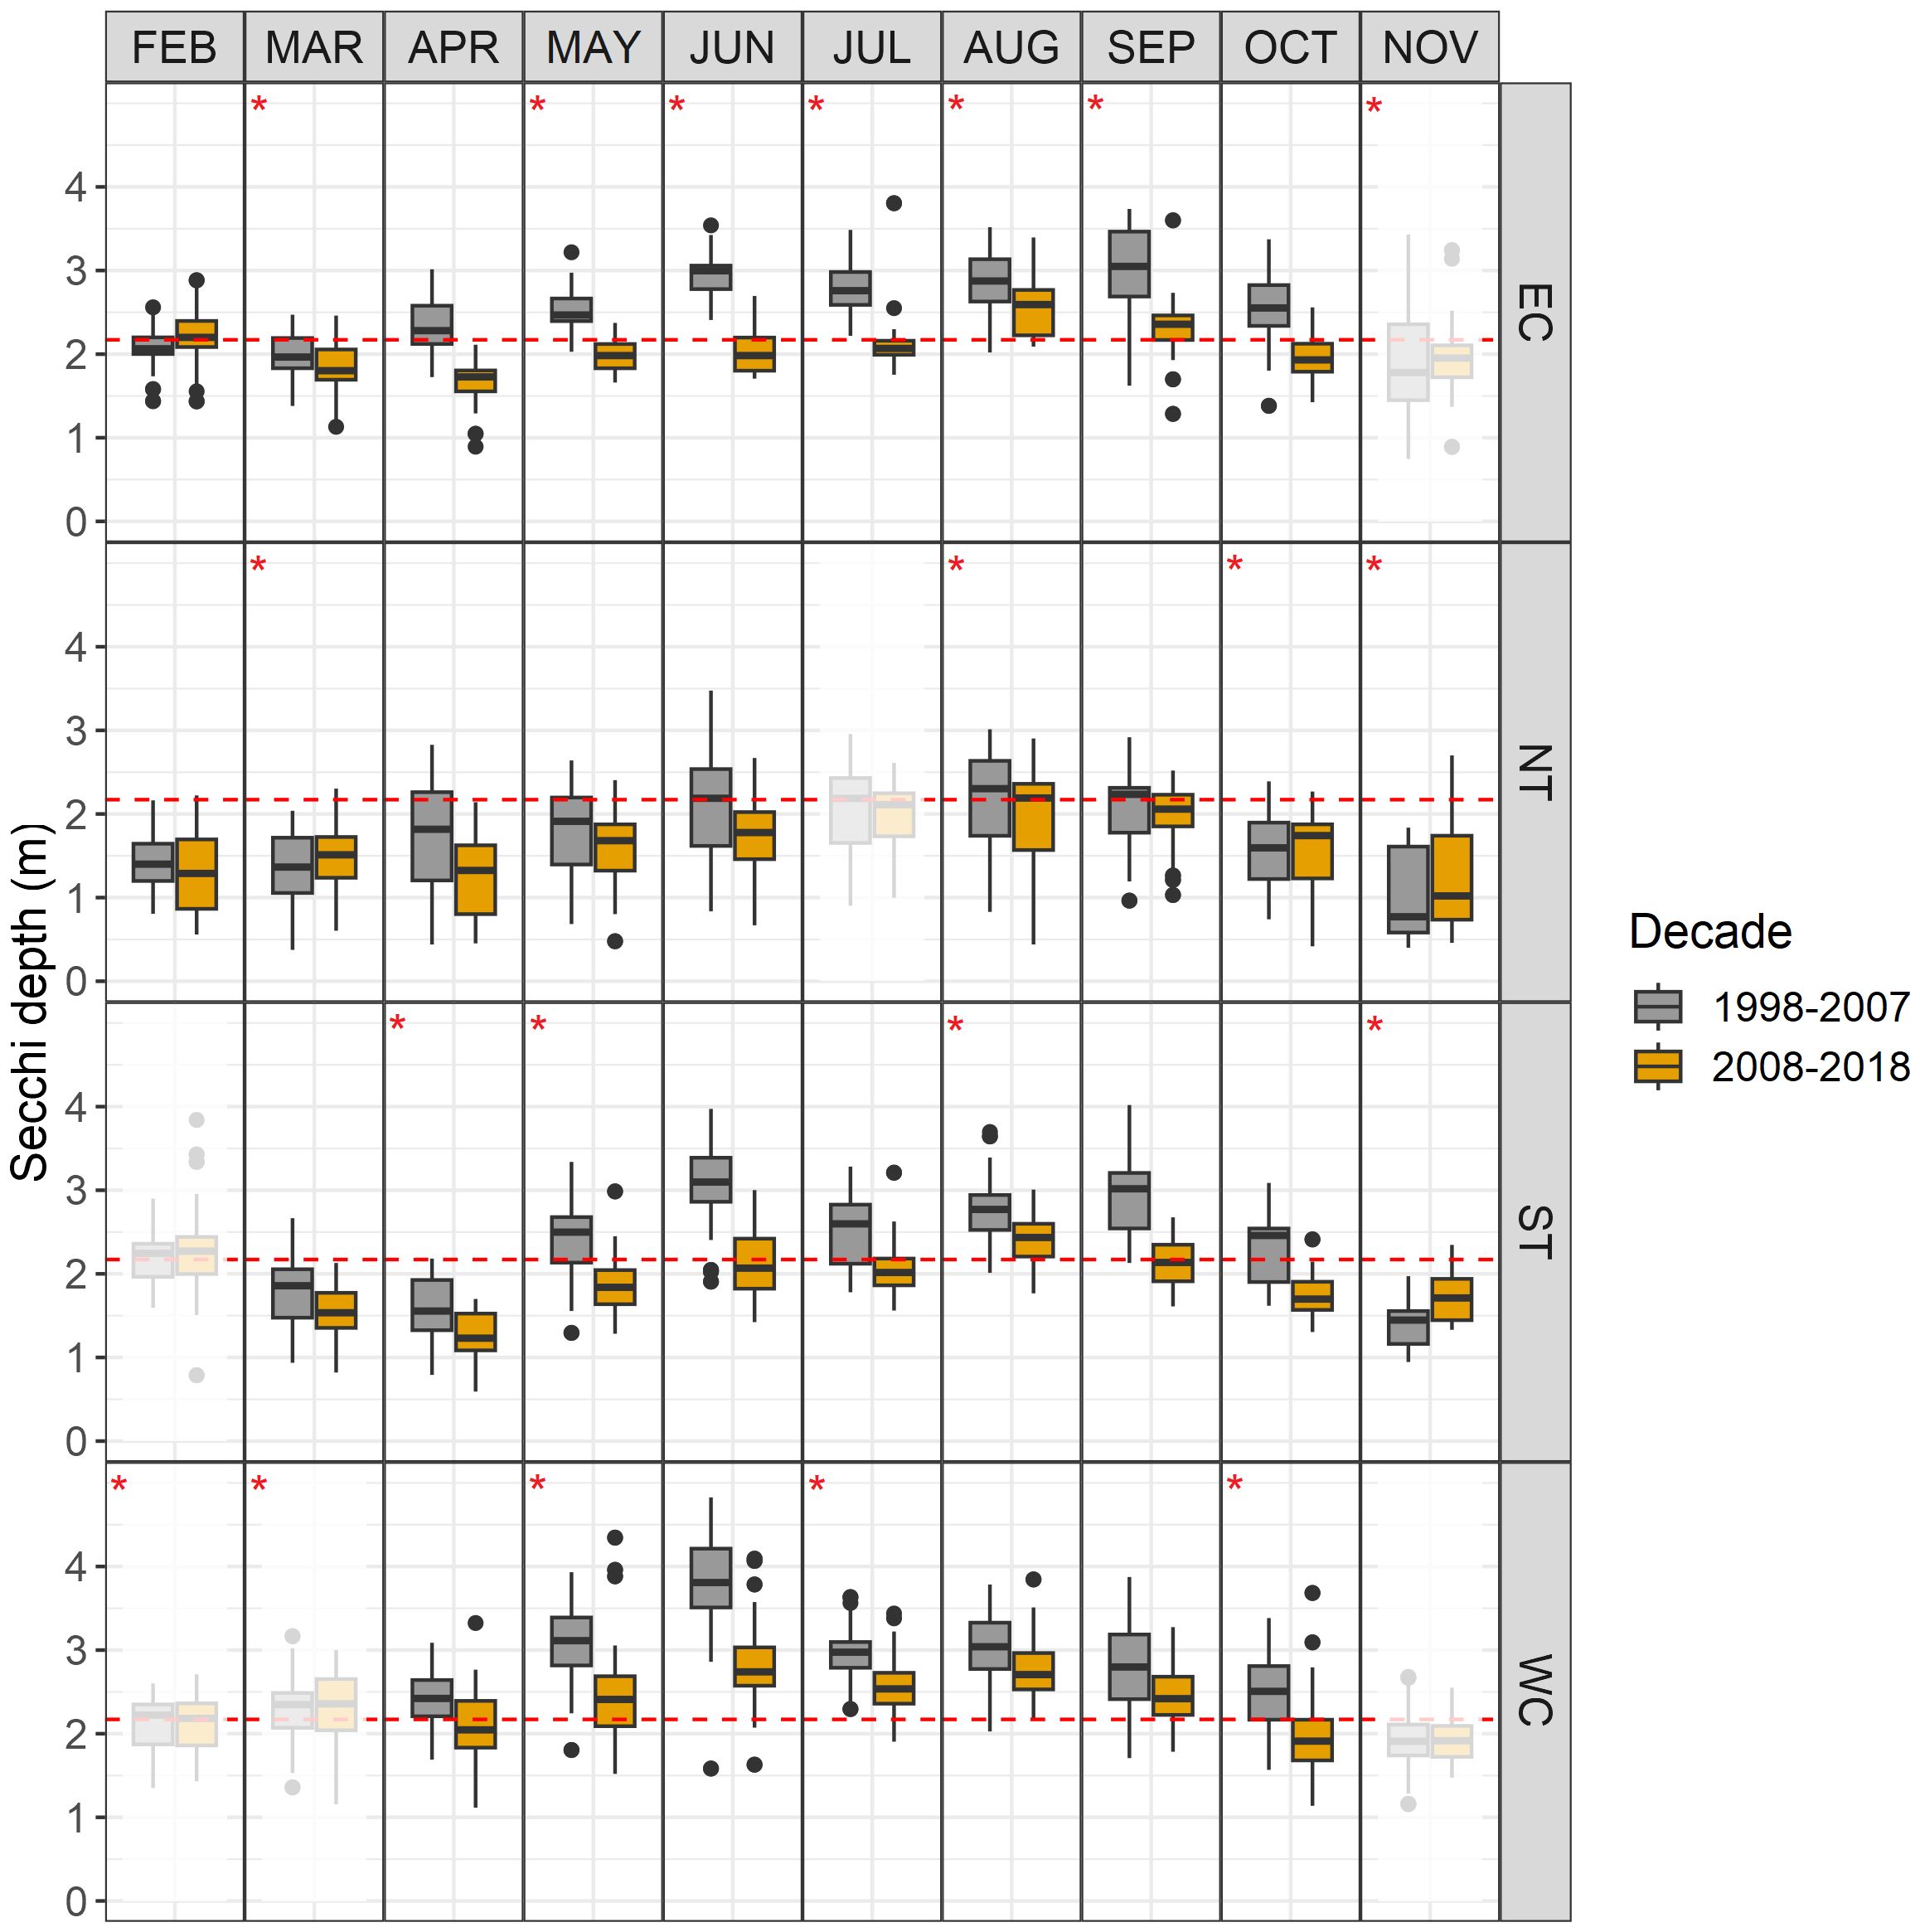
Figure 3 Monthly averages of Secchi depth (m) across four distinct regions within the Gulf of Riga: EC (Eastern Coast), NT (Northern Transitional), ST (Southern Transitional), and WC (Western Coast) in decades 1997 - 2007 and 2008 - 2018. Shaded panels represent statistically insignificant changes (p > 0.05), red stars highlight pairs with equal variances (comparable medians), and a red dashed line indicates the median Secchi depth (2.17 m) observed in the coastal waters of the Gulf of Riga throughout the entire period.
Furthermore, the Secchi depth values as well as trends varied across coastal zones and seasons (Table 2). The highest Secchi depth values were encountered in WC, succeeded by EC and ST, while the lowest values were consistently found in NT, where Secchi depth was significantly (p<0.001) lower than in the other zones. Notably, the most prominent shifts were identified in EC and ST. Substantially lower shifts compared to the first two groups were observed in WC and especially NT, which also displayed the highest Secchi depth variability. Moreover, the deepest declines of water transparency were consistently observed in June across all zones, whereas the smallest shifts (even sometimes positive) were in November, February and March.
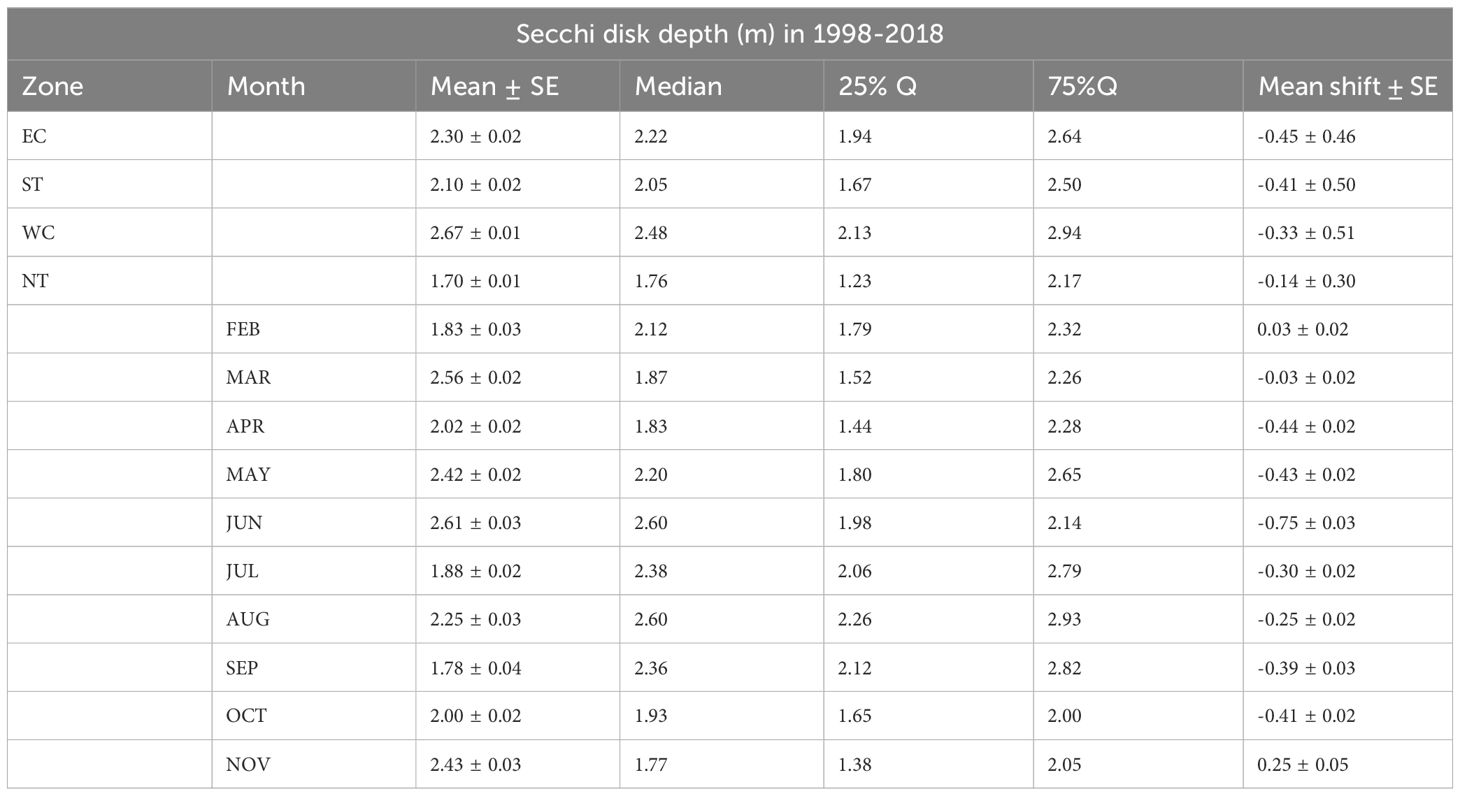
Table 2 Secchi disk depth (m) in four coastal zones of the Gulf of Riga and seasonal variations in the entire coastal zone averaged over the periods 1998-2018, as well as the average shift in Secchi disk depth between the decades 1998-2007 and 2008-2018, based on remote sensing data.
3.3 Water colour
The water colour, characterised by the Forel-Ule scale, serves as an additional metric of water transparency, contributing further insights due to its close relation to water composition. Notable alterations in water colour during the summer period (Figure 4) in general revealed a significant shift (p<0.001) from deep green to green-yellowish hues in the coastal waters across the Gulf. Specifically, the transition occurred from colour ‘10’ (25% quartile) and colour ‘12’ (75% quartile) in decade 1998–2007 to colour ‘11’ (25% quartile) and colour ‘13’ (75% quartile) in decade 2008–2018.
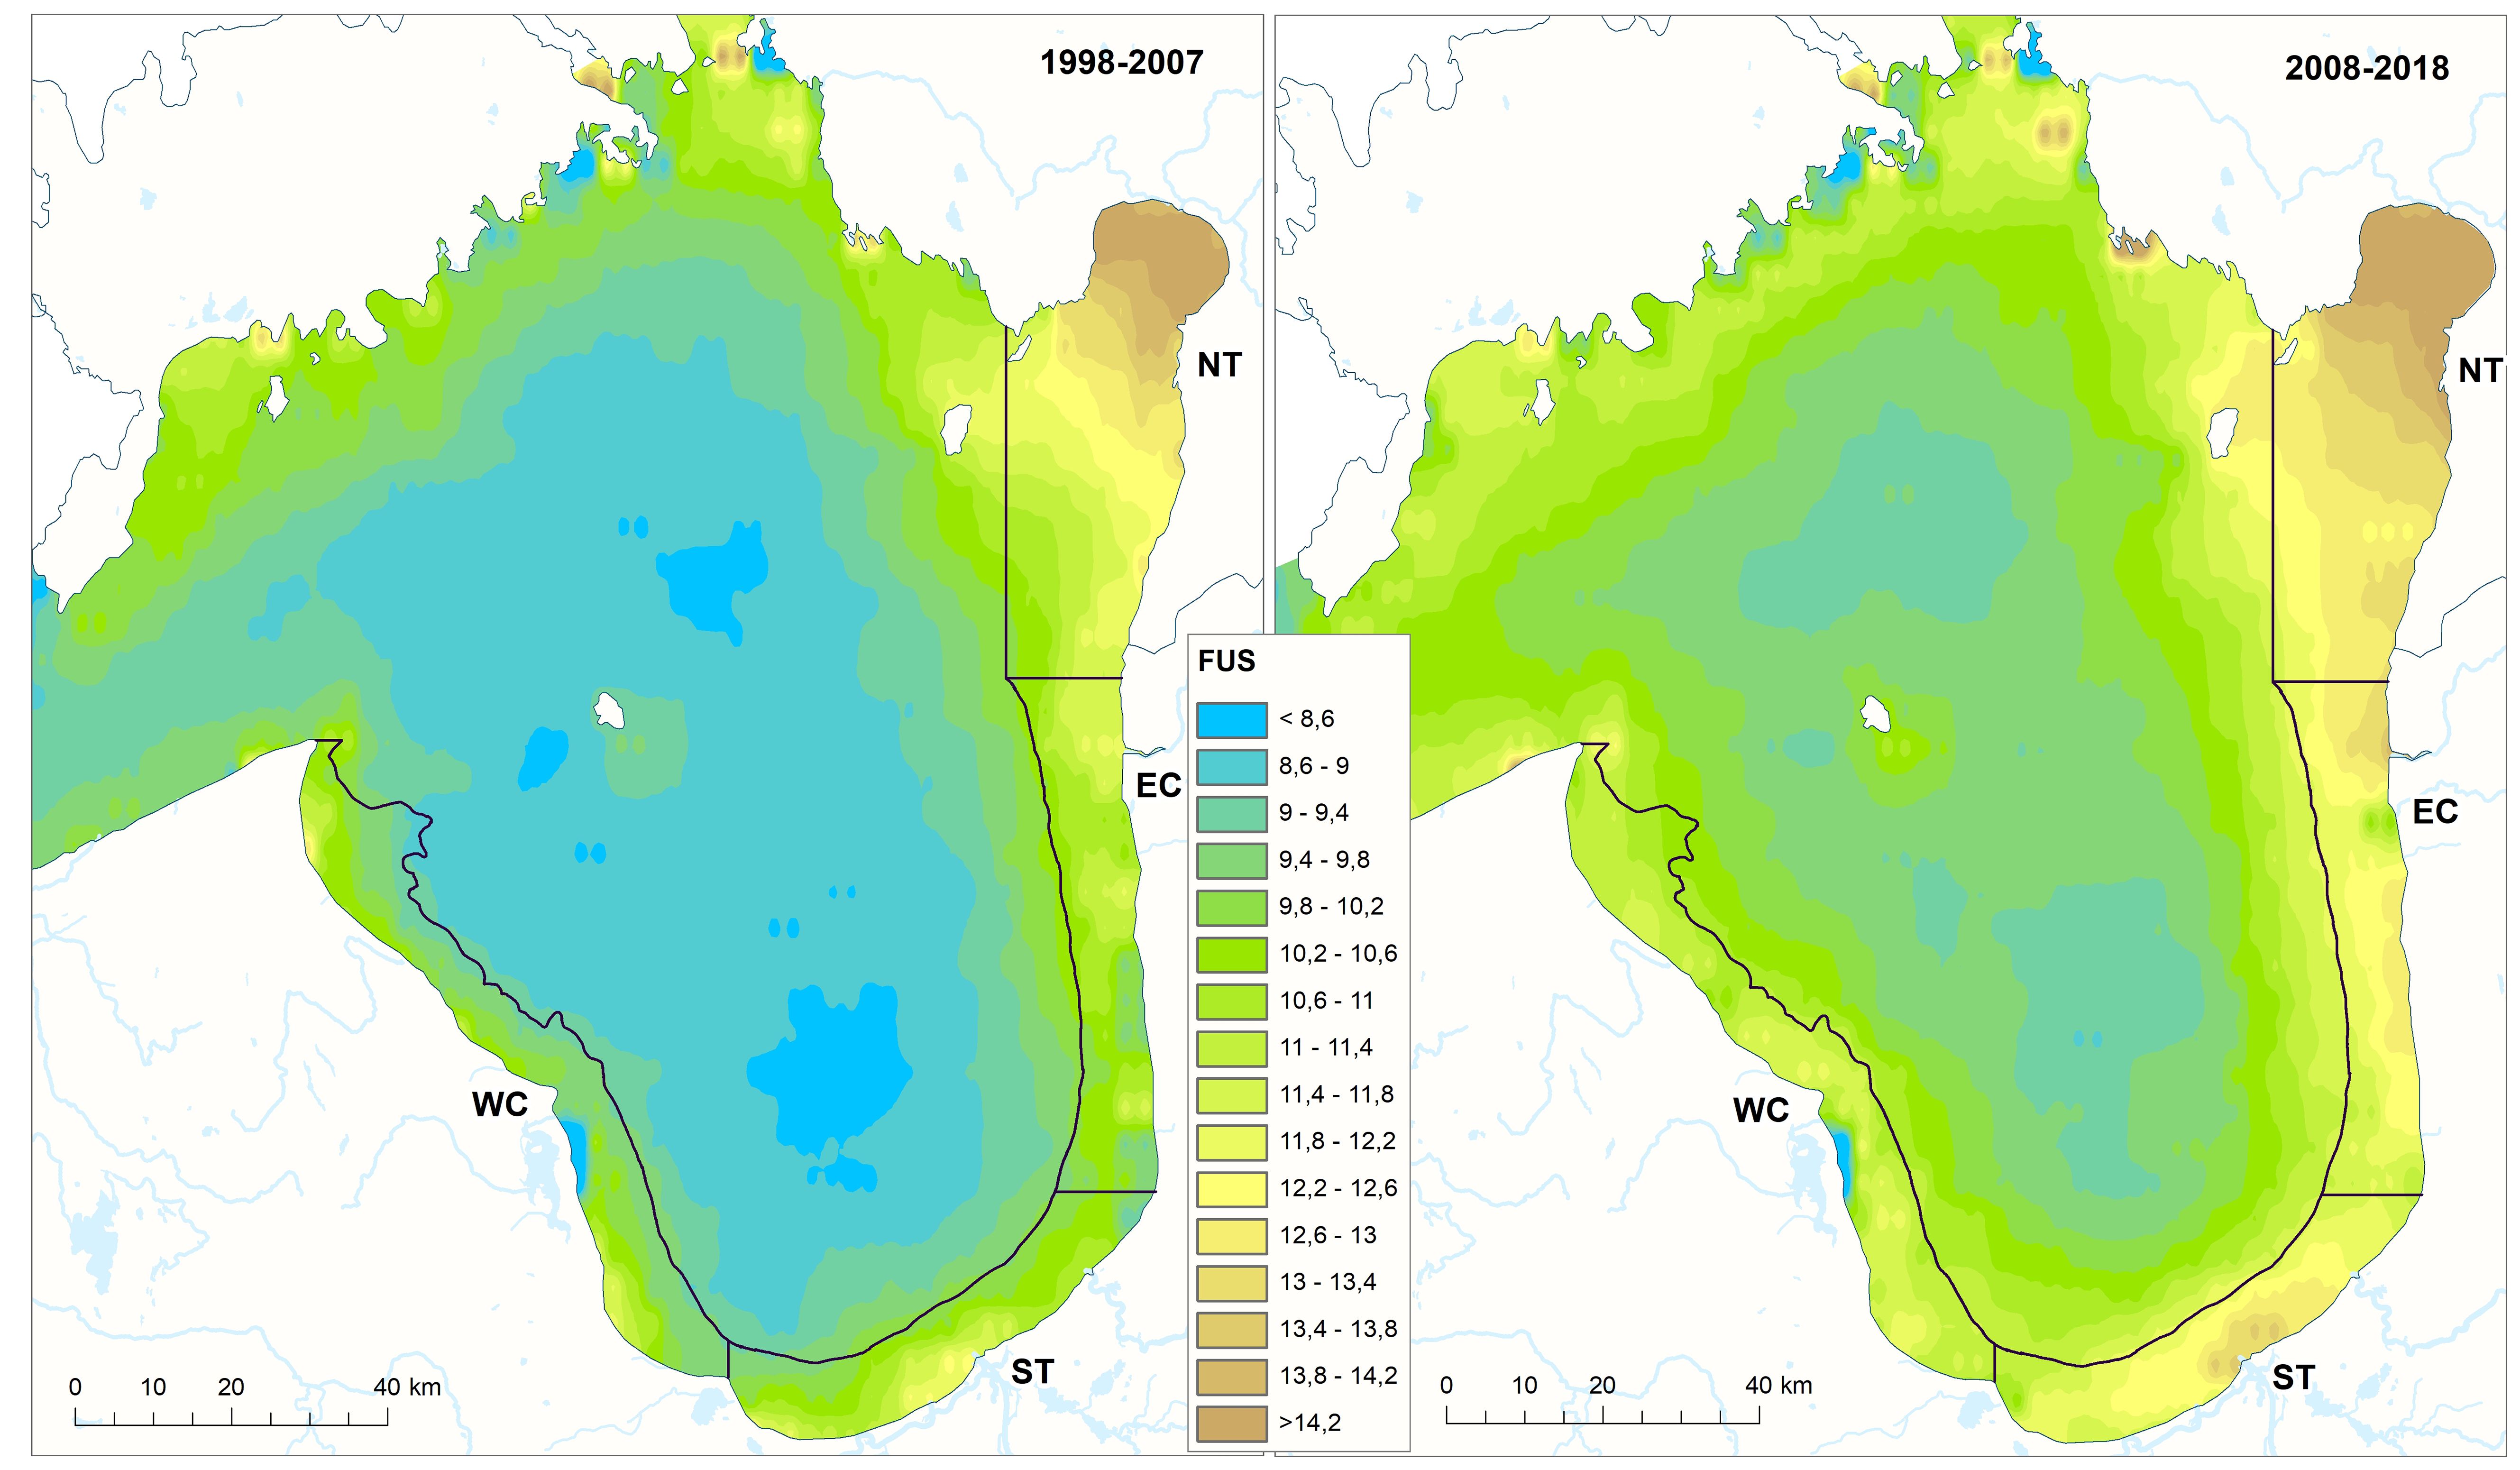
Figure 4 Average water colour (in Forel-Ule scale) in the Gulf of Riga for periods of 1998–2007 and 2008–2018 (summer months: June, July, August).
Similar to Secchi depth, water colour also exhibits significant changes from the decade 1998–2007 to the decade 2008–2018 (Figure 5; Supplementary Table S2) across all coastal zones (EC, NT, ST, and WC), regardless of the month. Among the 48 cases (month vs. region), 42 cases showed significant (p< 0.001) upward shifts in the colour hue along the FU scale. The only instances that did not display any significant change were November in EC and WC. Additionally, cases that showed downward shifts occurred in February and November. However, similar to the Secchi depth measurements, these months had limited data due to cloudiness and ice cover.
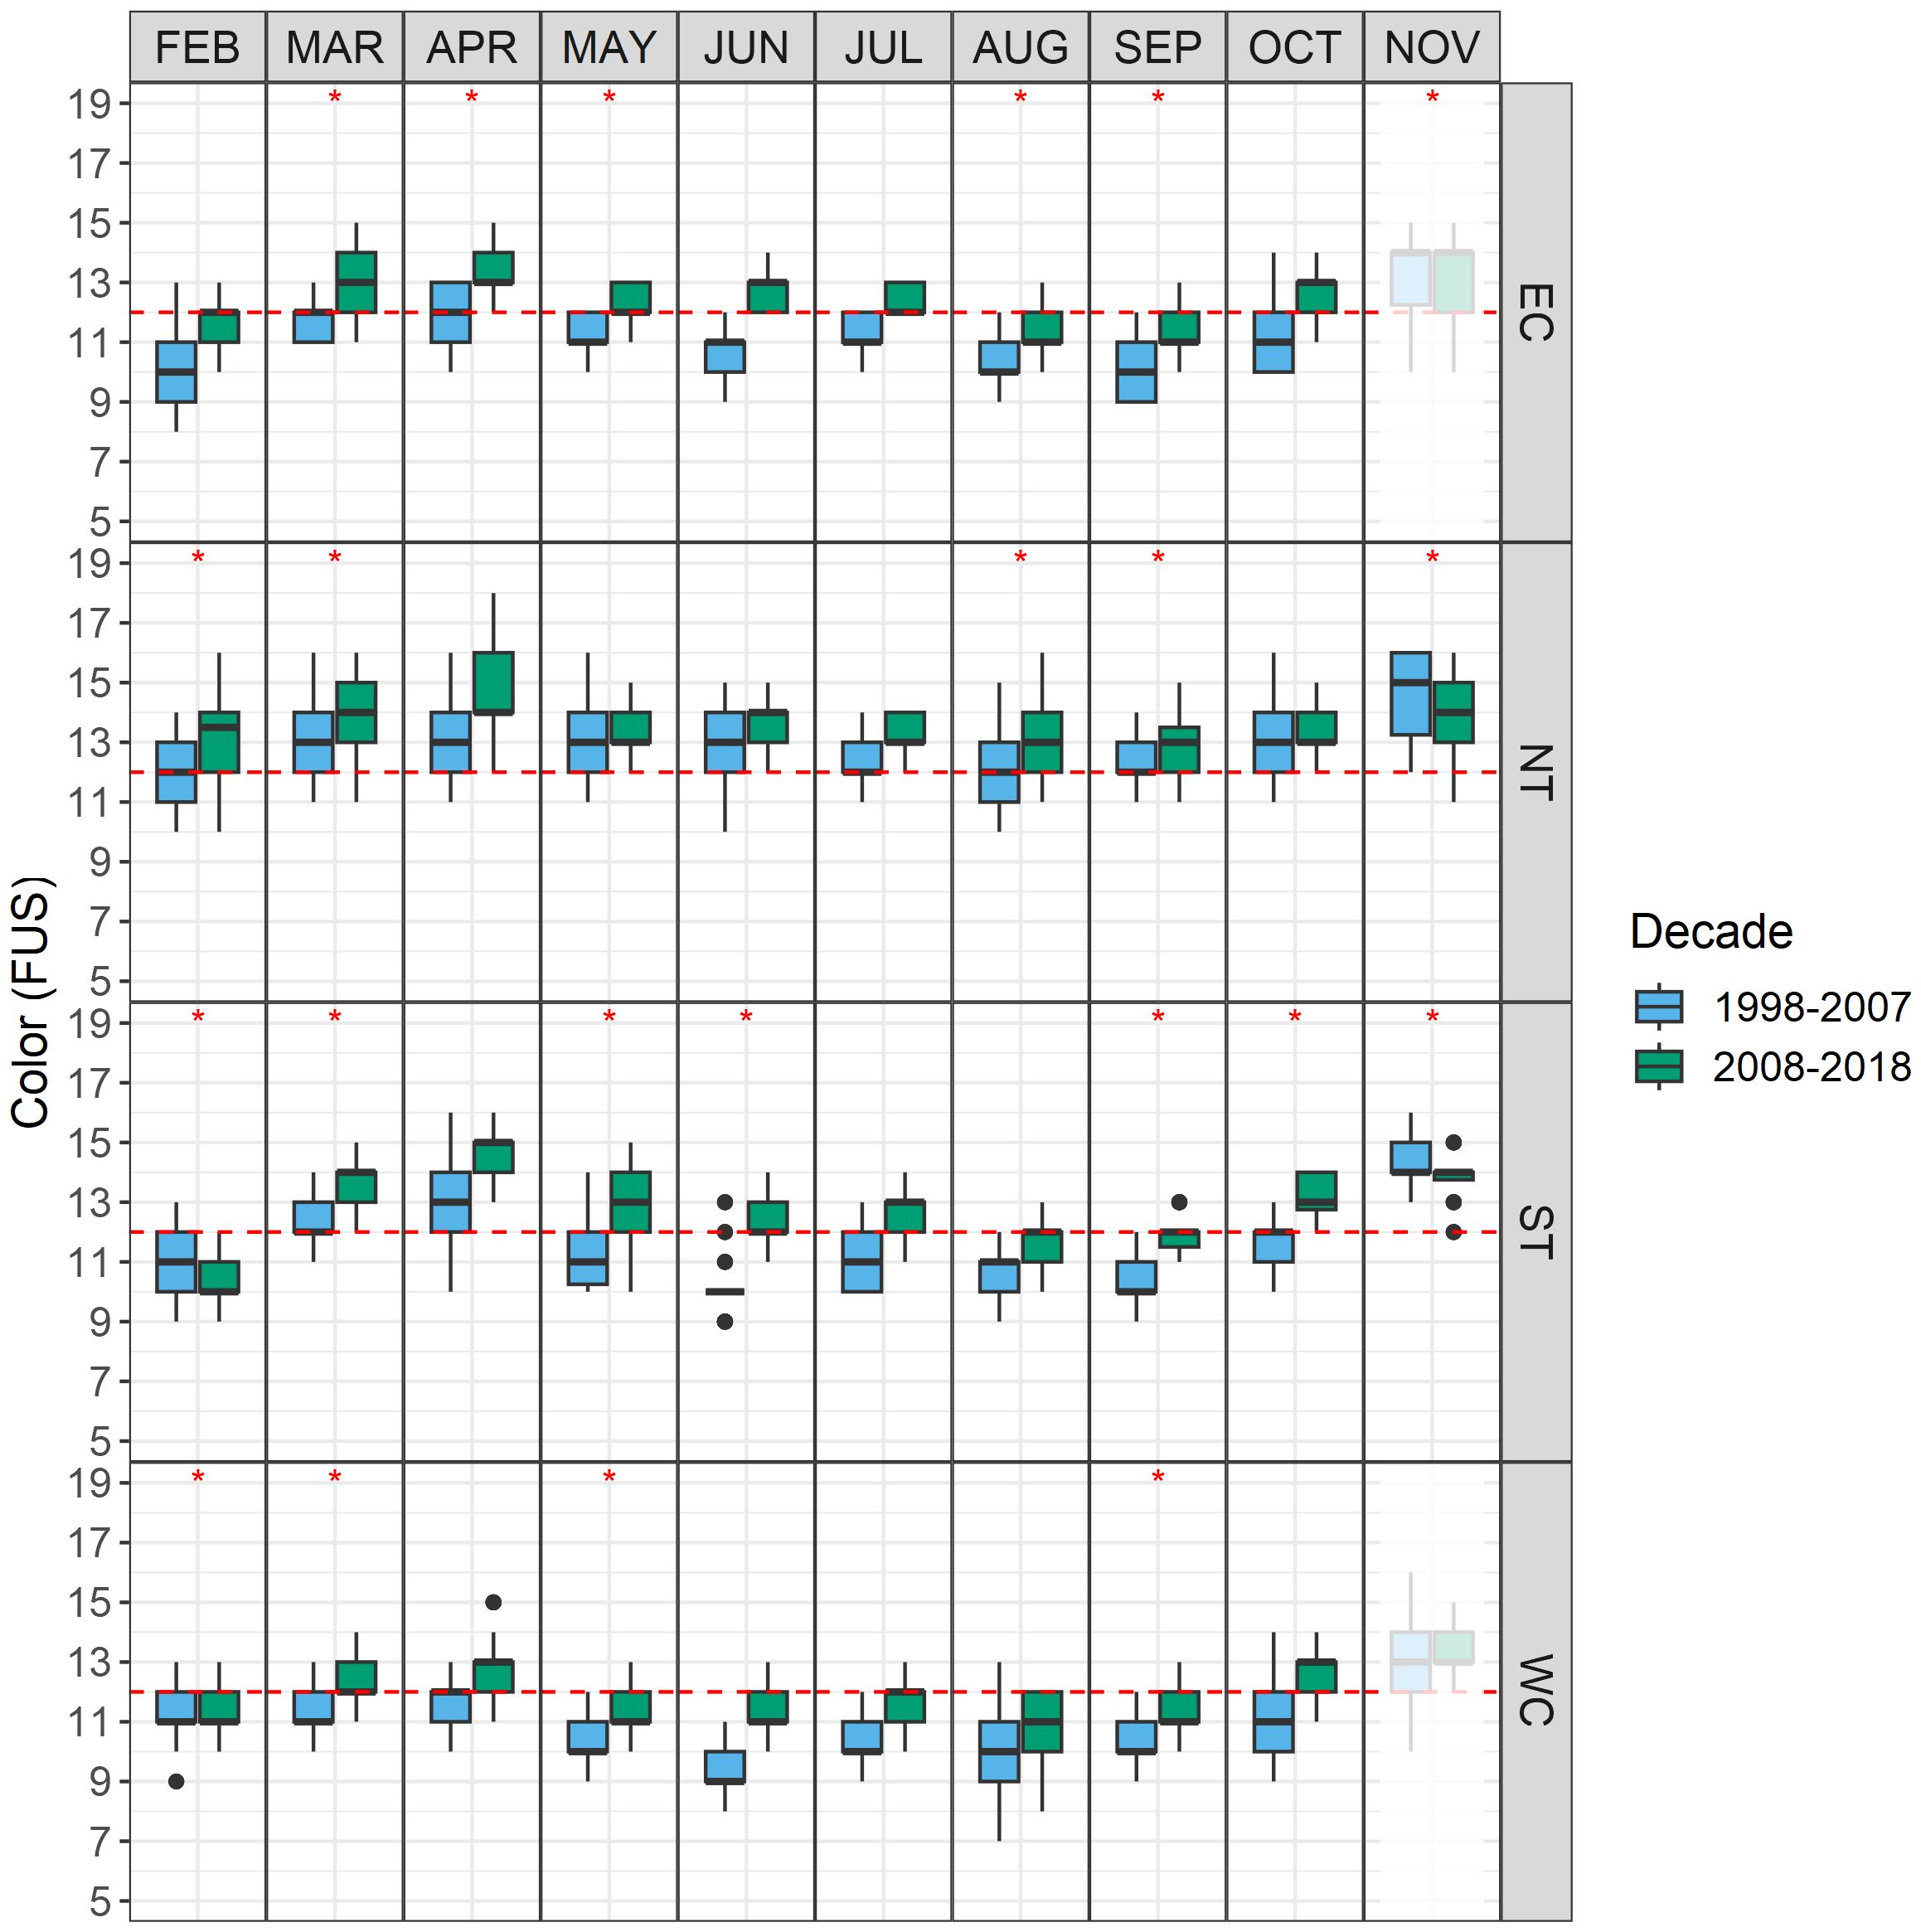
Figure 5 Monthly averages of the water colour (FU scale) across four distinct regions within the Gulf of Riga: EC (Eastern Coast), NT (Northern Transitional), ST (Southern Transitional), and WC (Western Coast) in decades 1997 - 2007 and 2008 - 2018. Shaded panels represent statistically insignificant changes (p > 0.05), red stars highlight pairs with equal variances (comparable medians), and a red dashed line indicates the median watercolour (12 FUS) observed in the coastal waters of the Gulf of Riga over the entire period duration.
The lowest water colour hue throughout the year and the entire study period was observed in the WC zone (Table 3). The minimum colour hue recorded was ‘7’ in August during the decade 1998–2008. On the other hand, the highest hue was observed in the NT zone, with the peak colour hue of ‘18’ recorded in April during the decade 2008–2018.
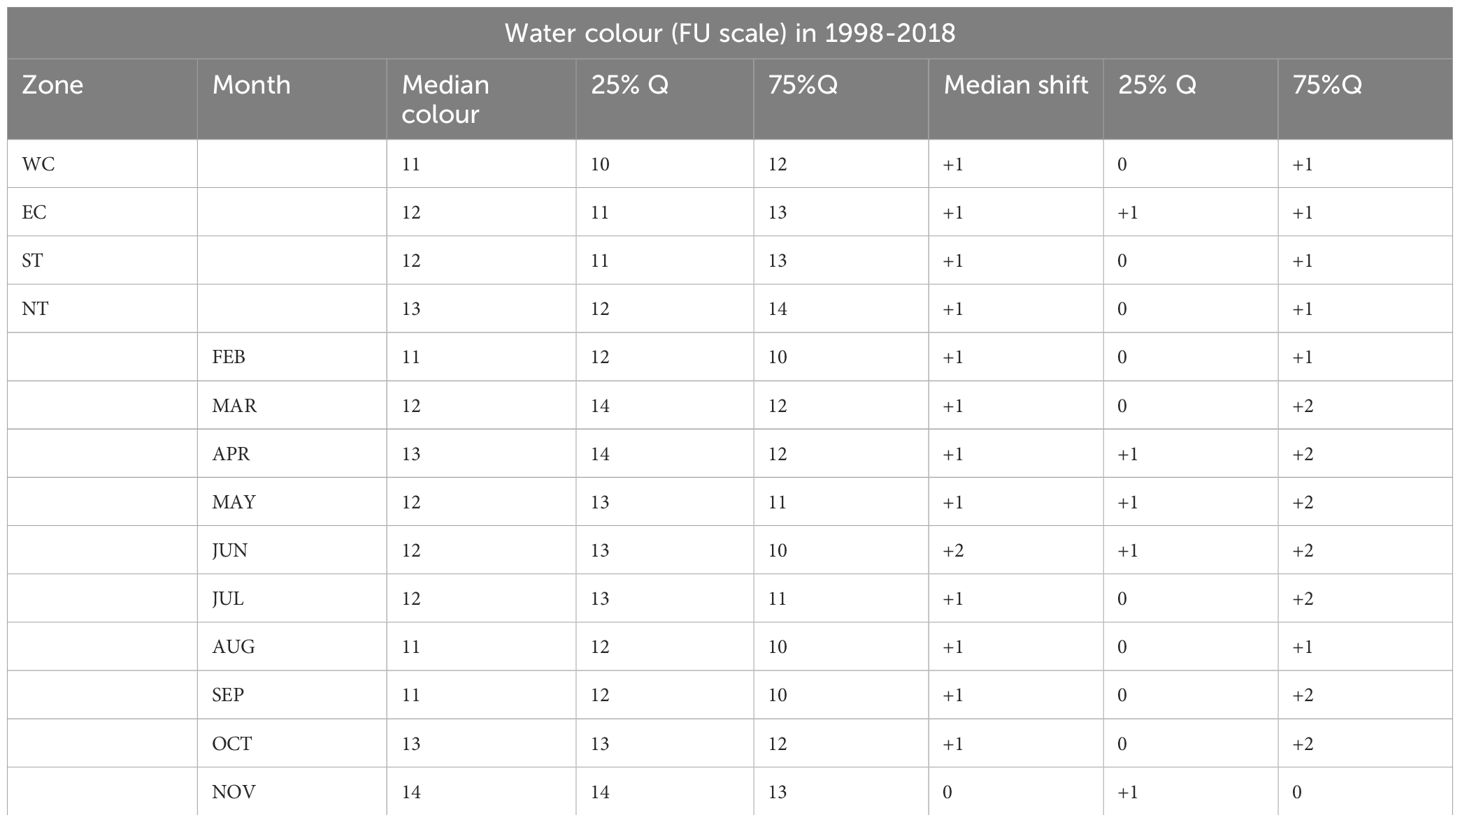
Table 3 Water colour (FU scale) in four coastal zones of the Gulf of Riga and seasonal variations in the entire coastal zone averaged over the periods 1998-2018, as well as the median shifts in water colour between the decades 1998-2007 and 2008-2018, based on remote sensing data.
Notably, EC experienced more pronounced changes compared to the other zones (p< 0.001, p = 0.027, and p< 0.001 compared to NT, ST, and WC, respectively), which agrees with the Secchi depth shifts presented earlier.
Regarding seasonal variation, the most significant shift in colour hue was observed in June (significantly different from other months, p< 0.001 in all cases except April, where p = 0.004) while the least pronounced shift was observed in November.
3.4 Sea surface salinity
The surface water salinity of the Gulf of Riga averaged over study period (Figure 6) demonstrated a clear spatial gradient with highest values in the North-West (Irbe strait), reflecting inflow of saline water from Eastern Baltic Proper. The South and South-East coastal area of the Gulf of Riga that receives freshwater input from rivers on average demonstrates comparatively lower salinity levels. The direct impact of inflowing freshwater from rivers is rather localised in the southern (coastal zone ST) part of the Gulf of Riga determined by the combined impact of Daugava, Lielupe and Gauja and in the northern part (coastal zone NT) determined by the Pärnu river. The impact of Salaca river (coastal zone EC), although detectable, is fairly negligible. Although explicit river plume areas are fairly local (Figure 6), there is clear evidence that riverine water is instrumental in the development of a clear, albeit relatively narrow belt of coastal water along the eastern coast of the Gulf of Riga, with substantially lower salinity levels. The breaking point of 4.5 ‰ salinity isoline located south from the line dividing EC and NT is strongly connected with the bathymetry of the region - 10 m isobath is located the most distant from the shoreline there as shown in Figure 1.
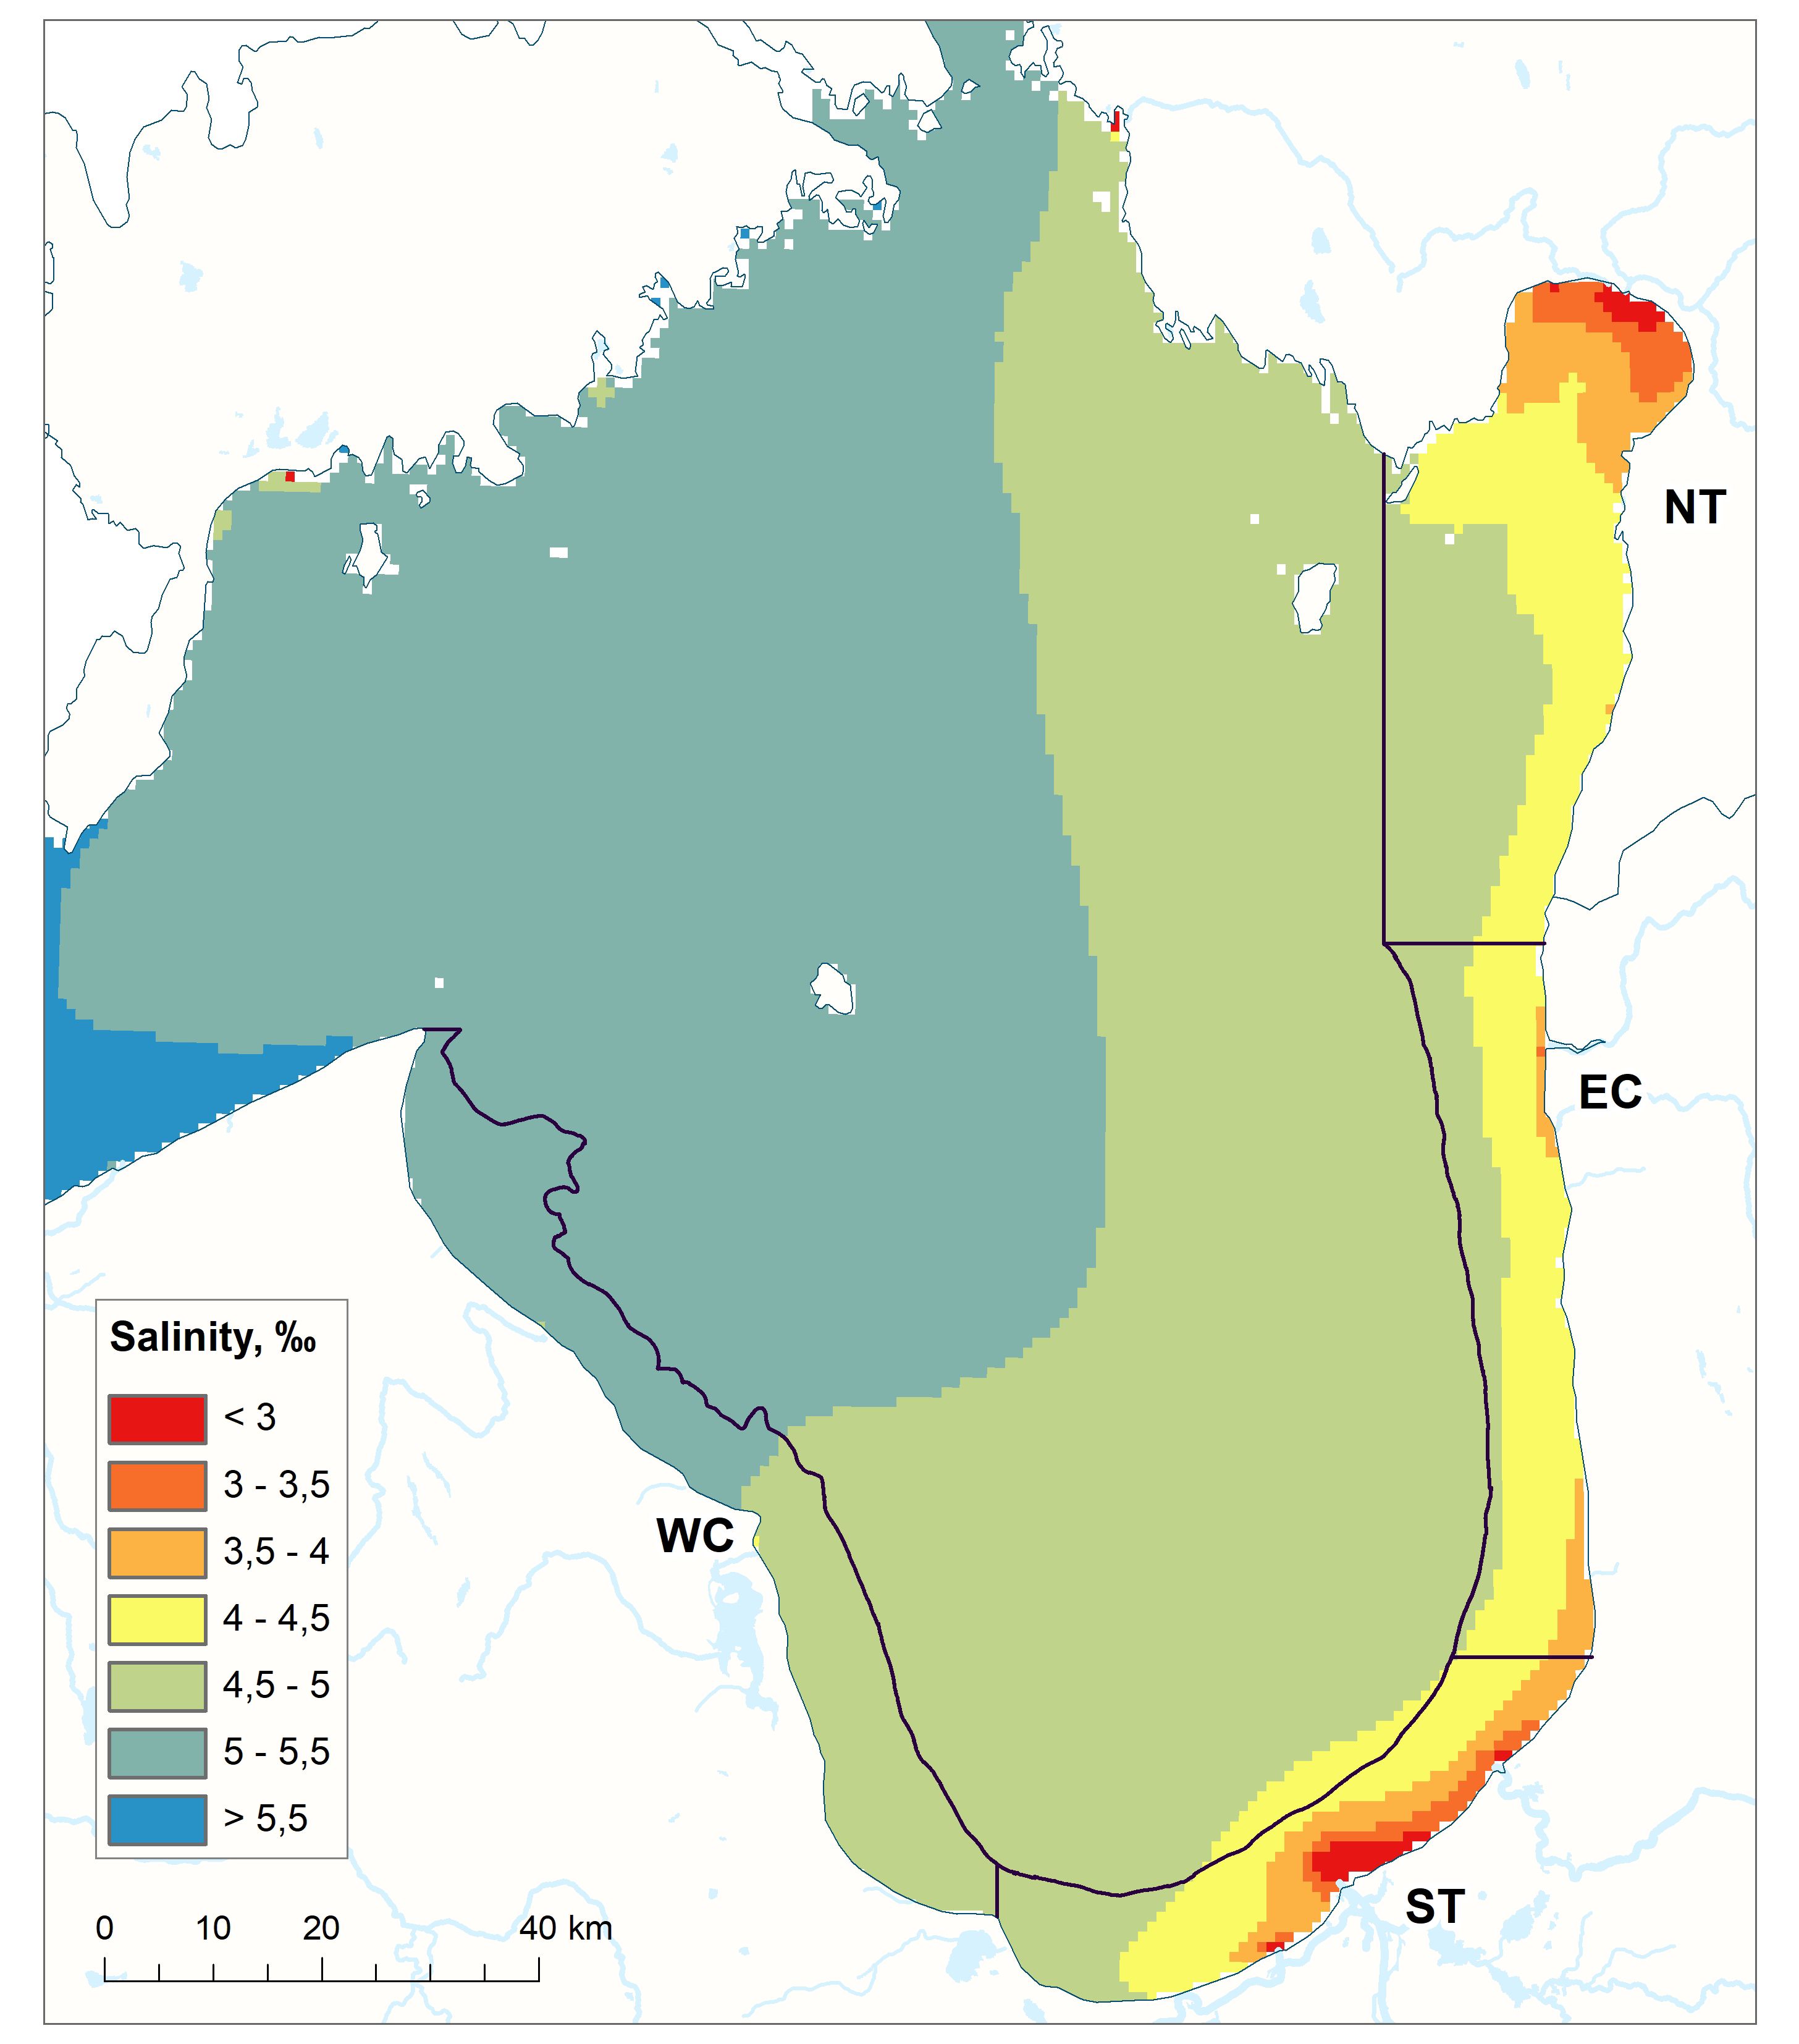
Figure 6 Mean sea surface (0–2 m) salinity (‰) in the Gulf of Riga during the period of 1998–2018, from the oceanographic reanalysis of 1993–2021 obtained by UL HIROMB-BOOS model results (see 2.3.).
The analyses of salinity (‰) changes between periods of 2008–2018 and 1998–2007 by grid cells of the study region revealed no significant differences (Supplementary Table S4) for medians.
3.5 Sea surface currents and ice conditions
Overall, the sea surface current pattern (Figure 7) remained unchanged throughout the study period of 1998 – 2018. Although the wind driven surface water current demonstrated certain fluctuation over study period, as presented already by Lips et al. (2016a), the predominant current has been pushing surface water against the eastern coast of the Gulf of Riga. As a combined result of this pressure as well as major freshwater inflow from rivers in the southern part of the Gulf of Riga, relatively narrow near-coast current is transporting water from southern part of the Gulf of Riga to northern along the eastern coast.
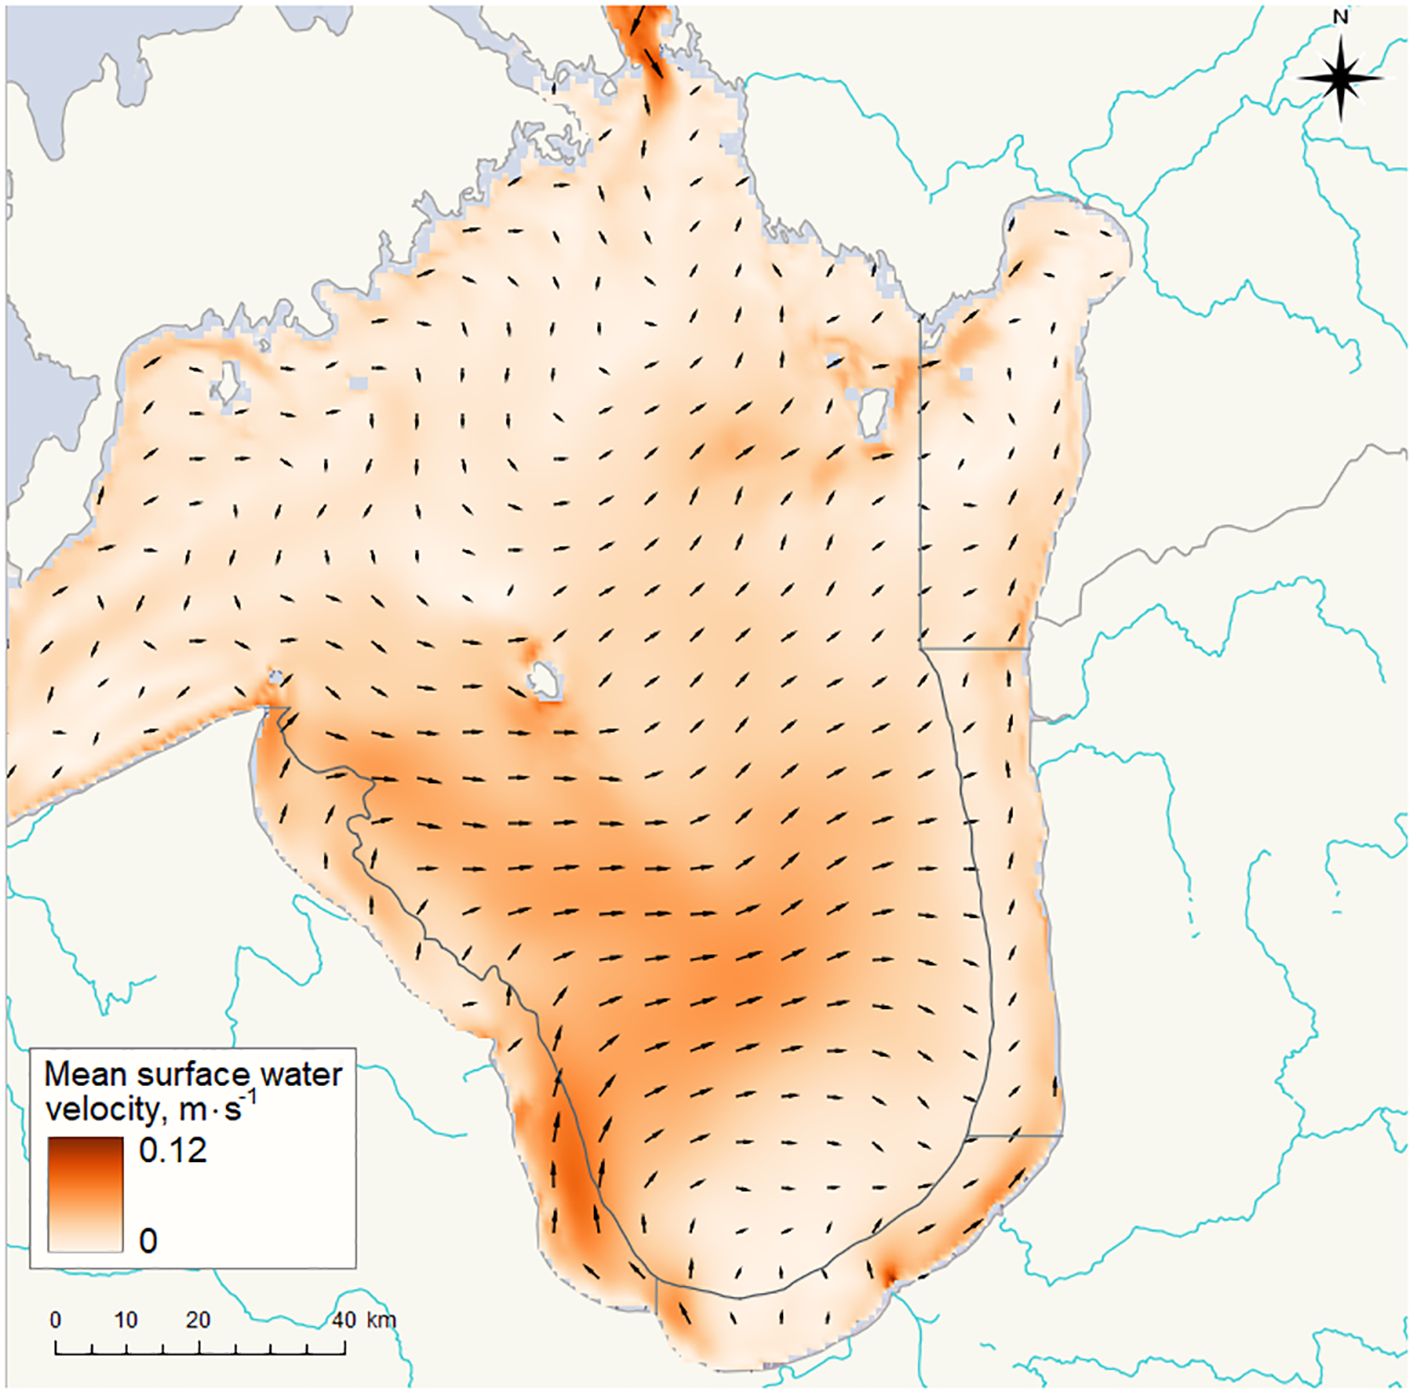
Figure 7 Mean surface current pattern in the Gulf of Riga during period of 1998–2018, from the oceanographic reanalysis of 1993–2021 obtained by UL HIROMB-BOOS model results (see chapter 2.3.).
The ice conditions in the coastal waters of the Gulf of Riga varied substantially among winters incorporated in the study period (Figure 8). Nevertheless, the distinct shift towards decrease in ice duration could be observed for all coastal zones.
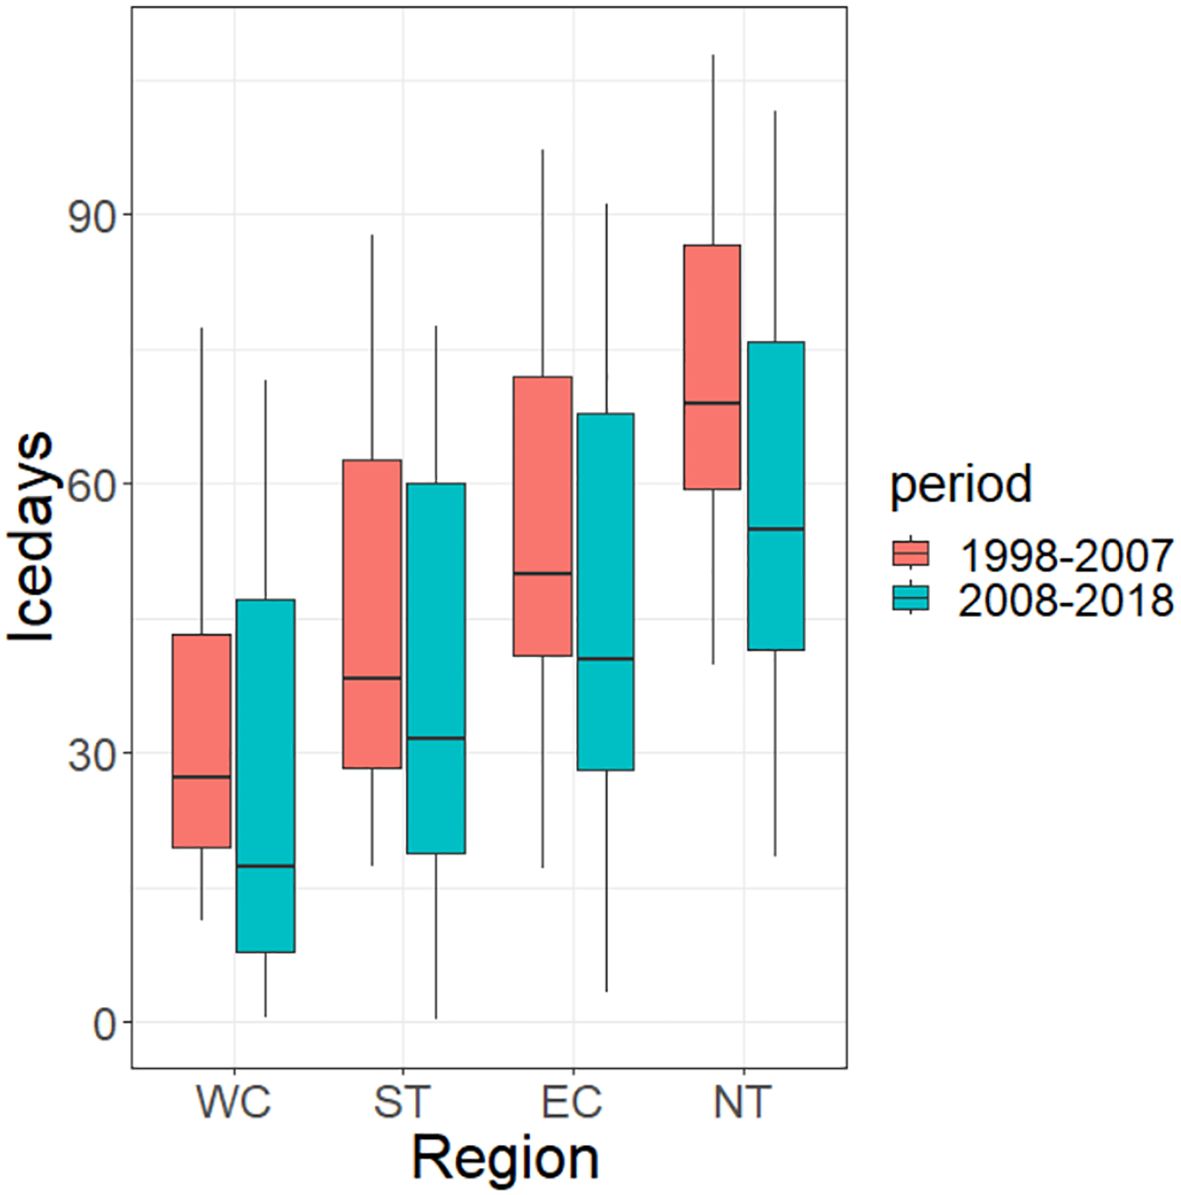
Figure 8 Mean number of days with ice cover (according to sea ice fraction area monthly means) in 4 coastal regions, from the oceanographic reanalysis of 1993–2021 obtained by UL HIROMB-BOOS model results (see chapter 2.3.).
3.6 River runoff, loads and river ice conditions
The yearly water runoff of six main rivers entering the Gulf of Riga varied substantially from 18.9 km3 in 2014 to 42.8 km3 in 1998. Average yearly runoff for the total study period is 30.0 ± 6.5 km3 and that comprises about 7% of the Gulf of Riga volume. A two-sample t-test at α=0.05 reveals that riverine runoff does not differ between the two study periods (Figure 9; Supplementary Table S3). Similarly, loads of TOC and SS did not show any significant differences between the two study periods, except loads of SS in Daugava River showing decreased load in 2008–2018 compared to 1998–2007 (p<0.10). The values of TOC and SS loads exhibited large interannual variations within the study periods (Figure 9; Supplementary Table S3). Furthermore, the available datasets of these parameters were incomplete, i.e., data from the number of years were missing. Consequently, the statistical analyses of differences between periods should be regarded as inconclusive. Data on yearly nutrient loads were available for the whole study period. TP and TN loads exhibited no significant changes between the periods except in the case of TP, where a significant decrease (p<0.05) in Lielupe River was observed (Figure 9; Supplementary Table S3). It can be noted that TP loads in five out of six rivers are lower in period 2008–2018 than in period 1998–2007, while TN loads in five rivers have increased. However, these changes are not statistically significant.
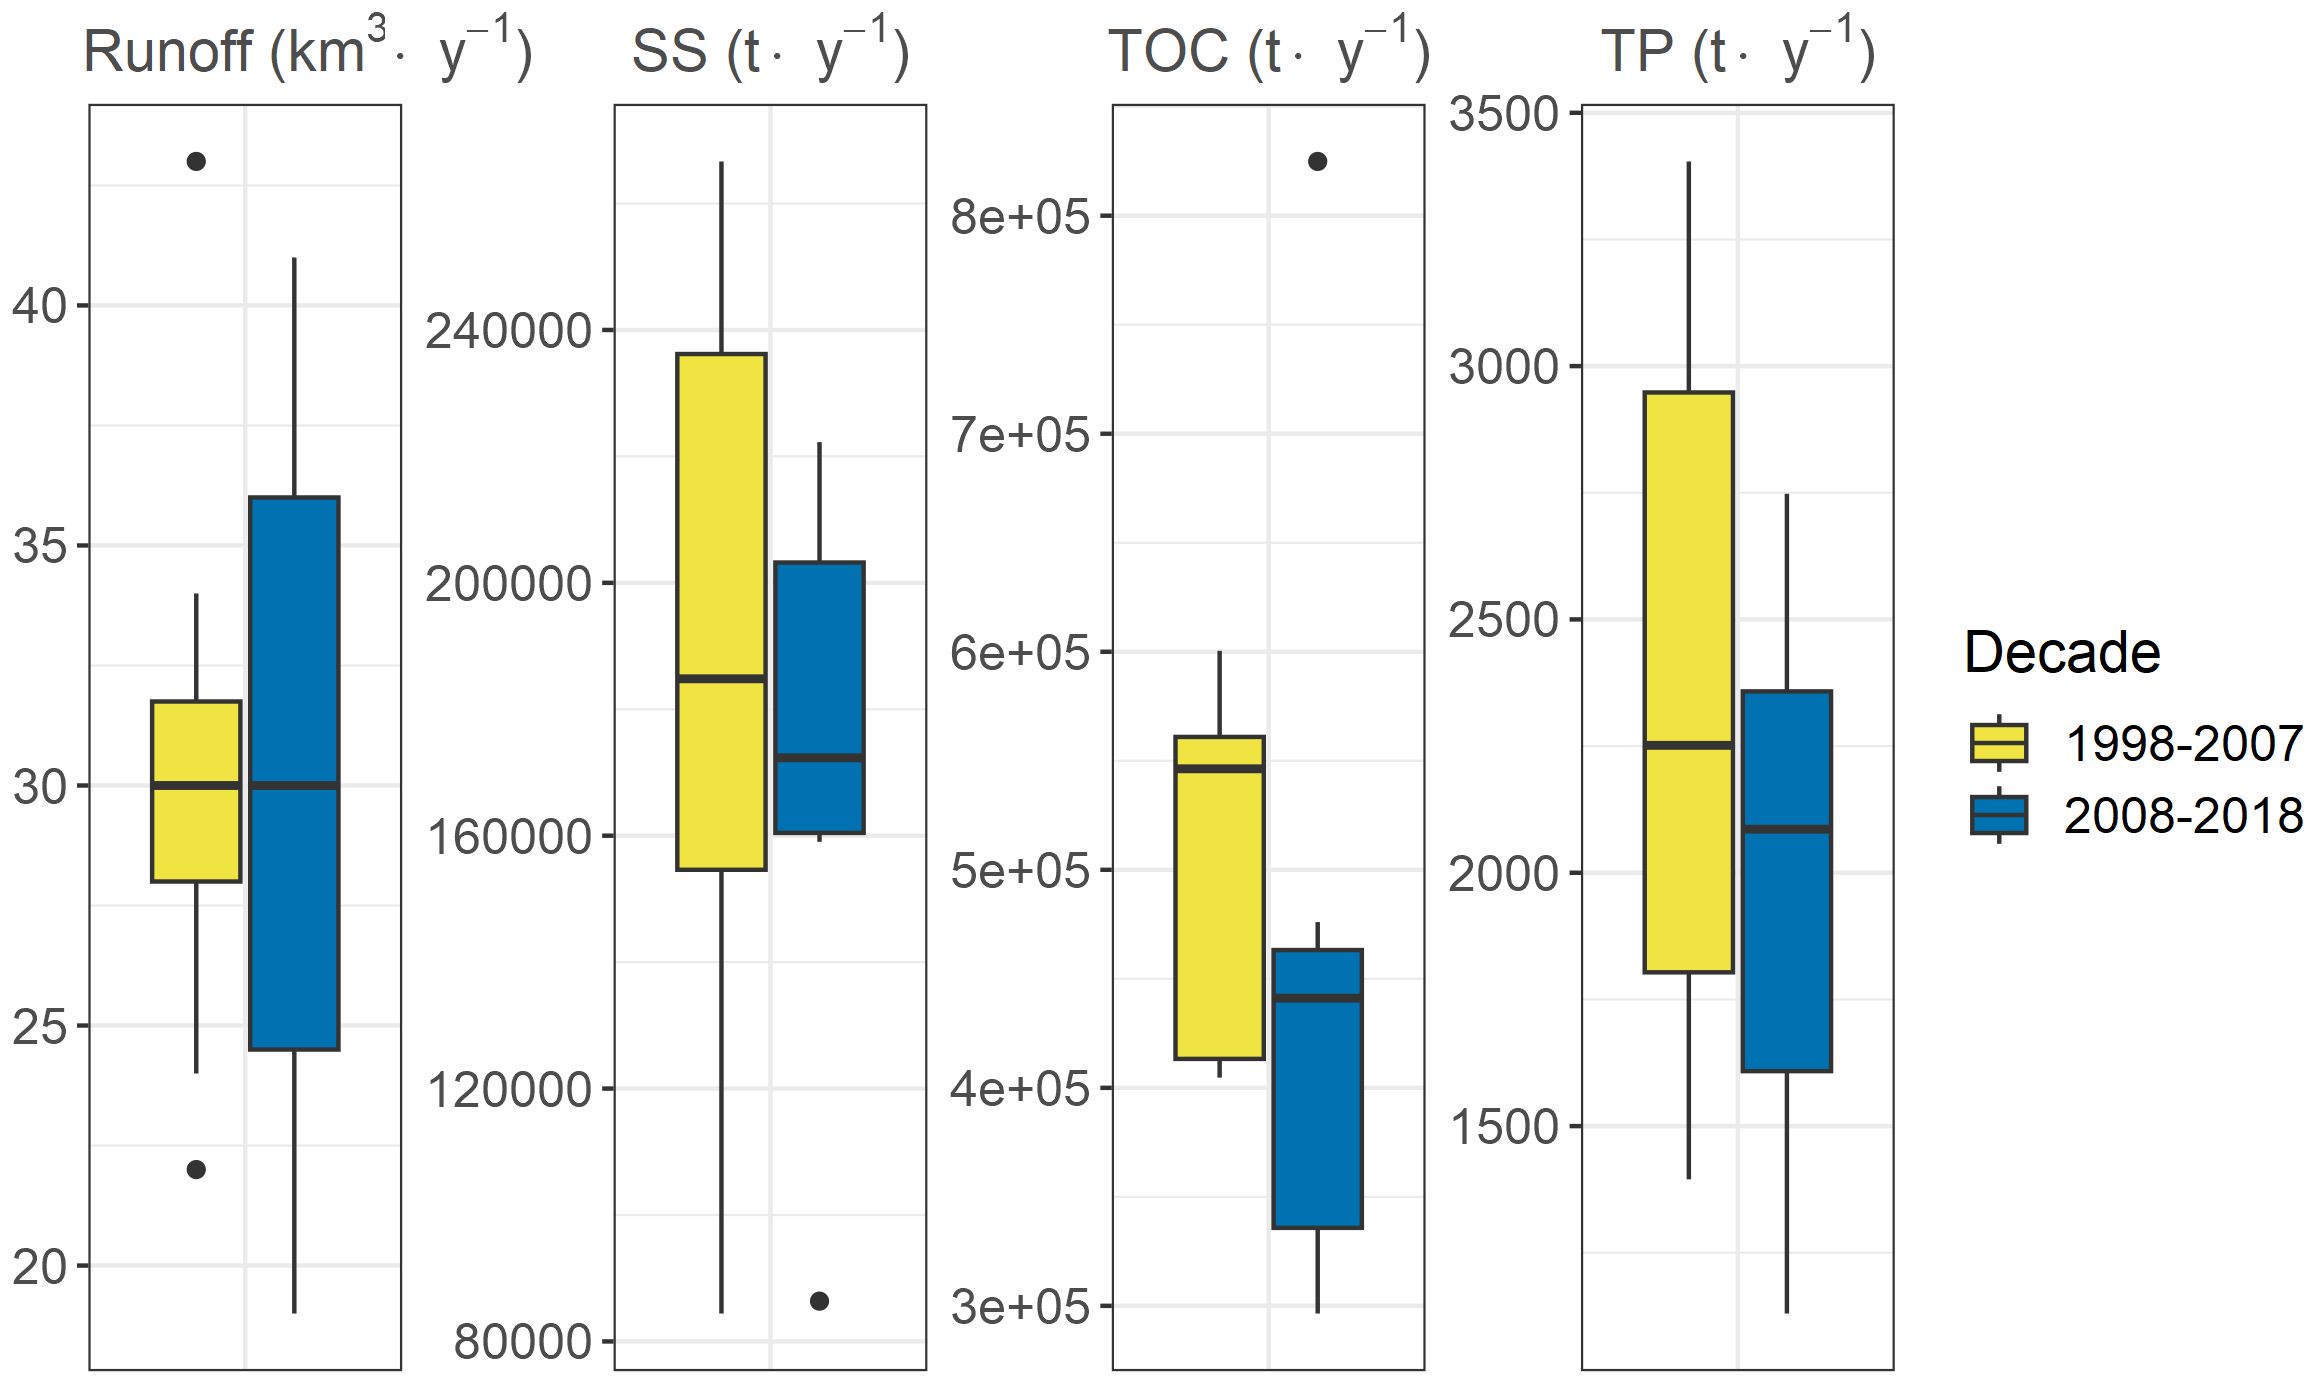
Figure 9 Comparison of yearly riverine runoff (km3 year-1) and loads (t year-1) of suspended solids (SS), total organic carbon (TOC) and total phosphorus (TP) for periods 1998–2007 and 2008–2018.
The number of ice cover days for rivers in the study area varied substantially among years and rivers, ranging from 0 days in Daugava (years 1999 and 2008) and in Salaca (years 2014 and 2017) to 130 in Daugava (year 1998). On average, ice cover of Lielupe (Figure 10) was the longest while ice cover of Salaca - the shortest. The difference in the number of ice cover days between the periods 1998–2007 and 2008–2018 varied, ranging from 10% in Lielupe to 34% in Salaca (Figure 10).
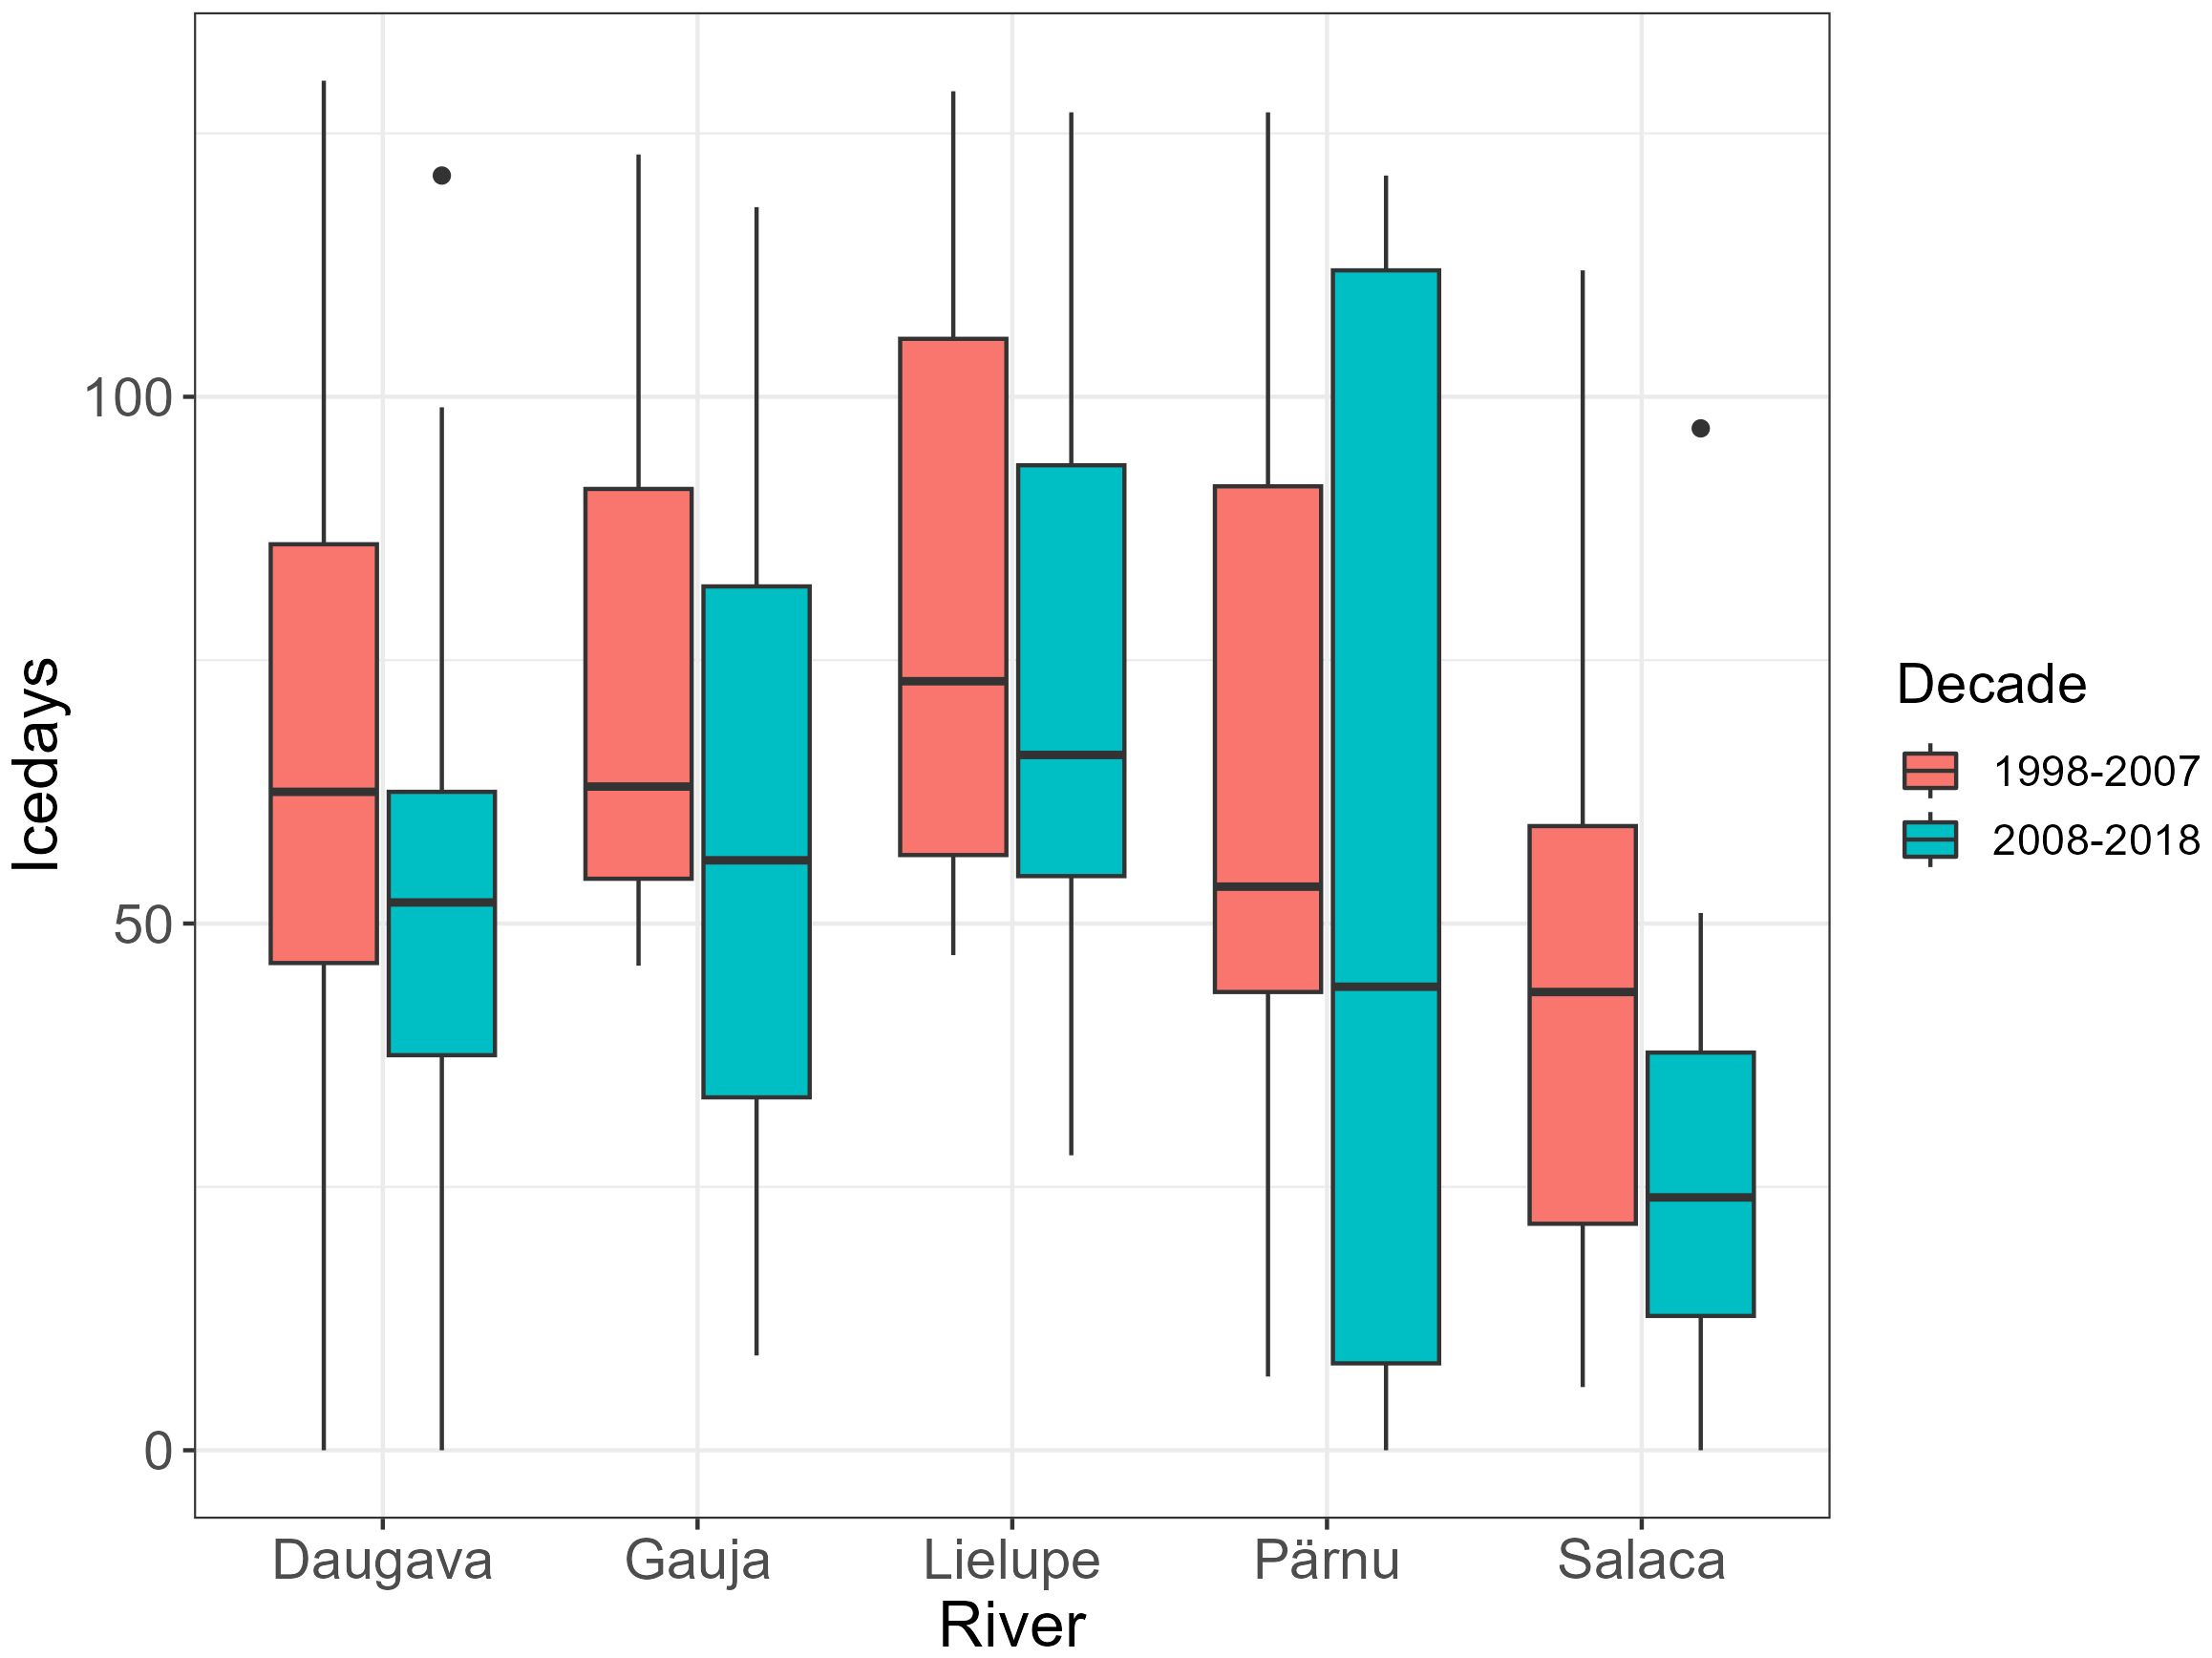
Figure 10 Number of days the rivers at study area were covered by ice during periods of 1998–2007 and 2008–2018.
4 Discussion
As has been previously stated by Aksnes et al. (2009) the long-term data on marine optical properties do not exist, except for Secchi disc depth observations (Aksnesa and Ohman, 2009), although substantial improvements in data availability has been made for most recent decades (Pitarch et al., 2019b). The Secchi disc depth values, especially in hydrologically dynamic coastal waters, usually exhibit high variability (Preisendorfer, 1986) as they are affected by light conditions during the time of measurement, wave height as well as by vertical and horizontal distribution of suspended material, both of autochthonous and allochthonous origin, and dissolved organic matter. Therefore, in order to detect changes in optical properties of coastal waters a substantial number of observations, both spatially and temporary spaced, is necessary. However, quite often this is not the case. Furthermore, Secchi depth observations can explain changes in light attenuation, while the nature of these changes or the driving factors cannot be accounted for. Similarly, in cases of some proxies used, like submerged aquatic vegetation depth distribution (Nielsen et al., 2002; Michael Kemp et al., 2004), only changes in light attenuation can be detected.
At the same time, the relatively high temporal and spatial resolution of remote-sensing datasets enable distinguishing the temporal changes in light attenuation on basin as well as sub-basin scales as was done during this study. The availability of the modified remote-sensing data (Pitarch et al., 2019b) allowed us to detect a shift in water transparency on a decadal scale for coastal areas of the Gulf of Riga that would have been missed if only data from classical marine monitoring had been utilised. Moreover, open access of the modified remote-sensing data, providing estimated Secchi disk depth and FU from absorption, backscattering and hue angle information (Wernand et al., 2013a; Wang et al., 2019; Pitarch et al., 2019a) presents also a great opportunity to get some insight into factors driving this change. So, by supplementing observations on changes in light conditions in the coastal zone of the Gulf of Riga with detected change in water colour from deep-green to green-yellowish hue it can be argued that observed change in light attenuation is likely driven by the increase of coloured dissolved organic matter (CDOM) concentration in surface water as already has been suggested by Dupont and Aksnes (2013) on the Baltic Sea scale. This does not exclude any variations in phytoplankton biomass, community structure and their seasonal succession, but rather clearly highlights the importance of other components that influence the light attenuation. Similar to our observations, the changes in light attenuation of marine coastal waters have been also attributed to increase of CDOM concentration in previous studies, mostly linking that to increased load of CDOM by freshwater inflow (Helms et al., 2008; Aksnes et al., 2009; Opdal et al., 2023). Most often enhanced mobilisation of organic carbon from soils with subsequent transport to coastal regions has been attributed to climate change driven increase in precipitation (De Wit et al., 2016) or fluctuation of CDOM loading due to interannual variations in river runoff (Frigstad et al., 2023). However, the annual river runoff figures presented in this study and previous findings shown by Apsīte et al. (2013), do not indicate a noticeable increase of annual freshwater inflow during the two decades scrutinised by this study. Therefore, precipitation and freshwater runoff cannot be used as a plausible explanation of detected shift in light attenuation and colour for this study.
The characteristic feature of coastal waters, or in case of the semi-enclosed Baltic Sea and its sub-basins, is that water consists of two components – saltwater from adjacent marine area and freshwater from inland streams. The changes in relative proportion between these two components as manifested in the Baltic Sea (Lehmann et al., 2022), due to alterations in inflow of saline water from adjacent North Sea can be characterised by changes in water salinity. By extension, the changes in CDOM bearing freshwater component in marine coastal waters (Opdal et al., 2023) can also be linked to alterations in salinity observed in the coastal water body of interest. However, no shift in water salinity and consequently no change in marine water/freshwater balance was detected during the study period, which seems to be in line with climate change assessments regarding the Baltic Sea (e.g. Meier et al., 2022a, 2022b), where it is stated that mean salinity change is small because the projected increase in river runoff is approximately compensated by the projected sea level rise and subsequent larger saltwater inflows. Although, uncertainty in salinity changes is rather high due to the related wind, river discharge and sea level rise changes. Obtained results regarding the spatial distribution of surface salinity in the GoR correspond to the previous findings (e.g. Berzinsh, 1980, 1995; Leppäranta and Myrberg, 2009), where main dynamics and gradients have been described. Similarly, the influence of freshwater inflow and currents to salinity dynamics have been shown using numerical modeling (e.g. Soosaar et al., 2014; Lips et al., 2016a, b) and HIROMB-BOOS model data, used within this study, revealed the same main patterns – salinity gradient from the Irbe strait to S and E part of the GoR, substantially lower salinity in the S part and Pärnu Bay due to the Daugava, Lielupe, Gauja river and Pärnu river inflow, respectively, and narrow band of fresher surface waters along the SE, E coast. The latter is related to the permanent current (due to the Coriolis effect) which brings the freshwater from the S part along the SE, E coast of the GoR.
The Kritzberg et al. (2020) have briefly discussed more drivers and mechanisms, including extension of growing season emphasised by Finstad et al. (2016) that is caused by global warming as well as land use (Opdal et al., 2023; Kratzer and Allart, 2023) as potential factors, capable of affecting CDOM concentrations in water environments. To our best knowledge, there have been no meaningful changes in proportions of land use types such as rural areas and natural biotopes in the study region over the past decades (open CORINE Land Cover data, https://land.copernicus.eu/en/products). At the same time, the study region, similarly to other regions worldwide, has been subject to global warming. The annual mean air temperature has increased by 0.4°C per decade (Kalvāns et al., 2023) since 1960-ties. However, if we consider an increase of mean air temperature of winter season by 2°C, comparing periods 1961–1990 and 1991–2020, it corresponds to a temperature rise from -4.4°C to -2.4°C (Kalvāns et al., 2023). So, considering just the average temperature, winter seasons of study period still manifest sub-freezing conditions. However, the actual duration of winter season is becoming shorter as evidenced by changes in river discharge regime (Apsīte et al., 2013). Furthermore, usually during one winter season several periods of severe and mild conditions interchange (LEGMA data) creating freeze-thaw cycles (FTC). The study by Gao et al. (2021), where compiled data from 2471 observations were used, conclusively demonstrated that FTC significantly increased dissolved organic carbon (DOC) leaching from all soil types except tundra. Furthermore, the greatest FTC effect has been observed at mild frost conditions. The effect of FTC on DOM mobilisation has been highlighted also in more recent studies, (e.g., Speetjens et al., 2022; Yang et al., 2023). Moreover, these studies suggest that the altered composition of DOM, influenced by changes in soil microbial activity due to freeze-thaw cycles (Feng et al., 2007; Yang et al., 2023), has the potential to shift the optical properties of DOM and increase its humification index (Speetjens et al., 2022). This phenomenon underscores the intricate relationship between climate-induced freeze-thaw dynamics and the composition of dissolved organic matter, most likely impacting the water optical properties observed in the Gulf of Riga over the past two decades. To test the assumption that milder winters would result in enhanced CDOM mobilisation we attempted to use TOC concentrations, to which DOC is a major constituent, within the monitored rivers. However, as demonstrated by this study, TOC loads actually decreased over the study period. Most notably the uncertainty of calculated load per period is substantial, since the TOC loads are available only for 3–7 years (depending on the monitoring site) for each 10-year period. Furthermore, the traditional monitoring approach with observation frequency ranging from once per month to once per two months, introduces additional uncertainty as it does not adequately reflect high runoff/low runoff fluctuation. Consequently, although in absence of DOC measurements the TOC freshwater load is the most desirable proxy for accounting of coastal water brownification, its use in this study is limited by the poor data coverage.
As an alternative, in order to quantify the duration of winter conditions when soil has been frozen, we used the number of days when major rivers were covered by ice. Furthermore, as an additional proxy we also utilised the number of days when coastal waters experienced ice conditions as not all coastal regions are part of the drainage area of substantial rivers and so are more impacted by small streams that cannot be represented by rivers used in this study. As has been presented in this study, the number of days that both rivers and coastal waters have been covered by ice has a decreasing tendency over study period clearly coinciding with changes in light attenuation and shift in water colour. Consequently, we suggest that the correlation between the decrease in water transparency, browning, and the reduction in ice cover days in the Gulf of Riga and surrounding rivers provides empirical evidence of changing FTC conditions in the region, consistent with climate change models (The Bacc II Author Team, 2015; Meier et al., 2022b).
The coastal waters where changes in light attenuation and colour were manifested are relatively shallow, less than 20 m deep. So, it is expected that due to the dominant surface current pattern, substances of terrestrial origin, like CDOM, would be trapped there for a prolonged time period. However, eventually CDOM that is mobilised during winter season and delivered to coastal waters by freshwater streams should be dispersed throughout the water column of the Gulf of Riga unless continuously replenished from the source. Since almost all months that have been analysed during this study demonstrate changes in both light attenuation and colour, it can be assumed that CDOM that is mobilised during milder periods during winter, only gradually leaches out of soils over spring and summer seasons. However, it should be stressed that in the absence of more direct evidence this is a rather speculative assumption.
5 Conclusions
The study highlights the urgent need for detailed and time-sensitive data to understand notable changes in water optical properties in the coastal waters of temperate regions. None of the examined variables, including river runoffs, salinity shifts, and ice cover tendencies, can presently provide unequivocal evidence of a robust correlation with water darkening. The findings, however, signal that desired state of the Baltic Sea outlined in the HELCOM Baltic sea Action Plan, like clear waters or natural distribution and occurrence of plants and animals might not be achievable just by reducing nutrient inputs, at least in coastal areas. Thus revisiting of the targets as well as reconsideration of actions might be needed.
The reduction in ice cover days, attributed to milder winters due to a warmer climate, showed promising results, which can be extended in further investigations. To confidently argue that this physical condition has a significant effect on water composition and therefore light attenuation, ice cover data must be supported by reasonably long datasets of TOC/DOC values.
The principal findings of the study confirm that remote sensing data is a powerful tool to fill in gaps in water optical properties, thereby uncovering significant changes that might remain undetected using traditional in-situ approaches. However, the lack of consistent long-term monitoring data in the chemical and physical properties of water in the region, does not allow us to utilise them fully in order to explain the findings in a modern context.
Data availability statement
Publicly available datasets were analysed in this study. This data can be found here: doi: 10.1594/PANGAEA.904266; https://latmare.lhei.lv; doi: 10.5281/ZENODO.8248943; https://data.gov.lv/dati/lv/dataset/noverojumu-stacijas/resource/e436dbc9-e3c9-4904-92e1-50b7c8254d90.
Author contributions
JA: Conceptualization, Funding acquisition, Project administration, Supervision, Writing – original draft. NS: Data curation, Formal analysis, Investigation, Methodology, Validation, Visualization, Writing – review & editing. DC-F: Data curation, Formal analysis, Visualization, Writing – review & editing. IK: Data curation, Formal analysis, Visualization, Writing – review & editing. AI: Formal analysis, Writing – review & editing. MS: Formal analysis, Visualization, Writing – review & editing. MV: Writing – review & editing.
Funding
The author(s) declare financial support was received for the research, authorship, and/or publication of this article. The study has been supported from the project “CE2COAST – Downscaling Climate and Ocean Change to services: Thresholds and Opportunities” funded by Ministry of Education and Science, Republic of Latvia through the 2019 “Joint Transnational Call on Next Generation Climate Science in Europe for Oceans” initiated by JPI Climate and JPI Oceans, contract numbers 23–11.17e/20/176 and 23–11.17e/20/246. The study has been also supported by EC Horizon Europe Research and Innovation programme grant AquaINFRA (Agreement No 101094434). IK has been supported by the University of Latvia grant No. ZD2016/AZ107.
Acknowledgments
We acknowledge University of Latvia colleague Juris Sennikovs regarding sharing know-how in automation of model analysis in the python environment.
Conflict of interest
The authors declare that the research was conducted in the absence of any commercial or financial relationships that could be construed as a potential conflict of interest.
Publisher’s note
All claims expressed in this article are solely those of the authors and do not necessarily represent those of their affiliated organizations, or those of the publisher, the editors and the reviewers. Any product that may be evaluated in this article, or claim that may be made by its manufacturer, is not guaranteed or endorsed by the publisher.
Supplementary material
The Supplementary Material for this article can be found online at: https://www.frontiersin.org/articles/10.3389/fmars.2024.1369537/full#supplementary-material
References
Aksnes D. L. (2007). Evidence for visual constraints in large marine fish stocks. Limnol. Oceanogr. 52, 198–203. doi: 10.4319/lo.2007.52.1.0198
Aksnes D., Dupont N., Staby A., Fiksen Ø., Kaartvedt S., Aure J. (2009). Coastal water darkening and implications for mesopelagic regime shifts in Norwegian fjords. Mar. Ecol. Prog. Ser. 387, 39–49. doi: 10.3354/meps08120
Aksnesa D. L., Ohman M. D. (2009). Multi-decadal shoaling of the euphotic zone in the southern sector of the California Current System. Limnol. Oceanogr. 54, 1272–1281. doi: 10.4319/lo.2009.54.4.1272
Apsīte E., Rudlapa I., Latkovska I., Elferts D. (2013). Changes in Latvian river discharge regime at the turn of the century. Hydrol. Res. 44, 554–569. doi: 10.2166/nh.2012.007
Berzinsh V. (1980). Interannual and seasonal changes of water salinity in the Gulf of Riga. Rybokhozyaistvennye issledovaniya (Balt-NIIRKH), Avots, Riga, 15Avots, 3–12 (in Russian).
Berzinsh V. (1995). ““Hydrology”,” in Ecosystem of the Gulf of Riga between 1920 and 1990. Ed. Ojaveer O. (Estonian Acad. Publ., Tallinn), 7–32.
Blanchet C. C., Arzel C., Davranche A., Kahilainen K. K., Secondi J., Taipale S., et al. (2022). Ecology and extent of freshwater browning - What we know and what should be studied next in the context of global change. Sci. Total Environ. 812, 152420. doi: 10.1016/j.scitotenv.2021.152420
Boyce D. G., Lewis M., Worm B. (2012). Integrating global chlorophyll data from 1890 to 2010. Limnol. Ocean Methods 10, 840–852. doi: 10.4319/lom.2012.10.840
Cael B. B., Bisson K., Boss E., Dutkiewicz S., Henson S. (2023). Global climate-change trends detected in indicators of ocean ecology. Nature 619, 551–554. doi: 10.1038/s41586-023-06321-z
Campagne C. S., Salles J.-M., Boissery P., Deter J. (2015). The seagrass Posidonia oceanica: Ecosystem services identification and economic evaluation of goods and benefits. Mar. pollut. Bull. 97, 391–400. doi: 10.1016/j.marpolbul.2015.05.061
Canuel E. A., Cammer S. S., McIntosh H. A., Pondell C. R. (2012). Climate change impacts on the organic carbon cycle at the land-ocean interface. Annu. Rev. Earth Planet. Sci. 40, 685–711. doi: 10.1146/annurev-earth-042711-105511
Ceccaroni L., Piera J., Wernand M. R., Zielinski O., Busch J. A., van der Woerd H. J., et al. (2020). Citclops: A next-generation sensor system for the monitoring of natural waters and a citizens’ observatory for the assessment of ecosystems’ status. PloS One 15, e0230084. doi: 10.1371/journal.pone.0230084
De Wit H. A., Valinia S., Weyhenmeyer G. A., Futter M. N., Kortelainen P., Austnes K., et al. (2016). Current browning of surface waters will be further promoted by wetter climate. Environ. Sci. Technol. Lett. 3, 430–435. doi: 10.1021/acs.estlett.6b00396
Dupont N., Aksnes D. L. (2013). Centennial changes in water clarity of the Baltic Sea and the North Sea. Estuarine Coast. Shelf Sci. 131, 282–289. doi: 10.1016/j.ecss.2013.08.010
Feng X., Nielsen L. L., Simpson M. J. (2007). Responses of soil organic matter and microorganisms to freeze–thaw cycles. Soil Biol. Biochem. 39, 2027–2037. doi: 10.1016/j.soilbio.2007.03.003
Finstad A. G., Andersen T., Larsen S., Tominaga K., Blumentrath S., De Wit H. A., et al. (2016). From greening to browning: Catchment vegetation development and reduced S-deposition promote organic carbon load on decadal time scales in Nordic lakes. Sci. Rep. 6, 31944. doi: 10.1038/srep31944
Fleming-Lehtinen V., Laamanen M. (2012). Long-term changes in Secchi depth and the role of phytoplankton in explaining light attenuation in the Baltic Sea. Estuarine Coast. Shelf Sci. 102–103, 1–10. doi: 10.1016/j.ecss.2012.02.015
Forel F. A. (1890). Une nouvelle forme de la gamme de couleur pourl’étude de l’eau des lacs. Arch. Des. Sci. Physiques etNaturelles/Société Physique d’Histoire Naturelle Genève 6, 25.
Frigstad H., Andersen G. S., Trannum H. C., McGovern M., Naustvoll L.-J., Kaste Ø., et al. (2023). Three decades of change in the Skagerrak coastal ecosystem, shaped by eutrophication and coastal darkening. Estuarine Coast. Shelf Sci. 283, 108193. doi: 10.1016/j.ecss.2022.108193
Frishfelds V., Cepīte- Frišfelde D., Timuhins A., Bethers U., Sennikovs J. (2023). Reanalysis and future climate projections of the physical state of the Gulf of Riga 1993–2100. Zenodo. doi: 10.5281/ZENODO.8248943
Gao D., Bai E., Yang Y., Zong S., Hagedorn F. (2021). A global meta-analysis on freeze-thaw effects on soil carbon and phosphorus cycling. Soil Biol. Biochem. 159, 108283. doi: 10.1016/j.soilbio.2021.108283
Hanssen-Bauer I., Achberger C., Benestad R., Chen D., Førland E. (2005). Statistical downscaling of climate scenarios over Scandinavia. Clim. Res. 29, 255–268. doi: 10.3354/cr029255
Haraldsson M., Tönnesson K., Tiselius P., Thingstad T. F., Aksnes D. L. (2012). Relationship between fish and jellyfish as a function of eutrophication and water clarity. Mar. Ecol. Prog. Ser. 471, 73–85. doi: 10.3354/meps10036
Helms J. R., Stubbins A., Ritchie J. D., Minor E. C., Kieber D. J., Mopper K. (2008). Absorption spectral slopes and slope ratios as indicators of molecular weight, source, and photobleaching of chromophoric dissolved organic matter. Limnol. Oceanogr. 53, 955–969. doi: 10.4319/lo.2008.53.3.0955
Kalvāns A., Kalvāne G., Zandersons V., Gaile D., Briede A. (2023). Recent seasonally contrasting and persistent warming trends in Latvia. Theor. Appl. Climatol 154, 125–139. doi: 10.1007/s00704-023-04540-y
Karlsson J., Byström P., Ask J., Ask P., Persson L., Jansson M. (2009). Light limitation of nutrient-poor lake ecosystems. Nature 460, 506–509. doi: 10.1038/nature08179
Kļaviņš M., Rodinovs V., Kokorīte I. (2002). Aquatic chemistry of surface waters in Latvia. LU, Riga, 285 pp.
Kratzer S., Allart M. (2023). Links between land cover and in-water optical properties in four optically contrasting Swedish bays. Remote Sens. 16, 176. doi: 10.3390/rs16010176
Kritzberg E. S., Hasselquist E. M., Škerlep M., Löfgren S., Olsson O., Stadmark J., et al. (2020). Browning of freshwaters: Consequences to ecosystem services, underlying drivers, and potential mitigation measures. Ambio 49, 375–390. doi: 10.1007/s13280-019-01227-5
Lee Z., Hu C. (2006). Global distribution of Case-1 waters: An analysis from SeaWiFS measurements. Remote Sens. Environ. 101, 270–276. doi: 10.1016/j.rse.2005.11.008
Lehmann A., Myrberg K., Post P., Chubarenko I., Dailidiene I., Hinrichsen H.-H., et al. (2022). Salinity dynamics of the Baltic sea. Earth Syst. Dynam. 13, 373–392. doi: 10.5194/esd-13-373-2022
Leppäranta M., Myrberg K. (2009). Physical Oceanography of the Baltic Sea (Chichester: Praxis Publishing Ltd). doi: 10.1007/978–3-540–79703-6
Lips U., Zhurbas V., Skudra M., Väli G. (2016a). A numerical study of circulation in the Gulf of Riga, Baltic Sea. Part I: Whole-basin gyres and mean currents. Continental Shelf Res. 112, 1–13. doi: 10.1016/j.csr.2015.11.008
Lips U., Zhurbas V., Skudra M., Väli G. (2016b). A numerical study of circulation in the Gulf of Riga, Baltic Sea. Part II: Mesoscale features and freshwater transport pathways. Continental Shelf Res. 115, 44–52. doi: 10.1016/j.csr.2015.12.018
Meier H. E. M., Dieterich C., Gröger M., Dutheil C., Börgel F., Safonova K., et al. (2022a). Oceanographic regional climate projections for the Baltic Sea until 2100. Earth System Dynamics 13, 159–199. doi: 10.5194/esd-13-159-2022
Meier H. E. M., Kniebusch M., Dieterich C., Gröger M., Zorita E., Elmgren R., et al. (2022b). Climate change in the Baltic Sea region: a summary. Earth Syst. Dynam. 13, 457–593. doi: 10.5194/esd-13–457-2022
Michael Kemp W., Batleson R., Bergstrom P., Carter V., Gallegos C. L., Hunley W., et al. (2004). Habitat requirements for submerged aquatic vegetation in Chesapeake Bay: Water quality, light regime, and physical-chemical factors. Estuaries 27, 363–377. doi: 10.1007/BF02803529
Monteith D. T., Stoddard J. L., Evans C. D., De Wit H. A., Forsius M., Høgåsen T., et al. (2007). Dissolved organic carbon trends resulting from changes in atmospheric deposition chemistry. Nature 450, 537–540. doi: 10.1038/nature06316
Moore T. S., Campbell J. W., Feng H. (2001). A fuzzy logic classification scheme for selecting and blending satellite ocean colour algorithms. IEEE Trans. Geosci. Remote Sens. 39, 1764–1776. doi: 10.1109/36.942555
Nielsen S. L., Sand-Jensen K., Borum J., Geertz-Hansen O. (2002). Depth colonization of eelgrass (Zostera marina) and macroalgae as determined by water transparency in Danish coastal waters. Estuaries 25, 1025–1032. doi: 10.1007/BF02691349
Niskanen T., Vainio J., Eriksson P., Heiler I. (2009). Maximum extent of the Baltic sea ice recalculated for the period 1971–2008. Report Series in Geophysics No 61, Helsinki, University of Helsinki Department of Physics, 164.
Ojaveer E., Akadeemia E. T. (Eds.) (1995). Ecosystem of the Gulf of Riga between 1920 and 1990 (Tallinn: Estonian Academy Publishers). 277.
Opdal A. F., Andersen T., Hessen D. O., Lindemann C., Aksnes D. L. (2023). Tracking freshwater browning and coastal water darkening from boreal forests to the Arctic Ocean. Limnol Oceanogr. Lett. 8, 611–619. doi: 10.1002/lol2.10320
Pitarch J., van der Woerd H. J., Brewin R. J. W., Zielinski O. (2019a). Optical properties of Forel-Ule water types deduced from 15 years of global satellite ocean colour observations. Remote Sens. Environ. 231, 111249. doi: 10.1016/j.rse.2019.111249
Pitarch J., van der Woerd H. J., Brewin R. J. W., Zielinski O. (2019b). Twenty years of monthly global maps of Hue angle, Forel-Ule and Secchi disk depth, based on ESA-OC-CCI data, PANGAEA. doi: 10.1594/PANGAEA.904266
Preisendorfer R. W. (1986). Secchi disk science: visual optics of natural waters. Limnol. Oceanogr. 31, 909–926. doi: 10.4319/lo.1986.31.5.0909
Purina I., Labucis A., Barda I., Jurgensone I., Aigars J. (2018). Primary productivity in the Gulf of Riga (Baltic Sea) in relation to phytoplankton species and nutrient variability. Oceanologia 60, 544–552. doi: 10.1016/j.oceano.2018.04.005
R Core Team (2022) R: A language and environment for statistical computing. Available online at: https://www.R-project.org/.
Samariks V., Krisans O., Donis J., Silamikele I., Katrevics J., Jansons A. (2020). Cost–benefit analysis of measures to reduce windstorm impact in pure Norway spruce (Picea abies L. Karst.) stands in Latvia. Forests 11, 576. doi: 10.3390/f11050576
Seinä A., Palosuo E. (1993). Itämeren suurimpien vuotuisten jääteitteen laajuuksien luokittelu 1720 - 1992 : Risto Jurvan kokoaman aineiston vuosilta 1720–1951 ja Merentutkimuslaitoksen jääpalvelun aineiston vuosilta 1952–1992 mukaan (Helsinki: Merentutkimuslaitos). Available at: http://hdl.handle.net/10138/157392.
Soosaar E., Maljutenko I., Raudsepp U., Elken J. (2014). An investigation of anticyclonic circulation in the southern Gulf of Riga during the spring period. Continental Shelf Res. 78, 75–84. doi: 10.1016/j.csr.2014.02.009
Speetjens N. J., Tanski G., Martin V., Wagner J., Richter A., Hugelius G., et al. (2022). Dissolved organic matter characterization in soils and streams in a small coastal low-Arctic catchment. Biogeosciences 19, 3073–3097. doi: 10.5194/bg-19-3073-2022
Suursaar Ü., Kullas T., Aps R. (2012). Currents and waves in the northern Gulf of Riga: measurement and long-term hindcast**The study was supported by the Estonian target financed project 0104s08, the Estonian Science Foundation grant No 8980 and by the EstKliima project of the European Regional Fund programme No 3.2.0802.11–0043. Oceanologia 54, 421–447. doi: 10.5697/oc.54-3.421
The Bacc II Author Team (2015). Second Assessment of Climate Change for the Baltic Sea Basin (Cham: Springer International Publishing). doi: 10.1007/978–3-319–16006-1
Ule W. (1892). ““Die Bestimmung der Wasserfarbe in den Seen,”,” in Kleinere Mittheilungen, Dr. A. Petermanns Mittheilungen aus Justin Perthes Geographischer Anstalt (Justus Perthes, Gotha), 70–71.
Wang S., Lee Z., Shang S., Li J., Zhang B., Lin G. (2019). Deriving inherent optical properties from classical water colour measurements: Forel-Ule index and Secchi disk depth. Opt. Express 27, 7642. doi: 10.1364/OE.27.007642
Wernand M. R., Woerd H. J. V. D. (2010). Spectral analysis of the Forel-Ule ocean colour comparator scale. JEOS:RP 5, 10014s. doi: 10.2971/jeos.2010.10014s
Wernand M. R., Hommersom A., van der Woerd H. J. (2013a). MERIS-based ocean colour classification with the discrete Forel–Ule scale. Ocean Sci. 9, 477–487. doi: 10.5194/os-9-477-2013
Wernand M. R., van der Woerd H. J., Gieskes W. W. C. (2013b). Trends in ocean colour and chlorophyll concentration from 1889 to 2000, worldwide. PloS One 8, e63766. doi: 10.1371/journal.pone.0063766
Yang Y., Cheng S., Fang H., Guo Y., Li Y., Zhou Y., et al. (2023). Linkages between the molecular composition of dissolved organic matter and soil microbial community in a boreal forest during freeze–thaw cycles. Front. Microbiol. 13. doi: 10.3389/fmicb.2022.1012512
Keywords: water browning, light attenuation, coastal waters, Baltic Sea, water darkening
Citation: Aigars J, Suhareva N, Cepite-Frisfelde D, Kokorite I, Iital A, Skudra M and Viska M (2024) From green to brown: two decades of darkening coastal water in the Gulf of Riga, the Baltic Sea. Front. Mar. Sci. 11:1369537. doi: 10.3389/fmars.2024.1369537
Received: 12 January 2024; Accepted: 03 June 2024;
Published: 18 June 2024.
Edited by:
Andrew M. Fischer, University of Tasmania, AustraliaReviewed by:
Sofia Saraiva, University of Lisbon, PortugalZbigniew Otremba, Gdynia Maritime University, Poland
Copyright © 2024 Aigars, Suhareva, Cepite-Frisfelde, Kokorite, Iital, Skudra and Viska. This is an open-access article distributed under the terms of the Creative Commons Attribution License (CC BY). The use, distribution or reproduction in other forums is permitted, provided the original author(s) and the copyright owner(s) are credited and that the original publication in this journal is cited, in accordance with accepted academic practice. No use, distribution or reproduction is permitted which does not comply with these terms.
*Correspondence: Juris Aigars, anVyaXMuYWlnYXJzQGxoZWkubHY=