 Ruijie Zhang
 Junqiang Shen
 Li Li*
- Fujian Provincial Key Laboratory of Marine Physical and Geological Processes, Third Institute of Oceanography, Ministry of Natural Resources, Xiamen, China
Spatiotemporal variation of storm surges in the Taiwan Strait (TWS) is studied using water level datasets from 14 tidal gauge stations located in the TWS from summer to fall of 2016. The effects of bathymetry on storm surges and tropical cyclone (TC)-induced continental shelf wave (CSW) are explored. By comparing water level response along the east coast of TWS, it is found that storm surges are asymmetric on the north and south sides of the Zhan-Yun Ridge (ZYR), regardless of the different categories and tracks of TCs passing by. Observations indicate that the ZYR could modulate the storm surges and the CSW propagation; ZYR can not only amplify the storm surges that generally peak around the ZYR, but also block the CSW propagation by dramatically dissipating its kinetic energy as revealed by the dispersion relation for the first mode CSW. Moreover, local wind work and the remote forcing, which are induced by TCs and cold fronts, respectively, can also modulate the synoptic variations of water level in the TWS.
1 Introduction
Storm surge is the dramatic rise and fall of sea surface height caused by abnormal atmospheric disturbances, including the wind stress and atmospheric pressure at sea surface associated with tropical cyclones (TCs) and extratropical cyclones or cold fronts. They have potentially devastating effects, which are the most serious marine disasters in coastal areas of China, causing tens of billions of economic losses on average every year (You, 2016). Note that, combined with the projected accelerating sea level rise in the warmer future (Church et al., 2013), TC-induced storm surges are expected to further exacerbate flood risks to various coastal regions (Mori et al., 2021).
There are many studies in the literature on storm surges off the coast of China. Tang et al. (2011) reported that there were 270 storm surge events exceeding 1 m, 48 storm surge events exceeding 2 m, and 15 storm surge events exceeding 3 m along the coast of China during the 50 years between 1949 and 1998. The highest storm surge level was observed at Nandu Tide Gauge at Guangdong province during the passage of Typhoon No. 8007 in July 1980, which exceeded 5.94 m (Liu and Wang, 1989; Zhang, 2009). Moreover, utilizing the numerical simulation (Jelesnianski, 1966; Qin et al., 1994; Shen and Gong, 2009; Rego and Li, 2010; Zhang et al., 2010; Liu and Huang, 2020), the contribution factors of storm surge can be quantified. For instance, it has been suggested that the wave setup and the nonlinear effects due to tide–surge coupling contribute up to 6%–35% and 70% to the total storm surge, respectively (Kim et al., 2008; Rego and Li, 2010; Liu and Huang, 2020). However, it is important to note that the local effects on the dynamics of storm surges are significant, including the width of continental shelf, bathymetry, and non-linear shallow water effects (Wolf, 1981; Pugh, 1987; Horsburgh and Wilson, 2007; Poulose et al., 2018).
It is worth noting that the abnormal atmospheric disturbances can not only generate the surges, but also induce the continental shelf waves (CSWs), both of which resulted from wind-induced Ekman transport (Gill and Schumann, 1974; Brink, 1991; Shen and Gong, 2009), and contributing to the synoptic variations of water level in the coastal region. It is well known that the propagation of CSWs is modulated by the bathymetry, while the shelf width and the seabed slope are the most important factors (Schumann and Brink, 1990; Yin et al., 2018). Moreover, CSWs can interact with the periodic local wind forcing during propagation, increasing amplitude and then forming the forced CSWs.
The Taiwan Strait (TWS) lies between Chinese mainland (west) and the Taiwan region (TWI; east) (Figure 1A), which suffers from storm surges frequently (Wu et al., 2017; Zhang et al., 2020). The TWS is approximately 175 km wide, 350 km long, and, on average, 50 m deep (between 23°N and 25°N) (Oey et al., 2014). The bathymetry is generally deeper on the west side of the strait, but is rather complicated. There is a deep submarine valley [the Penghu Channel (PHCh)] in the southwest of the TWI, which extends northward onto a ridge [the Zhan-Yun Ridge (ZYR)], approximately outlined by the 40-m isobath. Across the shelf break in the south, the bathymetry slopes steeply to a depth of 2,000–3,000 m into the South China Sea (SCS).
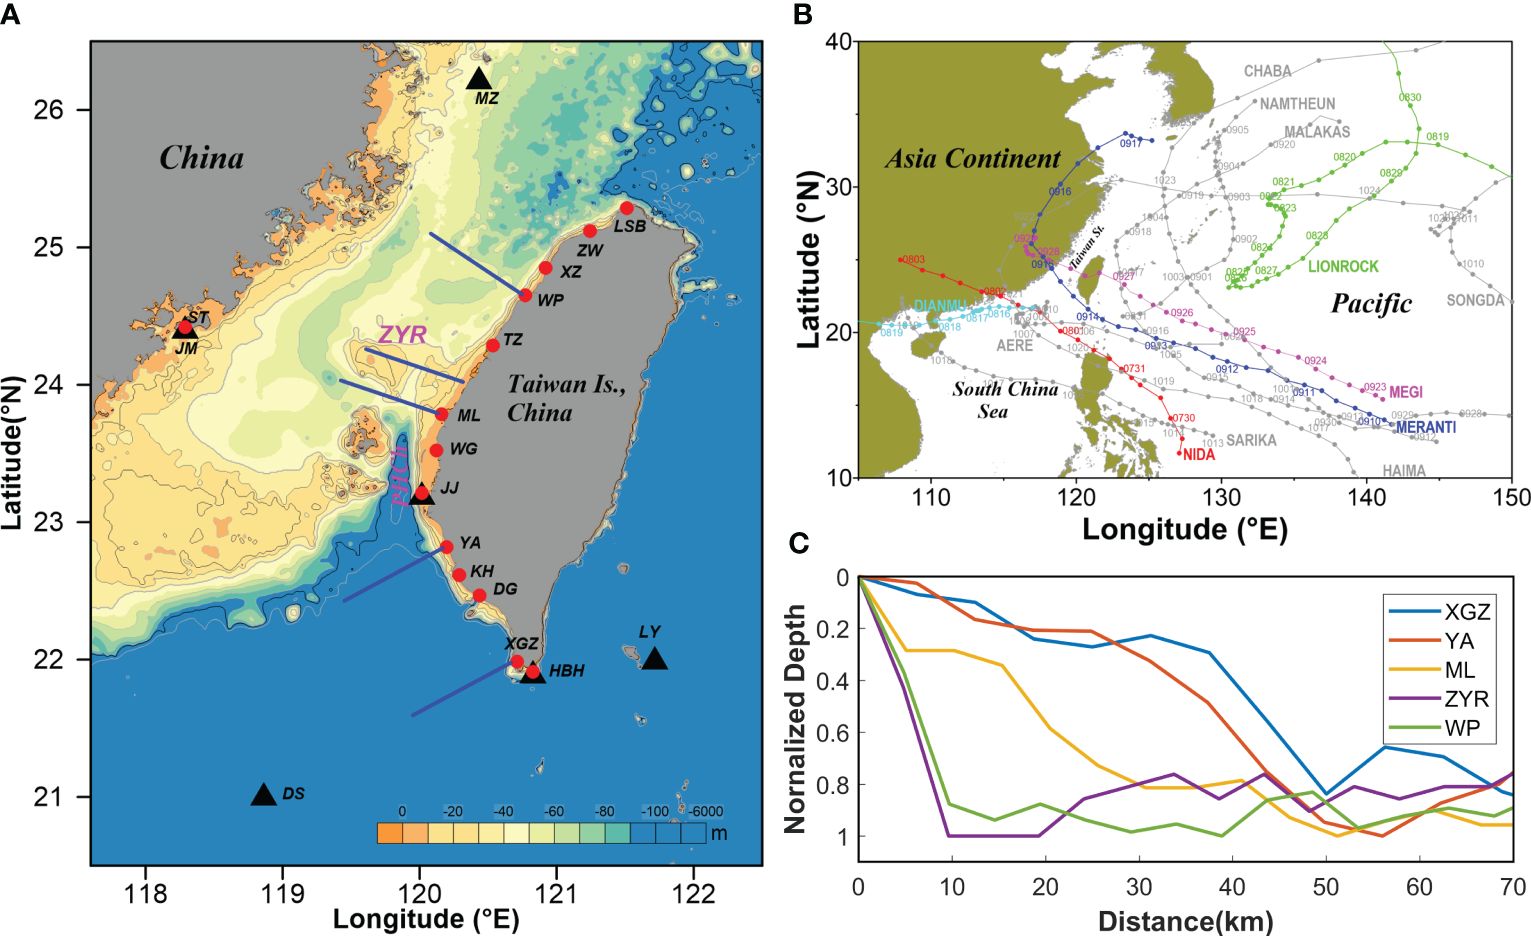
Figure 1 The geographic map and the domain of concern. (A) Fourteen tide-gauge stations and six meteorological buoys are depicted by red cycles and black triangles, respectively; the five blue lines off the east coast of Taiwan Island, China, indicate the cross-shelf transects where the dispersion relationship for the first-mode CSW is calculated. The major geographic locations labeled are Linshanbi (LSB), Zuwei (ZW), Xinzu (XZ), Waipu (WP), Taichung (TZ), Mailiao (ML), Wengang (WG), Jianjun (JJ), Yong-an (YA), Kaohsiung (KH), Donggang (DG), Xunguangzui (XGZ), Houbihu (HBH), Shuitou (ST), Mazu (MZ), Jinmen (JM), Lanyu (LY), Dongsha (DS), Zhan-Yun Ridge (ZYR), and Penghu Channel (PHCh). (B) The tracks of tropical cyclones in the Northwest Pacific Ocean in 2016; five passing tropical cyclones (i.e., Nida, Dianmu, Lionrock, Megi, and Meranti) are denoted with solid and colored circles. (C) The normalized depth profiles for five cross-shelf transects as shown in panel A; the normalized parameters (i.e., maximum depth) for sections of XGZ, YA, ML, ZYR, and WP are 3,104, 844, 70, 21, and 65 m, respectively; solid-colored circles indicate the position of the edge of the shelf at a depth of 200 m.
During summertime and fall from April to November, the shallow coastal waters of the TWI suffer from frequent TCs (approximately six to eight typhoons) generated in the western Pacific Ocean. The surge disasters brought by TCs cause a huge loss of humanity and property on both sides of the TWS. The complex geography of the TWI makes it a great challenge to accurately forecast the typhoon path, as well as the resulting storm surges and disasters. Previous studies have focused on the TWI to investigate the bathymetry’s effects on track deflection and strength variation of typhoons, as well as rainfall asymmetry (Xie and Zhang, 2012; Wang et al., 2013). The mountainous topography of the TWI causes partial decay of storm winds and influences surge wave propagation and surge heights in the waters around the TWI (Yang et al., 2021). In addition, along the southwest coast of the TWI with low ground elevation and gentler bathymetric slope, major flooding often occurs due to storm surge during the transit of TCs. Along the rocky northeast coast of the TWI where the bathymetric slope is steep, waves often break very close to the coastline and contribute significantly to the storm surge (Sheng et al., 2018). Although frequent storm surges are observed in the TWS, little attention has been paid to local bathymetric characteristics and their relevant effects on storm surges.
Based on observation from tidal gauges deployed on both sides of the TWS, the frequent storm surges in the region are studied. The analysis illustrates the asymmetric response of water level to storm surges on the eastern coast of the TWS, and it is found that the ZYR is the main reason for this asymmetry. Additionally, the effect of bathymetry on modulating the properties of the storm-induced CSWs is further discussed.
2 Synoptic systems and datasets
2.1 Tropical cyclones and cold front
During the investigated period from July to November, there were 12 named TCs that occurred in the Northwestern Pacific that affected the TWS (Figure 1B), of which 5 quasi-continuous TCs, namely, Nida, Dianmu, Lionrock, Megi, and Meranti, are selected to study the TC-generated storm surges. The information about these TCs, obtained from the Regional Specialized Meteorological Center (http://www.jma.go.jp/jma/index.html), is shown in Table 1. These TCs influenced the TWS from different directions. According to the track, those TCs can be divided into three types, that is, Nida, Dianmu, and Meranti from the south of the strait; Lionrock from the north; and Megi from the center (Figure 1 and Table 1). Dianmu is a severe tropical storm, Nida and Megi are classified as typhoons, while Lionrock and Meranti are super typhoons (Table 1). Meranti is regarded as the most powerful storm in 2016, which severely damaged Chinese mainland, causing a direct economic loss of 10.2 billion yuan and leaving 30 deaths and 18 missing. Lionrock caused the largest ever flooding of the Tumen River in North Korea, killing 138 people and leaving more than 400 missing. Although Lionrock did not enter the coastal waters of China, the TWS also experienced storm surges due to its huge volume and strong external wind fields.
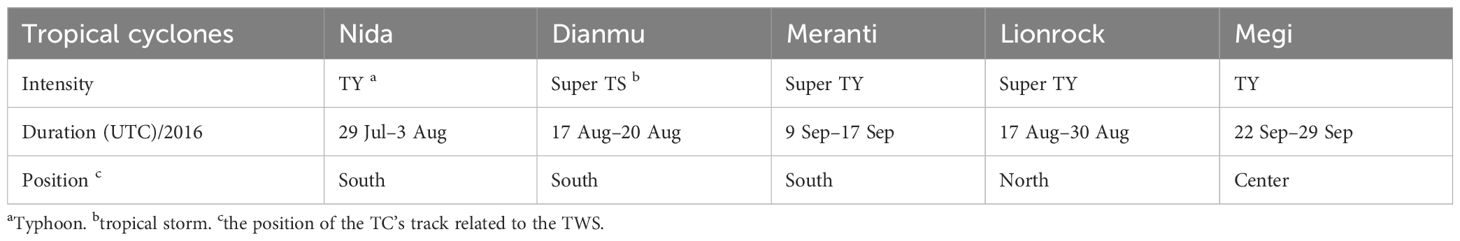
Table 1 Detailed information of the five TCs passing by.
In addition, extratropical cyclones and their accompanying cold fronts would affect the southeast coast of China in deep fall, which also induced water level variations in the TWS.
2.2 Datasets
Tidal gauge data at 14 coastal stations in the TWS (Figure 1A, solid red circles) are obtained from the website of the Central Weather Bureau of Taiwan (http://www.cwb.gov.tw). The data cover the period from 25 July to 2 November 2016, with a temporal resolution of 1 h. A PL33 digital symmetric filter with a cutoff period of 33 h (Alessi et al., 1985) is used to remove the tidal component of the tidal gauge dataset. Then, the mean water level is removed from the detided time series to obtain the water level anomalies. Spectrum analysis shows that the predominant period of the water level anomalies is located within the range of 64–128 h, which is associated with the duration of the synoptic systems passing over the region (not shown). Moreover, the subtidal energy peaks in the center of the TWS (i.e., TZ) are higher than those at the northern and southern parts (LSB and XGZ, not shown).
In situ wind speed was observed by six meteorological buoys (Figure 1A, solid black triangles), of which the data with a time interval of 1 h from 25 July to 25 September 2016 are used to depict the wind field during the passage of those TCs. The daily sea surface height (SSH) with 1/12 horizontal resolution supplied by the Hybrid Coordinate Ocean Model (HYCOM) is also used to diagnose the background dynamic during the transit of cold fronts. The bathymetry used in this study is ETOPO1 from the National Geophysical Data Center (http://www.ncei.noaa.gov/products/etopo-global-relief-model).
3 Results
3.1 TC-induced storm surges during five quasi-continuous TC events
As shown in Figure 2, different storm surges emerged along the eastern coast of the TWS during the transit of TCs. In most cases, the water level peaked at the stations in the central TWS, such as TZ and ML. Moreover, water level response to different TCs at the northern and southern parts of the strait exhibits great discrepancy. For instance, during the transit of Dianmu, there was minimal water level variation in the northern part of the TWS. In contrast, insignificant water level change in the southern part of the TWS was caused by the passage of Lionrock (a similar process can be found during the transit of cold fronts in fall). The transit of Megi induced single and double peaks in water level in the northern and southern parts of the TWS, respectively.
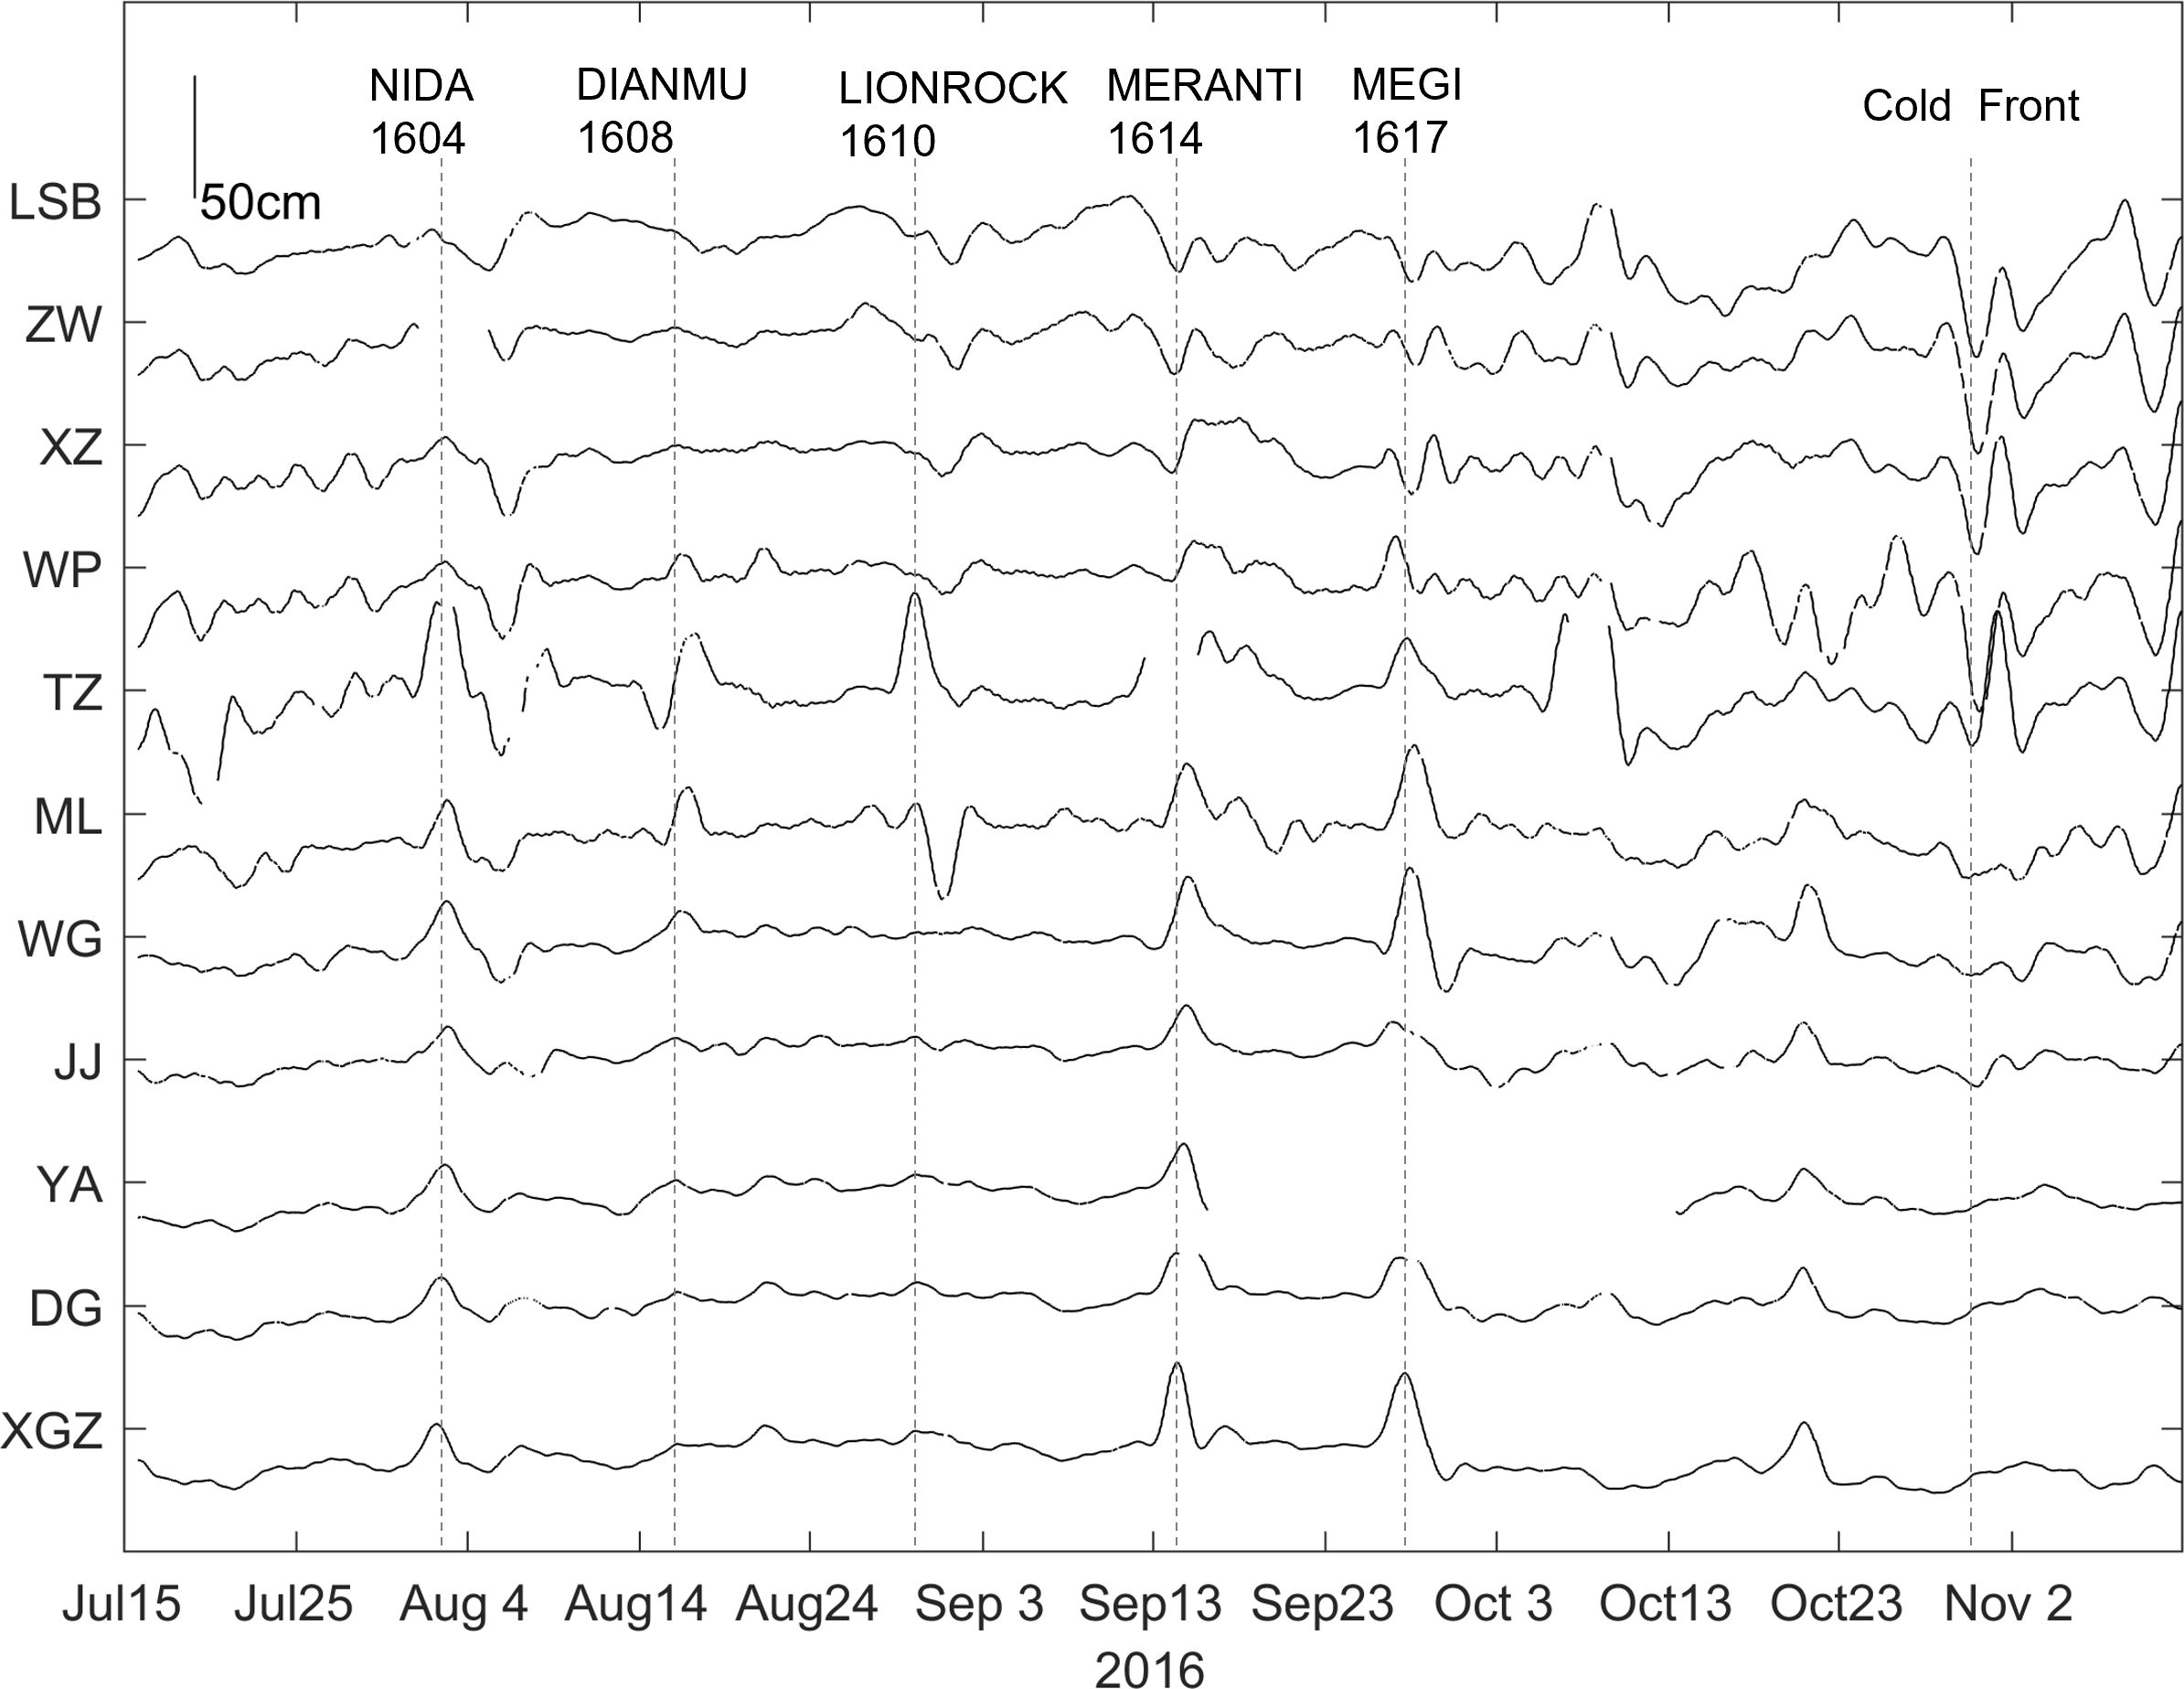
Figure 2 Time series of detided water level (low-pass filtered with a cutoff period of 33 h) for tidal gauge stations located along the eastern coast of the TWS. The transit times of five quasi-continuous TC events and a cold front are indicated by dotted lines.
The storm surge variations are very sensitive to TC tracks, which can be greatly affected by changes in background wind field. In this subsection, we divide these TC events into three categories depending on the tracks of the TCs relative to the TWS. Those TC-induced storm surges are depicted in the following.
3.1.1 TC transits from the south of the TWS
Figure 3A illustrates the water level response to typhoon Nida at each station along the eastern coast of the TWS. Storm surges were observed at all stations south of XZ, with varying peaks. The most significant surges appeared at stations around the ZYR (e.g., TZ, ML, and WG) while they peaked at TZ (~20 cm), indicating the amplification effect of the sand ridge. North of Taichung (i.e., TZ), surges at WP and XZ were lower than those at stations in the southern part, while no water level variation can be found in the two stations further north, ZW and LSB.
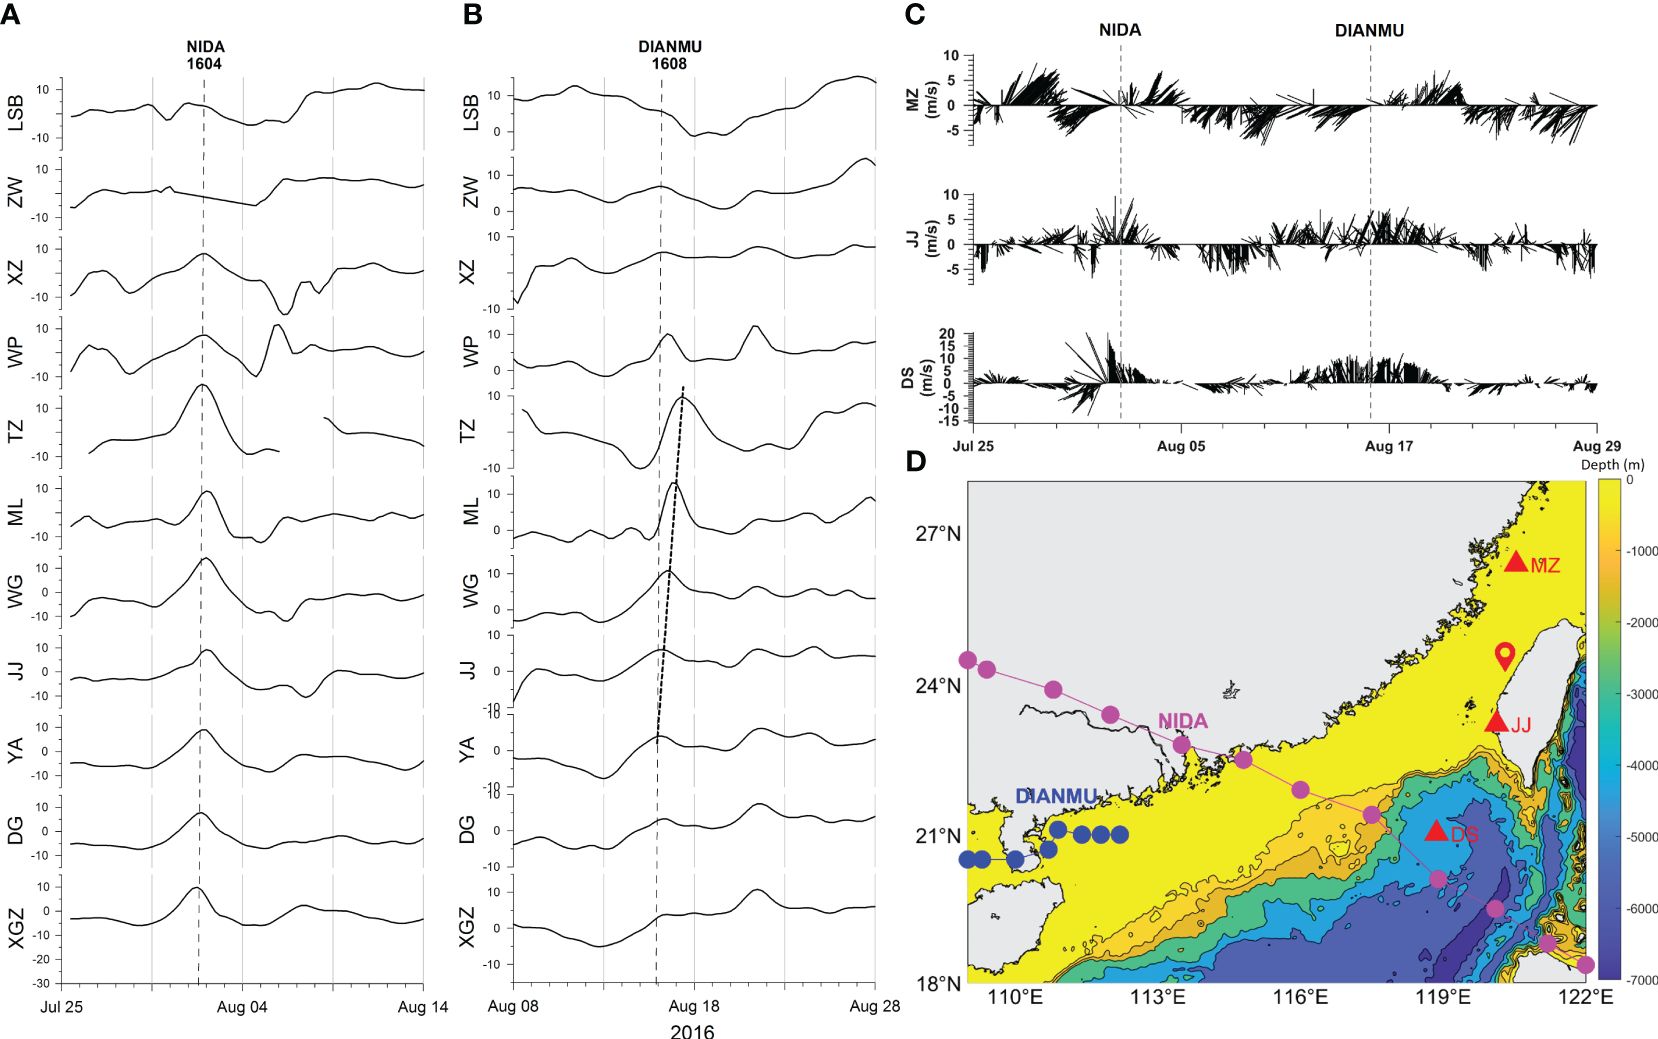
Figure 3 Time series of detided water level (cm) for tidal gauge stations during the transits of Nida (A) and Dianmu (B). (C) Time series of hourly wind vector observed at meteorological buoys. (D) The tracks of tropical cyclones Nida (purple circles) and Dianmu (blue circles) and the locations of meteorological buoys (red triangles). The location of ZYR is indicated by red pinpoint. Also shown are the times when the tropical cyclones hit the coast of Taiwan Island (thin vertical gray dashed lines in panels (A–C) and the CSW propagating along the eastern TWS [black dashed line in panel (B)].
Except for the spatial variation of surges, times for the peaks of surge at each station also differ. For instance, the time for surge peak at YA and stations located in the southern region appeared almost simultaneously, earlier than stations ML, WG, and JJ (which also peaked at the same time). Note that the southwest coast of the TWI has an obvious turning point at 23°N, which shows a NW–SE trend to the south and a NNE–SSW trend to the north. During the transit of Nida, the southeast wind first influenced the TWS (refer to Figure 3C for wind vectors at JJ), and the Ekman setup appeared on the coast south of 23°N. In the northern part, the Ekman setup was offshore and did not cause storm surges. When Nida moved further west, the southwest wind dominated the TWS (refer to Figure 3C for wind vectors at JJ), benefiting the Ekman setup along the eastern coast of the TWS. This resulted in a time delay before the appearance of peak water level in the center of the TWS. Interestingly, the peak of storm surge at TZ and two stations further north (i.e., WP and XZ) also appeared earlier than the stations (such as the ML and WG) in the center of the TWS. Before Nida entered the SCS, the southern East China Sea and the TWS were dominated by northeast wind (refer to Figure 3C for wind vectors at MZ and JJ). The water from the East China Sea flowing into the strait driven by wind was blocked by the ZYR, resulting in the water level setup on its northern side; at this time, the wind direction did not facilitate the Ekman setup along the eastern coast of the TWS. Thus, the surge emerged earlier in the northern part than in the center region. The surge reached its peak at TZ, which may have resulted from the combined effect of the water level setup around the ZYR.
Overall, an obvious spatiotemporal discrepancy can be found in the water level along the eastern coast of the TWS in response to typhoon Nida that transited from the south of the TWS. The response was asymmetric in the north and south of the ZYR. In the southern region, the coastline can be further divided into the center and south sections. Before Nida entered the SCS, northeast winds drove water from the southern part of the East China Sea into the strait, causing water level to rise along the northern coastline. However, the response was limited to the stations around the ZYR. Surges along central and southern coastline emerged after Nida entered the SCS, which mainly manifested as the Ekman setup. The varying directions of the coastline results in the different times for peak of storm surges. The surges first appeared in the southern coastline and then in the central region. There was no clear wave propagation signal; the above water level fluctuations were basically the forced response to Nida.
On the other hand, it can be seen from Figure 3B that the water level variation on the eastern coast of the TWS in response to super tropical storm Dianmu was limited to the south of TZ, while there was no response in the central and the northern region, indicating that the ZYR has an obvious blocking effect. The surge in the eastern TWS along the southern coastline emerged before Dianmu turned into a super tropical storm in the SCS. The surges gradually increased from south to north while reaching nearly 20 cm at TZ in the northern ZYR. The relevant peak signals propagated from south to north, and passed through YA and TZ, respectively. Considering that the distance between the two stations (i.e., YA and TZ) is approximately 170 km, and the peak signal lag was approximately 32 h, the corresponding group speed of the propagating waves was nearly 1.5 m/s, which was consistent with the group speed of the first-mode CSW (1.2–2.1 m/s) suggested by Shen et al. (2021).
Nida and Dianmu passed from the south of the TWS without entering the waters of the TWS. In contrast, the super typhoon Meranti hit the TWS directly from the south region. The intense southeast wind (refer to Figure 4B for wind vectors at LY) drove the dramatic surges (with a sharp peak water level of approximately 40 cm) at stations XGZ and HBH at the southern tip of the TWI. The surge is visible along the eastern coast of the TWS and shows signs of northward propagation, while the amplitude varies from station to station. Apart from the maximum surges (characterized by a sharp peak) observed at the southern tip of the TWI, the surges at stations (ML and TZ) around the ZYR were still quite distinguishable. Furthermore, the high water level at stations north of the ZYR (e.g., TZ, WP, and XZ) was maintained for several days, forming a wide peak.
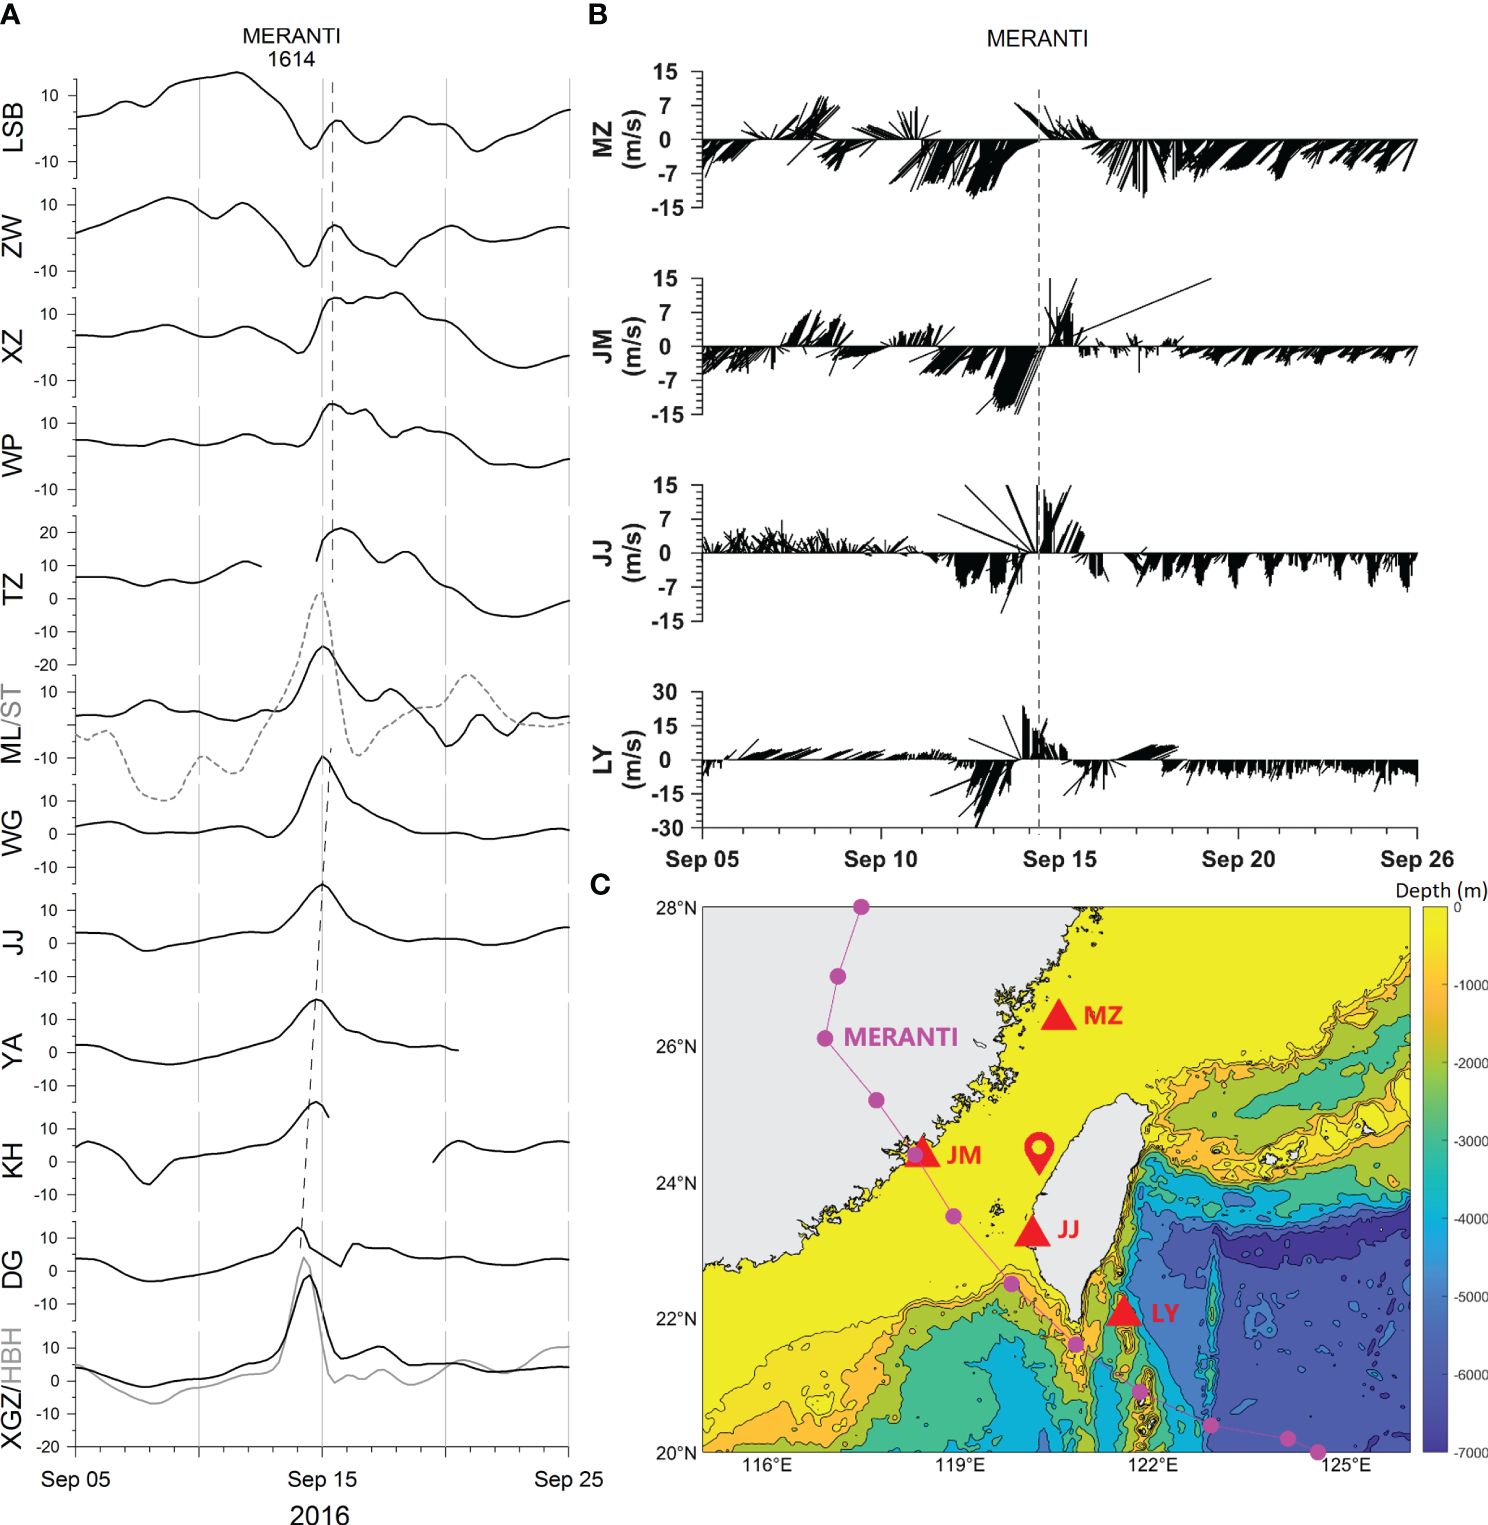
Figure 4 As in Figure 3, but for super typhoon Meranti. (A) Time series of detided water level (cm) for tidal-gauge stations during the transits of super typhoon Meranti. (B) Time series of hourly wind vector observed at meteorological buoys. (C) The track of Meranti (purple circles) and the locations of meteorological buoys (red triangles). The location of ZYR is indicated by red pinpoint. Also shown are the time when the Meranti hits the coast of Taiwan Island (thin vertical gray dash lines in panels A and B) and the CSW propagating along the eastern TWS (black dash line in panel A).
The above observations during the super typhoon Meranti indicate that, firstly, the water level rose near the coast of the southern tip of the TWI caused by the strong southeasterly winds after the typhoon entered the SCS, while it fell dramatically and formed a sharp peak as the typhoon moved further north and the wind direction changed to southwest (Figures 4A, B); secondly, the surge showed a northward-propagating trend, while it was amplified around the ZYR, which should be related to the effect of the ZYR; thirdly, the southwesterly winds (refer to Figure 4B for wind vectors at JJ) dominated the northern part of the west coastline (excluding the northern tip, refer to Figure 4B for wind vectors at MZ), maintaining the storm surges and forming a wide peak.
Figure 5 depicts more details about the northward-propagating waves (indicated by the black dotted line). The water level peaked in the southern tip of the TWI (21.9°N, the open sea of station XGZ) on the morning of 14 September (6:00 a.m.) while it reached the northern tip (25.3°N, near the station LSB) at midnight on 16 September (0:00). The coastline between the two sites is approximately 464 km long, and the group velocity of the propagating waves is estimated to be approximately 3.1 m/s, which was in accordance with the group speed of 3 m/s proposed by Shen et al. (2021) based on a 20-day wavelet analysis during the transit of Meranti.
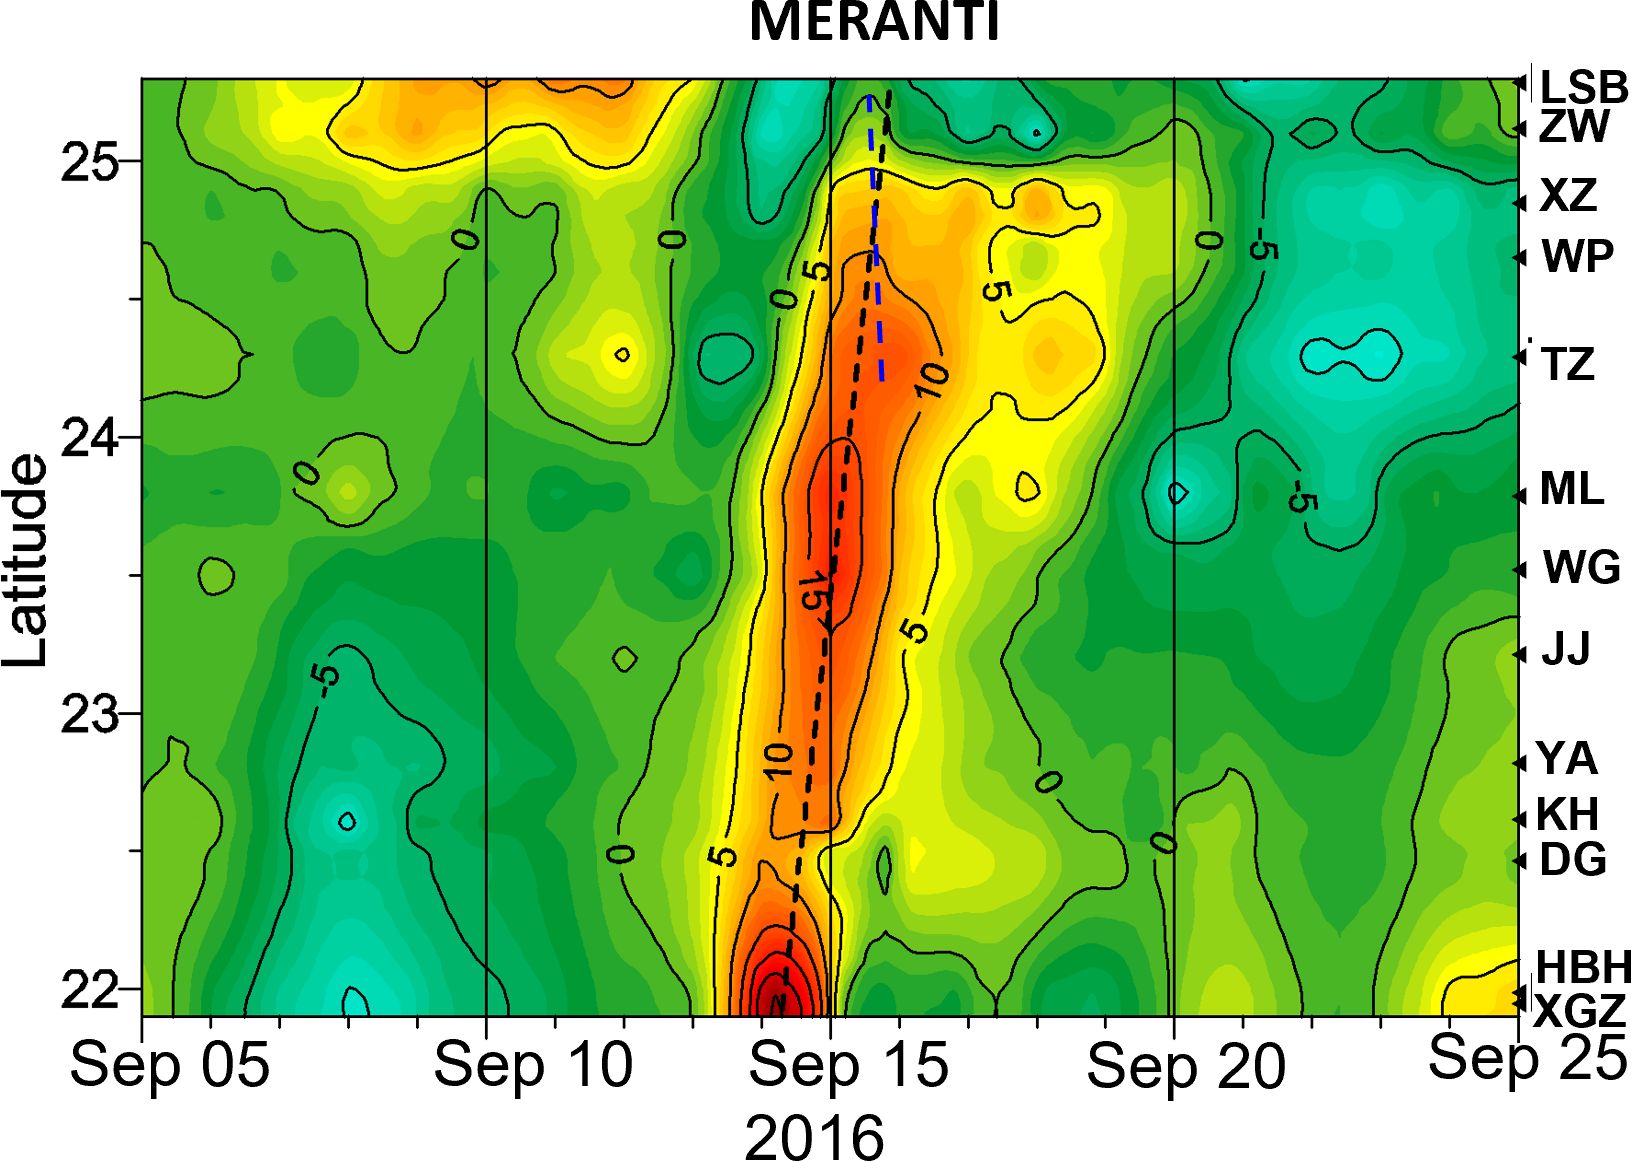
Figure 5 The space–time evolution of detided water level along the eastern TWS during the passage of Meranti. The figure also shows the times of CSW propagation along the eastern TWS (black dashed line) and the time of the peaks of water level (blue dashed line) at those tide-gauge stations (i.e., TZ, WP, XZ, ZW, and LSB) in the north of ZYR.
It is important to note that the observed surge has a maximum of 40 cm at the southern tip of the TWI (i.e., HBH and XGZ). However, the peak of storm surges appeared earlier in DG than in XGZ and HBH, while the times of the peak were synchronous at stations north of TZ (the blue dashed line in Figure 5). Accordingly, the water level on the eastern coast of the TWS response to Meranti can be categorized into three types.
Firstly, the narrow coastline from DG to ML shows an arc shape with an almost straight 50-m isobath (Figure 1). The surges gradually increased during their northward propagation, reaching approximately 30 cm at station ML (around the ZYR), indicating the amplification effect of the sand ridge on surge. The coastline between the two stations is approximately 180 km long; considering the time of the peak signals at ML lagged DG by 1 day, the wave had a group speed of approximately 2.1 m/s, which was similar to that suggested by Shen et al. (2021) and exhibited CSW characteristics.
Secondly, in the region north of ZYR, the storm surge peaked simultaneously at stations TZ and LSB with no visible propagation between them (the blue dotted line in Figure 5). This suggests that the surges north of ZYR were more likely to be the eastward Ekman transport driven by the southwesterly winds (refer to wind vectors at JJ around 15 September in Figure 4B) after the typhoon entered the TWS, rather than a northward-propagating CSW.
Thirdly, the surges at the southern tip of the TWI in XGZ and HBH lagged that in DG, but led that in the further north station JJ, indicating a unique surge mechanism. As Meranti transited close to the southern tip of the TWI, the wind field did not favor the surges before it passed. After Meranti passed Bashi Strait, XGZ and HBH were dominated by southwesterly winds (refer to wind vectors at LY in Figure 4B); this perpendicular onshore wind did not facilitate the local Ekman setup, which may be the underlying reason for the relatively delayed surges at XGZ and HBH.
3.1.2 TC transits from the north of the TWS
Figure 6A illustrates the time series of the detided water level in the TWS (the dotted line represents station ST at the western TWS) when the super typhoon Lionrock transited from the north of the TWS (Figure 6C). The water level response to Lionrock is almost invisible at the stations south of ML, while it is significant at TZ and ML. The water level at TZ soared by more than 30 cm, peaking on the morning of 30 August (which lagged ST for about half a day) and then declining rapidly. The surge was not observed at ML during the same period, while a negative pulse of approximately 20 cm appeared on 31 August. Lionrock did not induce surges at stations north of TZ. Water levels between stations WP and LSB rose slowly before its passage, fell after 28 August, and rose again on 1 September, forming a trough (Figure 6A).
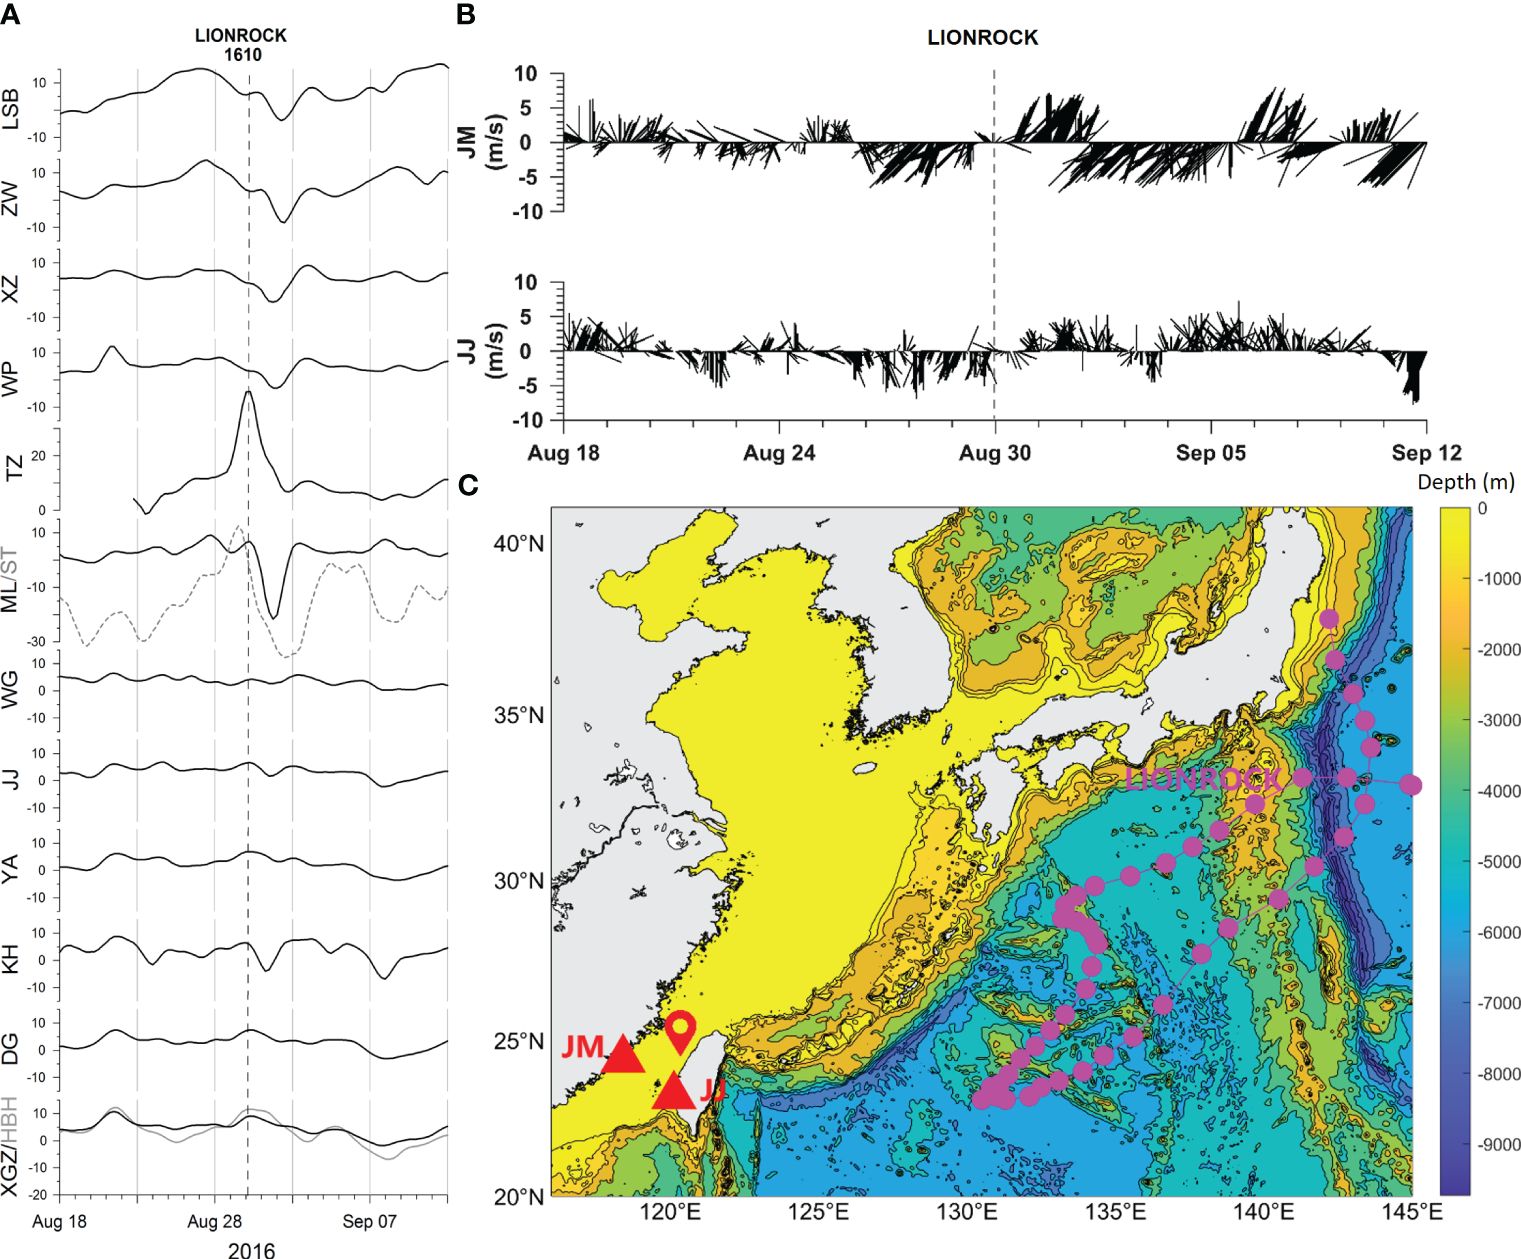
Figure 6 As in Figure 3, but for super typhoon Lionrock. (A) Time series of detided water level (cm) for tidal-gauge stations during the transits of super typhoon Lionrock. (B) Time series of hourly wind vector observed at meteorological buoys. (C) The track of Lionrock (purple circles) and the locations of meteorological buoys (red triangles). The location of ZYR is indicated by red pinpoint. Also shown is the time when the storm surges emerged along the coast of Taiwan Island (thin vertical gray dash lines in panels A, B).
The above-mentioned water level variations can be divided into northern, central, and southern categories according to their position relative to the ZYR, indicating that ZYR plays an important role in modulating the water level response to Lionrock. Although northeasterly winds (JM and JJ in Figure 6B) triggered by Lionrock can result in a uniform Ekman setup at the western TWS (e.g., ST), due to the blocking effect of the ZYR, the water level response can be completely different from north to south along the eastern coast of the TWS.
3.1.3 TC crosses the central part of the TWS
In contrast to the tracks of the above-mentioned TCs, typhoon Megi passed through the TWI in the center (Figure 7C), resulting in a unique water level response in the TWS. The most pronounced response also appeared around the ZYR (with a maximum surge of over 30 cm at ML) and had only one peak; in contrast, the other stations show almost double peaks before and after Megi’s landfall (Figure 7A).
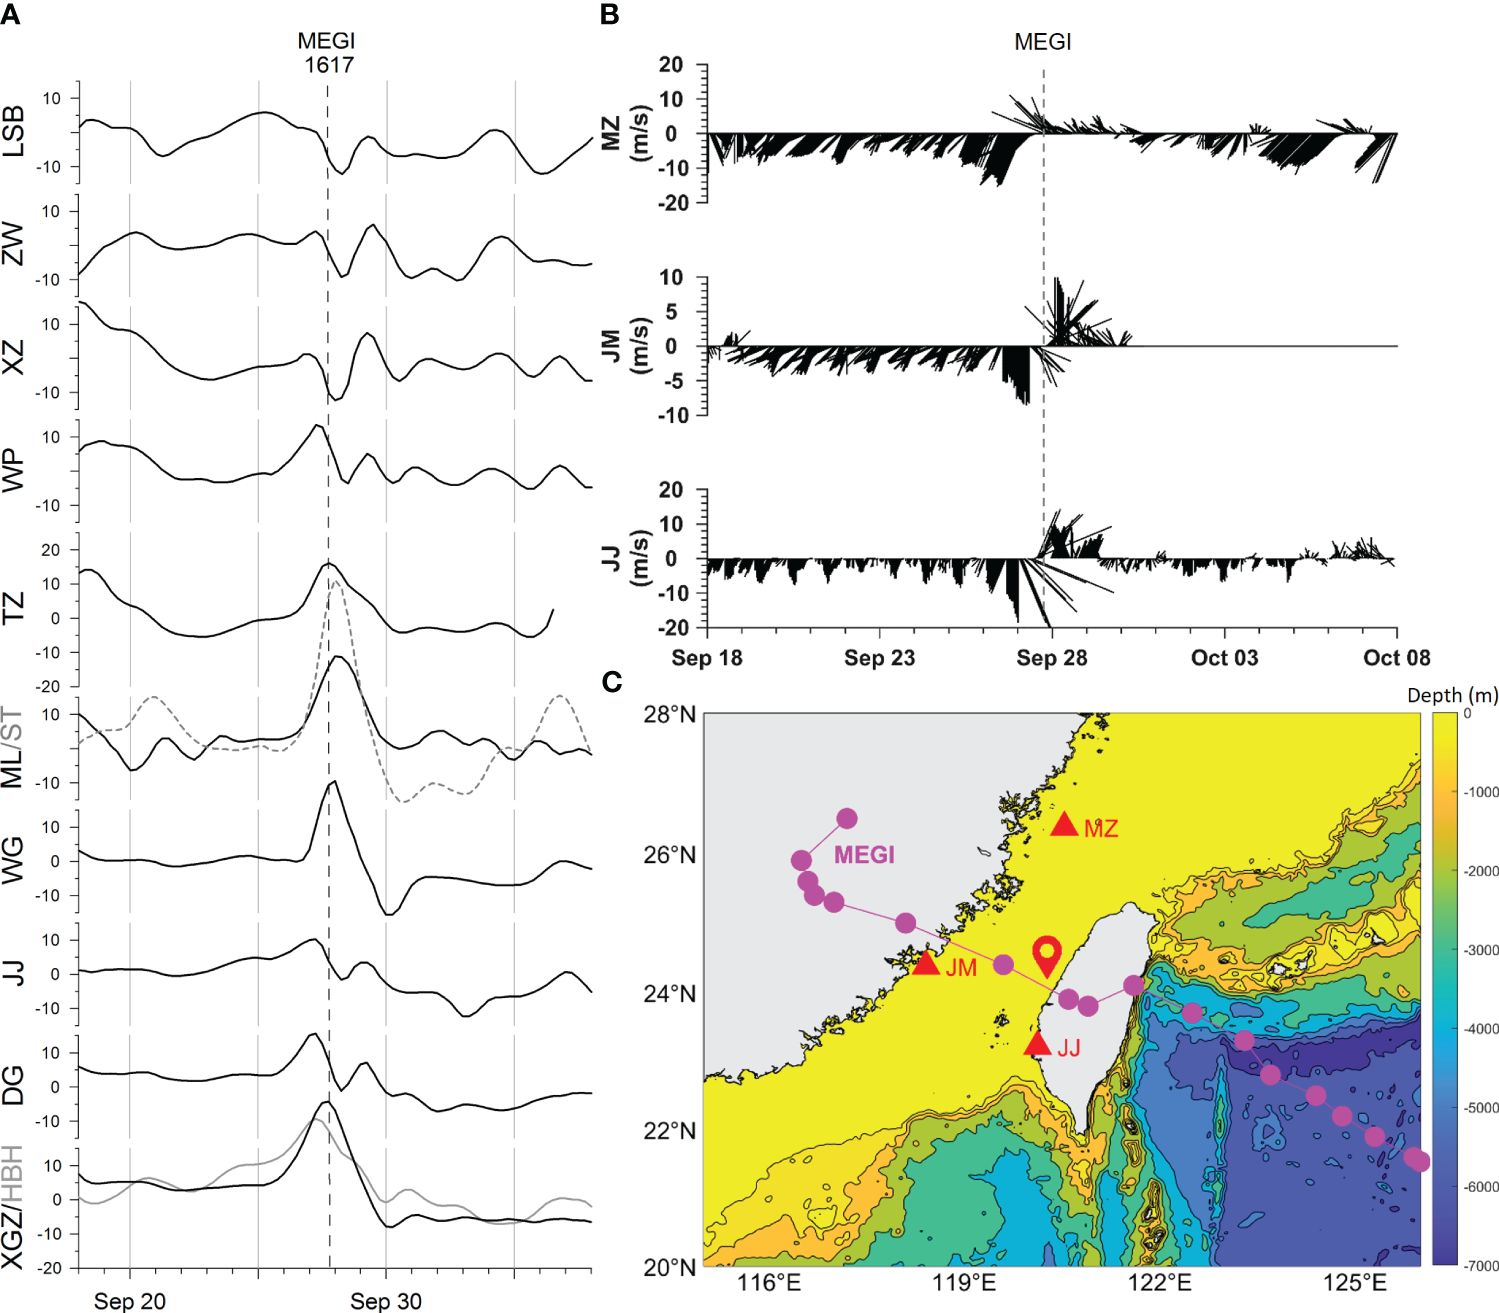
Figure 7 As in Figure 3, but for typhoon Megi. (A) Time series of detided water level (cm) for tidal-gauge stations during the transits of typhoon Megi. (B) Time series of hourly wind vector observed at meteorological buoys. (C) The track of Megi (purple circles) and the locations of meteorological buoys (red triangles). The location of ZYR is indicated by red pinpoint. Also shown is the time when the Megi hits the coast of Taiwan Island (thin vertical gray dash lines in panels A, B).
Northeasterly winds persisted in the East China Sea before Megi made landfall and intensified after its landing (refer to wind vectors at MZ in Figure 7B), causing water from the East China Sea to flow into the TWS and inducing the water level setup. When the typhoon moved further west into the TWS, the northeasterly wind soared, leading to a dramatic westward Ekman transport (refer to the water level at ST located on the western TWS, Figure 7A). As a result, the water level decreased rapidly along the eastern coast of the TWS, forming the first peak. As Megi moved further west and landed on Chinese mainland, the strong southwesterly winds (JJ and JM, Figure 7B) drove eastward Ekman transport, forming the second peak.
When the typhoon crossed the center of the TWS, the distinctive double-peak response can be found in the water level in both the northern and southern part of the eastern TWS. Although water level response to Megi was basically uniform in the north and south of ZYR, the response was still unique around the sand ridge, reflecting the significant effect of bathymetry on spatiotemporal variations of storm surges in the region.
3.2 Water level variation during a cold front
On 29 October 2016, a cold front transited the TWS in deep autumn, accompanied by strong northeasterly winds (the red thin line in Figure 8B), which then weakened on 31 October. As a result, the water level at the western TWS (e.g., ST) began to rise on 29 October, reached its peak on 30 October, and started to decrease on the same day before reaching trough on 31 October (Figure 8A). Water level at the western TWS was basically consistent with the transit of the cold front, while forced Ekman setup fluctuations can be found in both the Yellow Sea and the East China Sea (Figures 8B, C).
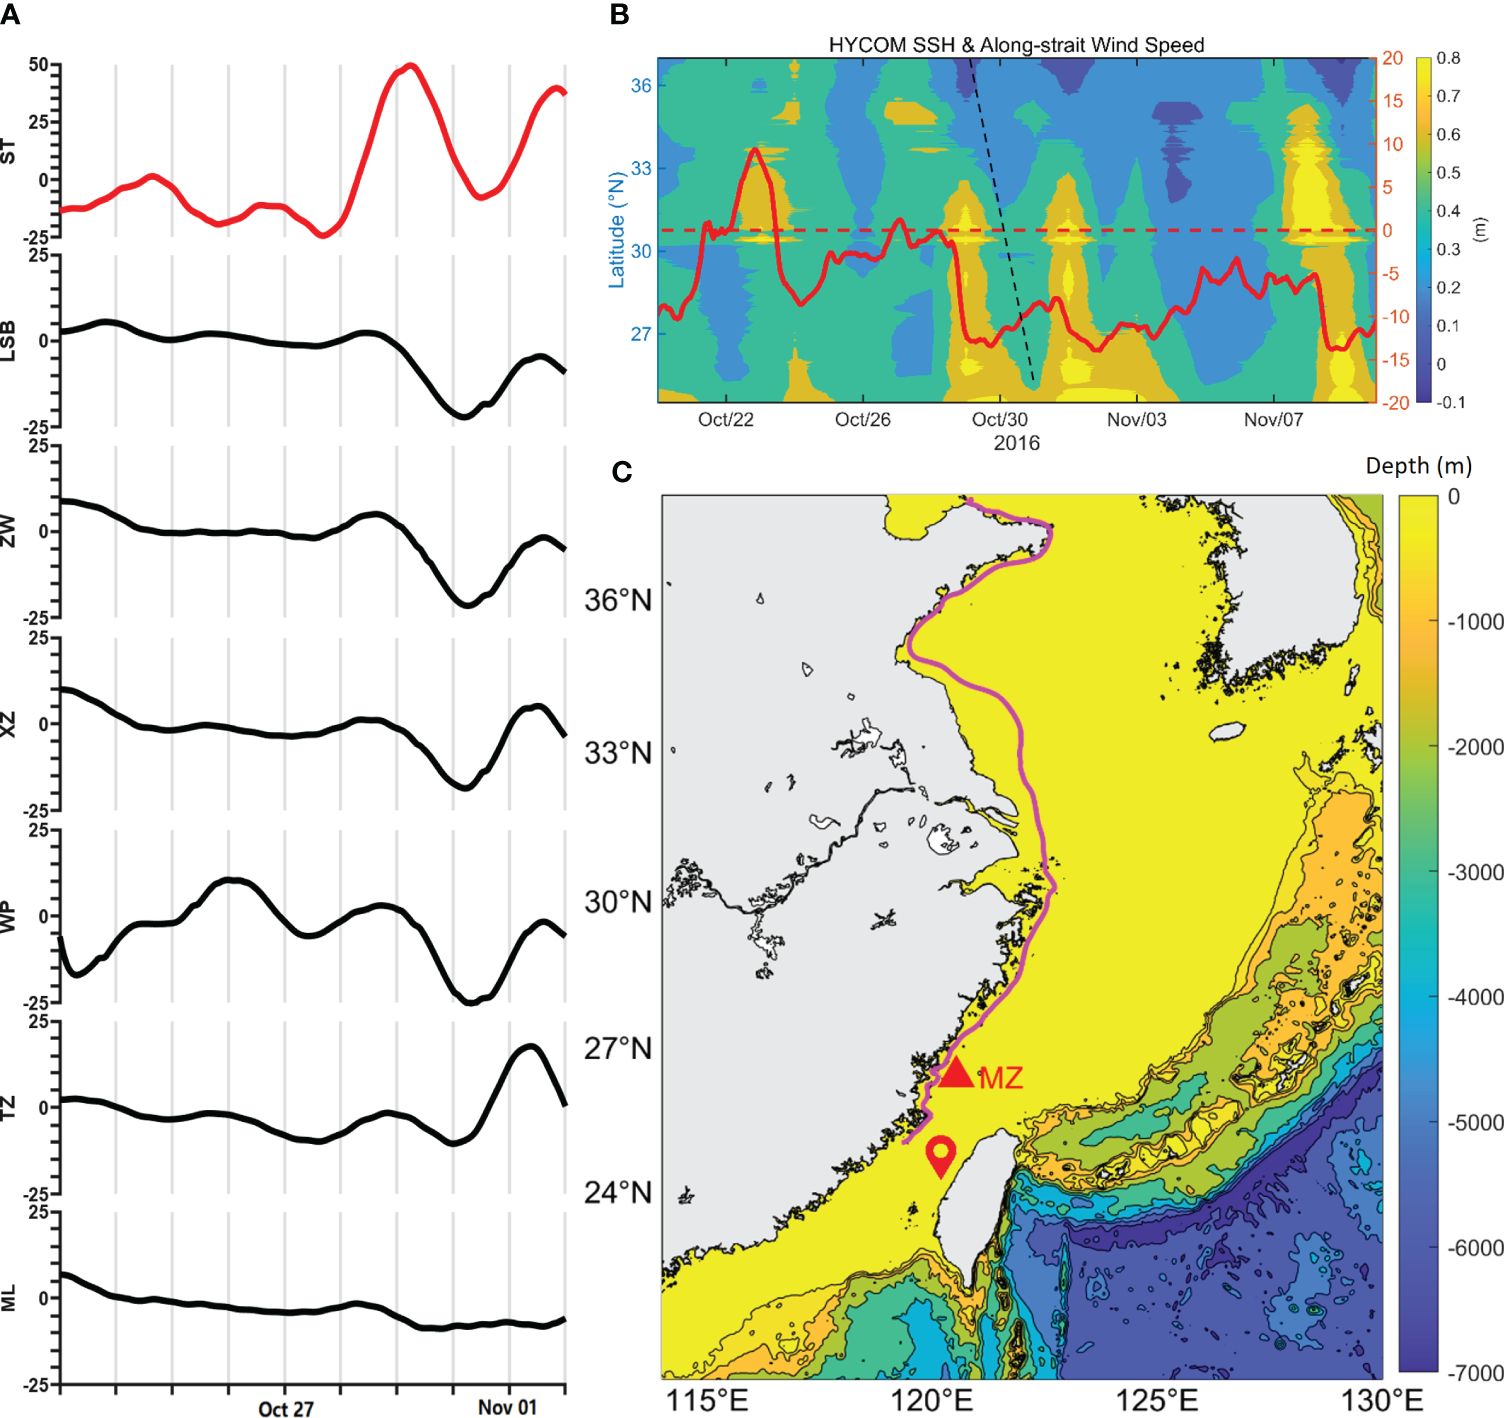
Figure 8 (A) Time series of detided water level (low-pass filtered with a cutoff period of 33 h) for tidal gauge stations during the transits of a cold front; red line denotes the data observed at ST station located on the western TWS. The location of ZYR is indicated by red pinpoint. (B) Time–distance plot of the alongshore SSH; the range is from the TWS toward the Yellow Sea along the China coast with the 15-m isobath; the time series of along-strait wind speed (thick red line) observed at MZ; and the large-scale oscillation originating from the Yellow Sea (black dashed line). (C) The dominant region of SSH obtained from HYCOM; the purple line is the isobath of 15 m along the China Coast, the red triangle denotes the location of the meteorological buoy at MZ.
The water level response to the cold front along the eastern coast of the TWS was relatively complex. Prior to the passage of the cold front, a slight water level rise can be seen at stations north of WP along the eastern coast, forming a peak on 29 October (Figure 8A), which may be caused by the water from the East China Sea that flew into the strait driven by the northeasterly winds at the beginning of the cold front. Thereafter, the water level on the eastern coast began to decline, accompanied by a rise on the west coast, reflecting the lateral fluctuation of water level caused by the westward Ekman transport.
After the passage of the cold front on 30–31 October, the water level began to decline synchronously on both sides of the TWS, reaching the trough in the early morning of 31 October (Figure 8A). The physical mechanism behind this process remains unclear. The decline in water level was basically synchronized on both sides of the TWS, which was not caused by the lateral adjustment of the water level in the strait after the strong wind. Moreover, the water level in the northern part of the eastern TWS was not very high before the decrease; it cannot be fully interpreted by the release of accumulated water that was previously blocked by the ZYR. A possible explanation could be attributed to the large-scale oscillation in the semi-enclosed Yellow Sea and East China Sea due to the relaxation of the northeasterly winds after the passage of the cold front (Figures 8B, C).
It is worth noting that the above-mentioned water level fluctuation is apparent only in the coast north of the ZYR, while it is invisible south of the sand ridge. This discrepancy reflects the effect of the ZYR in modulating the asymmetric response in the southern and northern part of the TWS to the transit of the synoptic system.
3.3 Cross-wavelet analysis
Cross-wavelet analysis is particularly adapted for studies of nonstationary signals (Thiebaut and Vennell, 2010). The cross-wavelet transform (XWT) of two signals exposes the regions in time–frequency space with a high common power and further reveals the information about the phase relationship (Grinsted et al., 2004). In this study, the phase relationship of the CSWs is investigated by exploring the XWT of pairs of the water level time series in different sites.
Results of these computations for adjacent station pairs are shown in Figure 9 during the passage of Dianmu. One can easily learn that the former would lead the latter during the common period band of 120–165 h (within the frequency band of approximately 0.17 ± 0.02 cpd) for those station pairs. Similar results are found in the case of Meranti, but with the period band of 64–81 h (within the frequency band of approximately 0.33 ± 0.03 cpd, refer to Shen et al., 2021, Figure 4).
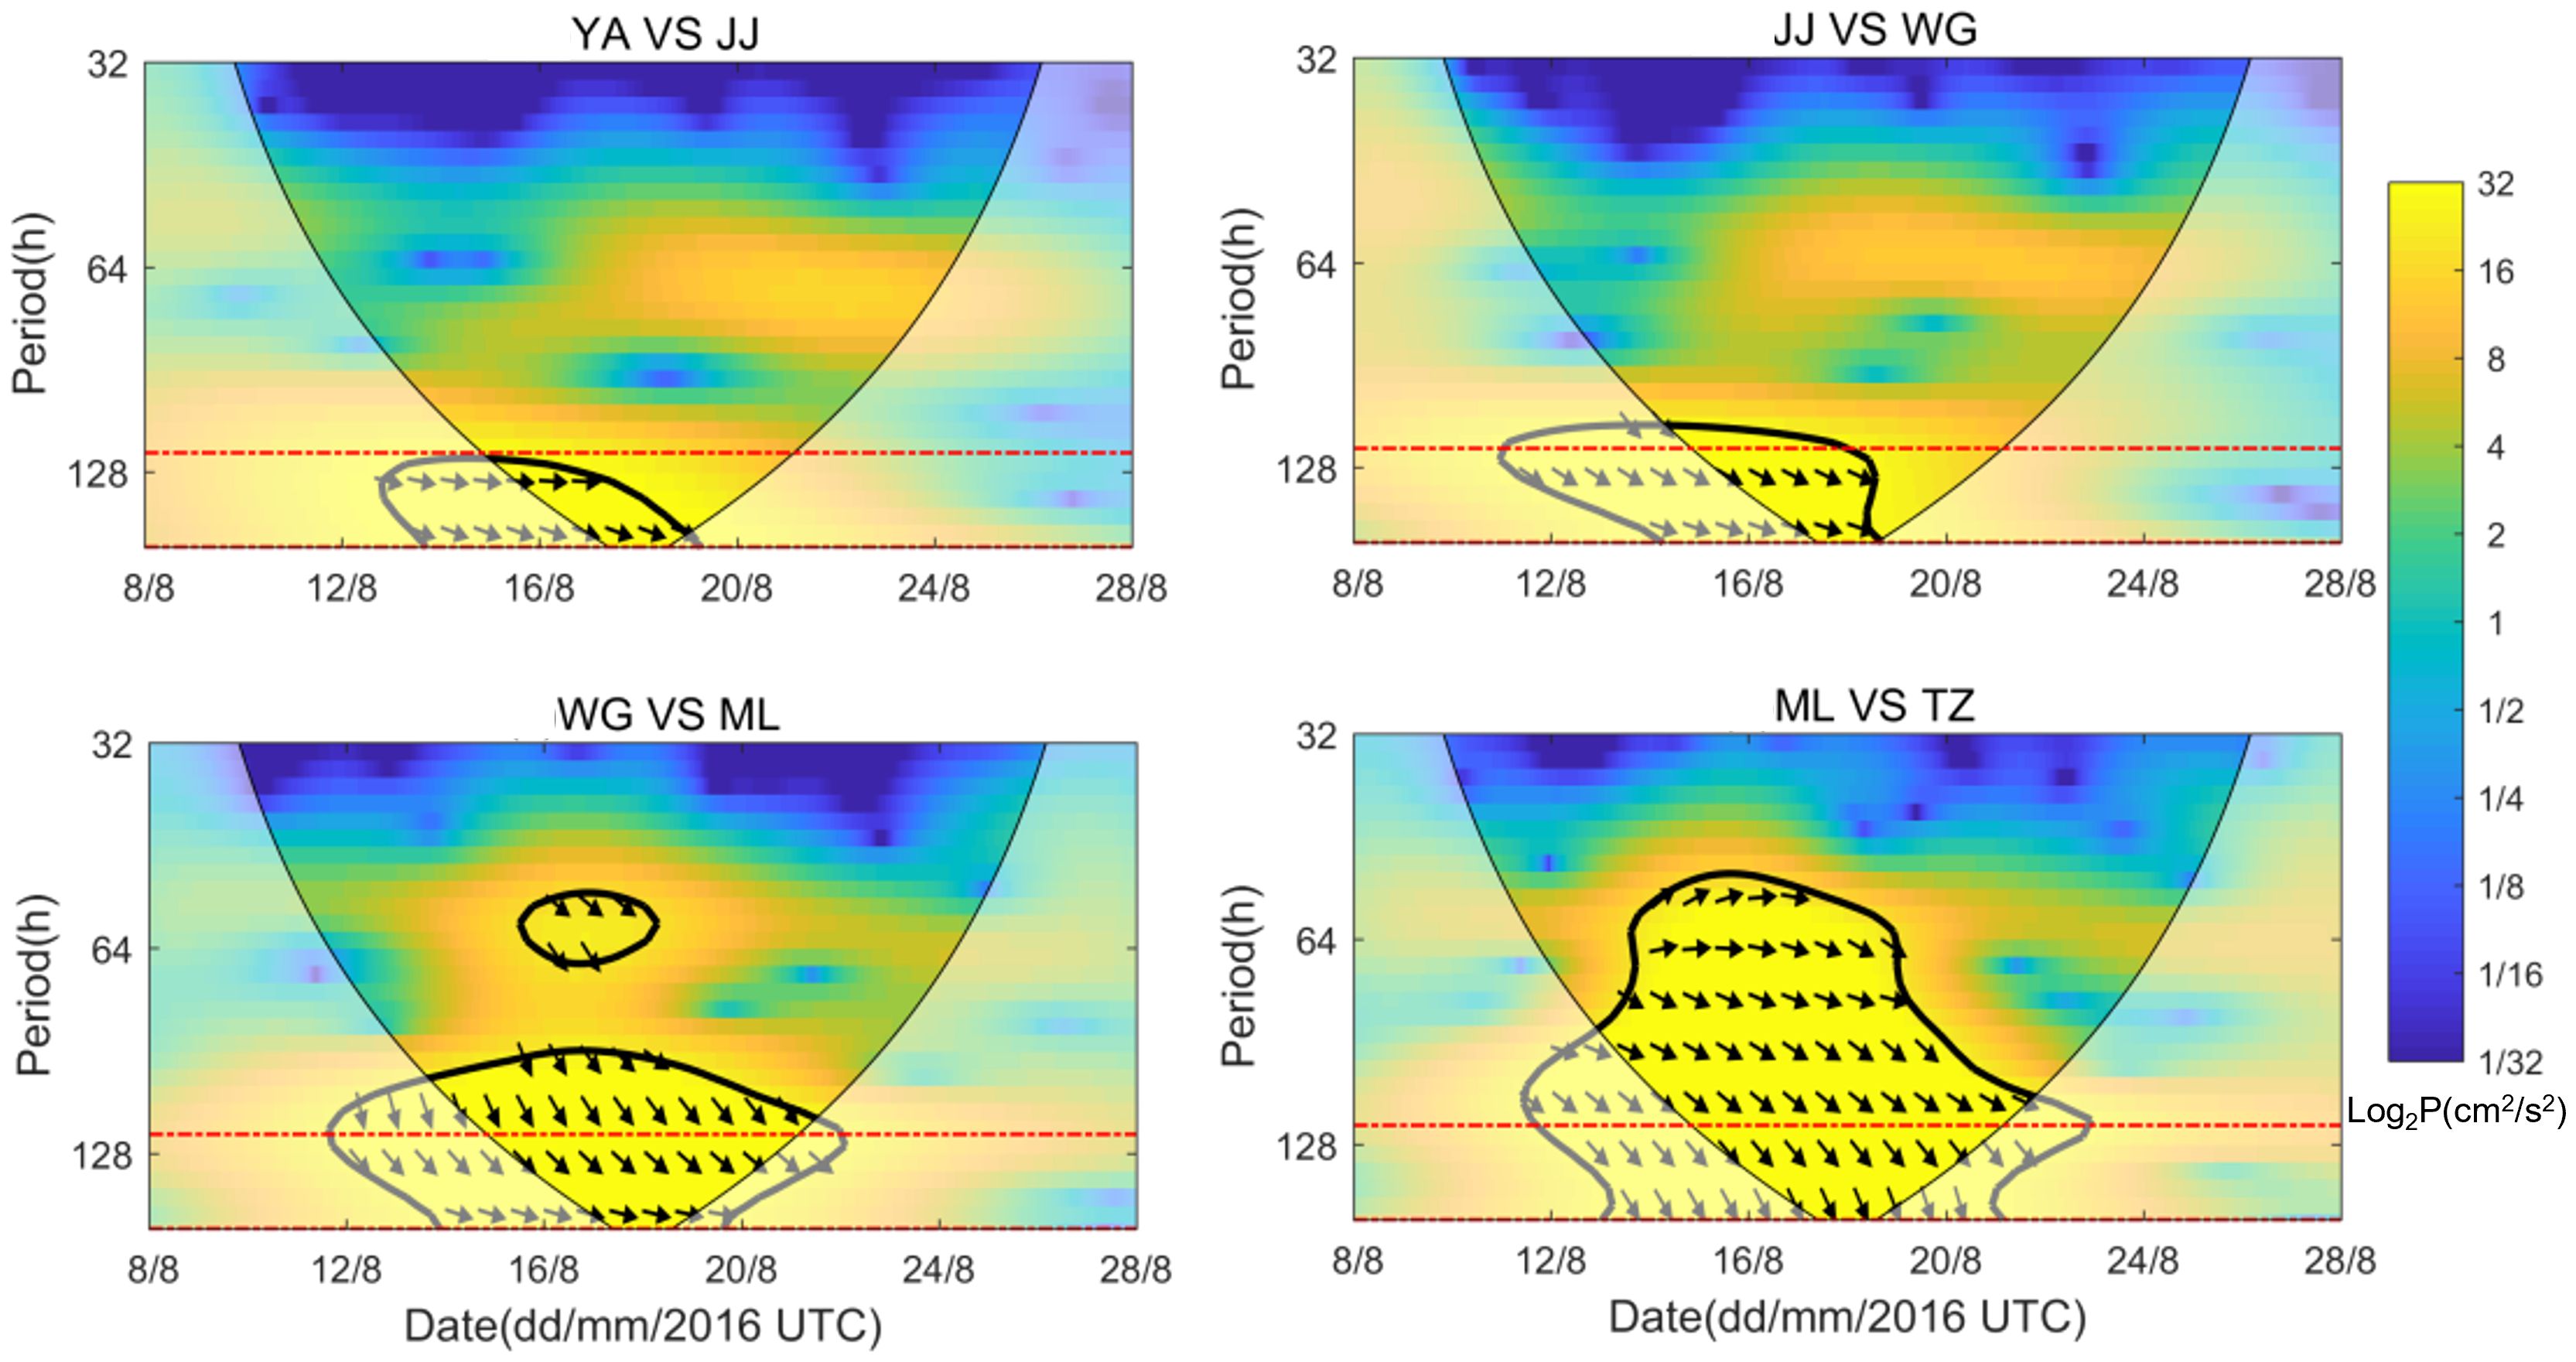
Figure 9 XWT of detided water level time series at tidal gauge station pairs (the thick line is the 5% significance level against red noise) during the passage of Dianmu. The relative phase relationship is also depicted in each panel with in-phase pointing to the right, anti-phase pointing to the left, and if the former would lead the latter by 90°, it will point straight downward. Red dashed lines in each panel denote the period band of 120–165 h. To calculate the mean phase between two time series, the circular mean of the phase over regions is used (Zar, 1999), which is higher than 5% statistical significance and within the given range of period.
Table 2 shows the values for different station pairs used to calculate the CSW phase velocities along the east coast of the TWS after the passage of Dianmu and Meranti. For the former case, the phase speed of those CSWs is large at the south entrance of the TWS, which could reach a speed of 4.5 m/s, but reduced to only 0.7–1.4 m/s in the TWS. Obviously, the CSWs dissipated rapidly and moved further north to the ZYR, with no propagation observed after that (see Figure 3B). On the other hand, the CSWs resulting from the transit of Meranti had a phase speed that variated during their propagation (Table 2). The wave propagated at a speed of 4.9 m/s between XGZ and JJ in the southern TWS, and it slowed down to 2.1 m/s between JJ and WG in the further north. However, between the station pair of WG and ML, no phase propagation of the CSW was depicted. Shen et al. (2021) claimed that the wave at station WG was a forced wave that was affected directly by the local wind forcing.
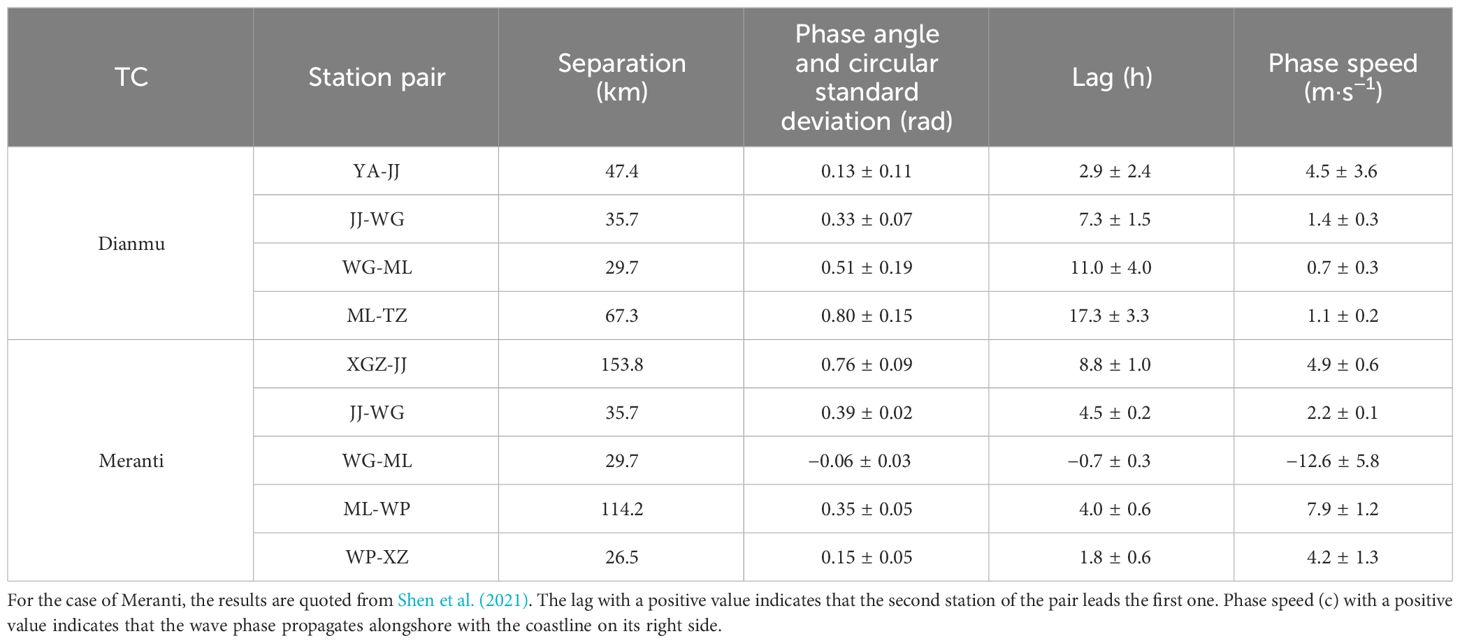
Table 2 Results of the XWT of detided water level time series for different pairs of station after the passage of Dianmu and Meranti.
When CSWs transited the ZYR, the phase speed increased to 7.9 m/s between ML and WP and then decreased to 4.2 m/s between WP and XZ. As Meranti directly entered the TWS, the powerful southwesterly winds (Figure 4B) could facilitate further propagation of the CSWs. We thus infer that the CSWs with the changing phase speed contained both free wave and forced wave. Before Meranti approached the TWS, it was dominated by the free wave, and when Meranti entered the TWS, it was shifted into forced wave.
3.4 Dispersion relation
In general, CSW is predominated by the first-mode (barotropic) Kelvin wave (Yin, 2012). Shen et al. (2021) reveal that the CSWs induced by super typhoon Meranti mainly consisted of the first three modes, while the first-mode wave dominates. To explore the characteristics of the first-mode CSW propagation along the eastern TWS, we use the codes (with 2007 version) written by Brink and Chapman (1985) to derive the dispersion curves of first mode CSW using five cross-shelf sections deployed along the eastern coast of the TWS (Figure 1A).
The results show that the slope of dispersion curves corresponding to four sections, XGZ, YA, ML, and ZYR, decreased from south toward the center of the TWS (Figure 10A); in other words, with the same wave number, the phase speed of the free CSWs propagating through the above sections will gradually decrease (Figure 10B). The continental shelf width corresponding to the above four sections gradually widened from south to north, with the seabed slope gradually decreased (Figure 1C). These topographic features should be the key factors modulating the CSW propagation in the region. Yin et al. (2018) reveal that the shelf width mainly influences the phase speed of the first-mode CSWs, while the seabed slope modulated that of the second- and third-mode CSWs. Herein, the shelf width of ZYR and WP sections is similar, while the seabed slope is somewhat different; the latter is slightly larger than the former. Accordingly, the slope of the dispersion curve and the phase speed corresponding to the above two sections are slightly greater in the latter than in the former. Therefore, we infer that in addition to shelf width, seabed slope is also the key factor that affects the propagation of first-mode CSWs.
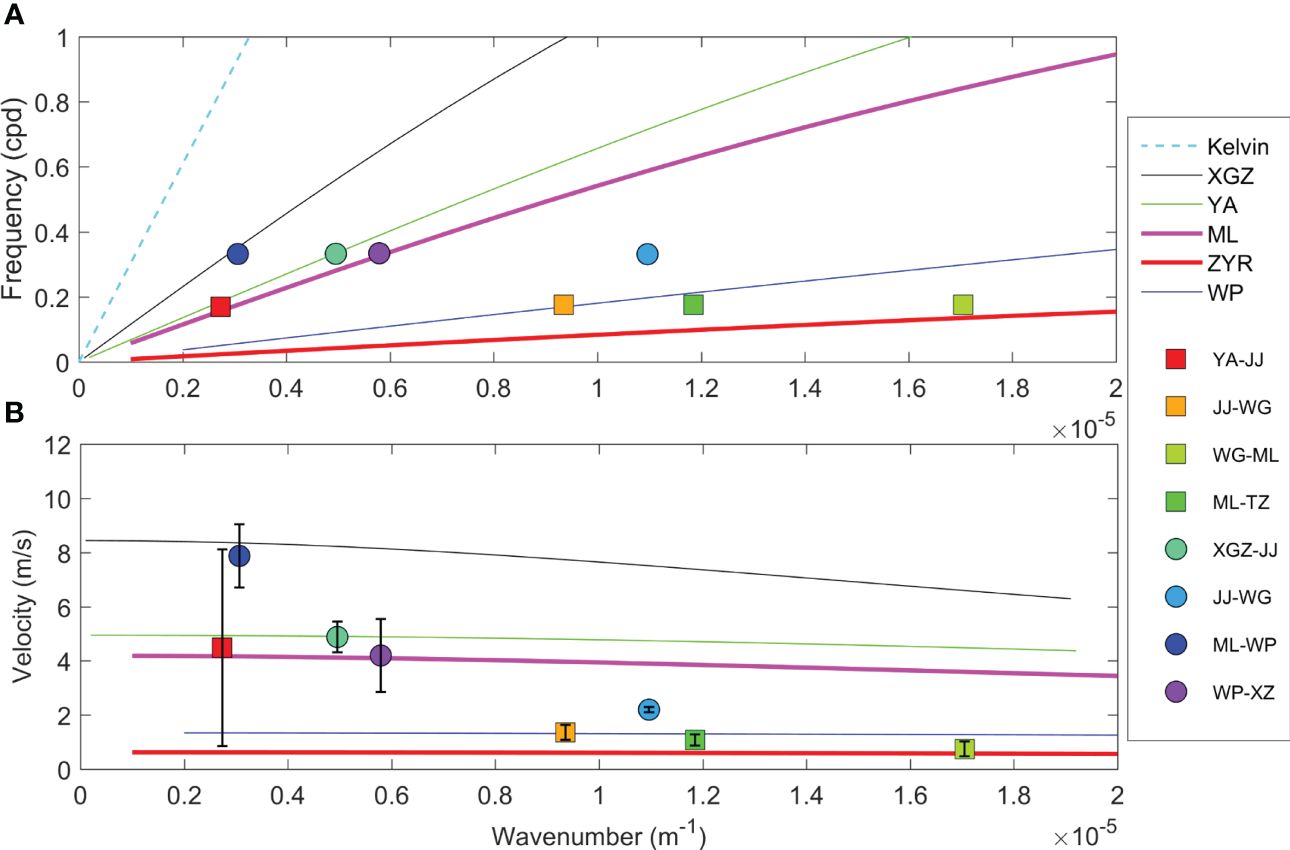
Figure 10 (A) Dispersion relations for the first mode of the CSW for the five sections distributed on the eastern TWS. (B) The phase velocity derived from the dispersion curves. The circles and squares with error bars are calculated from XWT of detided water level for station pairs. Theoretical dispersion relations are derived from the mean depth profiles as those shown in Figure 1C.
Figure 10B depicts that the phase speed of CSWs induced by Dianmu and Meranti is basically consistent with the theoretical estimates. For a long shelf wave within the frequency band of approximately 0.17 ± 0.02 cpd and 0.33 ± 0.03 cpd, the phase speed estimated from the dispersion curves (Figure 10B) is within the range of 0.6–8.4 m/s. However, the CSW caused by Dianmu was obviously closer to the theoretical solution of free shelf wave, while the one induced by Meranti was more likely a mixture of free wave and forced wave. For instance, when the CSWs passed through the WP section, the observed phase speed is approximately 4.2–7.9 m/s (between the station pairs ML–WP and WP–XZ), which is significantly higher than that of the theoretical solution (~1.3 m/s) (Figure 10B, solid blue line).
4 Discussion
In this study, we found that the peak surges always occur around the ZYR, indicating that the local bathymetry can modulate the storm surge’s evolution. Wind stress is the dominant factor that generates the storm surge in coastal seas (Jelesnianski, 1966). In addition, shelf geometry also has a significant impact on storm surge formation (Rego and Li, 2010). Pugh (1987) illustrated the impact of shelf bathymetry to coastal surges with a simple linear, steady-state expression for the sea surface slope in equilibrium with a constant wind field: , where is the surge height at the coast region, L is the shelf width, H is the average depth, W is the wind speed, and C combines gravity, density, and drag. In fact, the TC’s wind fields change dramatically and such equilibrium is unlikely to be accurate, but this expression can be used to demonstrate that wind is more effective in raising the sea surface in shallow waters. It is worth noting that ZYR has an average water depth of 17 m (the shallowest is approximately 9.6 m), which is much shallower than the mean water depth of the TWS (50 m). Such a shallow water is likely the main reason for the surge amplification in the region.
The study also illustrates the blocking effect of ZYR to the CSW propagation, especially for the free CSWs, which were dissipated significantly when they pass over the sand ridge. A typical example is the free CSWs induced by Dianmu; the wave signals basically disappeared when they moved further north to the ZYR. Previous studies have illustrated the energy evolution of CSWs propagating over the changing shelf bathymetry. For example, the waves lose energy while passing over capes and submarine canyons (Platov, 2016). The shelf width variation could result in energy transfer between different modes. If the shelf width widens along the propagation direction, energy will transfer from the low mode to the high mode (Wilkin and Chapman, 1990). In our case, CSWs from the southern tip of the TWI can propagate into the TWS, while the first-mode energy may decrease due to energy transfer from low mode to high mode as the shelf widens during propagation (Figure 1C). We observed that when free CSWs propagated through the ZYR, the phase speed decreased dramatically (Figure 10B); that is, the kinetic energy of CSWs was significantly reduced. Apart from the kinetic energy, the potential energy of CSWs was considered. The two items have the following relationship: (Platov, 2016), where K is the kinetic energy, is the potential energy, and ∈ is the ratio of the shelf width (L) to the internal Rossby deformation radius (). Note that, for most shelves, the condition is satisfied. In our case, is approximately 0.08 around the ZYR; hence, it can be said that the kinetic energy of the CSWs is its energy. In addition, based on the numerical simulation of the energy evolution of CSWs with different bathymetry, Platov (2016) pointed out that part of the kinetic energy can transfer to potential energy while the energy of CSWs is dissipated due to terrain constraints. This may partly explain the amplification effect of ZYR on storm surges, especially when CSWs pass over the ZYR, and the surge would reach its maximum (Figures 3B, 4A).
5 Summary
Based on the synchronous water level observation datasets, this study explores the spatiotemporal characteristics of storm surges in the TWS caused by TCs and cold fronts during summer to fall of 2016. The effects of bathymetry on storm surges and TC-induced CSW response are also discussed. It is found that the storm surges along the eastern coast of the TWS are asymmetric on the north and south sides of ZYR, regardless of the different category and track of TCs (or cold fronts) passing by. It is observed that ZYR can modulate storm surges and CSW propagation. On the one hand, ZYR can amplify the storm surges; the observed maximum water level setup almost appears around the ZYR. The water level at stations ML and TZ, adjacent to ZYR, can rise up to 30 cm during the transit of TC such as Lionrock, Megi, and Meranti. On the other hand, ZYR can block the propagation of CSWs. The kinetic energy of CSWs is dissipated significantly when they pass over ZYR. The free CSWs caused by Dianmu has a phase speed of 4.5 m/s at the south entrance of the TWS, while slowing down to 1.1 m/s around the ZYR. It is important to note that, apart from the effect of ZYR, local wind work and remote forcing can modulate the synoptic variations of water level in the TWS from summer to autumn. For instance, the strong wind field during the transit of Meranti resulted in a surge that peaked at 40 cm. In autumn, the passage of cold fronts can cause large-scale oscillations in the Yellow Sea and the East China Sea, leading to the synchronous decline of water level on both sides of the TWS.
Last but not least, the study also explores the effect of bathymetry on the CSW propagation. It is shown that the phase speed of first-mode CSWs is jointly modulated by the shelf width and the seabed slope. Moreover, the TWS is characterized by the complex bathymetry, which will inevitably affect the energy evolution of CSWs. The CSWs generated at the southern tip of the TWI need to pass over the canyon of PHCh before entering the strait, which may cause energy dissipation. More numerical simulations are needed to confirm the impact of bathymetry on the spatiotemporal evolution of CSWs.
Data availability statement
The original contributions presented in the study are included in the article/supplementary materials, further inquiries can be directed to the corresponding author/s.
Author contributions
RZ: Writing – review & editing, Software. JS: Writing – original draft, Writing – review & editing. LL: Conceptualization, Supervision, Writing – review & editing, Writing – original draft. YW: Software, Writing – review & editing. JH: Investigation, Visualization, Writing – review & editing. MZ: Data curation, Writing – review & editing. XG: Project administration, Resources, Supervision, Writing – review & editing.
Funding
The author(s) declare financial support was received for the research, authorship, and/or publication of this article. This work is supported by the Scientific Research Foundation of Third Institute of Oceanography, Ministry of Natural Resources (2022013, 2022027 and 2019018); the National Natural Science Foundation of China (41506014); the Southern Marine Science and Engineering Guangdong Laboratory (Guangzhou) (GML2019ZD0304); and the National Key Research and Development Program of China (2016YFC1402607).
Conflict of interest
The authors declare that the research was conducted in the absence of any commercial or financial relationships that could be construed as a potential conflict of interest.
Publisher’s note
All claims expressed in this article are solely those of the authors and do not necessarily represent those of their affiliated organizations, or those of the publisher, the editors and the reviewers. Any product that may be evaluated in this article, or claim that may be made by its manufacturer, is not guaranteed or endorsed by the publisher.
References
Alessi C. A., Beardsley R. C., Limeburner R., Rosenfeld L. K., Lentz S. J., Send E., et al. (1985). CODE-2: moored array and large-scale data report (Woods Hole, MA: Woods Hole Oceanographic Institution). doi: 10.1575/1912/1641
Brink K. H. (1991). Coastal-trapped waves and wind-driven currents over the continental shelf. Annu. Rev. Fluid Mechanics 23, 389–412. doi: 10.1146/annurev.fl.23.010191.002133
Church J. A., Clark P. U., Cazenave A., Gregory J. M., Jevrejeva S., Levermann A., et al. (2013). Sea-level rise by 2100. Science 342, 1445–1445. doi: 10.1126/science.342.6165.1445-a
Gill A. E., Schumann E. H. (1974). The generation of long shelf waves by the wind. J. Phys. Oceanography 4, 83–90. doi: 10.1175/1520-0485(1974)004
Grinsted A., Moore J. C., Jevrejeva S. (2004). Application of the cross wavelet transform and wavelet coherence to geophysical time series. Nonlin. Processes Geophys. 11, 561–566. doi: 10.5194/npg-11-561-2004
Horsburgh K. J., Wilson C. (2007). Tide-surge interaction and its role in the distribution of surge residuals in the North Sea. J. Geophys. Res. 112, C08003. doi: 10.1029/2006JC004033
Jelesnianski C. P. (1966). Numerical computations of storm surges without bottom stress. Mon. Weather Rev. 94, 379–394. doi: 10.1175/1520-0493(1966)094<0379:NCOSSW>2.3.CO;2
Kim S. Y., Yasuda T., Mase H. (2008). Numerical analysis of effects of tidal variations on storm surges and waves. Appl. Ocean Res. 30, 311–322. doi: 10.1016/j.apor.2009.02.003
Liu F., Wang X. (1989). A review of storm-surge research in China. Nat. Hazards 2, 17–29. doi: 10.1007/BF00124755
Liu W. C., Huang W. C. (2020). Investigating typhoon-induced storm surge and waves in the coast of Taiwan using an integrally-coupled tide-surge-wave model. Ocean Eng. 212, 107571. doi: 10.1016/j.oceaneng.2020.107571
Mori N., Takemi T., Tachikawa Y., Tatano H., Shimura T., Tanaka T., et al. (2021). Recent nationwide climate change impact assessments of natural hazards in Japan and East Asia. Wea. Climate Extremes 32, 100309. doi: 10.1016/j.wace.2021.100309
Oey L. Y., Chang Y. L., Lin Y. C., Chang M. C., Varlamov S., Miyazawa Y. (2014). Cross flows in the Taiwan strait in winter. J. Phys. Oceanography 44, 801–817. doi: 10.1175/JPO-D-13-0128.1
Platov G. A. (2016). The influence of shelf zone topography and coastline geometry on coastal trapped waves. Numerical Anal. Appl. 9, 231–245. doi: 10.1134/S1995423916030058
Poulose J., Rao A. D., Bhaskaran P. K. (2018). Role of continental shelf on non-linear interaction of storm surges, tides and wind waves: An idealized study representing the west coast of India. Estuarine. Coast. Shelf Sci. 207, 457–470. doi: 10.1016/j.ecss.2017.06.007
Pugh D. T. (1987). Tides, surges and mean sea-level: A handbook for engineers and scientists (Hoboken, N. J: John Wiley), 472.
Qin Z., Duan Y., Wang Y., Shen Z., Xu K. (1994). Numerical simulation and prediction of storm surges and water levels in Shanghai harbour and its vicinity. Nat. Hazards 9, 167–188. doi: 10.1007/BF00662597
Rego J. L., Li C. (2010). Nonlinear terms in storm surge predictions: Effect of tide and shelf geometry with case study from Hurricane Rita. J. Geophys. Res. 115, C06020. doi: 10.1029/2009JC005285
Schumann E. H., Brink K. H. (1990). Coastal-trapped waves off the coast of south Africa: generation, propagation and current structures. J. Phys. Oceanography 20, 1206–1218. doi: 10.1175/1520-0485(1990)020
Shen J., Gong W. (2009). Influence of model domain size, wind directions and Ekman transport on storm surge development inside the Chesapeake Bay: A case study of extratropical cyclone Ernesto. J. Mar. Syst. 75, 198–215. doi: 10.1016/j.jmarsys.2008.09.001
Shen J., Zhang S., Zhang J., Zeng M., Fang W. (2021). Observation of continental shelf wave propagating along the eastern Taiwan Strait during Typhoon Meranti 2016. J. Oceanol. Limnol. 39, 45–55. doi: 10.1007/s00343-020-9346-8
Sheng Y. P., Paramygin V. A., Terng C. T., Chu C. H. (2018). Towards an integrated storm surge and wave forecasting system for Taiwan coast[J]. J. Mar. Sci. Technol. 26, 117–127. doi: 10.6119/JMST.2018.02(1).0011
Tang L., Zhan J., Chen Y., Li Y., Nie Y. (2011). Typhoon process and its impact on the surface circulation in the northern south China sea. J. Hydrodyn 23, 95–104. doi: 10.1016/S1001-6058(10)60093-5
Thiebaut S., Vennell R. (2010). Observation of a fast continental shelf wave generated by a storm impacting newfoundland using wavelet and cross-wavelet analyses. J. Phys. Oceanography 40, 417–428. doi: 10.1175/2009JPO4204.1
Wang C., Chen Y., Kuo H., Huang. S. (2013). Sensitivity of typhoon track to asymmetric latent heating/rainfall induced by Taiwan topography: A numerical study of Typhoon Fanapi, (2010). J. Geophys. Res. Atmos. 118, 3292–3308. doi: 10.1002/jgrd.50351
Wilkin J. L., Chapman D. C. (1990). Scattering of coastal-trapped waves by irregularities in coastline and topography. J. Phys. Oceanography 20, 396–422. doi: 10.1175/1520-0485(1990)020
Wolf J. (1981). “Surge-tide interaction in the north sea and river thames,” in Floods due to high winds and tides. Ed. Peregrine D. H. (Academic, London), 75–94.
Wu T. R., Tsai Y. L., Terng C.-T. (2017). The recent development of storm surge modeling in Taiwan. Proc. IUTAM 25, 70–73. doi: 10.1016/j.piutam.2017.09.011
Xie B., Zhang F. (2012). Impacts of typhoon track and Island topography on the heavy rainfalls in Taiwan associated with Morakot, (2009). Mon. Weather Rev. 140, 3379–3394. doi: 10.1175/MWR-D-11-00240.1
Yang J., Lin C. Y., Liu H., Li L., Wu T. R., Wang P., et al. (2021). Effects of island topography on storm surge in Taiwan strait during Typhoon Maria. J. Waterway Port Coastal Ocean Eng. 147, 04020057. doi: 10.1061/(ASCE)WW.1943-5460.0000619
Yin L. P. (2012). The intrinsic mode of continental shelf waves and the forced continental waves in The East China Sea. [dissertation/Doctor’s thesis]. [Qingdao (SD, China)]: Ocean University of China. (in Chinese).
Yin L. P., Guo J. S., Qiao F. L. (2018). Impact of bottom topography on the character and mechanism of coastal trapped waves. Oceanologia ET Limnologia Sin. 49, 243–270. doi: 10.11693/hyhz20170500140
You Z. J. (2016). Coastal inundation and erosion hazards along the coast of China and mitigation strategies. Bull. Chin. Acad. Sci. (in Chinese) 31, 1190–1196.
Zhang J. (2009). A vulnerability assessment of storm surge in guangdong province, China. Hum. Ecol. Risk Assessment: Int. J. 15, 671–688. doi: 10.1080/10807030903050749
Zhang L., Shang S., Zhang F., Xie Y. (2020). Tide-surge-wave interaction in the Taiwan strait during typhoons soudelor, (2015) and dujuan, (2015). Appl. Sci. 10, 7382. doi: 10.3390/app10207382
Keywords: storm surge, continental shelf wave, tropical cyclone, bathymetry, Taiwan Strait
Citation: Zhang R, Shen J, Li L, Wang Y, Huang J, Zeng M and Guo X (2024) Asymmetry response of storm surges along the eastern coast of the Taiwan Strait. Front. Mar. Sci. 11:1368181. doi: 10.3389/fmars.2024.1368181
Received: 10 January 2024; Accepted: 08 April 2024;
Published: 08 May 2024.
Edited by:
Kyung-Ae Park, Seoul National University, Republic of KoreaReviewed by:
KiRyong Kang, Korea Meteorological Administration, Republic of KoreaWei Huang, Florida International University, United States
Copyright © 2024 Zhang, Shen, Li, Wang, Huang, Zeng and Guo. This is an open-access article distributed under the terms of the Creative Commons Attribution License (CC BY). The use, distribution or reproduction in other forums is permitted, provided the original author(s) and the copyright owner(s) are credited and that the original publication in this journal is cited, in accordance with accepted academic practice. No use, distribution or reproduction is permitted which does not comply with these terms.
*Correspondence: Junqiang Shen, anFzaGVuQHRpby5vcmcuY24=; Li Li, bGlsaUB0aW8ub3JnLmNu