 Hyo Keun Jang1
 Jae Joong Kang2
 Jae Hyung Lee3
 Dabin Lee4
 Naeun Jo5
 Yejin Kim6
 Kwanwoo Kim2
 Myung-Joon Kim7
 Sanghoon Park6Jaehong Kim8Jaesoon Kim6So Hyun Ahn9
 Sang Heon Lee6*
- 1Oceanic Climate and Ecology Research Division, National Institute of Fisheries Science, Busan, Republic of Korea
- 2Marine Environment Research Division, National Institute of Fisheries Science, Busan, Republic of Korea
- 3South Sea Fisheries Research Institute, National Institute of Fisheries Science, Yeosu, Republic of Korea
- 4Coastal Disaster and Safety Research Department, Korea Institute of Ocean Science and Technology, Busan, Republic of Korea
- 5Shipbuilding & Marine Center, Convergence Research Institute, Korea Testing & Research Institute, Ulsan, Republic of Korea
- 6Department of Oceanography and Marine Research Institute, Pusan National University, Busan, Republic of Korea
- 7Fisheries Resources Research Center, National Institute of Fisheries Science, Tongyeong, Republic of Korea
- 8Department of Earth, Ocean, and Atmospheric Science, Florida State University, Tallahassee, FL, United States
- 9Biology Department, Woods Hole Oceanographic Institution, Woods Hole, MA, United States
We investigated assessments of calorie production and energy efficiencies of phytoplankton in Gwangyang, Jaran, and Geoje-Hansan bays in southern Korea, based on seasonal field measurements data for particulate organic carbon (POC), macromolecular compositions, calorie contents, and primary production. Our findings revealed that Geoje-Hansan Bay consistently exhibits higher POC concentrations compared to Gwangyang and Jaran bays, except during the summer season. The observed seasonal variations in POC concentrations and primary productions indicated distinct factors influencing POC distribution among the bays, which varies with the seasons. Macromolecular compositions displayed notable patterns, with Gwangyang Bay exhibiting pronounced seasonal variations, Jaran and Geoje-Hansan bays showing stable carbohydrate (CHO) dominance, and Gwangyang Bay displaying protein (PRT) dominance influenced by river-borne nutrients. Analysis of calorie content revealed that Geoje-Hansan Bay exhibited the highest calorie content, suggesting a more favorable physiological state of phytoplankton compared to Gwangyang and Jaran bays. Estimations of annual primary production and calorie production demonstrated regional variations, with Geoje-Hansan Bay having the highest values followed by Jaran Bay and Gwangyang Bay. These differences in primary production and calorie production reflect the diverse ecological conditions and nutrient availability specific to each bay. Interestingly, Gwangyang Bay demonstrated the highest energy efficiency, producing more calories per unit of carbon compared to the other two bays, potentially due to the influence of different dominant phytoplankton communities. This study enhances our understanding of ecosystem dynamics and ecological characteristics among the three bays, emphasizing the importance of considering seasonal variations and specific bay characteristics in investigating biogeochemical processes, energy flow, and ecosystem functioning. The findings contribute valuable insights for the sustainable management of coastal ecosystems and aquaculture practices.
1 Introduction
Conventionally, phytoplankton primary production has been measured using stable (13C) or radiocarbon (14C) isotopes to indicate the amount of organic carbon fixed through photosynthesis (Platt and Irwin, 1973; Lee et al., 1991, 2008; Kim et al., 2019a). However, these conventional measurements reflect total particulate organic carbon (POC) production, encompassing both calorie-containing and non-calorie-containing organic materials. In contrast, examining the photosynthetic allocation of carbon into different macromolecular classes−carbohydrates (CHO), proteins (PRT), and lipids (LIP)−along with their biochemical composition, can provide more detailed insights into the calorie-containing POC materials and their nutritional value for consumers (Lee et al., 2009; Yun et al., 2015; Kim et al., 2016; Kang et al., 2020).
CHO, PRT, and LIP are among the key biomolecules synthesized by phytoplankton, and each serves distinct functions in their growth and survival (Liebezeit, 1984; Fernández-Reiriz et al., 1989; Finkel et al., 2016; Bhavya et al., 2019). Concurrently, variations in the biochemical compositions of phytoplankton can have significant implications for ecological interactions marine food webs within marine ecosystems (Laws, 1991; Graf, 1992; Parrish et al., 1995; Yun et al., 2015; Kim et al., 2016; Jo et al., 2017). Recent studies have demonstrated compelling evidence that the biochemical composition of phytoplankton offers valuable insights into their physiological conditions (Lee et al., 2009) and the nutritional value for consumers in diverse environmental regions (Yun et al., 2015; Kim et al., 2016; Jo et al., 2017; Lee et al., 2017; Kim et al., 2019b; Kang et al., 2020; Lee et al., 2020a; Jo et al., 2021). A comprehensive understanding of the relative abundance of these biochemical compositions within phytoplankton cells is crucial.
The composition of biochemical compounds in phytoplankton cells varies depending on their species composition and physiological conditions, and various environmental conditions such as water temperature, light availability, and nutrient concentrations for their growths (Liebezeit, 1984; Fernández-Reiriz et al., 1989; Lee et al., 2008; Finkel et al., 2016; Lee et al., 2017; Kim et al., 2018a; Lee et al., 2020b). These biochemical compositions can influence the nutritional value of phytoplankton for herbivores and higher trophic level consumers (Yun et al., 2015; Jo et al., 2017, 2021).
Previous studies focused on quantifying the caloric contents based on the three biomolecular compositions of phytoplankton in various oceans (Fabiano et al., 1993; Danovaro and Fabiano, 1997; Kang et al., 2020) as well as in several Korean bays (Kim et al., 2019b; Lee et al., 2020a, b). Through quantitative analysis, essential information can be gained regarding the cycling and transport of carbon and nitrogen, which are fixed through photosynthesis, across different trophic levels within marine food webs (Laws, 1991; Parrish et al., 1995; Kim et al., 2018b). Furthermore, efficiency of different cell-sized phytoplankton cells in terms of different calorie contents have been explored (Hitchcock, 1982; Finkel et al., 2016; Kang et al., 2017; Roy, 2018; Kang et al., 2020).
Coastal areas and bays hold immense ecological significance as vital aquatic resources worldwide (Kwak et al., 2012; Wetz and Yoskowitz, 2013; references therein). They serve as crucial habitats and food resources for a wide range of marine organisms, including large numbers of fish and shellfish species. Notably, Gwangyang, Jaran, and Geoje-Hansan bays (Figure 1) in South Korea stands out as prominent location for shellfish aquaculture, particularly for filter-feeding species such as oysters and scallops (Cho and Park, 1983; Yoon et al., 2009; Cho et al., 2012; Lee et al., 2018). These shellfish rely on phytoplankton as a primary food source for their growths and reproductions (Xu and Yang, 2007; Umehara et al., 2018). In recent decades, the bays of South Korea have experienced significant industrialization and intensive aquaculture activities, raising concerns about potential environmental impacts resulting from these anthropogenic influences. Consequently, these changes may lead to variations in the phytoplankton community and subsequent alterations in the biochemical compositions of particulate organic matter (POM) within the bay ecosystem (Lee et al., 2017; Kang and Oh, 2021). However, despite the significance of these potential changes, there is currently a lack of comprehensive information regarding the biochemical compositions of POM specifically in the southern bays of South Korea.
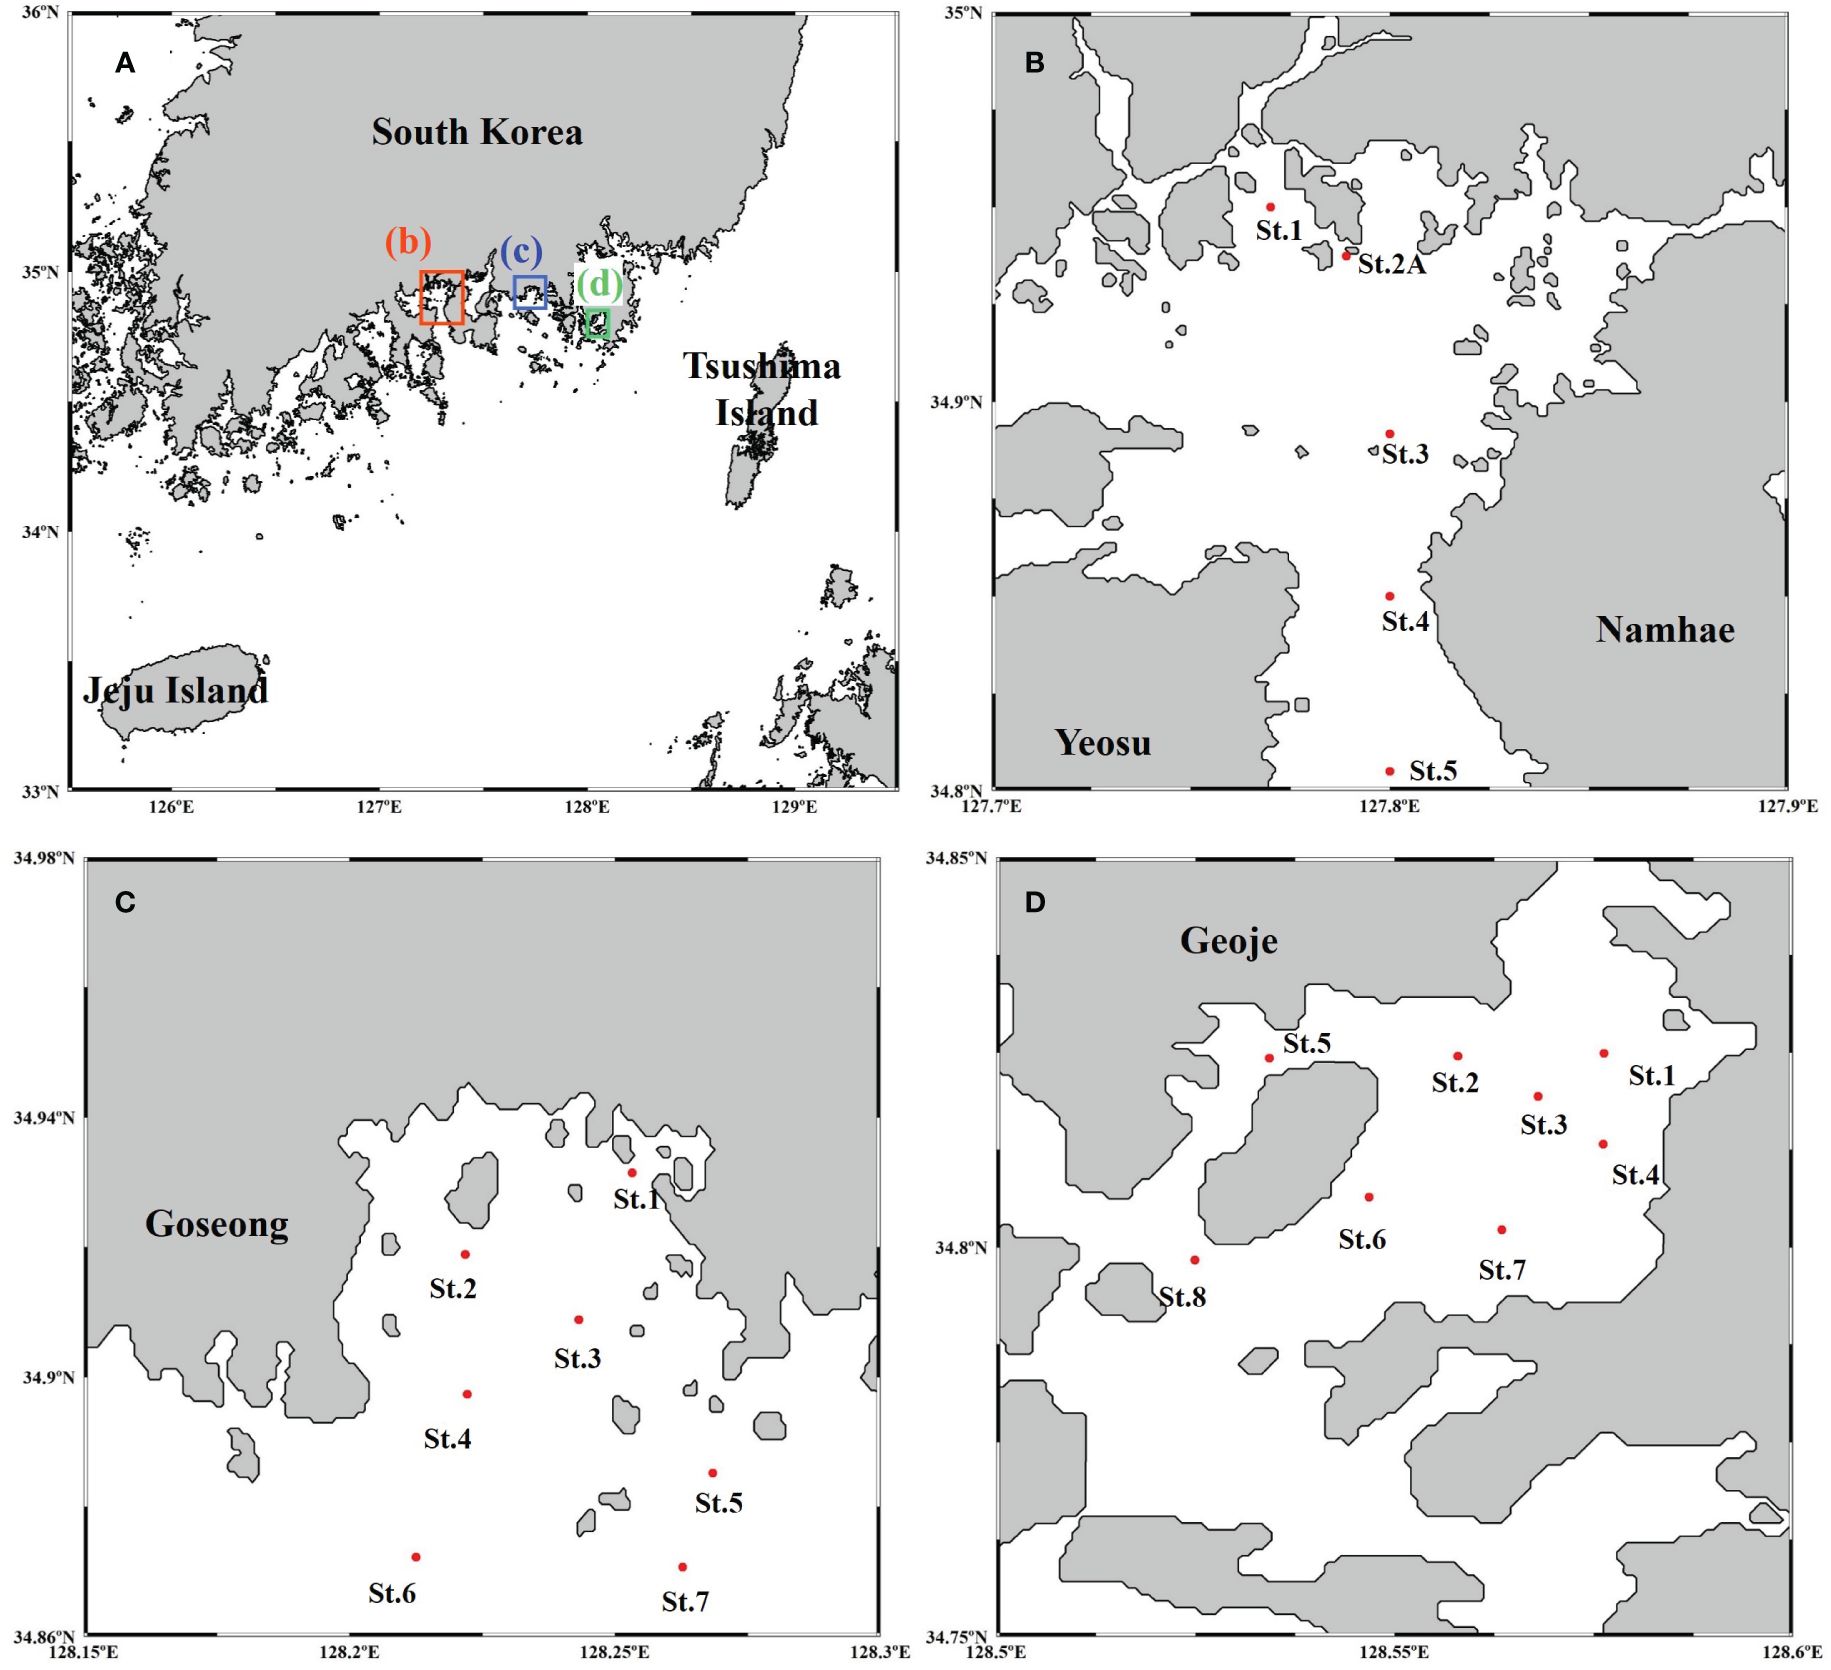
Figure 1 Sampling stations in the southern coastal regions of South Korea (A), Gwangyang Bay (B), Jaran Bay (C), and Geoje-Hansan Bay (D).
In this study, we aim to investigate the seasonal and regional characteristics of biochemical compositions, including CHO, PRT, and LIP, in POM across different environmental conditions in the southern bays of Korea. By analyzing these biochemical characteristics, our second objective is to quantify the annual calorie production attributed to mainly photosynthetic phytoplankton, which has not been previously determined. Additionally, we propose a hypothesis that the observed discrepancy between primary production, calorie production, and energy efficiency among phytoplankton communities in different bays may indicate differential trophic transfer efficiencies and ecosystem functioning. Further elucidating this relationship will provide valuable insights into the dynamics of marine ecosystems and their responses to environmental changes.
2 Materials and methods
2.1 Study sites description
Gwangyang Bay (Figure 1B), situated on the south-western coast of Korea, is adjacent to the open sea and bordered by the 4-km wide Yeosu Channel to the south and the Seomjin River to the north (Baek et al., 2015). Jaran Bay (Figure 1C), located on the south-eastern coast of South Korea in Goseong-gun, is characterized by relatively shallow water depths, typically not exceeding 20 meters (Lee et al., 2020c). The expansive mouth of the bay promotes efficient seawater exchange within the Jaran Bay region (Kim et al., 2019c). Geoje-Hansan Bay (Figure 1C), located in the south-eastern region of South Korea, constitutes an enclosed bay covering approximately 55 km2. It extends around 10 km from east to west and north to south. The bay features a deep channel, ranging from 20 to 40 meters in depth, extending northwestward from the southern tip of Geoje Island. In contrast, the inner part of the bay displays a relatively flat topography, with depths below 10 meters (Kwon et al., 2013).
2.2 Water sampling procedure for particulate organic carbon and biochemical concentrations
Field samplings were conducted in Gwangyang Bay, Jaran Bay, and Geoje-Hansan Bay to obtain data within the photic zone. In Gwangyang Bay, sampling activities encompassed 2-4 stations during November 2011 and were subsequently repeated in April, June, August, and October 2012, as well as January 2013 (Figure 1B). Jaran Bay underwent monthly samplings at 7 stations from January to December 2015 (Figure 1C). In Geoje-Hansan Bay, monthly water samplings were conducted at 8 stations throughout 2016 (Figure 1D). The sampling timeline was organized into four distinct seasons: winter (December-February), spring (March-May), summer (June-August), and autumn (September-November), based on the acquired data from each bay.
Water samples were collected using a 5 L Niskin water sampler (General Oceanics Inc. Miami, FL, USA) at three different light depths, corresponding to 100%, 30%, and 1% of the surface photosynthetic active radiation. The determination of three light depths were executed utilizing a Secchi disk at each station across all three bays throughout the observation period.
For the assessment of POC concentration, water samples (0.1-0.3 L) underwent filtration using pre-combusted GF/F filters (25 mm diameter) under low vacuum pressure (< 150 mmHg). Subsequently, the filtered samples were transferred to small petri dishes and promptly preserved in a freezer at –20°C until further analysis at the home laboratory of the Pusan National University. The POC concentration was quantified using a Finnigan Deltaplus XL mass spectrometer (Thermo Fisher Scientific Inc., Waltham, MA, USA) at the Alaska Stable Isotope Facility.
For biochemical analysis, 1 L water samples were filtered onto 47-mm GF/F filter (Whatman, 0.7 μm pore size) to determine the concentrations of CHO, PRT, and LIP. The filters were immediately stored at –80°C and preserved until further extraction analysis, conducted within a month following the collection.
2.3 Primary production measurements
To assess the primary production of phytoplankton, a 13C stable isotope technique was employed, following Equation (1) as outlined by Hama et al. (1983):
where ΔPOC represents the increase in photosynthetically fixed POC during incubation, POC is the amount of POC in the incubated sample, ais is the 13C atom % in the incubated sample, ans is the 13C atom % in the natural sample, and aic is the 13C atom % in the total inorganic carbon.
Seawater samples were systematically collected from six light depths, specifically 100%, 50%, 30%, 12%, 5%, and 1%. However, only the data from three light depths (100%, 30%, and 1%) were used in our analyses for consistency with other measurements.
These samples were subsequently transferred into 1 L polycarbonate incubation bottles, each equipped with screen filters corresponding to the respective light depth. A solution containing a stable carbon isotope, NaH13CO3, was introduced into the incubation bottles. These prepared bottles were then placed in a large acrylic incubator on the deck, exposed to natural light conditions for a duration of 4 to 5 hours.
Following the incubation period, the seawater samples underwent filtration using precombusted 25 mm GF/F filters. The stable carbon isotope (13C) and POC content in the filtered samples were quantified utilizing a Finnigan Delta + XL mass spectrometer at the stable isotope laboratory of the University of Alaska Fairbanks, USA. Stable carbon isotope ratio was reported in δ notation as per mil (‰) as determined from Equation (2):
where X is 13C and R is the corresponding ratio of 13C/12C of sample and standard, respectively. Peptone was used standard for carbon and the uncertainty for δ13C measurement was ± 0.1 ‰.
2.4 Biomolecule extraction and quantification
Biomolecule extraction from the sample filters was conducted at the home laboratory of Pusan National University, adhering to established protocols detailed in Kim et al. (2018a) and Bhavya et al. (2019). The sample filter was initially sectioned into smaller pieces and placed in a polypropylene vial to commence the extraction process.
The CHO extraction method outlined by Dubois et al. (1956) was applied in this study. Ultrasonification with 1 mL deionized water initiated the process, followed by the addition of 1 mL of phenol reagent (5%). After allowing the solution to stand at room temperature for approximately 40 minutes, 5 mL of sulfuric acid was introduced to the vial. The solution was left at room temperature for an additional 10 minutes to complete the CHO extraction. PRT extraction employed colorimetric peptide-detecting assays following the methodologies of Lowry et al. (1951) and Fiset et al. (2017). A 20-minute ultrasonification with 1 mL of deionized water was performed, followed by the addition of 5 mL of Alkaline Copper solution. After 10-minute standing at room temperature and thorough mixing using a vortex mixer, 0.5 mL of diluted Folin-Ciocalteu phenol reagent was added to finalize the PRT extraction. LIP extraction followed well-established techniques described by Bligh and Dyer (1959) and Marsh and Weinstein (1966). Small fragments of the sample filter in an amber vial were treated with a mixture of 3 mL chloroform and methanol, followed by a 20-minute ultrasonification step. Subsequent steps included refrigeration, centrifugation, and careful transfer of the resulting supernatant to a new glass vial. The lower phase of the sample vial was then dried, and remaining steps involved rehydration with 2 mL deionized water, heating, and cooling in a water bath for approximately 10 minutes. Finally, the solvent with an additional 3 ml deionized water was mixed thoroughly using a vortex mixer and left to stand for 10 minutes to complete the LIP extraction process.
Following extraction, the concentration of each biomolecule was determined using a UV spectrophotometer (Hitachi-UH5300, Hitachi, Tokyo, Japan). Specific standards were employed to quantify the concentrations of CHO, PRT, and LIP. The standards used were solutions of glucose, bovine serum albumin, and tripalmitin for CHO, PRT, and LIP quantification, respectively. The choice of these standards aligns with recommendations from prior studies by Kim et al. (2018a) and Bhavya et al. (2019), ensuring consistency and comparability in the quantification process.
2.5 Bioenergetic calculations, conversion factor, and daily calorie production
The caloric value was determined using the Winberg equation (Kcal g–1 = 0.041 × CHO% + 0.055 × PRT% + 0.095 × LIP%), following the methodology outlined by Winberg (1971). The calorie content (Kcal m–3) was calculated by multiplying the caloric value (Kcal g–1) by the total biochemical concentration (sum of CHO, PRT, and LIP) of POM (g m–3) at each specific light depth, as detailed in the procedures described by Fabiano et al. (1993).
Regional conversion factors from carbon to caloric units were determined for the four different seasons by dividing the calorie content by the POC concentration at specific locations. Primary production, representing the amount of organic carbon produced per unit time (Platt and Irwin, 1973), formed the foundation for calorie production calculations, incorporating both primary production data and the conversion factor from carbon to caloric units.
To determine the euphotic water column-integral values in this study, concentrations at each station were integrated vertically from three different light depths (100%, 30%, and 1%) using the trapezoidal rule. The trapezoidal rule entails partitioning the water column into discrete depth intervals, computing the area under the curve formed by the plotted data points, and summing these areas to estimate the total integral (Abramowitz and Stegun, 1972). Employing this approach provided an approximation of the euphotic water column-integral values in this study.
For regional assessments, data from multiple stations within each bay were averaged to ensure a representative measurement for the entire region. Similarly, seasonal values were derived by averaging data collected during the same seasons within each bay.
3 Results and discussion
3.1 Seasonal dynamics of euphotic water column-integral POC concentration and daily primary production
Distinct seasonal variations in POC concentrations were observed across the Gwangyang, Jaran, and Geoje-Hansan bays during this study period (Figure 2). Gwangyang Bay displayed comparatively lower POC concentrations in spring (1.3 ± 0.3 g m–2) and autumn (2.3 ± 0.9 g m–2), while exhibiting higher concentrations in winter (3.0 ± 1.7 g m–2) and summer (4.3 ± 1.1 g m–2). A similar trend was noted in Jaran Bay, with the highest POC observed in summer (4.1 ± 1.3 g m–2), followed by winter (3.4 ± 1.1 g m–2). In contrast, Geoje-Hansan Bay displayed the highest POC concentration in winter (6.6 ± 5.4 g m–2), decreasing to summer (3.3 ± 1.2 g m–2). These findings suggest that factors influencing POC accumulation and distribution differ among the bays and exhibit seasonal variability. Previous studies have indicated significant variations in nutrient conditions, macromolecular compositions, and phytoplankton compositions in Gwangyang Bay depending on river discharge (Lee et al., 2017; Kim et al., 2019b; Kang et al., 2022). In contrast, Jaran and Geoje-Hansan bays, lacking noticeable river impacts as a factor influencing seasonal variations in POC concentrations, eliminate river impacts as a factor influencing seasonal variations in POC concentrations (Lee et al., 2020a).

Figure 2 Seasonal euphotic water column-integral particulate organic carbon (POC) concentrations from 100% to 1% light depths in Gwangyang (A), Jaran (B), and Geoje-Hansan (C) bays.
Corresponding to the seasonal variation in the POC concentrations, the euphotic water column in Gwangyang, Jaran, and Geoje-Hansan bays displayed distinct seasonality in primary production (Figure 3). Gwangyang Bay showed a notable increase in primary production from winter (0.06 g C m–2 d–1) to summer (0.61 g C m–2 d–1), followed by a decrease in autumn (0.13 g C m–2 d–1). Similarly, Jaran Bay exhibited a comparable trend, with the peak primary production occurring in summer (0.55 g C m–2 d–1), followed by lower values in winter (0.33 g C m–2 d–1) and autumn (0.45 g C m–2 d–1). In contrast, Geoje-Hansan Bay demonstrated a consistent increase in primary production throughout the seasons, ranging from 0.31 g C m–2 d–1 in winter to 0.70 g C m–2 d–1 in autumn. Although statistical significance was not observed, Geoje-Hansan Bay demonstrated relatively higher primary production compared to Gwangyang and Jaran bays. Among the three bays, Gwangyang Bay consistently exhibited relatively lower primary production throughout the season, except during the summer period. Given the absence of artificial dams in the Seomjin River, Gwangyang Bay is susceptible to the potential impact of river discharge on the bay ecosystem (Lee et al., 2017). Our study area in Gwangyang Bay experienced extremely turbid conditions throughout the seasons, with an average euphotic depth of less than 5 m, due to freshwater discharge and a strong tidal conditions (Lee et al., 2017). These factors likely contribute to the lower primary production observed in this bay. Additionally, the phytoplankton species compositions in Gwangyang Bay plays a significant role in its lower primary levels. Small cryptophytes, which are dominant in Gwangyang Bay due to the influence of Seomjin River inputs and tidal propagation to the Yeosu Channel, generally exhibit lower photosynthetic activities compared to larger phytoplankton such as diatoms (Lee et al., 2023), which dominate in Jaran and Geoje-Hansan bays (Shim et al., 1984; Kang et al., 2018; Kim et al., 2019c; Kang and Oh, 2021). This predominance of small phytoplankton further contributes to the lower primary production in Gwangyang Bay throughout the season compared to Jaran and Geoje-Hansan bays.
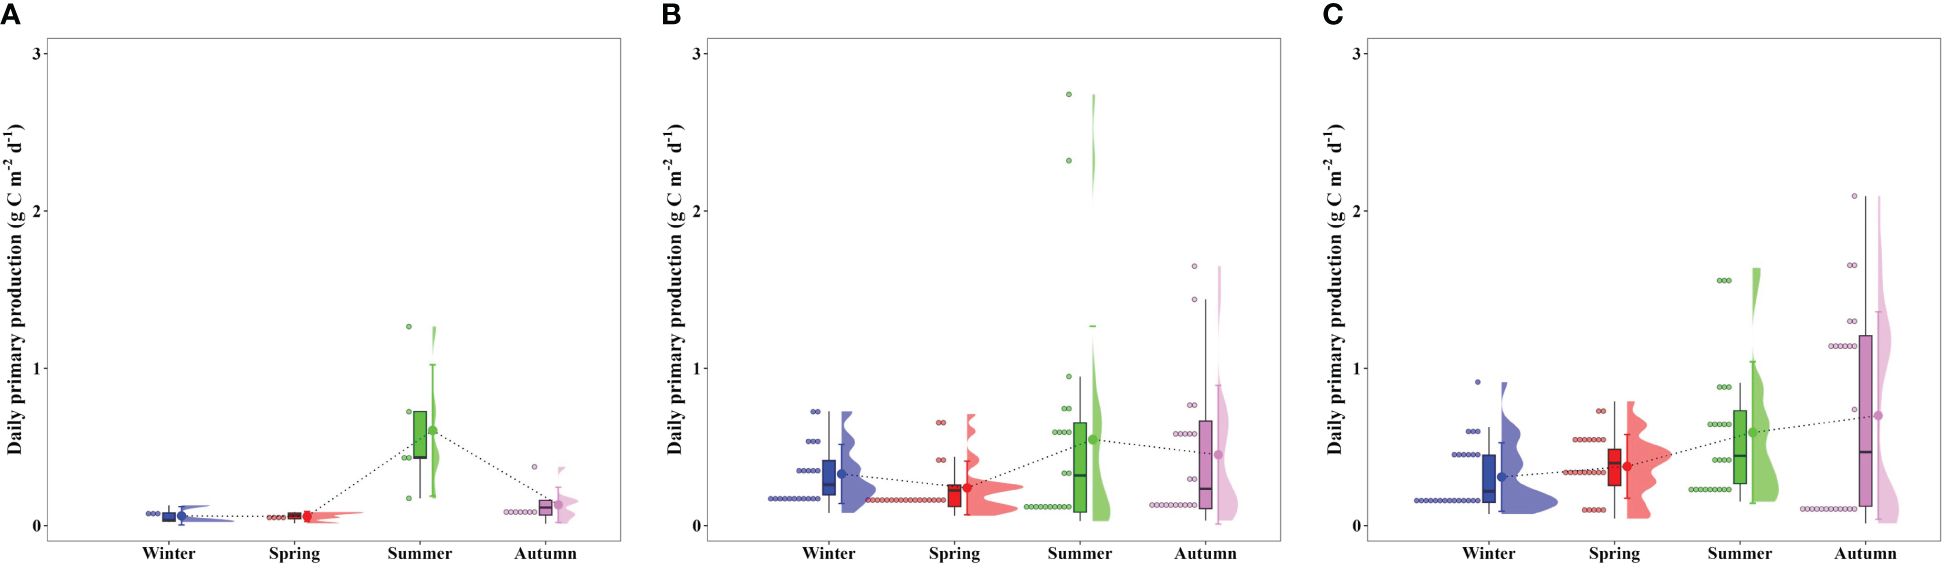
Figure 3 Seasonal euphotic water column-integral daily primary productions from 100% to 1% light depths in Gwangyang (A), Jaran (B), and Geoje-Hansan (C) bays.
3.2 Seasonal variations in macromolecular compositions
Seasonal dynamics of macromolecular compositions provide crucial insights into the physiological status of phytoplankton communities within marine ecosystems. In this study, the macromolecular compositions among the three studied bays−Gwangyang, Jaran, and Geoje-Hansan−were assessed, revealing notable distinctions, particularly in Gwangyang Bay (Figure 4). Gwangyang Bay exhibited marked seasonal changes in macromolecular compositions, representing a significant departure from the relatively stable compositions observed in Jaran and Geoje-Hansan bays. Specifically, Gwangyang Bay displayed a shift towards protein (PRT)-dominated compositions with decreased CHO content during spring, elevated lipid (LIP) content coupled with low PRT compositions during summer, and a tendency towards PRT dominance with lower LIP content in autumn.
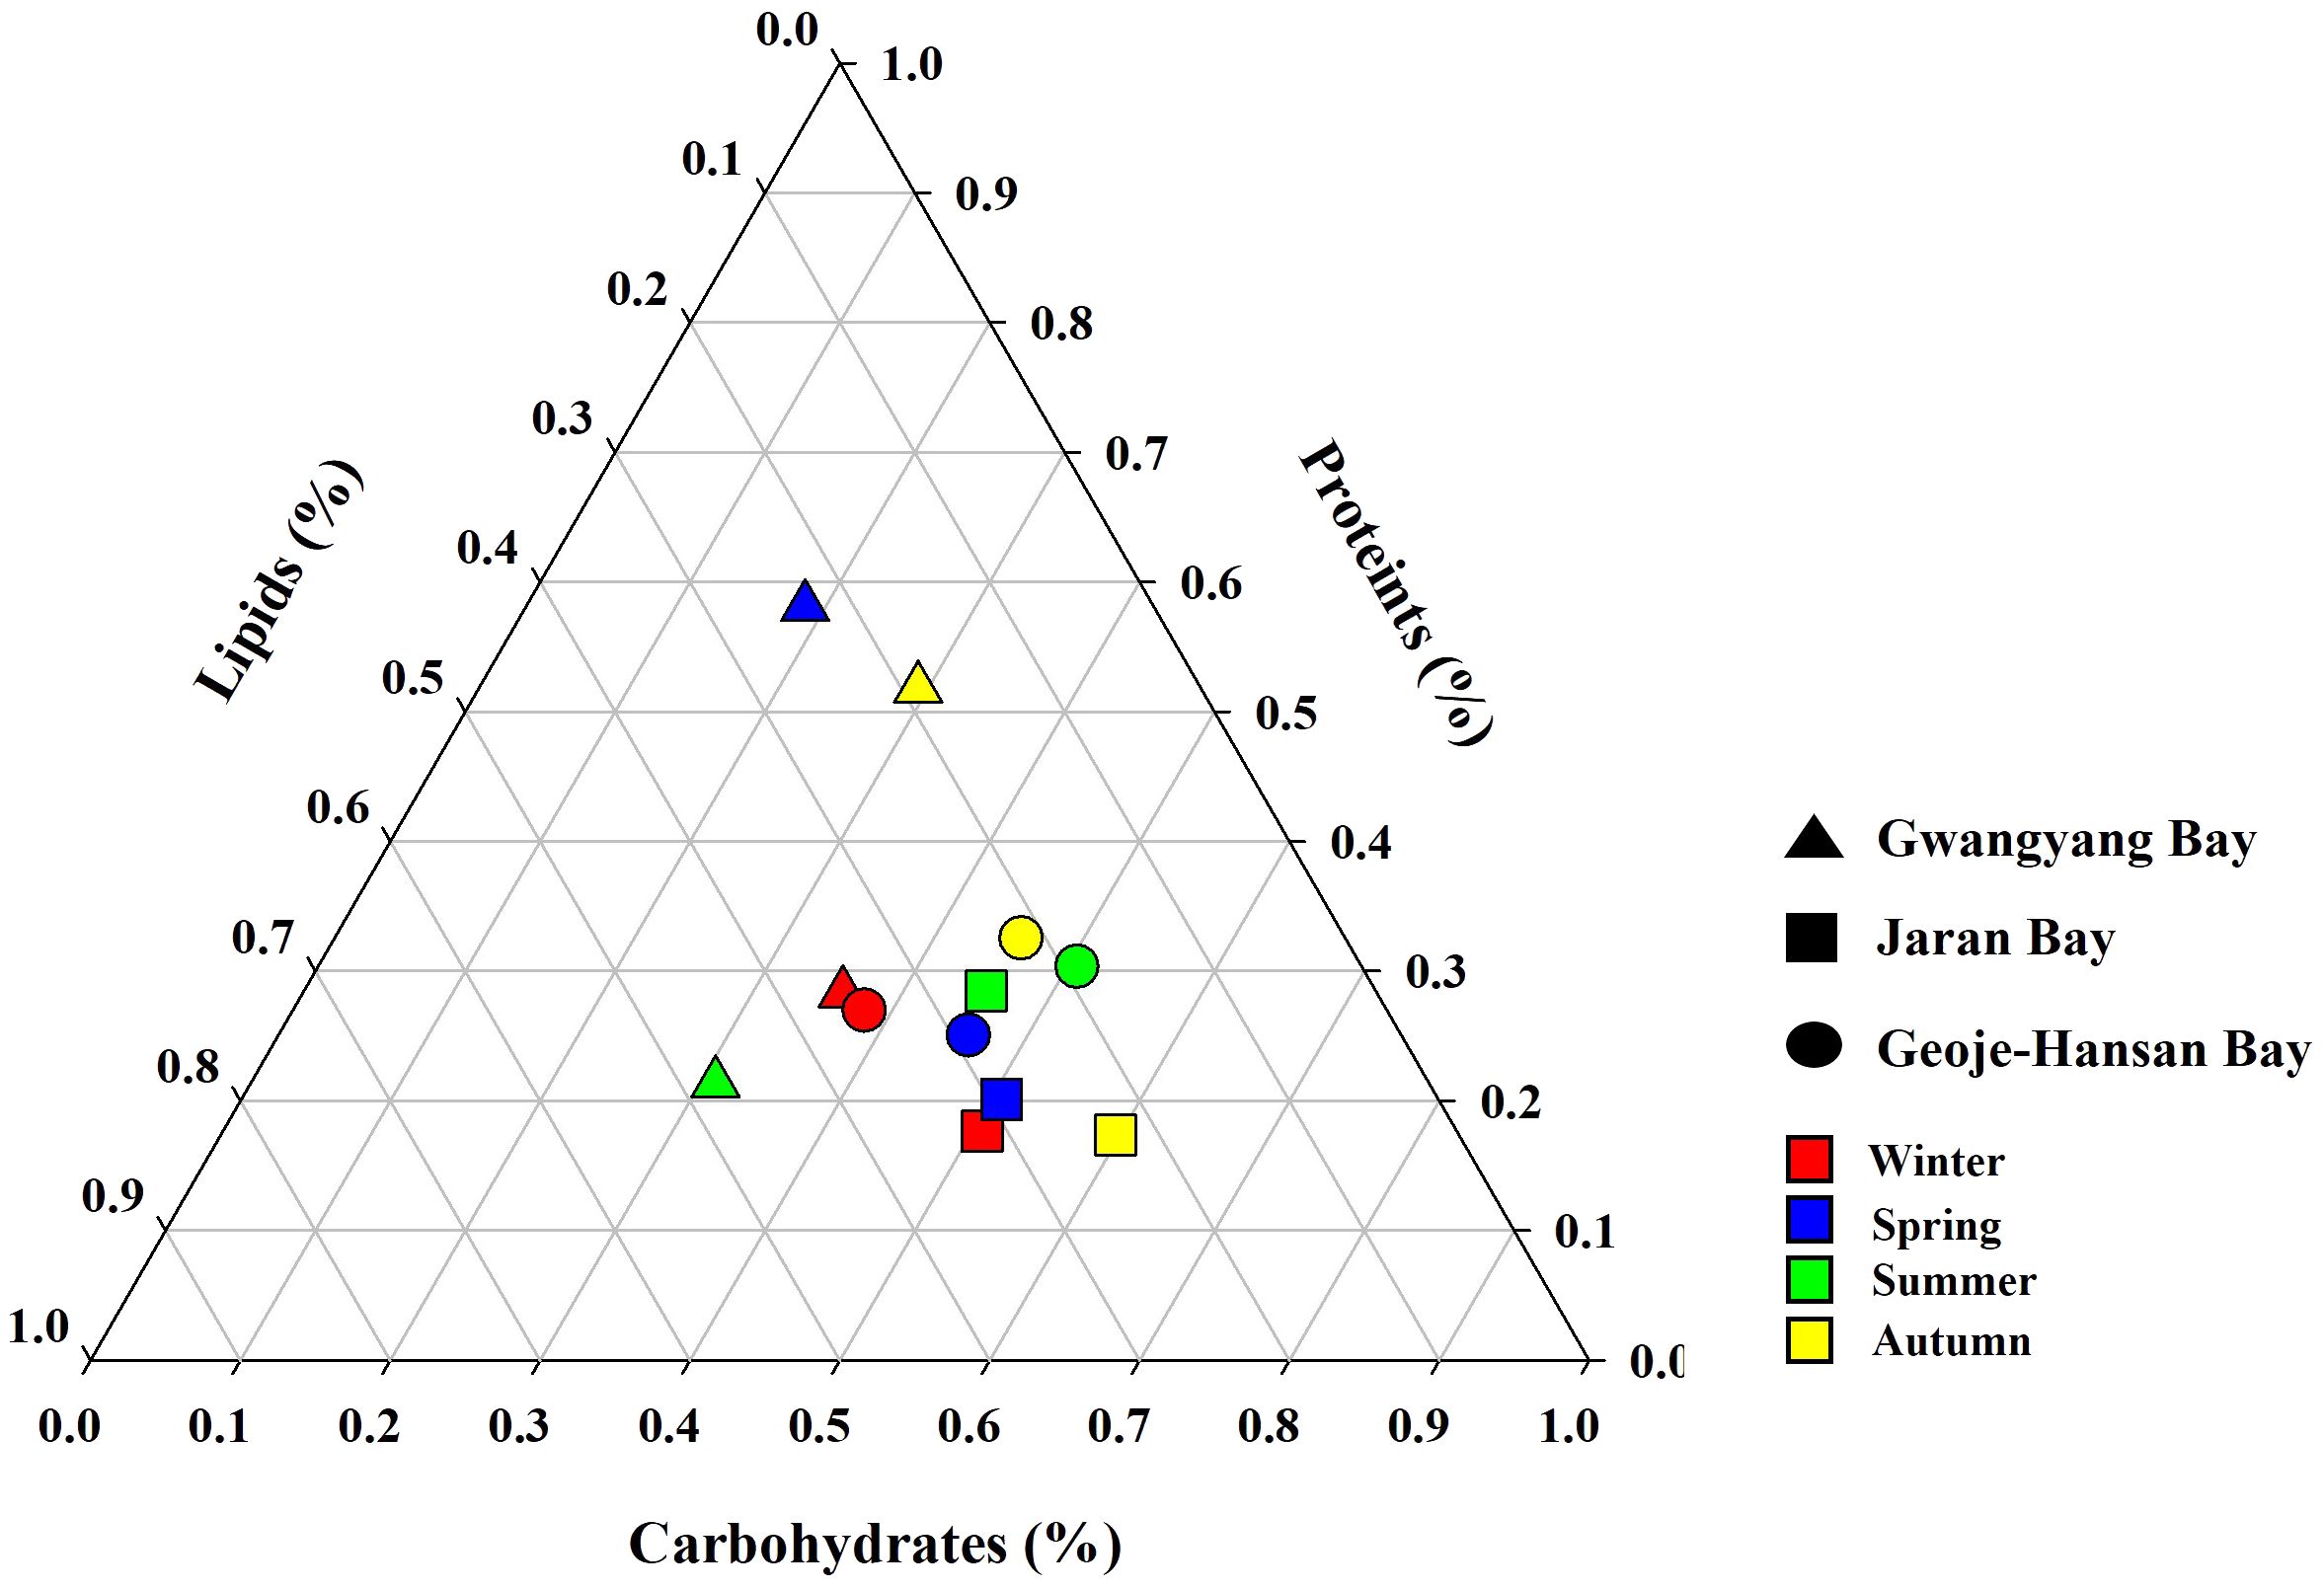
Figure 4 Ternary plots of seasonal macromolecular compositions in Gwangyang, Jaran, and Geoje-Hansan bays.
The observed discrepancies can be attributed to variations in phytoplankton physiology and water circulation patterns, as suggested in previous studies (Kim et al., 2018b). CHO, with their pivotal roles in supplying cellular carbon pools, including cell membranes and energy reservoirs, were consistently dominant in Jaran and Geoje-Hansan bays across all seasons (Van Oijen et al., 2004; Finkel et al., 2016; Duncan and Petrou, 2022). This CHO dominance aligns with global and regional patterns observed in various Korean bays, the East/Japan Sea, and world oceans (Jo et al., 2017; Kang et al., 2017; Roy, 2018; Kim et al., 2018b; Lee et al., 2020a, b). In contrast, Gwangyang Bay exhibited seasonal variations in macromolecular compositions, with a predominance of PRT. This PRT dominance is primarily attributed to river-borne nutrients, particularly dissolved inorganic nitrogen (DIN) from the Seomjin River, as evidenced by previous studies (Lee et al., 2017a; Kang et al., 2022). Significant positive relationships between PRT composition and DIN loading in Gwangyang Bay have been documented (Lee et al., 2017). Among various environmental factors, DIN is a major contributor to carbon allocations into PRT by phytoplankton (Bhavya et al., 2019). PRT is crucial for all enzymatic processes driving phytoplankton growth (Van Oijen et al., 2004; Finkel et al., 2016; Duncan and Petrou, 2022). The PRT-dominated compositions in Gwangyang Bay highlight the localized impact of river-borne nutrients, emphasizing the influence of specific environmental factors on phytoplankton physiology. Additionally, the predominance of small-sized phytoplankton in Gwangyang Bay (Shim et al., 1984; Kang and Oh, 2021) likely contributes to the PRT-dominated compositions. Small-sized phytoplankton tend to incorporate more carbon into PRT compared to larger phytoplankton (Lee et al., 2009). However, this relationship between different macromolecular compositions and phytoplankton cell size needs further validation.
These findings reveal significant variability in macromolecular compositions across different bays and seasons, with Gwangyang Bay standing out as a site with pronounced seasonal variations, while Geoje-Hansan and Jaran bays consistently displaying CHO-dominated compositions. Understanding such variations is crucial for elucidating the ecological dynamics of phytoplankton communities and their responses to environmental influences. The pronounced seasonal shifts in Gwangyang Bay, influenced by river-borne nutrients, contribute valuable insights into the intricate interplay between local environmental factors and phytoplankton physiology, enhancing our understanding of marine ecosystem dynamics.
3.3 Seasonal variations in euphotic water column-integral calorie contents and daily calorie production
Seasonal variations in the calorie contents integrated throughout the euphotic water column were compared among Gwangyang, Jaran, and Geoje-Hansan bays during this study (Figure 5). Notable seasonal variations in calorie contents were observed, with distinct patterns among the three bays.

Figure 5 Seasonal euphotic water column-integral calorie contents from 100% to 1% light depths in Gwangyang (A), Jaran (B), and Geoje-Hansan (C) bays.
Gwangyang and Geoje-Hansan bays displayed pronounced seasonal variations, contrasting with the relatively stable conditions observed in Jaran Bay. In Gwangyang Bay, seasonal calorie contents ranged from 35.1 Kcal m-2 (± 18.8 Kcal m-2) in winter to 11.2 Kcal m-2 (± 3.9 Kcal m-2) in autumn. Conversely, Jaran Bay exhibited consistent calorie contents ranging from 18.0 Kcal m-2 (± 5.5 Kcal m-2) in winter to 17.3 Kcal m-2 (± 4.7 Kcal m-2) in autumn. Geoje-Hansan Bay exhibited variations from 44.6 Kcal m-2 (± 33.8 Kcal m-2) in winter to 21.4 Kcal m-2 (± 9.2 Kcal m-2) in autumn. These variations in calorie content within the water column likely reflect the physiological state of phytoplankton community, with a gradual decline during their senescent phase (Platt and Subba Rao, 1970). Gwangyang and Geoje-Hansan bays, characterized by marked seasonal variation in the calorie contents, suggest corresponding variations in the physiological state of the phytoplankton community compared to Jaran Bay.
Notably, Geoje-Hansan Bay exhibited the highest calorie contents among the three bays, aligning with higher daily primary production, except during the summer period. Seasonally averaged calorie contents were 20.4 Kcal m–2 (± 11.9 Kcal m–2), 19.4 Kcal m–2 (± 2.0 Kcal m–2), and 30.9 Kcal m–2 (± 12.7 Kcal m–2) for Gwangyang, Jaran, and Geoje-Hansan bays, respectively. The annually averaged energy values in coastal waters, based on satellite ocean-color data, exhibit > 2.4 Kcal m–3 (Roy, 2018). For a simple comparison between Roy (2018) and this study, the calorie values can be > 24 Kcal m–2 if the average water depths in the Gwangyang, Jaran, and Geoje-Hansan bays are approximately 10 m depth, suggesting good agreement.
Seasonal conversion factors from carbon to calories were established for each bay to estimate calorie production from carbon (Figure 6). As we expected, the conversion factors vary seasonally among the three bays, reflecting fluctuations in the energy content of phytoplankton communities. In spring, Geoje-Hansan Bay displayed a significantly higher conversion factor (9.1 ± 2.7 Kcal (g C) –1; one-way ANOVA, p< 0.01) relative to Gwangyang Bay (7.5 ± 2.9 Kcal (g C) –1) and Jaran Bay (7.1 ± 1.4 Kcal (g C) –1). During the summer and autumn, the conversion factors showed no significant differences among the three bays, with average values of 6.8 Kcal (g C) –1 (± 3.2 Kcal (g C) –1), 5.9 Kcal (g C) –1 (± 1.6 Kcal (g C) –1), and 7.0 Kcal (g C) –1 (± 5.9 Kcal (g C) –1) for Gwangyang, Jaran, and Geoje-Hansan bays, respectively. Overall, Gwangyang Bay exhibited a significantly higher conversion factor (12.3 ± 3.7 Kcal (g C) –1; one-way ANOVA, p< 0.01), followed by Geoje-Hansan Bay (7.5 ± 2.1 Kcal (g C) –1) and Jaran Bay (5.5 ± 1.7 Kcal (g C) –1). These values are notably lower than the conversion factor (11.4 Kcal (g C) –1) suggested by Platt and Irwin (1973) without accounting for seasonal variations. Their conversion factor was derived from samples collected during the spring bloom of phytoplankton in St. Margaret’s Bay, Nova Scotia. Indeed, the conversion factor in this study was relatively higher during the spring season compared to other seasons, except for Gwangyang Bay exhibiting a significantly higher conversion factor during the winter period (Figure 6). These variations highlight the importance of considering both seasonal variations and appropriate conversion factors in assessing caloric content in diverse bay ecosystems.
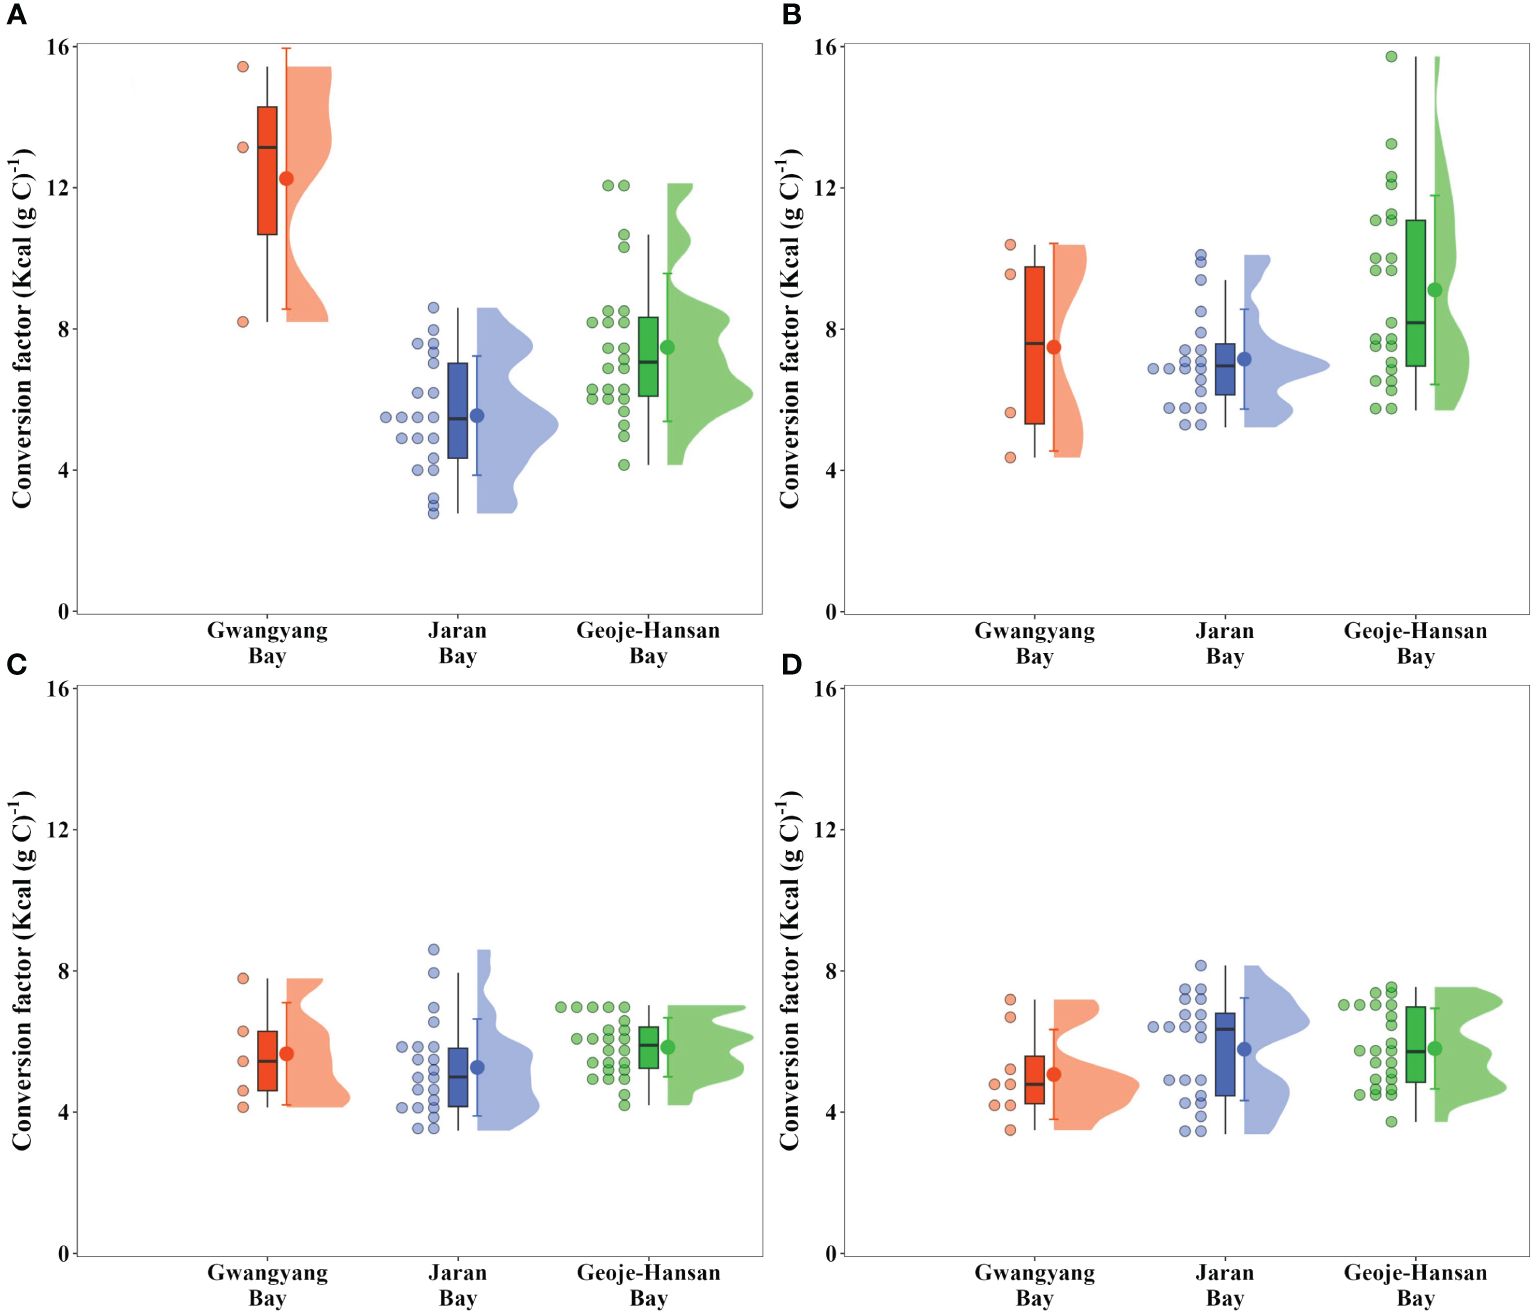
Figure 6 Seasonal conversion factors from carbon to caloric units in Gwangyang, Jaran, and Geoje-Hansan bays during winter (A), spring (B), summer (C), and autumn (D).
The seasonal daily calorie productions were derived from seasonal primary productions (Figure 3) and conversion factors (Figure 6) obtained from the present study at each bay, as displayed in Figure 7. The euphotic water column in Gwangyang, Jaran, and Geoje-Hansan bays displayed different seasonality in daily calorie production. Gwangyang Bay had the lowest calorie production during winter (0.63 ± 0.38 Kcal m-2 d-1) and spring (0.43 ± 0.34 Kcal m-2 d-1), followed by a substantial increase in summer (3.73 ± 2.98 Kcal m-2 d-1) and a subsequent decrease in autumn (0.67 ± 0.52 Kcal m-2 d-1). Jaran Bay showed relatively consistent calorie production across the seasons ranging from 1.66 Kcal m-2 d-1 (± 0.76 Kcal m-2 d-1) to 2.74 Kcal m-2 d-1 (± 3.06 Kcal m-2 d-1), indicating a more uniform energy production pattern. In line with higher daily primary production and calorie content, Geoje-Hansan Bay, with a peak during autumn (3.94 ± 3.63 Kcal m-2 d-1), exhibited relatively higher daily calorie production compared to both Gwangyang and Jaran bays throughout the season, except during the summer period. These regional variations in daily calorie production can be attributed to the combined effects of primary production and conversion factors among Gwangyang, Jaran, and Geoje-Hansan bays.
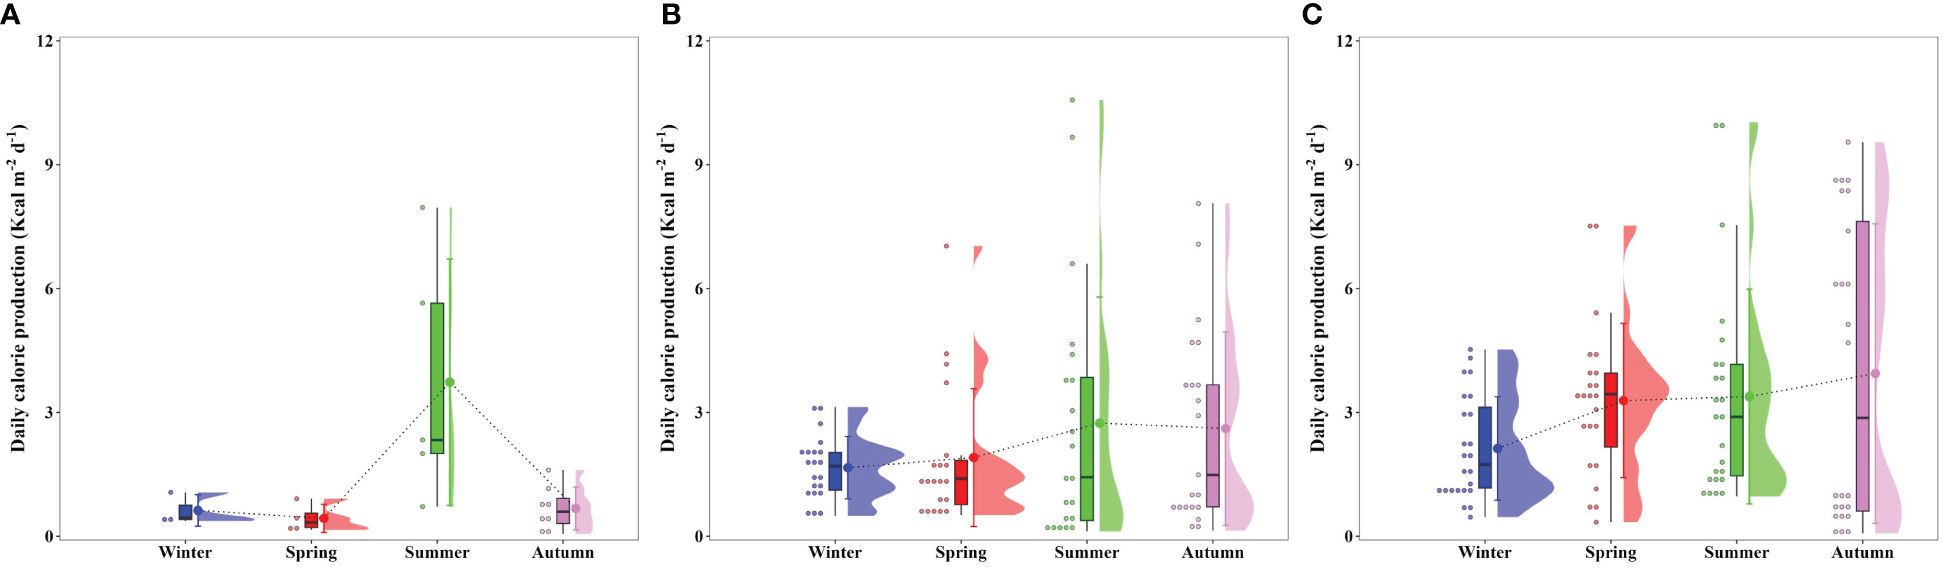
Figure 7 Seasonal daily calorie productions in Gwangyang (A), Jaran (B), and Geoje-Hansan (C) bays.
3.4 Regional comparison of annual primary production and calorie production
The annual primary productions and calorie productions for Gwangyang, Jaran, and Geoje-Hansan bays were assessed based on seasonal analyses. The estimated annual primary productions were 78 g C m–2 y–1, 143 g C m–2 y–1, and 181 g C m–2 y–1 for Gwangyang, Jaran, and Geoje-Hansan bays, respectively (Table 1). Correspondingly, the annual calorie productions were calculated as 499 Kcal m–2 y–1 for Gwangyang Bay, 814 Kcal m–2 y–1 for Jaran Bay, and 1302 Kcal m–2 y–1 for Geoje-Hansan Bay. These values reflect the calories produced per square meter annually by phytoplankton through photosynthesis within the euphotic layer. Geoje-Hansan Bay exhibited the highest the annual primary productions and calorie productions, followed by Jaran Bay and Gwangyang Bay. However, Gwangyang Bay demonstrated the highest energy efficiency, followed by Geoje-Hansan Bay and Jaran Bay, when examining the relationships between primary productions and calorie productions among the three bays (Figure 8). This suggests that phytoplankton in Gwangyang Bay can generate more calories per unit of carbon through photosynthesis compared to Geoje-Hansan and Jaran bays. This pattern aligns with the overall regional conversion factors observed in this study, with Gwangyang Bay showing the highest conversion factor, followed by Geoje-Hansan Bay and Jaran Bay. Therefore, regional conversion factors can serve as indirect indicators of energy efficiency.
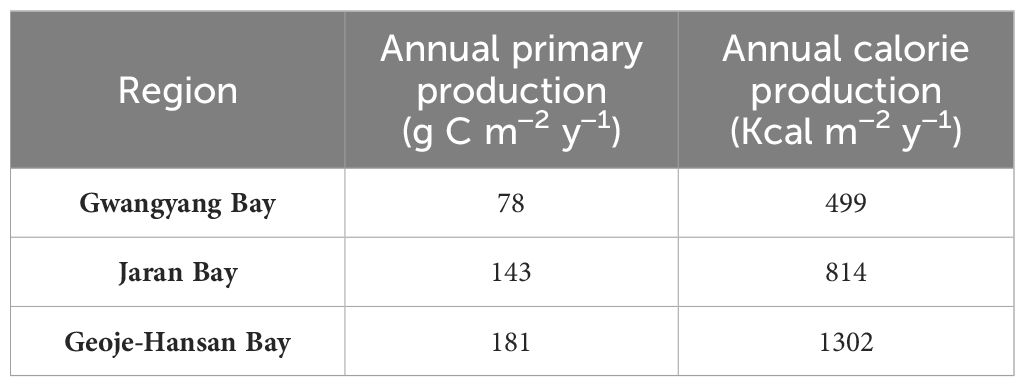
Table 1 Annual primary and calorie productions in Gwangyang, Jaran and Geoje-Hansan bays in South Korea.
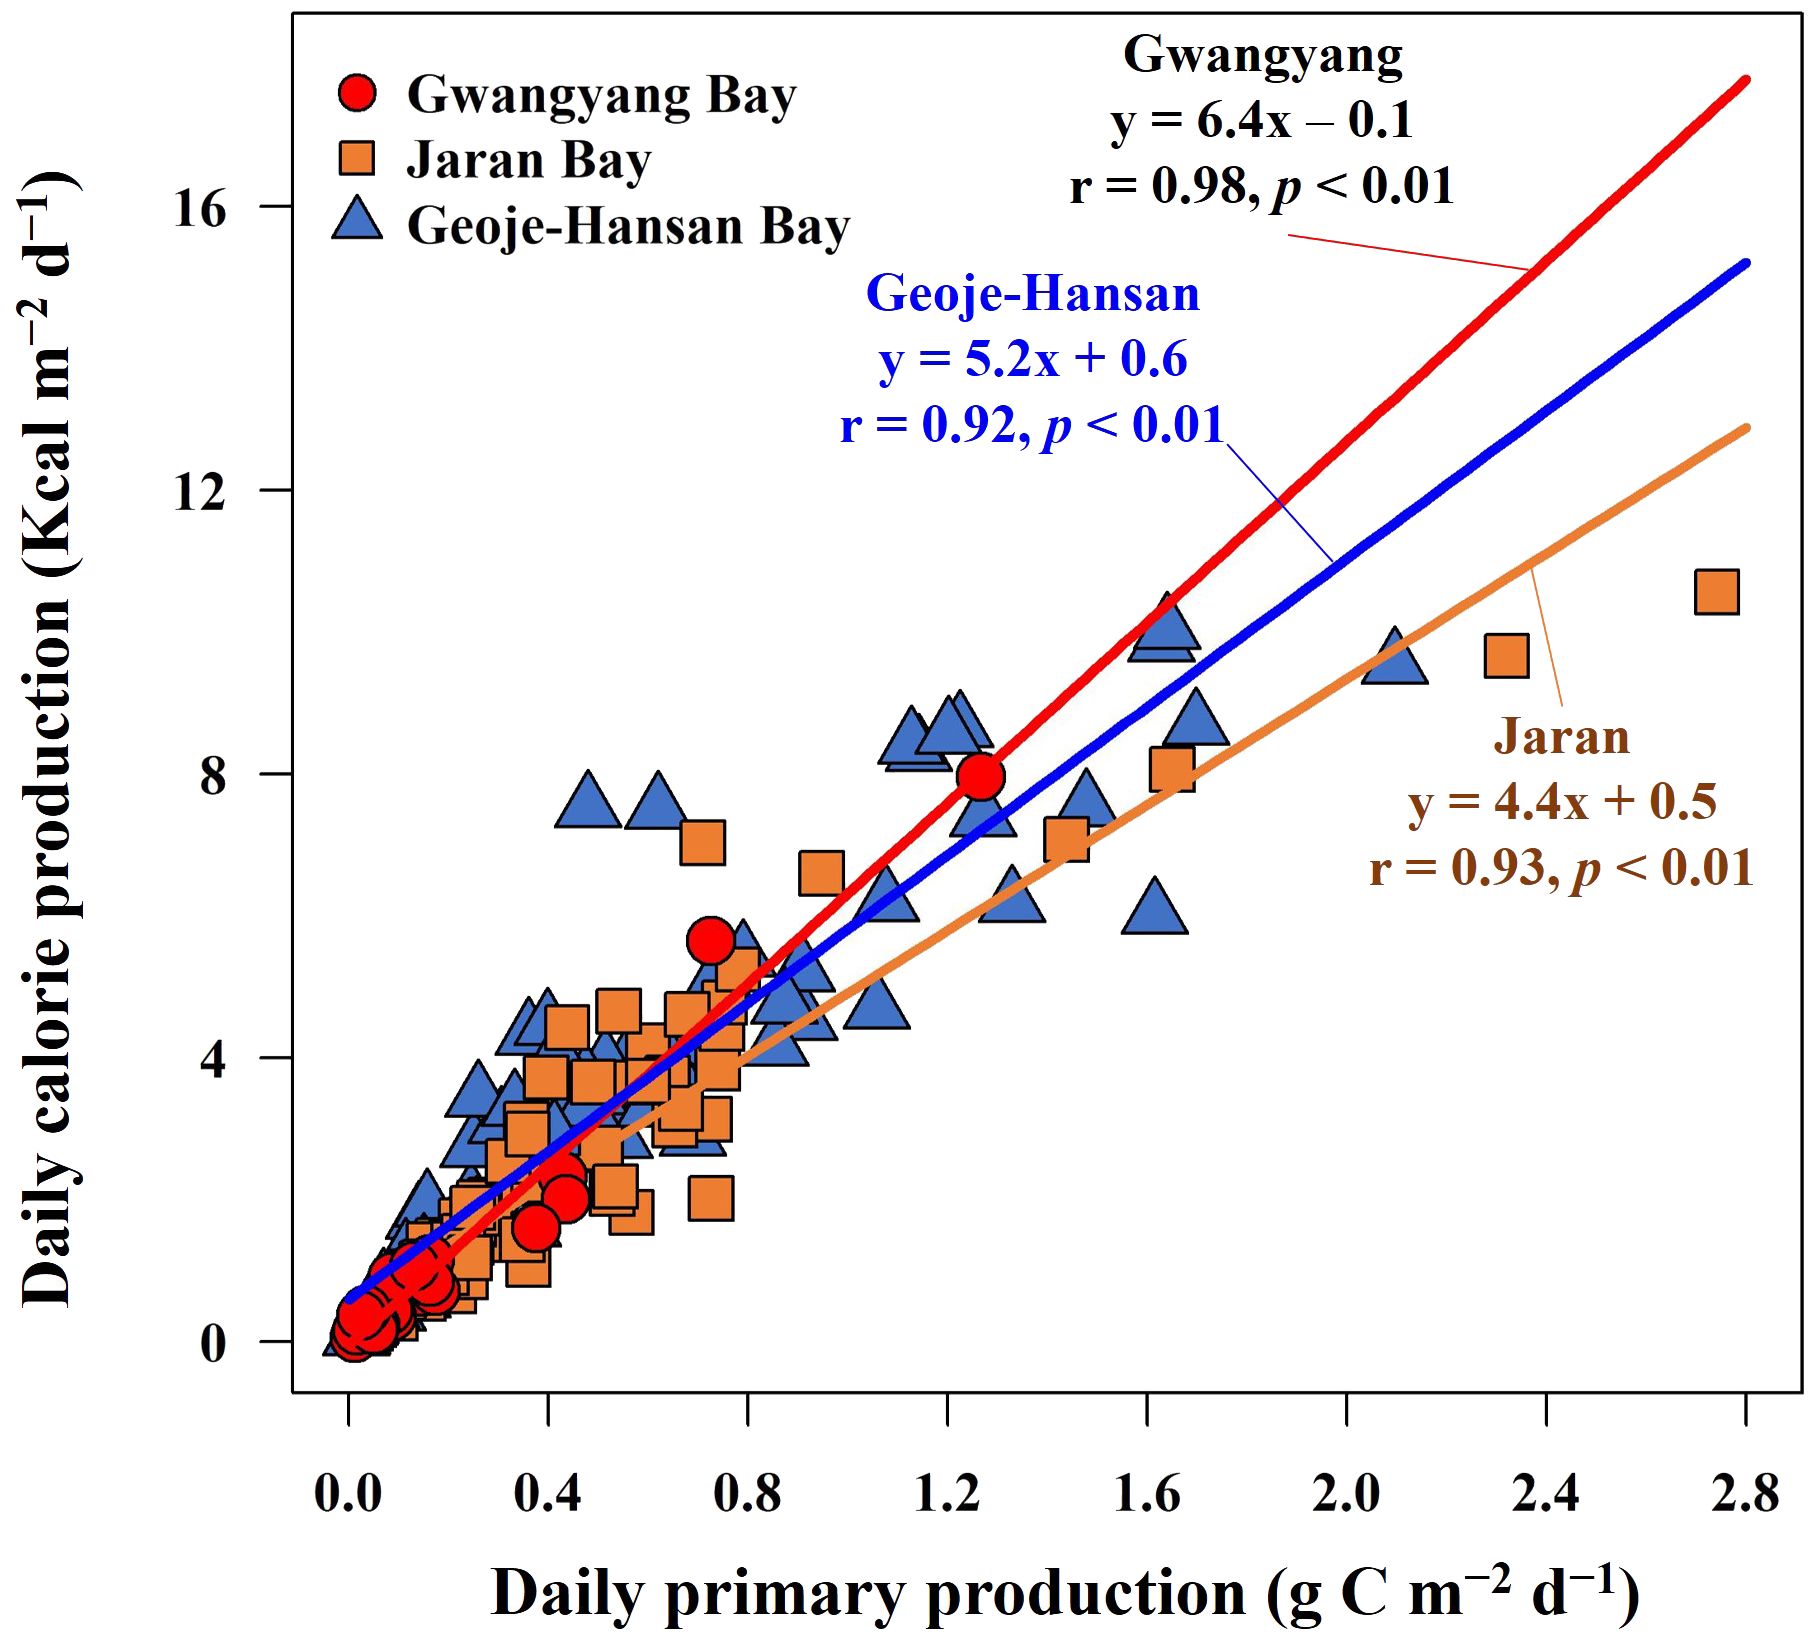
Figure 8 Relationships between daily primary production and daily calorie production in Gwangyang, Jaran, and Geoje-Hansan bays.
The observed variation in energy efficiency among phytoplankton communities suggests their differential capabilities in converting carbon into usable energy. For example, Hitchcock (1982) found varying caloric values for different phytoplankton species based on equivalent volume. The dominance of small cryptophytes in Gwangyang Bay likely contribute to its higher energy efficiency compared to diatoms-dominated Jaran and Geoje-Hansan bays (Shim et al., 1984; Kang et al., 2018; Kim et al., 2019c; Kang and Oh, 2021). Small phytoplankton species, such as cryptophytes, have been shown to assimilate energy more efficiently than larger counterparts, potentially enhancing the energy transfer efficiency to higher trophic levels (Kang et al., 2017). This increased energy efficiency directly influences the quantity and quality of food available to zooplankton populations and filter-feeding shellfish, leading to increased biomass and productivity of these organisms, which in turn can support larger populations of predators higher up the food chain.
Our study extended beyond conventional carbon-based measurements to estimate regional calorie productions fixed by phytoplankton within the study areas. This approach, incorporating energy-based assessments alongside carbon-based measurements, provides a more comprehensive understanding of the potential energy sources available to grazers within each specific location. While primary production measurements provide information on grams of carbon produced per unit time (Platt and Irwin, 1973), our calorie production estimation of calorie production offers additional insights into the potential energy source available to grazers in each specific location. Moreover, the energy efficiency derived from the relationship between primary production and calorie production could elucidate the trophic status of various marine ecosystems, with significant implications for shellfish aquaculture and fisheries management. Understanding energy efficiency provides valuable insights into the availability of energy resources for organisms at higher trophic levels, including zooplankton, shellfish, and ultimately, larger fish species, which is essential for maintaining ecosystem stability and resilience to environmental perturbations (Lewis et al., 2022). Phytoplankton energy efficiency influences the flow of energy from primary producers to higher trophic levels, affecting the overall structure and functioning of marine ecosystems (Eddy et al., 2021; Heneghan et al., 2021). Changes in phytoplankton energy efficiency can have cascading effects on ecosystem dynamics, leading to shifts in species composition, trophic interactions, and ecosystem services (Hairston and Hairston, 1993; Ullah et al., 2018).
In summary, our findings reveal significant variability in macromolecular compositions, primary production, and calorie production across Gwangyang, Jaran, and Geoje-Hansan bays. Gwangyang Bay, despite having the lowest primary production, exhibited the highest energy efficiency. This higher efficiency is attributed to the dominance of small cryptophytes and the influence of river-borne nutrients. Thus, the energy efficiency of phytoplankton calorie production serves as a crucial determinant of ecosystem productivity and trophic dynamics within marine environments. This study underscores the importance of considering macromolecular composition and energy efficiency to better understand the ecological dynamics and nutritional value of phytoplankton communities in marine ecosystems.
Data availability statement
The original contributions presented in the study are included in the article/supplementary material. Further inquiries can be directed to the corresponding author.
Author contributions
HJ: Writing – original draft, Conceptualization, Data curation, Formal analysis, Investigation, Methodology, Visualization, Writing – review & editing. JJK: Data curation, Formal analysis, Investigation, Writing – original draft. JL: Data curation, Formal analysis, Investigation, Writing – original draft. DL: Formal analysis, Investigation, Visualization, Writing – original draft. NJ: Data curation, Formal analysis, Writing – original draft. YK: Data curation, Formal analysis, Writing – original draft. KK: Investigation, Writing – review & editing. MK: Investigation, Writing – review & editing. SP: Conceptualization, Methodology, Writing – original draft. JK: Data curation, Formal analysis, Writing – original draft. JSK: Visualization, Writing – original draft. SA: Writing – review & editing. SL: Conceptualization, Funding acquisition, Methodology, Supervision, Validation, Writing – original draft, Writing – review & editing.
Funding
The author(s) declare financial support was received for the research, authorship, and/or publication of this article. This research was supported by Korea Institute of Marine Science & Technology (KIMST) funded by the Ministry of Oceans and Fisheries (RS-2023-00238486, Monitoring environmental and ecological changes in dynamic coasts and estuaries of the Korean four major rivers). This research was partially supported by the National Institute of Fisheries Science (NIFS) grant (R2024049) funded by the Ministry of Oceans and Fisheries.
Conflict of interest
The authors declare that the research was conducted in the absence of any commercial or financial relationships that could be construed as a potential conflict of interest.
Publisher’s note
All claims expressed in this article are solely those of the authors and do not necessarily represent those of their affiliated organizations, or those of the publisher, the editors and the reviewers. Any product that may be evaluated in this article, or claim that may be made by its manufacturer, is not guaranteed or endorsed by the publisher.
References
Abramowitz M., Stegun I. A. (Eds.) (1972). Handbook of Mathematical Functions with Formulas, Graphs, and Mathematical Tables, 9th printing (New York: Dover), 885.
Baek S.-H., Kim D., Son M., Yun S.-M., Kim Y.-O. (2015). Seasonal distribution of phytoplankton assemblages and nutrient-enriched bioassays as indicators of nutrient limitation of phytoplankton growth in Gwangyang Bay, Korea. Estuar. Coast. Shelf Sci. 163, 265–278. doi: 10.1016/j.ecss.2014.12.035
Bhavya P. S., Kim B. K., Jo N., Kim K., Kang J. J., Lee J. H., et al. (2019). A review on the macromolecular compositions of phytoplankton and the implications for aquatic biogeochemistry. Ocean Sci. J. 54, 1–14. doi: 10.1007/s12601-018-0061-8
Bligh E. G., Dyer W. J. (1959). A rapid method of total lipid extraction and purification. Can. J. Biochem. Physiol. 37, 911–917. doi: 10.1139/o59-099
Cho C. H., Park K. (1983). Eutrophication of bottom mud in shellfish farms, the Goseong-Jaran Bay. Korean J. Fish. Aquat. Sci. 16, 260–264.
Cho Y., Lee W.-C., Hong S., Kim H.-C., Kim J. B. (2012). GIS-based suitable site selection using habitat suitability index for oyster farms in Geoje-Hansan Bay, Korea. Ocean Coast. Manage. 56, 10–16. doi: 10.1016/j.ocecoaman.2011.10.009
Danovaro R., Fabiano M. (1997). Seasonal changes in quality and quantity of food available for benthic suspension-feeders in the Golfo Marconi (North-western Mediterranean). Estuar. Coast. Shelf Sci. 44, 723–736. doi: 10.1006/ecss.1996.0135
Dubois M., Gilles K. A., Hamilton J. K., Rebers P. A., Smith F. (1956). Colorimetric method for determination of sugars and related substances. Anal. Chem. 28, 350–356. doi: 10.1021/ac60111a017
Duncan R. J., Petrou K. (2022). Biomolecular composition of sea ice microalgae and its influence on marine biogeochemical cycling and carbon transfer through polar marine food webs. Geosci. 12 (1), 38. doi: 10.3390/geosciences12010038
Eddy T. D., Bernhardt J. R., Blanchard J. L., Cheung W. W., Colléter M., Du Pontavice H., et al. (2021). Energy flow through marine ecosystems: confronting transfer efficiency. Trends Ecol. Evol. 36, 76–86. doi: 10.1016/j.tree.2020.09.006
Fabiano M., Povero P., Danovaro R. (1993). Distribution and composition of particulate organic matter in the Ross Sea (Antarctica). Polar Biol. 3, 525–533. doi: 10.1007/BF00236394
Fernández-Reiriz M. J., Perez-Camacho A., Ferreiro M. J., Blanco J., Planas M., Campos M. J., et al. (1989). Biomass production and variation in the biochemical profile (total protein, carbohydrates, RNA, lipids and fatty acids) of seven species of marine microalgae. Aquaculture 83, 17–37. doi: 10.1016/0044-8486(89)90057-4
Finkel Z. V., Follows M. J., Liefer J. D., Brown C. M., Benner I., Irwin A. J. (2016). Phylogenetic diversity in the macromolecular composition of microalgae. PLoS One 11, e0155977. doi: 10.1371/journal.pone.0155977
Fiset C., Liefer J., Irwin A. J., Finkel Z. V. (2017). Methodological biases in estimates of macroalgal macromolecular composition. Limnol. Oceanogr. Methods 15, 618–630. doi: 10.1002/lom3.10186
Graf G. (1992). Benthic-pelagic coupling: a benthic view. Oceanogr. Mar. Biol. Annu. Rev. 30, 149–190.
Hairston J. N.G., Hairston S. N.G. (1993). Cause-effect relationships in energy flow, trophic structure, and interspecific interactions. Am. Nat. 142, 379–411. doi: 10.1086/285546
Hama T., Miyazaki T., Iwakuma T., Takahashi M., Otsuki A., Ichimura S. (1983). Measurement of photosynthetic production of a marine phytoplankton population using a stable 13C isotope. Mar. Biol. 73, 31–36. doi: 10.1007/BF00396282
Heneghan R. F., Galbraith E., Blanchard J. L., Harrison C., Barrier N., Bulman C., et al. (2021). Disentangling diverse responses to climate change among global marine ecosystem models. Prog. Oceanog. 198, 102659. doi: 10.1016/j.pocean.2021.102659
Hitchcock G. L. (1982). A comparative study of the size-dependent organic composition of marine diatoms and dinoflagellates. J. Plankton Res. 4, 363–377. doi: 10.1093/plankt/4.2.363
Jo N., Kang J. J., Park W. G., Lee B. R., Yun M. S., Lee J. H., et al. (2017). Seasonal variation in the biochemical compositions of phytoplankton and zooplankton communities in the southwestern East/Japan Sea. Deep. Res. Part II Top. Stud. Oceanogr. 143, 82–90. doi: 10.1016/j.dsr2.2016.12.001
Jo N., La H. S., Kim J. H., Kim K., Kim B. K., Kim M. J., et al. (2021). Different biochemical compositions of particulate organic matter driven by major phytoplankton communities in the northwestern Ross Sea. Front. Microbiol. 12. doi: 10.3389/fmicb.2021.623600
Kang J. J., Jang H. K., Lim J. H., Lee D., Lee J. H., Bae H., et al. (2020). Characteristics of different size phytoplankton for primary production and biochemical compositions in the western East/Japan Sea. Front. Microbiol. 11. doi: 10.3389/fmicb.2020.560102
Kang J. J., Joo H. T., Lee J. H., Lee J. H., Lee H. W., Lee D., et al. (2017). Comparison of biochemical compositions of phytoplankton during spring and fall seasons in the northern East/Japan Sea. Deep. Res. Part II Top. Stud. Oceanogr. 143, 73–81. doi: 10.1016/j.dsr2.2017.06.006
Kang J. J., Lee J. H., Kim H. C., Lee W. C., Lee D., Jo N., et al. (2018). Monthly variations of phytoplankton community in Geoje-Hansan bay of the southern part of Korea based on HPLC pigment analysis. J. Coast. Res. 85, 356–360. doi: 10.2112/SI85-072.1
Kang Y., Kwak I. S., Kang C. K. (2022). Co-occurrence of Bacillariophyceae-based and Cryptophyceae-based planktonic food webs in a temperate estuarine ecosystem revealed via eDNA. Estuar. Coast. Shelf Sci. 264, 107661. doi: 10.1016/j.ecss.2021.107661
Kang Y., Oh Y. (2021). Different roles of top-down and bottom-up processes in the distribution of size-fractionated phytoplankton in Gwangyang Bay. Water 13, 1682. doi: 10.3390/w13121682
Kim B. K., Lee S. H., Ha S. Y., Jung J., Kim T. W., Yang E. J., et al. (2018a). Vertical distributions of macromolecular composition of particulate organic matter in the water column of the Amundsen Sea Polynya during the summer in 2014. J. Geophys. Res. Ocean. 123, 1393–1405. doi: 10.1002/2017JC013457
Kim B. K., Lee J. H., Joo H., Song H. J., Yang E. J., Lee S. H., et al. (2016). Macromolecular compositions of phytoplankton in the Amundsen Sea, Antarctica. Deep Sea Res. II Top. Stud. Oceanogr. 123, 42–49. doi: 10.1016/j.dsr2.2015.04.024
Kim D., Lee Y. J., Kang H. Y., Kwon K. Y., Lee W. C., Kwak J. Y. (2019a). Seasonal variations in primary productivity and biomass of phytoplankton in Geoje-Hansan Bay on the southern coast of Korea. Ocean Sci. J. 54, 213–227. doi: 10.1007/s12601-019-0005-y
Kim H. C., Lee J. H., Lee W. C., Hong S., Kang J. J., Lee D., et al. (2018b). Decoupling of macromolecular compositions of particulate organic matters between the water columns and the sediment in Geoje-Hansan Bay, South Korea. Ocean Sci. J. 53, 735–743. doi: 10.1007/s12601-018-0052-9
Kim J. H., Hong S., Lee W. C., Kim H. C., Eom K. H., Jung W. S., et al. (2019c). Estimation of the effect of flushing time on oyster aquaculture potential in Jaran Bay. Ocean Sci. J. 54, 559–571. doi: 10.1007/s12601-019-0039-1
Kim Y., Lee J. H., Kang J. J., Lee J. H., Lee H. W., Kang C. K., et al. (2019b). River discharge effects on the contribution of small-sized phytoplankton to the total biochemical composition of POM in the Gwangyang Bay, Korea. Estuar. Coast. Shelf Sci. 226, 106293. doi: 10.1016/j.ecss.2019.106293
Kwak S. N., Huh S. H., Kim H. W. (2012). Change in fish assemblage inhabiting around Dae Island in Gwangyang Bay, Korea. J. Korean Soc Mar. Environ. 18, 175–184. doi: 10.7837/kosomes.2012.18.3.175
Kwon J. N., Park Y. C., Eom K. H. (2013). The characteristic of long term variation of the water quality from Hansan-Geoje bay, Korea. J. Korean Soc Mar. Environ. 16, 189–201. doi: 10.7846/JKOSMEE.2013.16.3.189
Laws E. A. (1991). Photosynthetic quotients, new production and net community production in the open ocean. Deep Sea Res. Part A. Oceanographic Res. Papers 38, 143–167. doi: 10.1016/0198-0149(91)90059-O
Lee B. D., Kang H. K., Kang Y. J. (1991). Primary production in the oyster farming bay. Bull. Korean Fish. Soc 24, 39–51. doi: 10.1007/BF02697696
Lee J. H., Kang J. J., Jang H. K., Jo N., Lee D., Yun M. S., et al. (2020b). Major controlling factors for spatio-temporal variations in the macromolecular composition and primary production by phytoplankton in Garolim and Asan bays in the Yellow Sea. Reg. Stud. Mar. Sci. 36, 101269. doi: 10.1016/j.rsma.2020.101269
Lee J. H., Kim H. C., Lee T., Lee W. C., Kang J. J., Jo N., et al. (2018). Monthly variations in the intracellular nutrient pools of phytoplankton in Jaran Bay, Korea. J. Coast. Res. 85, 331–335. doi: 10.2112/SI85-067.1
Lee J. H., Lee D., Kang J. J., Joo H. T., Lee J. H., Lee H. W., et al. (2017). The effects of different environmental factors on the biochemical composition of particulate organic matter in Gwangyang Bay, South Korea. Biogeosciences 14, 1903–1917. doi: 10.5194/bg-14-1903-2017
Lee J. H., Lee W. C., Kim H. C., Jo N., Jang H. K., Kang J. J., et al. (2020c). Transparent exopolymer particle (TEPs) dynamics and contribution to particulate organic carbon (POC) in Jaran bay, Korea. Water 12, 1057. doi: 10.3390/w12041057
Lee J. H., Lee W. C., Kim H. C., Jo N., Kim K., Lee D., et al. (2020a). Temporal and spatial variations of the biochemical composition of phytoplankton and potential food material (Fm) in Jaran bay, South Korea. Water 12, 1–16. doi: 10.3390/w12113093
Lee S. H., Kim H. J., Whitledge T. E. (2009). High incorporation of carbon into proteins by the phytoplankton of the Bering Strait and Chukchi Sea. Cont. Shelf Res. 29, 1689–1696. doi: 10.1016/j.csr.2009.05.012
Lee S. H., Whitledge T. E., Kang S.-H. (2008). Carbon uptake rates of sea ice algae and phytoplankton under different light intensities in a landfast sea ice zone, Barrow, Alaska. Arctic. 61, 281–291. doi: 10.14430/arctic25
Lee S. H., Yun M. S., Jang H. K., Kang J. J., Kim K., Lee D., et al. (2023). Size-differential photosynthetic traits of phytoplankton in the Chukchi Sea. Cont. Shelf Res. 255, 104933. doi: 10.1016/j.csr.2023.104933
Lewis K. A., Christian R. R., Martin C. W., Allen K. L., McDonald A. M., Roberts V. M., et al. (2022). Complexities of disturbance response in a marine food web. Limnol. Oceanogr. 67, S352–S364. doi: 10.1002/lno.11790
Liebezeit G. (1984). Particulate carbohydrates in relation to phytoplankton in the euphotic zone of the Bransfield Strait. Polar Biol. 2, 225–228. doi: 10.1007/BF00263628
Lowry O. H., Rosebrough N. J., Farr A. L., Randall R. J. (1951). Protein measurement with the folin phenol reagent. J. Biol. Chem. 193, 265–275. doi: 10.1016/0922-338X(96)89160-4
Marsh J. B., Weinstein D. B. (1966). Simple charring method for determination of lipids. J. Lipid Res. 7, 574–576. doi: 10.1016/S0022-2275(20)39274-9
Parrish C. C., McKenzie C. H., MacDonald B. A., Hatfield E. A. (1995). Seasonal studies of seston lipids in relation to microplankton species composition and scallop growth in South Broad Cove, Newfoundland. Mar. Ecol. Prog. Ser. 129, 151–164. doi: 10.3354/meps129151
Platt T., Irwin B. (1973). Caloric content of phytoplankton. Limnol. Oceanogr. 18, 306–310. doi: 10.4319/lo.1973.18.2.0306
Platt T., Subba Rao D. V. (1970). Primary production measurements on a natural plankton bloom. J. Fish. Res. Board Can. 27, 887–899. doi: 10.1139/f70-095
Roy S. (2018). Distributions of phytoplankton carbohydrate, protein and lipid in the world oceans from satellite ocean colour. ISME J. 12, 1457–1472. doi: 10.1038/s41396-018-0054-8
Shim J. H., Shin Y. K., Lee W. H. (1984). On the phytoplankton distribution in the Kwangyang Bay. J. Korean Soc Oceanogr. 19, 176–186.
Ullah H., Nagelkerken I., Goldenberg S. U., Fordham D. A. (2018). Climate change could drive marine food web collapse through altered trophic flows and cyanobacterial proliferation. PloS Biol. 16, e2003446. doi: 10.1371/journal.pbio.2003446
Umehara A., Asaoka S., Fujii N., Otani S., Yamamoto H., Nakai S., et al. (2018). Biological productivity evaluation at lower trophic levels with intensive Pacific oyster farming of Grassostrea gigas in Hiroshima Bay, Japan. Aquac. 495, 311–319. doi: 10.1016/j.aquaculture.2018.05.048
Van Oijen T., Van Leeuwe M. A., Gieskes W. W. C., De Baar H. J. W. (2004). Effects of iron limitation on photosynthesis and carbohydrate metabolism in the Antarctic diatom Chaetoceros brevis (Bacillariophyceae). Eur. J. Phycol. 39, 161–171. doi: 10.1080/0967026042000202127
Wetz M. S., Yoskowitz D. W. (2013). An ‘extreme future for estuaries? effects of extreme climatic events on estuarine water quality and ecology. Mar. pollut. Bull. 69, 7–18. doi: 10.1016/j.marpolbul.2013.01.020
Winberg G. (1971). Symbols, Units and Conversion Factors in Studies of Fresh Water Productivity Vol. 23 (London: International Biological Programme).
Xu Q., Yang H. (2007). Food sources of three bivalves living in two habitats of Jiaozhou Bay (Qingdao, China): indicated by lipid biomarkers and stable isotope analysis. J. Shellfish Res. 26, 561–567. doi: 10.2983/0730-8000(2007)26[561:FSOTBL]2.0.CO;2
Yoon S. P., Jung R. H., Kim Y. J., Hong S. J., Oh H. T., Lee W. C. (2009). Spatio-temporal changes in macrobenthic community structure and benthic environment at an intensive oyster culturing ground in Geoje-Hansan Bay, Korea. Sea 14, 213–228. doi: 10.7850/jkso.2009.14.4.213
Keywords: macromolecular compositions, calorie content, primary production, Geoje-Hansan bay, Gwangyang bay, Jaran bay, calorie production
Citation: Jang HK, Kang JJ, Lee JH, Lee D, Jo N, Kim Y, Kim K, Kim M-J, Park S, Kim J, Kim J, Ahn SH and Lee SH (2024) Comparison of annual biosynthetic calorie productions by phytoplankton in different southern Korean bays. Front. Mar. Sci. 11:1367137. doi: 10.3389/fmars.2024.1367137
Received: 08 January 2024; Accepted: 11 July 2024;
Published: 29 July 2024.
Edited by:
Alex J. Poulton, Heriot-Watt University, United StatesReviewed by:
Min-Seob Kim, National Institute of Environmental Research (NIER), Republic of KoreaSergey Mosharov, P.P. Shirshov Institute of Oceanology (RAS), Russia
Copyright © 2024 Jang, Kang, Lee, Lee, Jo, Kim, Kim, Kim, Park, Kim, Kim, Ahn and Lee. This is an open-access article distributed under the terms of the Creative Commons Attribution License (CC BY). The use, distribution or reproduction in other forums is permitted, provided the original author(s) and the copyright owner(s) are credited and that the original publication in this journal is cited, in accordance with accepted academic practice. No use, distribution or reproduction is permitted which does not comply with these terms.
*Correspondence: Sang Heon Lee, c2FuZ2xlZUBwdXNhbi5hYy5rcg==