 Wei Wei
 Shining Huang3
 Hao Qin
 Lin Mu
94% of researchers rate our articles as excellent or good
Learn more about the work of our research integrity team to safeguard the quality of each article we publish.
Find out more
ORIGINAL RESEARCH article
Front. Mar. Sci., 19 March 2024
Sec. Coastal Ocean Processes
Volume 11 - 2024 | https://doi.org/10.3389/fmars.2024.1364929
Coastal areas face escalating storm surge disasters due to rising sea levels and urban growth, posing greater risks to lives and property. Comprehensive storm surge risk assessment and sensitivity analysis in coastal areas are crucial for effective disaster prevention and mitigation. This research focuses on Huizhou, China, conducting a comparative study of storm surge risk assessment and sensitivity analysis based on an integrated approach, which includes the storm surge inundation numerical model (FVCOM-SWAN), Geographic Information System (GIS) and Remote Sensing (RS) techniques, and Multiple Criteria Decision-Making (MCDM) methods. Ten flood-related risk indicators are selected from the hazard, exposure and vulnerability, the weights of which are evaluated through a comprehensive comparison among Analytic Hierarchy Process (AHP), Fuzzy Analytic Hierarchy Process (FAHP), Entropy Weight (EW), AHP-EW, and FAHP-EW methods. High-precision risk level maps are generated subsequently utilizing GIS and RS techniques. Sensitivities of the indicators are analyzed using One-At-A-Time (OAT) and Fourier Amplitude Sensitivity Test (FAST) methods. The proposed storm surge risk assessment framework, the MCDM comparative study and the sensitivity analysis can offer insights for better understanding and management of storm surge risks, and contribute to the standardization and application of storm surge risk assessment.
With the increase of global population and the acceleration of urbanization, the economy and population of the coastal regions are mostly growing gradually, owing to their unique geographical advantages (Magnan et al., 2022). However, the Intergovernmental Panel on Climate Change (IPCC) predicted that in the coming decades, the intensity of extreme weather events, including surges, heavy rainfall, and sea-level rise, will intensify even further (Tangney, 2020). This implies that the coastal areas, characterized by high urban population density and greater susceptibility to extreme weather, will face significantly increased risks (Lu et al., 2022). Therefore, accurate prediction of storm surge tide processes, assessment of disaster risk levels, and sensitivity analysis play crucial roles in efficiently deploying defensive measures and risk mitigation strategies for storm surge disasters in coastal regions. According to existing literature, research on storm surge risk assessment mainly involves two aspects: the computation of storm surge flooding processes and the selection of risk assessment methods.
In addressing the issue of the computation of storm surge flooding processes, current scholars primarily utilize ocean numerical models to simulate and predict the tidal variations in seawater during typhoon events. Since the beginning of the 21st century, various models for storm surge inundation prediction have emerged (Chaumillon et al., 2017), including dynamic-based numerical simulation models and machine learning models primarily. Dynamic-based numerical simulation models have been widely applied for their accuracy and the ability of simulating real physical process. For instance, models based on WRF-FVCOM, the Coupled Ocean-Atmosphere-Wave-Sediment Transport (COAWST) modeling system, models based on SWAN-FVCOM, and the ADCIRC-SWAN model are commonly employed (Sian et al., 2020; Yang et al., 2020; Li and Chen, 2022). The use of numerical models for simulating and predicting storm surges has reached a mature stage, allowing researchers to choose appropriate models based on the study area and objectives. In recent years, machine learning models have gained considerable research attention due to their high prediction efficiency, especially the artificial neural network-based storm surge models (Chi and Rong, 2021). For instance, artificial neural network models, deep reinforcement learning-based approaches, Convolutional Neural Networks (CNN), and Long Short-Term Memory (LSTM) have also been applied in storm surge research (Wang et al., 2020; Adeli et al., 2023; Davila Hernandez et al., 2023).
Regarding the selection of methods for storm surge risk assessment, there are three main research methods for risk assessment of meteorological disasters: statistical analysis based on historical data, Multiple Criteria Decision-Making (MCDM) methods and machine learning techniques (Lyu and Yin, 2023). In methods based on historical data, Rilo et al. (2022) established a database derived from historical data on estuarine flood events and applied a framework using multiple correspondence analysis to process qualitative past flood information for flood disaster analysis. In MCDM methods, the most commonly employed methods include AHP, FAHP, and EW (Lyu et al., 2018; Sepehri et al., 2019; Ramkar and Yadav, 2021; Aslan, 2023). MCDM methods inherently involve subjective and objective aspects in the assessment process. Hence, some researchers nowadays focus on refining existing methods. For instance, Lyu and Yin (2023) proposed the use of Interval-FAHP to assess various disasters in Hong Kong. Alternatively, researchers employ a combination of methods to assess risk. For example, Azizi et al. (2023) utilized COPRAS-Entropy, COPRAS-AHP, DFID-Entropy, and DFID-AHP to determine a suitable approach for assessing flood risk in the Iranian region. In recent years, some researchers have employed machine learning models such as gradient boosting decision tree (GBDT), extreme gradient boosting (XGBoost), convolutional neural network (CNN), logistic regression, and random forest for risk assessment (Li et al., 2019; Chen et al., 2021). However, both the utilization of statistical analysis based on historical data and the application of machine learning methods requires a sufficient amount of literature data and observational data to establish an adequate risk database. In underdeveloped regions, where historical data is lacking or insufficient, research based on historical data and machine learning methods can be challenging to pursue. Despite the diversity of existing risk assessment methods, literature on storm surge risk assessment still predominantly employs conventional approaches. Current research on storm surge risk assessment often relies on only two indicators, namely, land use and land cover (LULC) data and inundation data, failing to capture the comprehensiveness of the disaster assessment process (De Scally, 2014; Zhang et al., 2016; Xianwu et al., 2020; Wang Y et al., 2021).
In summarizing the above research literature, although there were researches on both the storm surge flooding simulation and disaster risk assessment, there was a lack of full-chain framework for storm surge risk assessment. As a result, when evaluating the potential risk of impending storm surges, the scientific community and decision-makers do not know which path to follow. At the same time, for the disaster risk assessment, there have been various MCDM methods proposed by previous literatures. However, the applicability of these methods on the storm surge risk assessment of undeveloped coastal areas has never been studied. As a result, it is hard for us to know which method is better at describing the storm surge risks. Furthermore, there has been many assessment indicators suggested by the previous literatures to be used in disaster risk assessment, and yet there is no exploration of the sensitivity of these indicators for storm surge risk assessment. In storm surge risk assessments, it is crucial to give due consideration to which assessment indicators play a predominant role in the process.
Considering the above three issues, this research proposes a comprehensive framework for storm surge risk assessment, which includes the storm surge flooding simulation, the risk assessment and the sensitivity analysis. The analysis and discussions thereafter validate the practicability of the framework using a case study of Huizhou City of China. For the selection of storm surge assessment methods, this study employs the MCDM method, which involves the consideration of relevant evaluation criteria, and the requirement for historical risk data is not stringent. This research conducts a comparative study of 5 commonly used MCDM methods to identify their differences for the storm surge risk assessment, so that the scientific community and decision-makers can select the most suitable method when managing storm surge risks. The selecting five MCDM methods, namely: Analytic Hierarchy Process (AHP), Fuzzy Analytic Hierarchy Process (FAHP), Entropy Weight (EW), AHP-EW, and FAHP-EW methods. These five MCDM methods encompass not only commonly used subjective and objective assessment approaches in research but also comprehensive methods that refine individual techniques. Regarding the issue concerning the sensitivity analysis of risk assessment indicators, there is limited research in this area. This paper employs commonly used methods such as the One-At-A-Time (OAT) and the Fourier Amplitude Sensitivity Test (FAST) methods to evaluate the sensitivities of these indicators (Chen et al., 2010; Dano et al., 2019; de Brito et al., 2019). The comparative sensitivity results between the OAT and FAST methods are intended to assist in validating the accuracy of sensitivity analysis. The sensitivity of risk indicators helps decision-makers gain a clearer understanding of the sensitivity level associated with each evaluation indicator. The proposed framework, the MCDM comparative study and the sensitivity analysis can offer insights for better understanding and management of storm surge risks, and contribute to the standardization and application of storm surge risk assessment.
Huizhou city is situated in the southeastern coastal area of Guangdong Province, at the northeastern end of the Pearl River Delta and in the middle-lower reaches of the Dongjiang River. It is located between 113°51’ to 115°28’ east longitude and 22°4’ to 23°57’ north latitude. As a major coastal city, Huizhou has a marine area of 4,520 square kilometers and a coastline approximately 281.4 kilometers long. Among this coastline, 135.8 kilometers are natural coastlines, while 145.6 kilometers are artificial coastlines, accounting for 48% of the total. The coastal areas are home to an airport, key ports, large residential areas, nuclear power plants, and other major enterprises. In 2020, Huizhou city had a permanent population of 6.0429 million people, with a very high population density in the urban areas. Figure 1 depicts the zoning map of coastal towns in Huizhou City.
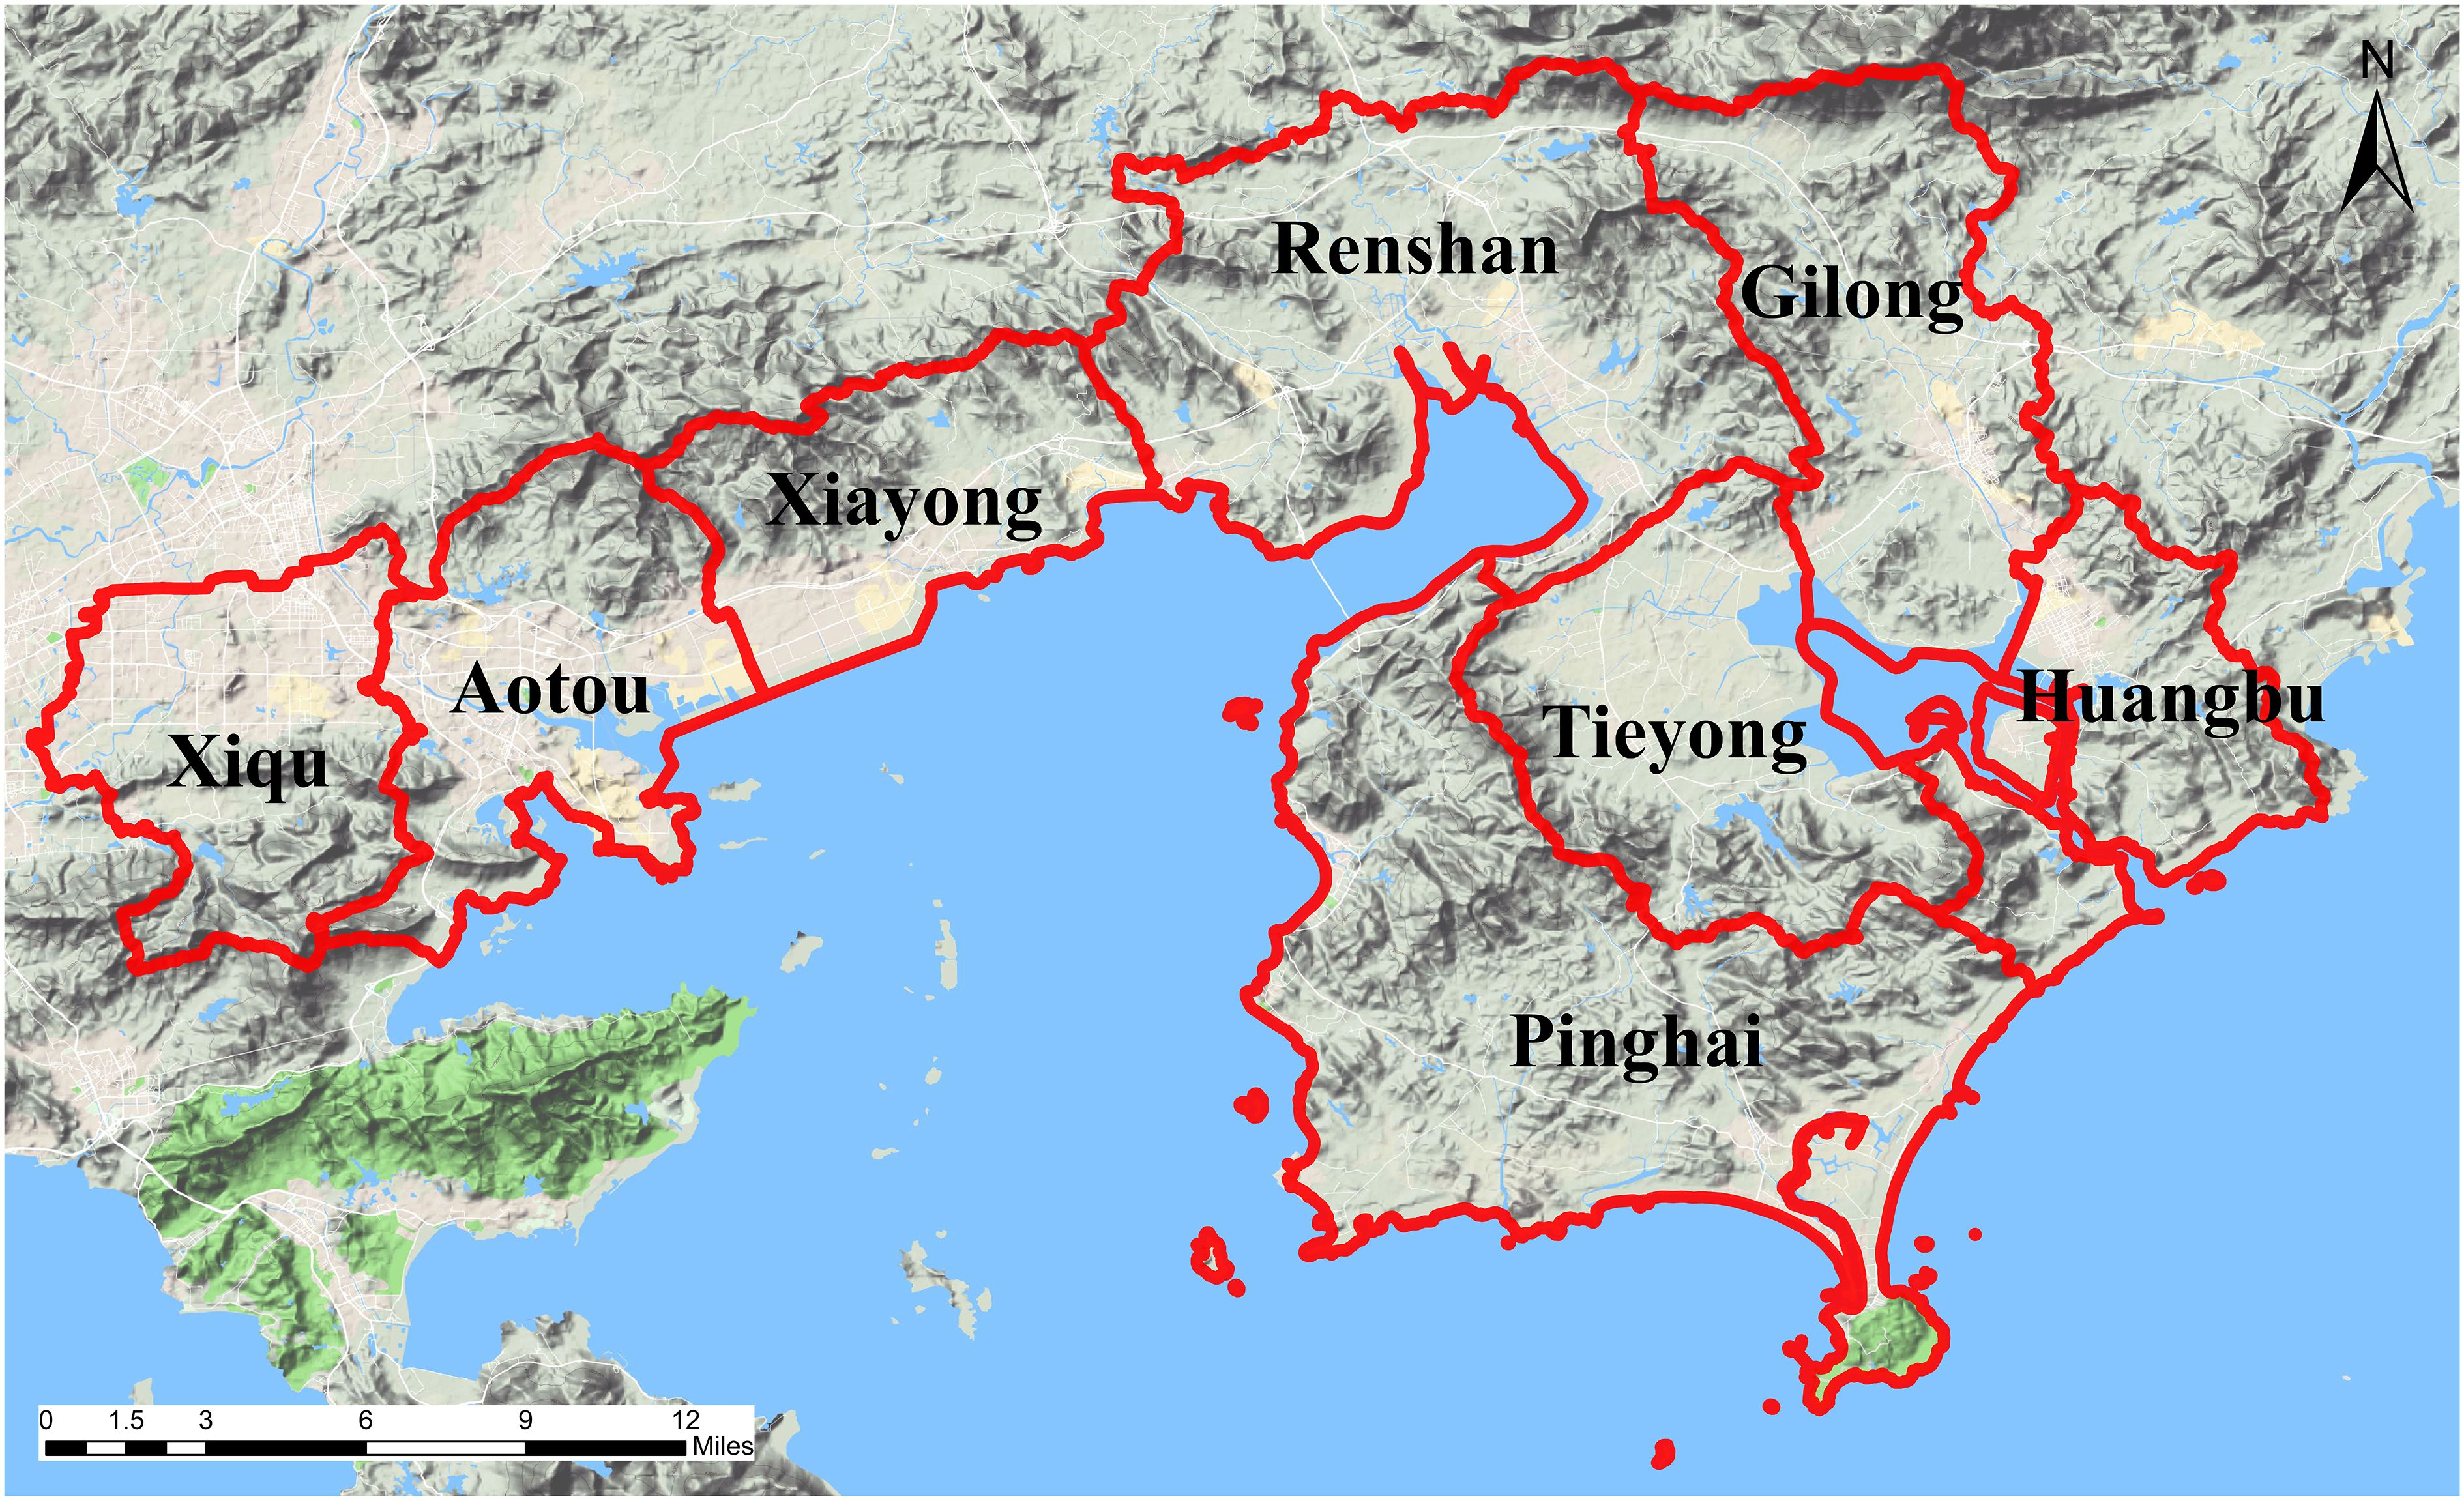
Figure 1 The zoning map of coastal towns in Huizhou City.
Storm surge is one of the most significant oceanic hazards in Huizhou city. On average, there are 2.5 storm surge events with a water level rise of more than 50 cm each year. Storm surges, accompanied by strong winds and high waves, can lead to tidal surges, dyke breaches, shipwrecks, flooding of farmland, and destruction of houses, resulting in substantial economic and human losses.
Table 1 illustrates the recent years’ losses in Huizhou City due to typhoon disasters, these data are sourced from the Department of Natural Resources of Huizhou Bureau. The process of assessing the risk level of storm surge disasters in Huizhou city and simulating potential storm surge disasters aims to facilitate the efficient deployment of disaster prevention measures before the onset of storm surge disasters. Meanwhile, the results of marine disaster risk zoning can serve as a reference for effectively avoiding high-risk areas in the subsequent layout of marine economic industries.

Table 1 The recent years have witnessed Huizhou City experiencing losses due to typhoon disasters.
The data utilized in the storm surge inundation model and their respective sources are outlined below:
(1) ERA-5: the 10-meter wind field reanalysis data is obtained from the European Centre for Medium-Range Weather Forecasts (ECMWF). In this study, it is integrated with the Holland wind field model to construct the typhoon wind field.
(2) Historical typhoon data: obtained from the China Meteorological Administration, and this data is employed to assess establish of the storm surge model.
(3) Water Level Records: obtained from the Huizhou tidal station measured by Department of Natural Resources of Huizhou Bureau. This data is applied to verify the simulation results of typhoon storm surge.
The selection of assessment indicators is crucial for the assessment of natural disaster risk levels. In this study, a summary of indicator selection for flood disaster risk assessment from recent literature is conducted. This study primarily choses a total of ten assessment indicators representing hazard, exposure, and vulnerability for the study area. Figures 2 and 3 depict the map data of these assessment indicators in the coastal areas of Huizhou city. The following provides a detailed introduction to the selected indicators and data sources. Exposure refers to the risk elements influenced by flood hazard and serves as the bridge connecting hazard and vulnerability (Yin et al., 2015). Regarding vulnerability, there is no unified concept (Kablan et al., 2017). This study considers the accessibility of indicator data and selects flood disaster assessment indicators for Huizhou City based on the causative factors, disaster-prone environment, and vulnerable bodies.
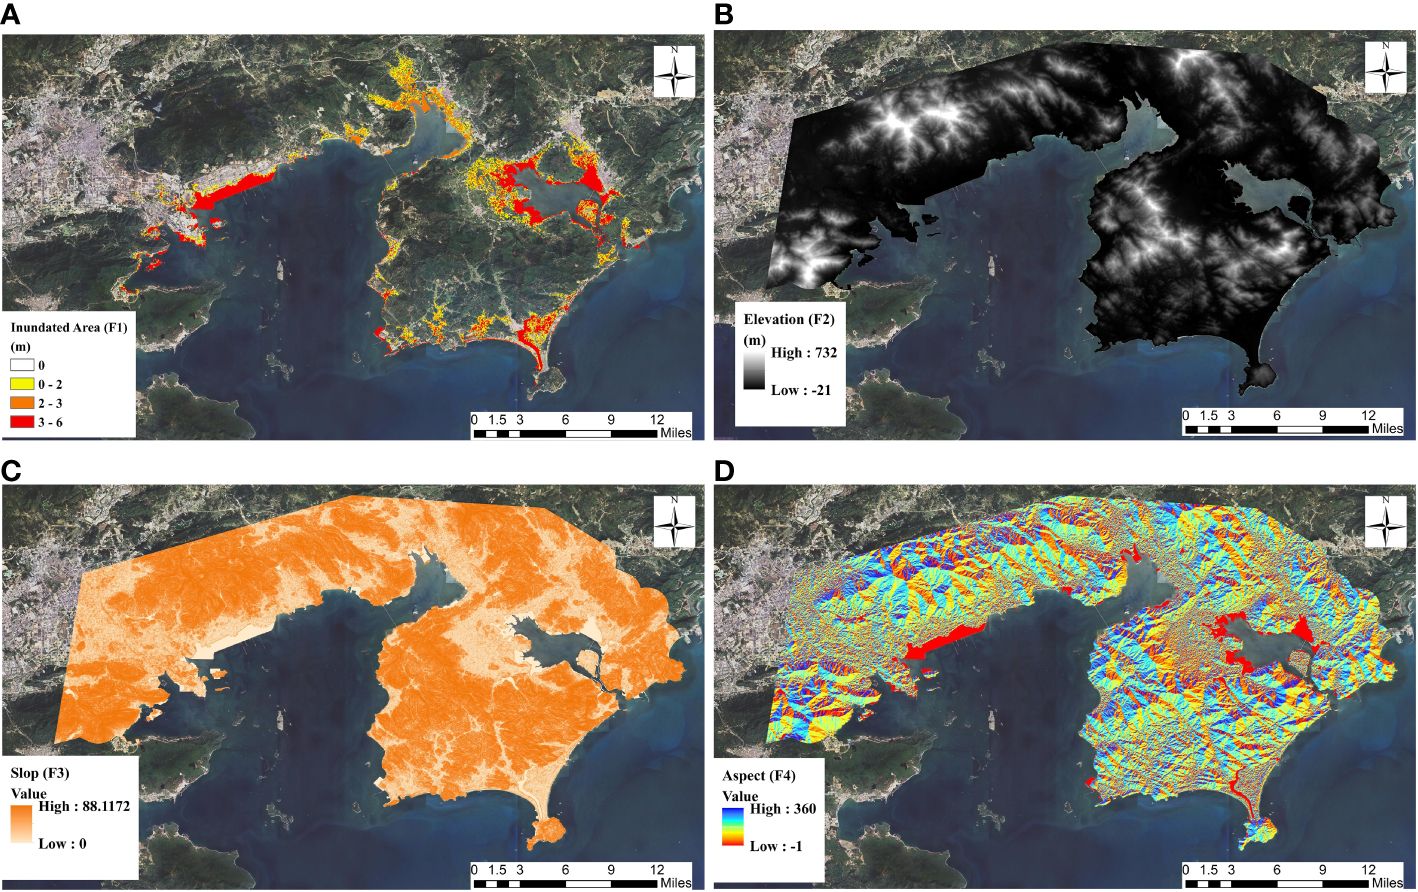
Figure 2 Maps depicting the indicator data used for storm surge risk assessment. (A) inundation depth; (B) DEM; (C) slope; (D) aspect.
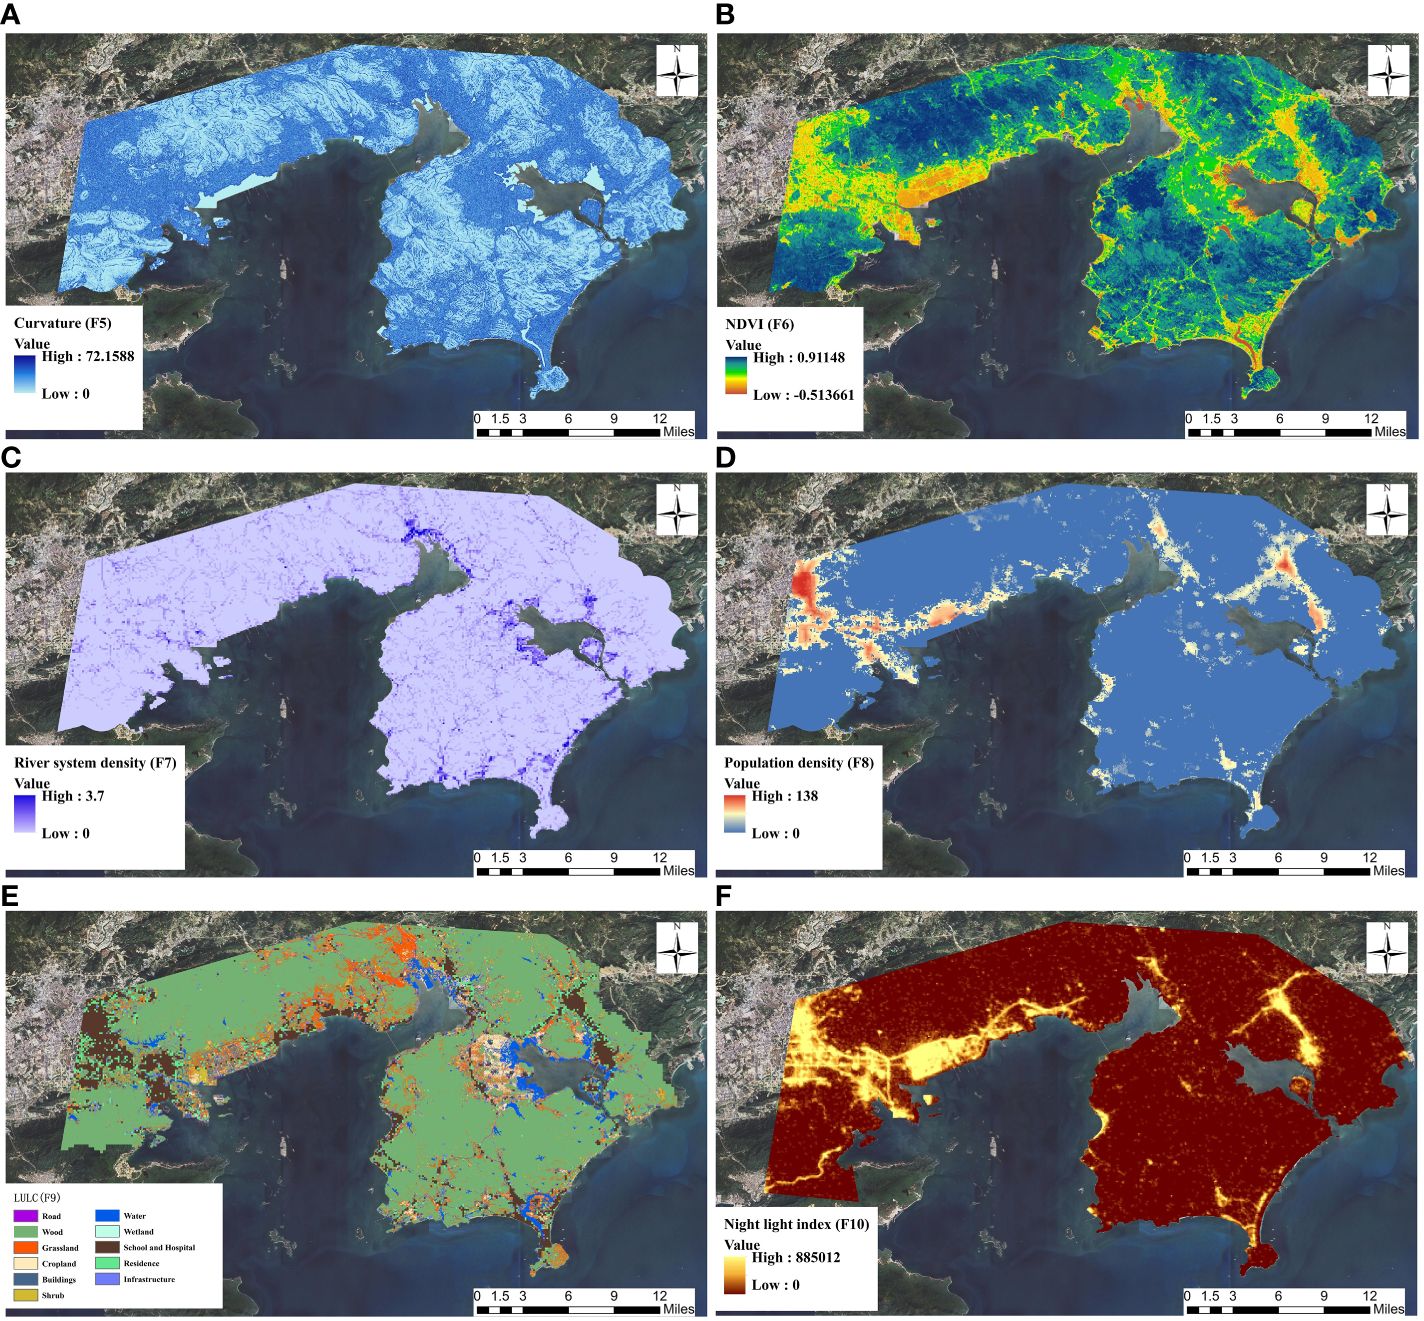
Figure 3 Maps depicting the indicator data used for storm surge risk assessment. (A) curvature; (B) NDVI; (C) River system density; (D) Population density; (E) LULC; (F) Nighttime lights.
(1) Inundation depth
The FVCOM-SWAN model is utilized to calculate the storm surge data by considering factors such as typhoon center pressure, path, and wind speed. The resulting storm surge inundation depth, obtained through GIS processing, represents the scale of storm surge hazards in the coastal region.
(2) DEM
In the context of flood hazards, the danger associated with such disasters tends to decrease inversely with increasing elevation (Aslan, 2023). When water descends from higher to lower elevations, it tends to accumulate. Additionally, due to the accumulation of rainfall in low-altitude areas, these regions are considered to be most susceptible to the impacts of flooding (Abd-el-Kader et al., 2023; Sahraei et al., 2023). This data obtained from the Department of Natural Resources of Huizhou Bureau. The elevation data with an accuracy of 0.3m is captured by UAV photogrammetry in Huizhou City.
(3) Slope
In the field of flood hazard research, it is widely recognized that the steepness of the terrain represents the magnitude and intensity of flood runoff (Franci et al., 2016). Additionally, it increases the likelihood of secondary disasters such as mudslides. The steeper slopes exacerbate the risk of disasters in the region (Lyu and Yin, 2023; Mitra and Das, 2023). Slope data is obtained by processing DEM data in ARCGIS software.
(4) Aspect
Slope aspect represents the orientation of the land and simultaneously affects aspects such as precipitation, hydrology, and sunlight exposure. Regions with a southern aspect often experience greater disaster losses compared to those with a northern aspect. Aspect, as a topographic parameter, influences the likelihood of flood hazards. It indicates the direction of the land and affects precipitation, hydrological processes, erosion, and solar exposure levels (Mitra and Das, 2023). Aspect data is obtained by processing DEM data in ARCGIS software.
(5) Curvature
Curvature is one of the fundamental indicators used to study the terrain characteristics of a research area. It represents the surface roughness, reflecting the accumulation and drainage conditions during flood disasters (Mousavi et al., 2022; Mitra and Das, 2023). Curvature data is obtained by processing DEM data in ARCGIS software.
(6) Normalized difference vegetation index (NDVI)
NDVI is commonly used to detect areas with vegetation cover and areas without vegetation cover (Mitra and Das, 2023). Flood events are partially related to vegetation, as vegetation possesses a certain water retention capacity. The greater the vegetation coverage, the lower the likelihood of flood disasters occurring (Wu et al., 2022). Landsat 8 satellite remote sensing data is imported into the ArcGIS platform to create NDVI.
(7) River system density
A higher river density indicates a larger runoff volume, faster flow velocity, and a higher degree of environmental exposure in the area (Sahmutoglu et al., 2023). This data is obtained from the Department of Natural Resources of Huizhou Bureau.
(8) Population density
Population is an essential factor that cannot be overlooked when studying the vulnerability of storm surge disasters (Sahmutoglu et al., 2023). In areas experiencing the same level of flood hazards, regions with higher population density tend to incur greater losses. The 100-meter precision population grid data used in this study is obtained from the WorldPop Project website (https://hub.worldpop.org/).
(9) LULC
LULC has an impact on various processes in disaster-affected areas, such as precipitation, runoff, and infiltration (Costache et al., 2020). Land types such as residential areas, hospitals, schools, and similar areas have lower surface infiltration capacity, making them more prone to surface runoff. Additionally, due to their social and economic attributes, these areas are associated with higher hazard levels and economic losses. Li et al. (2023) have developed a national-level land cover map. In this study, the combination of this data along with Points of Interest (POI) data is used to create a LULC map for Huizhou city. Residential areas and commercial land are categorized as Level 1 hazard zones, industrial parks as Level 2 hazard zones, and agricultural land and aquaculture areas as Level 3 hazard zones. Other land types such as forests and grasslands are classified as Level 4 hazard zones. Different values are assigned to grid cells based on their respective hazard levels, and these values are subsequently incorporated into the calculation of risk levels.
(10) Nighttime lights
Nighttime lights data is frequently utilized in the study to reflect the economic level and degree of urbanization in the research area (Feng, 2020). Economically developed regions with high population density and valuable assets tend to experience greater economic losses due to disasters. The nighttime lights data is sourced from the Luojia 1-01 Satellite (LJ1-01) data.
In 1980, building upon the Schloemer exponential pressure distribution model, Holland introduced the Holland B parameter to formulate the Holland typhoon wind field model (Holland, 1980). The holland wind field is calculated by Equation 3.1 and 3.2:
In the equation: represents the central pressure · RMW of the typhoon. P stands for the external pressure, set at 1010 · RMW denotes the radius of maximum wind speed in the typhoon. represents air density, taken as . f signifies the Coriolis parameter. r represents the distance from the center of the typhoon. represents the latitude of the typhoon’s center.
is the fitting parameter in Holland’s formulation. The Equation (3.3) for the radius of maximum wind speed (RMW) in the typhoon wind field model of this study is as follows:
is the latitude of the typhoon’s center. stands for the translation speed of the typhoon’s center.
According to the definition of the Holland wind field model, the typhoon wind field constructed by the model is circular and symmetric. However, actual typhoon wind field often exhibit asymmetry, which is inconsistent with this idealized symmetry. Therefore, in this study, the Holland-ERA-5 fused wind field is introduced. The fusion wind field is calculated by Equation (3.4):
In the equation: is the empirical wind field from the Holland model. stands for the background wind field from ERA-5. e is the weight coefficient, . C is a coefficient that considers the extent of the typhoon’s influence, , where .
The FVCOM (Finite-Volume Community Ocean Model) is a model developed by Chen et al. (2003) specifically designed for forecasting nearshore hydrodynamic environments. The Equations (3.5), (3.6), (3.7), (3.8), (3.9) and (3.10) are the governing equations of FVCOM, comprising momentum, continuity, temperature, salinity, and density equations:
In the Cartesian coordinate system, , , and respectively denote the east, north, and vertical coordinate axes. , and represent the velocity components in the , , and directions. , and respectively stand for temperature, salinity and density. is pressure. denotes the Coriolis parameter. represents gravitational acceleration. is the vertical eddy viscosity coefficient. is the vertical eddy diffusivity coefficient for heat. The symbols , , , and represent the diffusion terms for horizontal momentum, temperature, and salinity.
Wave numerical forecasting employs the third-generation nearshore wave model, SWAN, developed by Delft University of Technology in the Netherlands (Booij et al., 1996). The Equation (3.11) is the governing equation in SWAN, accounting for the influence of ambient currents, are determined through the evolution of the wave spectrum:
In the equation: is the wave action density spectrum. represents time. represents wave frequency. is the wave propagation direction. and respectively represent the wave celerity represented in the spectrum space for and . is the group velocity vector. stands for the sea surface current vector. is the Hamiltonian divergence operator. The term encompasses input and dissipation source terms, expressed in Equation (3.12):
Where: is the atmospheric-wave interaction term associated with wind-induced wave growth function. is the friction induced by wave-bottom interaction. represents the nonlinear wave-wave interaction term. is the three-wave and four-wave components of wave-wave interactions. represents the wave attenuation due to white capping and depth-induced breaking.
Both the SWAN and FVCOM models employ unstructured triangular grids to discretize the South China Sea region. The spatial extent covers the area between 13° - 29°N and 109° - 122°E. The model employs an unstructured triangular mesh to solve the dynamics of complex terrain, making it particularly suitable for the irregular and intricate coastal lines in the research area of Huizhou City.
Since the 1990s, entities such as the National Oceanic and Atmospheric Administration (NOAA), National Hurricane Center, and other industry departments in the USA have proposed maps depicting potential maximum storm surge inundation under various typhoon intensity scenarios (Glahn et al., 2009). These maps serve decision-making entities at the local government, insurance companies, and community levels. In the literature on storm surge risk assessment, the predominant approach involves utilizing storm surge simulation models to obtain the worst-case scenario of typhoon-induced sea level rise in the study area (Watson, 1995; Xianwu et al., 2020).
Wang S et al. (2021) conducted a statistical analysis of historical typhoon data in Huizhou, revealing the recurrence periods for typhoons with different atmospheric pressures. Among them, the typhoon with the lowest atmospheric pressure of 880 hPa has the longest recurrence period (1000 years) and is also the most severe typhoon that could occur in Huizhou.
Typhoon Mangkhut (Typhoon No. 1822) is a representative typhoon in the South China Sea region in recent years. In this study, to obtain the most unfavorable typhoon event for Huizhou City, the path of Typhoon Mangkhut is shifted to pass through the tidal station in Huizhou. Additionally, the typhoon’s atmospheric pressure is adjusted to the potential maximum central atmospheric pressure for the Huizhou region, set at 880 hPa, with a return period of 1000 years. The approach of assuming local maximum storm surge caused by the strongest typhoon, as studied, to provide insights for future storm surge disaster reduction processes is a universally accepted method internationally. By utilizing the modified typhoon path and atmospheric pressure, the model input parameters are configured, ultimately yielding the most unfavorable typhoon-induced sea level rise data for Huizhou City. This data is ultimately applied in the process of creating risk level maps.
The input for the model’s wind forcing is derived from the amalgamation of the ERA-5 wind field and the Holland wind field, as obtained from Formula 3.4. The SWAN model parameter set encompass: Wind input growth term (Komen scheme), Whitecapping dissipation term (Komen scheme), Bottom friction dissipation (Madsen eddy viscosity model), Nonlinear interactions (three-wave and four-wave nonlinear interactions). The FVCOM model utilizes open boundary tidal elevations computed from the harmonics of 11 major astronomical tides (M2, N2, S2, K2, K1, O1, P1, Q1, MS4, M4, M6). The input forcing fields include fused wind field data and wave data obtained from the SWAN model. The model uses a time step of 0.75 seconds for the outer model and 7 seconds for the inner model calculations.
To address the challenge of obtaining actual disaster data for Huizhou City, the MCDM method is employed to assess storm surge danger levels. Meanwhile, various MCDM methods, including AHP, FAHP, EW, AHP-EW, and FAHP-EW, are compared in this study to determine the most suitable method for storm surge risk assessment in the coastal areas of Huizhou. These five selected MCDM methods encompass not only commonly used subjective and objective assessment approaches in disaster evaluation studies but also comprehensive methodologies that refine individual techniques. The significance of assessment indicators in storm surge disaster risk assessment forms the foundation for determining the weights of these indicators. The weights of different indicators in different methods are obtained by subjective, objective or combination of subjective and objective methods.
(1) AHP
The AHP is a multi-level weight analysis decision-making method proposed by American operations researcher in the 1970s (Saaty, 1970). It is a systematic analysis method that combines qualitative and quantitative aspects. The AHP method is widely applied in various studies on disaster risk assessment. The core essence of the AHP method is computing the relative importance matrix to determine the weights of various assessment indicators (Roy et al., 2021). By evaluating the relative significance of different assessment indicators, constructing a relative importance matrix, and conducting a consistency check on the judgment matrix (Tokgozlu and Ozkan, 2018). When the Consistency Ratio is less than or equal to 0.1, the system is considered to have acceptable consistency. Subsequently, the relative weights of decision criteria are calculated using the eigenvalue method.
(2) FAHP
The AHP effectively combines subjective judgment, analysis, and rigorous computational reasoning. On the other hand, the FAHP, developed by (Chang, 1996) based on fuzzy set theory, recognizes that subjective judgments in complex decision environments are inherently fuzzy. By fuzzifying the scales of evaluation criteria, the FAHP theory assists evaluators in better selecting the scale values of the criteria, resulting in more precise and reasonable evaluation results (Wang et al., 2011). The FAHP method calculates the weight ratios of various decision criteria by constructing a fuzzy judgment matrix for the criterion system.
(3) EW
Shannon combined entropy with information and proposed the Entropy Weight (EW) method, which determines objective weights based on the variability of indicators (Sepehri et al., 2019). The smaller the entropy value of an evaluation indicator, the greater the variability in the indicator values, indicating a higher information content, and consequently, a higher weight for the indicator. The EW method determines the indicator weight according to the variation degree of the indicator value of each indicator, which is an objective weighting method to avoid the deviation brought by human factors.
(4) AHP-EW and FAHP-EW
AHP and FAHP rely on expert ratings to determine the importance of criteria, which can be influenced by cognitive biases and subjectivity. The EW method determines weights based on the entropy of information between different evaluation indicators and is a commonly used objective weighting method. Currently, researchers often adopt a combination of subjective and objective methods to obtain weights, aiming to complement subjectivity with objectivity and obtain more intuitive and accurate criterion weights (Zhang et al., 2011).
The distance function between the subjective weights obtained from AHP (or FAHP) and the objective weights obtained from the EW method can be defined as Equation (3.13):
c1 and c2 represents the criterion weights obtained from AHP (or FAHP), and denotes the criterion weights obtained from the EW method. The weight combination can be calculated by Equation (3.14):
c1 and c2 are the weight combination coefficients, which are determined by the Equation (3.15):
(1) OAT
To implement the OAT method, two parameters need to be set: the range of specific weight changes and the step size. Drawing upon de Brito et al. (2019), the weight change step size is specified as a percentage change increment (IPC) of ±4%, with a percentage change range (RPC) of ±100%. This would result in a total of 500 evaluation runs (50 weight changes * 10 evaluation criteria).
In order to ensure that the sum of the weights for each evaluation criterion is equal to 1, the Equation (3.16) is used to normalize the criterion weights:
In the formula, represents the adjusted weight of the m-th criterion, represents the weight of the other i-th criterion, and represents the normalized weight of the criterion after normalization.
Based on the 500 evaluation results obtained, the sensitivity of the criteria can be calculated using standardized regression coefficients in a linear regression model.
(2) FAST
In this study, the FAST method is also employed to assess the influence of input indicators on the variability of model outputs across different grid calculation units. The FAST is a global sensitivity analysis technique based on variance. Unlike local sensitivity analysis methods, which aim to estimate the partial derivatives of parameters under fixed conditions, global sensitivity methods allow for the exploration of the entire range of possibilities for varying all parameters and assessing the combined impact of simultaneous variations in input factors when computing sensitivity indices (Schaibly and Shuler, 1973). The sensitivity of parameter X can be represented using the Equation (3.17):
Where Y is the output value of the model, is the input parameter, is the expectation of Y when x takes a certain value, and is the variance of X as it traverses its range of values.
Figure 4 illustrates the specific steps of the integrated approach in assessing storm surge disaster risks in Huizhou city’s coastal area. The following steps provide details on Figure 4.
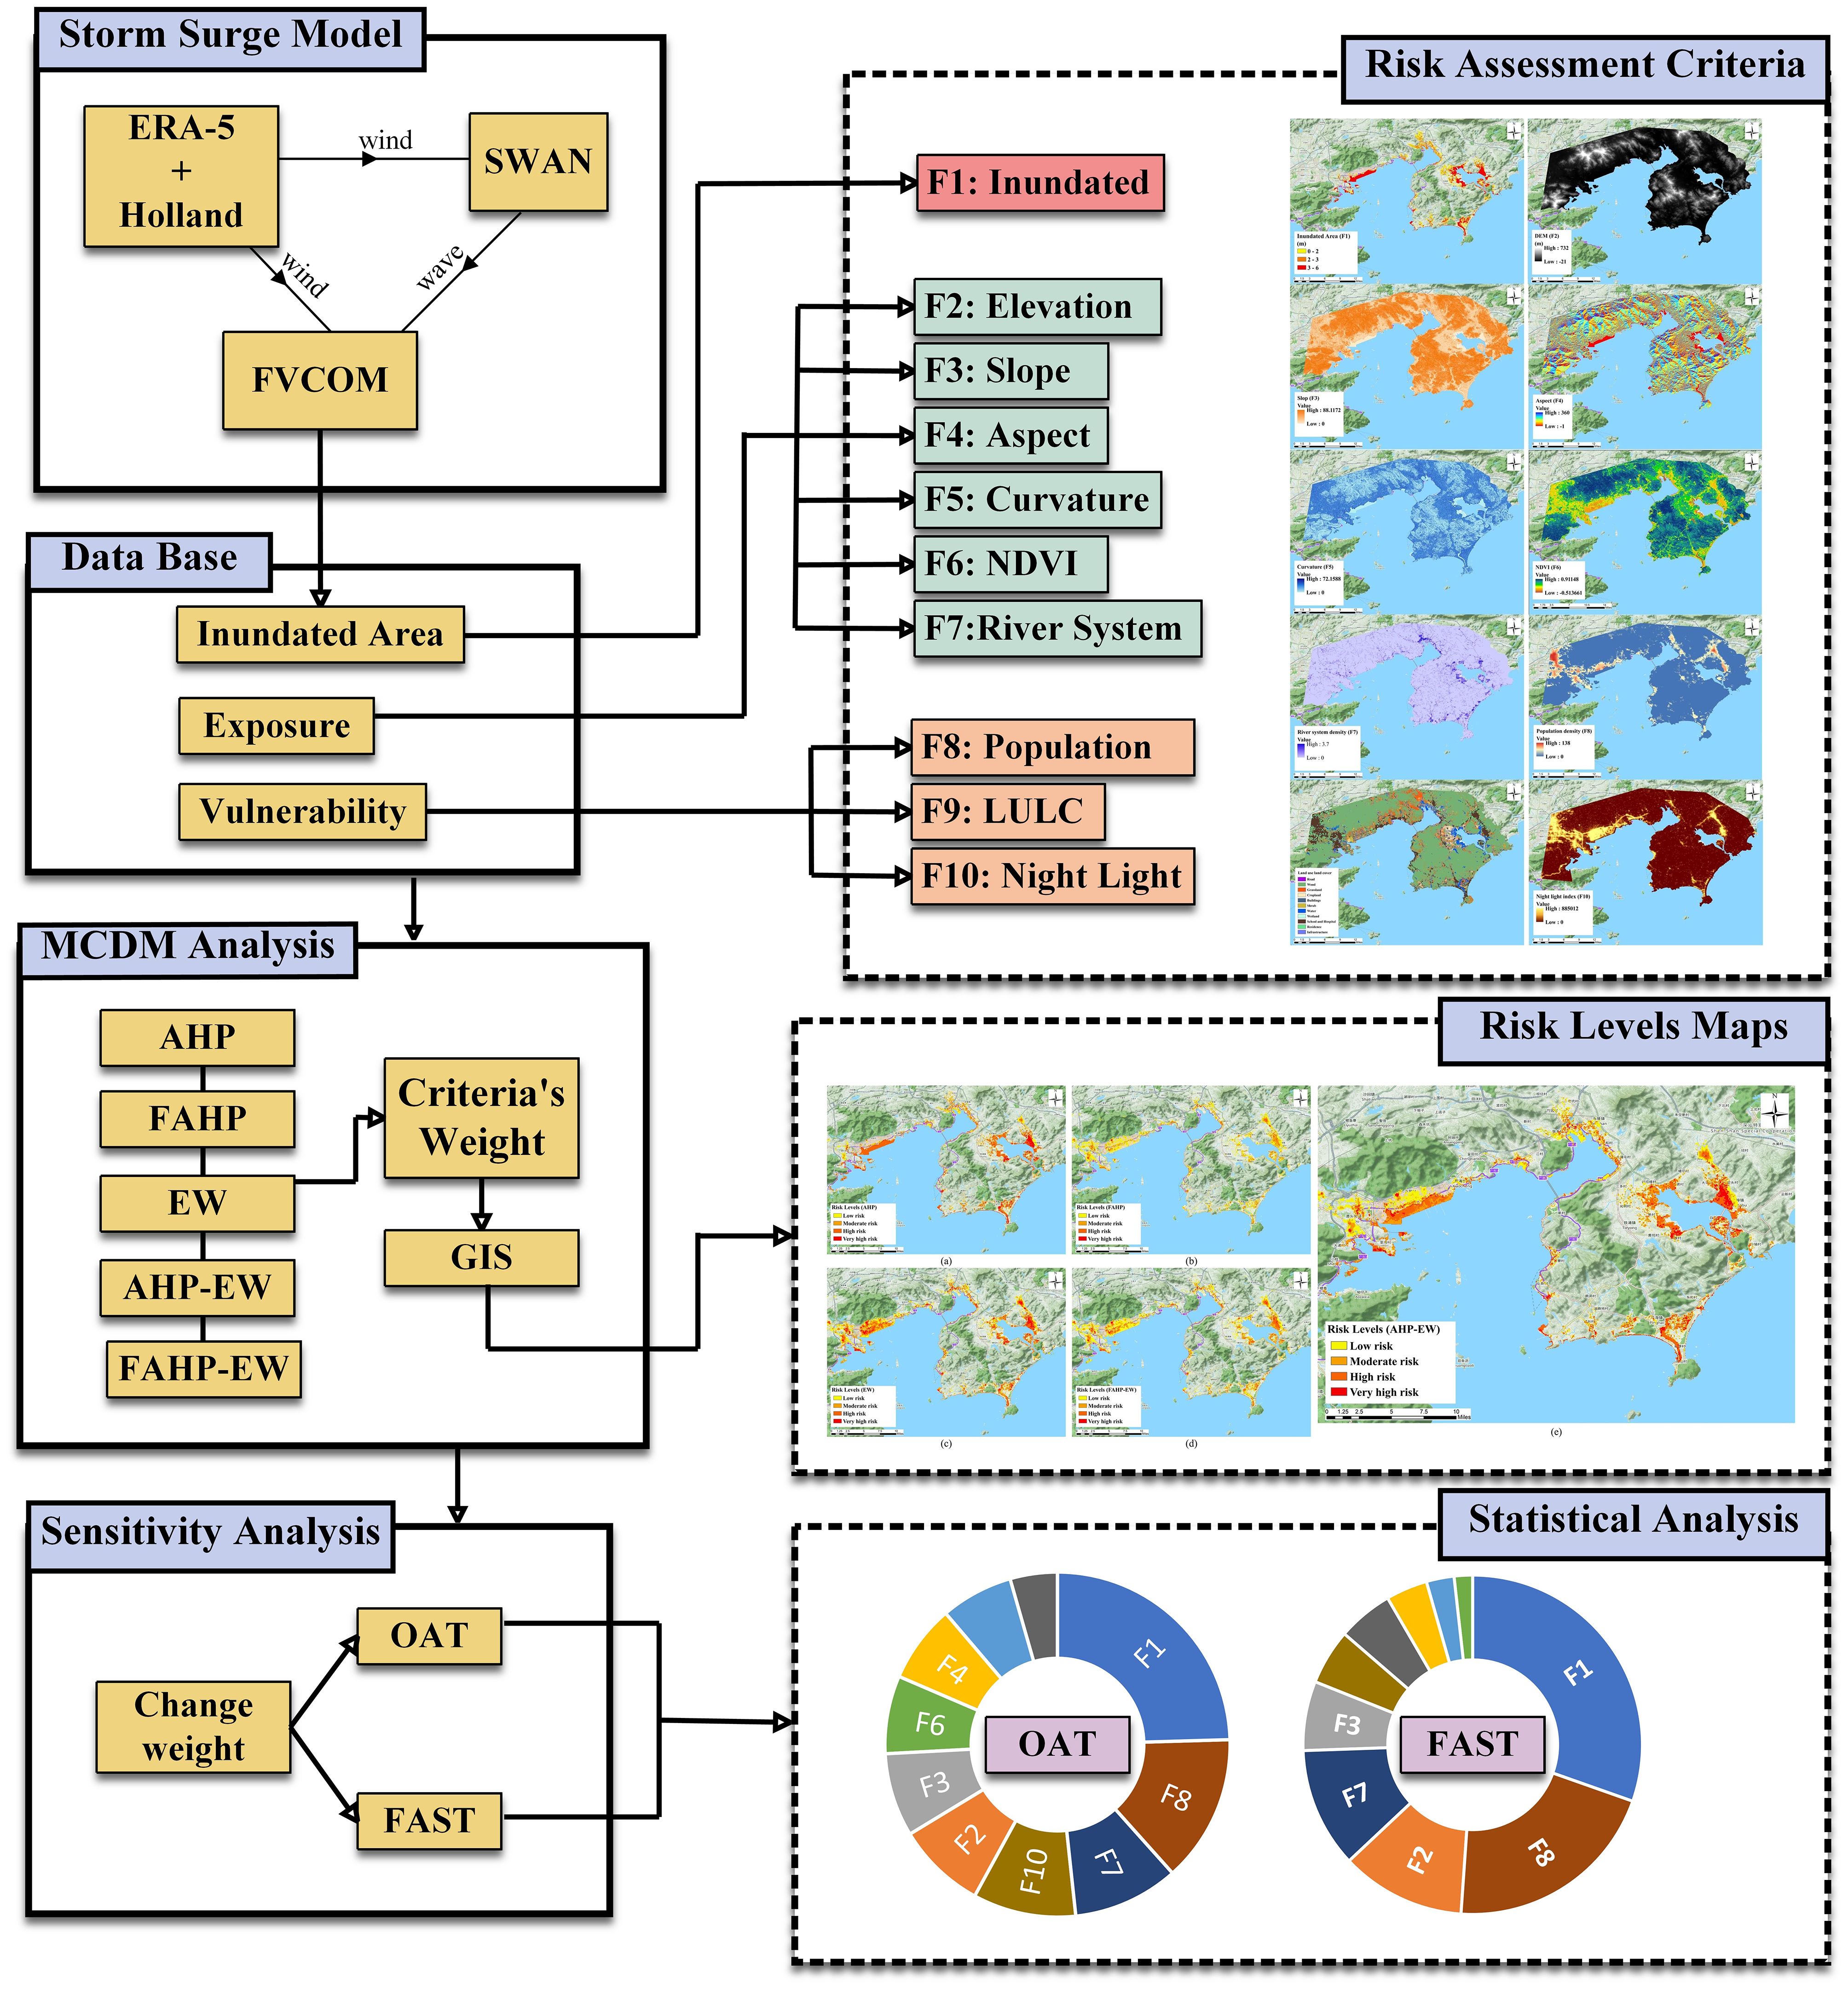
Figure 4 The procedure for storm surge risk assessment and sensitivity experiments on indicators.
Step 1. The coupled FVCOM-SWAN model is employed to calculate the storm surge inundation along the coastal area of Huizhou, the results of which are validated by official tidal measurements. The trajectory of Typhoon Mangkhut, which has caused the most significant losses along the coast of the South China Sea in recent years, is shifted to pass through the Huizhou station. The minimum atmospheric pressure is then adjusted to 880 hPa, corresponding to a return period of 1000 years. The modified path and pressure data are input into the FVCOM-SWAN model to calculate the storm surge. The inundation depth for the coastal region of Huizhou is computed by processing the model results from FVCOM-SWAN in GIS software.
Step 2. A geographic information database is created using various technologies such as GIS, RS, and digital map data. This database encompasses hazard data: inundation depth in Huizhou city; exposure data: DEM, slope, aspect, curvature, NDVI, river system density; and vulnerability data: population density, LULC, nighttime lights.
Step 3. The data within the geographic information database is subjected to a process of normalization. And the weights of indicators are evaluated through a comprehensive comparison among AHP, FAHP, EW, AHP-EW and FAHP-EW methods. In contrast to the more common approach in storm surge risk assessment that combines LULC data with inundation data, this study utilizes MCDM methods to better elucidate the complexity and comprehensiveness of the storm surge disaster process through the comprehensive selection of assessment indicators.
Step 4. By incorporating the weights of each risk factor into GIS, a series of risk level maps for storm surge inundation can be obtained. By comparing the risk level maps obtained through various methods, a more suitable approach for risk assessment in the Huizhou city area can be selected.
Step 5. By applying a series of adjustment to the weights of each risk factor, the risk level data is updated. Subsequently, the OAT analysis method and the FAST method for global sensitivity analysis are employed to determine the sensitivity of each risk factor.
Comparison between observed tidal data from tidal stations and predicted tidal level derived from harmonic constants is conducted. Figure 5 illustrates the comparative curve between the observed and predicted tidal levels of Huizhou tidal station in August 2018, the horizontal axis represents hours, while the vertical axis denotes tidal levels in units of meters. The primary discrepancies during the evaluation period are observed during the secondary high and low tides, with an average absolute error of 14 cm.
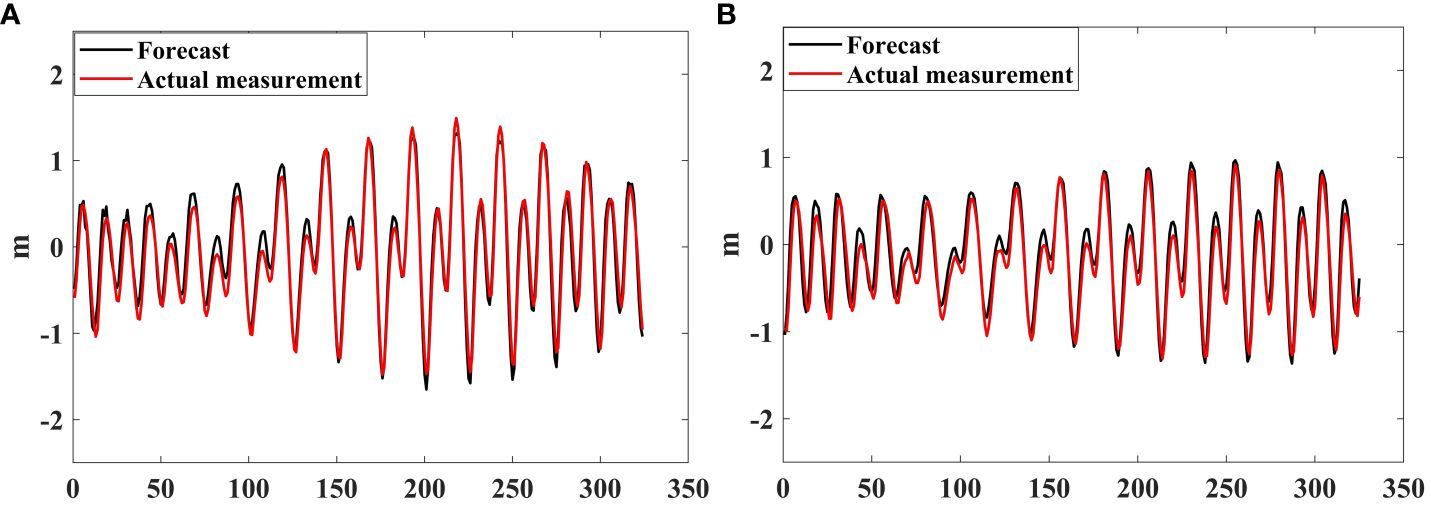
Figure 5 Tidal level verification at the Huizhou tidal station during non-typhoon periods. (A) from August 1st to August 15th, 2018; (B) from August 16st to August 30th, 2018.
The validation of storm surge tidal levels is performed for four significant typhoons that have a substantial impact on the Huizhou city. These typhoons include Typhoon No. 1208, Typhoon No. 1713, Typhoon No. 1720, and Typhoon No. 1822. Figure 6 depicts the comparative chart of storm surge tidal levels at the Huizhou tidal station, the horizontal axis represents the months and dates, while the vertical axis denotes the tidal level, measured in meters. The relative error for the maximum storm surge water level ranges from 2.1% to 19.8%. The validation results demonstrate a close alignment between the simulation and actual measurements, indicating the applicability of this model for simulating storm surge events in the Huizhou city.
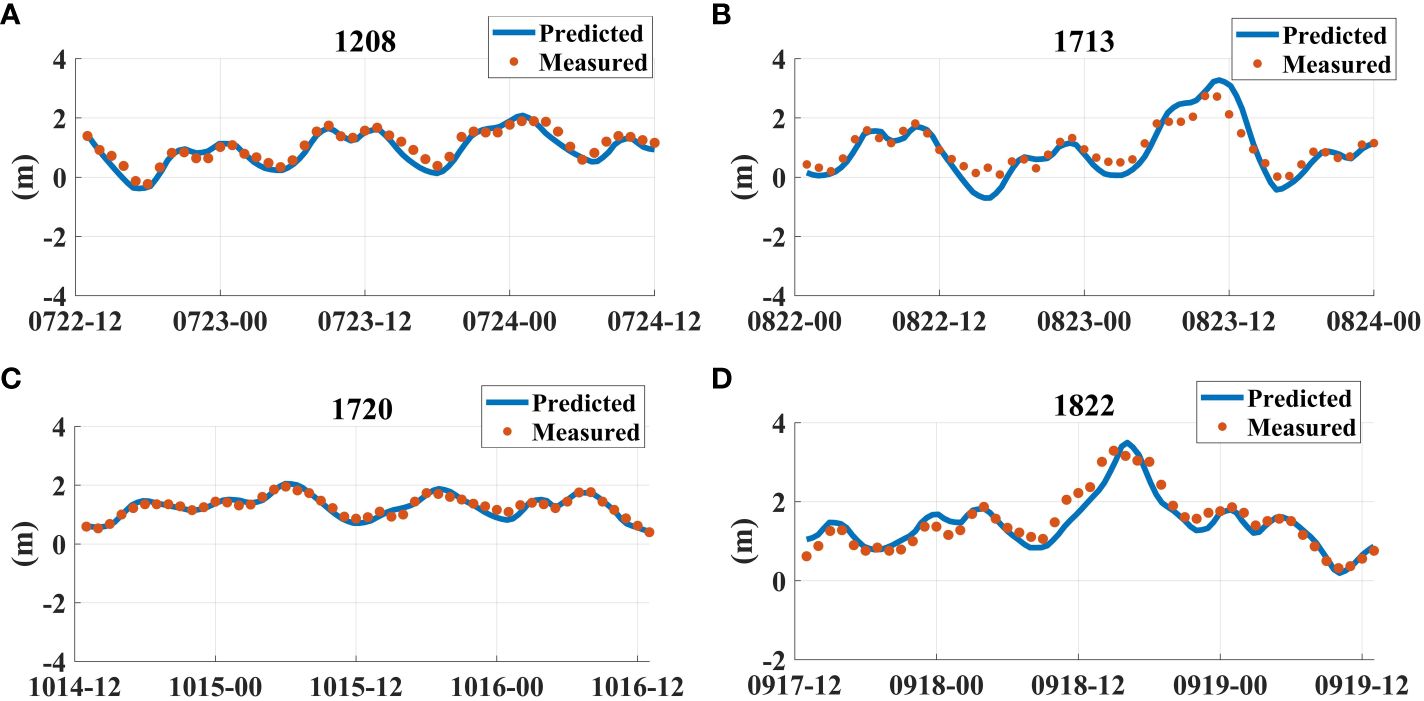
Figure 6 Model-predicted water level and observed water level curves at the Huizhou tidal station during different typhoon periods. (A) Typhoon No. 1208; (B) Typhoon No. 1713; (C) Typhoon No. 1720; (D) Typhoon No. 1822.
In the realm of storm surge risk assessment studies, the difficulty in data measurement and its restricted availability often leads to a scarcity of measured inundation data for the research area. Concurrently, the construction of storm surge models has reached a relatively mature stage technologically. Consequently, scholars commonly rely on water level data obtained from numerical models to compute submerged areas (De Scally, 2014). The FVCOM-SWAN model utilized in this paper undergoes validation through astronomical tide level comparison and verification of storm surge water levels during different typhoon periods. This process substantiates the applicability of this model for simulating storm surge inundation in the Huizhou City. This study utilizes Typhoon Mangkhut, which caused the most significant destruction to coastal areas in recent years in China, as the foundation for the storm surge risk zoning and inundation simulation in Huizhou city. Through the FVCOM-SWAN ocean model, the storm surge inundation process for this extreme scenario in Huizhou city is simulated, and a map depicting the maximum extent of storm surge flooding is generated. This map served as a valuable tool for comparative analysis in the risk assessment of storm surge disasters.
Table 2 and Figure 7 present the weights of the ten indicators used in constructing the assessment of storm surge disaster risk levels, Table 2 elucidates the evaluation indicators represented by F1-F10. In the AHP, the judgment matrix is derived based on the relative importance of indicators representing the hazard, exposure, and social vulnerability of storm surge disaster. The consistency test result of the judgment matrix is 0.0420, indicating a relatively consistent judgment matrix. The AHP results indicate that inundation depth, representing hazard, has the highest weight (0.3555). Additionally, social vulnerability, measured by population density, holds a weight of 0.180, while exposure, represented by DEM, has a weight of 0.157. Other indicators exhibit the following weights: LULC (0.074), river system density (0.069), slope (0.062), nighttime lights (0.035), aspect (0.033), curvature (0.018), and NDVI (0.018). While AHP remains one of the most classical methods in MCDM methods widely employed in disaster management research, an inevitable aspect is that expert judgments regarding the relative importance of criteria inherently carry subjectivity. Moreover, traditional AHP employs precise values to convey perceptions, lacking the ability to capture the inherent fuzziness in human thinking. Hence, the FAHP, as an extension of AHP with a fuzzy framework, is better suited to address the inherent vagueness in complex multi-criteria decision problems. Unlike traditional AHP, which employs precise values to convey perceptions, FAHP has the capability to capture the inherent fuzziness in human thinking.
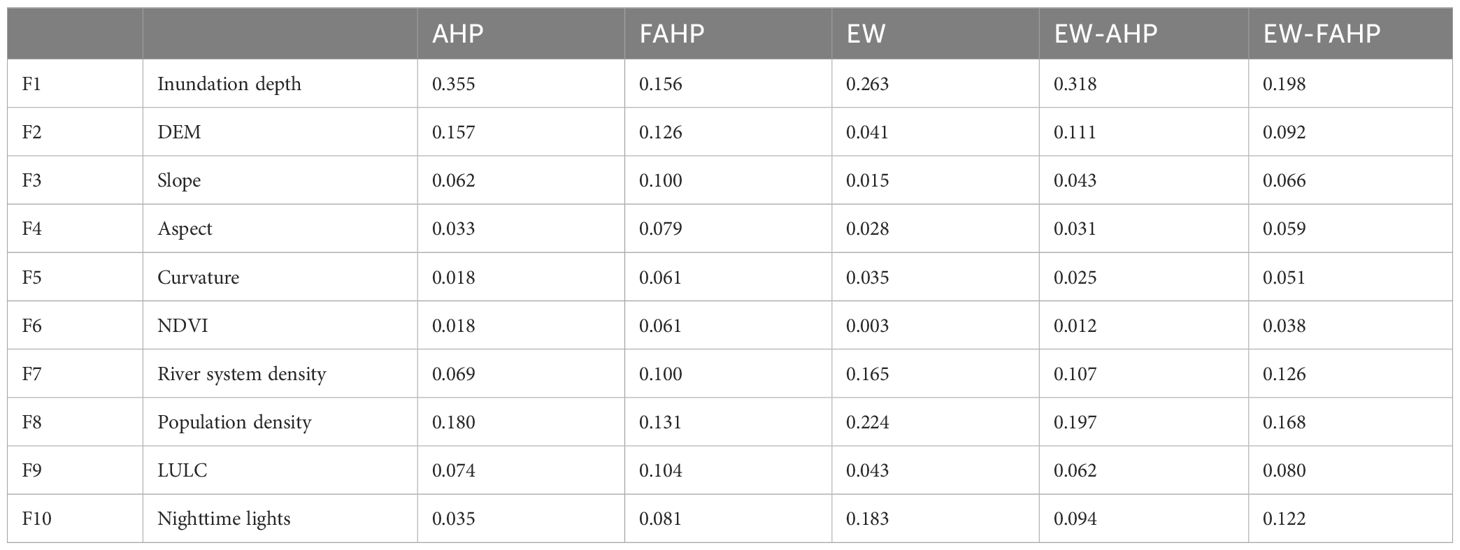
Table 2 The weights of various indicators.
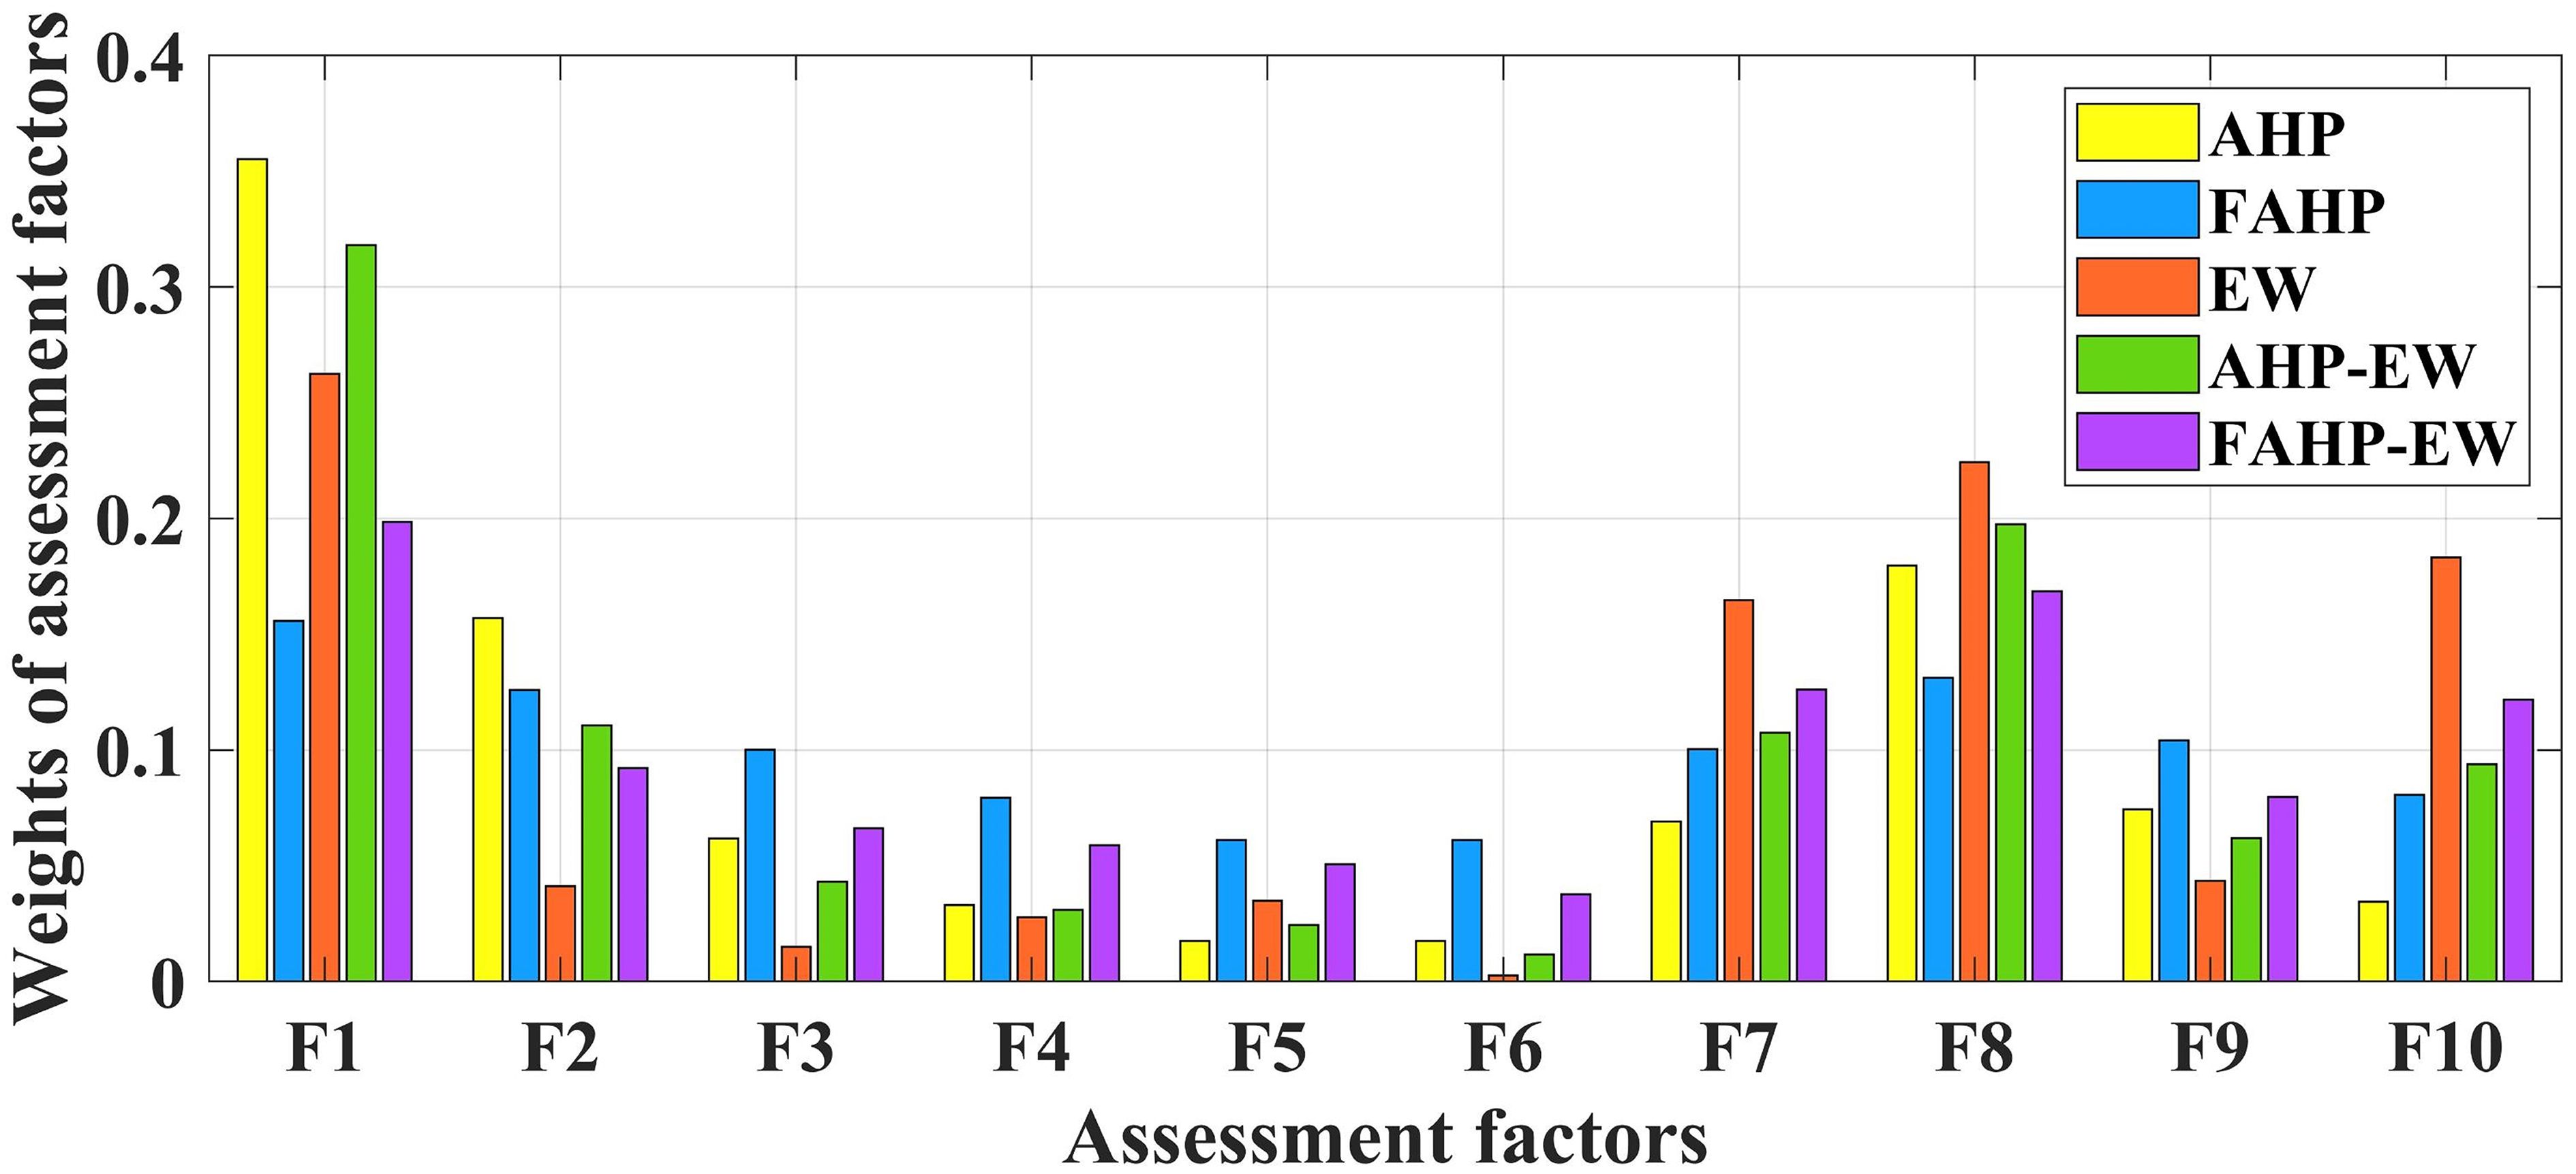
Figure 7 Statistical charts illustrating the weights of various indicators obtained through five different methods.
The weights of indicators obtained through the FAHP method align in the same order of weights as those derived from the AHP approach. However, with the use of the FAHP method, the differences between the weights of individual indicators are reduced. The variance of indicator weights obtained by the AHP method is 0.0111, while the FAHP method reduces the variance to 0.0009.
In the realm of MCDM methods, in addition to subjective judgment based on expert knowledge, objective weighting methods are also extensively employed in the field of disaster risk assessment. The EW method assesses the weight of indicators by calculating the information entropy of indicator values, thus determining the amount of information contained in each indicator. The EW method yields weights for the indicators, with the highest weight assigned to the inundation depth indicator at 0.263, followed by the population density indicator at 0.224. Notably, the weight of the nighttime light indicator significantly increases to 0.183. The water system density indicator also sees an increase in weight to 0.165. This implies that these four indicators carry a greater amount of information.
The assessment of storm surge disaster risk is a complex multi-criteria decision problem. To comprehensively consider both raw data and expert experience, AHP-EW and FAHP-EW methods are employed to determine the indicator weights. Utilizing the differences between the weight vectors obtained by AHP (or FAHP) and the EW method, calculate the allocation coefficients for the composite weights. The indicator weights obtained by FAHP-EW method are smoother than those obtained by AHP-EW method, and the variances are 0.003 and 0.009 respectively.
Upon comparing the weight information of various methods, it is evident that although the FAHP method still assigns the highest weight to the inundation depth indicator, considering that flooding is the primary cause of storm surge disaster losses, this weight appears relatively smaller in relation to the actual impact. Similarly, the weight of inundation depth indicator obtained by FAHP-EW method is also too small. Therefore, AHP, EW and AHP-EW can be selected in the selection of the most suitable risk assessment methods for Huizhou. In addition, the main difference in weight ranking between the AHP-EW method and the AHP method lies in the increased weight proportion of nighttime lights indicator. Based on the comparison of weight information from other methods, it’s challenging to determine the most suitable method from AHP, EW and AHP-EW. However, considering the principle, the combination of subjective and objective methods avoids the issues present in purely subjective or purely objective methods and is more likely to provide weight allocations that align with the actual situation.
Moreira et al. (2021) used methods such as natural breaks, equal intervals, quantiles, and standard deviation to categorize the final output. The conclusion drawn was that the natural breaks method is most suitable. The results obtained can assist decision-makers in reducing uncertainty and improving the quality of flood risk assessments. The natural breaks method is also widely employed in risk assessment studies (H. et al., 2016; He et al., 2022; Lyu and Yin, 2023). Therefore, based on the natural break classification method, this paper categorizes the data obtained by multiplying these indicator values with their respective weights into “low,” “medium,” “high,” and “very high” storm surge risk levels.
Firstly, numerical transformation of all data is carried out, such as LULC grid data, assigning distinct scores based on the specific land application direction for each grid cell. For areas with higher social vulnerability, such as schools and hospitals, the assigned score for the respective grid cell is higher. Conversely, for areas with lower social vulnerability like grasslands and forests, the assigned score is lower. Following the numerical transformation, the indicator data undergo positive transformation, standardization, and other processing steps to yield standardized indicator data. Multiply the standardized and normalized indicator data by their corresponding weights. Finally, summing up all the indicator data yields the risk data. Applying the natural breaks classification method, the data is divided into several classes based on natural groupings within the distribution of risk data. Natural breaks occur at the valleys’ low points in the histogram of risk data. Breakpoints are assigned in the order of the valleys’ sizes, and then this paper categorizes the risk data into “low risk,” “medium risk,” “high risk,” and “very high risk “ storm surge risk levels. When imported into the GIS platform and processed, they give rise to the storm surge risk level maps. In the literature, there is no unified consensus on flood risk classification methods. Figure 8 illustrates the storm surge disaster risk level maps for Huizhou city, as derived from various methodologies.
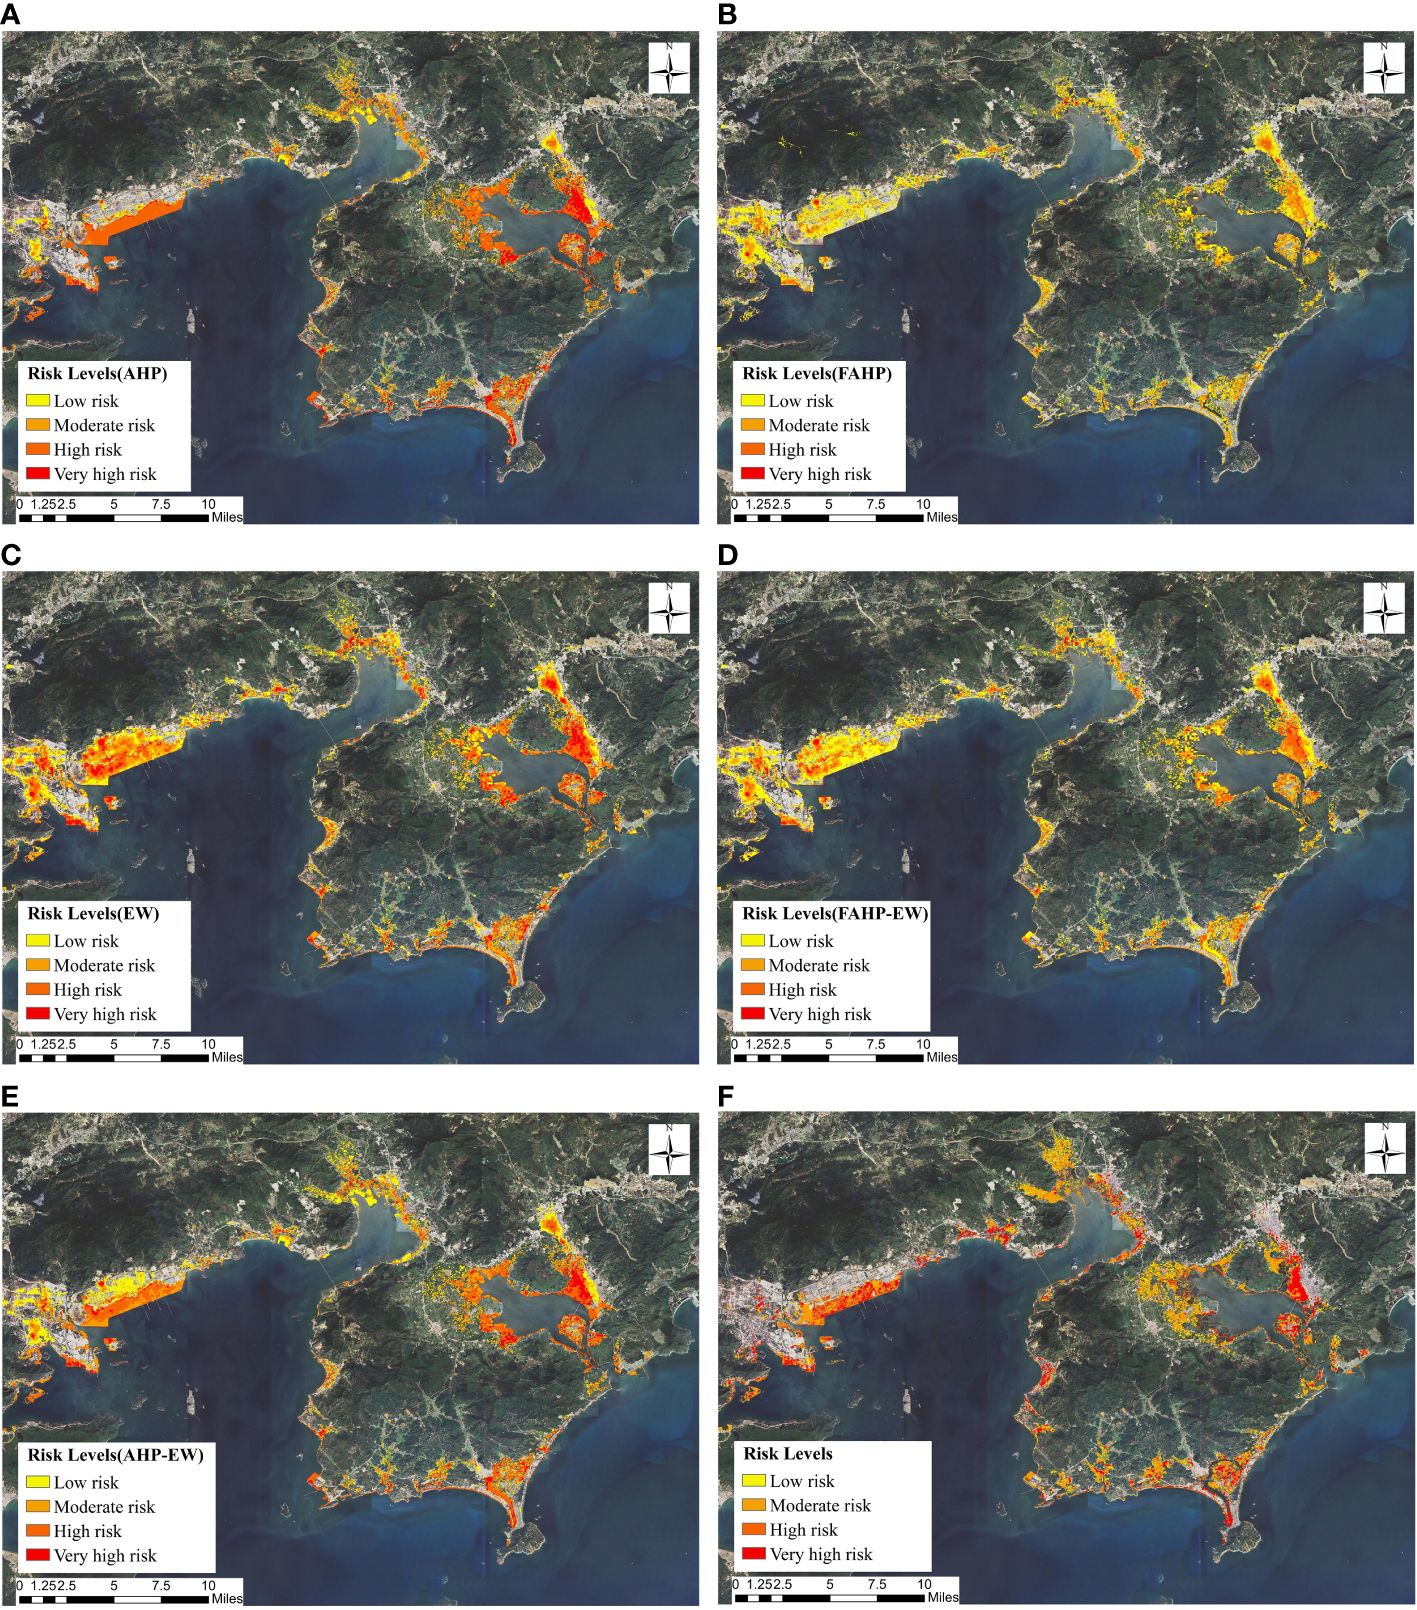
Figure 8 Maps displaying the coastal risk levels in Huizhou City assessed using different methods. (A) AHP: (B) FAHP; (C) EW; (D) FAHP-EW; (E) AHP-EW; (F) the traditional method used by Wang et al. (2021).
Among these methods, the AHP method indicates that high-risk areas account for a higher proportion in the risk level map, approximately 53%. In contrast, the FAHP and FAHP-EW methods yield a higher proportion of low-risk areas in the risk level map. Therefore, in terms of the effectiveness of the risk level maps, the EW method and the AHP-EW method produce risk level maps with more clearly defined gradations and a more reasonable range. In practical applications, risk level maps with clearly defined gradations provide essential information for the distribution of disaster prevention and mitigation resources and personnel, making them more valuable.
Figure 9 illustrates the risk level areas obtained from different MCDM methods. The hazard area determined using the subjective methods of AHP is 94.58 km², and FAHP results in 96.48 km², notably smaller than the objective method of EW, which yields an area of 124.55 km². Figure 8C illustrates the hazard area delineated by the EW method. It is evident that despite certain areas experiencing a smaller impact from storm surge, they still fall within the hazard zone. These areas generally exhibit higher population density or economic vulnerability. The increase in weights for population density and nighttime light in the indicator weights obtained by the EW method aligns with the mentioned situation.
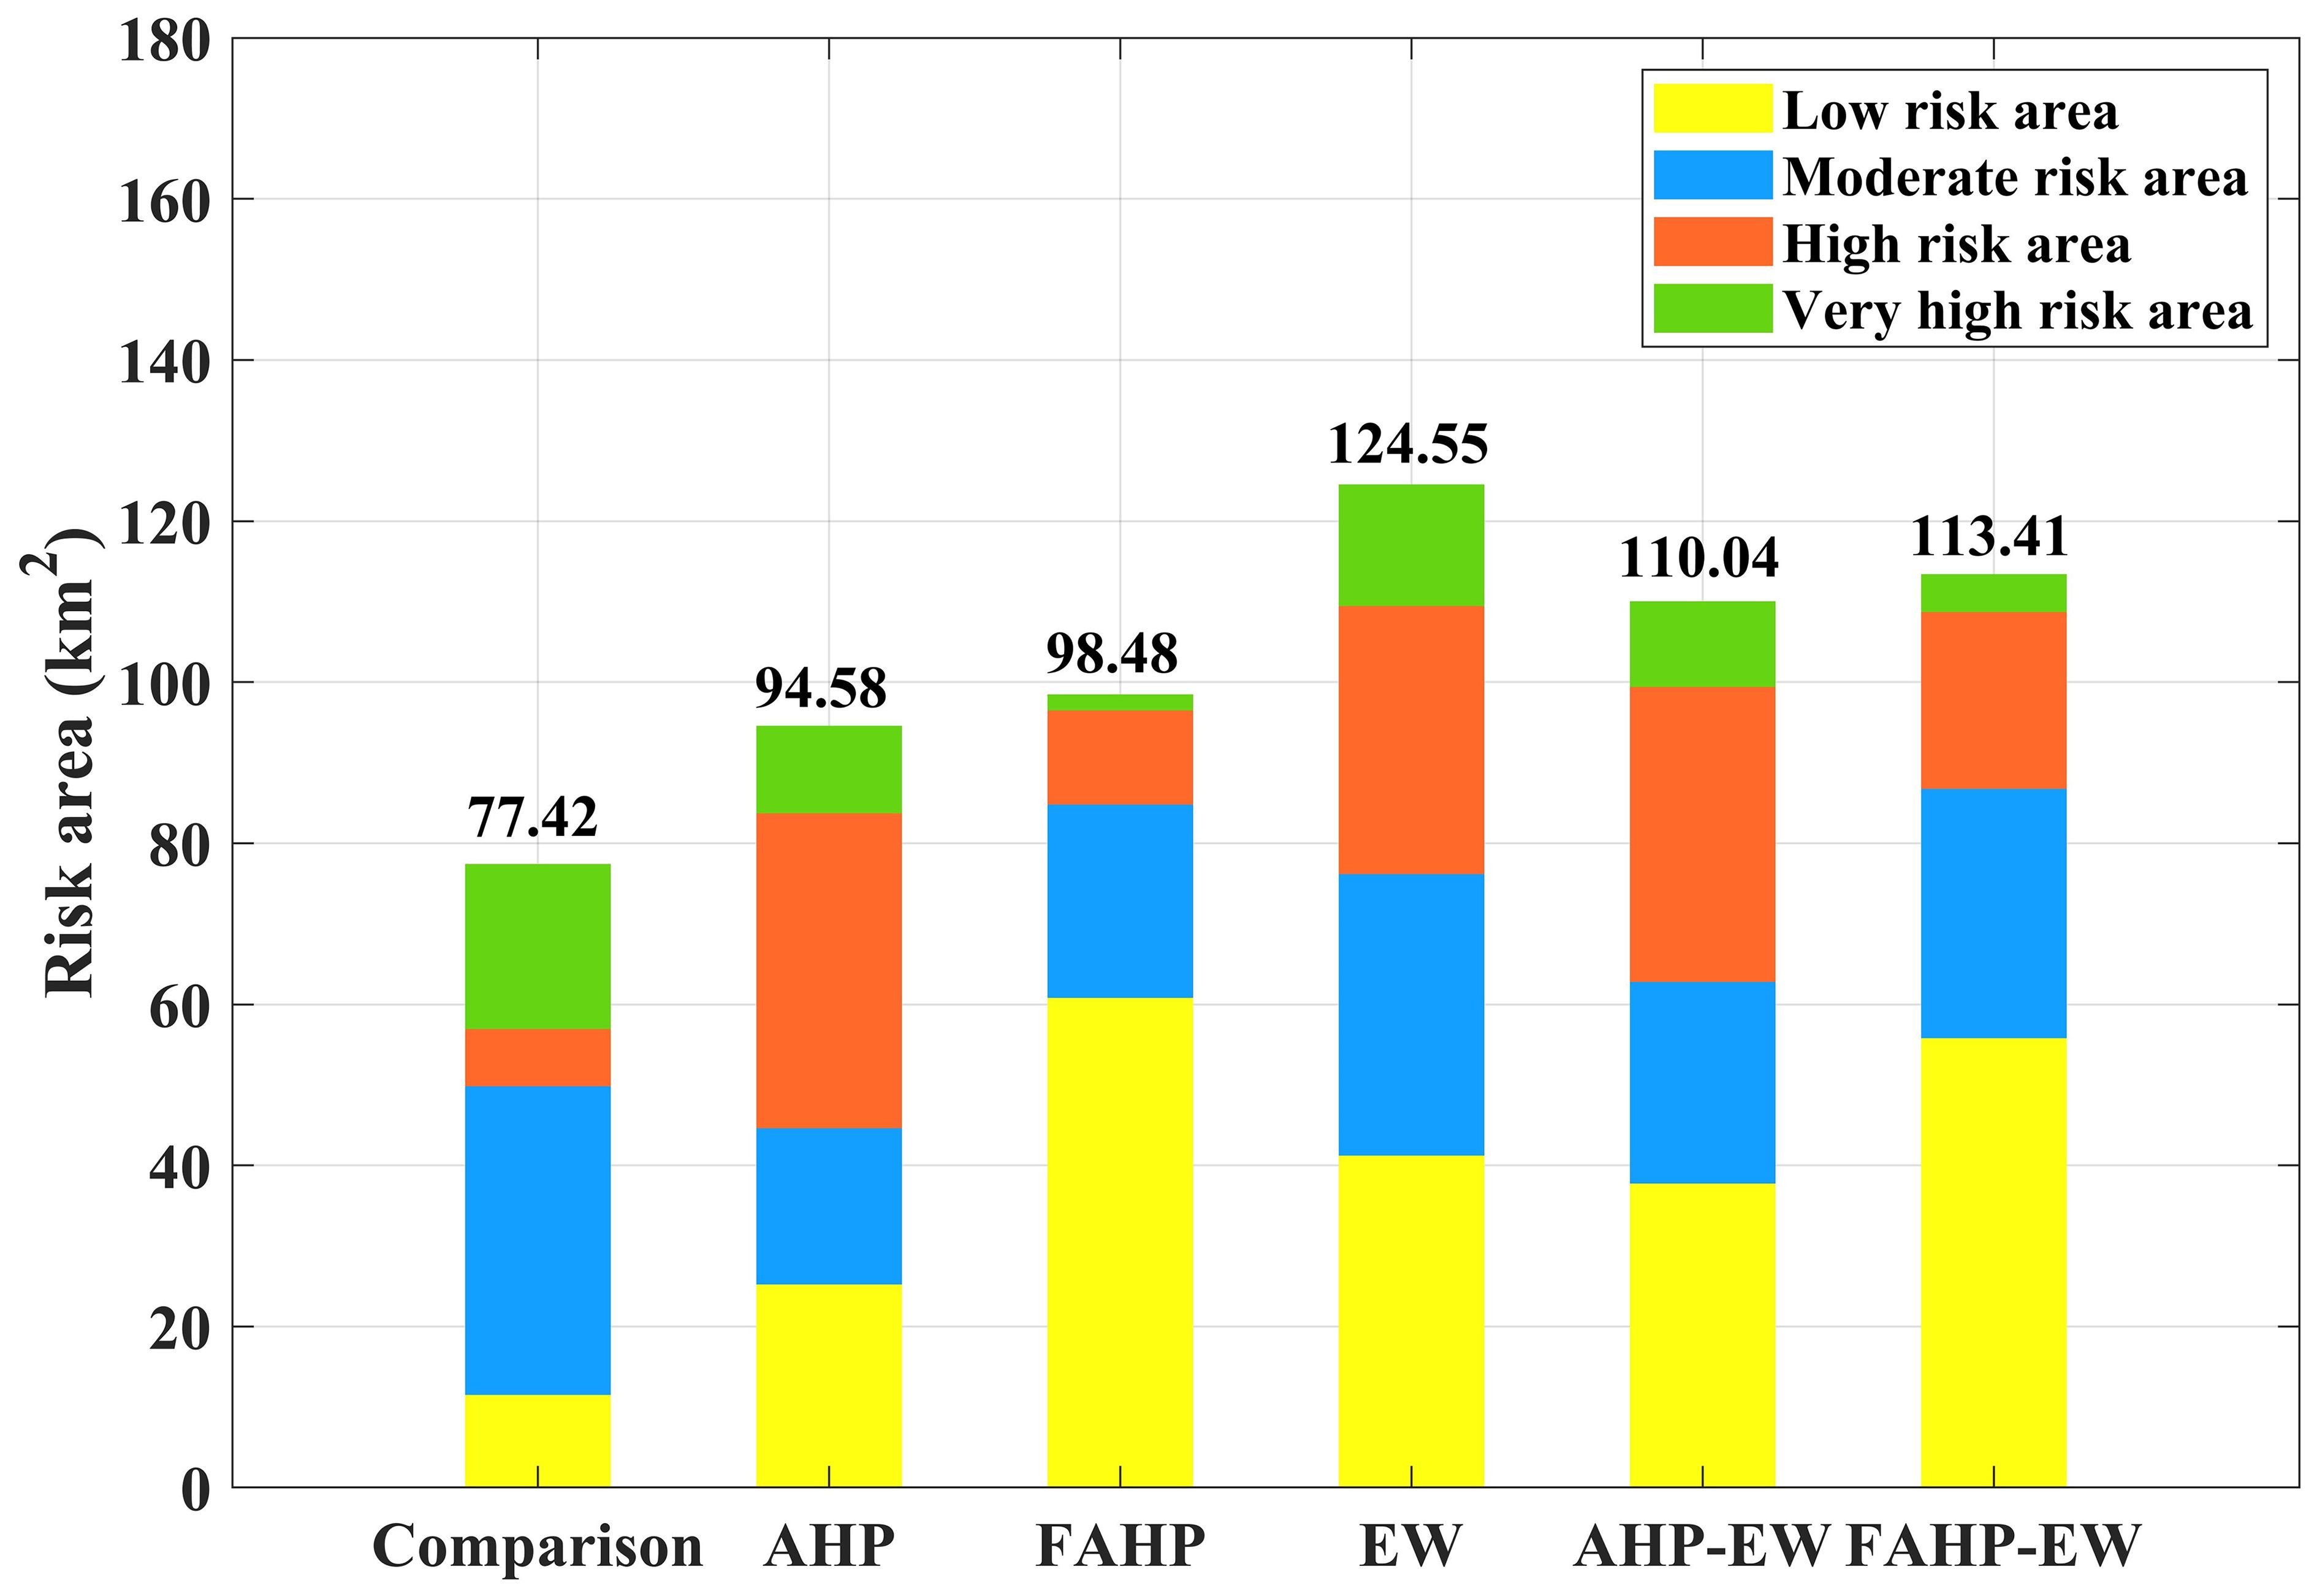
Figure 9 The areas of different storm surge risk levels along the coastal regions of Huizhou city assessed using various methods.
The comparative analysis of indicator weights reveals that subjective methods tend to emphasize hazard and exposure, with social vulnerability mainly focused on the population density indicator. On the other hand, objective methods primarily emphasize hazard and social vulnerability, while exposure indicators (such as DEM) have relatively lower weight proportions. After integrating subjective and objective methods, the AHP-EW and FAHP-EW methods yielded hazard areas of 110.04 km² and 113.41 km². Furthermore, from Figure 8D and Figure 8E, it can be observed that the hazard level map (AHP-EW) exhibits a more distinct classification of storm surge risk levels compared to the hazard level map (FAHP-EW). This pattern also corresponds to the comparison of weight variances. In the hazard level map (FAHP-EW), areas with low risk occupy a larger proportion, whereas regions with very high hazard levels are relatively small. In this storm surge inundation simulation, the obtained scenario represents the most unfavorable storm surge event under the conditions of a 1000-year return period typhoon. Therefore, the proportion of moderate to high-risk levels should not be negligible in the classification of storm surge risk levels. The risk level maps produced by the FAHP and FAHP-EW methods do not align with the situation. In the AHP method, there is a low proportion of low-risk areas, and the results are not as effective as those obtained from the EW and AHP-EW methods. Furthermore, based on the principles of this method, the AHP-EW method, which combines subjective and objective approaches, not only relieves the inherent shortcomings of purely objective or subjective methods but also better aligns with practical requirements. Therefore, through the comparison of five MCDM methods, this study chooses AHP-EW as the most appropriate method for storm surge risk assessment in Huizhou. Then the sensitivity of each indicator is analyzed based on the weight results obtained by AHP-EW method.
Due to the difficulty in obtaining or collating detailed storm surge disaster data for Huizhou City, refined in accordance with actual storm surge events, this study did not compare its results with real risk classification data. Therefore, to further validate the rationality of the MCDM methods, we selected methods from the literature that studied storm surge risk levels in the same region and compared them as the traditional method (Wang et al., 2021; De Scally, 2014). Wang et al. (2021) combined inundation depth data with LULC data to classify storm surge hazard levels. Figure 8F depicts a map of risk levels created using the method used by Wang et al. (2021), using the inundation depth and LULC data from this study. The map produced using the method mentioned by traditional method indicates a hazard area of 77.42 km², which is significantly lower in comparison to other methods, serving as a clear contrast in terms of hazardous area coverage.
Through the comparison of Figures 8E, F, it is evident that there is no significant change in the location and area of high-risk and very high-risk areas. The main difference lies in the categorization of medium to low-risk areas. The AHP-EW method encompasses a larger number of medium to low-risk areas. Furthermore, as seen in Figure 8F, the area of low-risk regions obtained using the traditional method is relatively smaller compared to other risk level areas. The MCDM methods, with their comprehensive indicator selection and assessment approach, effectively compensate for the relatively one-sided evaluation methods in the traditional method, making them more interpretable.
Figure 10 illustrates a comparison between the risk level maps of the Aotou Street and Huangbu Town areas in Huizhou city obtained through the traditional method and the AHP-EW method. The difference is significant as the risk area obtained by the AHP-EW method is larger than that of traditional methods, with the main distinction in the low-risk area identified by the AHP-EW method, specifically in Donglian village and Aotou township in Huizhou City. Figure 11 depicts a map illustrating the indicators for the regions of Aotou Township and Tiechong Township. It can be observed from Figures 10A, B and 11A, B that the primary factor contributing to disparities in the risk level maps obtained through two distinct approaches is the incorporation of indicators related to societal vulnerability, such as population density and nocturnal luminosity, in the AHP-EW method. Although the inundation extent caused by the storm surge in Donglian village and Aotou Street areas is relatively limited, these areas exhibit higher population density and nighttime luminosity. Consequently, these areas may incur higher levels of property and life safety losses during storm surge disasters.
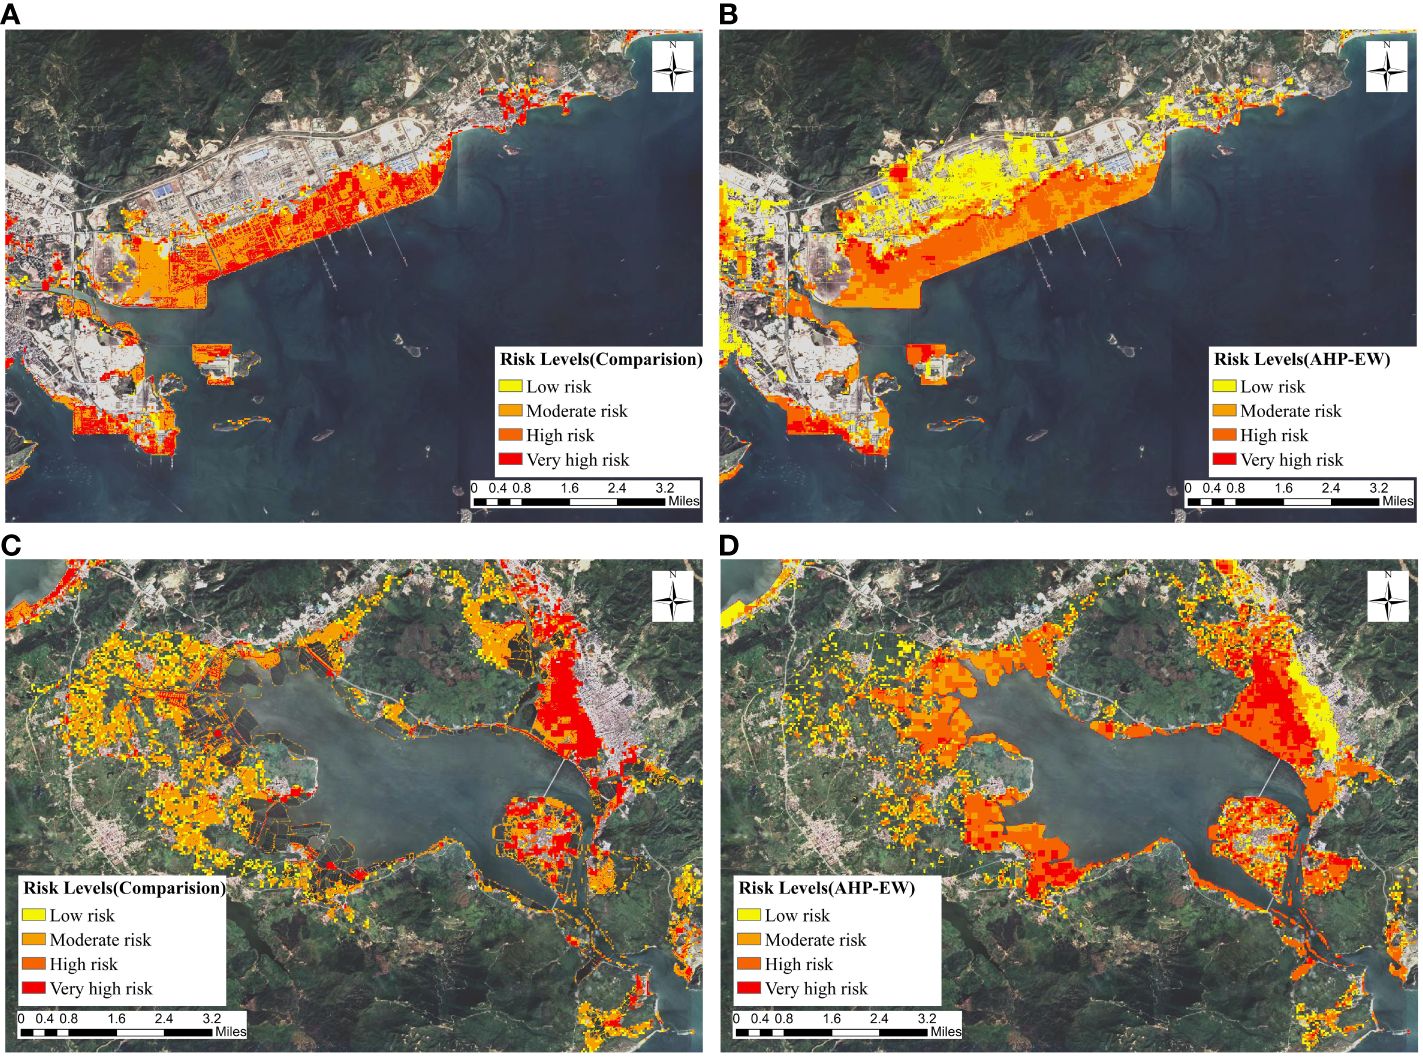
Figure 10 Comparison of risk level maps obtained through the AHP-EW method and the traditional method used by Wang et al. (2021). (A) Donglian Village and Aotou Street regions (traditional method); (B) Donglian Village and Aotou Street regions (AHP-EW); (C) Huangbu Town (traditional method); (D) Huangbu Town (AHP-EW).
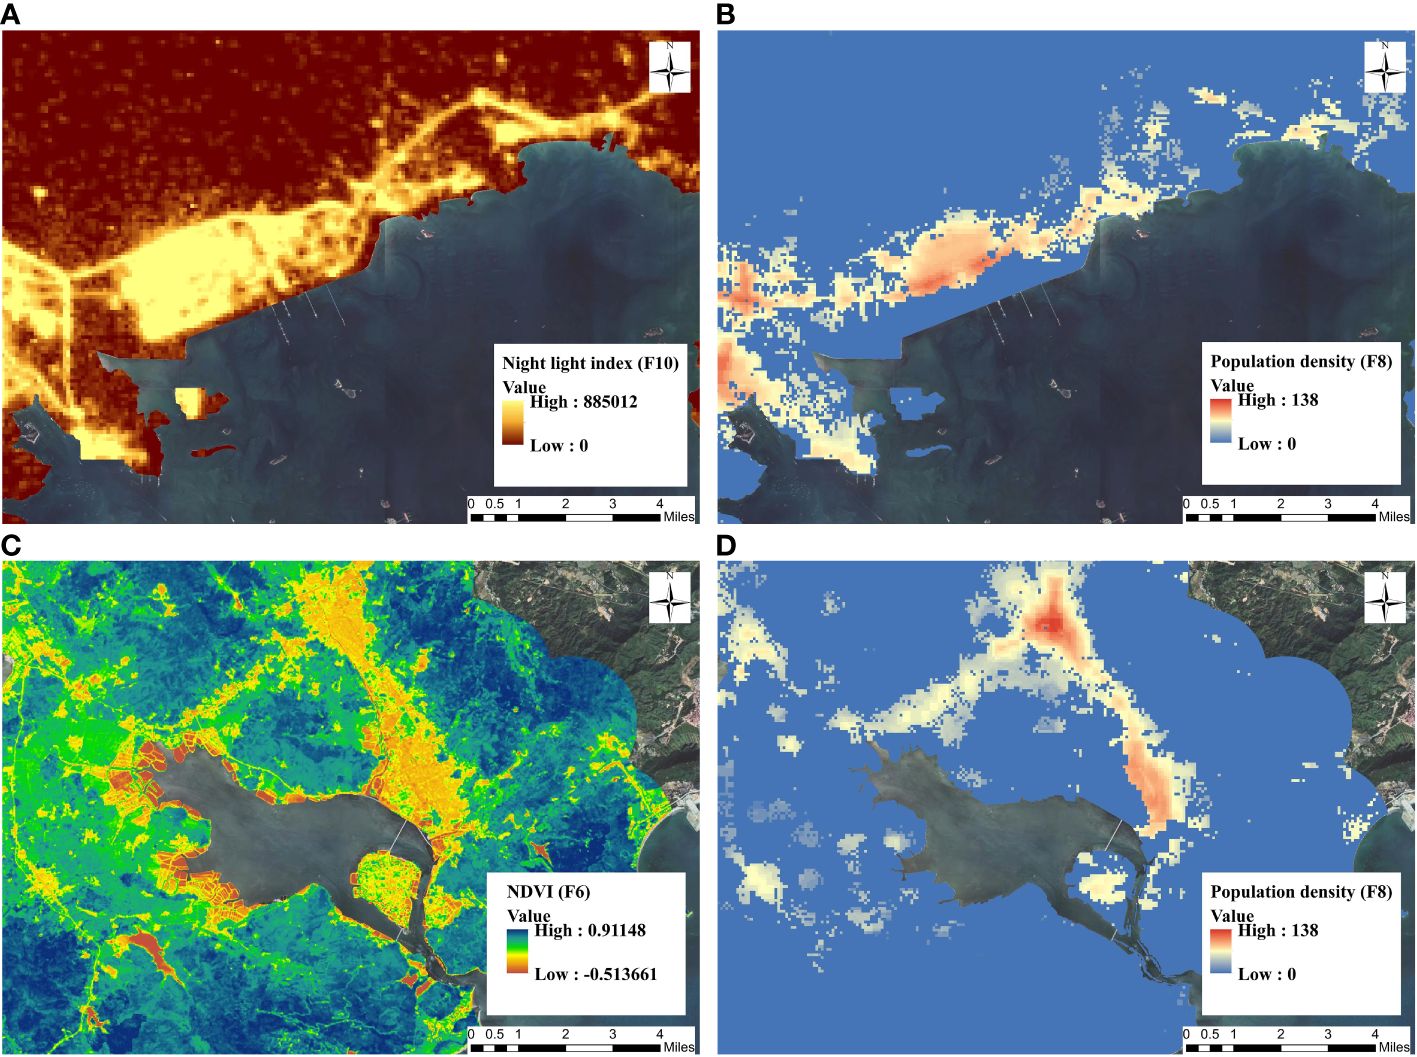
Figure 11 Maps depicting the assessment indicators that have a significant impact on the results. (A) Donglian Village and Aotou Street regions (Nighttime lights); (B) Donglian Village and Aotou Street regions (population density); (C) Huangbu Town (NDVI); (D) Huangbu Town (population density).
Furthermore, upon juxtaposing Figures 10C, D and 11C, D, it becomes evident that the broader scope of hazardous regions derived through the utilization of the AHP-EW approach is primarily attributed to the selection of NDVI and population density indicators. As depicted in Figure 11C, regions characterized by lower NDVI values on the map correspond to higher risk levels in the risk level map generated through the AHP-EW methodology. This correlation is mainly attributed to areas with lower NDVI values often indicating regions with frequent human economic activities. Therefore, during storm surge disasters, these areas tend to experience greater economic losses. Similarly, in regions characterized by elevated population density indicators, the risk level proportionally escalates, following the same rationale. Hence, the risk level map obtained through comprehensive exposure indicators (such as DEM and NDVI) and social vulnerability indicators (population density, nighttime light, etc.) is superior to maps obtained through the traditional method of overlaying inundation depth on LULC data. Although the result from AHP-EW exhibits a broader range of hazardous regions, it stands as a more rational and accurate representation.
After proportionally adjusting the indicator weights obtained through the AHP-EW method, the risk level is calculated for each grid cell within the study area, and 500 distinct RPC risk level maps are generated. Subsequently, the generated 500 matrices representing the risk levels of pixels are individually input into the OAT and FAST methodologies to compute the sensitivity of each indicator within every pixel. Figure 12 illustrates the statistical data regarding indicator sensitivities obtained through various methods. Calculate the average and maximum sensitivity for all study areas and regions with risk levels above the low-risk category. The results reveal a substantial alignment in sensitivity rankings between the two methods. Indicator F1 (inundation depth) demonstrates the highest sensitivity, signifying that alterations in the weight of the F1 indicator exhibit the most pronounced impact on risk level variations within the study area. The second tier of sensitivities includes indicators F2, F7, F8, F9, and F10. Risk levels display relatively low sensitivity towards alterations in the weights of indicators F3, F4, F5, and F6.
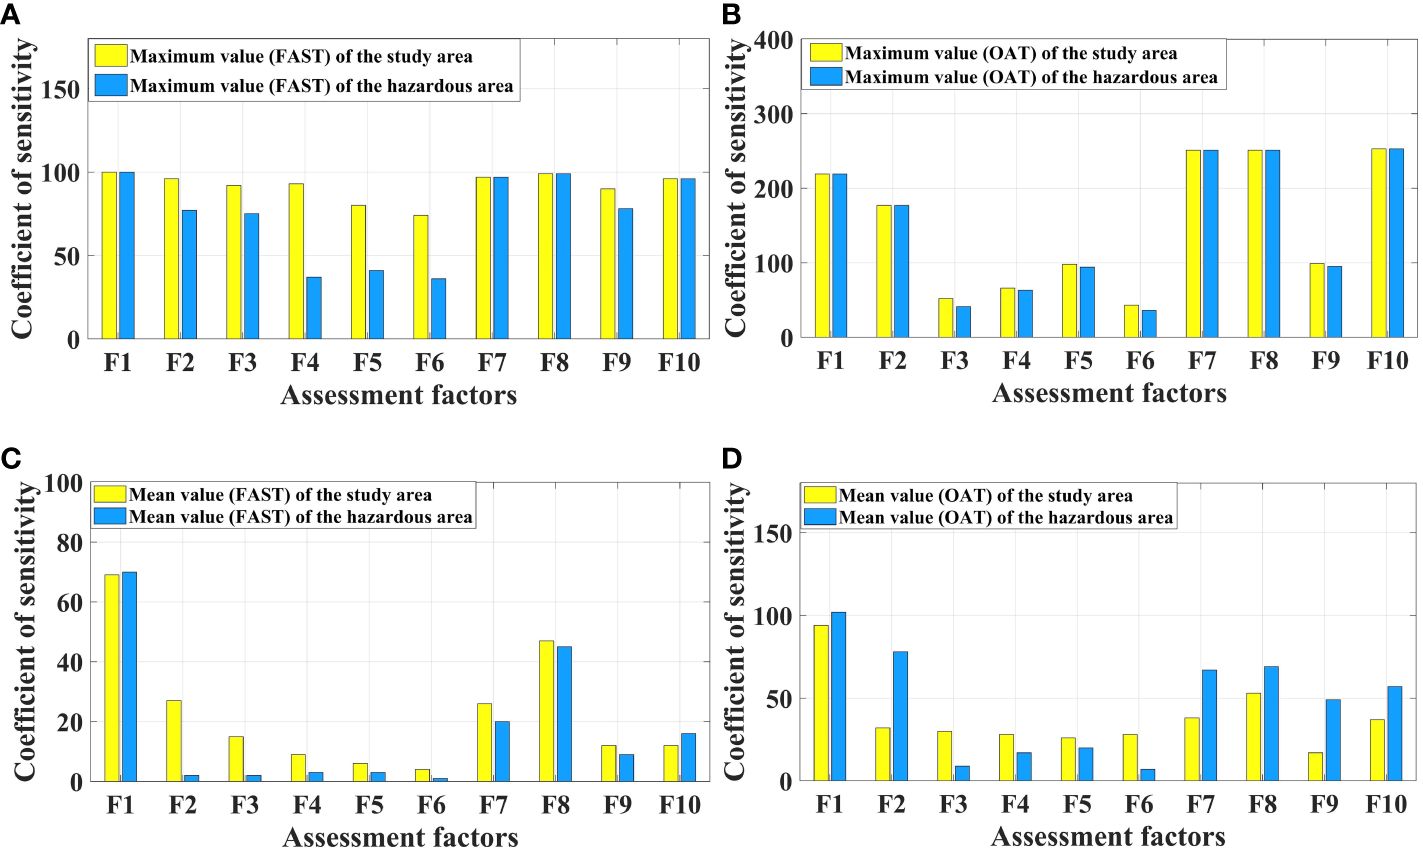
Figure 12 Sensitivity statistical charts for different assessment indicators. (A) the maximum sensitivity indices (FAST); (B) the maximum sensitivity indices (OAT); (C) the average sensitivity indices (FAST): (D) the average sensitivity indices (OAT).
In the process of management, decision-makers need judiciously utilize this information and thoroughly assess the influence of indicators with higher sensitivities on the evaluation of disaster risk levels. The AHP-EW method employed in this study for indicator selection is comprehensive, combining both subjective and objective aspects. The risk classification results are distinct. However, given the temporal and spatial heterogeneity of storm surge disasters, adjustments should be made in the application process based on the actual circumstances. Therefore, in the context of storm surge disaster warning and management, decision-makers should rely on actual circumstances and take into account the sensitivity of different indicator data to storm surge classification results. This will aid in determining the weights for locally chosen indicators, thus leading to a more rational storm surge risk level map.
Figure 13 illustrates indicator sensitivity maps for different regions and indicators. By observing these maps, the spatial heterogeneity of selected indicator sensitivities becomes evident. While the focus of this study is on the coastal areas of Huizhou City, decision-makers can obtain information from the map regarding the sensitivity range of various indicators at the village and town scales. The quantified sensitivity of indicators at different scales can provide crucial guidance for decision-makers in selecting indicator weights.
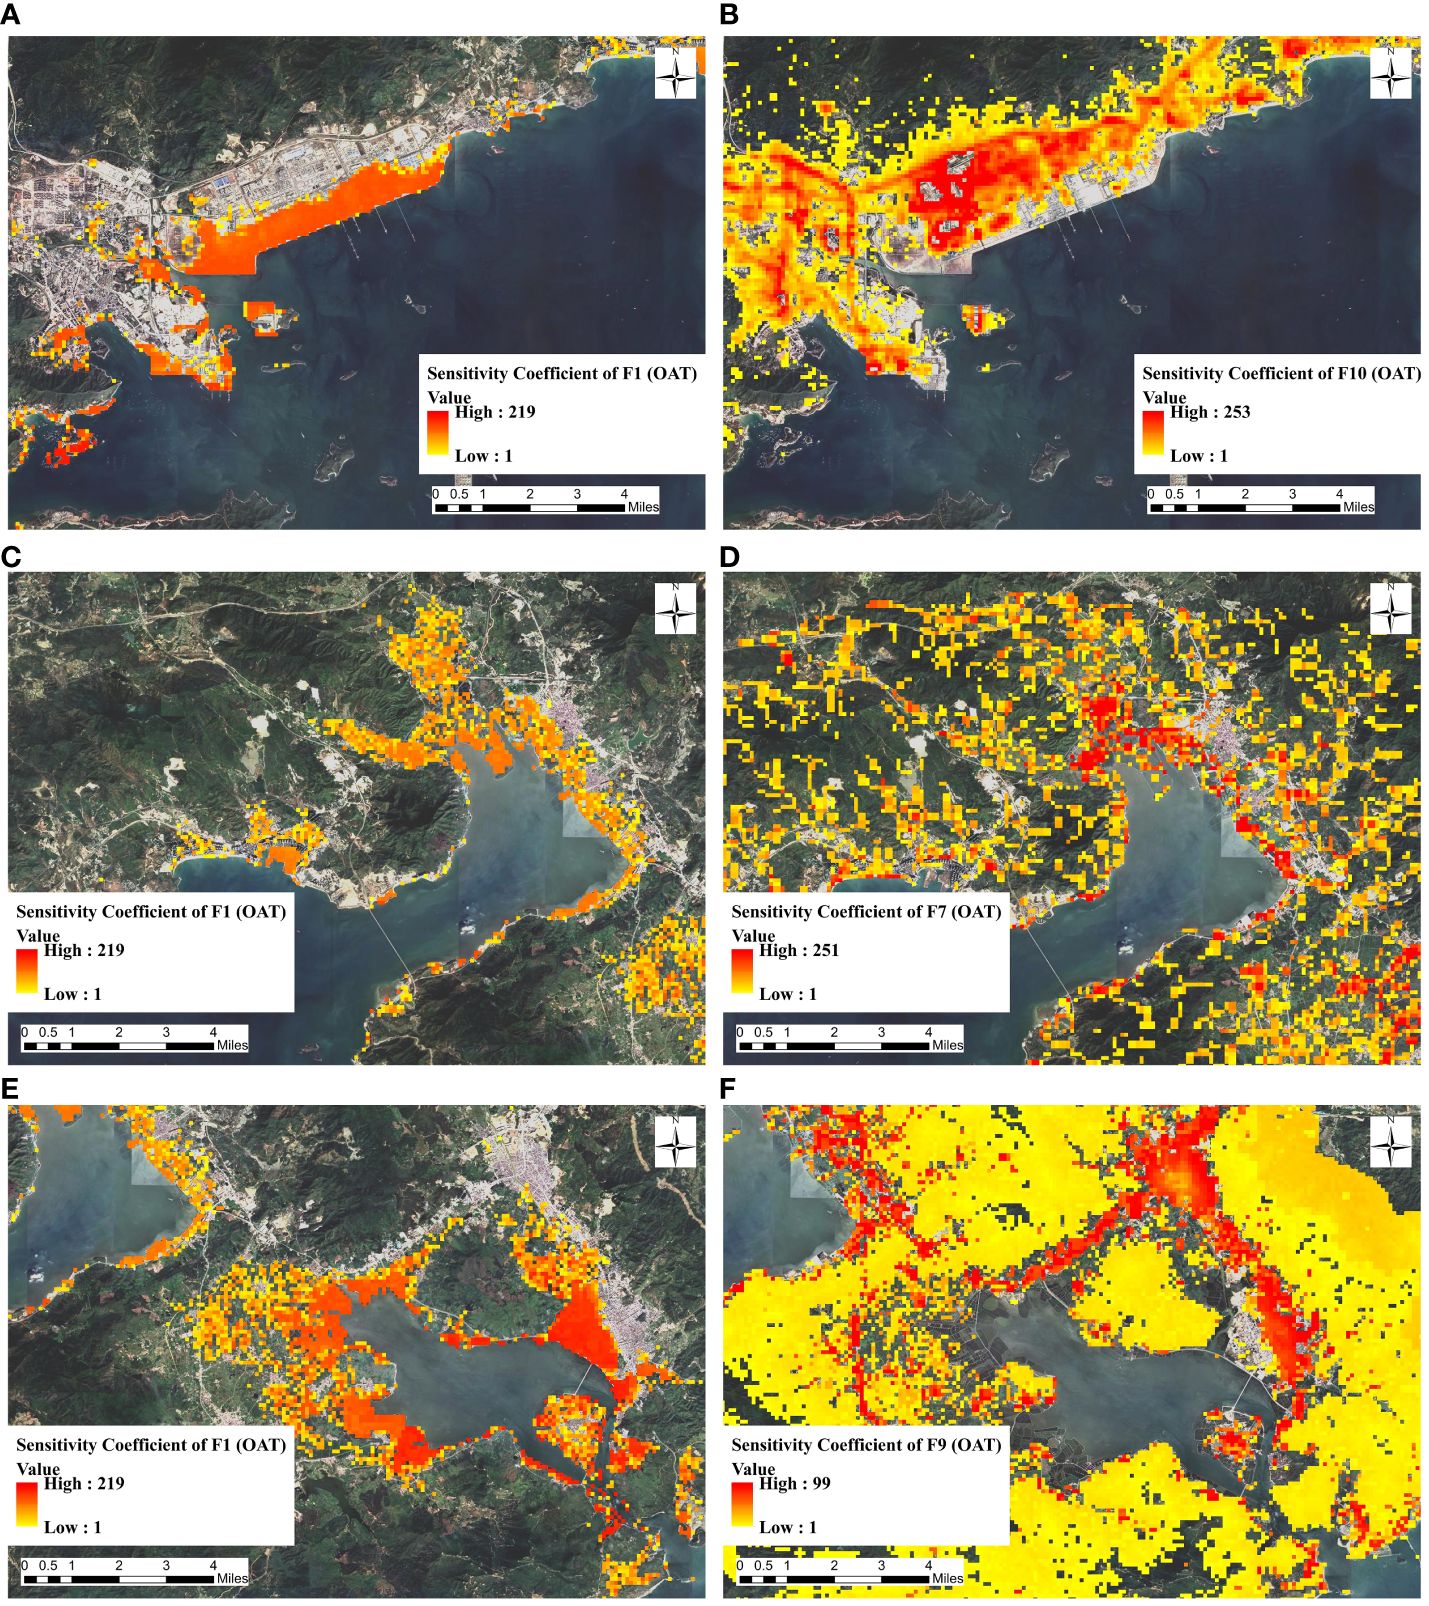
Figure 13 Sensitivity maps for different assessment indicators. (A) Donglian Village and Aotou Street regions (F1); (B) Donglian Village and Aotou Street regions (F10); (C) Jilong Town (F1); (D) Jilong Town (F7); (E) Huangbu Town (F1); (F) Huangbu Town (F9).
As depicted in Figures 13A, B, the southeastern region of the Danglin Village exhibits heightened sensitivity towards the inundation depth indicator (with a sensitivity index of 150), while demonstrating minimal sensitivity towards nighttime light. Additionally, the northwest region of Xuanlin Village exhibits a sensitivity exceeding 200 to the nighttime light indicator, while having extremely low sensitivity to the inundation depth indicator. The reverse pattern is observed in the southeast region of Xuanlin Village. Similarly, upon analyzing Figures 13C, D, it becomes evident that the coastal region of Leafing Village displays a notable disparity in sensitivity towards river system density indicators, with a sensitivity surpassing 200, as compared to the sensitivity towards inundation depth indicators, which ranges between 70 and 95. Hence, the metrics that demand particular attention within this region are the indicators related to river system density. Figures 13E, F illustrate a comparative analysis of sensitivity between land utilization and inundation depth indicators within the Huangbu Township area. The sensitivity towards inundation depth indicators (exceeding 200) significantly surpasses the sensitivity towards land utilization indicators (with a maximum of 99). Through comparative analysis of sensitivity maps, decision-makers can accurately assess the impact of different indicators on disaster assessment at various scales within their management areas. This provides a clearer understanding of the selection and prioritization of indicators.
This study addresses the issue of storm surge disaster impact on the Huizhou city and proposes a framework for assessing the risk levels of coastal storm surge disasters. The system integrates FVCOM-SWAN, GIS, RS, MCDM, and sensitivity analysis methods. Literature on risk assessment is diverse, but research on storm surge risk assessment is relatively traditional, and a standardized process has not yet been established. Currently, most research on storm surge risk assessment involves overlaying inundation data obtained from LULC data with vulnerability data. This study assesses storm surge risk levels using MCDM methods to evaluate selected indicators. This method not only addresses the issue of limited historical risk data in storm surge risk assessment for Huizhou city but also enhances the ability to explain the complexity and comprehensiveness of risk assessment. Considering the subjectivity of indicator weight selection and the objective attributes of data, this study uses AHP, FAHP, EW, AHP-EW and FAHP-EW to evaluate the storm surge risk level in the coastal area of Huizhou. Through comparative analysis, the most suitable method of storm surge risk level evaluation in Huizhou city is selected. The evaluation indicators utilized in this study including: the inundation depth, DEM, slope, aspect, curvature, NDVI, river system density, population density, LULC, and nighttime lights data. These indicators encompass hazard, exposure, and vulnerability aspects, enabling a comprehensive and scientific assessment of storm surge risk. In addition, there are few studies on the sensitivity test of the indicators for risk assessment. Analyzing the sensitivity of each assessment indicator to the risk assessment results is a crucial aspect of the risk management process. In this study, OAT analysis and FAST are used to calculate the sensitivity of each indicator and analyze the indicators with a significant impact on risk assessment. Main findings of the present study are the followings:
(1) The selection of storm surge disaster assessment indicators takes into account the disaster hazard, exposure and vulnerability indicators specific to the Huizhou city. The risk level map obtained through this approach, with a hazardous area of 110 km², surpasses the traditional method (Wang et al., 2021). The traditional method, which overlays inundation depth with land utilization to create a map, results in a hazardous area of 77 km². In addition to LULC, assessment indicators are supplemented in areas such as economics, population, and agriculture. By comprehensively considering various indicators for risk assessment, such as nighttime lights, population density, NDVI, etc., it becomes possible to detect risk areas that may not be captured through the evaluation of individual indicators alone. Not only does the new approach encompass a larger hazardous region, but it is also notably more reasonable and accurate.
(2) The comparison among five MCDM methods, namely AHP, FAHP, EW, AHP-EW, and FAHP-EW, result in hazardous area sizes ranging from 94 km² to 113 km². The comparative results indicate that AHP-EW and FAHP-EW methods can reduce the subjectivity in expert evaluation of indicators. Additionally, the AHP-EW method demonstrates clearer differentiation of risk levels for the most unfavorable storm surge disaster simulated in this study, facilitating the identification of high-risk areas for storm surge disasters. The AHP-EW method provides a more scientifically determined weight for each indicator, resulting in a risk level map that is better suited for storm surge risk classification.
(3) The sensitivity of standard layer indicators is calculated using the OAT analysis method and FAST method. The results indicate that the OAT method yielded an average sensitivity of 102 for the inundation depth indicator in the disaster area, exerting the greatest influence on the risk assessment outcome. Furthermore, in the second tier of sensitivity, river system density (67), population density (69), land utilization (49), DEM (78), and nighttime light (57) exhibit notable influences. In order to establish risk level divisions for different scales, reference should be made to sensitivity maps of indicators corresponding to various regional scales. This process aids in defining the weighting criteria between indicators, with the aim of obtaining a more accurate risk level map.
With global climate change, extreme typhoon disasters are expected to occur more frequently in the future. Typhoons with a minimum atmospheric pressure of 910 hPa (recurrence period of 100 years) occurred in the South China Sea in 2014 (Typhoon Rammasun) and 2016 (Typhoon Meranti), causing significant losses to coastal cities in China. This study employs Typhoon Mangkhut as a prototype, modifying its path to make landfall at the Huizhou station and adjusting the minimum atmospheric pressure to 880 hPa, corresponding to a return period of 1000 years. The modified typhoon is not a historical storm surge but an assuming situation of the most severe typhoon that could occur in the study area in the future. The assessment of risk level maps is conducted by envisioning the potential occurrence of the most severe storm surge in the future. Hence, risk maps can assist decision-makers in formulating risk response plans and evacuation strategies for densely populated coastal communities, minimizing civilian casualties. They can also be utilized to identify risk zones with a high concentration of hazardous materials, preventing potential environmental damage and secondary disasters that may be affected by storm surge.
This study aims to comprehensively assess the risk levels of the coastal areas in Huizhou city. It calculates the sensitivity of each criterion layer to provide strategic information for local administrative managers in storm surge disaster prevention. As a future research direction, storm surges often occur in conjunction with rainfall, leading to compound disasters. Simultaneously, the limitation of this study lies in focusing solely on the disasters caused by storm surge. Factors like heavy rainfall, strong winds, etc., which are also hazardous during typhoon landfall, have not been considered. Investigating compound disasters involving multiple factors can offer more comprehensive and accurate information for local disaster prevention and control efforts.
The raw data supporting the conclusions of this article will be made available by the authors, without undue reservation.
WW: Data curation, Formal analysis, Investigation, Methodology, Visualization, Writing – original draft. SH: Data curation, Formal analysis, Investigation, Visualization, Writing – review & editing. HQ: Conceptualization, Funding acquisition, Methodology, Project administration, Supervision, Validation, Writing – original draft. LY: Data curation, Validation, Visualization, Writing – review & editing. LM: Conceptualization, Funding acquisition, Project administration, Supervision, Writing – review & editing.
The author(s) declare that financial support was received for the research, authorship, and/or publication of this article. This work was supported by the National Key Research and Development Program of China (Grant No. 2021YFC3101800), Shenzhen Science and Technology Program (Grant No. KCXFZ20211020164015024), National Natural Science Foundation of China (Grant No. 52101332) and Guangdong Basic and Applied Basic Research Foundation (Grant No. 2023A1515240047).
The authors declare that the research was conducted in the absence of any commercial or financial relationships that could be construed as a potential conflict of interest.
All claims expressed in this article are solely those of the authors and do not necessarily represent those of their affiliated organizations, or those of the publisher, the editors and the reviewers. Any product that may be evaluated in this article, or claim that may be made by its manufacturer, is not guaranteed or endorsed by the publisher.
Abd-el-Kader M. M., El-Feky A. M., Saber M., AlHarbi M. M., Alataway A., Alfaisal F. M. (2023). Designating appropriate areas for flood mitigation and rainwater harvesting in arid region using a GIS-based multi-criteria decision analysis. Water Resour. Manage. 37, 1083–1108. doi: 10.1007/s11269-022-03416-6
Adeli E., Sun L., Wang J., Taflanidis A. A. (2023). An advanced spatio-temporal convolutional recurrent neural network for storm surge predictions. Neural Computing Appl. 35, 1–17. doi: 10.1007/s00521-023-08719-2
Aslan V. (2023). Evaluation of birecik basin flood detection with GIS assisted AHP methods. Ksce J. Civil Eng. 27, 2891–2907. doi: 10.1007/s12205-023-1271-x
Azizi E., Nikoo M. R., Mostafazadeh R., Hazbavi Z. (2023). Flood vulnerability analysis using different aggregation frameworks across watersheds of Ardabil province, northwestern Iran. Int. J. Disaster Risk Reduction 91, 103680. doi: 10.1016/j.ijdrr.2023.103680
Booij N., Holthuijsen L. H., Ris R. C. (1996). The "SWAN" wave model for shallow water. Coast. Eng. 668–676. doi: 10.1061/9780784402429.053
Chang D. (1996). Applications of the extent analysis method on fuzzy AHP. Eur. J. Operational Res. 95, 649–655. doi: 10.1016/0377-2217(95)00300-2
Chaumillon E., Bertin X., Fortunato A. B., Bajo M., Schneider J., Dezileau L., et al. (2017). Storm-induced marine flooding: Lessons from a multidisciplinary approach. Earth-Science Rev. 165, 151–184. doi: 10.1016/j.earscirev.2016.12.005
Chen C., Liu H., Beardsley R. C. (2003). An unstructured grid, finite-volume, three-dimensional, primitive equations ocean model: application to coastal ocean and estuaries. J. Atmospheric Oceanic Technol. 20, 159–186. doi: 10.1175/1520-0426(2003)020<0159:AUGFVT>2.0.CO;2
Chen Y., Yu J., Khan S. (2010). Spatial sensitivity analysis of multi-criteria weights in GIS-based land suitability evaluation. Environ. Model. Software 25, 1582–1591. doi: 10.1016/j.envsoft.2010.06.001
Chen J., Huang G., Chen W. (2021). Towards better flood risk management: Assessing flood risk and investigating the potential mechanism based on machine learning models. J. Environ. Manage. 293, 112810. doi: 10.1016/j.jenvman.2021.112810
Chi Y., Rong Z. (2021). Assessment of extreme storm surges over the changjiang river estuary from a wave-current coupled model. J. Mar. Sci. Eng. 9, 1222. doi: 10.3390/jmse9111222
Costache R., Popa M. C., Bui D. T., Diaconu D. C., Ciubotaru N., Minea G., et al. (2020). Spatial predicting of flood potential areas using novel hybridizations of fuzzy decision-making, bivariate statistics, and machine learning. J. Hydrology 585, 124808. doi: 10.1016/j.jhydrol.2020.124808
Dano U. L., Balogun A., Matori A., Wan Yusouf K., Abubakar I. R., Said Mohamed M. A., et al. (2019). Flood susceptibility mapping using GIS-based analytic network process: A case study of Perlis, Malaysia. Water 11, 615. doi: 10.3390/w11030615
Davila Hernandez C., Ho J., Kim D., Oubeidillah A. (2023). Machine-learning-based model for hurricane storm surge forecasting in the lower Laguna Madre. Algorithms 16, 232. doi: 10.3390/a16050232
de Brito M. M., Almoradie A., Evers M. (2019). Spatially-explicit sensitivity and uncertainty analysis in a MCDA-based flood vulnerability model. Int. J. Geographical Inf. Sci. 33, 1788–1806. doi: 10.1080/13658816.2019.1599125
De Scally F. A. (2014). Evaluation of storm surge risk: a case study from Rarotonga, Cook Islands. Int. J. Disaster Risk Reduction 7, 9–27. doi: 10.1016/j.ijdrr.2013.12.002
Feng K. (2020). Observed spatial pattern of summer extreme precipitation in China and its potential links to rapid urbanization. IOP Conf. Series: Earth Environ. Sci. 446, 32042. doi: 10.1088/1755-1315/446/3/032042
Franci F., Bitelli G., Mandanici E., Hadjimitsis D., Agapiou A. (2016). Satellite remote sensing and GIS-based multi-criteria analysis for flood hazard mapping. Natural Hazards 83, 31–51. doi: 10.1007/s11069-016-2504-9
Glahn B., Taylor A., Kurkowski N., Shaffer W. A. (2009). The role of the SLOSH model in national weather service storm surge forecasting. Natl. Weather Digest 33, 3–14.
H. F., A. F., J. A. N. H. (2016). “Urban flood risk mapping using analytichierarchy process and natural break classification (Case study: Surabaya, East Java, Indonesia),” in 2016 International Conference on Knowledge Creation and Intelligent Computing (KCIC), Vol. 2016-01-01. (Manado, Indonesia: IEEE), 148–154.
He Y., Xiong J., Cheng W., Yang J., He W., Yong Z., et al. (2022). Assessing the risk posed by flash floods to the transportation network in southwestern China. Geocarto Int. 37, 13210–13228. doi: 10.1080/10106049.2022.2076919
Holland G. J. (1980). An analytic model of the wind and pressure profiles in hurricanes. Monthly Weather Rev. 108, 1212–1218. doi: 10.1175/1520-0493(1980)108<1212:AAMOTW>2.0.CO;2
Kablan M. K. A., Dongo K., Coulibaly M. (2017). Assessment of social vulnerability to flood in urban côte d’Ivoire using the MOVE framework. Water 9, 292. doi: 10.3390/w9040292
Li S., Chen C. (2022). Air-sea interaction processes during hurricane Sandy: Coupled WRF-FVCOM model simulations. Prog. Oceanography 206, 102855. doi: 10.1016/j.pocean.2022.102855
Li Z., He W., Cheng M., Hu J., Yang G., Zhang H. (2023). SinoLC-1: the first 1-meter resolution national-scale land-cover map of China created with the deep learning framework and open-access data. Earth System Sci. Data Discussions 2023, 1–38. doi: 10.5194/essd-2023-87
Li X., Yan D., Wang K., Weng B., Qin T., Liu S. (2019). Flood risk assessment of global watersheds based on multiple machine learning models. Water 11, 1654. doi: 10.3390/w11081654
Lu X., Chan F. K. S., Chen W., Chan H. K., Gu X. (2022). An overview of flood-induced transport disruptions on urban streets and roads in Chinese megacities: Lessons and future agendas. J. Environ. Manage. 321, 115991. doi: 10.1016/j.jenvman.2022.115991
Lyu H., Sun W., Shen S., Arulrajah A. (2018). Flood risk assessment in metro systems of mega-cities using a GIS-based modeling approach. Sci. Total Environ. 626, 1012–1025. doi: 10.1016/j.scitotenv.2018.01.138
Lyu H., Yin Z. (2023). An improved MCDM combined with GIS for risk assessment of multi-hazards in Hong Kong. Sustain. Cities Soc. 91, 104427. doi: 10.1016/j.scs.2023.104427
Magnan A. K., Oppenheimer M., Garschagen M., Buchanan M. K., Duvat V. K., Forbes D. L., et al. (2022). Sea level rise risks and societal adaptation benefits in low-lying coastal areas. Sci. Rep. 12, 10677. doi: 10.1038/s41598-022-14303-w
Mitra R., Das J. (2023). A comparative assessment of flood susceptibility modelling of GIS-based TOPSIS, VIKOR, and EDAS techniques in the Sub-Himalayan foothills region of Eastern India. Environ. Sci. pollut. Res. 30, 16036–16067. doi: 10.1007/s11356-022-23168-5
Moreira L. L., de Brito M. M., Kobiyama M. (2021). Effects of different normalization, aggregation, and classification methods on the construction of flood vulnerability indexes. Water 13, 98. doi: 10.3390/w13010098
Mousavi S. M., Ataie-Ashtiani B., Hosseini S. M. (2022). Comparison of statistical and MCDM approaches for flood susceptibility mapping in northern Iran. J. Hydrology 612, 128072. doi: 10.1016/j.jhydrol.2022.128072
Ramkar P., Yadav S. M. (2021). Flood risk index in data-scarce river basins using the AHP and GIS approach. Natural Hazards 109, 1119–1140. doi: 10.1007/s11069-021-04871-x
Rilo A., Tavares A. O., Freire P., Zêzere J. L., Haigh I. D. (2022). Improving estuarine flood risk knowledge through documentary data using multiple correspondence analysis. Water 14, 3161. doi: 10.3390/w14193161
Roy S., Bose A., Chowdhury I. R. (2021). Flood risk assessment using geospatial data and multi-criteria decision approach: a study from historically active flood-prone region of Himalayan foothill, India. Arabian J. Geosciences 14, 999. doi: 10.1007/s12517-021-07324-8
Saaty T. L. (1970). Optimization in integers and related extremal problems. Am. Math. Mon. 78 (8), 921–923. doi: 10.2307/2316512
Sahmutoglu I., Taskin A., Ayyildiz E. (2023). Assembly area risk assessment methodology for post-flood evacuation by integrated neutrosophic AHP-CODAS. Natural Hazards 116, 1071–1103. doi: 10.1007/s11069-022-05712-1
Sahraei R., Kanani Sadat Y., Homayouni S., Safari A., Oubennaceur K., Chokmani K. (2023). A novel hybrid GIS-based multi-criteria decision-making approach for flood susceptibility analysis in large ungauged watersheds. J. Flood Risk Manage. 16. doi: 10.1111/jfr3.12879
Schaibly J. H., Shuler K. E. (1973). Study of the sensitivity of coupled reaction systems to uncertainties in rate coefficients. II Applications. J. Chem. Phys. 59, 3879–3888. doi: 10.1063/1.1680572
Sepehri M., Malekinezhad H., Hosseini S. Z., Ildoromi A. R. (2019). Assessment of flood hazard mapping in urban areas using entropy weighting method: a case study in Hamadan city, Iran. Acta Geophysica 67, 1435–1449. doi: 10.1007/s11600-019-00342-x
Sian K. T. L. K., Dong C., Liu H., Wu R., Zhang H. (2020). Effects of model coupling on typhoon kalmaegi, (2014) simulation in the south China sea. Atmosphere 11, 432. doi: 10.3390/atmos11040432
Tangney P. (2020). Understanding climate change as risk: a review of IPCC guidance for decision-making. J. Risk Res. 23, 1424–1439. doi: 10.1080/13669877.2019.1673801
Tokgozlu A., Ozkan E. (2018). Application of AHP method in flood risk maps: aksu river basin example. SDU Faculty Arts Sci. J. Soc. Sci. 44, 151–176. doi: 10.1007/s40996-023-01055-4
Wang Y., Chen X., Wang L., Min G. (2020). Effective ioT-facilitated storm surge flood modeling based on deep reinforcement learning. IEEE Internet Things J. 7, 6338–6347. doi: 10.1109/JIoT.6488907
Wang Y., Guo Z., Zheng S., Zhang M., Shu X., Luo J., et al. (2021). Risk assessment for typhoon-induced storm surges in Wenchang, Hainan Island of China. Geomatics Natural Hazards Risk 12, 880–899. doi: 10.1080/19475705.2021.1899060
Wang Y., Li Z., Tang Z., Zeng G. (2011). A GIS-based spatial multi-criteria approach for flood risk assessment in the dongting lake region, hunan, central China. Water Resour. Manage. 25, 3465–3484. doi: 10.1007/s11269-011-9866-2
Watson C. C. (1995). The Arbiter of Storms: a high resolution, GIS-based system for integrated storm hazard modeling. Natl. Weather Digest 20, 2–9.
Wu J., Chen X., Lu J. (2022). Assessment of long and short-term flood risk using the multi-criteria analysis model with the AHP-Entropy method in Poyang Lake basin. Int. J. Disaster Risk Reduction 75, 102968. doi: 10.1016/j.ijdrr.2022.102968
Xianwu S., Jufei Q., Bingrui C., Xiaojie Z., Haoshuang G., Jun W., et al. (2020). Storm surge risk assessment method for a coastal county in China: case study of Jinshan District, Shanghai. Stochastic Environ. Res. Risk Assess. 34, 627–640. doi: 10.1007/s00477-020-01791-3
Yang Z., Shao W., Ding Y., Shi J., Ji Q. (2020). Wave simulation by the SWAN model and FVCOM considering the sea-water level around the zhoushan islands. J. Mar. Sci. Eng. 8, 783. doi: 10.3390/jmse8100783
Yin J., Ye M., Yin Z., Xu S. (2015). A review of advances in urban flood risk analysis over China. Stochastic Environ. Res. Risk Assess. 29, 1063–1070. doi: 10.1007/s00477-014-0939-7
Zhang Y., Li T., Wang H., Guo J. (2016). Storm surge risk assessment for Yuhuan County in Taizhou City. Natural Hazards 84, 1–16. doi: 10.1007/s11069-016-2328-7
Keywords: storm surge, risk assessment, sensitivity analysis, MCDM, GIS
Citation: Wei W, Huang S, Qin H, Yu L and Mu L (2024) Storm surge risk assessment and sensitivity analysis based on multiple criteria decision-making methods: a case study of Huizhou City. Front. Mar. Sci. 11:1364929. doi: 10.3389/fmars.2024.1364929
Received: 03 January 2024; Accepted: 29 February 2024;
Published: 19 March 2024.
Edited by:
Paolo Ciavola, University of Ferrara, ItalyReviewed by:
Fangfang Zhu, The University of Nottingham Ningbo (China), ChinaCopyright © 2024 Wei, Huang, Qin, Yu and Mu. This is an open-access article distributed under the terms of the Creative Commons Attribution License (CC BY). The use, distribution or reproduction in other forums is permitted, provided the original author(s) and the copyright owner(s) are credited and that the original publication in this journal is cited, in accordance with accepted academic practice. No use, distribution or reproduction is permitted which does not comply with these terms.
*Correspondence: Hao Qin, cWgxcWgxMDBAYWx1bW5pLnNqdHUuZWR1LmNu; Lin Mu, bW91bGluMTk3N0Bob3RtYWlsLmNvbQ==
Disclaimer: All claims expressed in this article are solely those of the authors and do not necessarily represent those of their affiliated organizations, or those of the publisher, the editors and the reviewers. Any product that may be evaluated in this article or claim that may be made by its manufacturer is not guaranteed or endorsed by the publisher.
Research integrity at Frontiers
Learn more about the work of our research integrity team to safeguard the quality of each article we publish.