 Ninghong Li1
 Xufeng Zheng
 Xiao Ma
 Junying Zhu
94% of researchers rate our articles as excellent or good
Learn more about the work of our research integrity team to safeguard the quality of each article we publish.
Find out more
ORIGINAL RESEARCH article
Front. Mar. Sci., 28 June 2024
Sec. Global Change and the Future Ocean
Volume 11 - 2024 | https://doi.org/10.3389/fmars.2024.1361892
This article is part of the Research TopicRole of the Southern Ocean in Atmospheric pCO2 Change: Observations, Simulations and PaleorecordsView all 13 articles
The Southern Ocean connects the Pacific, Atlantic, and Indian Oceans, serving as a key hub for the global overturning circulation. The climate of the Southern Ocean is closely linked to the low-latitude equatorial Pacific, as well as the high-latitude regions of the North Atlantic, making it an important component of the global climate system. Due to the interactions of various processes such as atmospheric, oceanic, and ice cover, the Southern Ocean exhibits a complex and variable sea surface temperature structure. Satellite observations indicate that since 1980, the sea surface temperature of the Southern Ocean has been cooling, contrary to the global warming trend. However, due to the relatively short length of satellite observations, the specific mechanisms are not yet clear. Here, we used the EOF method to analyze sea surface temperature data since 1870 (HadISST1 and ERSSTV5), with three main separated modes explaining over 70% of the sea temperature variability. Among them, the first mode shows widespread positive sea surface temperature anomalies in the Southern Ocean, with a time series change consistent with global temperature anomalies, representing a mode of global warming. The second mode corresponds to the Atlantic Multidecadal Oscillation (AMO) but with a lag of approximately 4 years. The third mode is consistent with the variability of the El Niño-Southern Oscillation (ENSO). Furthermore, our study indicates that despite the ongoing global warming since 1980, the negative phase of AMO and positive phase of ENSO may counteract the effects of global warming, leading to an overall cooling trend in the sea surface temperature of the Southern Ocean.
The continuous emission of greenhouse gas into the atmosphere since the industrial revolution results in the rise of global temperature (IPCC, 2021). The ocean acting as a regulator of the climate system can slow down the warming of the global atmospheric surface temperature by absorbing excess heat due to its vast area and large heat capacity (Cheng et al., 2019). Over the past few decades, the ocean has absorbed more than 90% of the excess heat from the energy imbalance and more than half of the globally increased ocean heat is stored in the Southern Ocean (Rye et al., 2014).
The Southern Ocean has a unique and complex ocean dynamic environment, where different ocean processes influence the heat absorption and redistribution (Rintoul, 2018). Observations show that the warming in the Southern Ocean are not uniform and vary in different regions. The most significant warming areas are mainly concentrated in the Indian Ocean sectors of the Southern Ocean, followed by the Pacific Ocean sectors, while the Atlantic Ocean sectors of the Southern Ocean has relatively smaller warming amplitudes (Purkey and Johnson, 2010; Schmidtko et al., 2014; Cheng et al., 2020). Furthermore, the Southern Ocean is connected to the Pacific, Indian, and Atlantic Oceans. The distribution and variation of heat in the Southern Ocean can not only influence the climate changes in other ocean basins but also be affected by the climate and ocean processes of other ocean basins through atmospheric bridges and other mechanisms (Li et al., 2014; Liu et al., 2018).
Reanalysis data show that the fastest warming region in the Southern Ocean from 1979 to 2001 is located between 40°S and 45°S, followed by the area near 60°S, with slower warming in other regions (Fogt and Bromwich, 2006). Moreover, buoy data has revealed that since the 1950s, the warming of sub-surface waters in the Southern Ocean has been significantly higher than in most other global ocean regions, with the warming occurring near the Antarctic Circumpolar Current (ACC) (Gille, 2002). Other studies utilizing observational data collected since the 1960s have similarly shown that upper ocean waters in mid-latitudes of the Southern Ocean are rapidly warming, accompanied by surface water freshening (Böning et al., 2008; Wijffels et al., 2008). However, some studies have found that south of 60°S in the Southern Ocean, there is a weaker or cooling trend in surface warming (Purkey and Johnson, 2010; Schmidtko et al., 2014). Recent work based on satellite observation revealed slight cooling trend since 1980 contrary to the global warming trend (Yang et al., 2023). However, the satellite observation is too short to elucidate the specific mechanisms contributing to this cooling trend. Here, we utilize data spanning from 1870 to 2022, totaling 153 years, to decompose various modes of Southern Ocean SST using Empirical Orthogonal Function (EOF) analysis. Our work aims to investigate the main mechanisms influencing the distribution and changes in Southern Ocean SST based on the spatial characteristics of temperature anomalies associated with different modes and their temporal trends. Based on above results, we proposed that despite the ongoing global warming since 1980, the negative phase of AMO and positive phase of ENSO may counteract the effects of global warming, leading to an overall cooling trend in the sea surface temperature of the Southern Ocean.
This study utilized sea surface temperature analyses from the Hadley Centre Sea ice and SST data set version 1(HadISST1) and Extended Reconstructed Sea Surface Temperature version 5 (ERSSTV5) datasets for Empirical Orthogonal Function (EOF) analysis. HadISST1 primarily consists of satellite observations, but data prior to the satellite era were reconstructed using ship-based measurements, which have uncertainty due to sparse coverage (Kennedy, 2014). Therefore, the ERSSTV5 dataset was used for additional comparison. HadISST1 dataset including monthly observations from 1870 to the present employs a standard method for calculating SST and undergoes quality control and correction processes based on observational data (Rayner et al., 2003). We choose the SST for latitude range of 40°S to 75°S and longitude range of 180° to -180°from January 1870 to December 2022 with a spatial resolution of 1° × 1° and a temporal resolution of monthly intervals for EOF analyses. The ERSSTV5 dataset is reconstructed by combining data from ships, buoys, satellite measurements, and other observation platforms. The spatial resolution of ERSSTV5 is approximately 2° × 2°. The selected time range and temporal resolution are consistent with HadISST1. To process the data, we first calculated anomalies relative to the annual mean sea surface temperature and then performed the EOF analysis. Moreover, we compare the time series of our extracted SST modes with climate index, i.e., AMO, ENSO, to infer their potential driving mechanisms. The AMO index was calculated based on the SST anomalies averaged over the North Atlantic region (0°-60°N, 80°W-0°) (Zhang and Delworth, 2007) and the Southern Oscillation Index (SOI) was used as an indicator of ENSO.
EOF analysis conducted on the area-weighted annual mean observed Sea Surface Temperature data south of 40°S for the HadISST1 spanning the years 1870 to 2022 reveals that the primary EOF mode (EOF1, Figure 1A) of HadISST1 exhibits predominantly positive values across the entire region south of 40°S, with minor cooling anomalies observed in the Bellingshausen Sea and Amundsen Sea. The first principal component (PC1, Figure 1D) exhibits a significant increasing trend, particularly noticeable after 1942, and its temporal variability is highly correlated with Global Temperature Anomaly (correlation coefficient, R=0.84, p<0.01). The dominant spatio-temporal SST variability in ERSSTV5 (Figure 2) closely resembles that of HadISST1. The observed SST pattern in the Southern Ocean is primarily characterized by widespread warming, which explains half of the total variance (59.1% for HadISST1 and 43.33% for ERSSTV5). Furthermore, the regression coefficients between the Global Temperature Anomaly and SST of HadISST1 demonstrate a similar pattern to that of Empirical Orthogonal Function 1 (EOF1) (Figures 3A, B). Due to the utilization of distinct data sources, analysis procedures, and historical bias corrections by HadISST1 and ERSSTV5, the strong agreement between them provides assurance in interpreting this phenomenon as indicative of “global warming”.
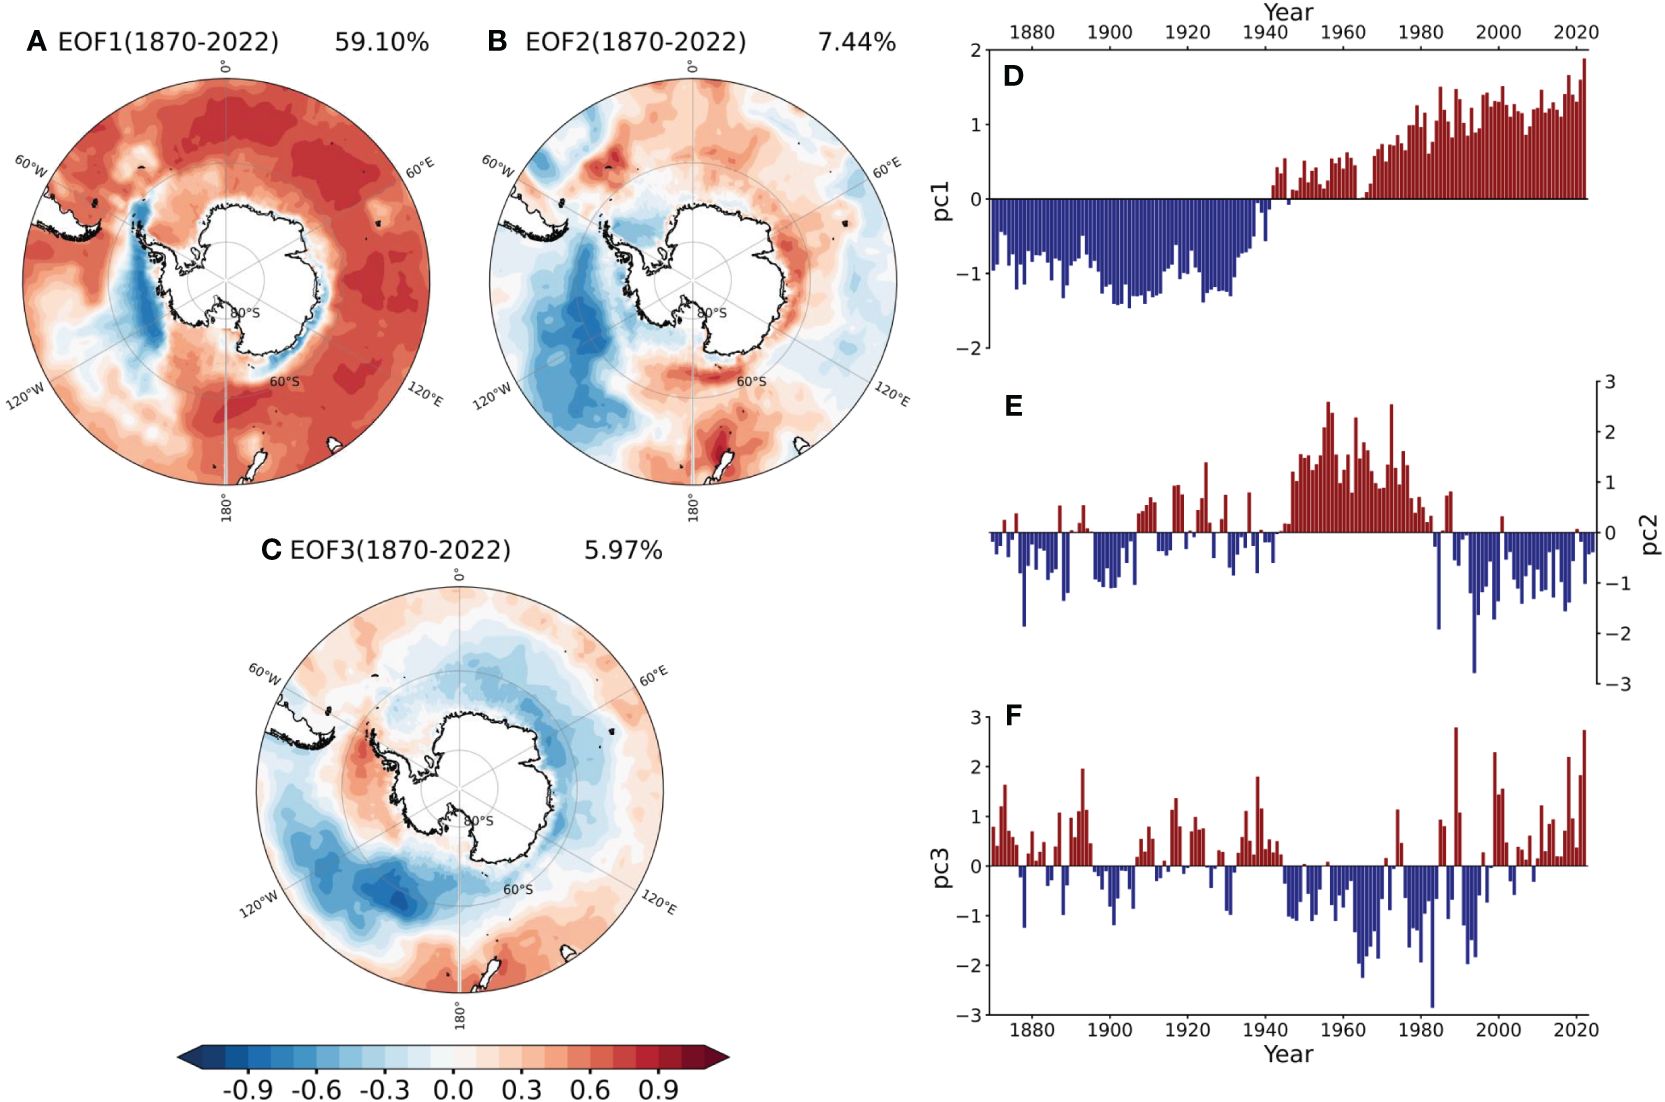
Figure 1 (HadISST1 dataset) EOF analysis results of sea surface temperature in the Southern Ocean from 1870 to 2022. (A–C) show the spatial temperature anomaly distribution (corresponding to positive PC values) and the contribution rate for EOF1, EOF2, and EOF3, respectively. Red indicates positive anomalies, while blue indicates negative anomalies. (D–F) show the corresponding time series fluctuations for each mode, with temperature anomalies reversed when PC values are negative.
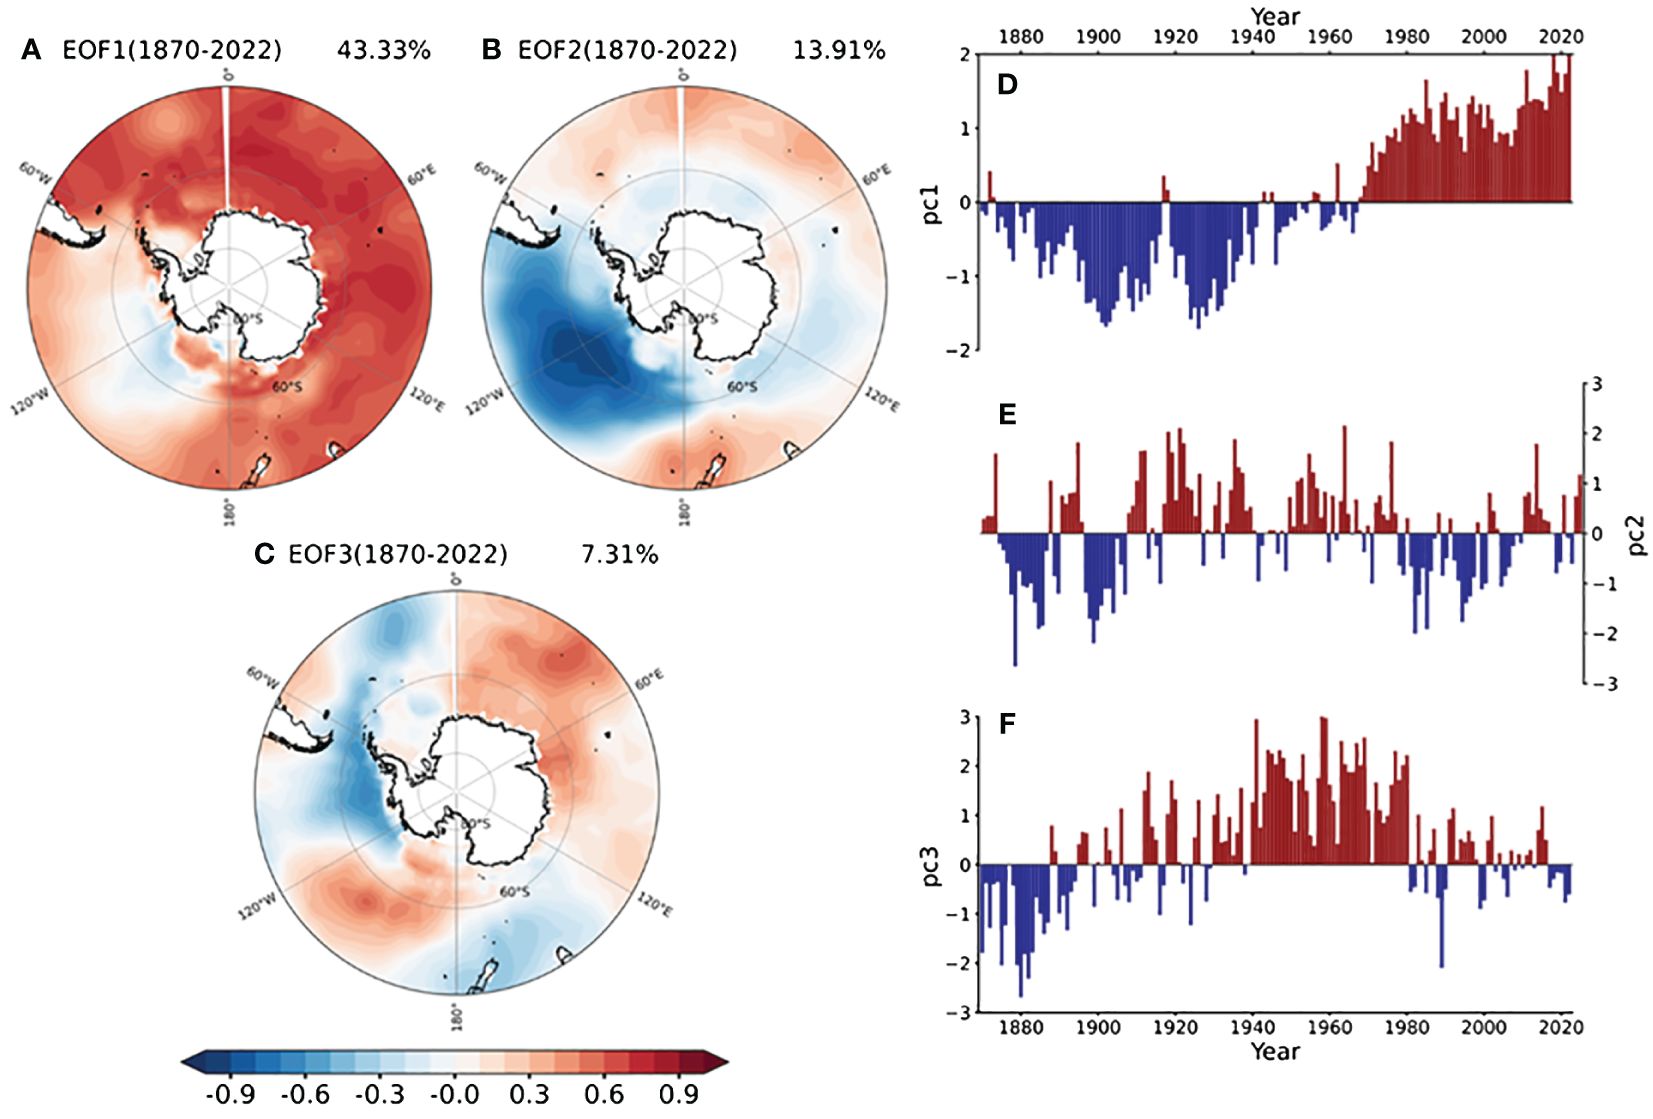
Figure 2 (ERSSTV5 dataset) EOF analysis results of sea surface temperature in the Southern Ocean from 1870 to 2022. (A–C) show the spatial temperature anomaly distribution (corresponding to positive PC values) and the contribution rate for EOF1, EOF2, and EOF3, respectively. (D–F) show the corresponding time series fluctuations for each mode.
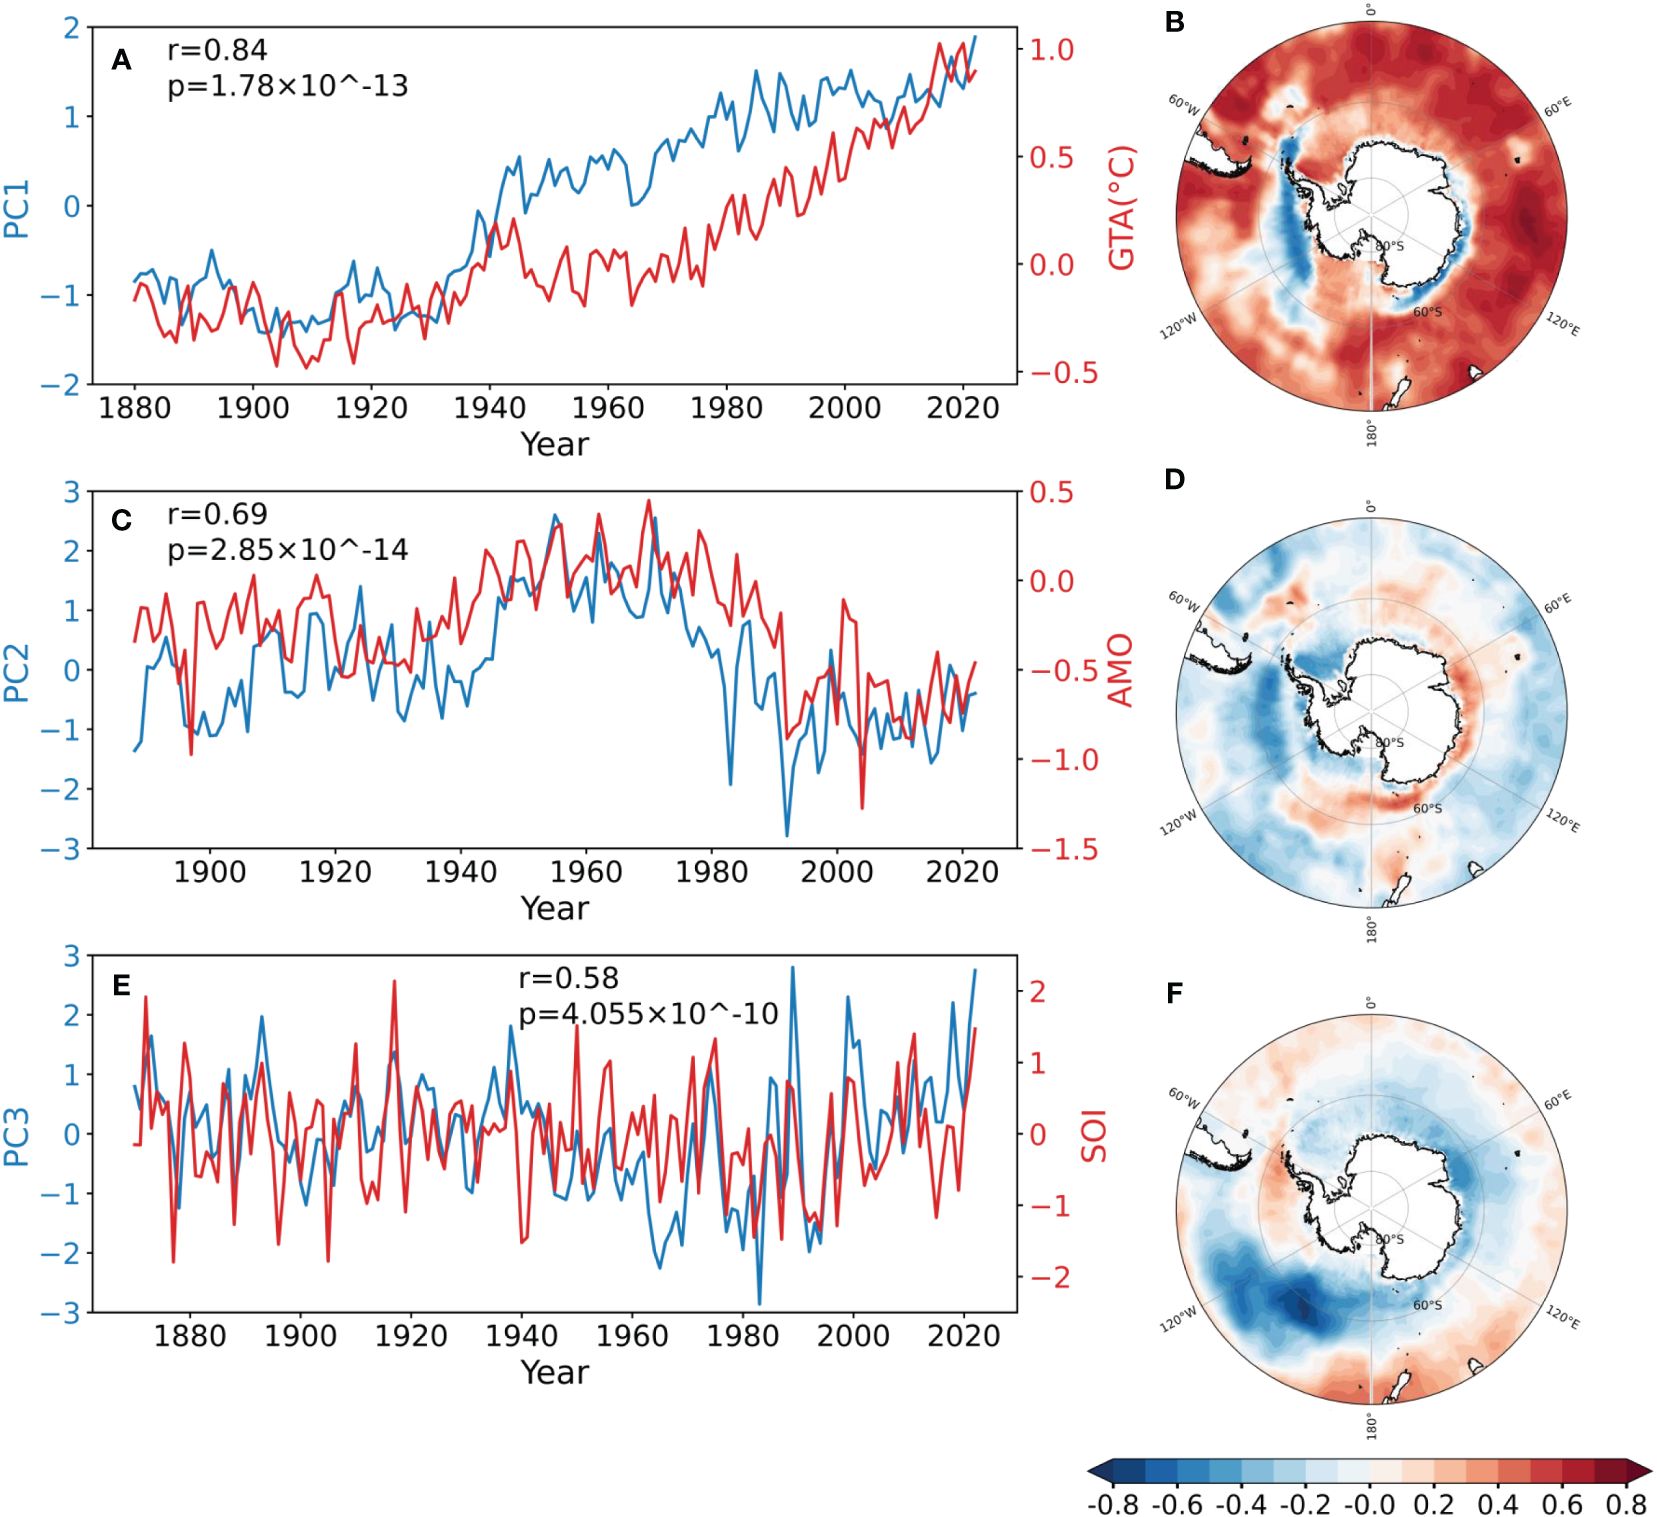
Figure 3 (HadISST1 dataset) Spatial correlation between relevant indicators and sea surface temperature in the Southern Ocean in the EOF analysis from 1870 to 2022. (A, C, E) show the correlation analysis between GTA (Global Temperature Anomaly), AMO, SOI, and PC1, PC2, PC3, respectively, in terms of time scale. (B, D, F) show the spatial correlation distribution between Southern Ocean SST and GTA, AMO, SOI, respectively.
The second EOF (EOF2, Figure 1B) of HadISST1, accounting for 7.4% of the total variance, displays a symmetric pattern characterized by positive anomalies predominantly in regions linked to the South Atlantic, along the coast of New Zealand, the Ross Sea, and the Antarctic ice edge. Conversely, negative anomalies are observed in the Bellingshausen Sea and Amundsen Sea. The second principal component (PC2, Figure 1E) displays significant interdecadal variability, exhibiting prominent positive anomalies between 1940 and 1980 and negative anomalies from 1980 to 2022. The spatial and temporal variability of the EOF2 and its corresponding principal component in the HadISST1 dataset closely resemble the EOF3 of ERSSTV5 (Figure 2C), which accounts for 7.31% of the total variance in ERSSTV5.
The regression coefficients between AMO and SST of HadISST1 exhibit similar pattern as EOF2. Furthermore, the temporal variation of PC2 is highly correlated to AMO. In short, EOF2 of HadISST1 and EOF3 of ERSSTV5 are mainly dominated by the AMO Figures 3C, D.
However, it should be noted that the AMO leads the PC2 of HadISST1 by approximately 4 years (Figure 4). The delayed impact of AMO on SST in the Southern Ocean could be attributed to the gradual propagation of Rossby waves. The AMO is the primary mode of interannual sea surface temperature variability in the Atlantic Ocean, exhibiting a period of around 60 years (Schlesinger and Ramankutty, 1994). The AMO can impact the Southern Ocean by modifying circulation patterns in the North Atlantic (Simpkins et al., 2016). The positive phase of the AMO is associated with the strengthening of North Atlantic eddies and the circulation in the Celtic Sea, leading to the generation of remote Rossby waves in the Southern Ocean. These Rossby waves disturb the circulation patterns in the Southern Ocean, consequently altering the distribution of SST and heat transport (Simpkins et al., 2014). The delayed response of the Southern Ocean SST to the AMO can be explained by the time needed for distant atmospheric teleconnections to occur and the sluggish propagation of Rossby waves, which can take several years to reach the Southern Ocean (Zhang et al., 2017). Moreover, the Southern Ocean is situated at high latitudes south of the equator, and its distinctive seasonal distribution may lead to a delay in the expression of the AMO signal in the SST of the Southern Ocean. The seasonal fluctuations and specific features necessitate a prolonged period for the Southern Ocean to react to the AMO signal.
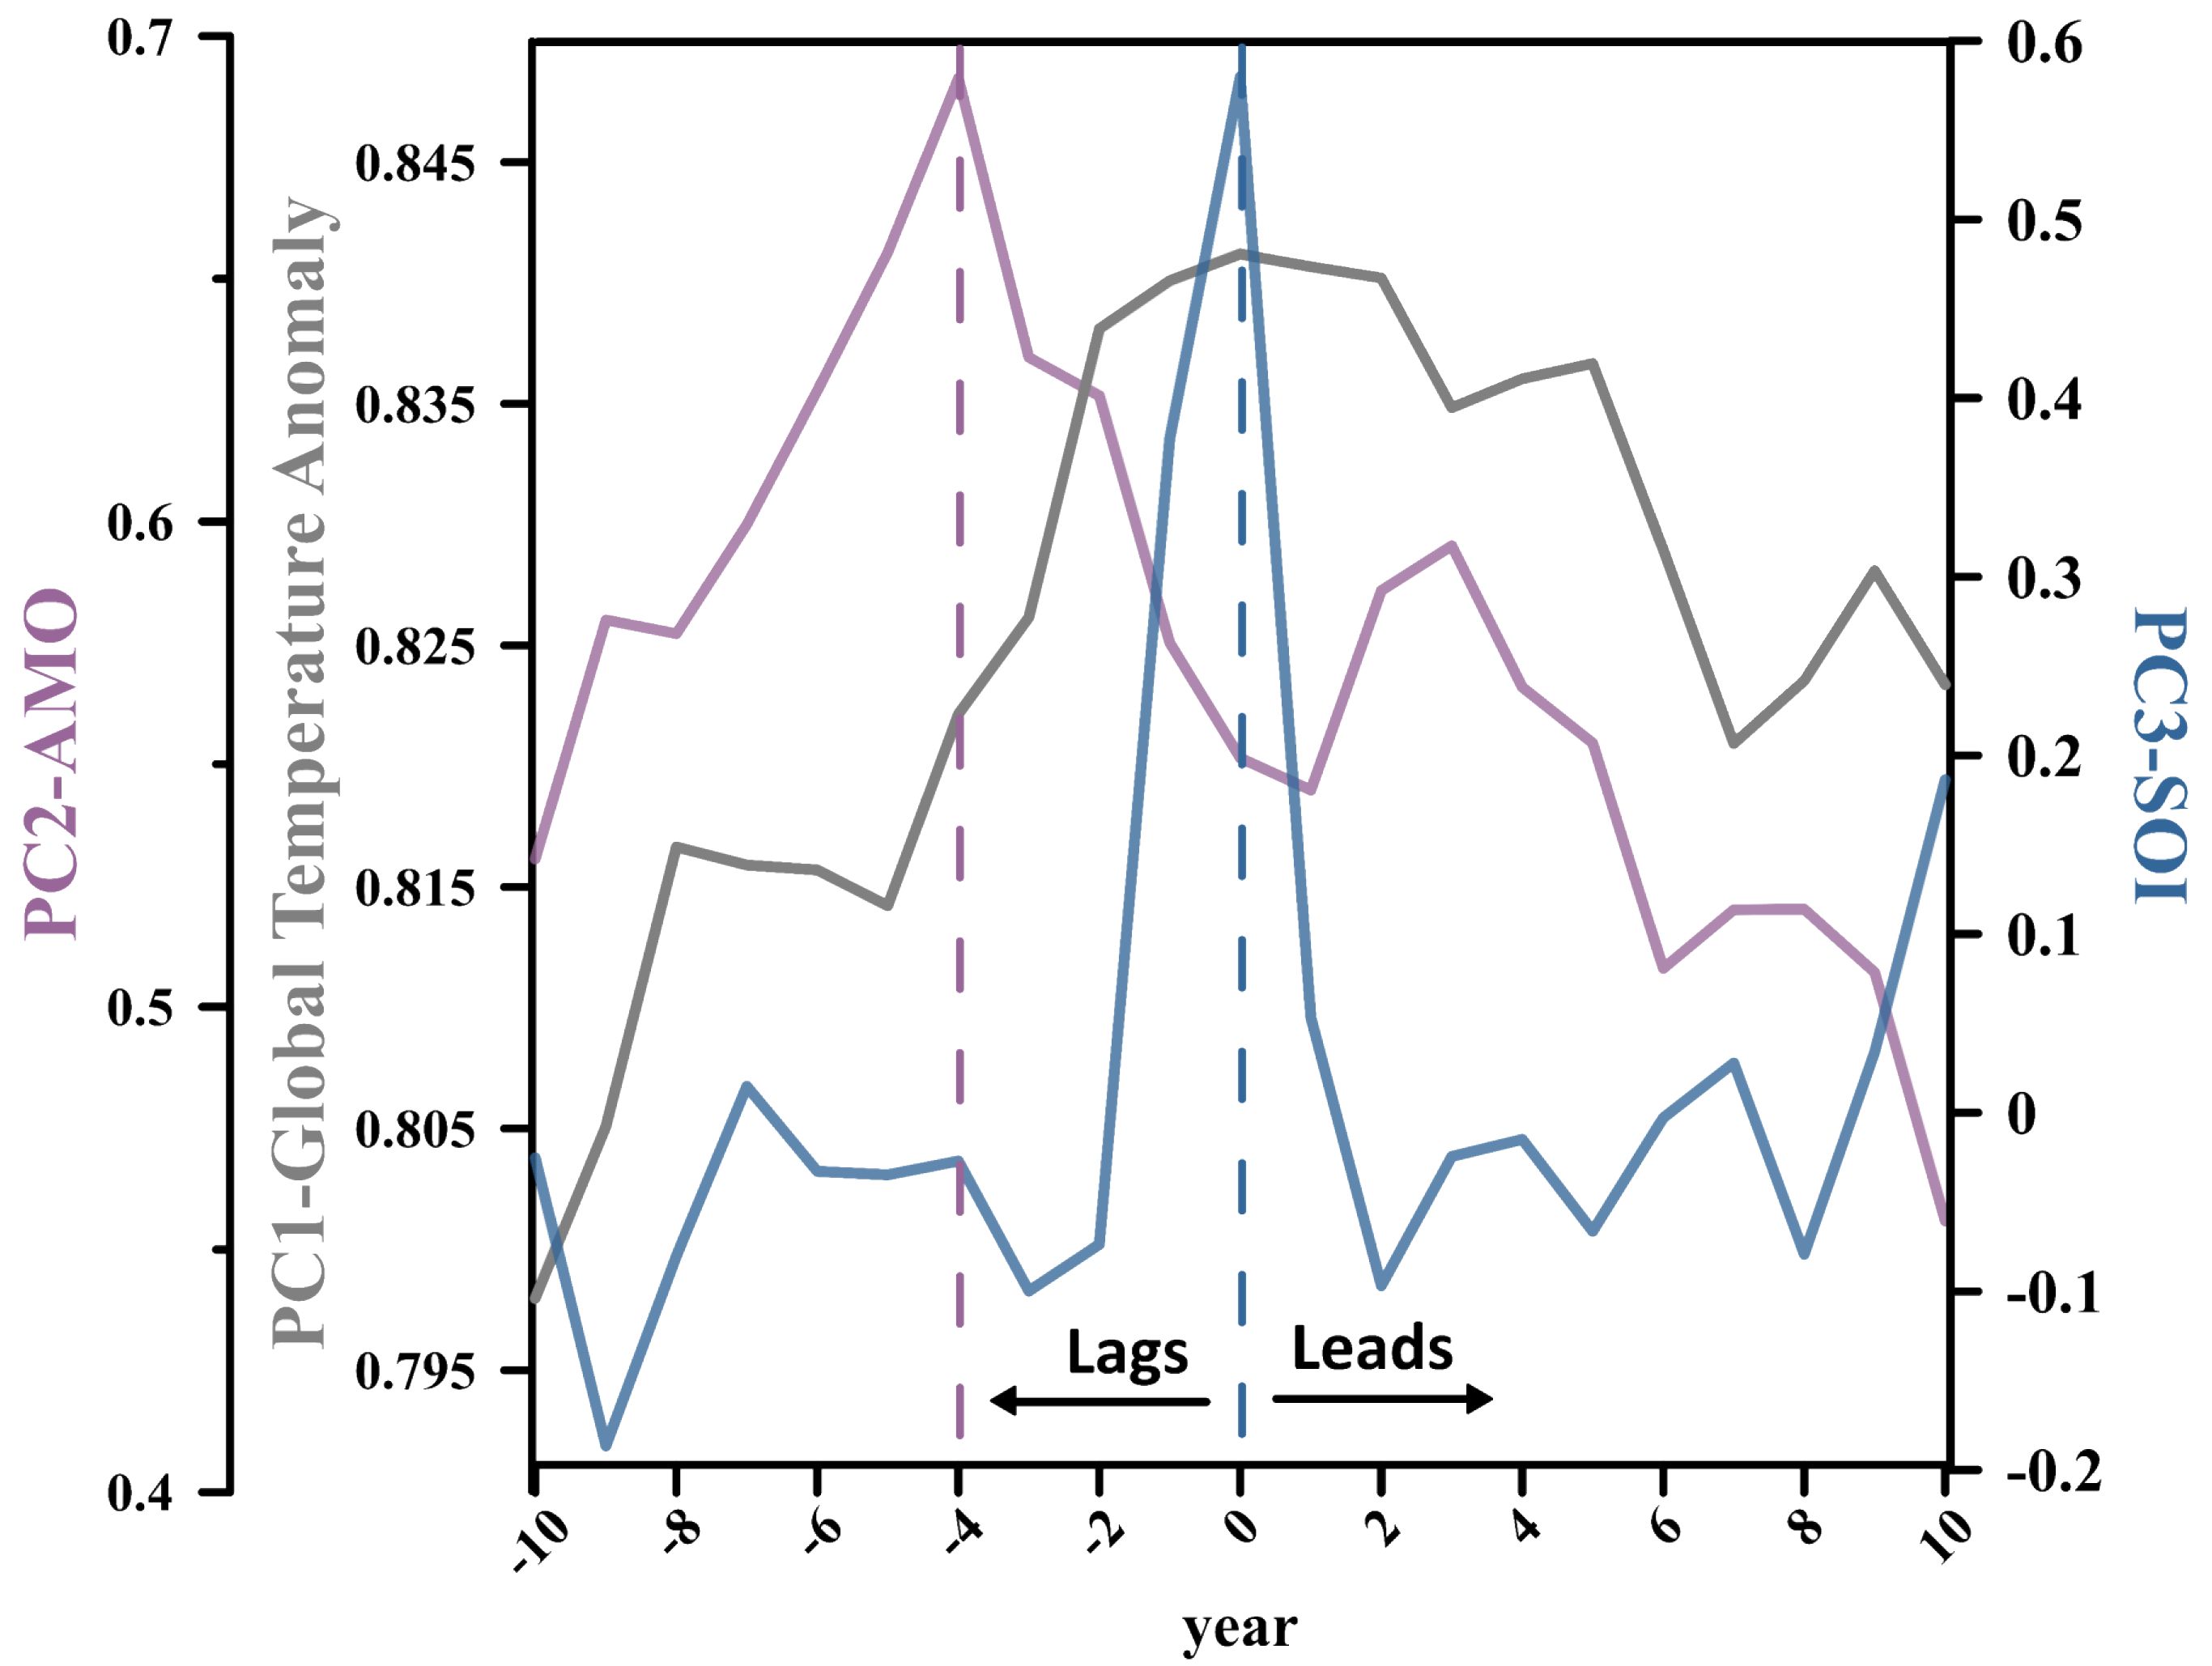
Figure 4 (HadISST1 dataset) Delayed and advanced correlations between various indicators and their corresponding time series in the EOF analysis from 1870 to 2022. The negative axis represents PC lagging behind the corresponding indicator, while the positive axis represents PC leading. The vertical axis represents the correlation coefficient, and the gray and blue dashed lines represent the maximum correlation.
The EOF3 of HadISST1 (Figure 1C), explaining 5.97% of the total variance, shows positive anomalies in the peripheral areas of the Southern Ocean, particularly between latitudes 50°S and 40°S, as well as in the Bellingshausen Sea and the Amundsen Sea. Conversely, negative anomalies are observed in the waters off the western coast of Australia and in the southern Indian Ocean, displaying a symmetrical pattern. The principal component PC3 (Figure 1F), which displays significant interannual variability, is strongly correlated with the El Niño-Southern Oscillation (ENSO index, SOI). In addition, the regression coefficients between SOI and SST in HadISST1 exhibit a similar pattern to the EOF3 of HadISST1. Therefore, we suggest that this SST pattern is primarily influenced by ENSO Figures 3E, F.
Previous research has demonstrated that the ENSO can impact the Southern Ocean. ENSO events lead to convective heating in the tropical atmosphere, causing abnormal pressure changes that move towards the south and east. These pressure fluctuations interact with the Amundsen Sea Low (ASL) system, affecting SST in the Southern Ocean through wind-induced and thermodynamic reactions. This effect is also apparent in simulations of future climate change (Li, 2000; Ciasto and England, 2011; Wang et al., 2022). ENSO events can induce anomalous variations in sea surface temperatures in the equatorial Pacific, subsequently influencing sea surface temperatures in the Southern Ocean via ocean currents.
During El Niño events, the elevated SST in the central-eastern equatorial Pacific induce alterations in atmospheric circulation, causing a rise in SST in the eastern sector of the Southern Ocean. Conversely, during La Niña events, the reduction in SST in the central-eastern equatorial Pacific leads to a decline in SST in the eastern part of the Southern Ocean (Wang et al., 2017; Ferster et al., 2018). These changes align with the temperature anomalies identified in EOF3 (Figure 1C). Consequently, the findings of the third mode further substantiate the impact of ENSO events on temperature fluctuations in the Southern Ocean, albeit the contribution is relatively minor.
Both HadISST1 and ERSSTV5 dataset clearly reveal the dominant role of global warming on the SST of the Southern Ocean over the past century (Figures 1, 2). This warming anomaly is more obvious after 1942. However, recent studies based on satellite data have shown a cooling trend in the Southern Ocean since 1982 (Yang et al., 2023), which appears to contradict to the warming trend indicated by EOF1. According to our results, the PC2 of HadISST1 and PC3 of ERSSTV5, which were interpreted as SST mode influenced by AMO here, shifted to negative phase after approximately 1980. Therefore, we propose that the negative phase of AMO since 1980 will possibly offset the warming trend and resulting in cooling trending in the Southern Ocean.
The SST in the Southern Ocean plays a crucial role in the global climate system, and its variations are influenced by multiple factors. By analyzing the HadISST1 and ERSSTV5 datasets (Figure 5) from 1870 to 2022 using the EOF method, we found that the spatiotemporal characteristics of Southern Ocean SST are closely related to global temperature anomalies, the AMO, and the ENSO. Global temperature anomalies are identified as the primary driver of Southern Ocean SST changes, exhibiting a persistent increasing trend. In addition, both AMO and ENSO have significant impacts on Southern Ocean SST, with a lagged response of four years to AMO. The contributions of these two modes differ between the two datasets, possibly due to variations in data sources and resolutions. Specifically, since 1980, there has been a clear global warming trend; however, the negative phase of AMO and the positive phase of ENSO may have counteracted the effects of global warming, leading to a cooling trend in Southern Ocean SST since 1980. These findings suggest that global warming, AMO, and ENSO are the primary factors influencing Southern Ocean SST variations.
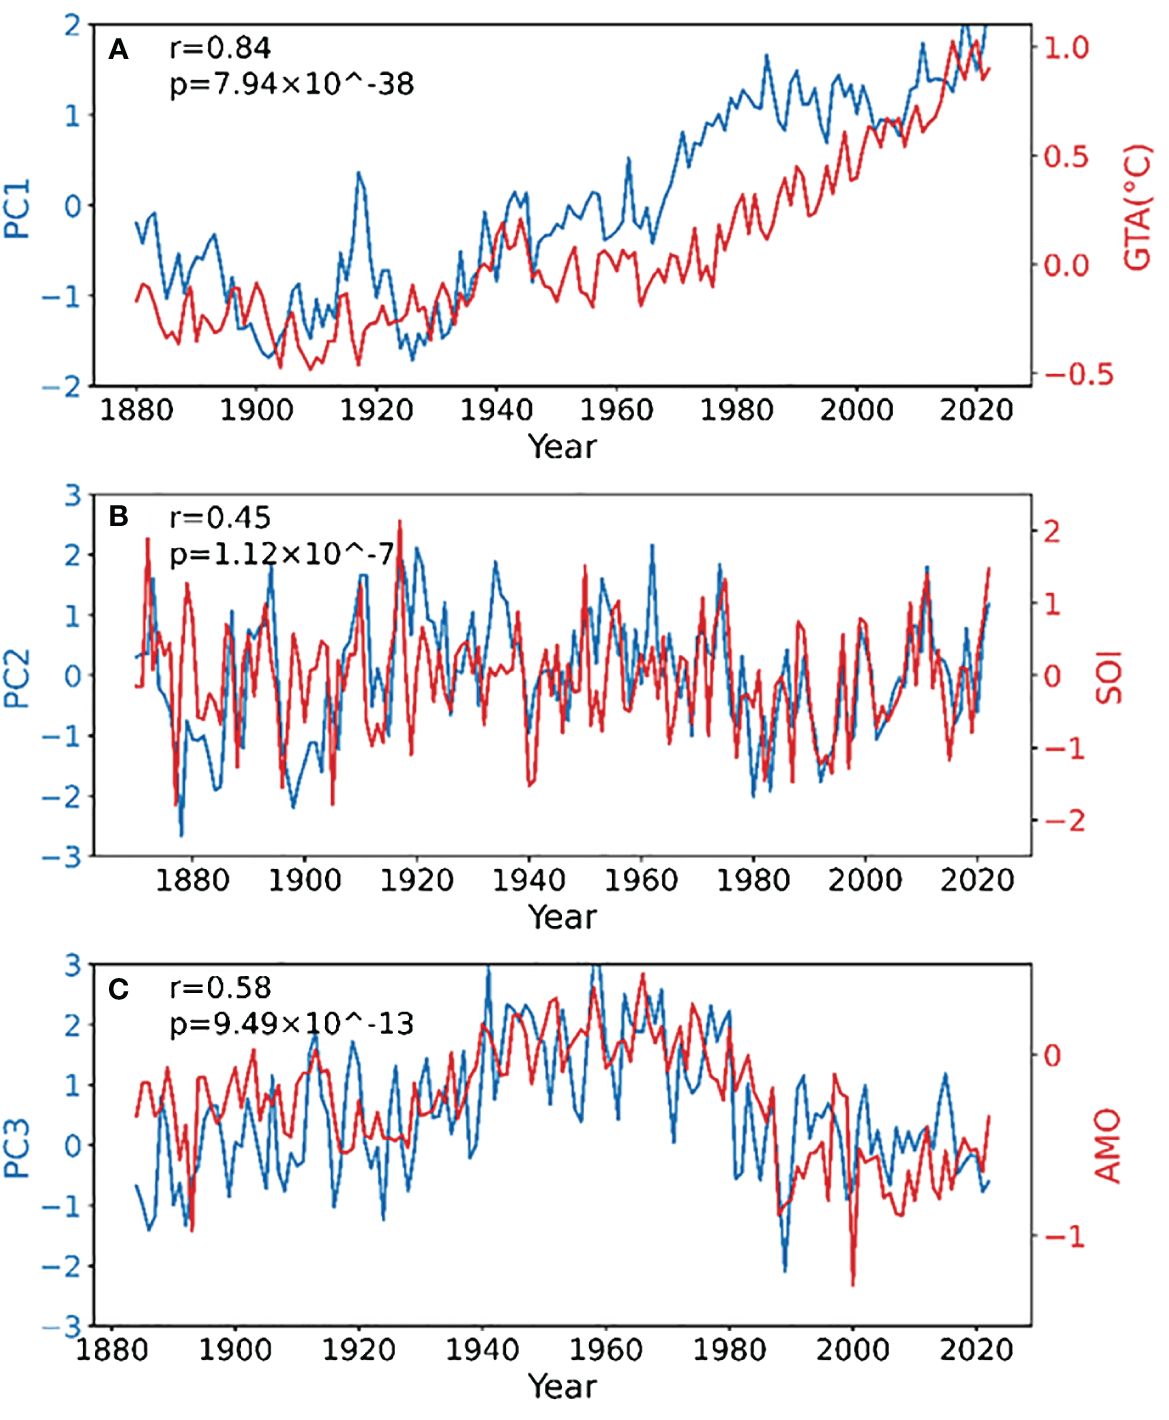
Figure 5 (ERSSTV5 dataset) Correlation between PC and relevant indicators in EOF analysis from 1870 to 2022. The correlation between (A) PC1 and GTA, (B) PC2 and AMO, (C) PC3 and SOI.
The original contributions presented in the study are included in the article/supplementary material, further inquiries can be directed to the corresponding author.
NL: Writing – original draft. XZ: Writing – original draft. TS: Writing – original draft. XM: Writing – original draft. JZ: Writing – original draft. DC: Software, Writing – review & editing.
The author(s) declare financial support was received for the research, authorship, and/or publication of this article. This research is funded by Hainan Province’s Key Research and Development Project (ZDYF2022SHFZ091), the National Natural Science Foundation of China (42276061), Hainan University Collaborative Innovation Centre Project (XTCX2022HYB08).
The authors declare that the research was conducted in the absence of any commercial or financial relationships that could be construed as a potential conflict of interest.
All claims expressed in this article are solely those of the authors and do not necessarily represent those of their affiliated organizations, or those of the publisher, the editors and the reviewers. Any product that may be evaluated in this article, or claim that may be made by its manufacturer, is not guaranteed or endorsed by the publisher.
Böning C. W., Dispert A., Visbeck M., Rintoul S. R., Schwarzkopf F. U. (2008). The response of the Antarctic Circumpolar Current to recent climate change. Nat. Geosci. 1, 864–869. doi: 10.1038/ngeo362
Cheng L., Abraham J., Hausfather Z., Trenberth K. E. (2019). How fast are the oceans warming? Science 363, 128–129. doi: 10.1126/science.aav7619
Cheng L., Abraham J., Zhu J., Trenberth K. E., Fasullo J., Boyer T., et al. (2020). Record-setting ocean warmth continued in 2019. Adv. Atmospheric Sci. 37, 137–142. doi: 10.1007/s00376-020-9283-7
Ciasto L. M., England M. H. (2011). Observed ENSO teleconnections to Southern Ocean SST anomalies diagnosed from a surface mixed layer heat budget. Geophysical Res. Lett. 38, L09701-1-L09701-5. doi: 10.1029/2011GL046895
Ferster B. S., Subrahmanyam B., Macdonald A. M. (2018). Confirmation of ENSO-Southern Ocean teleconnections using satellite-derived SST. Remote Sens. 10, 331. doi: 10.3390/rs10020331
Fogt R. L., Bromwich D. H. (2006). Decadal variability of the ENSO teleconnection to the high-latitude South Pacific governed by coupling with the southern annular mode. J. Climate 19, 979–997. doi: 10.1175/JCLI3671.1
Gille S. T. (2002). Warming of the southern ocean since the 1950s. Science 295, 1275–1277. doi: 10.1126/science.1065863
IPCC. (2021). Climate change 2021—The physical science basis. Chem. Int. 43, 22–23. doi: 10.1515/CI-2021-0407
Kennedy J. J. (2014). A review of uncertainty in in situ measurements and data sets of sea surface temperature. Rev. Geophysics 52, 1–32. doi: 10.1002/rog.v52.1
Li X., Holland D. M., Gerber E. P., Yoo C. (2014). Impacts of the north and tropical Atlantic Ocean on the Antarctic Peninsula and sea ice. Nature 505, 538–542. doi: 10.1038/nature12945
Li Z. X. (2000). Influence of Tropical Pacific El Nino on the SST of the Southern Ocean through atmospheric bridge. Geophysical Res. Lett. 27, 3505–3508. doi: 10.1029/1999GL011182
Liu F., Lu J., GAruba O., Leung L. R., Luo Y., Wan X. (2018). Sensitivity of surface temperature to oceanic forcing via q-flux Green’s function experiments. Part I: Linear response function. J. Climate 31, 3625–3641. doi: 10.1175/JCLI-D-17-0462.1
Purkey S. G., Johnson G. C. (2010). Warming of global abyssal and deep Southern Ocean waters between the 1990s and 2000s: Contributions to global heat and sea level rise budgets. J. Climate 23, 6336–6351. doi: 10.1175/2010JCLI3682.1
Rayner N., Parker D. E., Horton E. B., Folland C. K., Alexander L. V., Rowell D. P., et al. (2003). Global analyses of sea surface temperature, sea ice, and night marine air temperature since the late nineteenth century. J. Geophysical Research: Atmospheres 108. doi: 10.1029/2002JD002670
Rye C. D., Naveira Garabato A. C., Holland P. R., Meredith M. P., George Nurser A. J., Hughes C. W., et al. (2014). Rapid sea-level rise along the Antarctic margins in response to increased glacial discharge. Nat. Geosci. 7, 732–735. doi: 10.1038/ngeo2230
Rintoul S. R. (2018). "The global influence of localized dynamics in the Southern Ocean.", Nature, 558 (7709), 209-218. doi: 10.1038/s41586-018-0182-3
Schlesinger M. E., Ramankutty N. (1994). An oscillation in the global climate system of period 65–70 years. Nature 367, 723–726. doi: 10.1038/367723a0
Schmidtko S., Heywood K. J., Thompson A. F., Aoki S. (2014). Multidecadal warming of Antarctic waters. Science 346, 1227–1231. doi: 10.1126/science.1256117
Simpkins G. R., Mcgregor S., Taschetto A. S., Ciasto L. M., England M. H. (2014). Tropical connections to climatic change in the extratropical Southern hemisphere: the role of Atlantic SST trends. J. Climate 27, 4923–4936. doi: 10.1175/JCLI-D-13-00615.1
Simpkins G. R., Peings Y., Magnusdottir G. (2016). Pacific influences on tropical atlantic teleconnections to the southern hemisphere high latitudes. J. Climate 29, 6425–6444. doi: 10.1175/JCLI-D-15-0645.1
Wang G., Cai W., Santoso A., Wu L., Fyfe J. C., Yeh S., et al. (2022). Future Southern Ocean warming linked to projected ENSO variability. Nat. Climate Change 12, 649–654. doi: 10.1038/s41558-022-01398-2
Wang C., Deser C., Yu J., Dinezio P., Clement A. (2017). “"El Niño and southern oscillation (ENSO): a review,” in Coral reefs of the eastern tropical Pacific: Persistence and loss in a dynamic environment, 8, 85–106.
Wijffels S. E., Willis J., Domingues C. M., Barker P., White N. J., Gronell A., et al. (2008). Changing expendable bathythermograph fall rates and their impact on estimates of thermosteric sea level rise. J. Climate 21, 5657–5672. doi: 10.1175/2008JCLI2290.1
Yang H., Gerrit L., Christian S., Qiang W., Xin H. R., Xiaoxu S., et al. (2023). Satellite-observed strong subtropical ocean warming as an early signature of global warming. Commun. Earth Environ. 4. doi: 10.1038/s43247-023-00839-w
Zhang R., Delworth T. L. (2007). Impact of the Atlantic multidecadal oscillation on North Pacific climate variability. Geophysical Res. Lett. 34, L23708-1-L23708-6. doi: 10.1029/2007GL031601
Keywords: Southern Ocean, empirical orthogonal function, sea surface temperature, AMO, ENSO
Citation: Li N, Zheng X, Su T, Ma X, Zhu J and Cheng D (2024) A key hub for climate systems: deciphering from Southern Ocean sea surface temperature variability. Front. Mar. Sci. 11:1361892. doi: 10.3389/fmars.2024.1361892
Received: 27 December 2023; Accepted: 24 May 2024;
Published: 28 June 2024.
Edited by:
Zhifang Xiong, Ministry of Natural Resources, ChinaReviewed by:
Xiaoxu Shi, Southern Ocean Science and Engineering Guangdong Laboratory (Zhuhai), ChinaCopyright © 2024 Li, Zheng, Su, Ma, Zhu and Cheng. This is an open-access article distributed under the terms of the Creative Commons Attribution License (CC BY). The use, distribution or reproduction in other forums is permitted, provided the original author(s) and the copyright owner(s) are credited and that the original publication in this journal is cited, in accordance with accepted academic practice. No use, distribution or reproduction is permitted which does not comply with these terms.
*Correspondence: Xufeng Zheng, eHVmZW5nemhlbmdAaGFpbmFudS5lZHUuY24=
Disclaimer: All claims expressed in this article are solely those of the authors and do not necessarily represent those of their affiliated organizations, or those of the publisher, the editors and the reviewers. Any product that may be evaluated in this article or claim that may be made by its manufacturer is not guaranteed or endorsed by the publisher.
Research integrity at Frontiers
Learn more about the work of our research integrity team to safeguard the quality of each article we publish.