
94% of researchers rate our articles as excellent or good
Learn more about the work of our research integrity team to safeguard the quality of each article we publish.
Find out more
ORIGINAL RESEARCH article
Front. Mar. Sci., 15 April 2024
Sec. Marine Fisheries, Aquaculture and Living Resources
Volume 11 - 2024 | https://doi.org/10.3389/fmars.2024.1358209
This article is part of the Research TopicPersonalized and Intelligent Feeding in AquacultureView all 4 articles
 Haiyan Zhao1,2,3
 Junfeng Wu1,2,3*
 Liang Liu1,2,3Boyu Qu1,2,3Jianhao Yin1,2,3
 Hong Yu1,2,3Zhongai Jiang4Chunyu Zhou5
With the global population growth and increasing demand for high-quality protein, aquaculture has experienced rapid development. Fish culture management and feed supply are crucial components of aquaculture. Traditional baiting management relies on experiential judgment and regular observation, which often leads to inefficient baiting practices and wastage. To address these issues, intelligent bait casting decisions have emerged. Leveraging advanced artificial intelligence algorithms, intelligent bait casting decisions can overcome most drawbacks of traditional bait management and enhance breeding efficiency. However, most of the current intelligent baiting decisions are focused on using methods such as image processing and target detection to identify different feeding actions and patterns. These methods do not discuss based on video streams and do not consider the changes in fish behavior during the baiting process. Therefore, we proposed a real-time analysis method based on the density distribution of fish feeding behavior (FishFeed). Firstly, this method upgrades the input mechanism, not only handling static images but also capable of real-time video stream analysis. Secondly, by evaluating the fish school density distribution through a new intelligent baiting strategy, this method can monitor the feeding behavior of fish school during the baiting process in real time. Finally, we constructed a dataset for fish school density analysis (DlouFishDensity) that includes a wealth of video and image frames, providing a valuable resource for research. Experimental results indicate that our algorithm outperforms MCNN, improving MAE by 1.63 and 1.35, MSE by 1.92 and 1.58, and reducing prediction time by 2.56 seconds on the same dataset. By implementing real-time analysis of fish feeding behavior density distribution, our method offers a more efficient and effective approach to baiting management in aquaculture, contributing to improved breeding efficiency and resource utilization.
China is a major maritime nation as well as a significant player in the aquaculture industry. China’s aquaculture sector has emerged as one of the world’s largest and most comprehensive industries of its kind. Currently, China accounts for over 60% of global aquaculture production (Mang et al., 2012). With the continuous advancement of deep learning and artificial intelligence technologies, coupled with evolving market demands, China’s aquaculture industry is undergoing profound transformation and innovation. In recent years, it has witnessed substantial growth in terms of scale, standardization, and integration of intelligent systems (Zhang et al., 2020). As an integral part of artificial intelligence, computer vision technology is also widely used in intelligent breeding fields such as fish breeding (Li D. et al., 2020). Computer vision technology facilitates optimized feed delivery and feeding management processes (Wang, 2019). By monitoring and analyzing various indicators such as feed waste rate, feed utilization rate, and feed consumption rate etc., intelligent adjustments can be made to provide scientific data support for breeding management. This ultimately enhances breeding efficiency and economic benefits.
However, the traditional feeding methods in aquaculture rely too much on manual labor and are limited by the experience and work efficiency of breeders. It is difficult to control the feeding time, amount, and frequency accurately, and it cannot flexibly adapt to the needs of fish, which may lead to feed waste and unstable feeding effects. In contrast, although machine timed and quantitative feeding has been applied in aquaculture, it mainly relies on preset fixed feed amounts. Due to the inability to automatically adapt to the needs of fish, it may cause problems of insufficient or excessive feed supply. Both insufficient and excessive feed supply can have negative impacts on fish growth, increase breeding costs, and cause pollution to the breeding water area (Zhang et al., 2023). Therefore, feeding not only affects the growth and health of fish, but also has a profound impact on the economic efficiency of aquaculture. Currently, although these two methods are simple and economical, they are no longer suitable for the development of intelligent aquaculture.
As a result, an increasing number of researchers have started exploring how to use computer vision technology to achieve the goal of intelligent aquaculture, including intelligent baiting (Wang et al., 2015). Computer vision technology, especially when combined with deep learning models, offers new possibilities for developing intelligent feeding strategies (Yang et al., 2021). Currently, computer vision technology can extract behavioral characteristics and environmental parameters of fish schools through the collection and analysis of image and video data, such as the number, size, position, swimming trajectory of fish, and the presence of bait (He et al., 2019). These advanced algorithms can automatically optimize the amount and frequency of feeding based on the behavioral patterns of fish and specific conditions of the surrounding environment. Through real-time monitoring and analysis, these models have the potential to adjust feeding plans to meet individual needs and adapt to changing environments, providing theoretical support and practical guidance for intelligent baiting, thereby promoting the efficient use and management of aquaculture resources.
At present, the application workflow of computer vision technology in the field of intelligent bait casting is typically illustrated in Figure 1. Video footage capturing fish under various conditions is collected using cameras and other equipment, followed by extraction of relevant features through appropriate machine learning algorithms. These extracted features are then analyzed and processed to facilitate intelligent decision-making regarding the optimal amount and timing for bait casting.

Figure 1 Flow chart of intelligent bait casting.
Furthermore, in the realm of intelligent aquaculture research, it is crucial to delve into fish feeding behavior for scientific assessment of hunger levels and optimization of aquaculture practices. The behavior patterns of fish school are complex and changeable, including group behavior, domain behavior, courtship behavior, escape behavior and feeding behavior. These behavioral patterns are formed in the process of survival and reproduction of fish, which is a way for them to adapt to the environment. Feeding behavior serves as an indicator of a fish’s food requirements while also reflecting its degree of hunger to a significant extent. Therefore, by observing and analyzing the aggregation and dispersion patterns exhibited by schools of fish, we can gain more efficient insights into their feeding behavior. The density distribution within a school accurately depicts its level of aggregation; high density distributions indicate strong feeding behavior with intensified schooling tendencies, necessitating increased bait quantities to meet demand. Conversely, low density distributions signify scattered fish with weaker feeding behaviors, requiring reduced or suspended bait casting to avoid wastage. Scientific judgment of hunger degree and accurate feeding can optimize the breeding process and improve production efficiency, which is of great significance for realizing intelligent bait casting and improving breeding management.
In the process of feeding, real-time analysis of fish school video stream data plays a crucial role. It not only provides precise information on fish distribution and density, helping breeders to formulate more accurate feeding strategies; it also aids in understanding the feeding status of the fish, allowing for timely adjustments to the amount and frequency of feed. Additionally, this analysis can promptly detect any abnormalities, ensuring breeding safety. As a key technology for realizing intelligent feeding, real-time fish school video stream data analysis can promote the automation and intelligence of the feeding process, enhance breeding efficiency, reduce labor costs, and further drive the modernization of fishery production.
With the continuous development of information technology and artificial intelligence, accurately grasping the dynamic information of fish schools has become an important trend in the production of fisheries. This not only helps to improve the efficiency of fishery production but also provides a scientific basis for ecological protection and sustainable development. However, existing research mainly focuses on target detection and density estimation in static images, lacking comprehensive analysis based on video stream data, and does not fully consider the impact of the behavioral state of the fish school on feeding decisions.
In order to explore the intrinsic connection between the behavioral state of the fish school during the baiting process and feeding decisions, and to provide a scientific basis for optimizing feeding strategies, we proposed a real-time baiting decision method for fish school based on density distribution (FishFeed). By deeply analyzing the number and distribution of fish schools in video stream data, further revealing the behavioral state of the fish school, a more comprehensive and accurate assessment method is provided for real-time feeding decisions. The main contributions are as follows:
(1) Firstly, we developed a multivariate input enhancement module that significantly augments the input capacity of network models by facilitating various data types, such as real-time video streams, and providing functions for image preprocessing and preliminary feature recognition. This enhances the model’s adaptability to dynamic fish school scenarios and establishes a foundation for the real-time acquisition of fish school density distribution.
(2) Furthermore, we introduced a spatio-temporal density fusion and visualization module, complemented by an innovative intelligent feeding strategy based on attention mechanisms. This module can generate innovative spatio-temporal fusion density maps derived from the real-time acquired fish school density distribution. Utilizing the intelligent feeding strategy enables a quantitative analysis of the changes in fish school density during the feeding process, thus effectively discerning the feeding behaviors of fish school.
(3) Lastly, we constructed a fish school density analysis dataset (DlouFishDensity), which encompasses 20 videos that illustrate complete fish school feeding behaviors. In addition, 1000 image frames of fish school were extracted from these videos, with over 20,000 manual annotations of fish head positions conducted.
The structure of this paper is organized as follows: The second part of the article mainly introduces the related work in the field of intelligent baiting; the third part mainly introduces our proposed real-time analysis method of fish feeding behavior based on density distribution; the fourth part mainly introduces the simulation experiment results; the fifth part summarizes the full text and makes a prospect.
In recent years, with the continuous development of computer vision technology, more and more researchers have begun to explore how to use computer vision technology to achieve intelligent bait casting. Intelligent bait casting aims to achieve real-time monitoring of fish behavior and status and accurate bait casting through non-intrusive and automated high-precision image recognition and deep learning algorithms, improve breeding efficiency, reduce feed waste and reduce environmental pollution.
In the current intelligent bait casting system, there is a close relationship between fish feeding activity and intelligent bait casting. By judging the feeding activity of fish, the appetite and demand of fish can be directly understood, so as to accurately control the feeding amount, feed type and feeding time, which provides an important basis for intelligent feeding. Zheng et al. (2021) proposed an evaluation method of fish feeding activity intensity based on near-infrared depth map. This method directly processed the depth data to obtain clear fish feeding images, and judged the fish feeding activity through the total number and change rate of target pixels, so as to provide a scheme for real-time measurement and control. While depth data can visually reflect fish behavior, how to translate this data into actual feeding strategies and decisions may require more in-depth research. Zhou et al. (2019) proposed an automatic classification method of fish feeding intensity based on convolutional neural Network (CNN) and machine vision. This method used the reflection frame classification method combining gray level co-occurrence matrix and SVM to detect the feeding behavior of fish, and the accuracy of this method was as high as 90%. However, in practical applications, the function of real-time monitoring and evaluation of fish feeding intensity needs to be further optimized. Zhao Jian et al. (Zhao et al., 2016b) analyzed the change characteristics of the surface reflection area caused by fish feeding activities as the key factor, and proposed an evaluation method of fish feeding activity intensity based on improved kinetic energy model. However, there is no mention of the stability of long-term monitoring and the consistency of data, which is very important in practical applications, especially in the continuous monitoring of fish behavior. Zhao et al. (2016a) developed an improved kinetic energy model, which quantified the feeding intensity of fish schools by extracting the speed and rotation Angle of fish schools through optical flow method. Chen Ming et al. (Chen et al., 2020) used the gray level co-occurrence matrix and Markov random field model to extract the shape and texture information of the fish school, which was used as the input of the neural network to detect the feeding intensity of the fish school, and the accurate recognition rate of the method reached 98%. Liu et al. (2014) proposed a computer vision-based feeding activity index (CVFAI) using the moving speed of fish schools to measure the feeding activity of fish at any given time. Zhang et al. (2022) proposed a deep learning method combining MobileNetV2 and SENet to identify the feeding behavior of fish schools. The method uses feature weighting network to enhance feature weights and suppress noise, and the accuracy rate reaches 97.76%. It performs well under laboratory conditions, but applicability and robustness in actual farming environments are not detailed, and real-time performance is not discussed.
At the same time, the feeding behavior of fish schools can be indirectly analyzed by examining surface feeding images or the remaining amount of residual bait during bait casting, thereby facilitating the establishment of an intelligent bait casting system. This method combines image processing and machine learning technology to enable real-time monitoring, assessment, and accurate determination of the feeding status and activity of fish schools. ATOUM et al. (Atoum et al., 2015) proposed an automatic feeding system based on residual bait detection to continuously control the feeding process of fish in aquaculture ponds, aiming to improve production profits by controlling feed quantity at an optimal rate. Due to the influence of factors such as light changes, water surface reflection, splash and so on, there are many difficulties in improving the robustness of residual bait detection. Qiao Feng et al. (Qiao et al., 2015) used the machine vision technology and embedded system to construct a real-time image acquisition and processing system to analyze the feeding law of fish, and established the kinematic and dynamic models of the bait casting machine. Combined with the real-time image processing results and the feeding law of fish, an intelligent bait casting system was constructed. Zhou et al. (2023) proposed an intelligent feeding fuzzy control scheme for Factory recirculating aquaculture Systems (IRAS) based on deep visual sensing. In this scheme, a target detection model based on deep learning was introduced to capture the residual bait and feeding frequency, and a fuzzy neural network model was established to solve the problem of autonomous decision-making control of feeding strategy. Hu et al. (2015) proposed to use the machine vision method to analyze the water surface feeding images taken in the process of baiting, establish a new calculation model of baiting amount, and construct an intelligent baiting method according to the feeding law. The process of extracting and analyzing image feature parameters is mentioned in this paper, but the complexity of data processing and the required computational resources are not taken into account, which will bring difficulties to the subsequent production application. Hu et al. (2021) proposed an improved YOLO-V4 network, which, by combining DenseNet and PANet structures, effectively improves the accuracy and detection speed of real-time detection of uneaten feed particles in underwater environments, helping to optimize feed management and reduce waste, but the method’s ability to generalize under different farming environments and conditions. The cost and complexity of deployment in actual farming operations are not fully considered. Mu Chunhua et al. (Mu et al., 2015) focused on the identification of residual bait and feces in industrial circulating aquaculture, extracted six features through image preprocessing and used Support Vector Machine (SVM) algorithm with four different kernel functions and improved decision tree algorithm for residual bait image recognition, which provided a theoretical basis for the intelligent feeding system based on residual bait concentration detection. But the size of the data set used to train and test the algorithm is not specified in detail, if the data set is not large enough, it may lead to insufficient generalization ability of the algorithm in practical applications.
However, there are relatively few studies and significant challenges in the analysis of feeding behavior based on fish density. Existing research mostly focuses on target detection or density estimation in static images, lacking in-depth discussion of video stream data and ignoring the impact of fish behavior states on feeding decisions.
Therefore, we proposed a real-time analysis method for fish school feeding behavior based on density distribution (FishFeed), which can efficiently quantify the density distribution of fish schools during feeding and make baiting decisions accordingly.The proposed method consists of three parts: multivariate input enhancement module, fish behavior understanding and density estimation module, and spatio-temporal density fusion and visualization module. In order to facilitate the use of fish density for feature extraction, training and prediction, we collate and label the fish Density dataset (DlouFishDensity), which contains a total of 1000 pictures of 20 fish videos and manually annotate them.
With the advancement of research in intelligent farming, it has become evident that computer vision technology holds substantial promise for fish density monitoring and feeding behavior analysis. By leveraging computer vision techniques, we can gain more insight into school density and feeding behavior. For instance, a high-density distribution typically signifies that the fish school is highly clustered or gathering in a specific area, which may suggest their robust feeding behavior. Conversely, a low-density distribution implies that the fish are dispersed, possibly indicating weaker feeding behavior.
This information is of great significance to farmers, as it enables them to better judge the hunger level of fish schools, understand their growth status, prevent diseases, and optimize breeding processes to improve production efficiency. However, realizing this task presents numerous challenges, with the main issues being:
Issue1: Traditional network models have limitations when dealing with rapidly changing or dynamically complex environments, especially when handling dynamic fish school scenarios. These scenarios involve many variables and uncertainties, such as the speed, direction, and density changes of the fish schools, which make it difficult for traditional models to accurately capture and analyze.
Issue2: The feeding behavior states of a fish school are influenced by multiple factors, including the density of the fish school, environment, physiological needs, and group interactions. It is a significant challenge to accurately analyze these behavior states through the estimation of fish school density and closely link them with feeding decisions. Therefore, how to construct a feeding decision model that comprehensively considers these factors to achieve more precise feeding is a topic worthy of our in-depth research and exploration.
In light of these challenges, we proposed a novel method for real-time analysis of fish feeding behavior based on density distribution(FishFeed), aiming to address the increased accuracy and real-time requirements in intelligent feeding decision-making problems. As illustrated in Figure 2, FishFeed comprises three components: a multivariate input enhancement module, a fish behavior understanding and density estimation module, and a spatio-temporal density fusion and visualization module. Among them, the multi-input enhancement module integrates real-time video stream analysis, image preprocessing, and feature recognition functions, breaking through the limitations of traditional models when dealing with a single data type, thereby enhancing the adaptability and robustness of the model when dealing with dynamic fish school scenarios. In addition, the spatio-temporal density fusion module combined with the intelligent baiting strategy based on the attention mechanism not only improves the monitoring and analysis accuracy of the fish feeding behavior but also effectively quantifies the aggregation and dispersion behavior of the fish school, providing strong support for efficient baiting decisions. The process of the FishFeed method is described below.
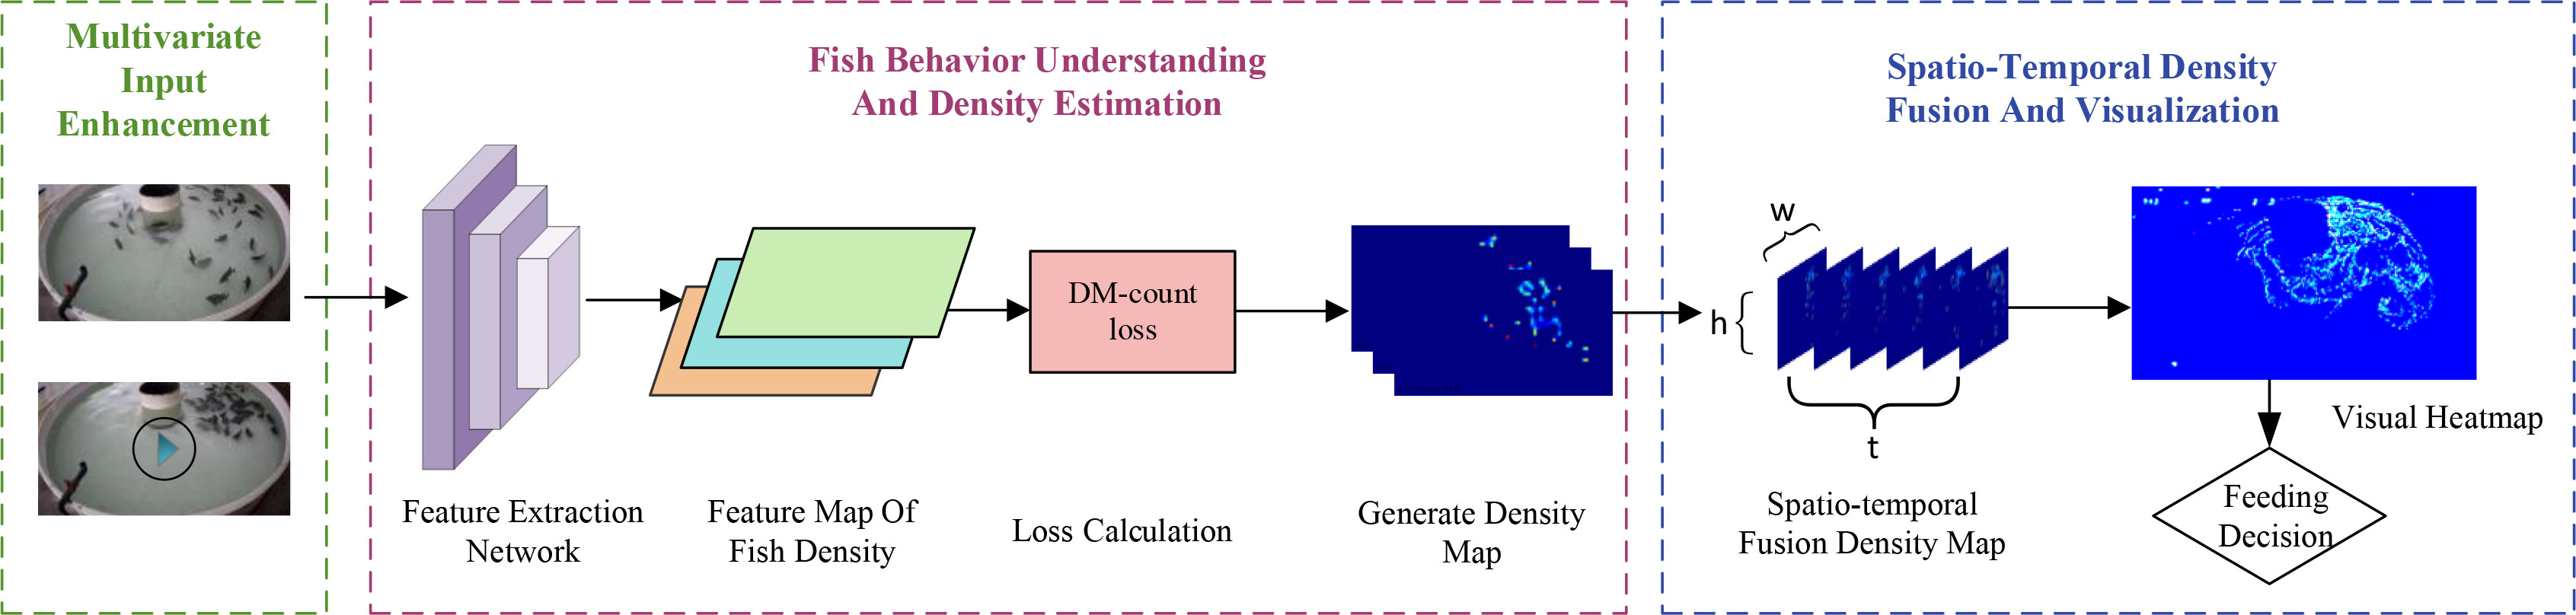
Figure 2 Diagram of the FishFeed network structure.
The processed dataset is initially fed into the density estimation algorithm for fish density estimation training. After sufficient iterations, the optimal network weight file obtained through training is obtained. Subsequently, the input images, videos, or video streams are preprocessed through a multi-input enhancement module. The fish school behavior understanding and density estimation module is used to estimate the density of the test set, generating a density map. Through the spatiotemporal density fusion and visualization module, a three-dimensional density superposition of the estimated density values and spatiotemporal fusion density map are generated, visualized through heatmaps and video. At the same time, the changes in the density distribution of the fish school during this period are quantitatively analyzed for baiting decisions.
With the wide application of deep learning in various fields, the requirements for network models are getting higher and higher. To cater to the need for real-time fish density estimation, we introduced a novel multivariate input enhancement module. This module is designed to accommodate multiple data types, incorporate image preprocessing and initial feature recognition functionalities, and endows the network model with excellent scalability and potent input data processing capabilities. It can process and analyze all kinds of data in real time, which provides strong support for real-time monitoring of dynamic scenes such as fish density.
The input module of traditional network models typically accepts a single data type. However, the multi-input enhancement module not only accepts multiple data types, including still images, video clips, and real-time video streams, but also provides image preprocessing and preliminary feature recognition functions. This design makes the network model flexible in dealing with different data sources, thus extending its applicability in dynamic scenarios and promoting the further development of the field of intelligent bait casting.
This multivariate input augmentation module is shown in Figure 3 and consists of the following key steps:
Data input management: The module receives various types of input data, including still images, video clips, and live video streams. Since the format and standard of the input data may vary, proper image sequence management is required to ensure uniformity in data entry.
Image preprocessing: To standardize the input data, the preprocessing steps include image resizing, pixel value normalization, color space conversion, etc.
Preliminary feature extraction: Before passing the input data to the density estimation module, this module initially extracts the key features of the fish school from the original image. The aim is to optimize and prepare the feature data to better adapt to the input requirements of the network model.
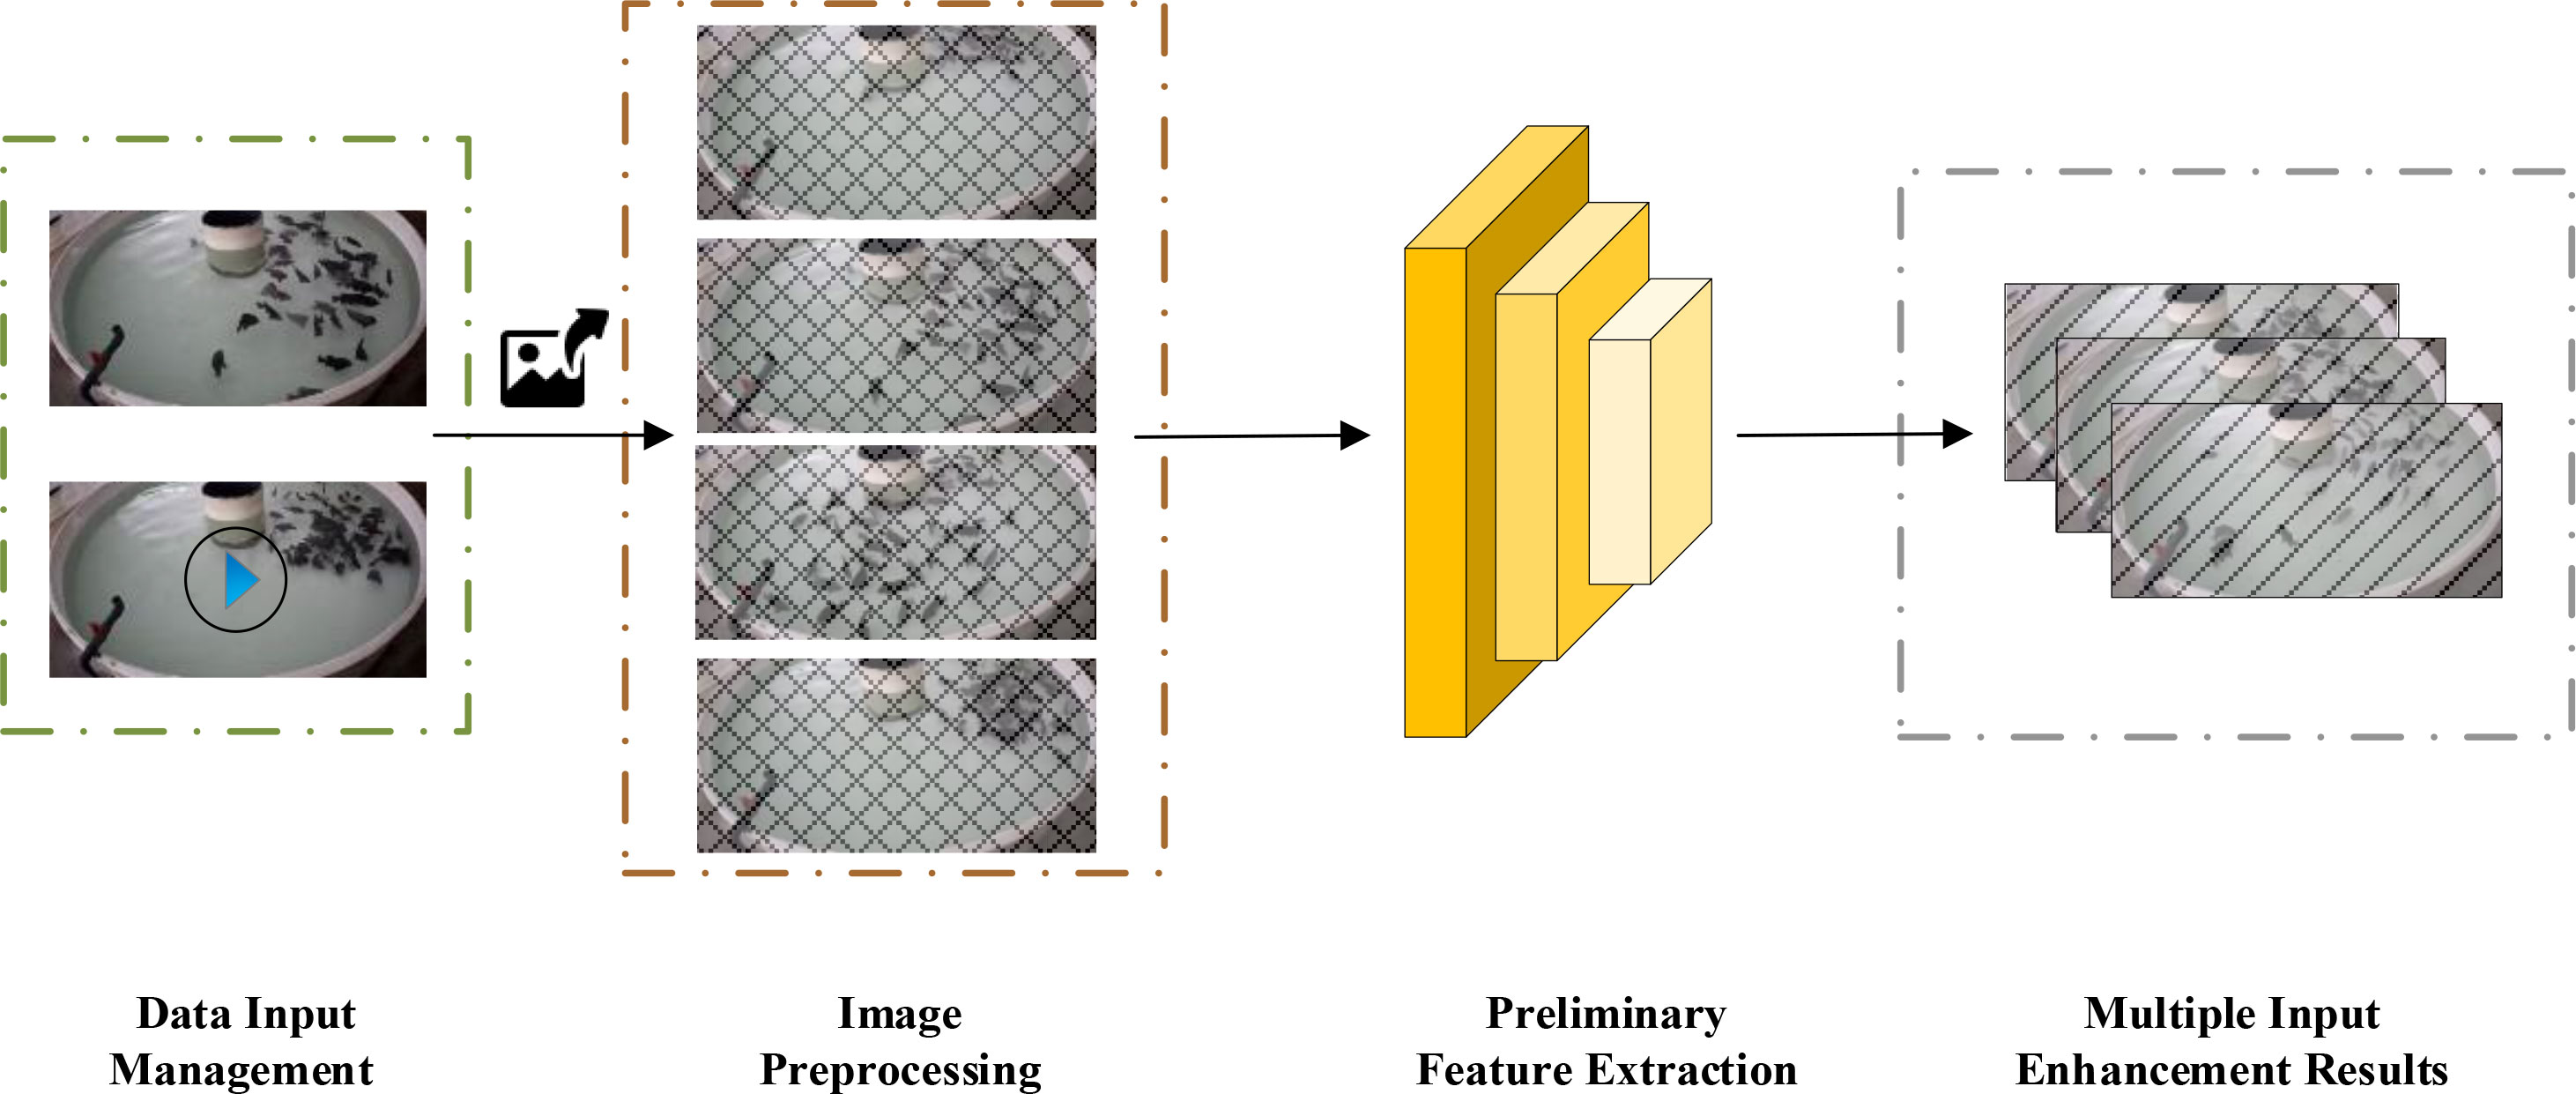
Figure 3 Multivariate input enhancement module network structure diagram.
In aquaculture and fishery management, it is crucial to grasp the distribution of fish density accurately and in real time for optimizing breeding strategies and management decisions. However, due to the complex and variable underwater environment and the diversity of fish behaviors, this task is extremely challenging. To address this, we proposed a module for understanding fish behavior and estimating density, which consists of three core components: a feature extraction network, loss computation, and density map generation. Firstly, we employ the VGG19 Variant as the feature extraction network. By adjusting the network structure and parameter configuration, it enhances its adaptability to underwater environments and fish images. Secondly, we introduce DM-Count Loss as the loss function. This loss function combines the advantages of density map estimation and object counting, by considering both the difference between predicted and actual density maps, and the error between predicted and actual counts, thus improving the model’s robustness and accuracy. Finally, we utilize an adaptive Gaussian kernel density map generation method. This method dynamically adjusts the parameters of the Gaussian kernel according to the characteristics and density distribution of the fish images to produce high-quality density maps.
Through the organic integration of these three parts, we have constructed a complete and efficient module for understanding fish behavior and estimating density. By sending fish images processed by the multi-input enhancement module into the well-trained density estimation module, we can quickly obtain the distribution of fish density. The structure of the fish school behavior understanding and density estimation module is shown in Figure 4.
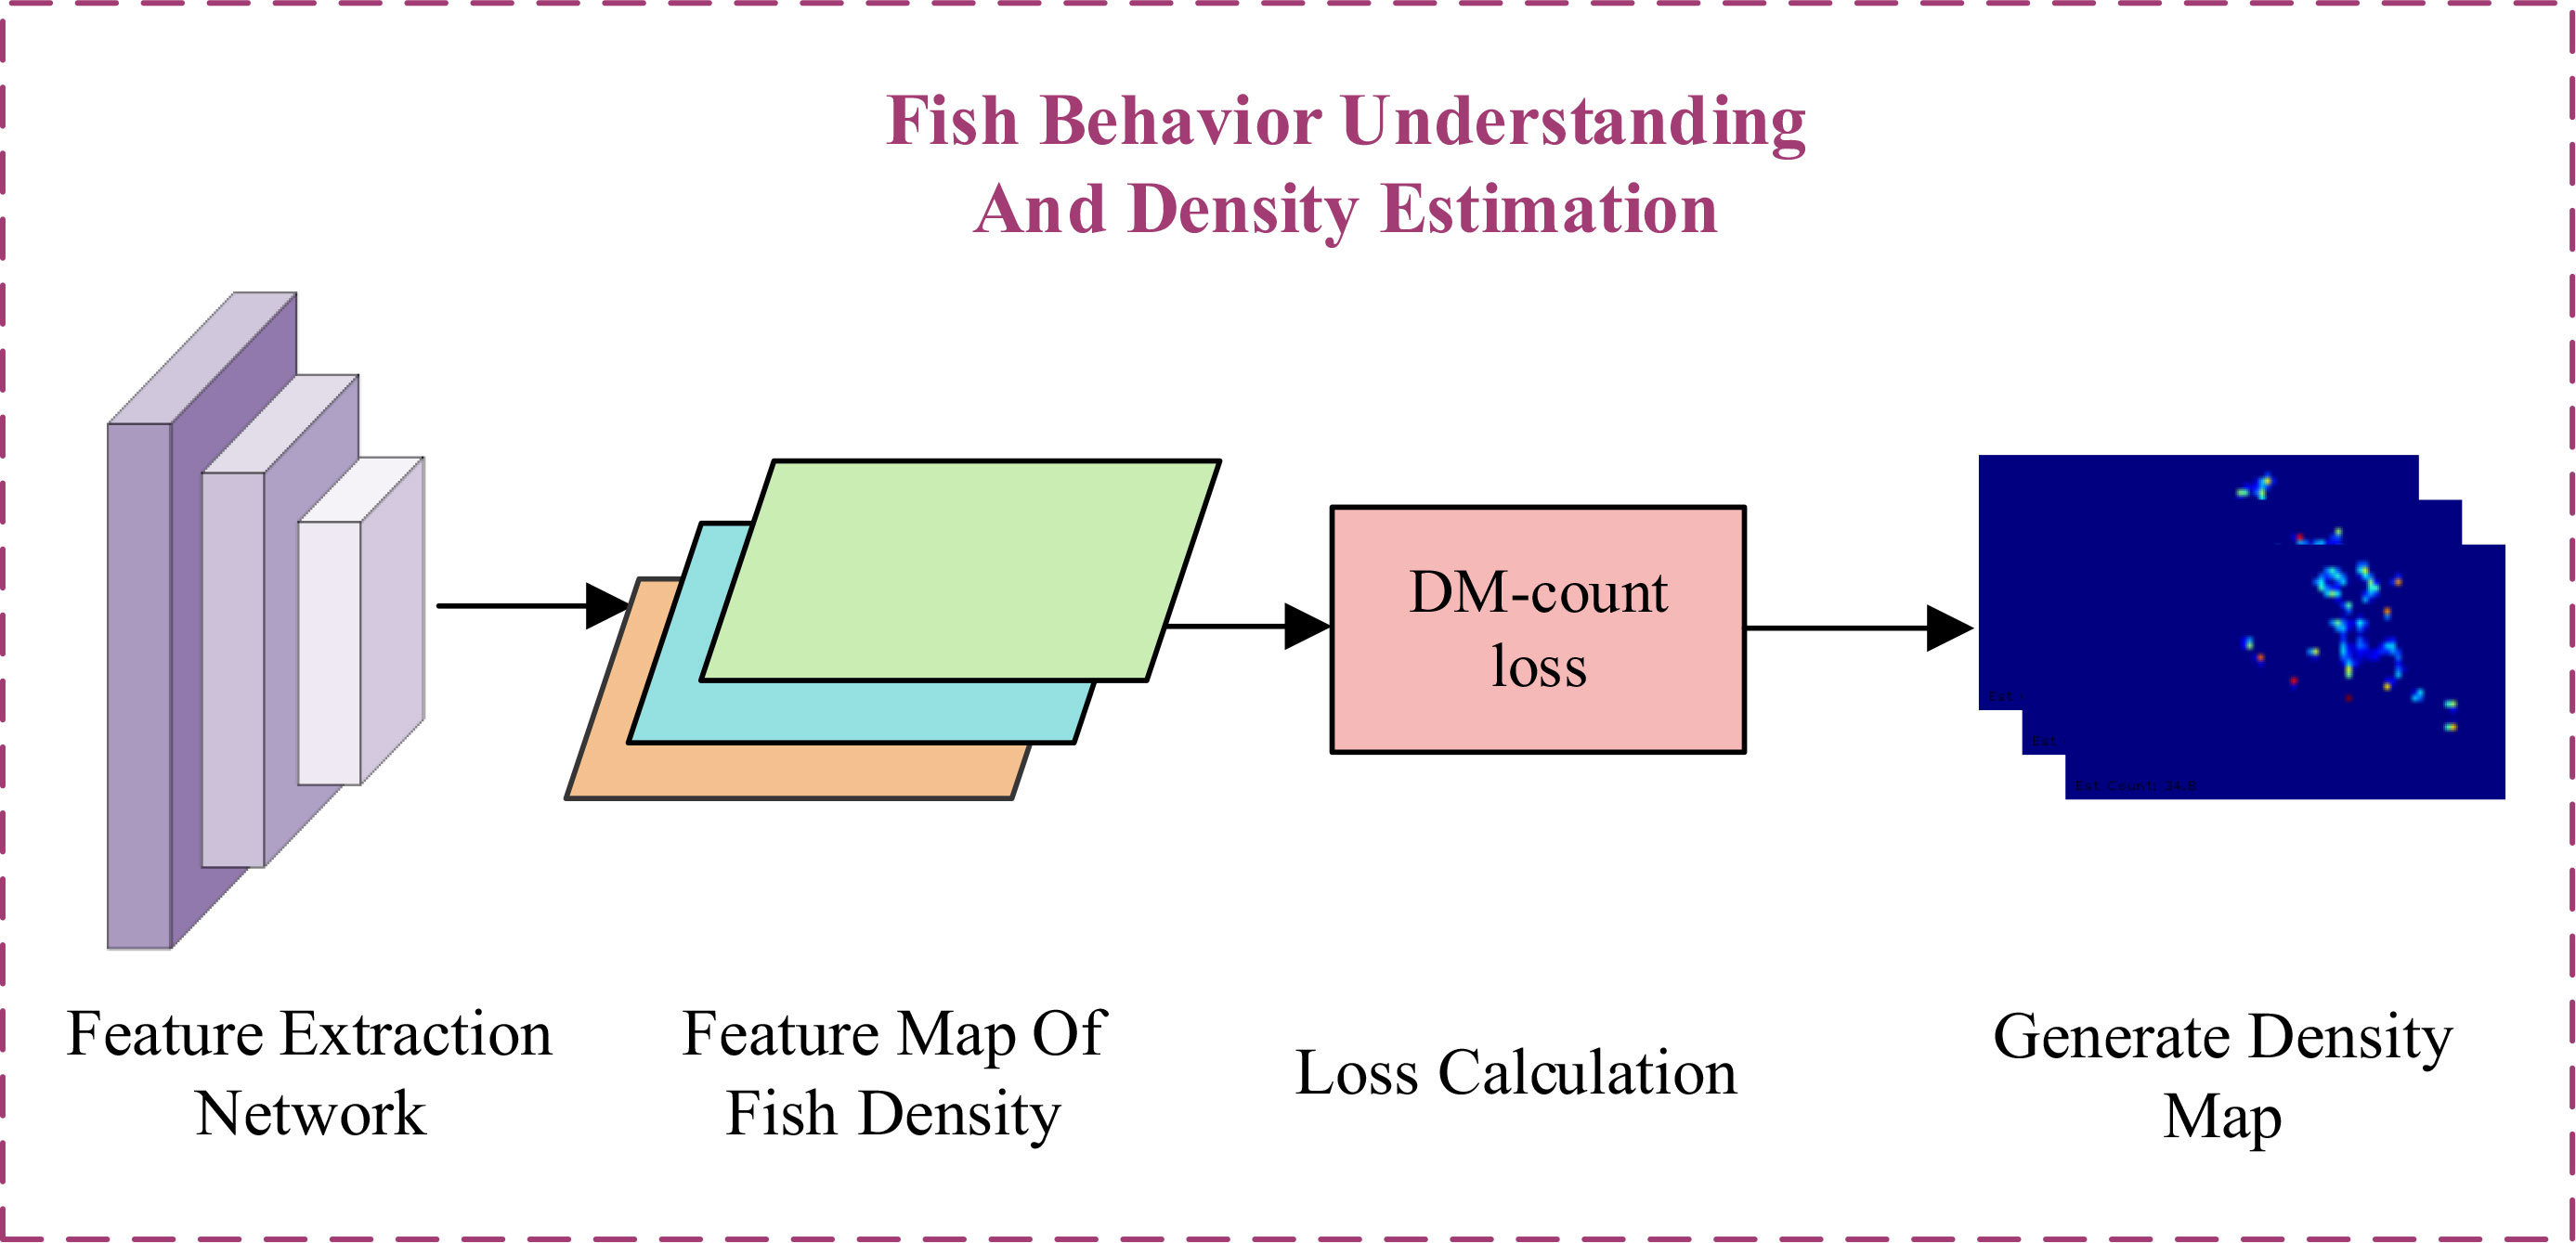
Figure 4 Fish behavior understanding and density estimation module structure diagram.
Firstly, the VGG19 Variant network is used to extract features from fish school images, obtaining a rich feature representation. Then, these features are inputted into the DM-Count loss function to calculate the loss and perform backpropagation, optimizing the model’s parameters. During the prediction process, density maps are generated through an adaptive Gaussian kernel density map generation method to supervise the training process of the model. Finally, after multiple iterations of training, a model capable of real-time, accurate estimation of fish school density distribution is obtained.
To extract the features of fish school images more effectively, we adopted an improved VGG19 Variant network. This network has been optimized based on the original architecture of VGG19 to adapt to the underwater environment and the characteristics of fish school images. By reducing the depth of the neural network layers, adjusting the number of convolutional layers, and introducing up-sampling operations, the network’s feature extraction capability has been enhanced, allowing it to better capture the details and contextual information of fish school images. The specific network structure is shown in Figure 5, and the detailed network structure is shown in Table 1.

Figure 5 VGG19 Variant network structure diagram.

Table 1 VGG19 Variant network structure table.
Due to the VGG19 model’s characteristics such as deep architecture, small convolution kernel size, transfer learning, and wide network structure, it performs exceptionally well in traditional image recognition tasks. These features also provide potential advantages for its application in this module. It can effectively capture local details and spatial relationship information of fish schools, thereby more accurately estimating the density distribution of fish schools. First, the input image is passed through the VGG19 Variant network to extract features, which only contains 16 convolutional layers and 4 pooling layers. Then, since the feature map extracted by the convolutional layer may be relatively small, in order to increase the resolution of the density map, an up-sampling operation is applied here. The up-sampled feature map will pass through a sequence module containing 2 convolutional layers, namely the density regression layer, which will further extract and learn the fish school density features. The feature map processed by the density regression layer will be passed to the density estimation layer, which will further process the feature map.
The network model chosen to be used in this paper, VGG19, is a classic convolutional neural network model, which is a variant of VGGNet. The reason why our fish density estimation algorithm finally chose to use the VGG19 model for the following reasons:
Deep architecture: VGG19 has a deep network structure, including 16 convolutional layers and 3 fully connected layers, which makes the model have stronger learning ability and expression ability. This enables VGG19 to extract and learn the fish body features in complex fish images more accurately, and finally improve the accuracy of fish density estimation.
Small-size convolution kernel: VGG19 uses a small-size convolution kernel (3×3), which can greatly reduce the number of parameters, increase the nonlinear ability of the model, and better retain the detail information in the fish image. By stacking multiple small-size convolutional layers, abstract features are gradually extracted to achieve better fish density estimation performance.
Transfer learning: Since VGGNet is pre-trained on large-scale image classification tasks, VGG19 learns rich image feature representations. Through transfer learning, we can use the feature extraction ability of VGG19 trained on large-scale datasets, and then apply it to the fish density estimation algorithm. In this way, data and computing resources can be saved, and it can help to improve the accuracy and generalization ability of fish density estimation.
Wide network structure: VGG19 has a large model capacity, which can better adapt to complex fish density estimation tasks. The width of the network allows the model to learn more features and relationships, enabling it to better understand the distribution of fish in the image for accurate density estimation.
But the VGG19 model also has some problems, such as consuming more computing resources and using more parameters. Among them, the main reason is that the VGG19 model contains three fully connected layers, and the vast majority of parameters in these fully connected layers are from the first fully connected layer, which leads to more memory usage. However, in this paper, we do not need to classify or regression the extracted fish school features, but to generate a predicted density value map based on the extracted features to estimate the fish school density in the image. Therefore, there is no need to rely on the complex fully connected layer structure in our fish school density estimation algorithm. The VGG19 Variant we used in the fish density estimation algorithm is compared with the original VGG19 model, and the comparison results are shown in Table 2. VGG19 consists of a 19-layer neural network with 16 convolutional layers and 3 fully connected layers, while the VGG19 Variant contains only the original 16 convolutional layers and the new 3 convolutional layers.

Table 2 The VGG19 Variant and the original VGG19 comparison table.
Compared with the traditional VGG19 model, the VGG19 Variant proposed in this paper is optimized for real-time requirements, and the heavy fully connected layer in the VGG19 model is abandoned, the number of parameters is significantly reduced, and the extra calculation and memory overhead are avoided, making our algorithm more lightweight and efficient.
To accurately calculate the loss and guide the training of the model, we adopted the DM-Count loss function (Wang et al., 2020). This loss function combines information from two aspects: density map estimation and target counting. By comprehensively considering the difference between the predicted density map and the actual density map, as well as the error between the predicted count and the actual count, it achieves a comprehensive optimization of the model’s performance. The introduction of DM-Count Loss effectively improves the model’s robustness and generalization ability, enabling it to better adapt to different underwater environments and fish behaviors.
In the existing fish density estimation methods, the Euclidean distance loss function is often used to estimate the difference between the predicted density map and the true value, and the loss function is defined as follows:
N is the number of training images, is the input image in the network, θ represents the network parameters, F (,θ) represents the predicted density map generated by the network learning, represents the true density map of the label, and L represents the difference loss between the two.
Compared to using the Euclidean distance loss function, adopting the DM-Count loss function can provide a more stringent generalization error range and a more reasonable calculation method, thus showing better performance in density estimation tasks. The Euclidean loss function is more sensitive to outliers, and the square operation will amplify the impact of outliers, while the DM-Count loss function has better performance and stability, with less impact on outliers, because it does not square the error. This means that our model has higher reliability and accuracy when dealing with new data.
Let denote the vectorized binary graph of point labels and denote the vectorized predictive density map returned by the neural network. By treating and as unnormalized density functions, we represent the DM-Count loss function in terms of three terms: the count loss , the OT loss , and the total variation (TV) loss . The first term measures the difference between the totals, while the last two measures the difference between the normalized density function distributions. The total loss function is a combination of count loss, OT loss and TV loss, and the formula is defined as follows:
Where and are tunable hyperparameters for OT and TV losses. To ensure that the TV loss has the same proportion as the count loss, we multiply this loss term by the total count.
Given H training images and corresponding dot labeled maps , a deep neural network f for density map estimation is learned by minimization as follows:
(1)Count loss : Let denote the L1 norm of the vector, so , are the ground truth and predicted counts, respectively, and the counting loss is defined as the absolute difference between the two:
(2)OT loss : are both non-canonical density functions. But you can convert them into probability density functions by dividing them by their respective totals. We define the OT loss as follows:
Where are solutions to the OT cost (Villani, 2008).
(3)Total variation (TV) loss : The OT loss will approximate the high-density regions of the fish school well, but the approximation may be poor for low density regions. To solve this problem, we additionally use the total variation loss, defined as:
Density maps are a powerful visualization tool that is widely used in fishery fish stock studies to assess the abundance, distribution range, and so on of fish stocks. In this paper, the density map is used to visually show the distribution of fish density. Through the density map, we can understand the aggregation degree, density relationship and dynamic change of fish schools in space, and then analyze their behavioral characteristics and ecological habits.
The physical meaning of the density map is to indicate the density of the fish school in a specific spatial extent by the intensity of color or shadow. In the density map, a stronger shadow indicates a higher density of fish, and vice versa indicates a lower density of fish. Specifically, a high-density area means that there are more fish gathered together in the area, while a low-density area indicates that the fish school is more dispersed within the area. Figure 6 illustrates the density of fish schools.
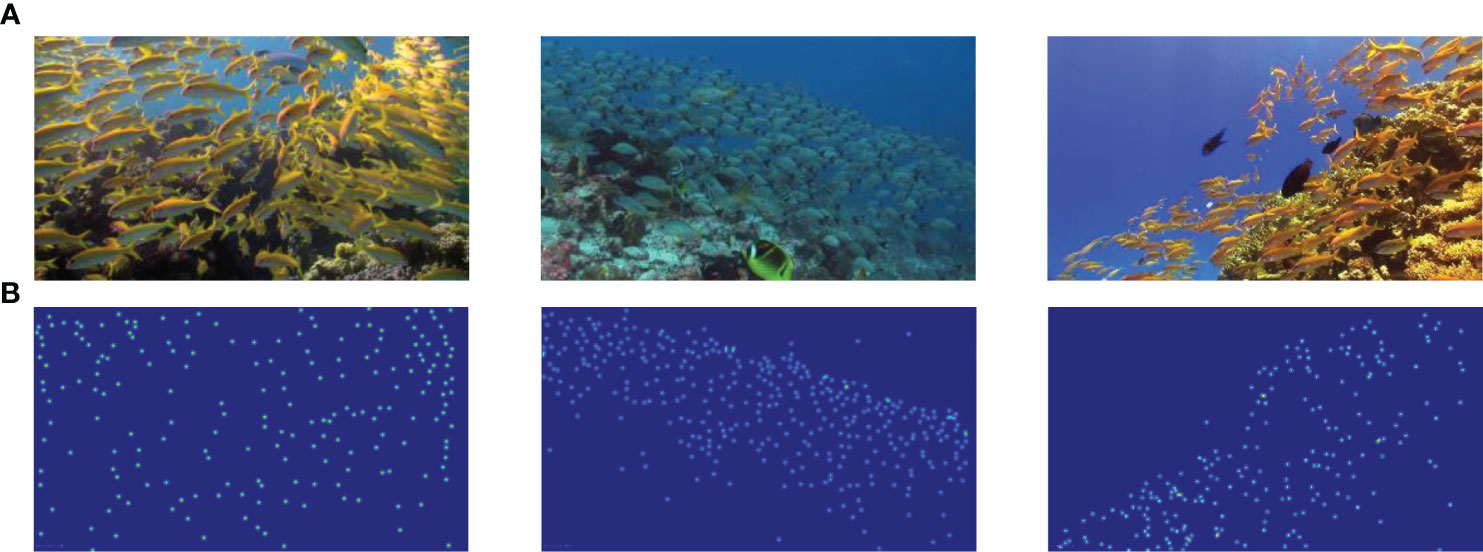
Figure 6 Examples of fish school density maps. (A) Original images, (B) density maps.
In order to achieve accurate feeding, we need to obtain the density distribution of fish in the feeding process in real time and accurately, and analyze and judge the feeding behavior based on this information. To this end, the number of fish schools in the density map can be counted to determine the prediction result. Therefore, the quality of the density map has an important impact on the accuracy of the prediction results.
During the density map generation phase, we employed an adaptive Gaussian kernel density estimation method. This approach dynamically adjusts the parameters of the Gaussian kernel based on the characteristics and density distribution of the fish school images to generate high-quality density maps. By adaptively selecting the appropriate size and weight of the Gaussian kernel, we can effectively reduce the impact of noise and artifacts while maintaining spatial resolution in the density map. This results in more accurate, smoother, and easier-to-interpret density maps, providing strong support for subsequent understanding of fish behavior and density estimation.
Firstly, the position of each fish head in the picture is marked, and the size of the fish head is calculated according to the known position of each fish head and the distance between each other. Then, by applying the geometrically adaptive Gaussian kernel algorithm, we transform the marked points into a patch of the corresponding fish head size and ensure that the probability sum of this region is one. Finally, we can obtain an accurate fish school density map, where the sum of regional probabilities of all fish heads in the whole image is equal to the number of fish schools, and the density map generation process is shown in Figure 7.
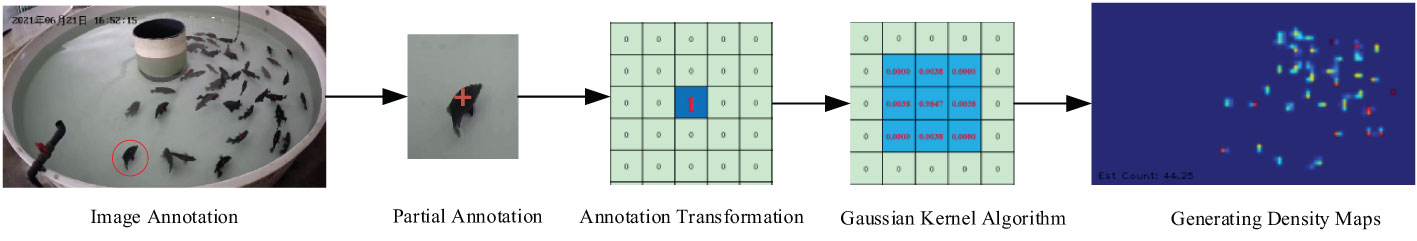
Figure 7 The density generation process.
Convert the labeled fish head image into a density map by (7):
Where δ is the impact function, xi represents the position of the pixel where the fish head is located, represents the impact response function of the fish head position in the image, and N is the total number of fish heads in the image.
Since the problem of near size and far size appears in almost every picture of the fish school, in order to make the density map can truly reflect the actual distribution of the fish school (the size of the fish in different positions is different). The density map based on adaptive Gaussian kernel is adopted, and the formula is as follows:
Among them:
This formula is used to calculate the average distance between the m nearest fish heads to the fish head of xi and the fish head. is approximately equal to the fish head size when the fish density is relatively large. To calculate the density of the fish around a pixel, we multiply with Gaussian kernel , in our experiments, β=0.3 works best.
With the ongoing advancements in artificial intelligence technology, intelligent feeding systems have gained widespread adoption in the aquaculture industry. However, effectively monitoring fish aggregation and dispersion to achieve precise feeding and optimize breeding conditions remains an urgent challenge. To address this issue, we proposed a spatio-temporal density fusion and visualization module and an attention-mechanism-based intelligent bait casting strategy for accurate assessment of fish aggregation and dispersion. The proposed spatiotemporal density fusion and visualization module enhances the original output, facilitating informed feeding decisions. Unlike the original network model, which can only generate a density map corresponding to a single image at a specific time point, our approach aims to create a spatio-temporal fusion density map that clearly illustrates the density distribution of fish over time. By leveraging the attention-mechanism-based intelligent feeding strategy, more accurate feeding decisions can be made.
Specifically, we propose the following two key steps to implement this spatio-temporal density fusion and visualization module:
Firstly, we adopt the method of 3D density superposition calculation to integrate the changes of fish density in a period of time to achieve spatio-temporal density fusion. Since each density map represents the fish density distribution at a specific time point, after obtaining the density maps in a certain period of time, we calculate the superposition of these density maps in the time dimension t and the two-dimensional spatial dimension h, w, that is, the fish density values at the corresponding positions on each density map are accumulated. The spatio-temporal density fusion process is shown in Figure 8. In this way, we obtain a density map that integrates the information about the density variation of the fish school over a period of time, that is, the spatio-temporal fusion density map.
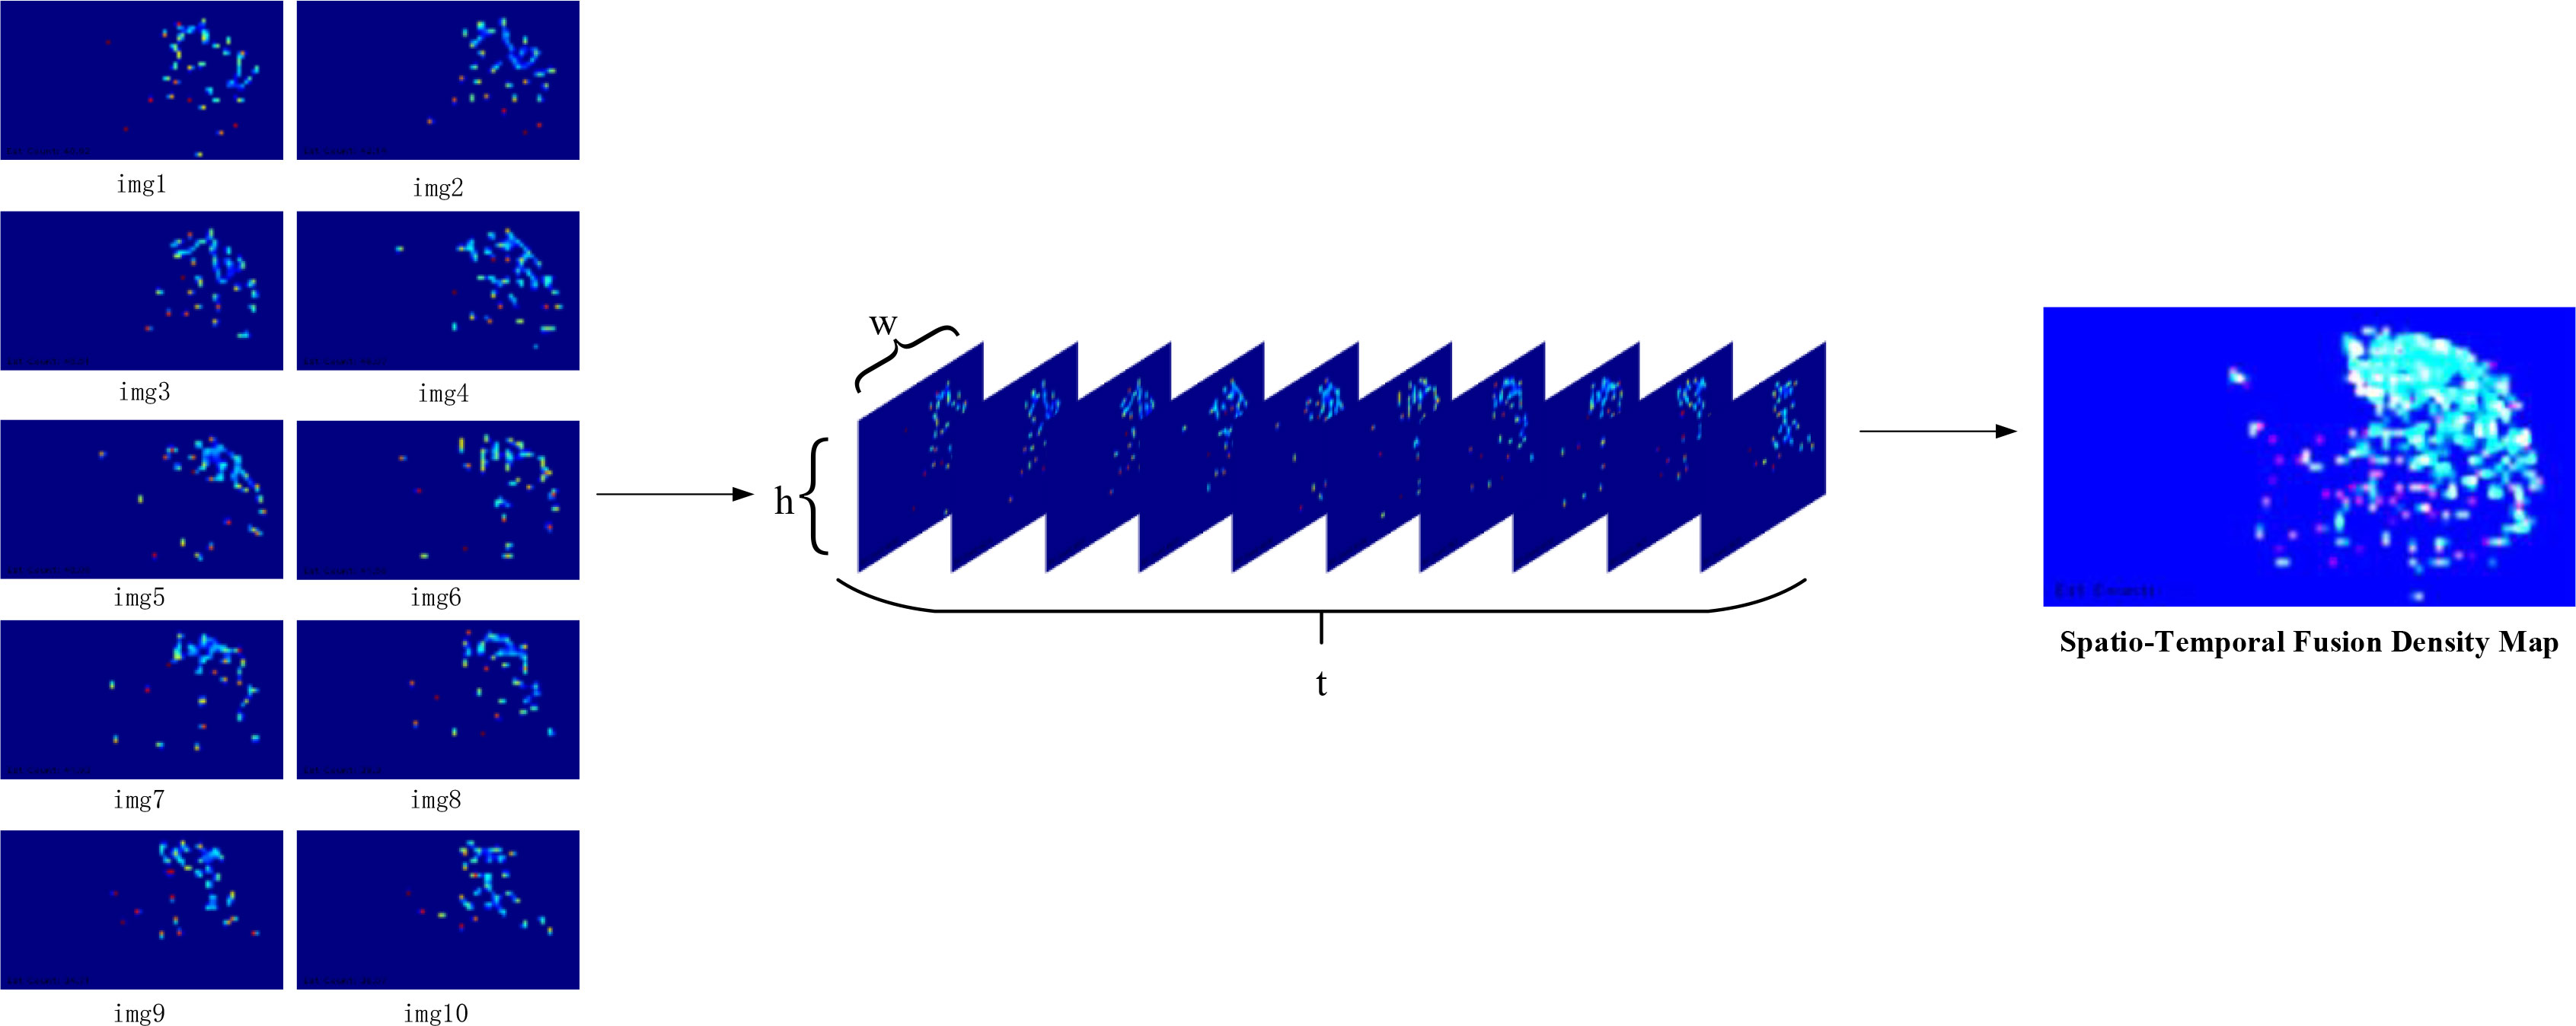
Figure 8 Process of spatio-temporal density fusion.
Secondly, spatio-temporal fusion density map is visualized, where heat maps and videos are common methods:
Heat map: In each time period, we convert the pixel value of the density map into the corresponding color intensity, and use the chromatogram of the heat map for visualization. By observing the color distribution and morphological characteristics in the heat map, the color information in the map can intuitively represent the density level and morphological characteristics of different regions, such as the degree of aggregation, the degree of diffusion and the distribution of large and small regions. It can further reflect the aggregation behavior and changing trend of fish school. Figure 9 shows an example of visual heat map, where (A) and (B) each shows one of the original images of fish school pictures in a period of time, (C) and (D) each show the corresponding synthesized spatio-temporal fusion density map for fish school images over a period of time. As shown in Figure 9C, D, the lighter colored areas indicate highly dense areas, while the other areas indicate areas with low density or even no fish. This visualization method can help us intuitively analyze the density distribution of fish in each time period.
Video: We concatenate the superimposed density maps of multiple time periods in chronological order to form a continuously playing dynamic heat map video. By observing this video, we can intuitively observe the distribution and dynamic change trend of fish density in a longer period of time, and this dynamic heat map display way can provide more detailed and comprehensive information.
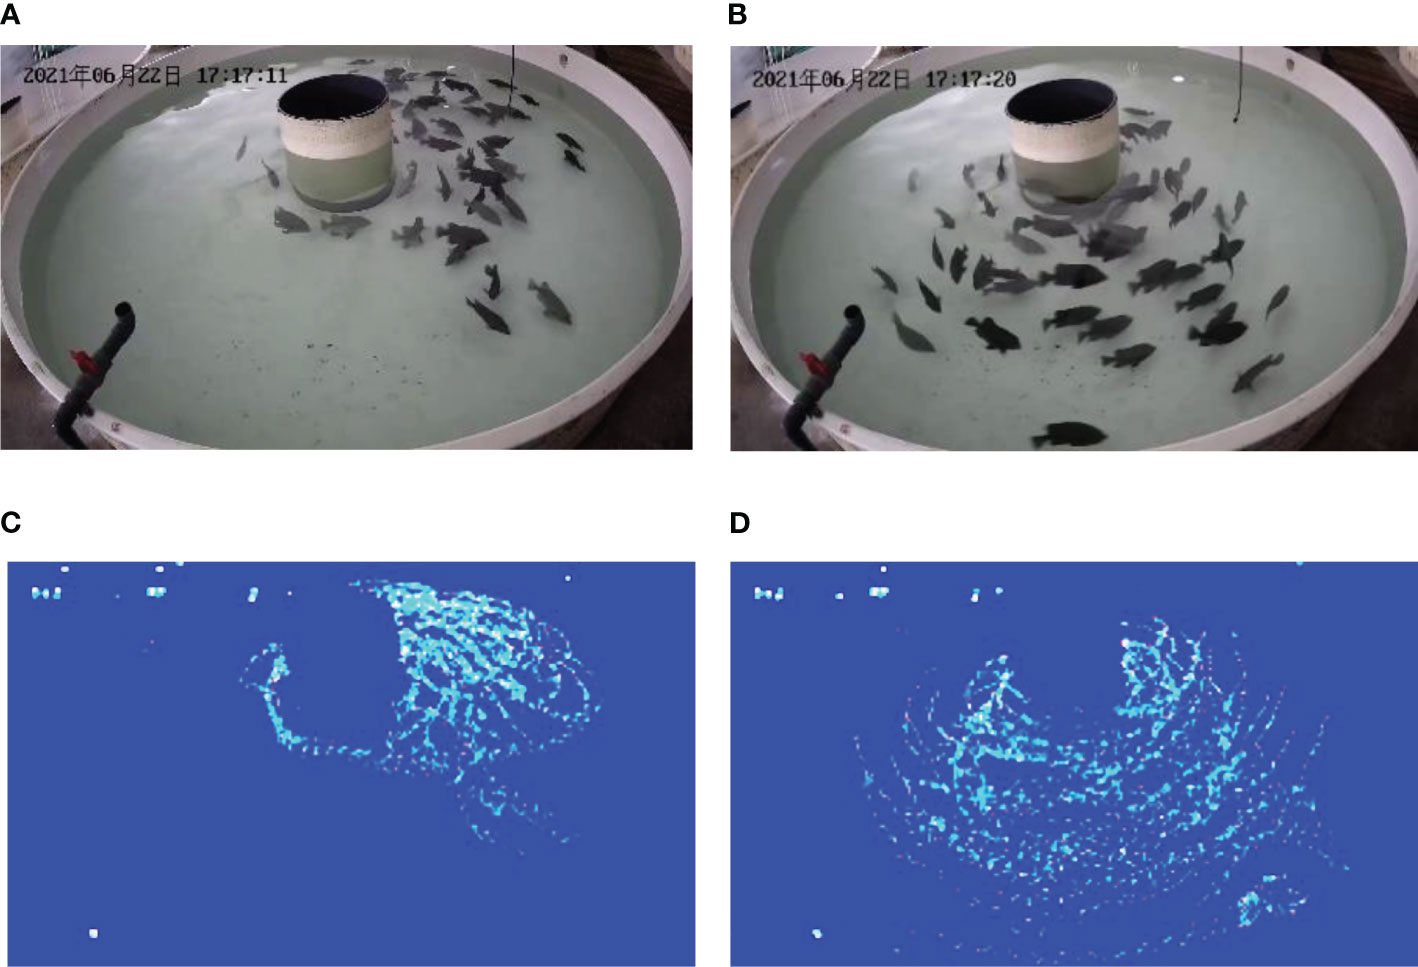
Figure 9 Examples of visual heat maps. (A, B) Original images, (C, D) density maps.
By introducing this spatio-temporal density fusion and visualization module, we can intuitively visualize the density changes of fish schools over a period of time. The innovation of this module enables our network model to better deal with time series information, analyze the dynamic behavior changes of fish schools more comprehensively, and provide a more comprehensive perspective for the study of fish behavior and ecology.
In this paper, we proposed an attention-mechanism based intelligent bait casting strategy. The core task is to analyze and calculate fish density by utilizing the concept of attention mechanism. This approach aims to accurately determine the change in fish density in each area, assess its significance within the entire image, and subsequently accurately judge the degree of fish aggregation and dispersion. The rationale behind employing the attention mechanism lies in the fact that areas with higher fish numbers on the entire fish density map typically exhibit more pronounced density fluctuations, thereby providing more valuable information. Consequently, these areas are deemed more important and warrant greater attention.
The analysis process of this strategy relies upon the spatio-temporal density fusion and visualization module introduced above. After generating a spatio-temporal fusion density map, this module combines the concepts of attention mechanism in deep learning to quantitatively analyze the changes in density distribution, in order to judge the degree of fish gathering and further infer whether they are in a state of hunger. Specifically, we can conclude that when the fish density distribution quickly shows a gathering trend after a single attempt to bait, the fish is in a state of hunger, because the fish tend to gather together in search of food. This analysis based on the changes in density distribution can effectively help us judge the degree of hunger of fish and take corresponding feeding measures in time.
In order to combine the time factor and Density information to accurately measure the change trend and degree of fish density distribution, we introduce a new formula to represent the contribution of total difference of fish density change(TD), which is defined as follows:
Where N represents the number of regions divided by the density map, represents the proportion of the fish density value of the k region in the whole map after the division of the i density map, that is, the contribution degree of each region to the overall density, and represents the estimated fish density in the kth region.
Through a series of calculations, analysis and comparisons, we can obtain a numerical index to quantitatively assess the strength of the trend and degree of change in the density distribution of fish schools. This new formula provides us with an objective and quantifiable tool to evaluate the changes in fish density, thus providing a scientific and accurate basis for intelligent bait casting strategy. The specific methods are as follows:
Density map division: The spatiotemporal fusion density map of the input is evenly divided into four, six, or nine regions. These areas are rectangular areas of equal size, ensuring that the distribution of fish stocks within each area is fully considered, and the number of partitions depends on the number of fish stocks contained in the dataset. The two data sets used in this paper are divided into four regions, as shown in Figure 10B.
Area density contribution evaluation: for each division area, calculating the fish density values and fish density values accounted for the proportion of the whole picture , in order to realize each regional contribution to the density of the whole evaluation.
Figure before and after difference calculation: to deal with continuous time point of the fish density diagram, calculate the regional density changes in the value. This involves subtracting the value of each corresponding area in the previous density map from the value in the current density map, to obtain the difference . For each region, the formula for calculating the density change value is as follows:
Among them, the represents the difference of fish density change in the kth region.
Differential contribution calculation: the difference of each area respectively multiplied by the proportion of the region , differential contribution of each region
Total differential contribution calculation: The fish density change difference contribution calculated from all regions is accumulated to obtain the total fish density change difference contribution TD of the whole density map region. Where N denotes the number of regions divided by the density map.
Total Difference Contribution to fish density change (TD) analysis: Based on the calculated TD value, the analysis is performed to determine whether the fish are gathering or dispersing. If TD is greater than zero, it is judged as fish gathering. On the contrary, if TD is less than or equal to zero, the fish is judged to be dispersed. Finally, the judgment result of fish gathering or dispersing is output.
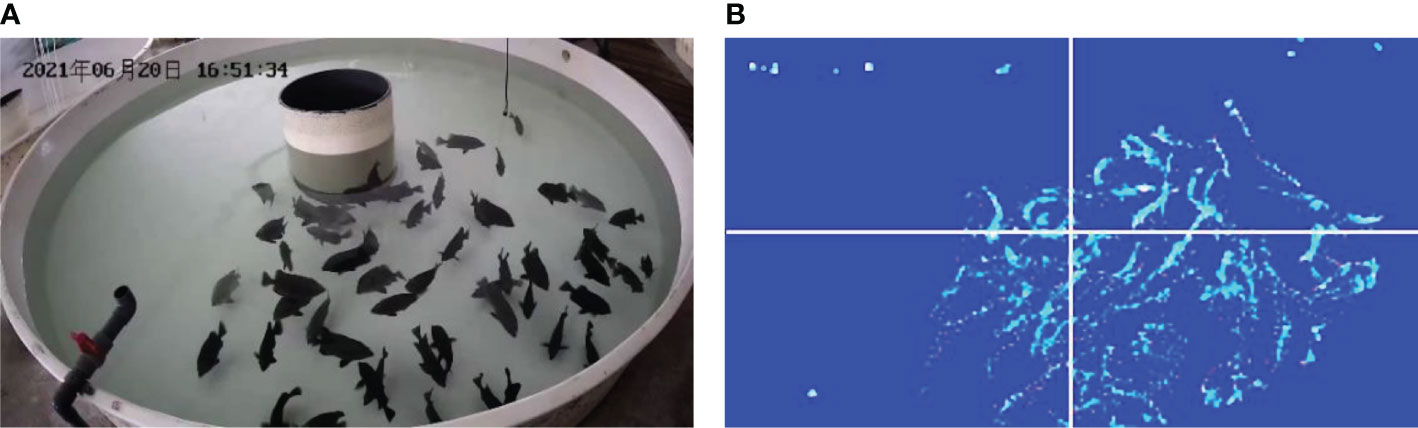
Figure 10 An Example Of Density Map Partitioning. (A) One of the original images, (B) density map.
In this paper, we used two datasets. One is the fish density analysis dataset (DlouFishDensity), which contains 20 side-shot videos with complete fish feeding behavior, as shown in Figure 11. Another is a data video clip taken by Cui (Cui et al., 2022), which contains videos all taken above the water surface, as shown in Figure 12.
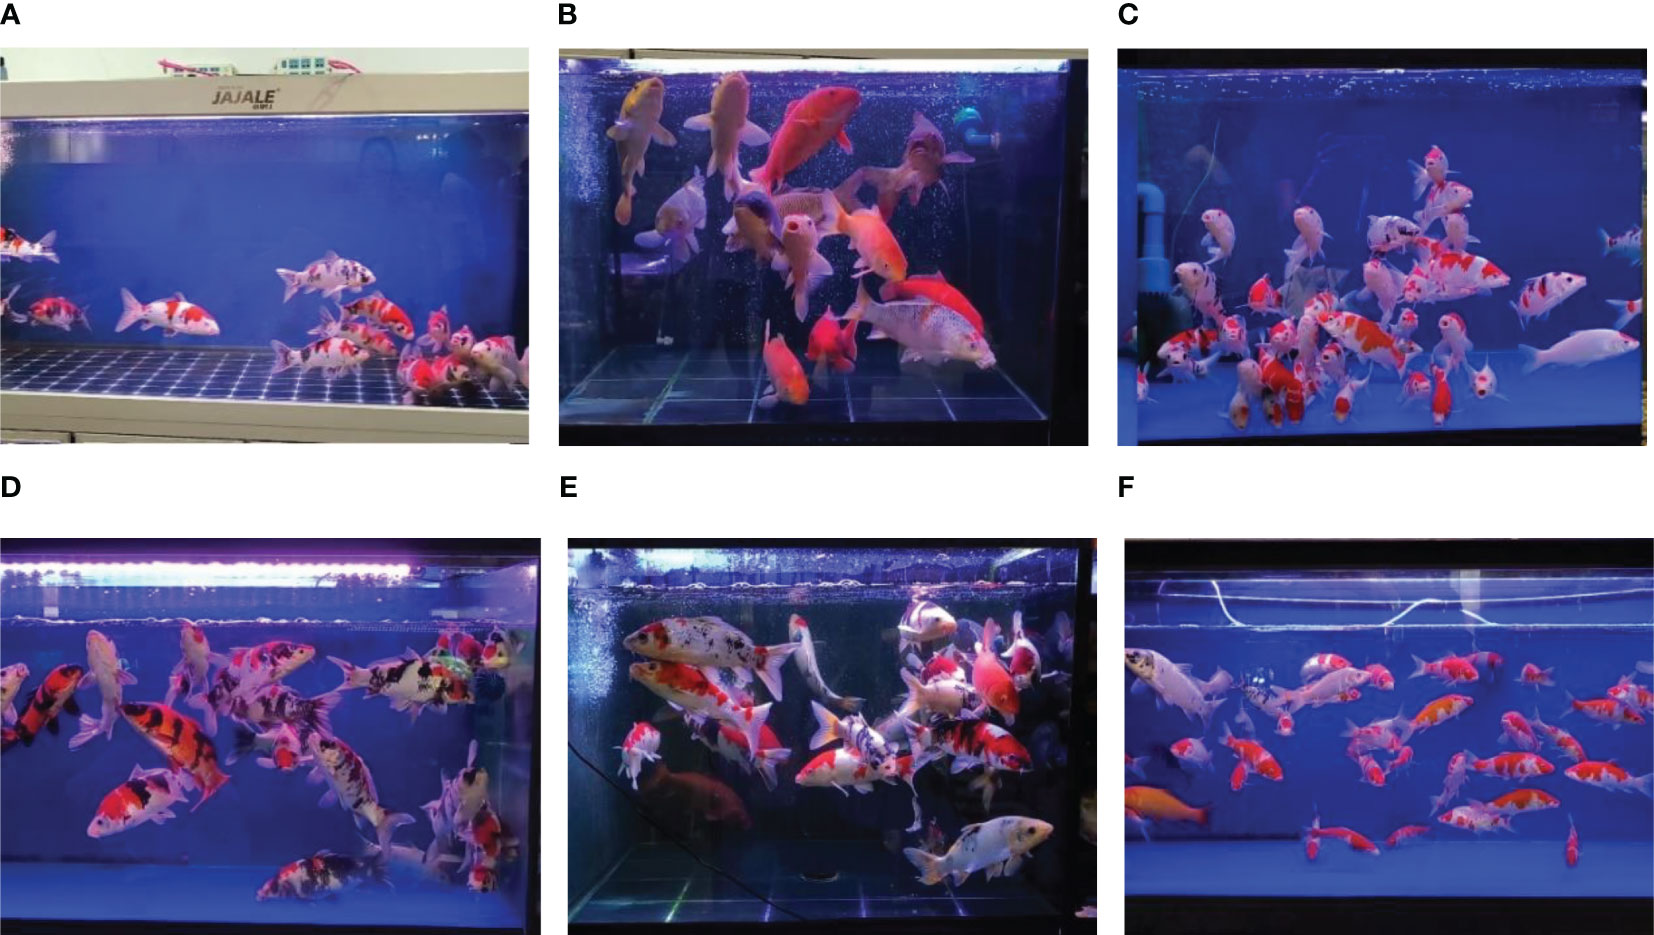
Figure 11 Partial picture of DlouFishDensity dataset.
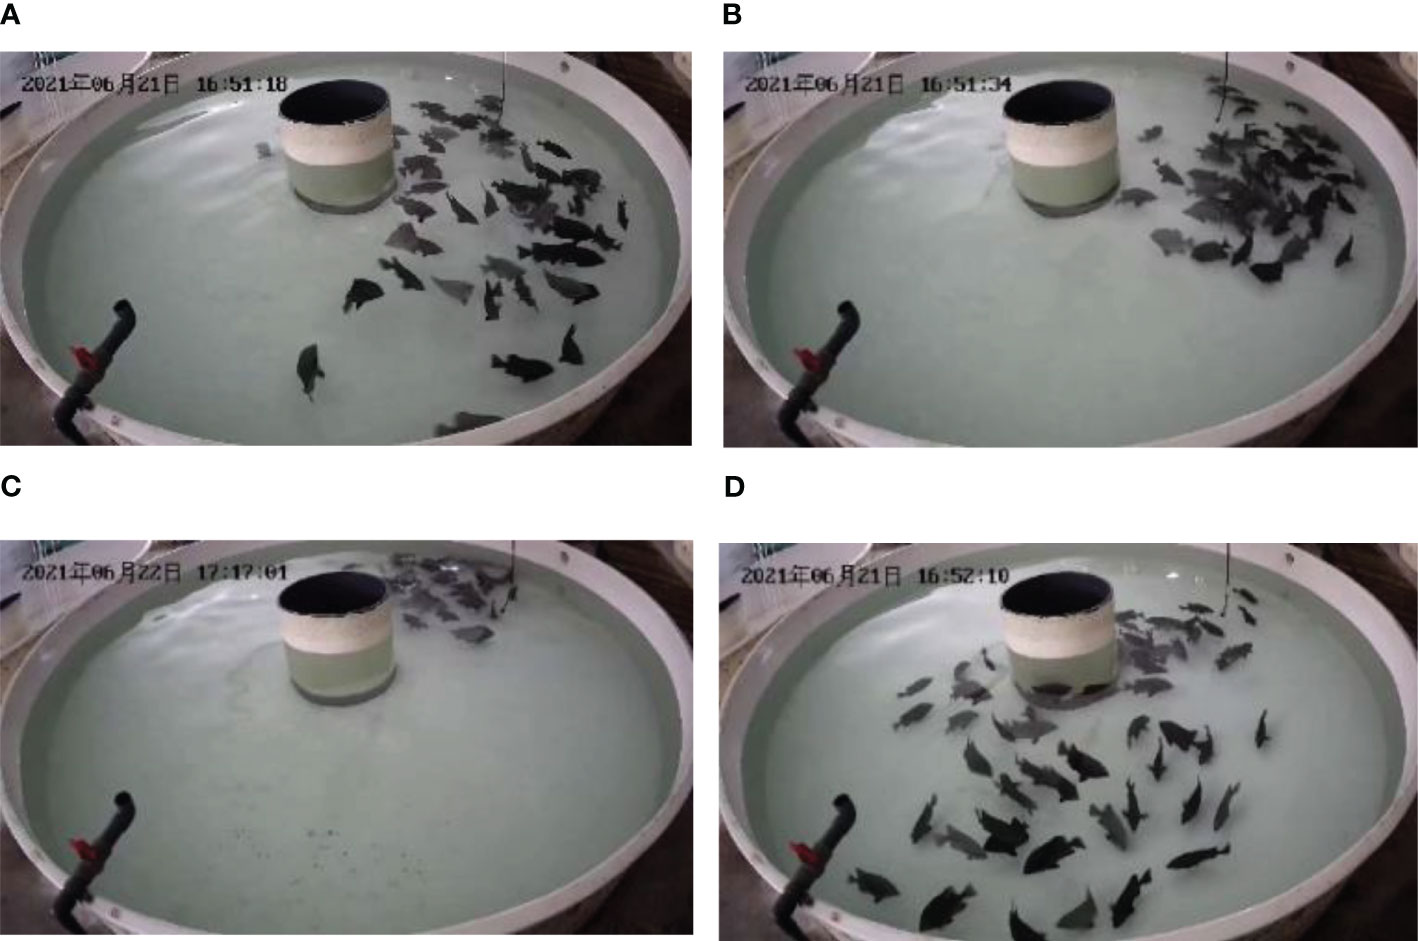
Figure 12 Part of the data set picture of Cui (Cui et al., 2022). (A) Scattered, (B) gather, (C) gather, (D) scattered.
To accurately train and predict the fish school density analysis model, first, we filter all the collected videos. The videos that meet our requirements have a resolution of 1920*1080 and a duration between 30s-60s. Second, we manually labeled the locations of fish heads on 900 image frames in DlouFishDensity and 300 image frames in the video of Cui (Cui et al., 2022) dataset, and finally labeled the locations of more than 30000 fish heads. The labeling tool uses MATLAB to establish a data_marker labeling applet to label the fish head of each picture in the data set. The fish with occluded fish heads in the picture will not be labeled, and the corresponding at file will be generated for the marked picture, where the total number of markers in the image is used as the ground truth value of the whole picture.
Due to the lack of public fish density datasets at this stage, we collected and produced a dataset specifically for fish density analysis (DlouFishDensity). To obtain authentic behavioral data of fish in an aquaculture environment, we used mobile phones and high-definition video equipment for on-site recording, capturing 20 videos of fish school feeding behavior.
The video was recorded from the experimental fish breeding pool of Dalian Ocean University, and the simple schematic diagram of the collection equipment is shown in Figure 13. The size of the breeding pool is 3 meters * 2 meters, the water depth is 1.5 meters, the distance between the lamp and the pool is 1.5 meters, and the camera is located on one side of the pool, used to shoot the underwater fish school feeding behavior video from the side.

Figure 13 The simple schematic diagram of the collection equipment of DlouFishDensity dataset.
Through this dataset, we aim to provide an accurate and diverse resource for training and evaluating models for the fish farming industry and related research. The dataset contains 20 videos with complete school feeding behavior and 1000 manually annotated image frames, and part of the DlouFishDensity dataset pictures are shown in Figure 11.
We divided the dataset into a training set and a test set at a ratio of 9:1, with 18 videos for training and 2 videos for testing. From the 18 videos, we extracted 1000 frames of fish school images for manual annotation, which reflect the density distribution of the fish school at different times. From the two videos, 274 and 235 image frames were extracted as Test Set A and B groups respectively.
We employed the data video clips taken by Cui et al. (2022). Unlike the underwater fish school activity videos taken from the side in DlouFishDensity, the videos included in this data set are all taken above the water surface. They breed the experimental subjects in a farm located in Yantai City, Shandong Province, China. The breeding pool is a circular pool with a diameter of 3 meters and a depth of 0.75 meters. The simple schematic diagram of the collection equipment is shown in Figure 14. The video of fish feeding is captured from above the water surface by a camera and transmitted to the computer for processing.
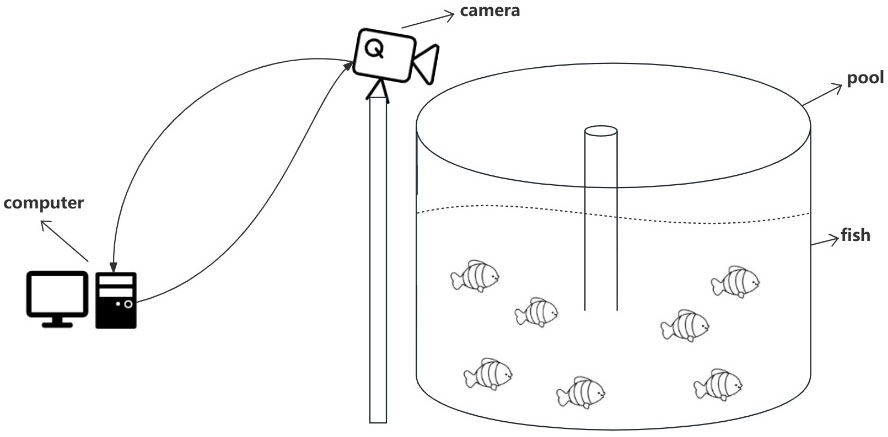
Figure 14 The simple schematic diagram of the collection equipment of Cui dataset.
Some of the dataset images are shown in Figure 12. The figures show the scattered state of the fish school in (A) and (D), while (B) and (C) will be evaluated as fish school gatherings. The video of fish activity taken above the water surface has a wider field of view and can capture images of fish activity from various angles. The combination of video data taken above the water surface and those taken from the side can enhance our dataset, provide a better understanding of the spatial distribution and density changes of fish schools, improve the diversity and reliability of experiments, and offer more accurate and comprehensive results for real-time analysis of fish density changes. During this experiment, these video clips were reorganized and spliced reasonably, and data were labeled for testing.
The hardware configuration used in the experiment is mainly based on the CPU of i7 9700 and the GPU of NVIDIA RTX 3090 for training, and the network design is based on Pytorch version 1.7.0 and CUDA version 11.0.
The entire network is initialized to a Gaussian distribution with mean 0 and standard deviation 0.1 for the weights. Compared with the stochastic gradient descent optimization algorithm, the Adam optimization algorithm has the advantages of less resources and fast model convergence. Therefore, the Adam algorithm is used to optimize the network. The initial learning rate of the model is 0.00001, the learning rate decay is multiplied by 0.9 every 5 rounds, the number of samples in each batch is 1, and the number of training rounds is 1000. The network automatically saves the best algorithm model weight parameters of the last five times.
Fish school density estimation is one of the key tasks in our proposed FishFeed method. With the rapid development of computer vision and deep learning technologies, an increasing number of algorithms have been proposed to solve the problem of fish school density estimation. However, different algorithms and backbone networks vary in their performance in terms of fish school image feature extraction and density estimation. To verify the overall performance of our proposed algorithm in fish school density estimation, as well as the effectiveness of our proposed VGG19 Variant in fish school image feature extraction, we designed a series of experiments and compared their performance with that of already published algorithms.
All algorithms are trained on the DlouFishDensity dataset, and each algorithm has undergone multiple trainings and parameter tuning. In this process, we strictly keep the other parameters unchanged and only observe the performance of the two methods compared.In test sets A and B, to ensure the stability and reliability of the results, we chose the average value of five runs as the final basis for evaluation.
In these experiments, we employed four evaluation metrics to comprehensively measure the performance of the algorithm. Mean Absolute Error (MAE) and Mean Squared Error (MSE) are two widely used indicators in density estimation problems. They effectively quantify the difference between the model’s predicted results and the actual values, thereby helping us judge the accuracy of model predictions. At the same time, we also considered the prediction time and the number of predicted density maps generated per second. These two metrics respectively reflect the computational efficiency of the algorithm and the rate of generating results, which are of significant importance for real-time requirements in practical applications.
The Mean Absolute Error (MAE) and Mean Squared Error (MSE) can provide important information about the accuracy and robustness of an algorithm. MAE is used to quantify the mean absolute difference between the predicted and true values. A lower MAE value signifies that the algorithm’s prediction is closer to the true value, indicating higher accuracy. MSE measures the mean squared error between the predicted and true values, reflecting the degree of data variation. A smaller MSE value suggests better algorithm robustness, as it maintains a low prediction error in the face of data changes. The definitions are as follows:
Where N is the number of images, is the number of marked real image fish schools, and it is the estimated number of fish schools corresponding to the ith image.
To verify the effectiveness of our proposed VGG19 Variant in extracting features from fish school images, we designed exhaustive experiments. The experiments selected three representative density estimation feature extraction networks for comparative analysis. These include the CSRNet (Li et al., 2018), which is based on an improved VGG16 for feature extraction, and the FishCount (Li J. et al., 2020) model, which is based on an improved MCNN for feature extraction. By comparing the performance of these networks, we can deeply assess the advantages of the VGG19 Variant in feature extraction.
In the experiments, we only replaced the backbone network without changing other network structures and adjusted parameters individually for training. Through quantitative analysis of the prediction errors after training, we revealed the unique advantages of the VGG19 Variant in extracting features from fish school images. Table 3 shows the prediction results in the test set.
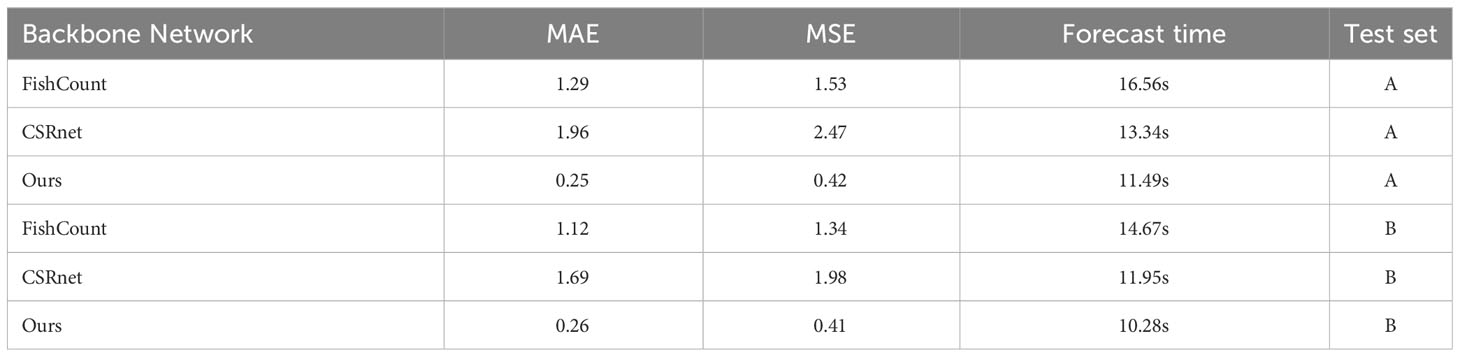
Table 3 Prediction results of different backbone network on DlouFishDensity dataset.
In this experiment, the VGG19 Variant we adopted demonstrated significant performance advantages in extracting features from fish school images. Quantitative analysis shows that the model has achieved noticeable improvements in key performance indicators such as Mean Absolute Error (MAE), Mean Squared Error (MSE), and prediction processing time. Specifically, Table 3 shows the evaluation results of our model on test sets A and B, where the prediction speed surpassed other models for comparison. In test set A, our model recorded the lowest MAE and MSE, and similarly achieved the smallest error in test set B.
Through comparative analysis with other models, we found that the VGG19 Variant can more effectively capture key information when extracting features from fish school images, thereby significantly improving the accuracy of density estimation. We believe that this performance improvement is mainly due to the improvements in network architecture design, parameter optimization, and feature extraction and fusion mechanisms of the VGG19 Variant. Taking into account all evaluation indicators, the VGG19 Variant has been proven to be the optimal model structure choice for this research task.
In order to verify the overall performance of the proposed algorithm in the estimation of fish density, we designed a series of experiments and compared its performance with that of published algorithms. MCNN (Gkioxari et al., 2016) comes from a population counting study.
It is particularly important to emphasize that the results generated in this experiment are based on the method of generating a single density map from a single input image. This means that for each input image, the algorithm independently generates a corresponding density map as output. This approach helps us to observe and analyze the performance of the algorithm more meticulously when dealing with individual samples and also provides more specific and targeted guidance for subsequent algorithm optimization.
The results shown in Table 4 demonstrate the predictive performance of different algorithm models on the DlouFishDensity dataset. These results not only provide an objective basis for us to compare the strengths and weaknesses of different algorithms but also offer valuable reference information for subsequent research and applications.
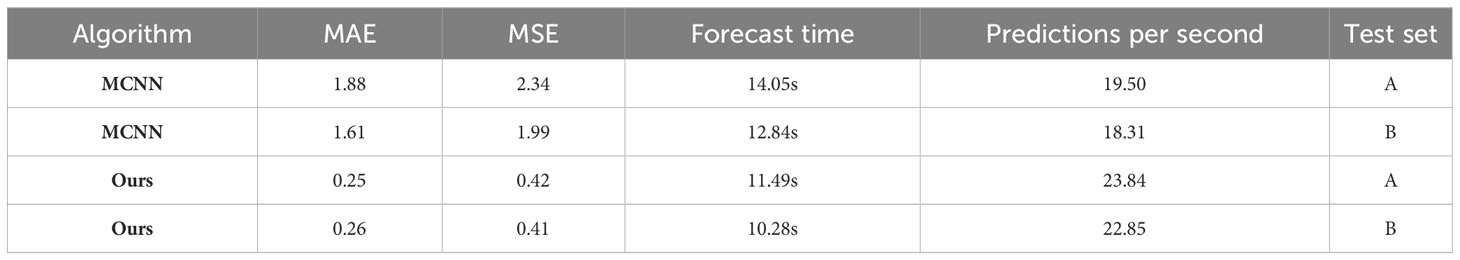
Table 4 Prediction results of different algorithms on DlouFishDensity dataset.
The experimental results show that the proposed algorithm is better than the MCNN algorithm in the two indexes of mean absolute error (MAE) and mean square error (MSE). Specifically, compared with MCNN algorithm, our algorithm improves MAE by 1.63 and 1.35, and MSE by 1.92 and 1.58, respectively. These data clearly demonstrate the excellent performance and higher prediction accuracy of our algorithm in fish density estimation.
Furthermore, compared to the MCNN algorithm, our algorithm reduces the average prediction time by 2.56 seconds and produces an average of 4.44 more predictive density maps per second. This enhancement is attributed to the incorporation of a lightweight VGG19 deformation network and the optimized utilization of a 16-layer convolutional neural network for feature extraction. Consequently, the model can expediently comprehend the features of fish schools, thereby better fulfilling our requirements for real-time density analysis of fish feeding behavior.
The reduction in prediction time is pivotal for real-time analysis tasks, especially in practical applications where rapid and precise predictions are essential due to the need for immediate responses and decisions. A prolonged prediction time can impair the real-time performance of the analysis, potentially resulting in missed opportunities for critical analysis. Consequently, the proposed algorithm’s ability to reduce prediction time is a significant advantage, enhancing both the efficiency and suitability of the model for real-time analysis tasks. This further underscore the practicability and advancement of the proposed algorithm in analyzing feeding behavior based on fish density distribution.
Through the analysis of experimental accuracy and real-time performance, our study demonstrates, through an analysis of experimental outcomes, that the algorithm developed in this research is capable of effectively capturing the characteristics of fish school behavior, thereby reducing density estimation errors and enhancing the overall performance of the model. Comparatively, when juxtaposed against the MCNN algorithm, our approach exhibits marked superiority in terms of Mean Absolute Error (MAE), Mean Squared Error (MSE), and prediction time. These findings not only substantiate the efficacy of our proposed algorithm in fish density estimation but also pave the way for further refinement and practical implementation in real-world fish density estimation scenarios.
Water quality represents a pivotal factor influencing fish distribution and population density. Comprehending its impact on estimating fish population density is essential. Primarily, water quality directly impacts the living environment and physiological condition of fish. Optimal water quality fosters a conducive habitat for fish, facilitating their growth and reproduction, which in turn augments population density. Conversely, degraded water quality may precipitate fish mortalities, migrations, or erratic behaviors, consequently diminishing population density.
Secondarily, fluctuations in water quality parameters can directly modulate fish behavior and physiology. For example, variations in critical parameters like temperature, dissolved oxygen, and pH levels can influence metabolic rates, appetite, and reproductive capacities of fish, subsequently affecting population density. Furthermore, pollutants, toxic substances, and pathogens present in water can inflict direct or indirect harm to fish, impacting population density.
In the process of estimating fish population density, the influence of water quality manifests in several aspects:
Data Collection: Inadequate consideration of water quality factors during data collection may induce sample bias, thus skewing the estimation results of fish population density. Therefore, data collection must meticulously account for the spatial distribution and variability of water quality parameters.
Fish Behavioral Changes: Alterations in water quality can elicit changes in fish behavior, such as aggregation, migration, or avoidance. These behavioral shifts can directly affect the estimation results of fish population density. Hence, the impact of water quality on fish behavior necessitates thorough consideration during estimation.
Fish Physiological State: Water quality directly affects the physiological state of fish. Fish under stress or affected by water pollution may exhibit physiological anomalies, thereby influencing the estimation results of fish population density.
To verify the effectiveness of our proposed attention mechanism-based intelligent bait casting strategy on the changing trend and degree of fish population density, we designed an experiment. Utilizing the FishFeed method, which incorporates the aforementioned intelligent feeding strategy as the algorithmic determination approach, we conducted the experiment. Both algorithmic determination and manual analysis were employed to appraise the outcomes. By monitoring temporal factors and density data throughout the feeding process, we could analyze the fish population’s density distribution in real-time and gauge their aggregation levels. These analyses offered profound insights into the fish population’s hunger levels, thereby laying the groundwork for future feeding strategy adjustments.
In our experiment, we employed an attention-based intelligent baiting strategy to scrutinize the alterations in the density distribution of fish groups. The changes in density distribution were quantified using Formula 10, as defined in Section 2.3.2, which also enabled us to determine the degree of aggregation within these groups. By calculating the differences in density at various time points and aggregating them, we derived the contribution of total difference of fish density change (TD) value. The detailed computation procedure is outlined in Section 2.3.2. The formula for computing the TD value is presented as follows:
Where N represents the number of regions divided by the density map, represents the proportion of the fish density value of the k region in the whole map after the division of the i density map, that is, the contribution degree of each region to the overall density, and represents the estimated fish density in the kth region.
Based on the calculated TD value, the analysis is performed to determine whether the fish are gathering or dispersing:
If TD is greater than zero, it is judged as fish gathering.
If TD is less than or equal to zero, the fish is judged to be dispersed.
For this purpose, during the algorithm testing phase, we converted the two datasets of Cui et al. (2022) and the DlouFishDensity video into HTTP video streams. In this way, we simulated the transmission and processing environment of real-time video streams to be closer to actual application scenarios and to more accurately assess the real-time performance of the algorithm. We recorded key performance indicators when the algorithm processed each video set, including the total running time of the algorithm and the processing time per image. The details and performance data of the three video sets are shown in Table 5.
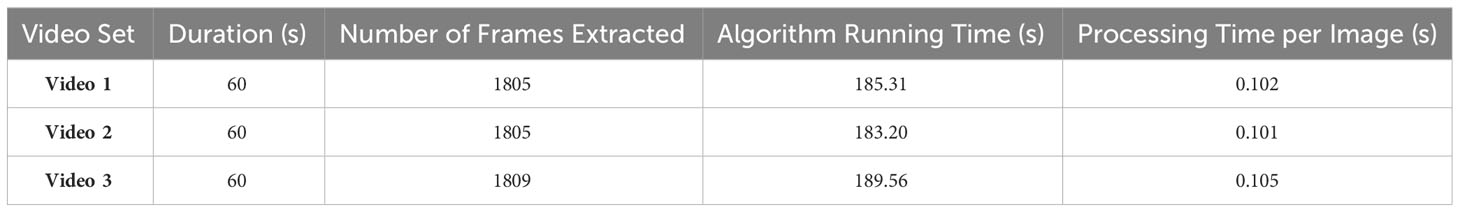
Table 5 Video stream processing performance assessment table.
These results provide us with valuable information about the performance of the algorithm when processing HTTP video streams in real-time. By deeply analyzing and comparing these results, we can further optimize the algorithm to improve its accuracy and efficiency in practical applications.
During the conversion process, we ensured the stability and continuity of the video stream so that the algorithm could receive and process video data in real-time. Subsequently, we used the algorithm to generate a spatio-temporal fusion density map, TD value and judgment results generated by the algorithm are shown in Figures 15–17.
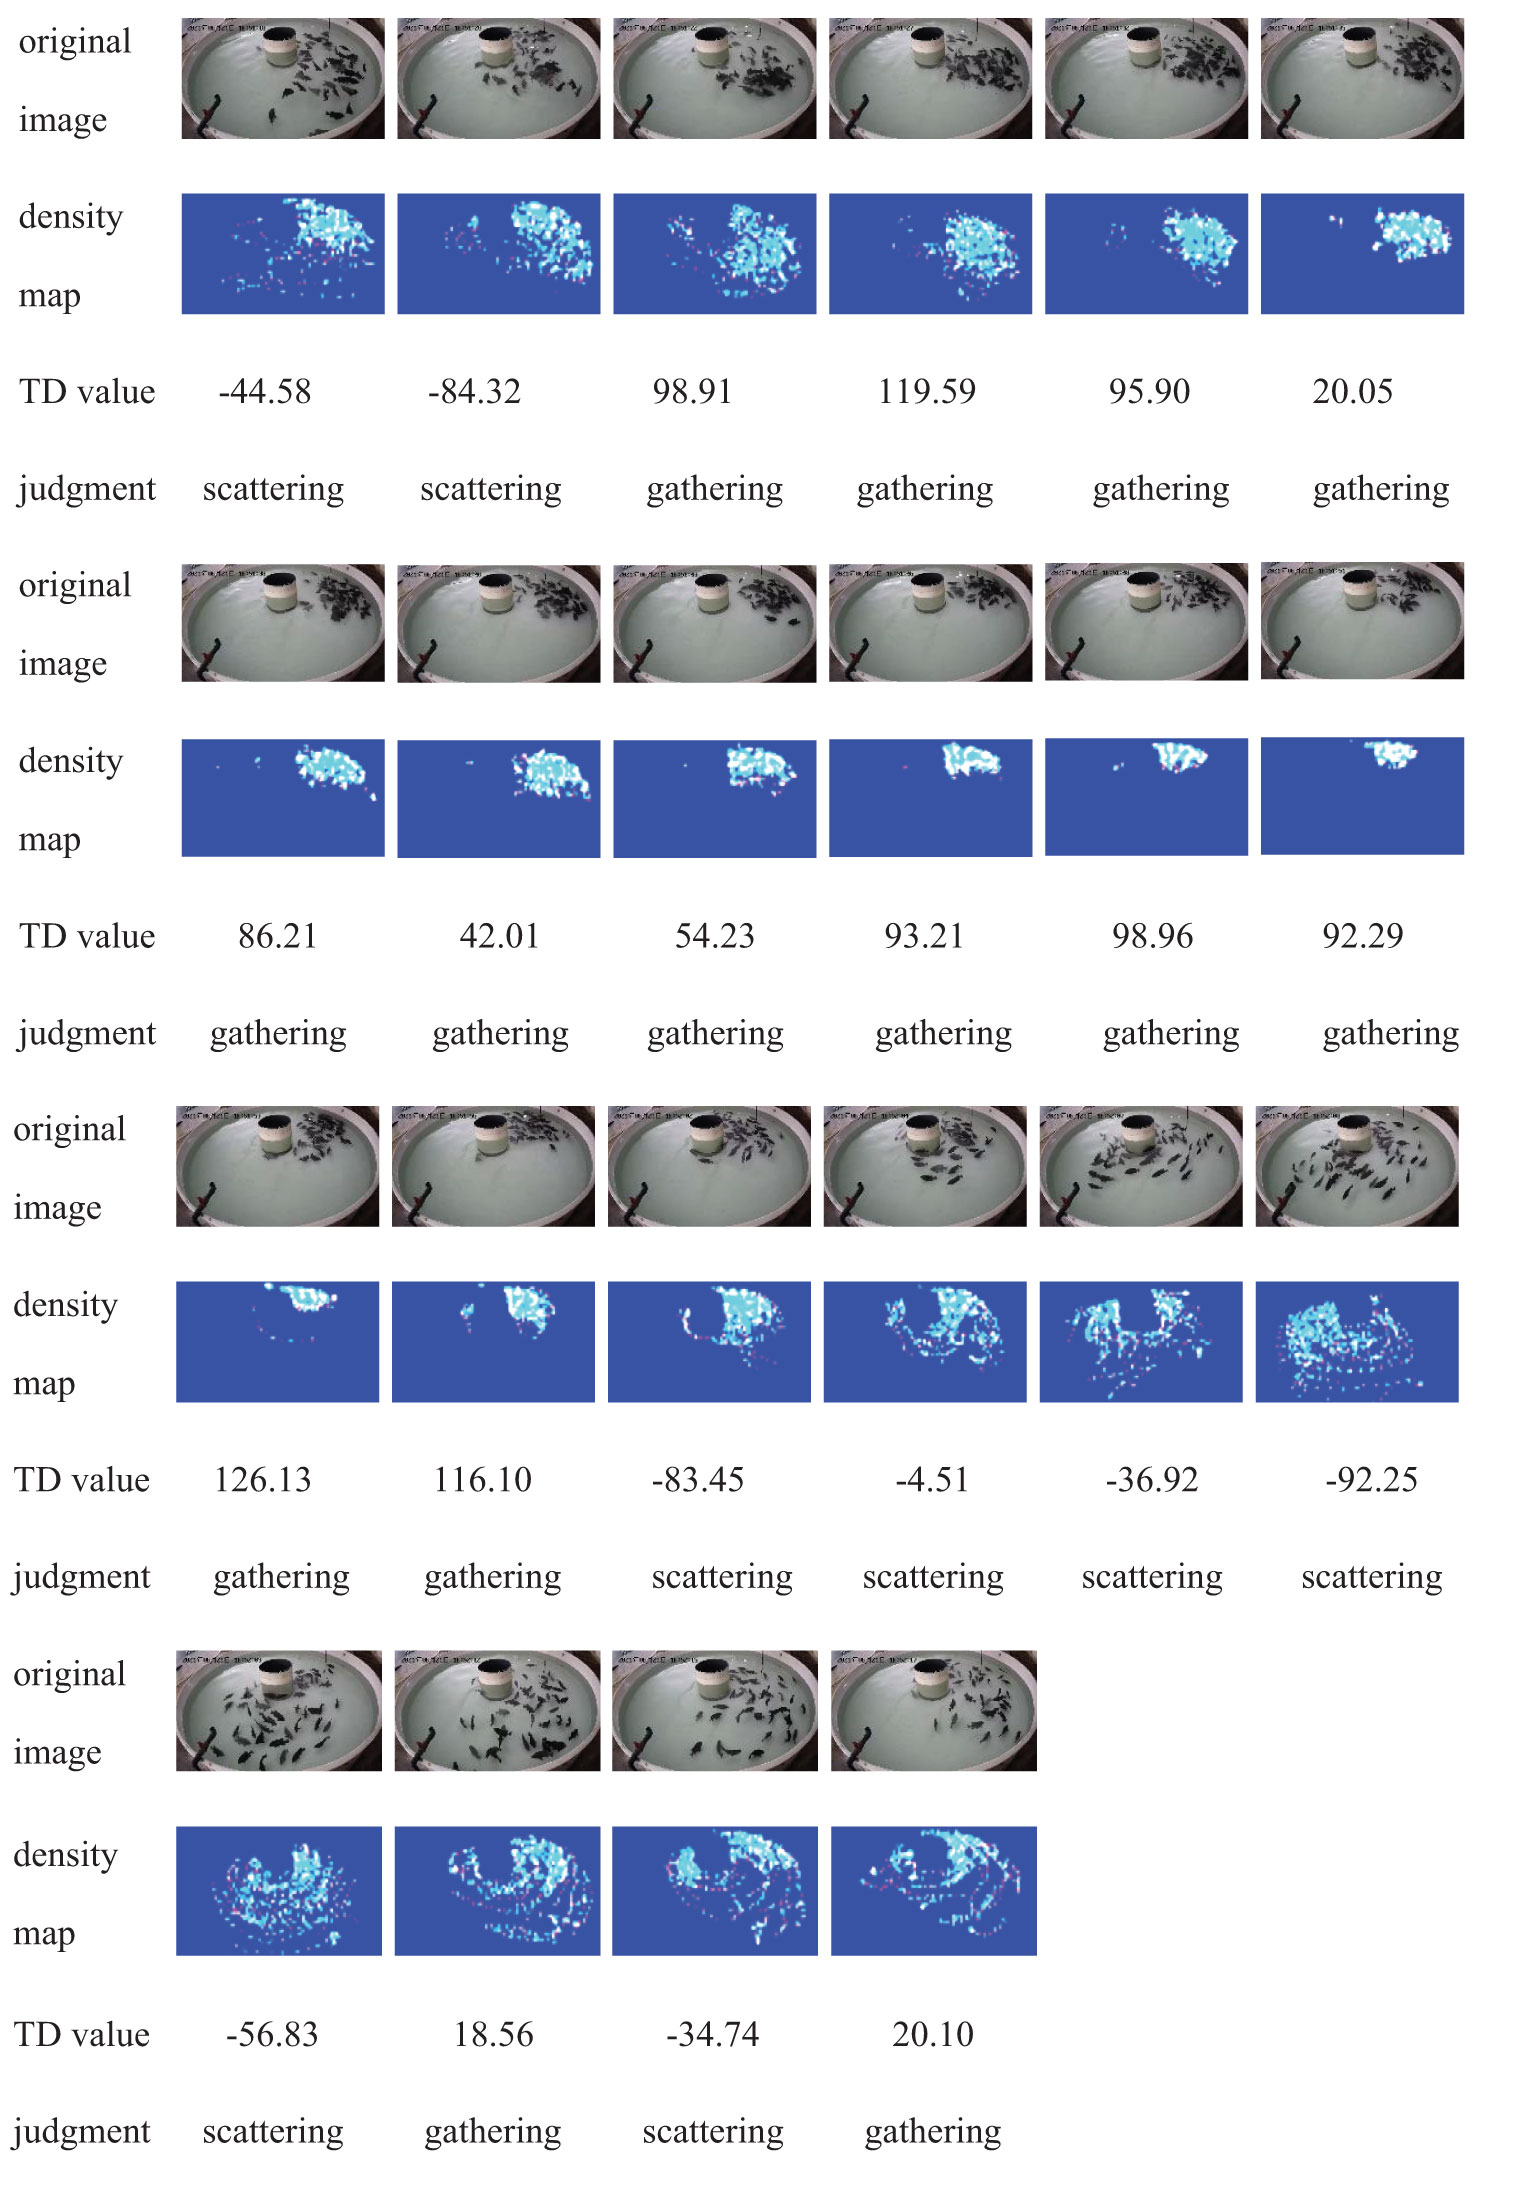
Figure 15 Test results of Cui (Cui et al., 2022) dataset Video 1.
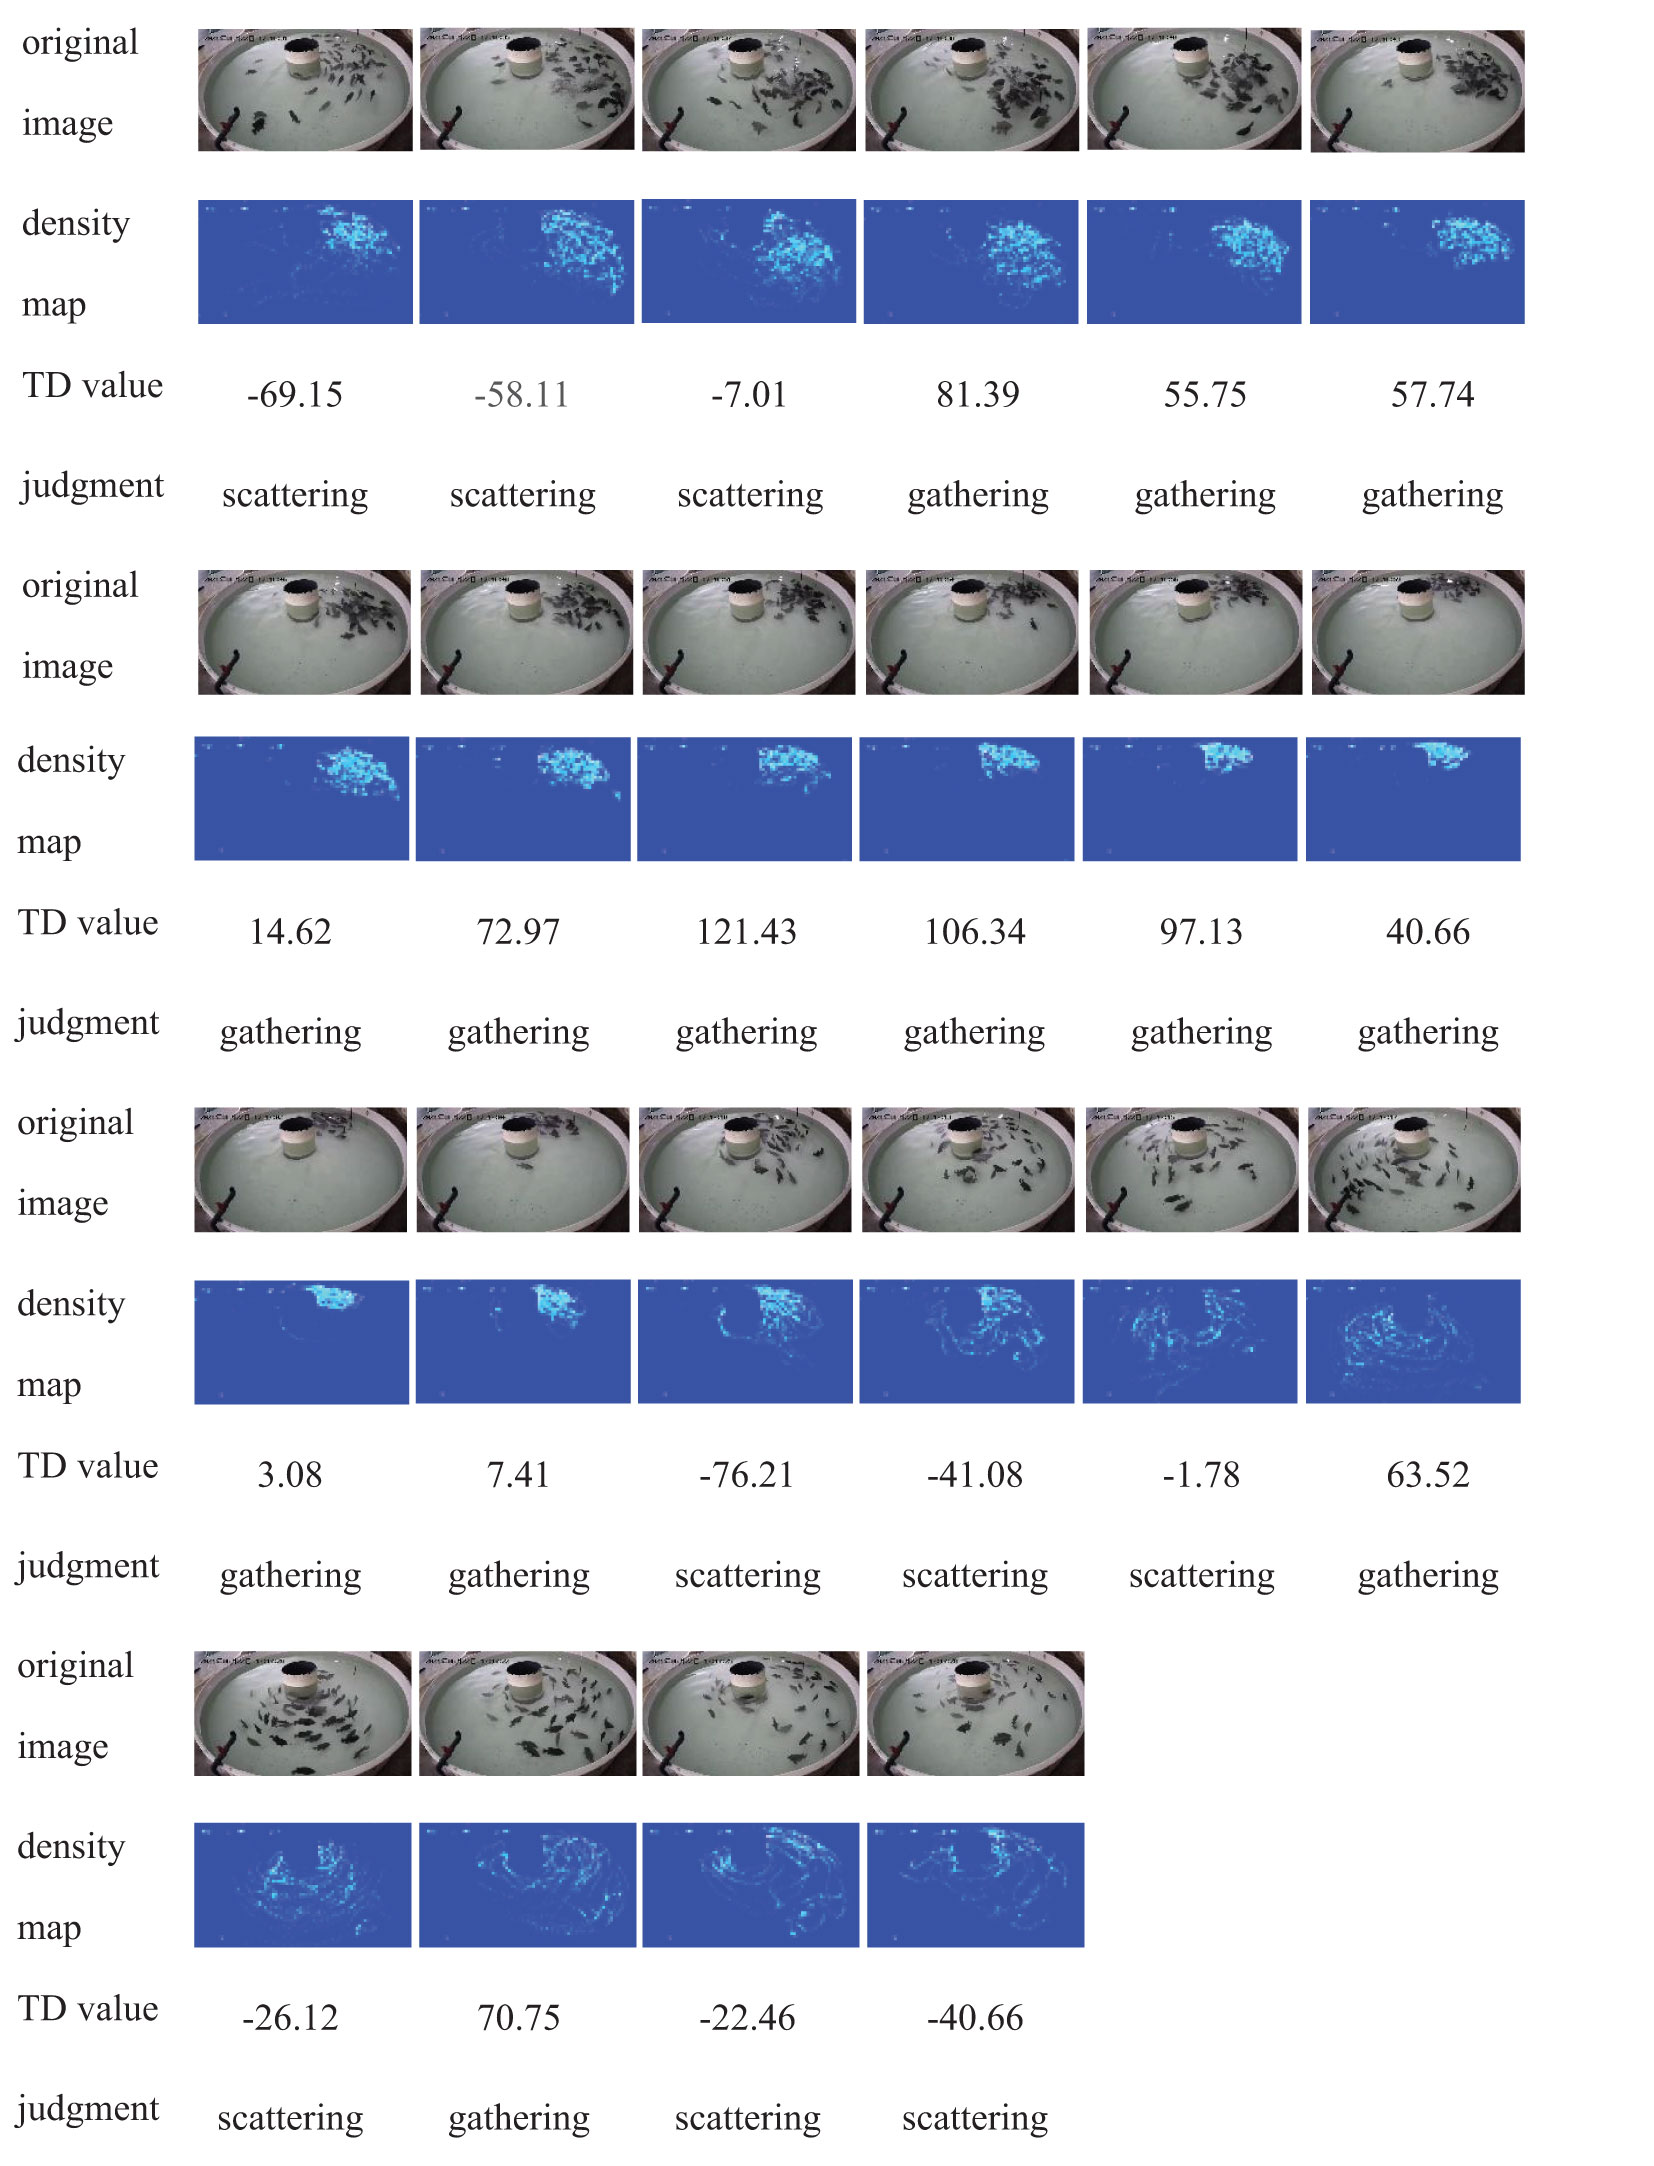
Figure 16 Test results of Cui (Cui et al., 2022) dataset Video 2.
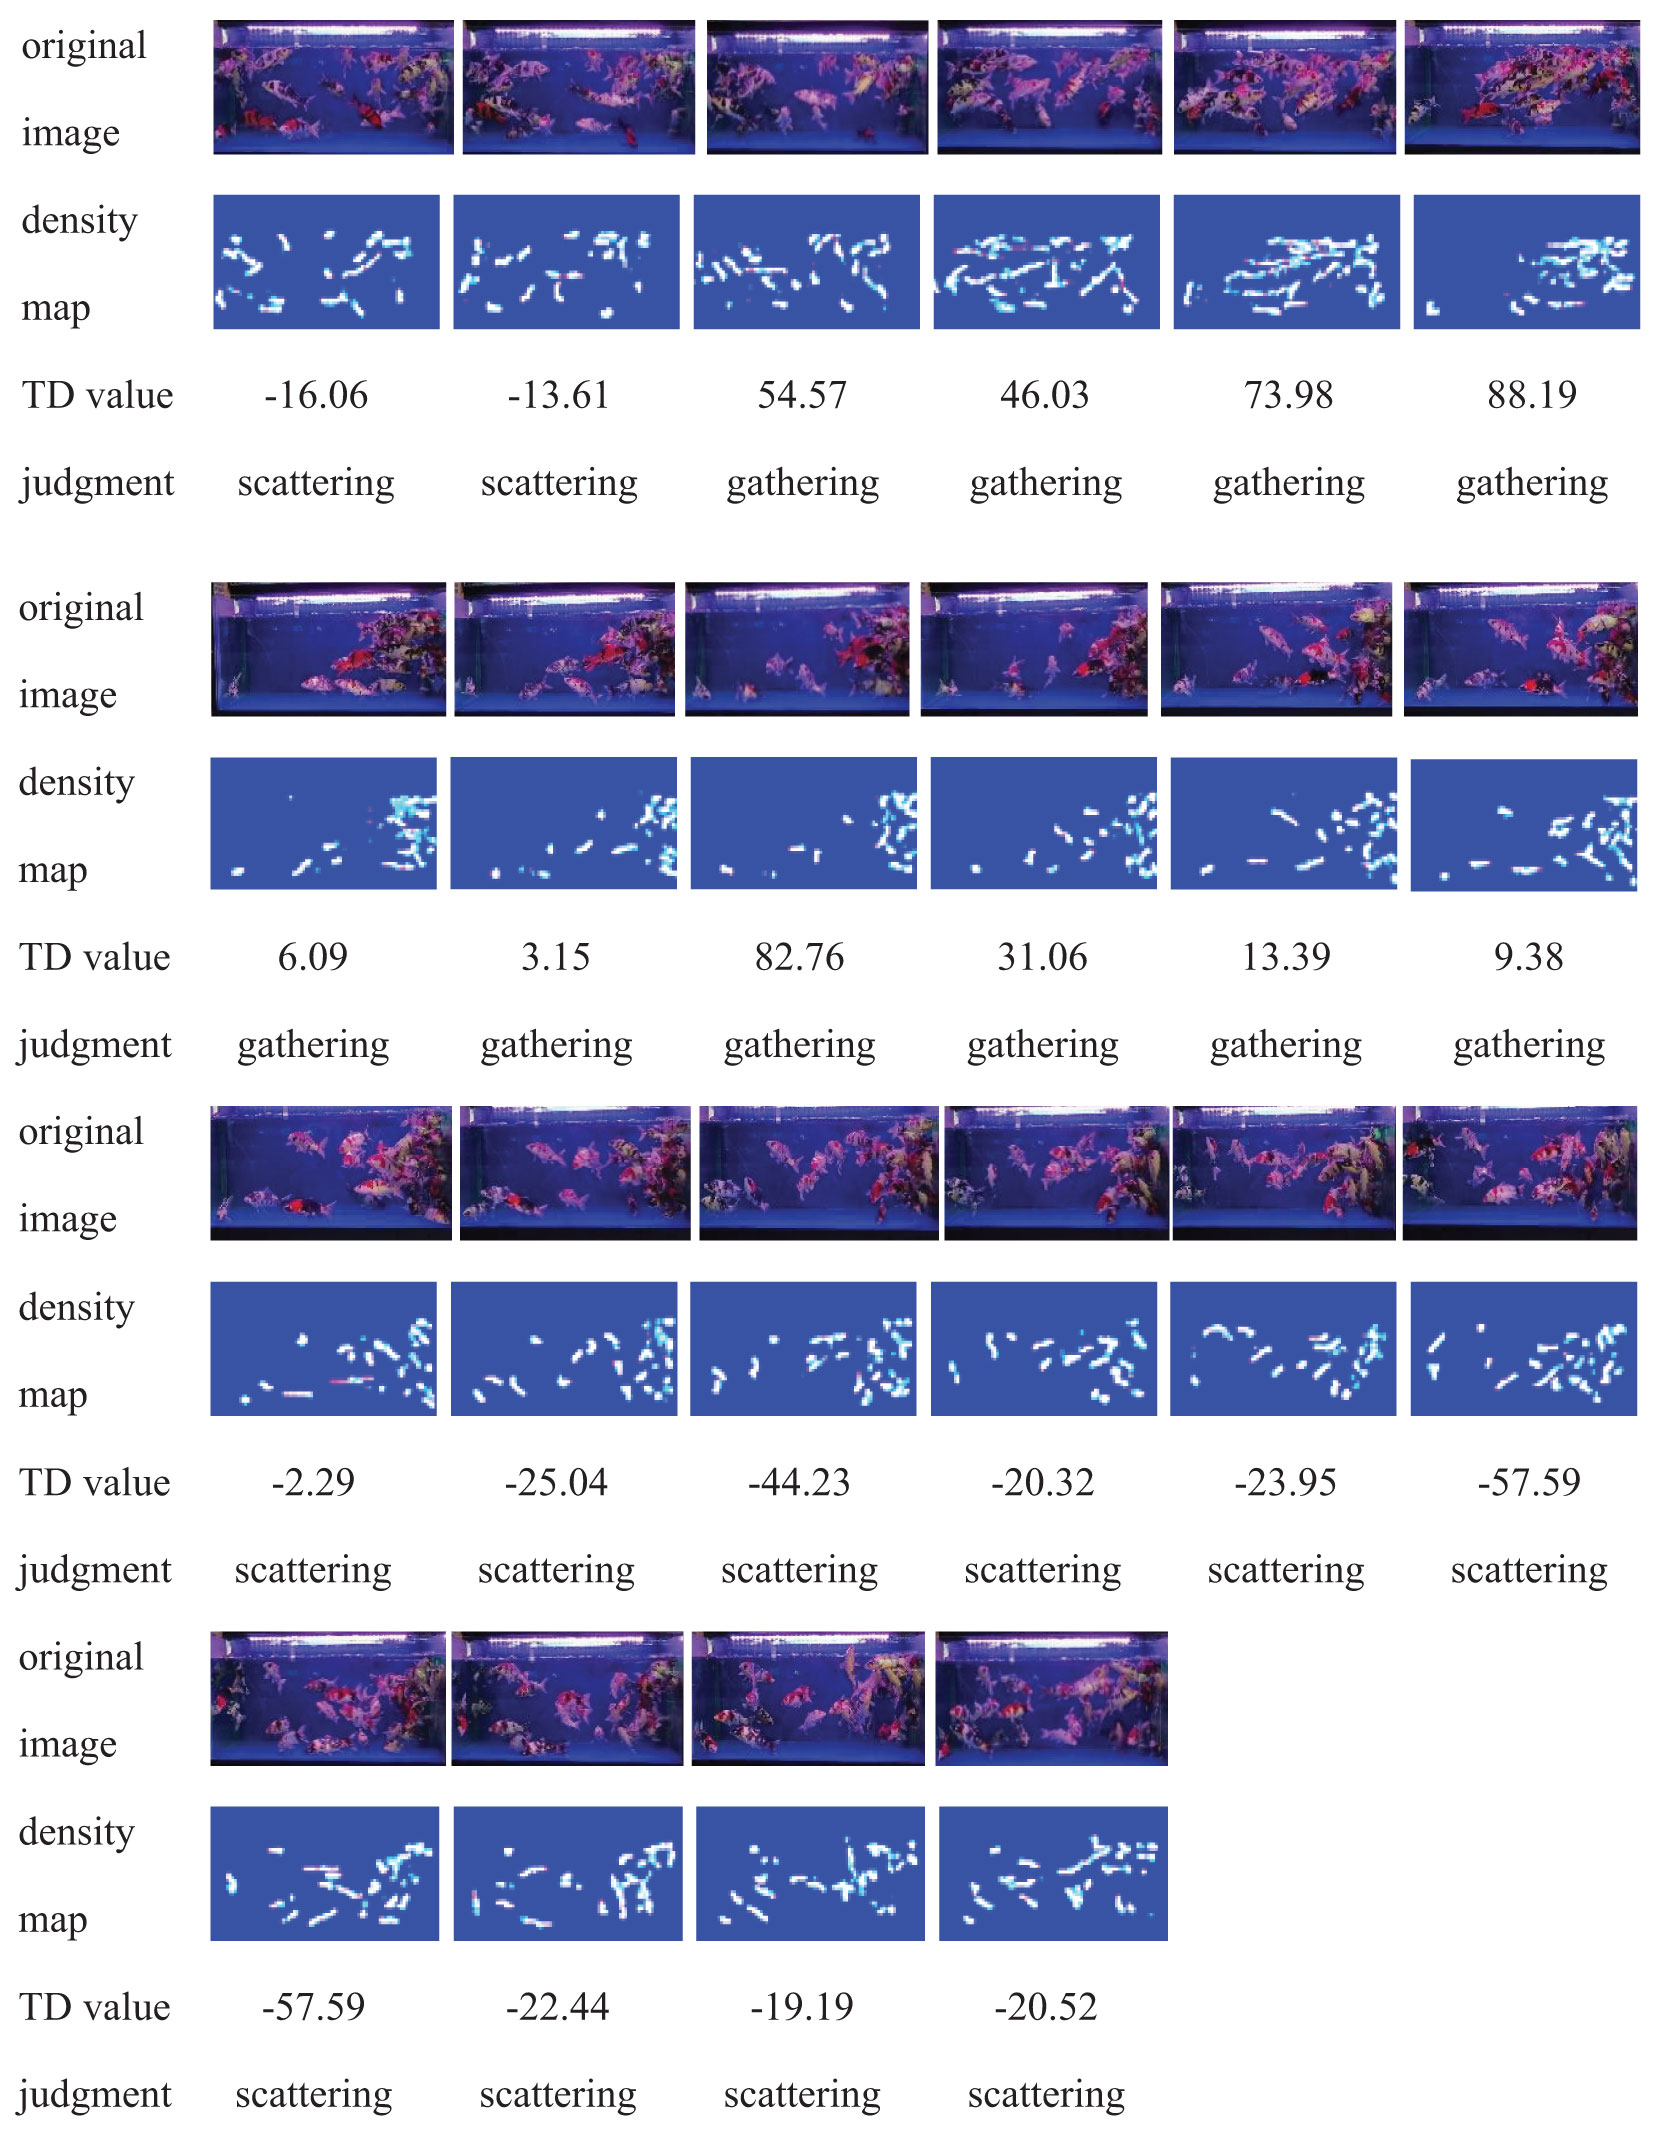
Figure 17 Test results of DlouFishDensity dataset Video 3.
Based on the analysis of the data collected during the experiment, it was observed that a clustering trend in fish density following bait casting may indicate that the fish are in a starvation state. This is because fish tend to gather together in search of food when they are hungry. By analyzing changes in density distribution, we can assess the hunger level of a school of fish and take timely measures for bait casting.
Accordingly, it was found that the FishFeed method can effectively analyze the real-time density distribution of fish with high reliability. The TD value is a robust indicator of the trends and magnitudes in fish density distribution. Monitoring the TD values across various time points reveals post-feeding alterations in fish density, corroborating our observations and analyses, thus affirming the efficacy of the attention mechanism-based intelligent feeding strategy. Employing the TD value as an assessment metric enables precise quantification of the shifts in fish density distribution. Integrating this with the concept of the attention mechanism from deep learning facilitates an enhanced analysis of fish aggregation and dispersion patterns. These results also demonstrate that the intelligent bait casting strategy proposed in this paper combines time factors and density information to accurately infer the starvation state of fish. This provides strong guidance and decision-making support for farmers, ultimately improving the effectiveness of bait casting in fishery production.
Despite not showing significant performance differences in core metrics such as algorithm processing speed and accuracy, the two datasets exhibit distinct characteristics in their spatiotemporal fusion density maps.
Firstly, due to the different shooting angles, there are visual differences in the spatiotemporal fusion density maps of the two datasets. The Cui dataset may focus more on the distribution and density changes of targets on the water surface, while the DlouFishDensity dataset may provide another perspective from a side view. This difference makes the two datasets have different applicable scenarios in practical applications.
Secondly, although the data results are similar in core metrics, the differences in spatiotemporal fusion density maps could also impact the algorithm’s decision-making outcomes. Due to the different presentations of density maps, algorithms may be influenced by varying visual information during analysis and judgment. Therefore, even if the two datasets are similar in terms of algorithm processing speed and accuracy, their decision-making results could differ due to visual disparities.
In algorithm performance testing and evaluation, it is crucial to simulate the transmission and processing environment of real-time video streams, especially for algorithms designed to address real-time issues in practical applications. The reason we converted the videos from Cui dataset and DlouFishDensity dataset into HTTP video streams was precisely because of this consideration. Through this conversion, we can more accurately simulate the complex environment that the algorithm faces in real-world applications, thus evaluating its performance more comprehensively.
In practical applications, video streams are often affected by various factors such as network bandwidth, transmission delays, and packet loss, all of which can significantly impact the algorithm’s real-time performance. By converting datasets into HTTP video streams, we can introduce these practical factors, making the algorithm testing environment closer to real-life scenarios. Such simulation helps us more accurately assess the algorithm’s performance in real-time processing, such as processing speed, stability, and robustness.
Therefore, adopting the method of converting datasets into HTTP video streams not only helps to more accurately evaluate the algorithm’s real-time performance but also provides us with more comprehensive and in-depth algorithm performance analysis results. This will aid us in better optimizing the algorithm, enhancing its performance in practical applications, and offering strong support for research and application in related fields.
In this paper, we introduce a novel approach for analyzing the feeding behavior of fish schools based on density distribution, offering fresh perspectives and methodologies for practical applications in the realm of fish farming. The proposed intelligent bait casting strategy has the potential to enhance the efficiency of fish breeding, minimize bait waste, and reduce costs. Furthermore, by incorporating temporal variations in fish density distribution, we can better align with the ecological needs of fish and foster their growth and well-being. Nevertheless, this strategy necessitates further validation and optimization to accommodate more intricate fish school behavior scenarios and account for other pertinent factors such as environmental influences.
The raw data supporting the conclusions of this article will be made available by the authors, without undue reservation.
The manuscript presents research on animals that do not require ethical approval for their study.
HZ: Writing – original draft, Data curation, Project administration, Software. JW: Funding acquisition, Project administration, Writing – review & editing, Validation. LL: Data curation, Writing – review & editing, Project administration. BQ: Project administration, Validation, Writing – review & editing. JY: Project administration, Validation, Writing – review & editing. HY: Project administration, Writing – review & editing. ZJ: Writing – review & editing, Project administration. CZ: Writing – review & editing, Project administration.
The author(s) declare financial support was received for the research, authorship, and/or publication of this article. This research was funded by the National Key Research and Development Program of China (2021YFB2600200), National Natural Science Foundation of China (31972846), Key Laboratory of Environment Controlled Aquaculture (Dalian Ocean University) Ministry of Education (202205,202315) and Natural Science Foundation of Liaoning Province(2023-MSLH-008). The Key R&D Projects in Liaoning Province (2023JH26/10200015) and General Research Project of Education Department of Liaoning Province (JYTMS20230501).
The authors declare that the research was conducted in the absence of any commercial or financial relationships that could be construed as a potential conflict of interest.
All claims expressed in this article are solely those of the authors and do not necessarily represent those of their affiliated organizations, or those of the publisher, the editors and the reviewers. Any product that may be evaluated in this article, or claim that may be made by its manufacturer, is not guaranteed or endorsed by the publisher.
Atoum Y., Srivastava S., Liu X. (2015). Automatic feeding control for dense aquaculture fish tanks. IEEE Signal Process. Lett. 22, 1089–1093. doi: 10.1109/LSP.2014.2385794
Chen M., Zhang C., Feng G., Chen X., Chen G., Wang D. (2020). Assessment method of fish feeding activity intensity based on feature weighted fusion. J. Agric. Machinery 51, 245–253. doi: CNKI:SUN:NYJX.0.2020-02-027
Cui M., Liu X., Zhao J., Sun J., Lian G., Chen T., et al. (2022). “Fish feeding intensity assessment in aquaculture: A new audio dataset AFFIA3K and a deep learning algorithm,” in 2022 IEEE 32nd International Workshop on Machine Learning for Signal Processing (MLSP). (Xi'an, China: IEEE) 1–6. doi: 10.1109/MLSP55214.2022.9943405
Gkioxari G., Toshev A., Jaitly N. (2016). “Chained predictions using convolutional neural networks,” in European Conference on Computer Vision (Springer, Cham), 728–743.
He J., Huang Z., Song X., Peng L. (2019). Research progress of Fish behavior recognition and quantification based on computer vision technology in aquaculture. Fisheries Modernization 46, 7–14. doi: CNKI:CDMD:2.1012.050526
Hu X., Liu Y., Zhao Z., Liu J., Yang X., Sun C., et al. (2021). Real-time detection of uneaten feed pellets in underwater images for aquaculture using an improved YOLO-V4 network. Comput. Electron. Agric. 185, 106135. doi: 10.1016/j.compag.2021.106135
Hu L., Wei Y., Zheng D., Chen J. (2015). Research on intelligent feeding method based on machine vision. J. Trop. Oceanogr. 34, 90–95. doi: 10.3969/j.issn.1009-5470.2015.04.013
Li D., Wang Z., Wu S., Miao Z., Duan Y. (2020). Automatic recognition methods of fish feeding behavior in aquaculture: A review. Aquaculture 528, 735508. doi: 10.1016/j.aquaculture.2020.735508
Li J., Wu J., Yu H., Zhou Y. (2020). A fish density estimation algorithm based on redundancy pruning. Comput. Digital Eng. 48, 2864–2868, 2911. doi: 10.3969/j.issn.1672-9722.2020.12.012
Li Y., Zhang X., Chen D. (2018). “Csrnet: Dilated convolutional neural networks for understanding the highly congested scenes,” in Proceedings of the IEEE conference on computer vision and pattern recognition. (Salt Lake City, UT, USA: IEEE) 1091–1100. doi: 10.1109/CVPR.2018.00120
Liu Z., Li X., Fan L., Lu H., Liu L., Liu Y. (2014). Measuring feeding activity of fish in RAS using computer vision. Aquacultural Eng. 60, 20–27. doi: 10.1016/j.aquaeng.2014.03.005
Mang Q., Xu G., Zhu J., Xu R. (2022). Developmental status and prospective vision for China’s aquaculture. Fishery Modernization 49, 1–9.
Mu C., Fan L., Liu Y. (2015). Research on residual bait identification in recirculating aquaculture system based on computer vision. Fishery Modernization 42 (2), 33–37. doi: 10.3969/j.issn.1007-9580.2015.02.007
Qiao F., Zheng D., Hu L., Wei Y. (2015). Research on intelligent feeding system based on machine vision real-time decision-making. J. Eng. Design 6), 528–533. doi: 10.3785/j.issn.1006-754X.2015.06.003
Villani C. (2008). Optimal transport: old and new (Berlin: Springer Science & Business Media). Vol. 338, p. 23.
Wang W. (2019). Application of vision technology in aquaculture. Fisheries Rich Guide 525, 28–29. doi: CNKI:SUN:YYZF.0.2019-21-017
Wang B., Liu H., Samaras D., Hoai M. (2020). Distribution matching for crowd counting. Adv. Neural. Inf. Process. Syst., 33, 1595–1607.
Wang Y., Nie Y., Xie C., Shuang F. (2015). Design and Research of intelligent bait casting system for Aquaculture Fish Based on machine Vision. Instrument Technol. 309, 1–4. doi: CNKI:SUN:YBJI.0.2015-01-001
Yang X., Zhang S., Liu J., Gao Q., Dong S., Zhou C. (2021). Deep learning for smart fish farming: applications, opportunities and challenges. Rev. Aquaculture 13, 66–90. doi: 10.1111/raq.12464
Zhang L., Li B., Sun X., Hong Q., Duan Q. (2023). Intelligent fish feeding based on machine vision: A review. Biosyst. Eng. 231, 133–164. doi: 10.1016/j.biosystemseng.2023.05.010
Zhang L., Wang J., Duan Q. (2020). Estimation for fish mass using image analysis and neural network. Comput. Electron. Agric. 173, 105439. doi: 10.1016/j.compag.2020.105439
Zhang L., Wang J., Li B., Liu Y., Zhang H., Duan Q. (2022). A MobileNetV2-SENet-based method for identifying fish school feeding behavior. Aquacultural Eng. 99, 102288. doi: 10.1016/j.aquaeng.2022.102288
Zhao J., Gu Z., Shi M., Lu H., Li J., Shen M. (2016a). Spatial behavioral characteristics and statistics-based kinetic energy modeling in special behaviors detection of a shoal of fish in a recirculating aquaculture system. Comput. Electron. Agric. 127, 271–280. doi: 10.1016/j.compag.2016.06.025
Zhao J., Zhu S., Ye Z., Liu Y., Li Y., Lu H. (2016b). Research on evaluation method of feeding activity intensity of swimming fishes in recycling aquaculture. Trans. Chin. Soc. Agric. Machinery 47, 288–293. doi: 10.6041/j.issn.1000-1298.2016.08.038
Zheng J., Zhao F., Lin Y., Chen Z., Gan Y., Pang B. (2021). Real-time measurement of feeding intensity in swimming fish based on near-infrared depth maps. J. Shanghai Ocean Univ. 30, 1067–1078. doi: 10.12024/jsou.20200703116
Zhou C., Xu D., Chen L., Zhang S., Sun C., Yang X., et al. (2019). Evaluation of fish feeding intensity in aquaculture using a convolutional neural network and machine vision. Aquaculture 507, 457–465. doi: 10.1016/j.aquaculture.2019.04.056
Keywords: computer vision, deep learning, intelligent feeding, fish feeding behavior, fish density distribution
Citation: Zhao H, Wu J, Liu L, Qu B, Yin J, Yu H, Jiang Z and Zhou C (2024) A real-time feeding decision method based on density estimation of farmed fish. Front. Mar. Sci. 11:1358209. doi: 10.3389/fmars.2024.1358209
Received: 19 December 2023; Accepted: 26 March 2024;
Published: 15 April 2024.
Edited by:
Chao Zhou, Beijing Research Center for Information Technology in Agriculture, ChinaReviewed by:
Shahbaz Gul Hassan, Zhongkai University of Agriculture and Engineering, ChinaCopyright © 2024 Zhao, Wu, Liu, Qu, Yin, Yu, Jiang and Zhou. This is an open-access article distributed under the terms of the Creative Commons Attribution License (CC BY). The use, distribution or reproduction in other forums is permitted, provided the original author(s) and the copyright owner(s) are credited and that the original publication in this journal is cited, in accordance with accepted academic practice. No use, distribution or reproduction is permitted which does not comply with these terms.
*Correspondence: Junfeng Wu, d3VqdW5mZW5nQGRsb3UuZWR1LmNu
Disclaimer: All claims expressed in this article are solely those of the authors and do not necessarily represent those of their affiliated organizations, or those of the publisher, the editors and the reviewers. Any product that may be evaluated in this article or claim that may be made by its manufacturer is not guaranteed or endorsed by the publisher.
Research integrity at Frontiers
Learn more about the work of our research integrity team to safeguard the quality of each article we publish.