 Ziang Li
 Chuning Wang
 Meng Zhou
- 1School of Oceanography, Shanghai Jiao Tong University; Key Laboratory of Polar Ecosystem and Climate Change, Ministry of Education, Shanghai, China
- 2Shanghai Key Laboratory of Polar Life and Environment Sciences, Shanghai Jiao Tong University, Shanghai, China
- 3Key Laboratory for Polar Science, Polar Research Institute of China, Ministry of Natural Resources, Shanghai, China
The Amundsen Sea of West Antarctica is one of the regions of particularly interest to the oceanography community due to accelerated basal melting of its ice shelves. Quantitative estimates of the composition of water masses and their sources are essential for understanding the heat and salt budgets and the stability of ice shelves in this region. In this study, the water mass distributions on the Amundsen Sea continental shelf are estimated based on FOAM-GLOSEA5v13, a global oceanographic reanalysis product, using a modified statistical based optimal water mass analysis method. The reanalysis product effectively captures the signal of primary water masses, including the Winter Water (WW) and the Circumpolar Deep Water (CDW) below the Antarctic Summer Surface Water (SSW). The horizontal and vertical distributions and temporal evolution of three water mass endmembers (WW, CDW and DSW) and their mixing ratios are calculated, based on which an intrusion location detection method was established. Using the reanalysis product and intrusion detection method, all potential CDW intrusion sites along the shelf break are identified. Based on the reanalysis product, an intrusion site over the shelf break, away from major deep troughs was captured and confirmed by numerical particle tracking experiments.
1 Introduction
The West Antarctic Ice Sheet (WAIS) in the Amundsen Sea section is currently experiencing a rapid melting phase. Results from previous studies suggest that the complete collapse of WAIS could result in a global sea level rise of 3.3 m (Bamber et al., 2009). Approximately 35% of the WAIS drains into the Amundsen Sea (Smith, 2012), a marginal sea that spans over longitudes between 130°W and 100°W of the Southern Ocean. The complete collapse of all ice shelves in the Amundsen Sea could result in a global sea-level rise of 1.5 m (Vaughan, 2008). The continental shelf of the Amundsen Sea is featured by a wider middle region with meridional width over 400 km, and narrower east and west sides with the narrowest part less than 50 km (Figure 1). The bottom bathymetry of the Amundsen Sea continental shelf is characterized by various sea troughs. These troughs are deeper towards the southern side, capable of transporting warmer and saltier waters off the shelf to the immediate vicinity of the ice shelves (Walker et al., 2007; Nakayama et al., 2019). Thus, these ice shelves in the Amundsen Sea are particularly vulnerable to the warm water transportation through these troughs (Walker et al., 2013; Nakayama et al., 2018), where the basal meting rates can reach 4.3-17.7 m year-1 (Rignot et al., 2013).
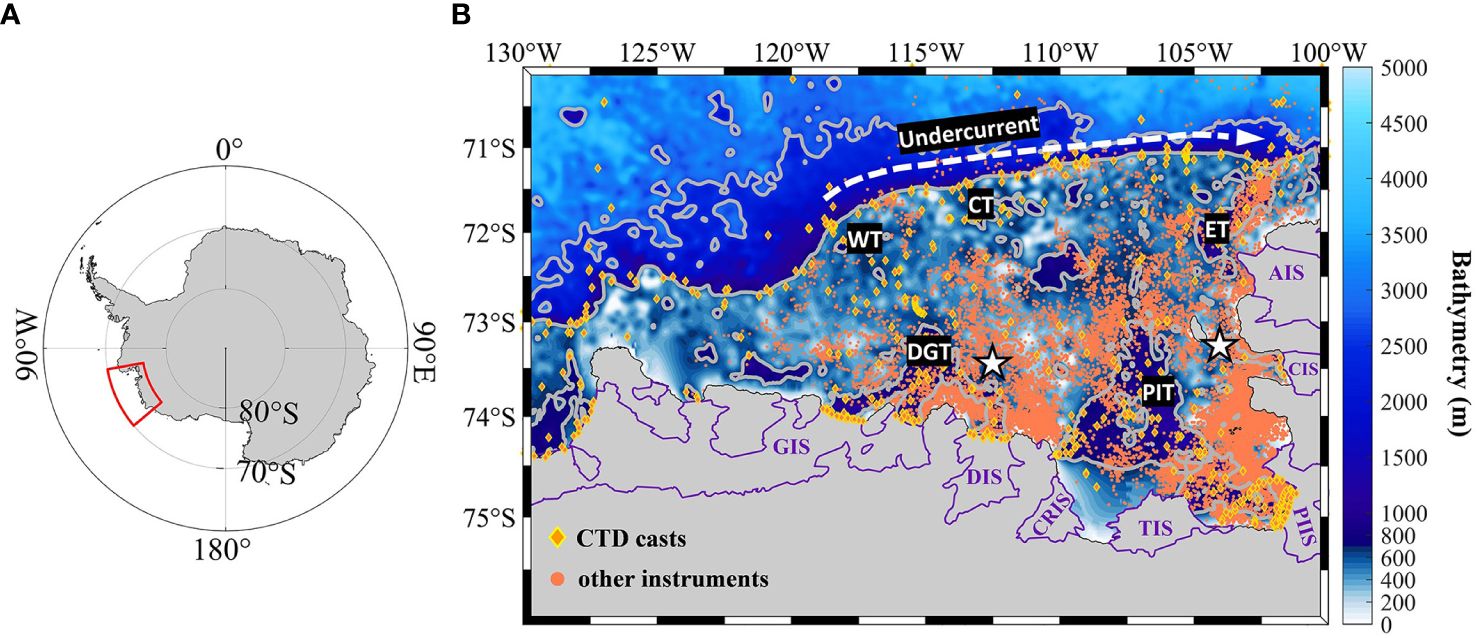
Figure 1 Bathymetry of the Amundsen Sea and its vicinity from the ETOPO 1 dataset (Amante and Eakins, 2009). (A) The Southern Ocean with the red box enclosing the Amundsen Sea; and (B) bathymetry of the Amundsen Sea. The gray contours are 700 m and 2600 m isobaths, which are selected to present the edges of continental shelf break and the northern edge of Amundsen Sea Embayment, respectively. DGT, PIT, WT, CT, ET, GIS, DIS, CRIS, TIS, PIIS, CIS and AIS denote the locations of Dotson-Getz Trough, Pine Island Trough, Western Trough, Central Trough, Eastern Trough, Getz Ice Shelf, Dotson Ice Shelf, Crosson Ice Shelf, Thwaites Ice Shelf, Pine Island Ice Shelf, Cosgrove Ice Shelf and Abbot Ice Shelf, respectively. The two white pentagrams represent the position of Amundsen Polynya and Pine Island Bay Polynya from west to east (Arrigo and Dijken, 2003). Yellow diamonds and orange dots are the profiling locations of CTD and other instruments in World Ocean Database (WOD) (Boyer et al., 2018), respectively.
Results from previous studies found 3 major water masses over the Amundsen Sea continental shelf: Antarctic Summer Surface Water (SSW), Winter Water (WW) and Circumpolar Deep Water (CDW) (Hellmer, 1996; Wåhlin et al., 2010; Narayanan et al., 2019). In addition to these major components, other water masses of smaller volume, such as Ice Shelf Water (ISW), also present on the continental shelf. Like most parts of the Southern Ocean, surface water masses in the Amundsen Sea continental shelf show strong seasonal variability. SSW is only found in the surface ocean (top 50 m) during summer, with potential temperature greater than -1.5°C, and is mainly formed from atmospheric heating and negative salt flux from melting of sea ice (Walker et al., 2013). Since surface heating and ice melting vary greatly over seasons and short time scales, salinity and temperature of SSW scatter widely on a Temperature-Salinity (T-S) diagram. During winter seasons, temperature of surface water drops below -1.5°C, and SSW transforms to WW due to the reversed surface heat flux. Due to its overall low buoyancy, WW can be mixed to depths greater than 200 m. During summer, WW vanishes in the ocean surface and becomes the remnant memory of surface WW from the previous winter. Over the Amundsen Sea continental shelf, WW exists year-round at sub-surface and can be found at depth over 400 m (Wåhlin et al., 2010), with a characteristic salinity of 34.0 PSU and potential temperature below -1.5°C (Walker et al., 2013).
Below the main thermocline in Amundsen Sea, CDW is the most extensive which is also by volume the largest water mass of the Southern Ocean. It is characterized by potential temperature of 1.6-2.0°C and salinity greater than 34.6 PSU (Walker et al., 2013), and has a neutral density of 28.00-28.27 kg m-3 in Amundson Sea (Whitworth et al., 1985). Depending on small variation in water characteristics, CDW can be divided into the upper CDW (UCDW) and lower CDW (LCDW). UCDW is characterized by slightly higher temperature and occupies shallower depths (above 550 m) (Moffat et al., 2009), while LCDW is characterized by salinity greater than 34.72 PSU and occupies greater depths. And they can sometimes be found in the depths of troughs on the shelf (Walker et al., 2013). As CDW crosses the continental shelf break, it gradually mixes with local water masses and becomes colder and fresher, forming the modified CDW (mCDW). Over the Amundsen Sea continental shelf, mCDW is the most prominent water type below the depth of 300 m, and is observed frequently in the deeper parts of troughs (Walker et al., 2013). Dense Shelf Water (DSW) is an important water mass in the Antarctic marginal seas, which is characterized by low temperature (-1.8~-1.9°C), high salinity (>34.5 PSU), and neutral density greater than 28.27 kg m-3 (Williams et al., 2016). However, there is currently no direct evidence of its presence in the Amundsen Sea. Key water mass characteristics mentioned in this Section are summarized in Table 1.

Table 1 Characteristics of water masses used in study.
The intrusions of CDW on the Amundsen Sea continental shelf are critical to accelerate melting and disintegration of ice shelves (Lars and Isabella, 2021; Wang et al., 2023). CDW typically crosses the Amundsen Sea continental shelf break through the positions near 3 major deep troughs, including the Western Trough (WT) near 118°W, Central Trough (CT) near 113°W and Eastern Trough (ET) near 103°W (Kim et al., 2017; Azaneu et al., 2023). Local wind patterns are considered to be one of the key contributors to the CDW intrusion intensity over the Amundsen Sea continental shelf (Thoma et al., 2008). The westward and southward migration of the Amundsen low pressure center makes prevailing wind over the continental shelf break shifting from easterlies to westerlies, which causes strong horizontal shear between the along-slope currents and results in increased CDW intrusion (Thoma et al., 2008; Narayanan et al., 2019). In addition to surface winds, the CDW intrusion intensity can be affected by several processes such as the eastward undercurrent along the shelf break (Walker et al., 2013), eddy transports (Adcock and Marshall, 2000), topographic effects (Klinck, 1996; Dinniman and Klinck, 2004), and the Ekman layer dynamics (Wåhlin et al., 2012). These complex mechanisms control the intrusions of CDW onto the shelf and the mixing of CDW with other water masses.
In this work, the global reanalysis product FOAM-GLOSEA5v13 is used to analyze spatial and temporal distributions of water mass compositions and sites of CDW intrusions across the continental shelf break, and a statistical optimal multiparameter analysis method was employed to quantify water mass composition and the mixing processes between water masses.
2 Materials and methods
2.1 In-situ measurements and reanalysis products
Data of in-situ potential temperature and salinity measurements on the Amundsen Sea continental shelf are acquired from the World Ocean Database (WOD) (Boyer et al., 2018). A total of 21,441 profiling casts are extracted from the data archive, including 19,505 Autonomous Pinniped profiles, 1,023 Sea Glider profiles, 621 CTD casts, and 292 casts from other platforms. The profiles contain 1,153,436 potential temperature-salinity (-) data pairs, which are used to identify water masses as shown in Figure 2. These in-situ measurements span over 123 years since the 1890s, of which 98.71% are taken after year 2000; most of CTD casts (60.48%) are taken during summer months (December-February), while in winter months in-situ measurements are relatively sparse. Due to previous research interest, the spatial data density is higher over the continental shelf break, in the deep troughs and near the ice shelf edge than that of other shelf areas.
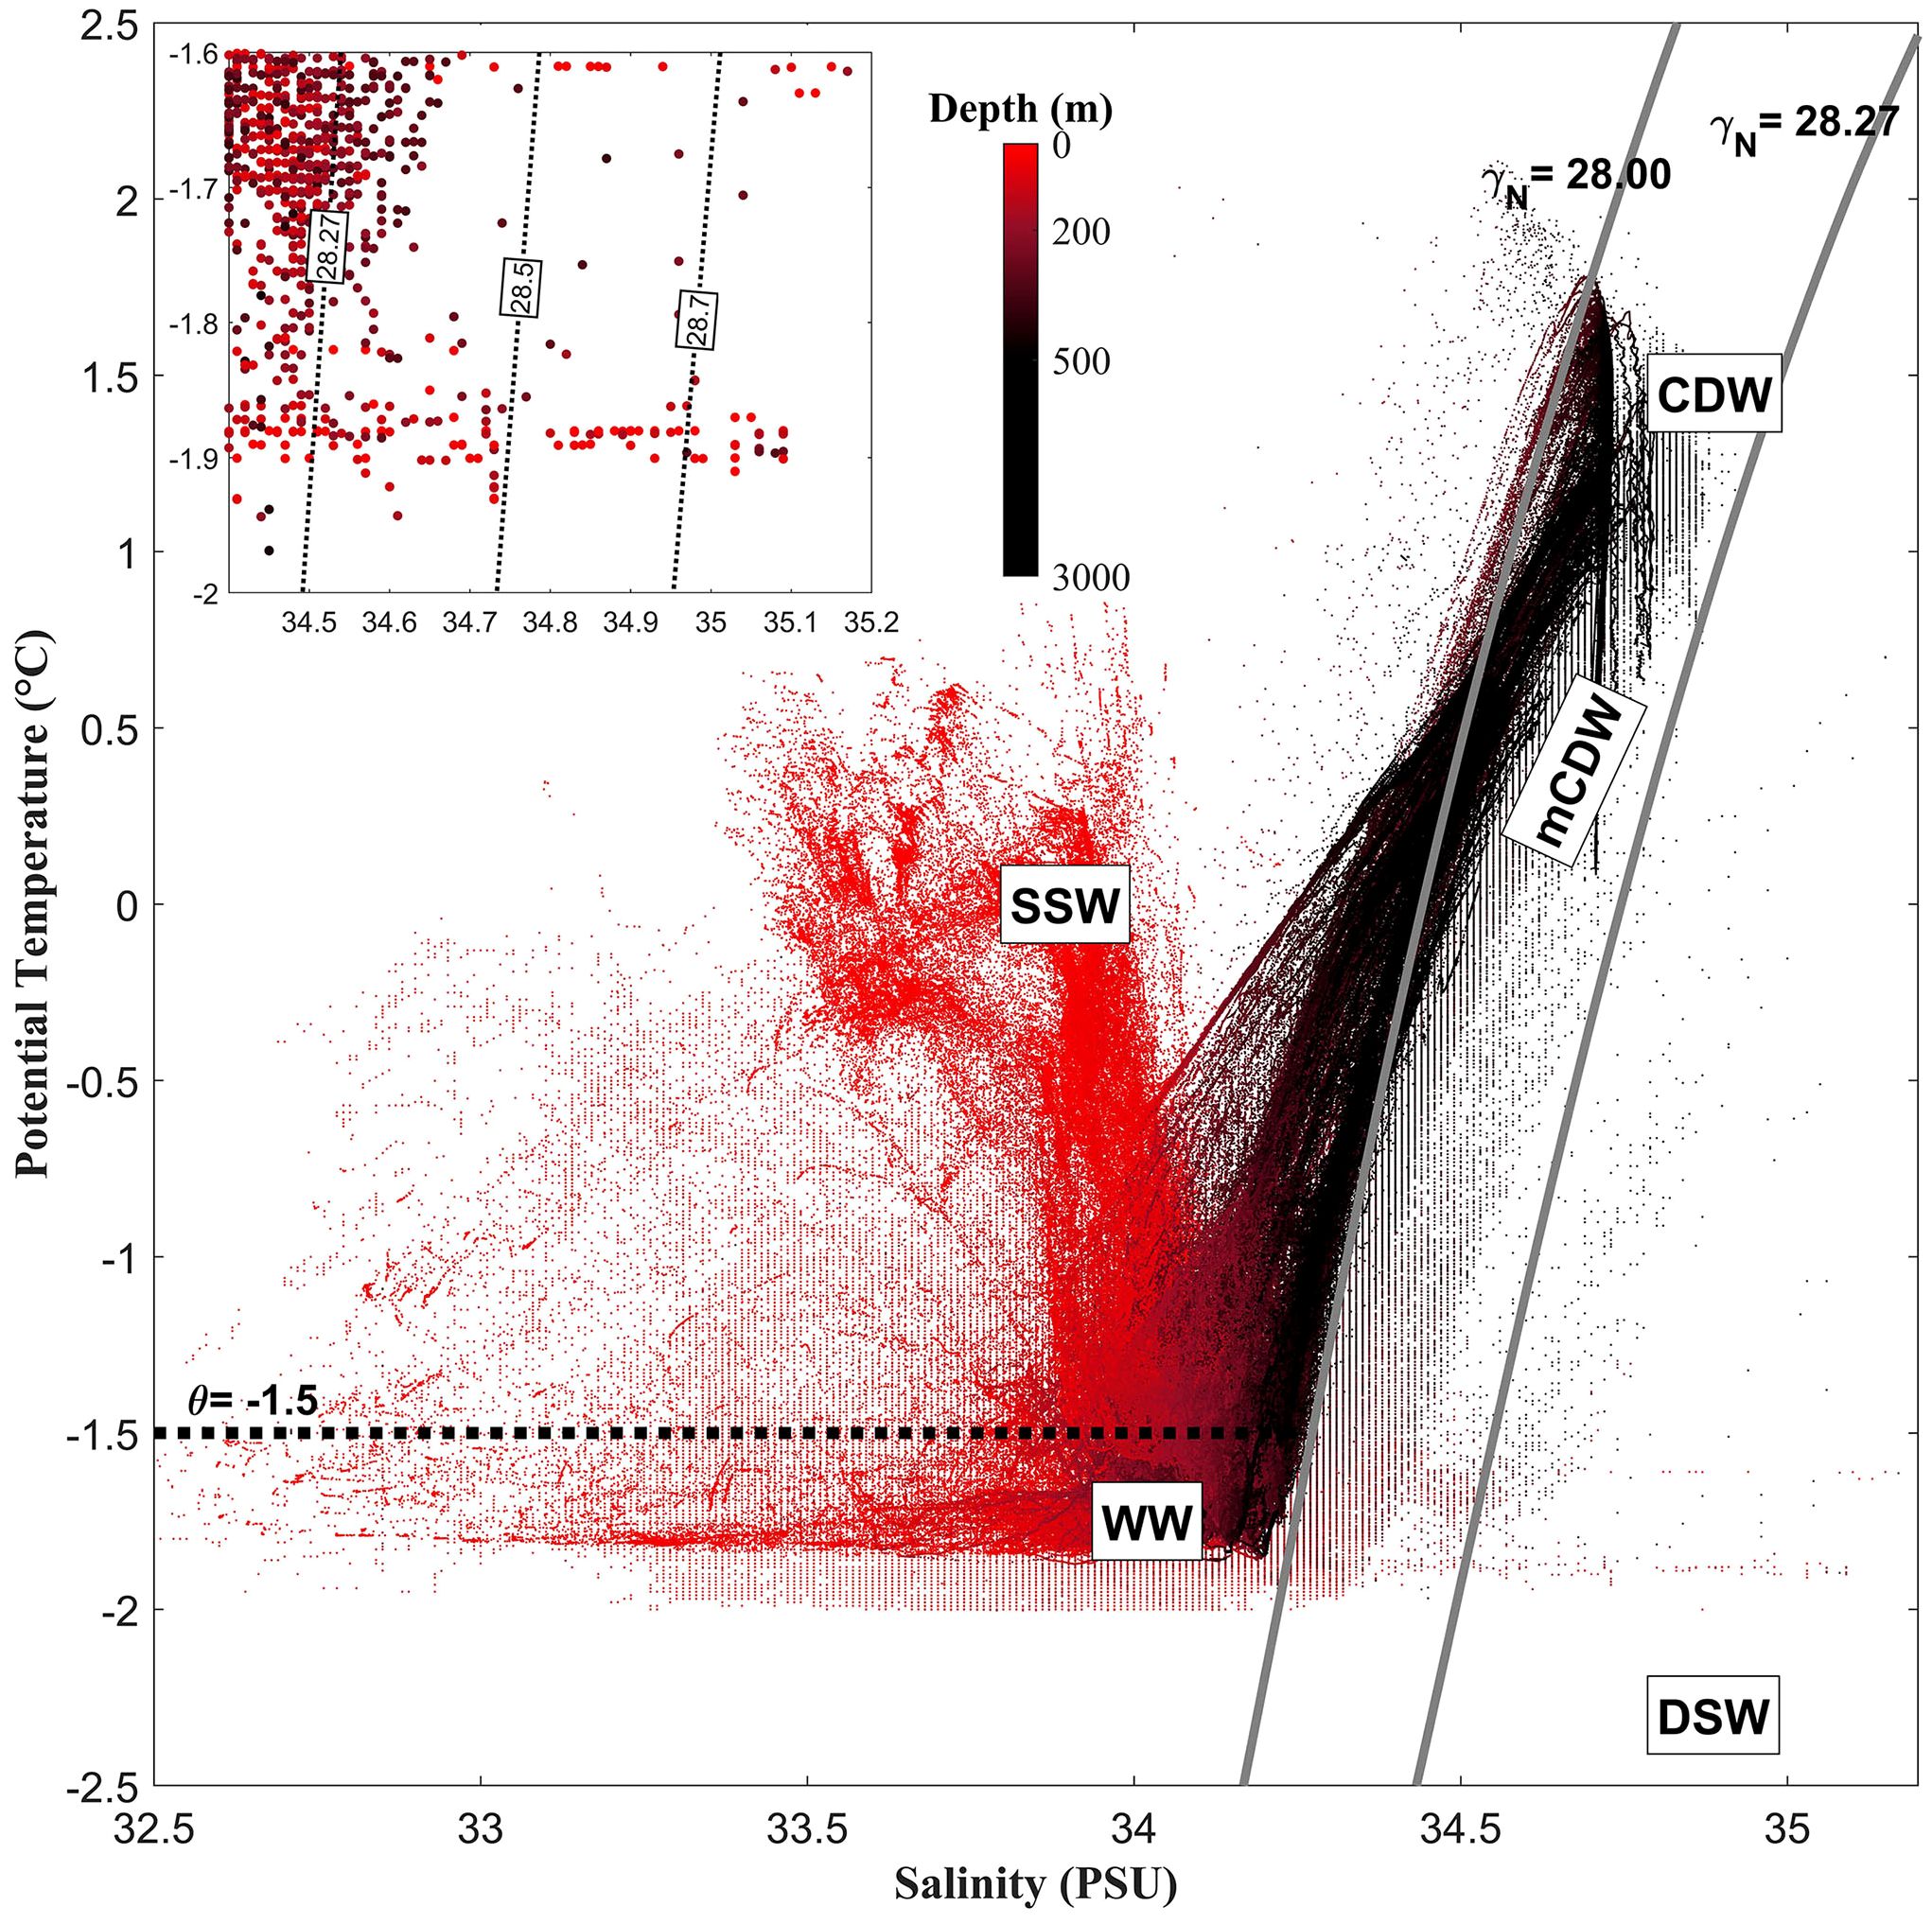
Figure 2 Potential temperature-Salinity (- ) scatter diagram of World Ocean Database in-situ measurements on the Amundsen Sea between 130°W and 100°W. The upper left panel is the zoomed in scatter near the DSW endmember. Gray lines are neutral density contours.
Since the WOD dataset is limited in both seasonal and spatial coverages while ocean reanalysis products provide high-resolution, gridded hydrographic datasets, a combination between in-situ and reanalysis datasets can be used for long-term, high resolution water mass map reconstruction. The reanalysis products used in this work are part of the Global Ocean Reanalysis Multi-Model Ensemble Products (GREP), which is publicly available from Copernicus Marine Environment Monitoring Service (CMEMS; https://data.marine.copernicus.eu/product/GLOBAL_REANALYSIS_PHY_001_031). This ensemble contains 4 global ocean reanalysis products, C-GLORS (hereinafter CGLO), FOAM-GLOSEA5v13 (hereinafter FOAM), GLORYS2V4 (hereinafter GLOR) and ORAS5 (hereinafter ORAS). The products cover temporal period between 1993 and 2020, and has a uniform horizontal resolution of 1/4° and 75 levels in vertical direction.
In order to assess the data quality of each product, a direct comparison with in-situ hydrographic CTD measurements from the WOD database is carried out. A total number of 621 CTD profiles within the research site (Figure 1) are used for comparison. The mean profiles of potential temperature and salinity along with their standard deviation of data misfit are calculated for all 4 reanalysis products (Figure 3). To take the traditional definition of the mixed layer depth as the depth with a temperature difference of 0.2°C from the near-surface value at 10 m (Montégut et al., 2004), the mixed layer depth in GREP sub-datasets is shallower than the observed value, but their overall vertical structure shows reasonable agreement. The WW minimum temperature at subsurface (100 m) in the observation is not well predicted by the GREP products, where the simulated temperature is slightly higher than observed value. Among all 4 sub-datasets, FOAM shows the best fit to the observations in terms of temperature and salinity mean profiles (Figures 3A, C). Even though FOAM’s model misfit standard deviation is not constantly lowest at all depths, it is still lower than the other three at depths of 300-600 m (Figures 3B, D), where the CDW layer resides.
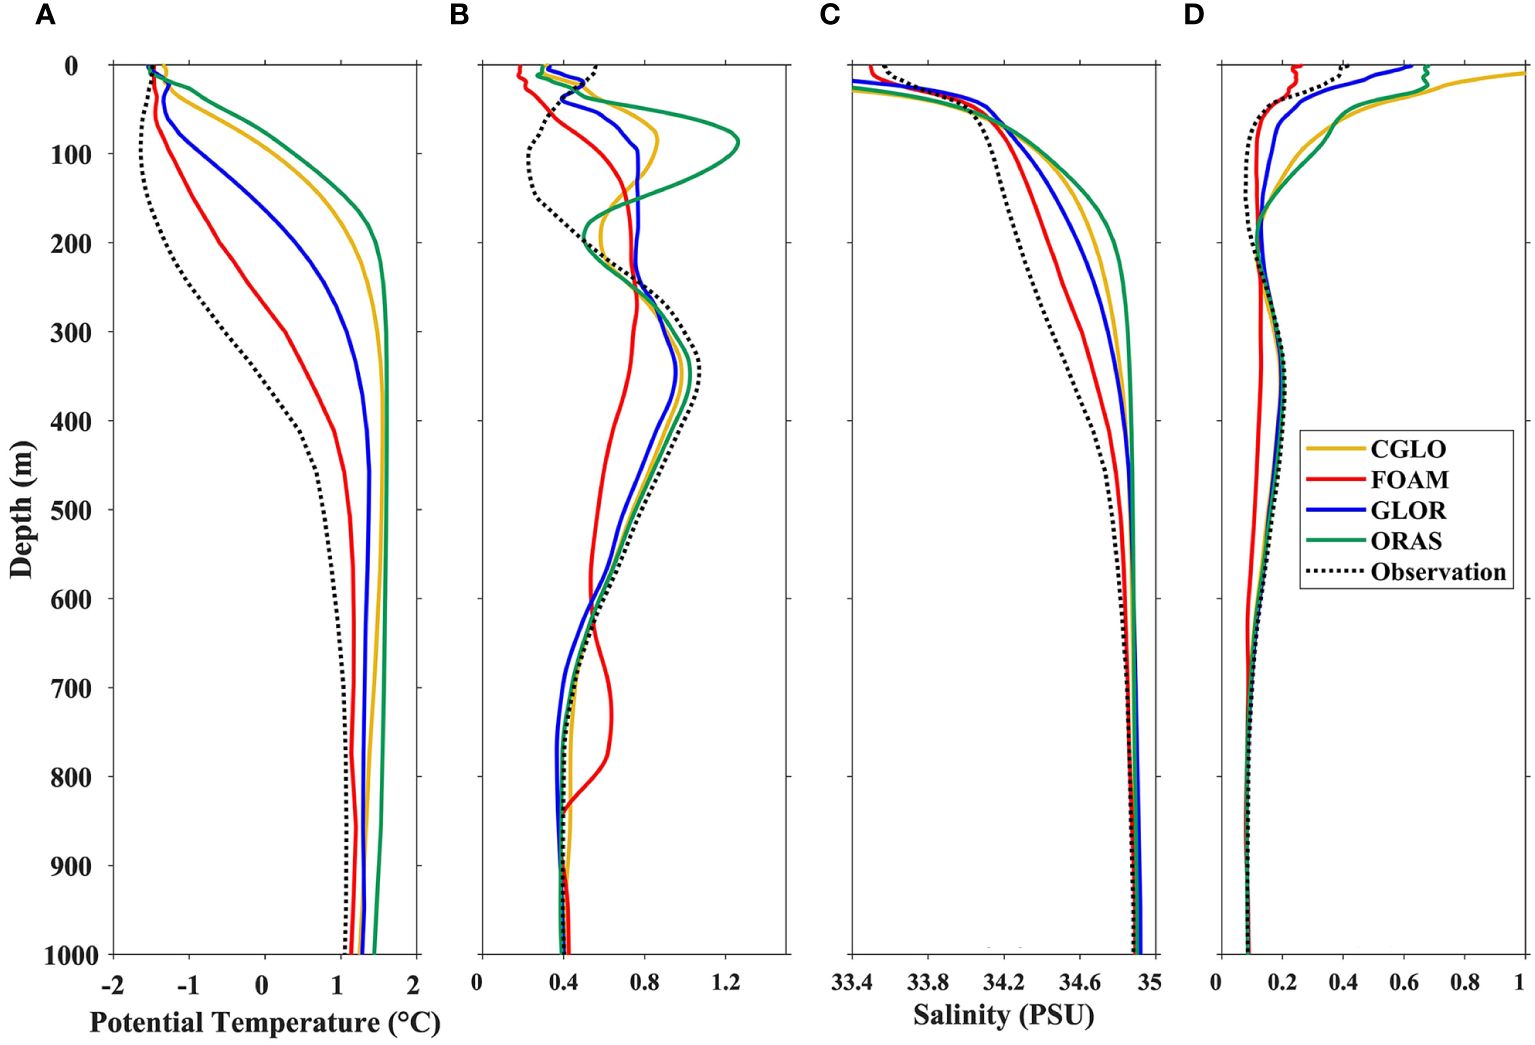
Figure 3 Comparison of GREP reanalysis products with in-situ CTD observations. (A, C) Mean profiles of potential temperature (A) and salinity (C) over the top 1000 m. Black dashed lines denote the WOD observation while colored lines denote the 4 reanalysis sub-datasets. (B, D) Profiles of model misfit standard deviation of temperature (B) and salinity (D). The model misfit standard deviation is defined as , where . The standard deviation of WOD observation is denoted as the black dashed lines.
Since the bathymetry data used by FOAM cannot fully resolve the complex topographic features of the continental shelf and slope and its numerical kernel does not contain the computation of ice shelf thermodynamics, the accuracy of FOAM’s simulated hydrographic and velocity fields could be affected by these weaknesses, thus needs to be evaluated in more detail using in-situ measurements. In order to validate FOAM’s temperature and salinity fields along the continental shelf and shelf break of the Amundsen Sea, a cross-shelf transect over the Amundsen Sea continental shelf, surveyed from January 12 to 15, 2009, is selected and compared with FOAM in Figure 4. It is found the spatial structure of temperature and salinity, mixed layer depth, and their transition from the shelf break to the continental shelf is well captured by FOAM, which proves that FOAM can properly simulate the cross-shelf processes over this region. More detailed comparison of tracer fields, thermocline depth and thickness between FOAM and in-situ observation from various platforms are provided in the Supplementary Material, which proves that FOAM’s simulated hydrographic fields on the Amundsen Sea continental shelf is reliable and can be used in this study.
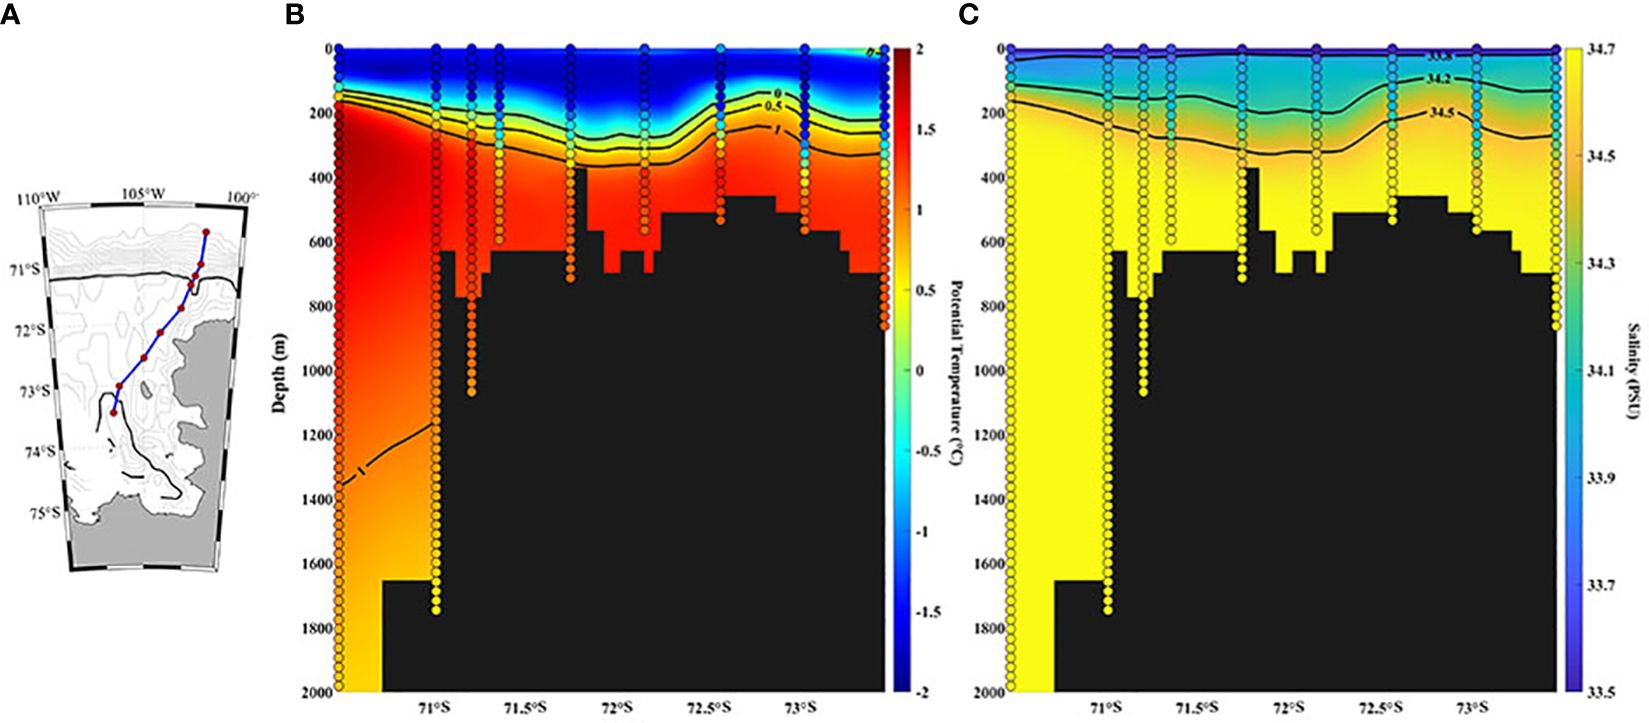
Figure 4 Comparison between CTD and FOAM over a section. (A) CTD data station distribution. (B) Distribution of FOAM’s potential temperature and (C) salinity over the section, where the scatters represent the CTD data.
2.2 Water mass analysis
The water mass composition and their mixing ratios are calculated using a modified version of the ‘optimal endmember analysis’ (Mao et al., 1964; Tomczak and Large, 1989; Frants et al., 2013; Li et al., 2018). This algorithm can be expanded and applied to any number of water mass end points, which is referred to as the M-Polygon water mass analysis method. For simplicity, the derivation and details are not included in the main text and are provided in the Supplementary Material. Considering three water mass endmembers A, B and C, and a mixed water type P with given θ/S values (Figure 5A). Let Ap, Bp, and Cp be the ‘mixing ratio’, which is the percentage of each water mass endmember in P, and Ap, Bp, and Cp can be solved using the following equations:
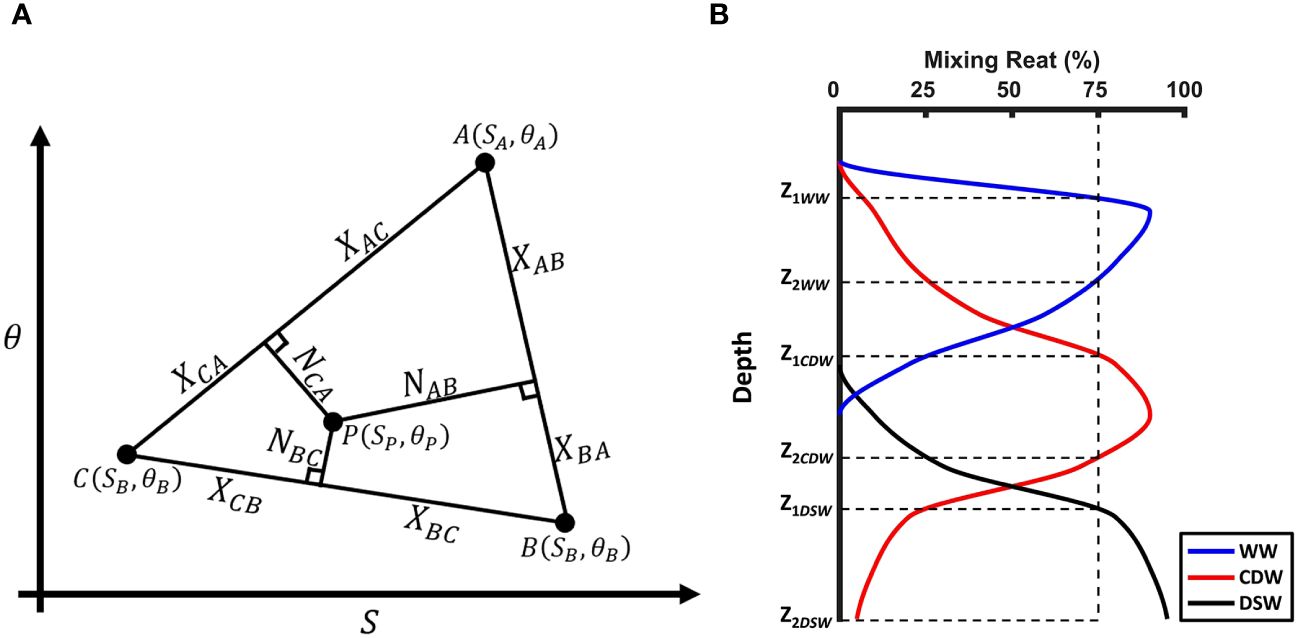
Figure 5 Schematic diagram of the (A) water mass analysis method and (B) water mass thickness calculation.
where , and are point to line distances between P and the three sides of the triangle ABC; , , , , and are distances between triangle vertices and perpendicular foot points of P to the three sides (Figure 5A); , , , , and are intermediate variables mixing ratios. All variables in Equations (1–4) are by definition equal to or greater than zero since they represent percentages or distances. And the general solution of Equations (1–4) is shown in Equations (5, 6):
where
This method is then applied to the Amundsen Sea continental shelf using three water mass endmembers, WW, CDW and DSW, to diagnose relative mixing ratios of these water masses and possible intrusion sites of CDW onto the continental shelf break. In in-situ measurements, some high salinity signal in the cold-water regime was identified (Figure 2), therefore, in addition to WW (low temperature and low salinity) and CDW (high temperature and high salinity), another water mass endmember is required to close the calculation of water mass mixing. Since the third water mass endmember represent low temperature, high salinity signal, DSW can be used as a pseudo endmember in such case. Detailed discussions on the appearance of these high-density signals can be found in Section 3.1 and Section 4.2. After composition ratios of these water masses are determined, the characteristic depths of each water masses are estimated, including the depths of its upper and lower boundaries and thickness, by examining water mass mixing ratio profiles on the continental shelf. The upper and lower boundaries ( and ) of a water mass are determined by the depth where the mixing ratio profile first and last crosses a predefined threshold in the water column (e.g., 75%, Figure 5B); this mixing ratio threshold is referred to as the lower mixing ratio (LMR) in this work. The overall thickness is then given by taking the difference between the upper and lower boundary depths . Note that in order to avoid overlapping between different water masses at the same depth, LMR has to be greater than 50% to ensure that there is only one dominant water mass at a certain depth. It is necessary to point out that the ‘thickness’ of a water mass given by our algorithm is dependent on percentage of the specified water mass in the composition of water masses. It is a tool to diagnose at the degrees and sites of mixing between water masses.
3 Results
3.1 Water mass characteristics
The monthly averaged FOAM reanalysis data from year 2010 to 2020 is used for our analysis. The multi-year averaged - distribution in Amundsen Sea of summer (December, January and February) and Winter (June, July and August) are shown in Figure 6. Several key water masses, UCDW, LCDW, WW, SSW, DSW and mCDW can be identified from the - scatter plots. In general, the water mass distribution and their characteristics given by FOAM can well represent the in-situ measurements of WOD (Figure 2). The - characteristics of the identified water masses in FOAM are in reasonable agreement with the WOD measurements and values reported by other studies, for instance, temperature maximum can reach 1.9°C of the characteristic temperature of UCDW, and the high-salinity signature (>34.7 PSU) of the warmer LCDW. A high-salinity, low-temperature ‘tail’ in the - scatter that resembles the characteristics of DSW is found in the FOAM data; similarly, a tail-like structure is also found in the historical data collections (Figure 2), and the salinity of which (>35 PSU) is higher than modeled values (~34.8 PSU). Even though this ‘tail’ suggests presence of DSW, it is worth noting that most of these high-salinity, low-temperature signals are captured by Autonomous Pinniped Bathythermograph (instrumented seals), which are known to have instrument-dependent salinity offset (Frazer et al., 2018); without proper calibration these data cannot be considered as evidence of DSW presence on the Amundsen continental shelf. For water masses of shallower depth, WW covers a wide range of salinity, with a constant low-temperature signature of -1.8°C; SSW covers a wide range of both and , and the ranges of both agree well with the WOD measurements (Figure 2).
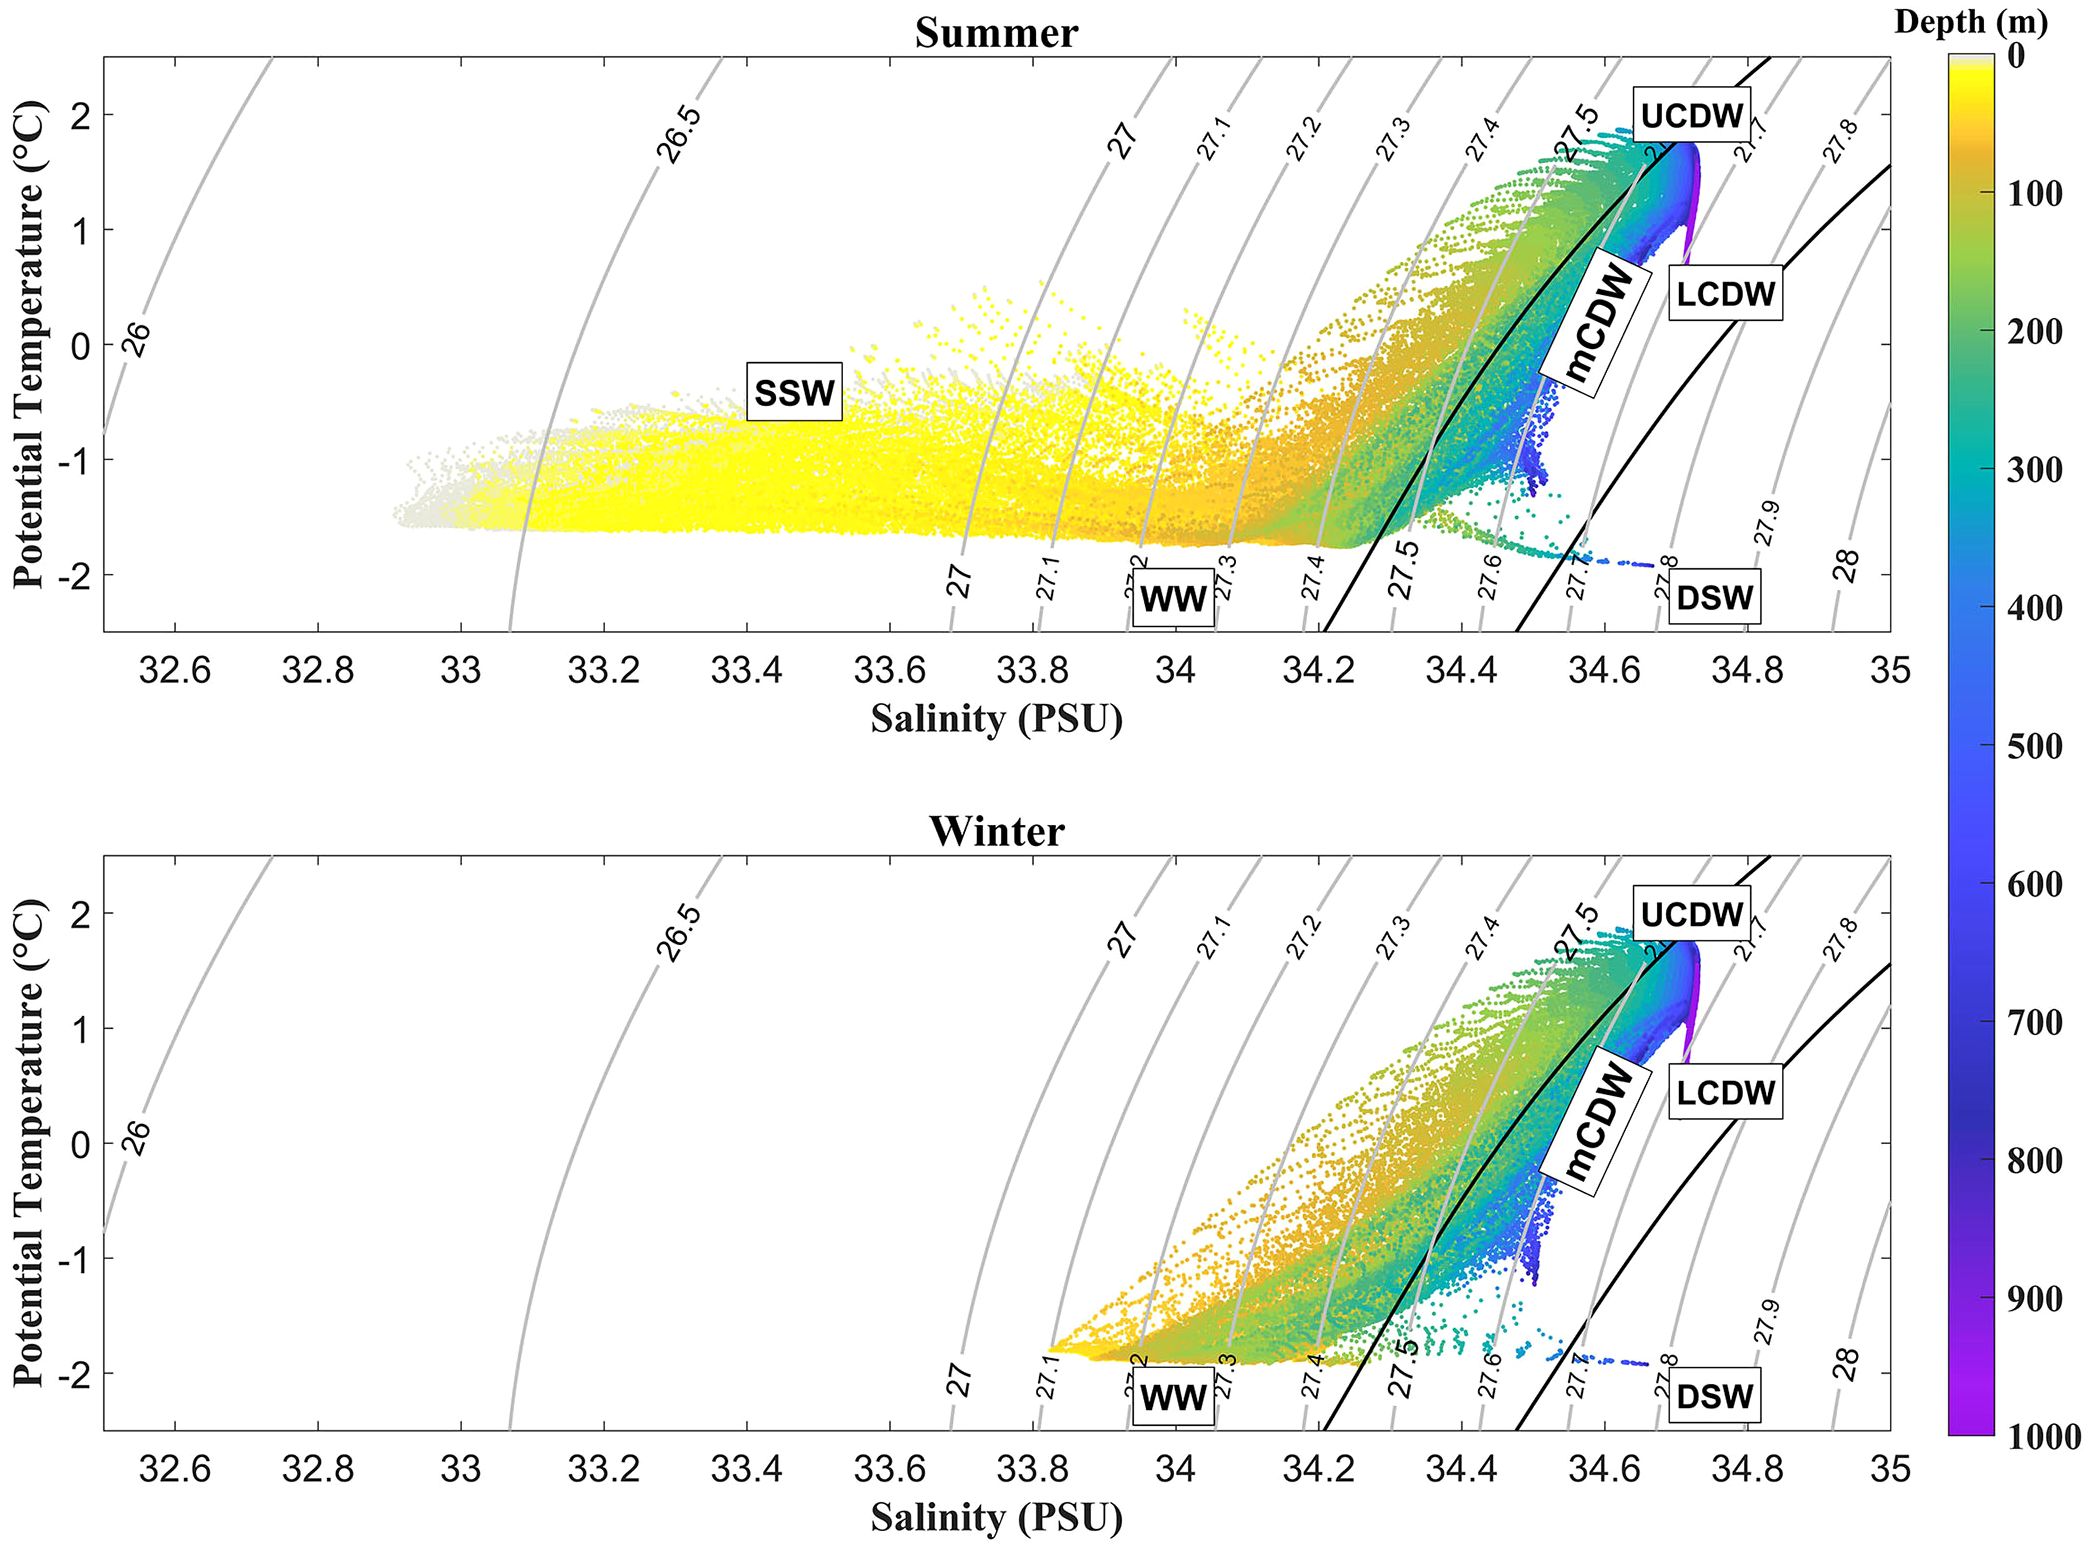
Figure 6 - scatter plot of the upper 1000 m in the Amundsen Sea. The upper and lower panels are data averaged over summer (December, January and February) and Winter (June, July and August) from year 2010 to 2020, respectively. Two black lines show neutral density 28.00 kg m-3 and 28.27 kg m-3. Gray contours denote isolines of potential density, while colormap denotes the depth of data points.
3.2 Water mass composition on Amundsen Sea continental shelf
CDW mixes with shelf water masses and forms the mCDW when it intrudes onto the Amundsen Sea continental shelf region. The mixing primarily occurs between CDW and WW, while mixing with DSW only plays a minor role. The direct mixing between CDW and SSW is rare as they are separated by WW layers. To quantify the mixing ratio and thickness of each water mass, the water mass analysis method described in Section 2.2 is implemented to the FOAM reanalysis. Since SSW can theoretically only mix with WW and only in summer, and we focus on the mixing that occurs below the thermocline, for simplicity, the discussion of mixing between SSW and WW is not included in this study; instead, only three basic water masses, CDW, WW and DSW are used as endmembers; in order to exclude the component of SSW, data points with potential density less than 27.1 kg m-3 are removed before performing the water mass analysis. The water mass properties of endmembers are determined by inspecting the - distributions in the reanalysis product and WOD observation (Figures 2, 6): for DSW and WW, the - values are given by the data points of maximum and minimum salinity in winter, respectively; for CDW the endmember - values are then determined by taking the midpoint of data point of maximum potential temperature and data point of maximum salinity. And in order to more accurately characterize the temperature and salinity of the water at different depths and locations, conservative temperature and absolute salinity were chosen rather than potential temperature and practical salinity for the determination of endmember values. The finalized values of water properties are listed in Table 2.
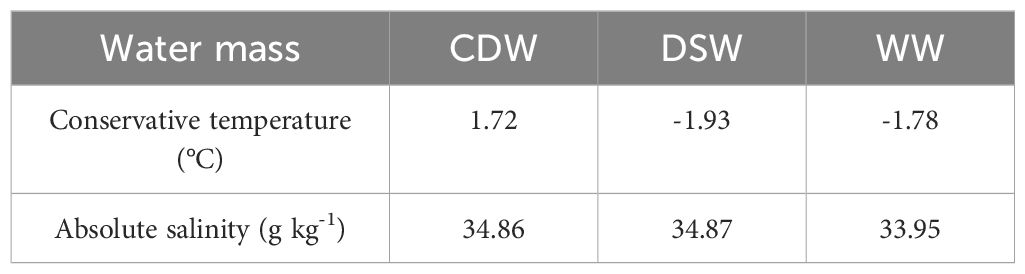
Table 2 - characteristics of water mass analysis endmembers.
The mixing ratio and characteristic depths of each water mass is calculated using Equations (5). The thickness of WW, DSW and CDW on the continental shelf are calculated with LMR thresholds of 75% and 50%, respectively, using FOAM’s monthly data averaged over 2010-2020 (Figure 7). Among the three water masses, results of WW show the greatest horizontal distribution over the continental shelf; its thickness increases towards the Antarctic coast, which is likely a result of the meridional temperature and air-sea heat flux gradient. When using a higher LMR threshold (75%), DSW only presents in a very small region. When using a lower LMR threshold (>50%), more of DSW is found surrounding the Dotson Ice Shelf (DIS) and Crosson Ice Shelf (CRIS), which are near the Amundsen Polynya (Arrigo and Dijken, 2003). In contrast, DSW is in general absent in the Pine Island Trough and its eastern area of Amundsen Sea. On the other hand, CDW is mainly distributed over the central and eastern side of the continental shelf; the overall thickness of CDW is greater than the other two water masses, coinciding with the strong intrusion of CDW onto the eastern continental shelf; CDW thickness decreases towards the coast, suggesting that more shelf water masses are mixed with CDW as it intrudes deeper into the continental shelf. Largest CDW thickness is found on several locations (119°W-117°W, 115°W-110°W and 105°W-103°W) along the continental shelf break, and these locations coincide with major troughs on the continental shelf break; this distribution pattern suggests that CDW tends to intrude and travels southward through these deep troughs, which is also reported in numerous research works (Walker et al., 2007; Wåhlin et al., 2010; Jacobs et al., 2011; Assmann et al., 2013).
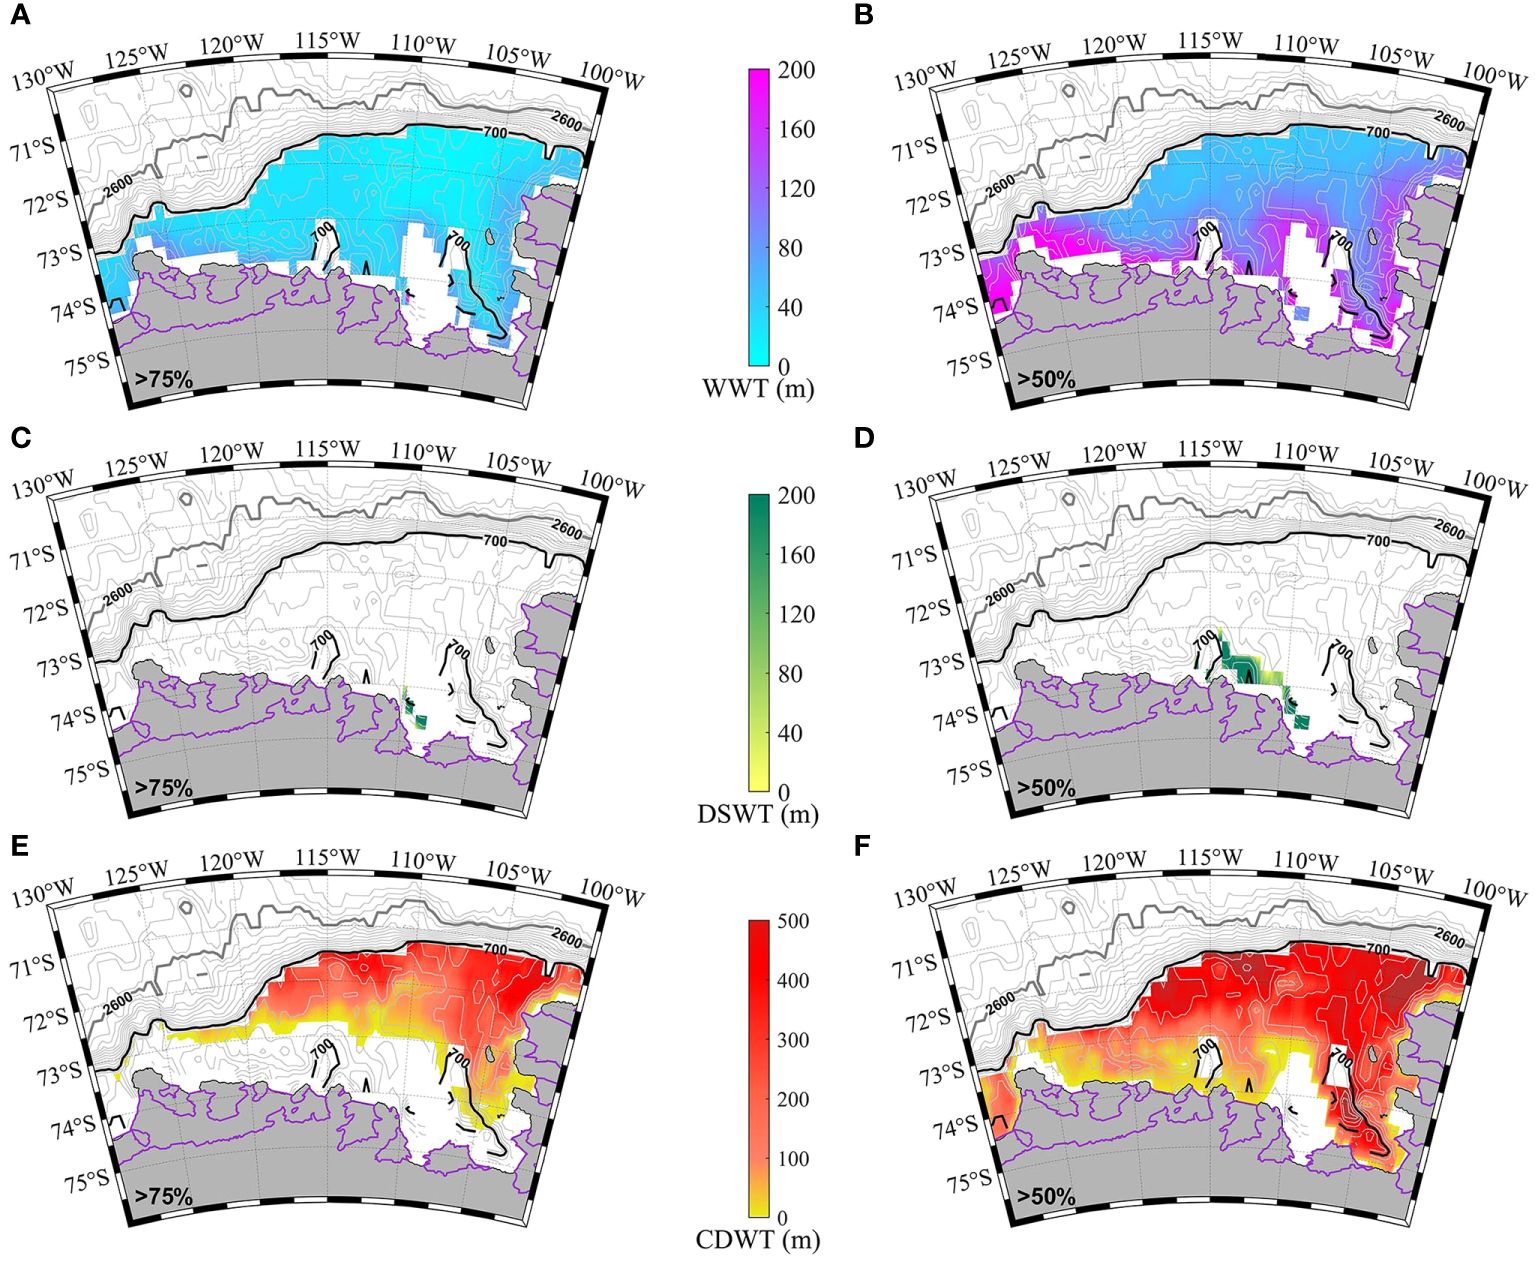
Figure 7 Water mass thickness averaged distribution of WW (A, B), DSW (C, D) and CDW (E, F) over 2010-2020. Two specified LMR values, 75% (A, C, E) and 50% (B, D, F) are used to test the algorithm’s sensitivity to mixing ratio threshold value. Gray contours are isobaths with an interval of 100 m between 300 and 1000 m and 200 m between 1000 and 3200 m. Thick black and gray contours are 700 and 2600 m isobaths, respectively. Purple lines denote the ice shelf edge.
The temporal variations of the three water masses’ characteristic depths, including the total thickness and depths of upper/lower boundaries, are calculated by spatially averaging the characteristic depths derived from the monthly-mean FOAM reanalysis, and the results (LMR=75%) are summarized in Figure 8. Among the three water masses, CDW’s total thickness shows the least seasonal variability but has an overall decreasing trend over Sept. 2006-Jun. 2009 (~130 m) and two increasing periods over Oct. 1995-Oct. 1999 (~80 m) and Jul. 2014-Dec. 2019 (~130 m), respectively. The increasing and decreasing trends of CDW thickness are mostly caused by the uprising and descending of CDW’s upper boundary. The second increasing period of CDW thickness suggests that the Amundsen Sea continental shelf is receiving more CDW inflow in recent years, which could be an indicator of another period of rapid warming after 1974-1987 and the 1990s (Joughin et al., 2003; Rignot, 2008; Scott et al., 2009; Wingham et al., 2009; Steig et al., 2012), which could potentially trigger more mass loss of ice shelves. To further explore these two increasing periods, the CDW thickness anomaly was calculated to indicate its interannual variability obviously; and five El Niño index anomalies were downloaded from the Physical Sciences Laboratory of National Oceanic and Atmospheric Administration (NOAA; https://psl.noaa.gov/enso/dashboard.html). During the specified period of analysis spanning three decades, it is found that the strongest two El Niño events (indicated by the red shading in Figure 8E) correspond well with the beginning of the two increasing periods of CDW thickness, as depicted in Figures 8C, D. Thus, this interannual variability of CDW is likely related to the El Niño events over the upper Southern Pacific Ocean; and the potential mechanism is that the El Niño events could lead to the movement of Amundsen low through the transmission of Rossby waves, changing the wind stress over the continental shelf (Steig et al., 2012).
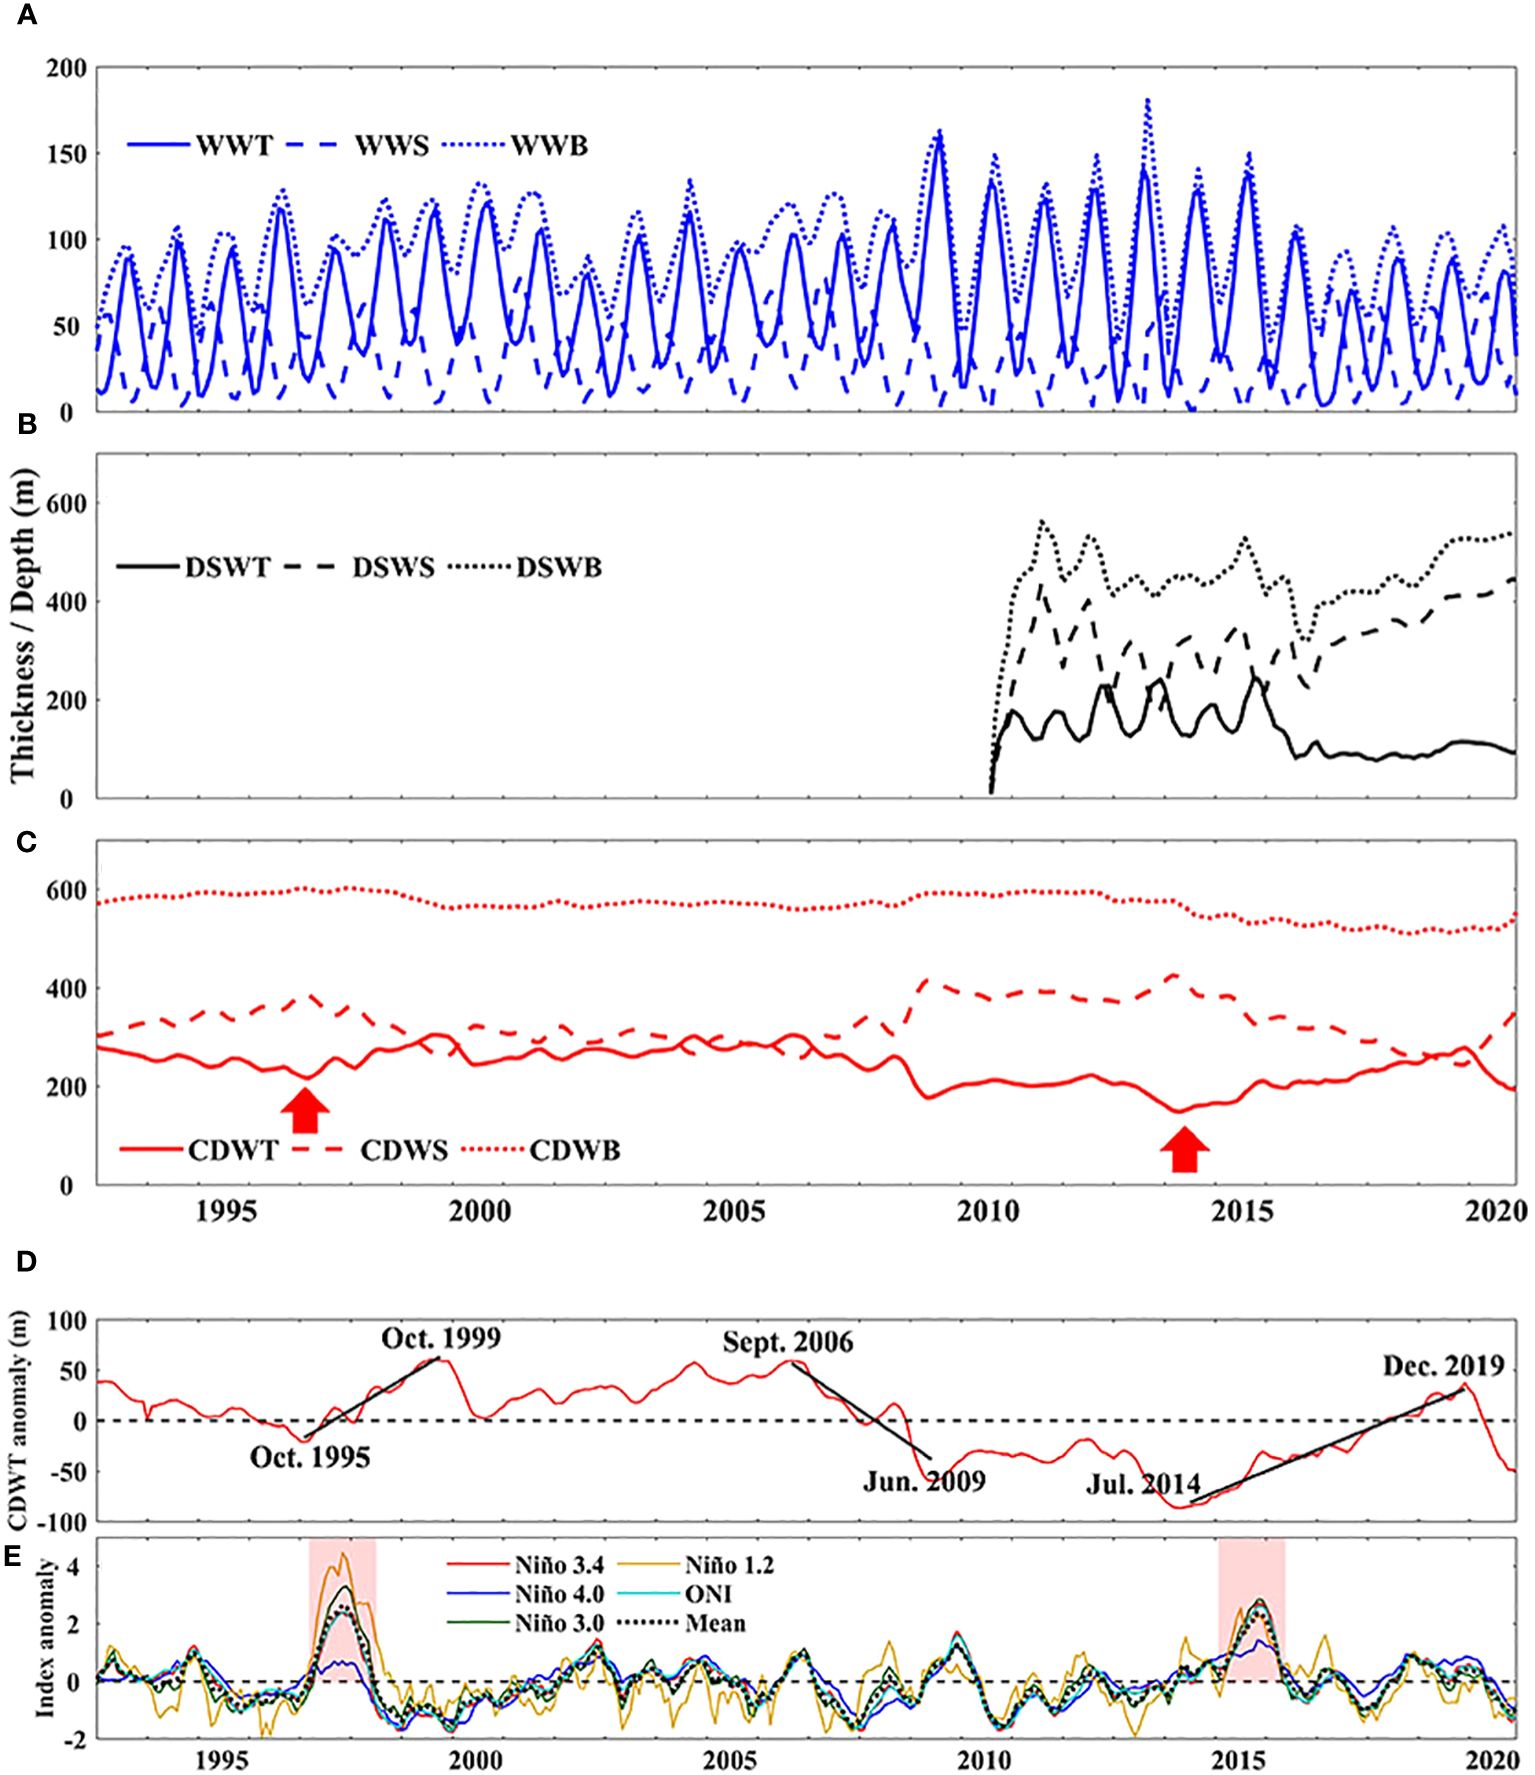
Figure 8 Spatially averaged characteristic depths of (A) CDW, (B) DSW and (C) WW from year 1993 to 2020, determined using a LMR threshold of 75%. The solid, dashed and dotted lines represent the overall thickness, surface and bottom boundary depths, respectively. (D) The CDW thickness (CDWT) anomaly from year 1993 to 2020. (E) Five El Niño index anomalies in year 1993-2020. The two red shadings represent two strongest El Niño events in the period.
On the other hand, WW’s characteristic depths show the largest seasonal variation, as its thickness increases during winter months and drops below 40 m during summer months. The seasonal variation is stronger in 2009-2015, and then becomes smaller after 2016. Similarly, DSW’s characteristic depths also show stronger seasonal oscillation during 2010-2015 and then gradually decays afterwards. Unlike WW and CDW, DSW is absent in the Amundsen Sea before year 2010 and only emerges afterwards. This temporal evolution of DSW thickness suggests that the water mass characteristics is under influence of higher-salinity, lower-temperature water masses after August 2010. More discussion of DSW on the Amundsen Sea continental shelf is in Section 4.2.
3.3 Possible CDW intrusion locations
The potential sites of CDW intrusion on shelf break are tracked by altering the LMR threshold and examining the response of CDW thickness distribution to the changing LMR. Firstly, to demonstrate our algorithm’s sensitivity to LMR, the total CDW volume is calculated by horizontally integrate CDW thickness over the continental shelf as shown in Equation (7).
As the LMR threshold decreases, more volume of water will be identified as CDW thus should increase monotonously with decreasing LMR. The gradual increase of as a function of LMR is then calculated and the results are shown in Figure 9. At very high LMR, no water mass on the continental shelf can be identified as CDW thus the total volume is zero; signal of CDW only begins to emerge when LMR threshold drops below 92%, and the increase of can be divided into two stages: the first stage features a rapid increase in CDW volume, where the total volume increases from 0 to 427,65.7 km3 as LMR decreases from 92% to 86%; and during the second stage, the increasing rate of drops and total volume becomes less sensitive to the LMR. Identified CDW volume reaches its maximum value as LMR threshold drops to 50% since LMR values lower than 50% is not valid in our analysis.
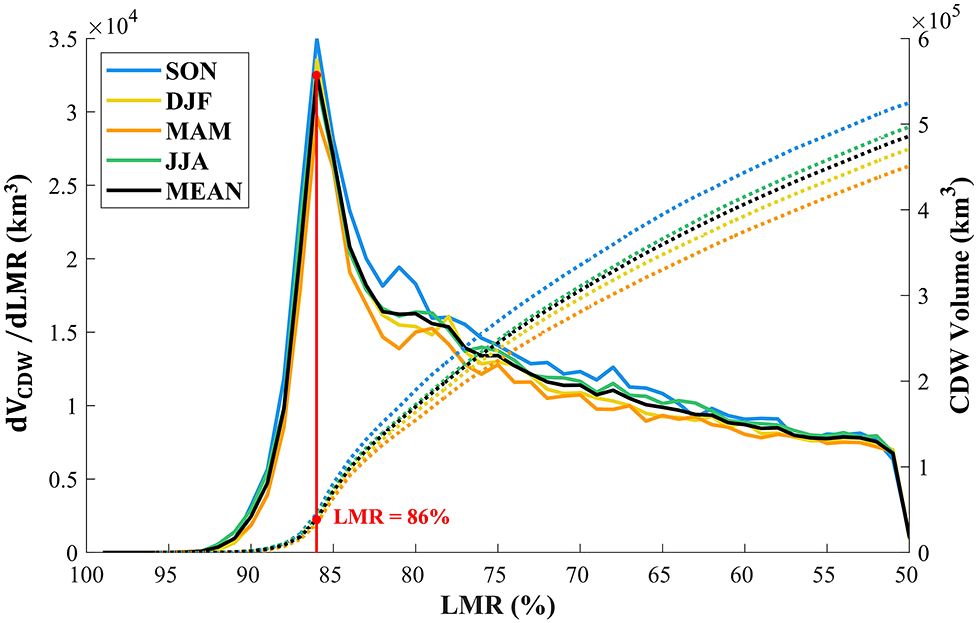
Figure 9 Total volume of CDW on the continental shelf (, dashed lines) as a function of LMR and its first-order derivative (solid lines), averaged from year 2010 to 2020. Colored lines denote seasonal averaged values, while the black line denotes the overall mean value.
To illustrate the horizontal expansion of CDW signal as LMR threshold decreases, the CDW thickness distribution of three LMR values (92%, 86% and 50%) are calculated and results are shown in Figure 10. When LMR decreases to 92%, CDW signal first begin to emerge on the continental shelf near 106.5°W of the shelf break, suggesting a high CDW intrusion possibility through this location in the reanalysis results. As LMR drops from 92% to 86%, more evident CDW intrusion cores begin to emerge, centered around 110°W (LMR = 91%), 113°W (LMR = 90%), 118°W (LMR = 89%), and 102.5°W (LMR = 88%), respectively; these CDW cores can penetrate deep into the continental shelf and reach the coast of Antarctic continent. When LMR drops to 77%, more water masses with lower CDW concentration will be included, and several other possible locations are revealed; further decrease of LMR does not change the general spatial pattern of CDW nor reveal more intrusion locations along the shelf break.
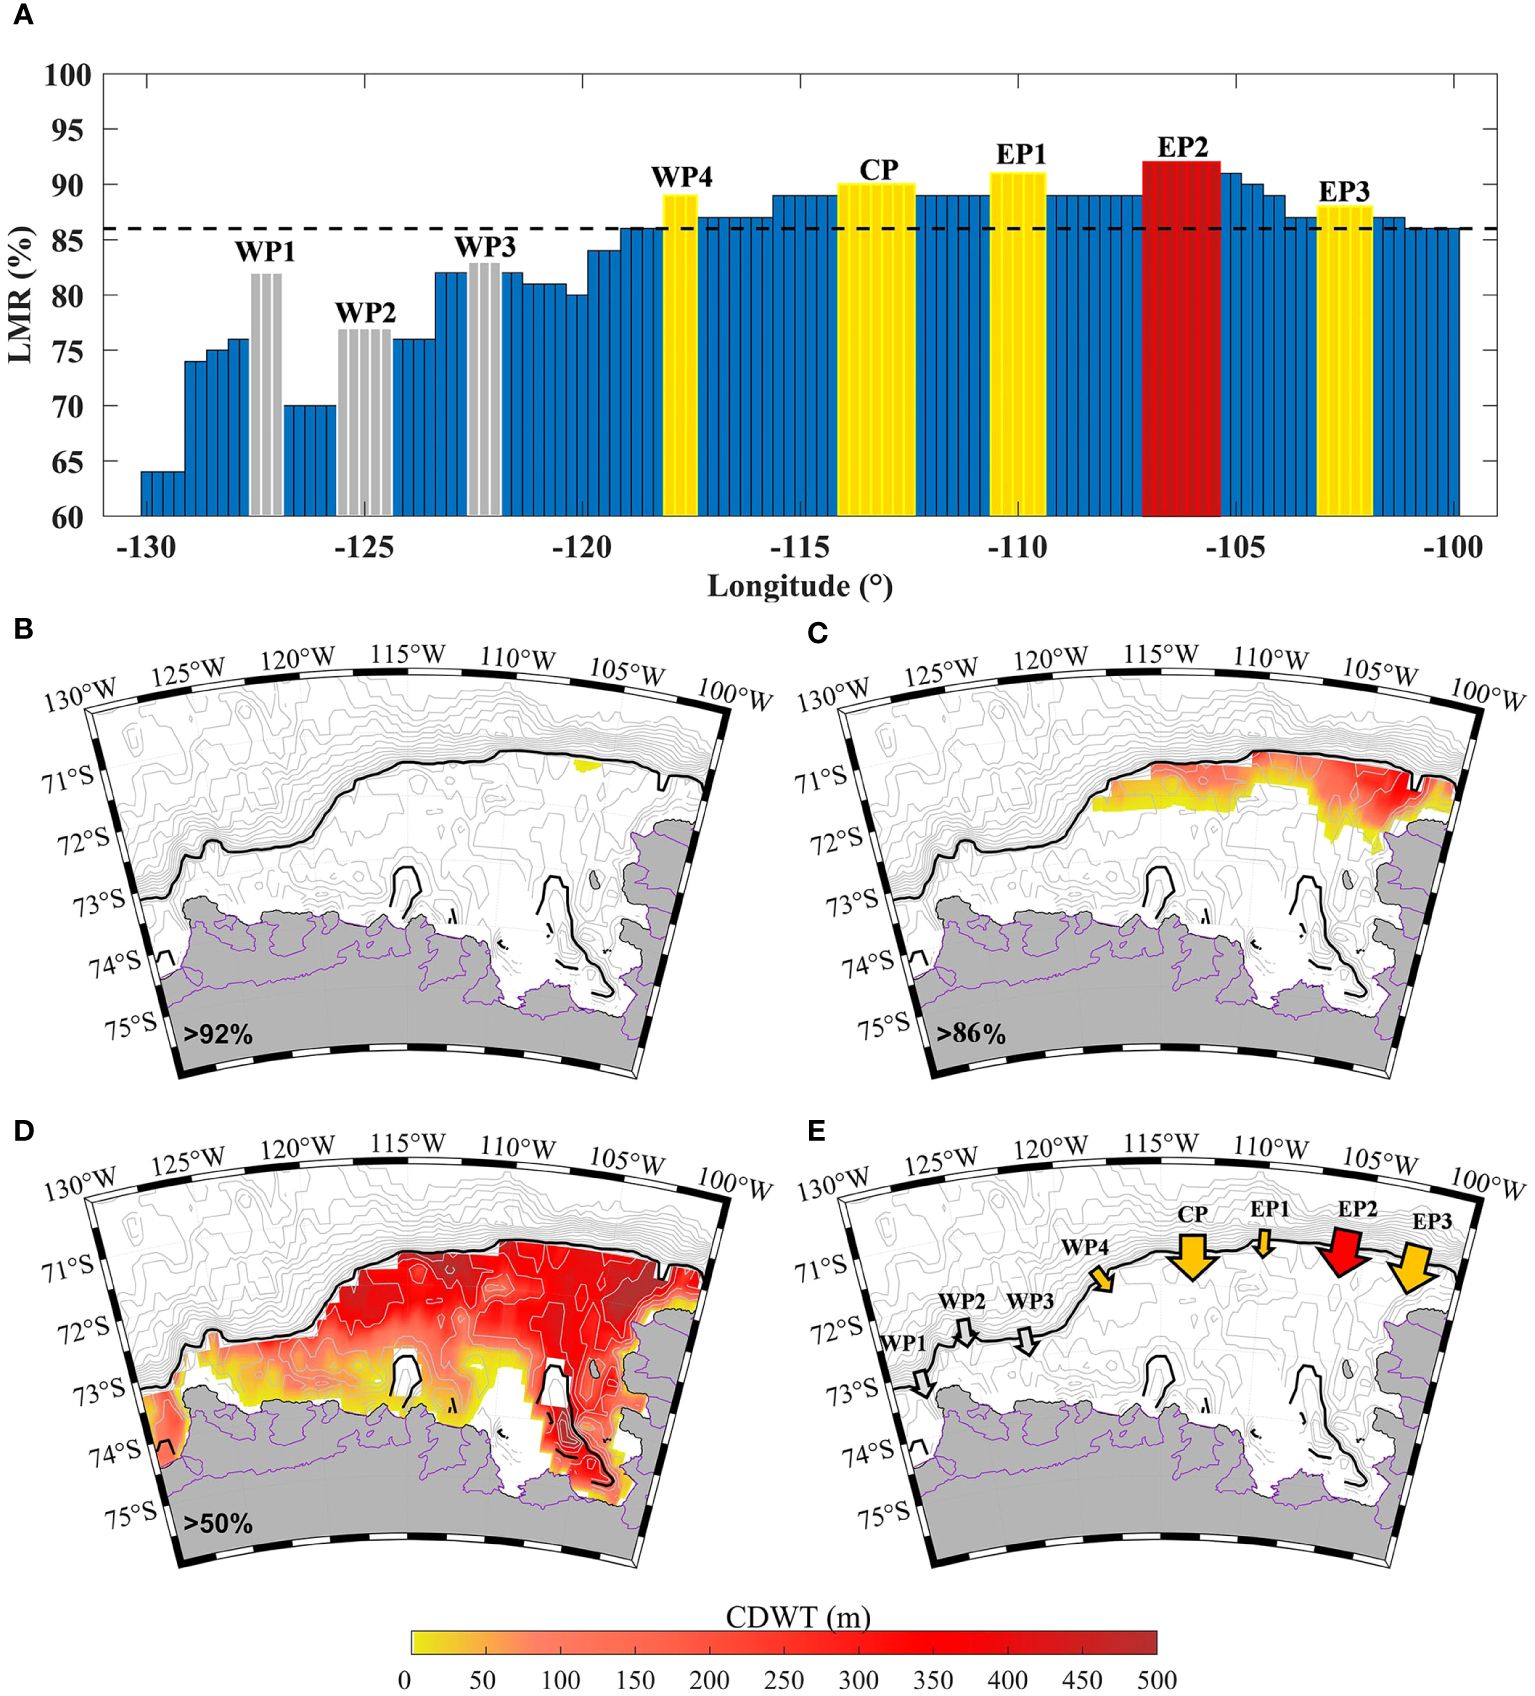
Figure 10 (A) All possible CDW intrusion sites at continental shelf break and the corresponding LMR when they are detected. Blue bars denote locations without CDW intrusions. Yellow and gray bars represent intrusion locations identified with LMR values greater than 85% and 75%, respectively. Red bar represents the first location of intrusion detected. Horizontal black dashed line shows the LMR = 86%, which is the demarcation of the two intrusion stages as mentioned earlier. (B–D) Distribution of CDW thickness on the continental shelf with LMR values of 92%, 85% and 50%, respectively. (E) Possible CDW intrusion sites/pathways, as in (A), where colors denote the intrusion strength deducted from the CDW thickness sensitivity tests.
8 possible CDW intrusion locations along the shelf break marked in Figure 10E are identified by examining the CDW emergence pattern while gradually lowering the LMR threshold value. From west to east these locations are named the Western Pathway 1-4 (WP 1-4), Central Pathway (CP), Eastern Pathway 1-3 (EP 1-3). These pathways coincide with the location of major troughs along the continental shelf break, suggesting that bathymetry is a key controlling factor of the cross-isobath transport of CDW. To quantitatively evaluate the tendency of CDW intrusion in these locations, the maximum LMR value is examined when CDW signal first emerges in each location, and use these values to compare the possibilities of CDW intrusion over each pathway (Table 3). In this process, only locations where CDW signal appeared independently along the continental shelf break were considered as potential intrusion pathways/sites, i.e., each intrusion location was identified without CDW signal appearing at its connecting location, in order to avoid zonal currents on the shelf from influencing intrusion judgments. Using a LMR threshold of 86%, which is the demarcation of the two intrusion stages as mentioned earlier, 5 locations (WP4, CP, EP1, EP2, EP3) with the higher CDW intrusion possibility were revealed; these sites are mostly located on the eastern side of the shelf break, whereas on the western side the LMR threshold of CDW first emergence is much lower (80.7% on average) and thus the CDW intrusion possibility is correspondingly smaller. This spatial pattern in general agrees with findings of previous works, which state that CDW intrudes onto the continental shelf through the troughs of the eastern Amundsen Sea (Wåhlin et al., 2012; Assmann et al., 2013; Walker et al., 2013; Kim et al., 2017; Azaneu et al., 2023). But WP1 is special because the CDW was observed at the location in front of the Getz Ice Shelf (Steiger et al., 2021), but the CDW intrusion is not considered strong here in our results, probably because the spatial resolution of the reanalysis data limits our capture of the CDW signal around the shelf break near the Siple Trough. Our results suggest that the water mass analysis method, even though only relies on conventional hydrographic data ( and ) with limited resolution, can successfully capture almost CDW intrusion sites on the continental shelf break, and also has the potential to be used to detect new sites that may have been previously overlooked.
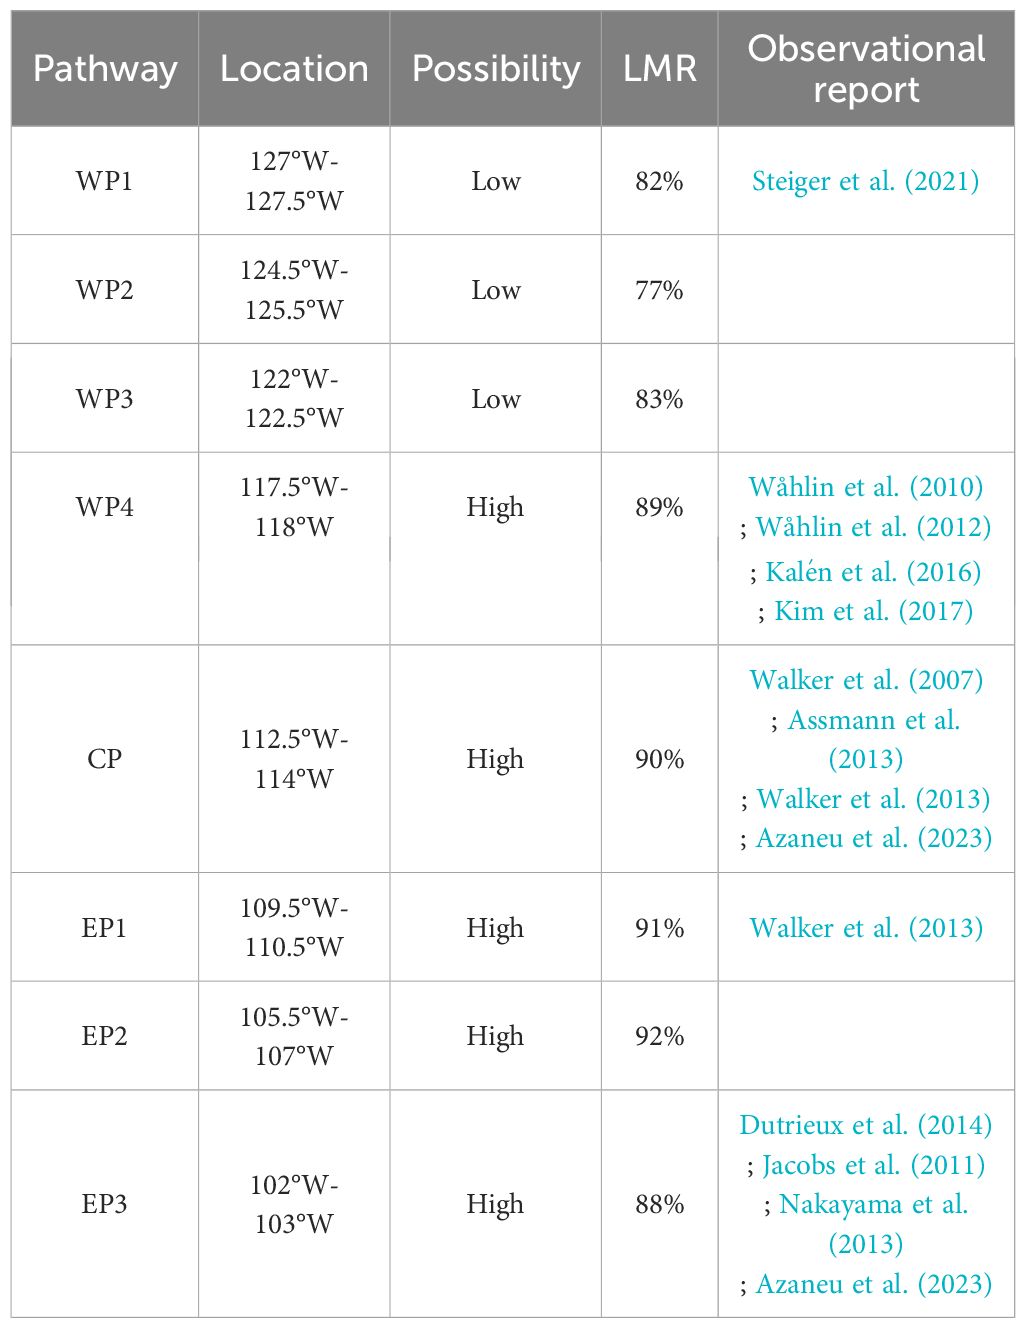
Table 3 Possible Intrusion Locations of CDW based on CDW thickness distribution.
4 Discussion
4.1 Cross-shelf break CDW intrusion near shallow region
Using FOAM and a water mass analysis method, 5 locations with high possibility of CDW intrusion were identified, including several previously reported locations (WP 4, CP, EP 1 and EP 3, Walker et al., 2007; Wåhlin et al., 2010; Jacobs et al., 2011; Wåhlin et al., 2012; Nakayama et al., 2013; Walker et al., 2013; Dutrieux et al., 2014; Kalén et al., 2016; Nakayama et al., 2017; Azaneu et al., 2023) and a newly captured location (EP 2). The reanalysis results reveal that EP 2, a previously unidentified location on the continental shelf break, is where high concentration CDW first begins to emerge and expand on the continental shelf, which suggests that EP 2 is a CDW intrusion pathway of high possibility that may have been overlooked. The highest CDW mixing ratio near EP 2 is clear evidence of direct CDW upwelling onto the continental shelf since other processes that brings CDW onshore, such as eddy-mediated cross-shelf mixing tend to lower the overall concentration of CDW (Klinck and Dinniman, 2010). It should also be noted that EP 2 is a relatively shallow region (maximum depth< 550 m), whereas other major intrusion sites (WP4, CP, EP3) are deep channels that connect directly to the shelf break. Coincidentally, the site with the second-highest intrusion possibility (EP 1) is also a shallow region where maximum depth does not exceed 550 m. The spilling of CDW over these shallow areas is counterintuitive since previous studies show that CDW intrusion mostly occurs near the deep troughs along the shelf break (Morrison et al., 2020; Liu et al., 2022). Nevertheless, the reanalysis results suggest that CDW can upwells onto the continental shelf through even when these deep troughs are absent.
Even though the results show a tendency of CDW intrusion over these shallow regions, it could still be argued that since the concentration of CDW is not uniform along the continental shelf slope, the CDW signal is first detected in EP 2 only because, in the reanalysis results, the on-slope CDW concentration near EP 2 is higher than other locations in the first place. To further demonstrate the cross-shelf break tendency of CDW over EP 2 in the reanalysis product, the velocity data provided by the FOAM reanalysis is used to calculate the time-series of cross-shelf break velocity and conduct a numerical particle tracking experiment using a simple forward scheme. Daily mean velocity at EP 2 was projected to the directions of along and across the shelf break, respectively, and the full time series of cross shelf break velocity at 300 m, 400 m, and 500 m depths are shown in Figure 11. The daily mean velocity reveals that the cross-isobath flow is primarily shoreward (negative values) during year 1993-2019. If cross-shelf break velocity greater than 2.5 cm s-1 is defined as strong inflow/outflow events (red/blue bars), it can be seen that inflow events occur more frequently than outflow events, which, further proves the cross-shelf break intrusion tendency of CDW at EP 2 in FOAM’s results.
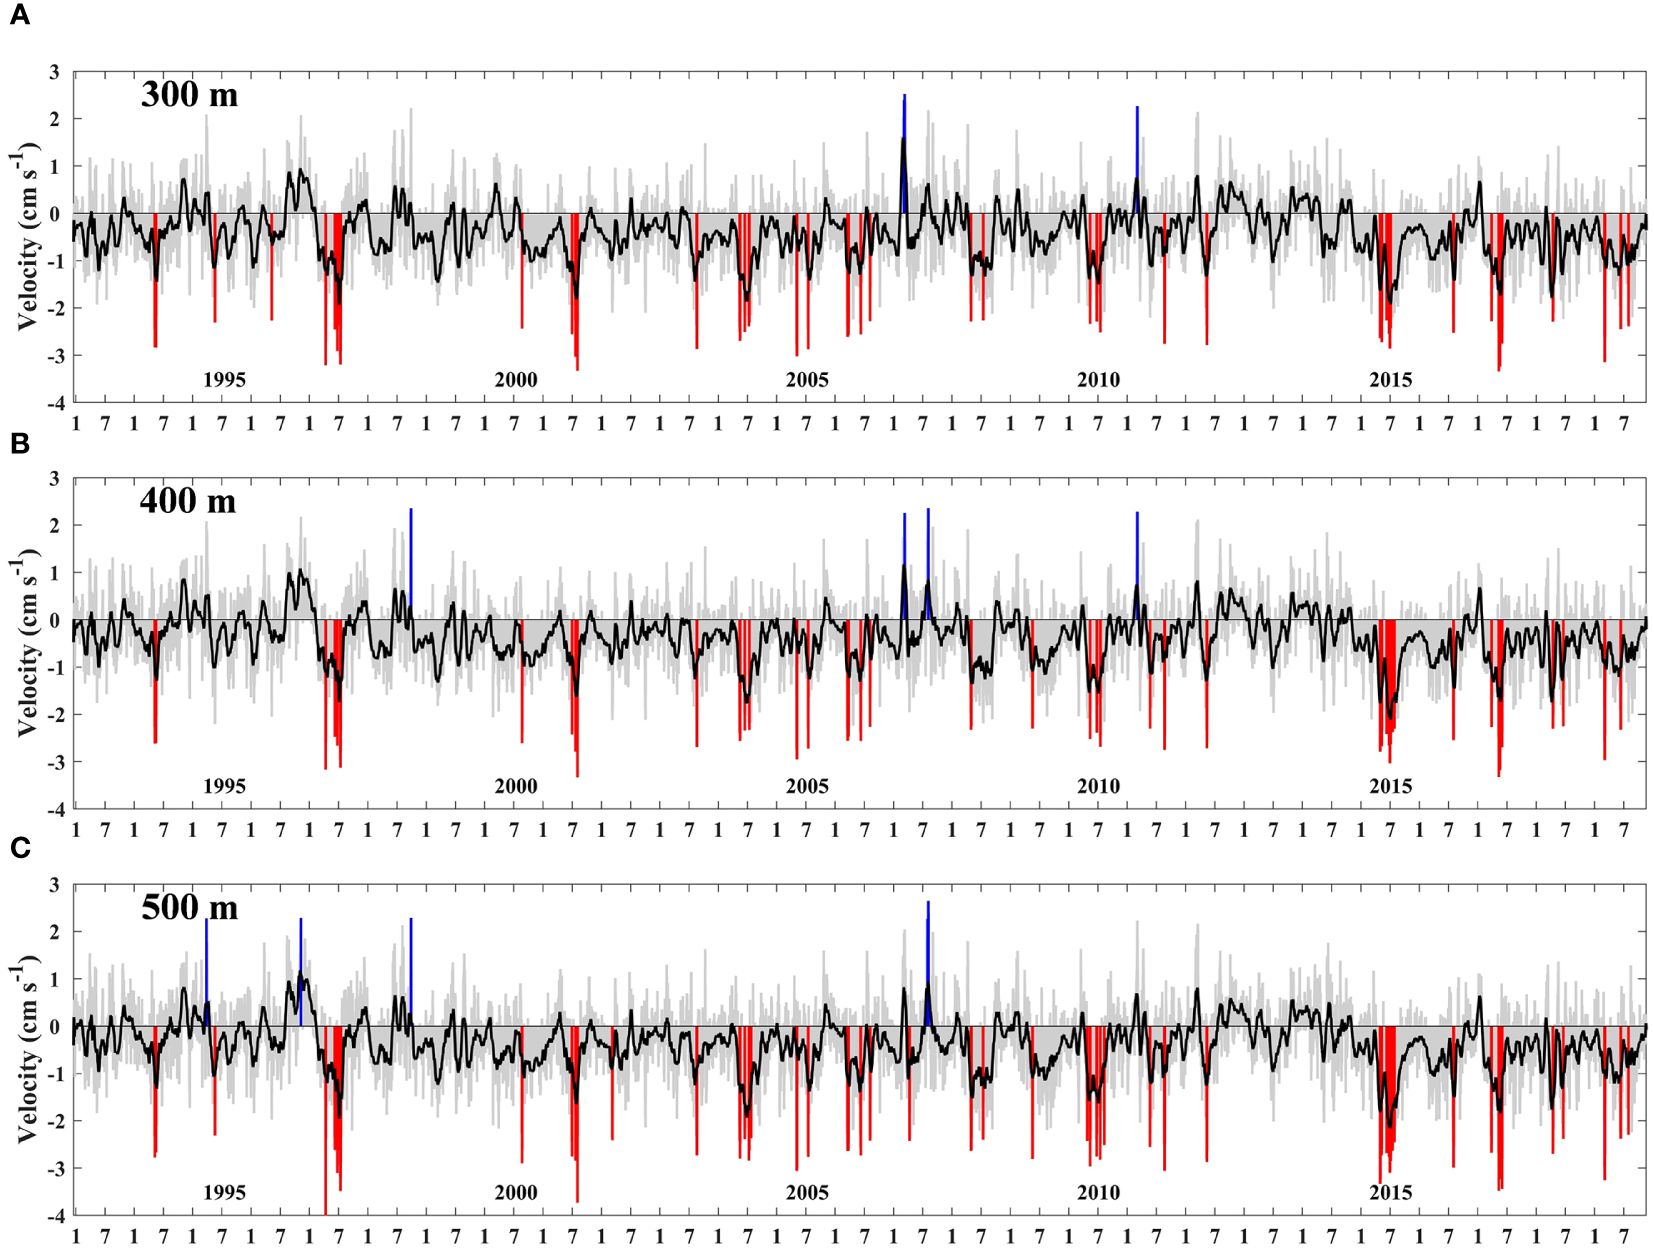
Figure 11 Time series of the velocity across shelf break at EP 2 at depth of (A) 300 m, (B) 400 m and (C) 500 m. Gray bars are daily-averaged velocity, while red/blue lines are onshore/offshore velocity greater than 2.5 cm s-1. Black lines represent window-averaged velocity using a 30-day window size.
Through a simple numerical particle tracking experiment based on FOAM’s velocity data, we further investigated the flow field of EP 2 and evaluated its ability to transport CDW southward in the reanalysis results. In the experiment, particles are released over 0.1° intervals slightly north of EP 2 (106°W-107°W, 71.15°S) at 2 depths, 300 and 400 m. For simplicity the particle only moves in horizontal direction as FOAM reanalysis does not provide data of vertical velocity. These particles are released on January 1, 2019 and then tracked over 9 months, and results of the particle pathways are shown in Figure 12. The results in particle tracking experiment show that there is a clear southward water movement trend, which could potentially move CDW onshore into the PIT; after CDW flows into the PIT, it has a chance to be transported near the ice shelves (Jacobs et al., 2011; Webber et al., 2019; Lars and Isabella, 2021). This southward movement is slow yet steady over the tracking period; the particles at 300 m traveled up to 320 km southward over the 9-month period, with a mean southward velocity of 1.37 cm s-1; at 400m depth, with similar southward velocities and particles being also tracked into the PIT. From this tracking experiment, it can be concluded that the tendency of intrusion in EP 2 is a consistent feature in the reanalysis results.
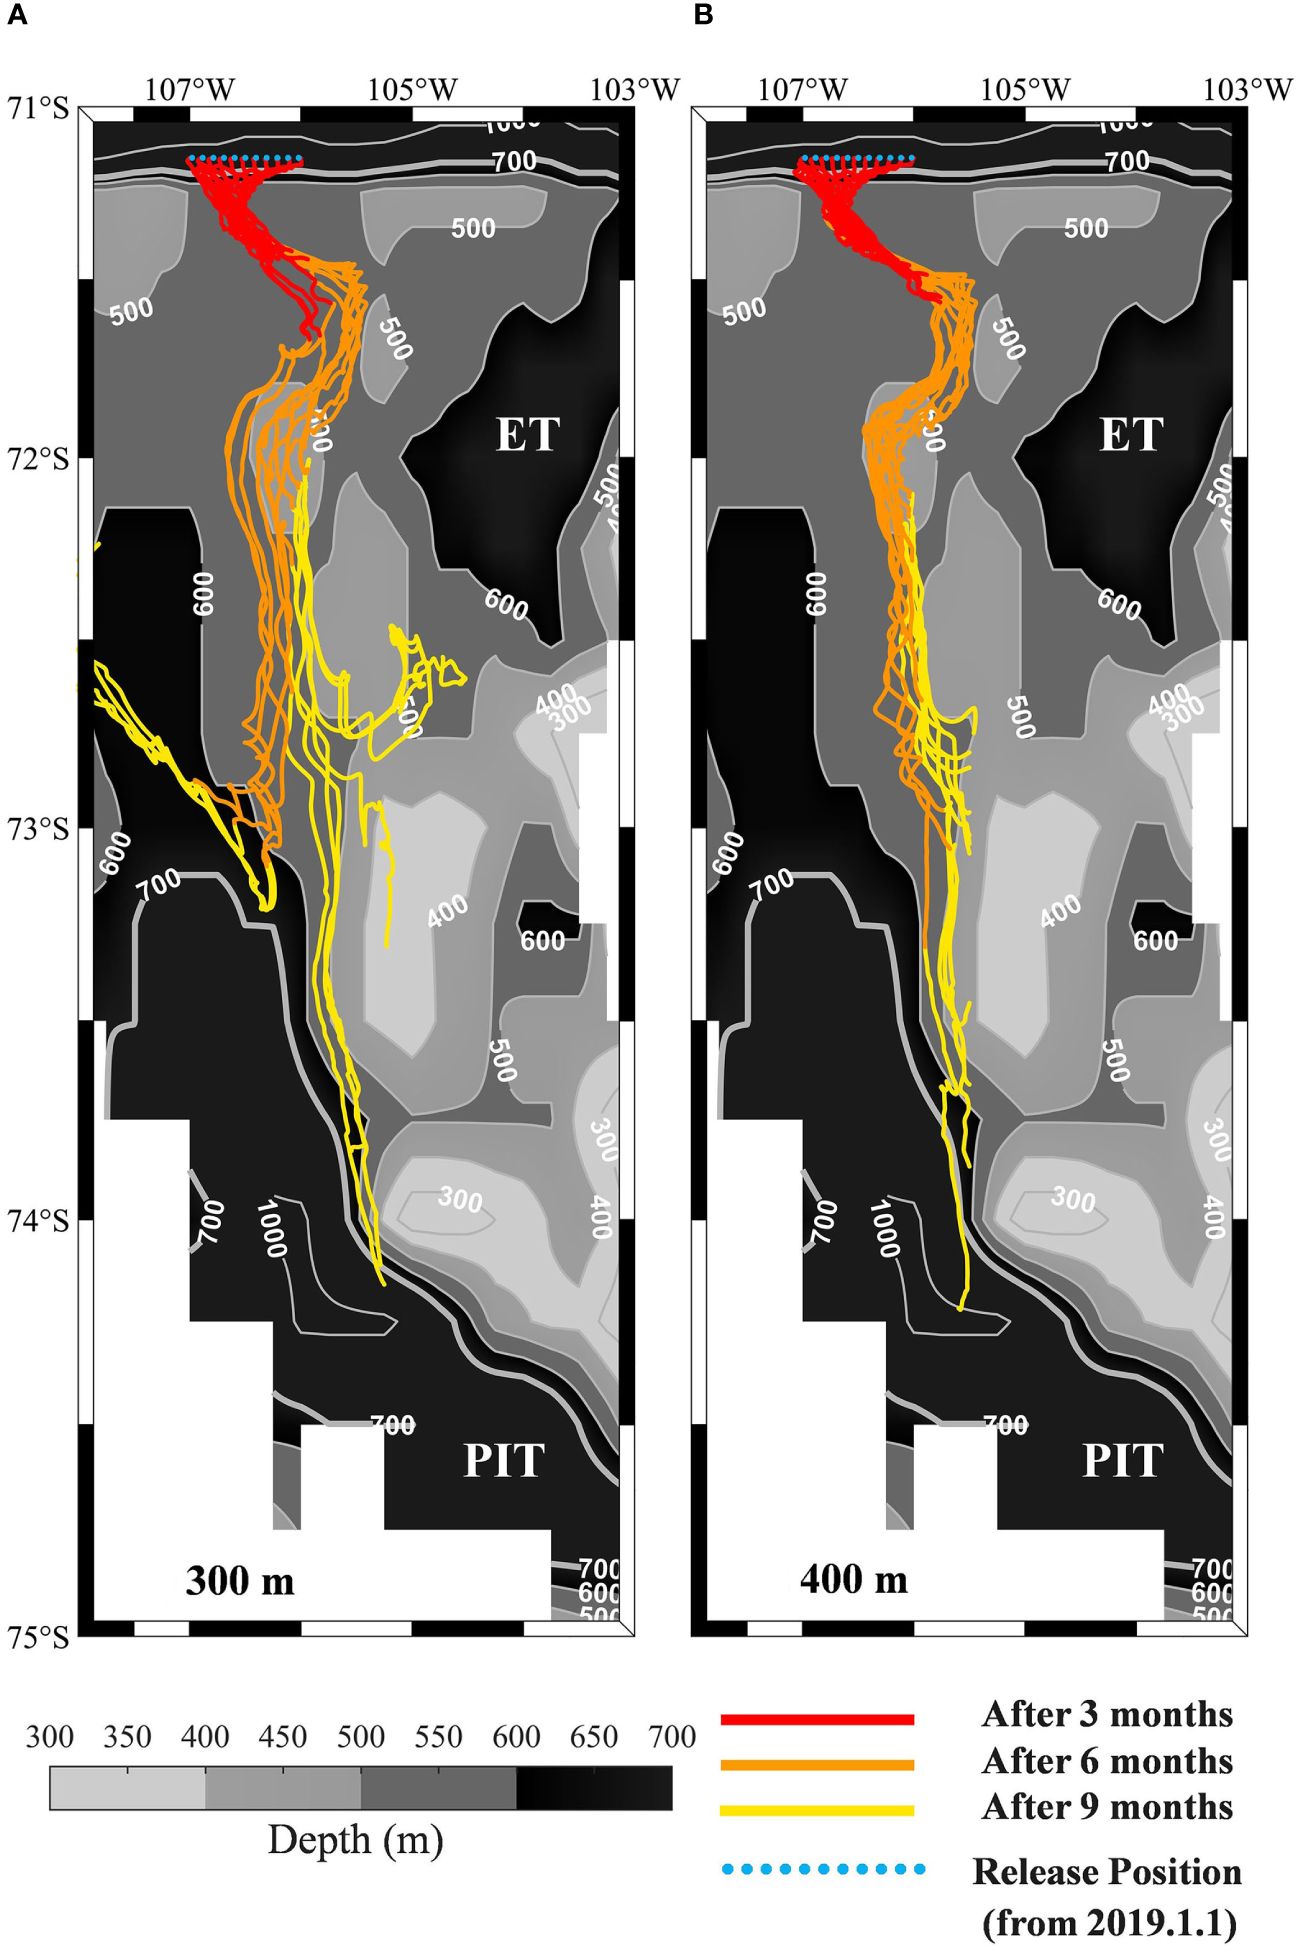
Figure 12 Pathways of particles at (A) 300 m and (B) 400 m in the numerical particle tracking experiment. The red, orange and yellow lines represent the particle’s position after 3, 6 and 9 months, respectively. Blue points represent the particle release position; gray line represents the isobath.
Despite these evidences, it should be emphasized that the bathymetry configuration used by FOAM does not fully resolve the complex topographic features of near the shelf break, which are important in governing the flow structure over these regions (Walker et al., 2007; Liu et al., 2018; Sun et al., 2022), thus the cross-shelf break CDW incursion at EP 2 and the southward traveling tendency of the mCDW could be an artifact of the numerical model; more in-situ measurements of both hydrographic and flow fields are required to validate the intrusion of CDW over this location. Even so, our results suggest that CDW can potentially intrude the continental shelf near shallower regions, thus observations of non-deep-water troughs along the continental shelf break of the Amundsen Sea, which are rare at present, should not be overlooked in future studies.
4.2 DSW in the Amundsen Sea
Generation of DSW is associated with brine discharge during sea ice production, either over a wider continental shelf (Gill, 1973; Jacobs et al., 1985) or in wind-driven coastal polynya areas where sea ice constantly forms (Baines and Condie, 1985; Rintoul, 1985). On the Amundsen Sea continental shelf there are two polynyas (Figure 1): Amundson Polynya located at 113°W and 73.5°S and Pine Island Bay Polynya located at 104°W and 73°S (Arrigo and Dijken, 2003). However, the presence of DSW in these polynyas is questionable. Previous studies often classify the Amundsen Sea continental shelf as a ‘Warm shelf’ due to the large volume of CDW intrusion (Thompson et al., 2018). It is believed that due to the faster basal melt rate of ice shelves, the less dense meltwater could enhance stratification and suppress the formation of DSW (Silvano et al., 2018). Therefore, the Amundsen Sea continental shelf is not considered a DSW-productive region (Narayanan et al., 2019).
As shown in Figures 2 and 6, high density (σ >28.27 kg m-3) water mass was captured in both WOD and FOAM products. Duo to the lack of ice shelf in FOAM, the presence of DSW is unknown based on the FOAM’s results. In the WOD dataset where signals of high density, high temperature (θ>-1℃) water was found in multiple profiles. This high density, high temperature signal is an indicator of Modified Shelf Water (MSW), which is a mixed water mass of CDW and DSW and thus is indirect evidence of DSW presence. However, the fact that this MSW signal is measured by instrumented seals, which are known for its salinity bias, discredited these measurements. There is no evidence of DSW presence if data from instrumented seals are excluded; more high quality in-situ measurements are required to prove or disprove the existence of DSW and its variations on the Amundsen Sea continental shelf.
5 Conclusions
In this study, the compositions and distributions of water masses on the Amundsen Sea continental shelf are assessed using data from a global oceanographic reanalysis product (FOAM-GLOSEA5v13) and an optimal multiparameter analysis method. The mixing ratios of three water mass endmembers are evaluated based on the reanalysis product. Results suggest the volume of WW shows strong seasonal oscillation throughout the reanalysis data period (1993-2020). The volume of CDW experienced two periods of increasing trend and one period of decreasing trend from 1993 to 2020, and its variation is potentially associated with the variability of El Niño as suggested by previous studies. Small volume of DSW is identified in the reanalysis product, even though there is no direct evidence of DSW presence in in-situ observations.
Using a lower mixing ratio method, the spatial extension and potential intrusion sites of CDW on the Amundsen Sea continental shelf are quantified. Five potential sites of CDW intrusion along the shelf break are identified in the reanalysis product, including one that has not been reported in previous studies (EP 2). Based on the results, the newly found intrusion site is located between 105.5°W-107°W, and the tendency of cross-shelf break southward intrusion is confirmed with numerical particle tracking experiments. The analysis reveals two intrusion sites with strong CDW signal over relatively shallow regions (EP 1 and EP 2), despite that previous studies (Walker et al., 2013; Nakayama et al., 2018; Azaneu et al., 2023) suggest that CDW intrusion tends to occur near deep troughs away from shallow regions. This suggests that cross-shelf break intrusion near shallower area should not be ignored, and more in-situ velocity observations are required to validate cross-shelf break flow over shallow regions.
Scope statement
This study aligns with the scope and focus of the journal ‘Frontiers in Marine Science’. It summarizes the spatial and temporal distribution of water masses in the Amundsen Sea shelf area using reanalysis data. This study provides new insights into the detection methods of CDW intrusion sites on the shelf break, and it also describes a intrusion site that has never been mentioned before. These studies provide insights into CDW intrusion and ice shelf melting in the Amundsen Sea. The study’s methods and practical implications make it suitable for publication in ‘Frontiers in Marine Science’, a renowned journal dedicated to advancing knowledge in marine sciences and their applications.
Data availability statement
The original contributions presented in the study are included in the article/Supplementary Material. Further inquiries can be directed to the corresponding authors.
Author contributions
ZL: Writing – review & editing, Writing – original draft, Visualization, Software, Methodology, Investigation, Formal analysis, Data curation, Conceptualization. CW: Writing – review & editing, Visualization, Supervision, Investigation, Data curation, Conceptualization. MZ: Writing – review & editing, Validation, Supervision, Resources, Project administration, Funding acquisition.
Funding
The author(s) declare financial support was received for the research, authorship, and/or publication of this article. This work was funded by the National Natural Science Foundation of China (Grant No. 41941008), the Shanghai Frontiers Science Center of Polar Science (SCOPS), the Ministry of Natural Resources of the People’s Republic of China (Grant 583 No: IRASCC 1-02-01B), and the Shanghai Key Laboratory of Polar Life and Environment Sciences (Grant #: 21DZ2260100).
Acknowledgments
We would like to thank Yisen Zhong, Shuangzhao Li and Zhaoru Zhang for their comments and technical supports in developing the methods used in the analyses.
Conflict of interest
The authors declare that the research was conducted in the absence of any commercial or financial relationships that could be construed as a potential conflict of interest.
Publisher’s note
All claims expressed in this article are solely those of the authors and do not necessarily represent those of their affiliated organizations, or those of the publisher, the editors and the reviewers. Any product that may be evaluated in this article, or claim that may be made by its manufacturer, is not guaranteed or endorsed by the publisher.
Supplementary material
The Supplementary Material for this article can be found online at: https://www.frontiersin.org/articles/10.3389/fmars.2024.1358196/full#supplementary-material
References
Adcock S. T., Marshall D. P. (2000). Interactions between geostrophic eddies and the mean circulation over large-scale bottom topography. J. Phys. Oceanogr. 30 (12), 3223–3238. doi: 10.1175/1520-0485(2000)030<3223:IBGEAT>2.0.CO;2
Amante C., Eakins B. W. (2009). ETOPO1 1 arc-minute global relief model: procedures, data sources and analysis version NOAA technical memorandum NESDIS NGDC-24 [Dataset]. Available online at: https://repository.library.noaa.gov/view/noaa/1163.
Arrigo K. R., Dijken G. L. V. (2003). Phytoplankton dynamics within 37 Antarctic coastal polynya systems. J. Geophysical Research: Oceans 108, 3271. doi: 10.1029/2002JC001739
Assmann K. M., Jenkins A., Shoosmith D. R., Walker D. P., Jacobs S. S., Nicholls K. W. (2013). Variability of Circumpolar Deep Water transport onto the Amundsen Sea Continental shelf through a shelf break trough. J. Geophysical Research: Oceans 118, 6603–6620. doi: 10.1002/2013JC008871
Azaneu M., Webber B., Heywood K. J., Assmann K. M., Dotto T. S., Abrahamsen E. P. (2023). Influence of shelf break processes on the transport of warm waters onto the eastern amundsen sea continental shelf. J. Geophysical Res. Oceans 128, e2022JC019535. doi: 10.1029/2022JC019535
Baines P. G., Condie S. (1985). Observations and modelling of antarctic downslope flows: A review. In Antarctic research series. Vol. 75, pp. 29–49. doi: 10.1029/AR075p0029
Bamber J., Riva R., Vermeersen B. (2009). Reassessment of the potential contribution to sea level from a collapse of the West Antarctic Ice Sheet. IOP Conf. Series: Earth Environ. Sci. 6, 901–903. doi: 10.1126/science.1169335
Boyer T. P., Baranova O. K., C. C., Garcia H. E., Grodsky A., Locarnini R. A., et al. (2018). World ocean database 2018 version NOAA atlas NESDIS 87 [Dataset]. Available online at: https://www.ncei.noaa.gov/sites/default/files/2020-04/wod_intro_0.pdf.
Dinniman M. S., Klinck J. M. (2004). A model study of circulation and cross-shelf exchange on the west Antarctic Peninsula continental shelf. Deep-Sea Res. Part II 51, 2003–2022. doi: 10.1016/j.dsr2.2004.07.030
Dutrieux P., Rydt J. D., Jenkins A., Holland P. R., Ha H. K., Lee S. H., et al. (2014). Strong sensitivity of pine island ice-shelf melting to climatic variability. Science 343, 174–178. doi: 10.1126/science.1244341
Frants M., Gille S. T., Hewes C. D., Holm-Hansen O., Kahru M., Lombrozo A., et al. (2013). Optimal multiparameter analysis of source water distributions in the Southern Drake Passage. Deep-Sea Res. Part II 90, 31–42. doi: 10.1016/j.dsr2.2012.06.002
Frazer E. K., Langhorne P. J., Williams M. J. M., Goetz K. T., Costa D. P. (2018). A method for correcting seal-borne oceanographic data and application to the estimation of regional sea ice thickness. J. Mar. Syst. 187, 250–259. doi: 10.1016/j.jmarsys.2018.08.002
Gill A. E. (1973). Circulation and bottom water production in the Weddell Sea. Deep Sea Res. Oceanographic Abstracts 20, 111–140. doi: 10.1016/0011-7471(73)90048-X
Hellmer H. H. (1996). Oceanic erosion of a floating antarctic glacier in the amundsen sea. Ocean Ice Atmosphere: Interact. at Antarctic Continental Margin 75, 83–99. doi: 10.1175/JCLI-D-12-00813.1
Jacobs S. S., Fairbanks. R., Horibe Y. (1985). Origin and evolution of water masses near the Antarctic continental margin evidence from H218O/H216O ratios in seawater. Oceanology Antarctic Continental Shelf 43, 59–86. doi: 10.1029/AR043p0059
Jacobs S. S., Jenkins A., Giulivi C. F., Dutrieux P. (2011). Stronger ocean circulation and increased melting under Pine Island Glacier ice shelf. Nat. Geosci. 4, 519–523. doi: 10.1038/NGEO1188
Joughin I., Rignot E., Rosanova C. E., Lucchitta B. K., Bohlander J. (2003). Timing of recent accelerations of pine island glacier, Antarctica. Geophysical Res. Lett. 30, 1706. doi: 10.1029/2003GL017609
Kalén O., Assmann K. M., Wåhlin A. K., Ha H. K., Kim T. W., Lee S. H. (2016). Is the oceanic heat flux on the central Amundsen sea shelf caused by barotropic or baroclinic currents? Deep-Sea Res. Part II 123, 7–15. doi: 10.1016/j.dsr2.2015.07.014
Kim T. W., Ha H. K., Wåhlin A. K., Lee S. H., Kim C. S., Lee J. H., et al. (2017). Is Ekman pumping responsible for the seasonal variation of warm circumpolar deep water in the Amundsen Sea? Continental Shelf Res. 132, 38–48. doi: 10.1016/j.csr.2016.09.005
Klinck J. M. (1996). Circulation near submarine canyons: A modeling study. J. Geophysical Research: Oceans 101, 1211–1223. doi: 10.1029/95JC02901
Klinck J. M., Dinniman M. S. (2010). Exchange across the shelf break at high southern latitudes. Ocean Sci. 6, 513–524. doi: 10.5194/os-6-513-2010
Lars B., Isabella R. (2021). Classifying oceanographic structures in the amundsen sea, Antarctica. Geophysical Res. Lett. 48, e2020GL089412. doi: 10.1029/2020GL089412
Li D., Zhou M., Zhang Z., Zhong Y., Zhu Y., Yang C., et al. (2018). Intrusions of kuroshio and shelf waters on northern slope of south China sea in summer 2015. J. Ocean Univ. China 17, 477–486. doi: 10.1007/s11802-018-3384-2
Liu C., Wang Z., Cheng C., Wu Y., Xia R., Li B., et al. (2018). On the modified circumpolar deep water upwelling over the four ladies bank in prydz bay, east Antarctica. J. Geophysical Research: Oceans 123, 7819–7838. doi: 10.1029/2018JC014026
Liu C., Wang Z., Liang X., Li X., Li X., Cheng C., et al. (2022). Topography-mediated transport of warm deep water across the continental shelf slope, east Antarctica. J. Phys. Oceanography 52, 1295–1314. doi: 10.1175/JPO-D-22-0023.1
Mao H., Ren Y., Wan G. (1964). Preliminary study on quantitative analysis of shallow water mass by T-S relation. Oceanology Limnology 1), 1–22.
Moffat C., Owens B., Beardsley R. C. (2009). On the characteristics of Circumpolar Deep Water intrusions to the west Antarctic Peninsula Continental Shelf. J. Geophysical Research: Oceans 114, C05017. doi: 10.1029/2008JC004955
Montégut C., d. B., Madec G., Fischer A. S., Lazar A., Iudicone D. (2004). Mixed layer depth over the global ocean: An examination of profile data and a profile-based climatology. J. Geophysical Research: Oceans 109, C12003. doi: 10.1029/2004JC002378
Morrison A. K., Hogg A. M., England M. H., Spence P. (2020). Warm Circumpolar Deep Water transport toward Antarctica driven by local dense water export in canyons. Sci. Adv. 6, eaav2516. doi: 10.1126/sciadv.aav2516
Nakayama Y., Manucharyan G., Zhang H., Dutrieux P., Torres H. S., Klein P. (2019). Pathways of ocean heat towards Pine Island and Thwaites grounding lines. Sci. Rep. 9, 16649. doi: 10.1038/s41598-019-53190-6
Nakayama Y., Menemenlis D., Schodlok M., Rignot E. (2017). Amundsen and Bellingshausen Seas simulation with optimized ocean, sea ice, and thermodynamic ice shelf model parameters. J. Geophysical Research: Oceans 122, 6180–6195. doi: 10.1002/2016JC012538
Nakayama Y., Menemenlis D., Zhang H., Schodlok M., Rignot E. (2018). Origin of circumpolar deep water intruding onto the Amundsen and Bellingshausen Sea continental shelves. Nat. Commun. 9, 3403. doi: 10.1038/s41467-018-05813-1
Nakayama Y., Schröder M., Hellmer H. H. (2013). From circumpolar deep water to the glacial meltwater plume on the eastern Amundsen Shelf. Deep-Sea Res. Part I 77, 50–62. doi: 10.1016/j.dsr.2013.04.001
Narayanan A., Gille S. T., Mazloff M. R., Murali K. (2019). Water mass characteristics of the antarctic margins and the production and seasonality of dense shelf water. J. Geophysical Research: Oceans 124, 9277–9294. doi: 10.1029/2018JC014907
Rignot E. (2008). Changes in West Antarctic ice stream dynamics observed with ALOS PALSAR data. Geophysical Res. Lett. 35, L12505. doi: 10.1029/2008GL033365
Rignot E., Jacobs S., Mouginot J., Scheuchl B. (2013). Ice-shelf melting around Antarctica. Science 341, 266–270. doi: 10.1126/science.1235798
Rintoul S. R. (1985). On the origin and influence of adélie land bottom water. In Antarctic research series. Vol. 75, pp. 151–171. doi: 10.1029/AR075p0151
Scott J. B. T., Gudmundsson G. H., Smith A. M., Bingham R. G., Pritchard H. D., Vaughan D. G. (2009). Increased rate of acceleration on Pine Island Glacier strongly coupled to changes in gravitational driving stress. Cryosphere 3, 125–131. doi: 10.5194/tc-3-125-2009
Silvano A., Rintoul S. R., Peña-Molino B., Hobbs W. R., Wijk E. V., Aoki S., et al. (2018). Freshening by glacial meltwater enhances melting of ice shelves and reduces formation of Antarctic Bottom Water. Sci. Adv. 4, eaap9467. doi: 10.1126/sciadv.aap9467
Smith J. (2012). Deglacial history of the West Antarctic Ice Sheet in the western Amundsen Sea Embayment. Quaternary Int. 30, 488–505. doi: 10.1016/j.quascirev.2010.11.020
Steig E. J., Ding Q., Battisti D. S., Jenkins A. (2012). Tropical forcing of Circumpolar Deep Water Inflow and outlet glacier thinning in the Amundsen Sea Embayment, West Antarctica. Ann. Glaciology 53, 19–28. doi: 10.3189/2012AoG60A110
Steiger N., Darelius E., Wåhlin A. K., Assmann K. M. (2021). Intermittent reduction in ocean heat transport into the Getz Ice Shelf cavity during strong wind events. Geophysical Res. Lett. 48, e2021GL093599. doi: 10.1029/2021GL093599
Sun C., Liu C., Wang Z., Yan L., Tao Y., Qin Q., et al. (2022). On the influences of the continental shelf bathymetry correction in Prydz Bay, East Antarctica. Front. Mar. Sci. 9. doi: 10.3389/fmars.2022.957414
Thoma M., Jenkins A., Holland D., Jacobs S. (2008). Modelling Circumpolar Deep Water intrusions on the Amundsen Sea continental shelf, Antarctica. Geophysical Res. Lett. 35, L18602. doi: 10.1029/2008GL034939
Thompson A. F., Stewart A. L., Spence P., Heywood K. J. (2018). The antarctic slope current in a changing climate. Rev. Geophysics 56, 741–770. doi: 10.1029/2018RG000624
Tomczak M., Large D. G. B. (1989). Optimum multiparameter analysis of mixing in the thermocline of the eastern Indian Ocean. J. Geophysical Research: Oceans 94, 16141–16149. doi: 10.1029/JC094iC11p16141
Vaughan D. G. (2008). West Antarctic Ice Sheet collapse - the fall and rise of a paradigm. Climatic Change 91, 65–79. doi: 10.1007/s10584-008-9448-3
Wåhlin A. K., Muench R. D., Arneborg L., Björk G., Ha H. K., Lee S. H., et al. (2012). Some implications of ekman layer dynamics for cross-shelf exchange in the amundsen sea. J. Phys. Oceanography 42, 1461–1474. doi: 10.1175/JPO-D-11-041.1
Wåhlin A. K., Yuan X., Björk G., Nohr C. (2010). Inflow of warm circumpolar deep water in the central amundsen shelf. J. Phys. Oceanography 40, 1427–1434. doi: 10.1175/2010JPO4431.1
Walker D. P., Brandon M. A., Jenkins A., Allen J. T., Dowdeswell J. A., Evans J. (2007). Oceanic heat transport onto the Amundsen Sea shelf through a submarine glacial trough. Geophysical Res. Lett. 34, L02602. doi: 10.1029/2006GL028154
Walker D. P., Jenkins A., Assmann K. M., Shoosmith D. R., Brandon M. A. (2013). Oceanographic observations at the shelf break of the Amundsen Sea, Antarctica. J. Geophysical Research: Oceans 118, 2906–2918. doi: 10.1002/jgrc.20212
Wang Z., Liu C., Cheng C., Qin Q., Yan L., Qian J., et al. (2023). On the multiscale oceanic heat transports toward the bases of the antarctic ice shelves. Ocean-Land-Atmos. Res. 2, 10. doi: 10.34133/olar.0010
Webber B. G. M., Heywood K. J., Stevens D. P., Assmann K. M. (2019). The impact of overturning and horizontal circulation in pine island trough on ice shelf melt in the eastern amundsen sea. J. Phys. Oceanography 49, 63–83. doi: 10.1175/JPO-D-17-0213.1
Whitworth III T., Orsi A. H., Kim S.-J., Nowlin Jr. W. D., Locarnini R. A. (1985). Water masses and mixing near the antarctic slope front. In Antarctic research series. Vol. 75, pp. 1–27. doi: 10.1029/AR075p0001
Williams G. D., Herraiz-Borreguero L., Roquet F., Tamura T., Ohshima K. I., Fukamachi Y., et al. (2016). The suppression of Antarctic bottom water formation by melting ice shelves in Prydz Bay. Nat. Commun. 7, 12577. doi: 10.1038/ncomms12577
Keywords: Amundsen Sea, water mass analysis, CDW intrusion, reanalysis product, numerical particle tracking
Citation: Li Z, Wang C and Zhou M (2024) Assessment of water mass distribution and intrusions of circumpolar deep water in the Amundsen Sea based on the ocean reanalysis product FOAM-GLOSEA5v13. Front. Mar. Sci. 11:1358196. doi: 10.3389/fmars.2024.1358196
Received: 19 December 2023; Accepted: 17 June 2024;
Published: 09 July 2024.
Edited by:
Zhaomin Wang, Hohai University, ChinaReviewed by:
Qingxuan Yang, Ocean University of China, ChinaXianxian Han, Southern Ocean Science and Engineering Guangdong Laboratory (Zhuhai), China
Yoshihiro Nakayama, Hokkaido University, Japan
Copyright © 2024 Li, Wang and Zhou. This is an open-access article distributed under the terms of the Creative Commons Attribution License (CC BY). The use, distribution or reproduction in other forums is permitted, provided the original author(s) and the copyright owner(s) are credited and that the original publication in this journal is cited, in accordance with accepted academic practice. No use, distribution or reproduction is permitted which does not comply with these terms.
*Correspondence: Meng Zhou, bWVuZy56aG91QHNqdHUuZWR1LmNu; Chuning Wang, d2FuZ2NodW5pbmdAc2p0dS5lZHUuY24=